Article

Kinetic Modeling of the Photocatalytic Degradation of Chlorinated Aromatic Volatile Organic Compounds: Mass Transfer Enhancement

1
UFR d’Ingénierie Agronomique Forestière et Environnementale, Université de Man, Man M139PL, Côte d’Ivoire
2
College of Engineering, Imam Mohammad Ibn Saud Islamic University (IMSIU), Riyadh 11432, Saudi Arabia
3
École Nationale Supérieure de Chimie de Rennes, CNRS, ISCR (Institut des Sciences Chimiques de Rennes)–UMR 6226, Université Rennes, F-35000 Rennes, France
4
Chemistry Department, College of Science, Imam Mohammad Ibn Saud Islamic University (IMSIU), Riyadh 11623, Saudi Arabia
5
Energy, Water, Environment and Process Laboratory, National Engineering School of Gabes, University of Gabes, Gabes 6072, Tunisia
*
Authors to whom correspondence should be addressed.
Appl. Sci. 2024, 14(4), 1507; https://doi.org/10.3390/app14041507
Submission received: 4 January 2024 / Revised: 25 January 2024 / Accepted: 5 February 2024 / Published: 13 February 2024
(This article belongs to the Section Chemical and Molecular Sciences)

Abstract

:
Chlorobenzene (CB) and Chloronaphthalene (CN) emissions from cement plant operations pose significant environmental risks. This study investigates the mass transfer effects of chlorinated aromatic Volatile Organic Compounds (VOCs), specifically CB and CN, in the gas phase of a continuous-tangential-flow annular photocatalytic reactor. The experiments involved introducing CB and CN into the reactor, and the degradation kinetics were analyzed using the Langmuir–Hinshelwood (L-H) model. The L-H model was applied to assess the impact of the flow rate, concentration, and relative humidity (% RH) on the degradation rate (DR). The results indicate that both the experimental and simulated degradation rates improved with increased flow rates (1 to 9 m3·h−1) and inlet concentrations (30 to 216 mg·m−3). This enhancement of the DR correlates with the availability of active OH* species on the TiO2 surface. The L-H model emphasizes the role of H2O molecules in VOC removal kinetics. The degradation rates increased with a rising water content (5 to 55%), but adverse effects on VOC conversion were observed beyond a 55% RH. This study reveals a mass transfer effect, with internal diffusional limitations in the TiO2 pores under operational conditions. The kinetics were predominantly controlled by chemical kinetics and catalyst pore availability. Furthermore, this study demonstrates a higher CB degradation than CN in the reactor and experimental conditions. For a concentration of 1.328 mM·m−3, the CB DR ranged from 0.70 to 2.84 µM·m2·s−1, as the flow rate varied from 1 to 9 m3·h−1. The CN DR varied from 0.60 to 2.20 µM·m2·s−1 within the same flow rate range.

1. Introduction

Air pollution has far-reaching environmental consequences, including the acidification of rivers, soils, and the atmosphere, the eutrophication of lakes and rivers, ozone layer depletion, and intensified greenhouse effects [1,2,3,4] Various VOCs are responsible for these nuisances, such as chlorobenzene (CB) and chloronaphthalene (CN), which are chemicals from the cement industry [5,6,7] The impact of CB and CN extends beyond environmental concerns, as these chemicals pose toxicity risks to human health [6]. Notably, due to their volatility, cement workers face potential exposure to these VOCs, presenting a significant public health challenge [8,9,10,11].
In response to these challenges, since the 1980s regulations have been established to limit the emissions of these compounds into the air, safeguarding worker health. For the good application of these rules, it is, thus, necessary to continue to propose to industrialists innovative treatment solutions adapted to these gas emissions. Consequently, research advancements in photocatalysis have revealed the efficacy of this chemical process for purifying air contaminated by VOCs through continuous reactors.
Heterogeneous photocatalysis involves the absorption of photons by a semiconductor with an energy equal to or greater than that of the band gap (Ec − Ev), facilitating the flow of electrons from the valence band (Ev) to the conduction band (Ec) [12,13]. This process generates a positive hole (h+) at the valence band and releases an electron (e−) into the conduction band [14,15]. This chemical process consists of oxidizing the pollutant on a catalyst (TiO2 usually) under UV radiation [16,17,18]. In the presence of oxygen and/or water vapor, the UV radiation that activates the semiconductor (catalyst) allows for the VOCs in contact with the reactive surface to convert into CO2 and H2O [19,20,21].
Photocatalysis generally proceeds in three steps: the mass transfer of the pollutant to the catalyst, the adsorption on the catalyst, and the chemical reaction. Among continuous photocatalytic reactors, tangential flow configurations, which consider the VOC concentration, UV intensity, and water vapor composition, offer adaptability to an industrial scale [22]. The desorption and diffusion processes of VOCs and their by-products are typically negligible, and steady-state kinetic models often overlook the mass transfer effects. Thus, the adsorption of the pollutant and the oxidation reaction are usually described by the Langmuir–Hinshelwood (L-H) theory [23,24,25,26]. In this study, a continuous-tangential-flow photoreactor is employed to assess the impact of the mass transfer on the degradation of CB and CN at industrial concentrations. The investigation includes an analysis of the influence of the flow rate, concentration, and relative humidity (RH) of the air stream on the degradation rate. Additionally, a Langmuir–Hinshelwood (L-H) modeling of the experimental results is conducted.
The scientific challenge addressed in this work is to highlight the effect of chlorinated radicals on the performance of photocatalytic reactors. In fact, the novelty is based on the treatment of simulated gas air from a cement factory. The experiments were carried out on a pilot scale under conditions similar to those on site. This was done in favor of emphasizing the true photocatalytic performances. A modeling component was established to underscore the effect of the mass transfer on the removal kinetics. To the best of our knowledge, there is no existing work on these pollutants at a pilot scale.

2. Experimental Setup

The overall photocatalytic degradation rate of the VOCs was calculated as follows:
r = Q S × C i n 100 × R %  
R E   % = C i n C o u t C i n × 100
where RE is the VOCs’ removal efficiency, Cin and Cout are the inlet and outlet VOCs’ concentration (mM·m−3), respectively, Q is the volumetric flow rate (m3·h−1), and S is the medium surface (m2).
The Langmuir–Hinshelwood (L-H) model generally represents the degradation kinetics. This model is defined by the following equation [27,28,29]:
r o = k · K · C 0 1 + K C 0   or   1 r 0 = 1 k K · 1 C 0 + 1 k
where r0 is the initial reaction rate (mM·m−3·s−1), k is the reaction rate constant (mM·m−3·s−1), and K is the adsorption constant (m3·mM−1).
The slope of the curve C = f (time), where the influence of the by-products is assumed to be negligible, determines the initial reaction rate. The values of the L-H constants are determined from the slope and intercept of the plot r0−1 = f (C0−1).
Assuming that the mass transfer is not the limiting step, and that the effect of the intermediate products is negligible, then the reaction rate can be expressed according to Equation (3) [29]. In this model, the adsorption and desorption reactions are neglected in comparison to the oxidation mechanism. A continuous plug flow reactor at a steady state is considered. The distribution of the pollutants along the axial direction should not be ignored. The continuity equation for a pollutant is denoted as follows:
  u · d C d z = r
In this equation, z is the axial position in the reactor. After integration, the previous equation becomes
      l n ( C i n / C o u t ) C i n C o u t ) = k a p p · K · L u   1 C i n C o u t ) K  
where L is the reactor length (m), u is the superficial gas velocity (m·s−1), and Cin and Cout are the inlet and outlet concentrations. The L-H constants kapp and K are obtained by fitting the results of each concentration and flow rate with the linear equation. The cross-correlation coefficient is obtained by the covariance of kapp and K divided by the norm deviation of each modulus kapp and K.
The overall mass balances of the contaminant on the gaseous and solid phases in a continuous reactor result in the following relations [30,31].
In the gas phase:
u · d C d z + k m · a v · C C s = 0  
In the solid phase:
k m · a v · C C s = k a p p · K · C s 1 + K · C s
where C and Cs are the concentrations in the gas phase of the overall and average surface of the VOCs (mM·m−3), respectively, km is the mass transfer coefficient (m·s−1), and av is the average area per unit volume of the reactor (m2·m−3).
Assuming a linear transfer gradient, the material flux Jf through the film is written according to the Fick law, integrated over the thickness δ of the film [32].
J f = D δ · C b C s = k f · C b C s
where δ is the thickness of the external film, Cb is the core concentration of the fluid, Cs is the concentration on the surface of the adsorbent grain, kf is the external mass transfer coefficient, and D is the diffusion coefficient.
The film thickness δ varies with the operating conditions, such as the turbulence, grain size, and fluid viscosity. Several semi-empirical correlations were established to obtain the external mass transfer coefficient kf. The dimensionless numbers of Reynolds (Re),
Schmidt (Sc), and Sherwood (Sh) translate these parameters.
R e = 2 · R p · ρ · U 0 μ S c = μ ρ · D m o l S h = d e q · k f D m o l  
where deq is the equivalent diameter, ρ is the fluid density, U0 is the surface velocity, µ is the fluid dynamic viscosity, and Dmol is the molecular diffusion coefficient of the solute in the fluid.
D m o l = 10 3   · 29 + M 29 · M ( 20.1 1 3 + V m 1 3 ) 2 · T 1.75 P a t m  
where P is the gas flow pressure (Pa), T is the absolute temperature (°K), Vm is the molecular volume of the gas (m3·m−1), and M is the molecular mass of the pollutant (g·m−1).

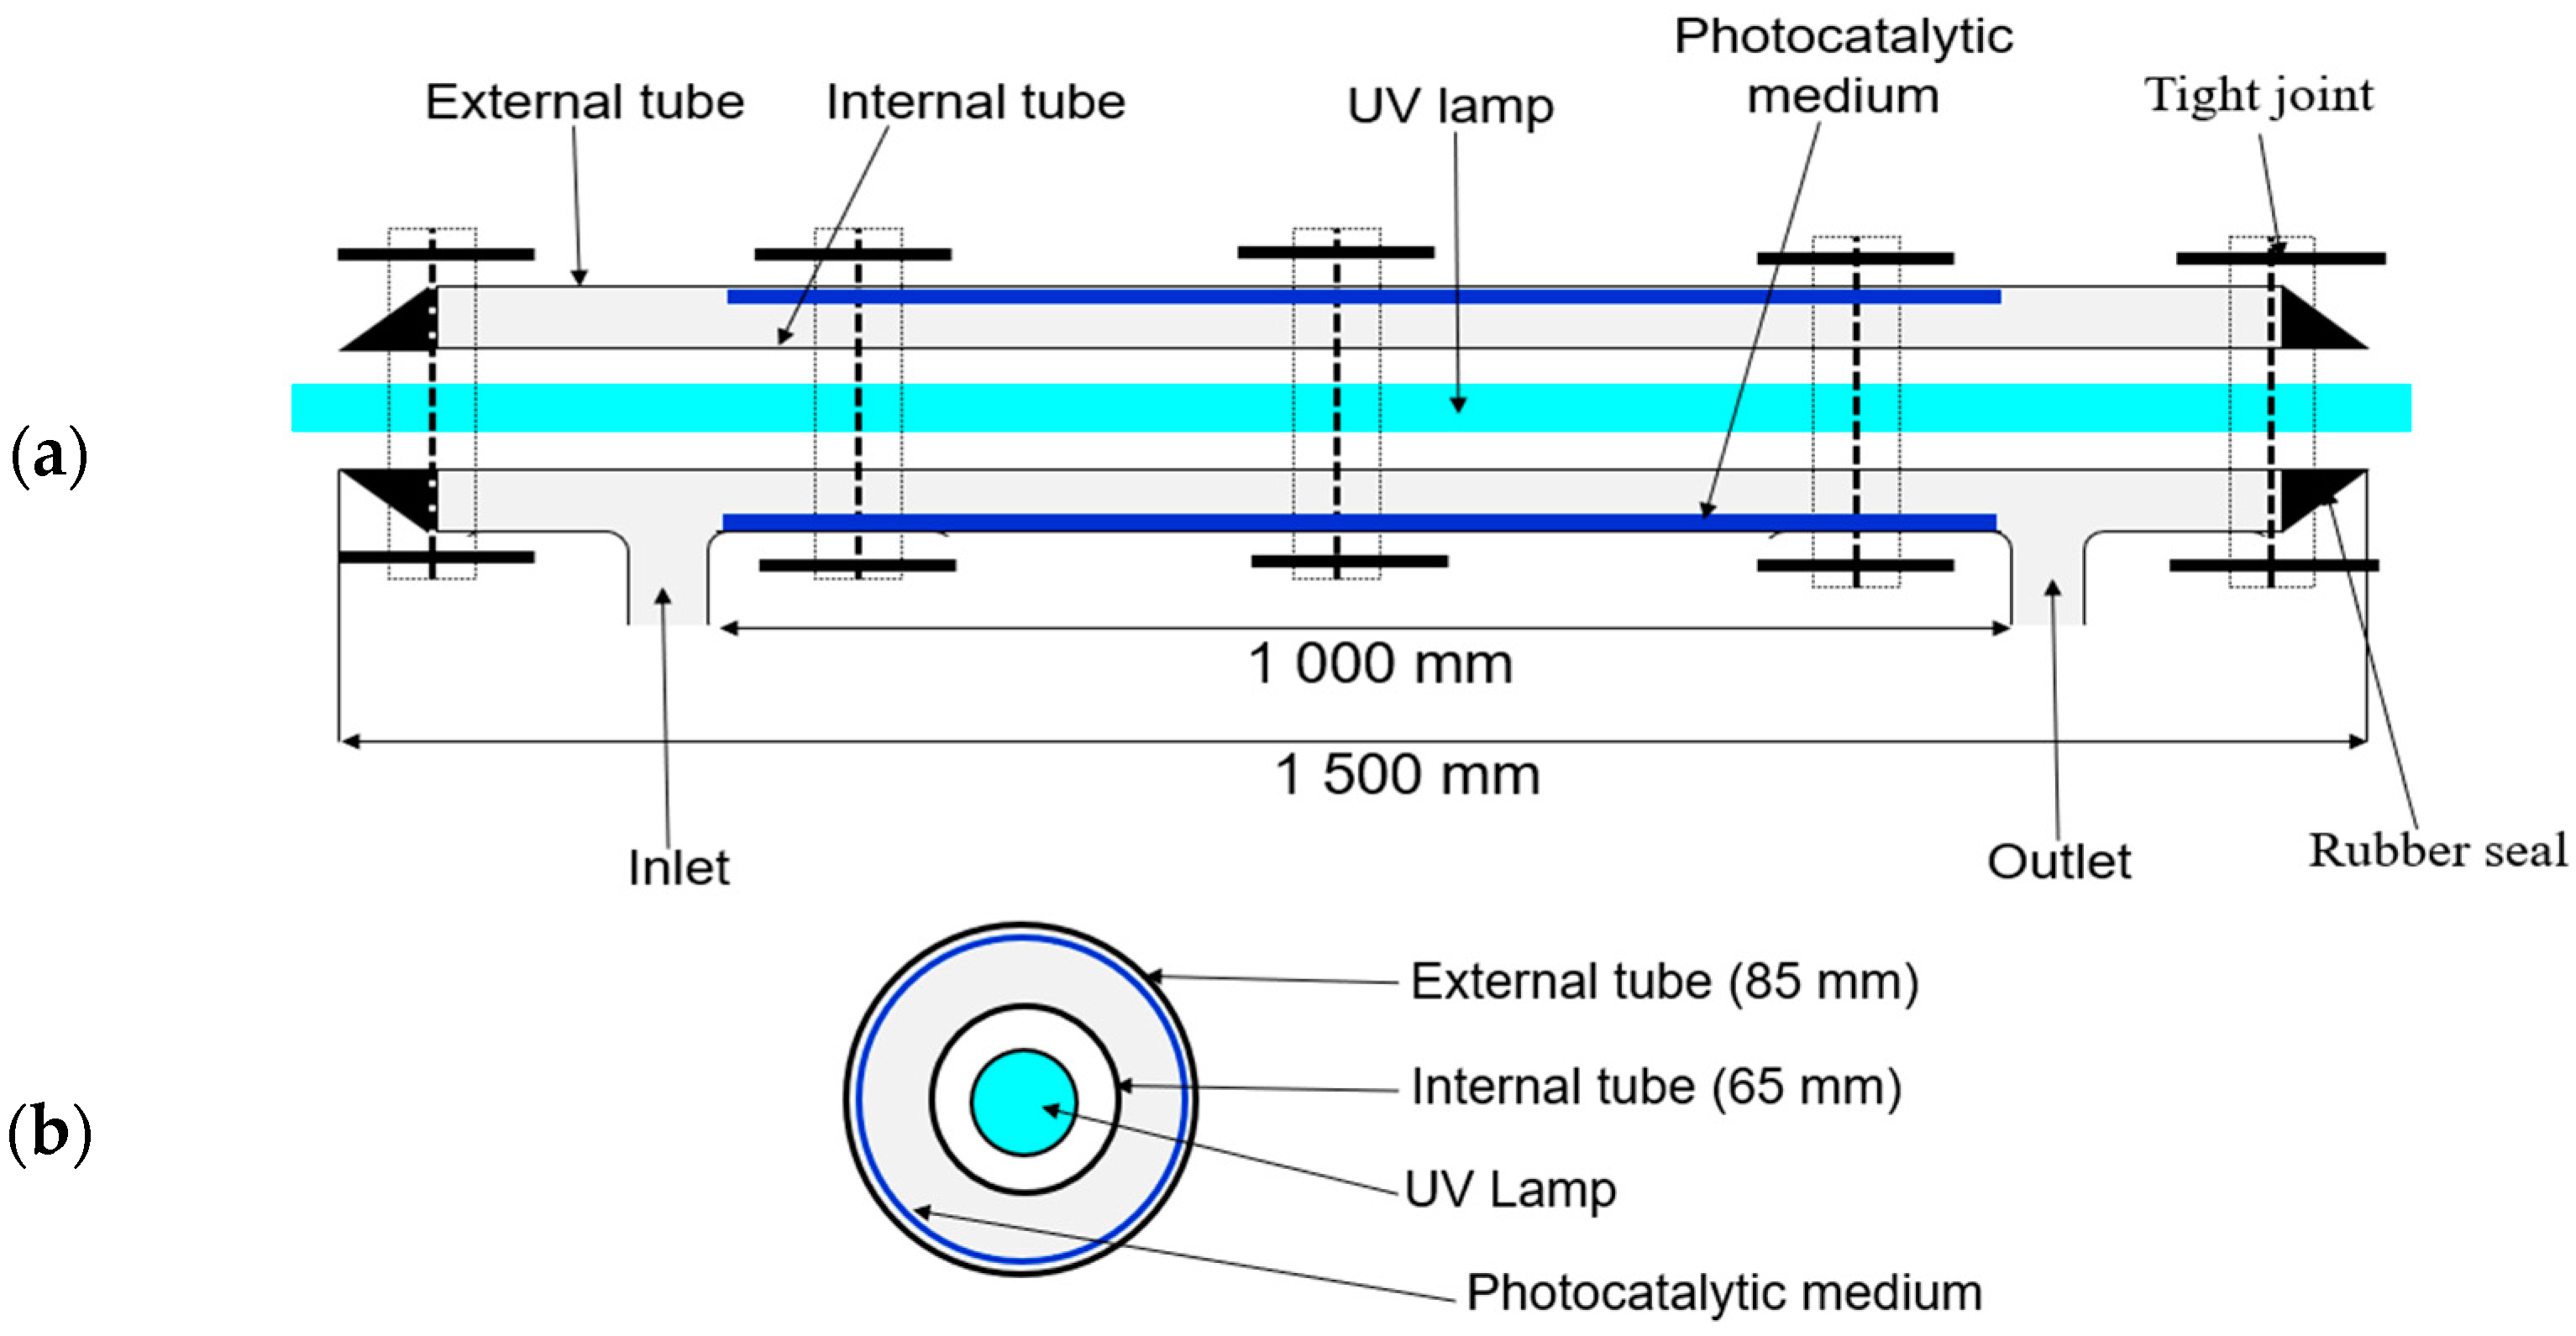
2.1. Photocatalytic Reactor Configuration

The catalytic material was a coated fiberglass mat of 20 g/m2 of colloidal silica which ensured the fixation of 20 g/m2 of PC500 Millenium titanium dioxide nanoparticles. The PC500 TiO2 nanoparticles had a diameter of 5 to 10 nm and were in a pure anatase form with an indirect bandgap energy of 3.3 eV. The specific surface area of the TiO2 nanoparticles was 300 m2/g. The coating process consisted of impregnating the fibers using an industrial-sized press. The material preparation was carried out by Ahlstrom Research and Services (Ahlstrom Patent). The plot of the N2 isotherm showed an adsorption of the fundamental type on a non-porous solid.
The light source was an 80 W UVA lamp (Philips CLEO performance). Its emission spectrum varied from 300 to 400 nm. The pollutant circulated continuously in a tangential flow in the reactor. The reactor was cleaned with an air stream (2 m3·h−1) under UV light at about 20 W·m−2 for one hour to avoid possible contamination before starting the experiments. The injection of VOCs was made continuously in the liquid state from a syringe pump system (Kd Scientific Model 100, Holliston, MA, USA). This system was introduced into the circuit as a gas flow.
The flow rate and VOCs’ concentrations varied from 1 to 9 m3·h−1 and 30 to 216 mg·m−3, respectively. A heating tape was wound around the channel at the level of the injection zone to ensure the good evaporation of the pollutants. Valves and a flowmeter (Bronkhorst In-Flow, Grez-sur-Loing, France) were introduced at the reactor inlet to maintain the airflow (Figure 1 and Figure 2). A specific testo sensor monitored the air quality (humidity and temperature). In this study, the values (5%, 30%, 55%, and 80%) for the relative humidity were determined by introducing a column humidifier into the degradation system to provide dry and humid air.

2.2. Gas Phase Analysis

The VOCs’ concentration, before and after the mineralization experiments, was quantified using a gas chromatography (Focus GC) using a flame ionization detector (FID) and an FFAP column (length = 25 m and internal diameter = 0.32 mm). The flow rate of the carrier gas was 1 mL·min−1. The injector and detector temperatures of the CN were 260 °C and 270 °C, respectively, and 250 °C for the CB. The samples were collected in the reactor downstream using a 500 µL gas-tight syringe and were manually injected into the GC. The CO2 concentration was quantified using a multi-gas infrared analyzer equipped with GFC (Gas Filter Correlation) technology (MIR 9000 Environment, Verano Brianza, Italy). A TESTO sensor was used to monitor the system’s temperature and relative humidity (RH).

3. Results and Discussion

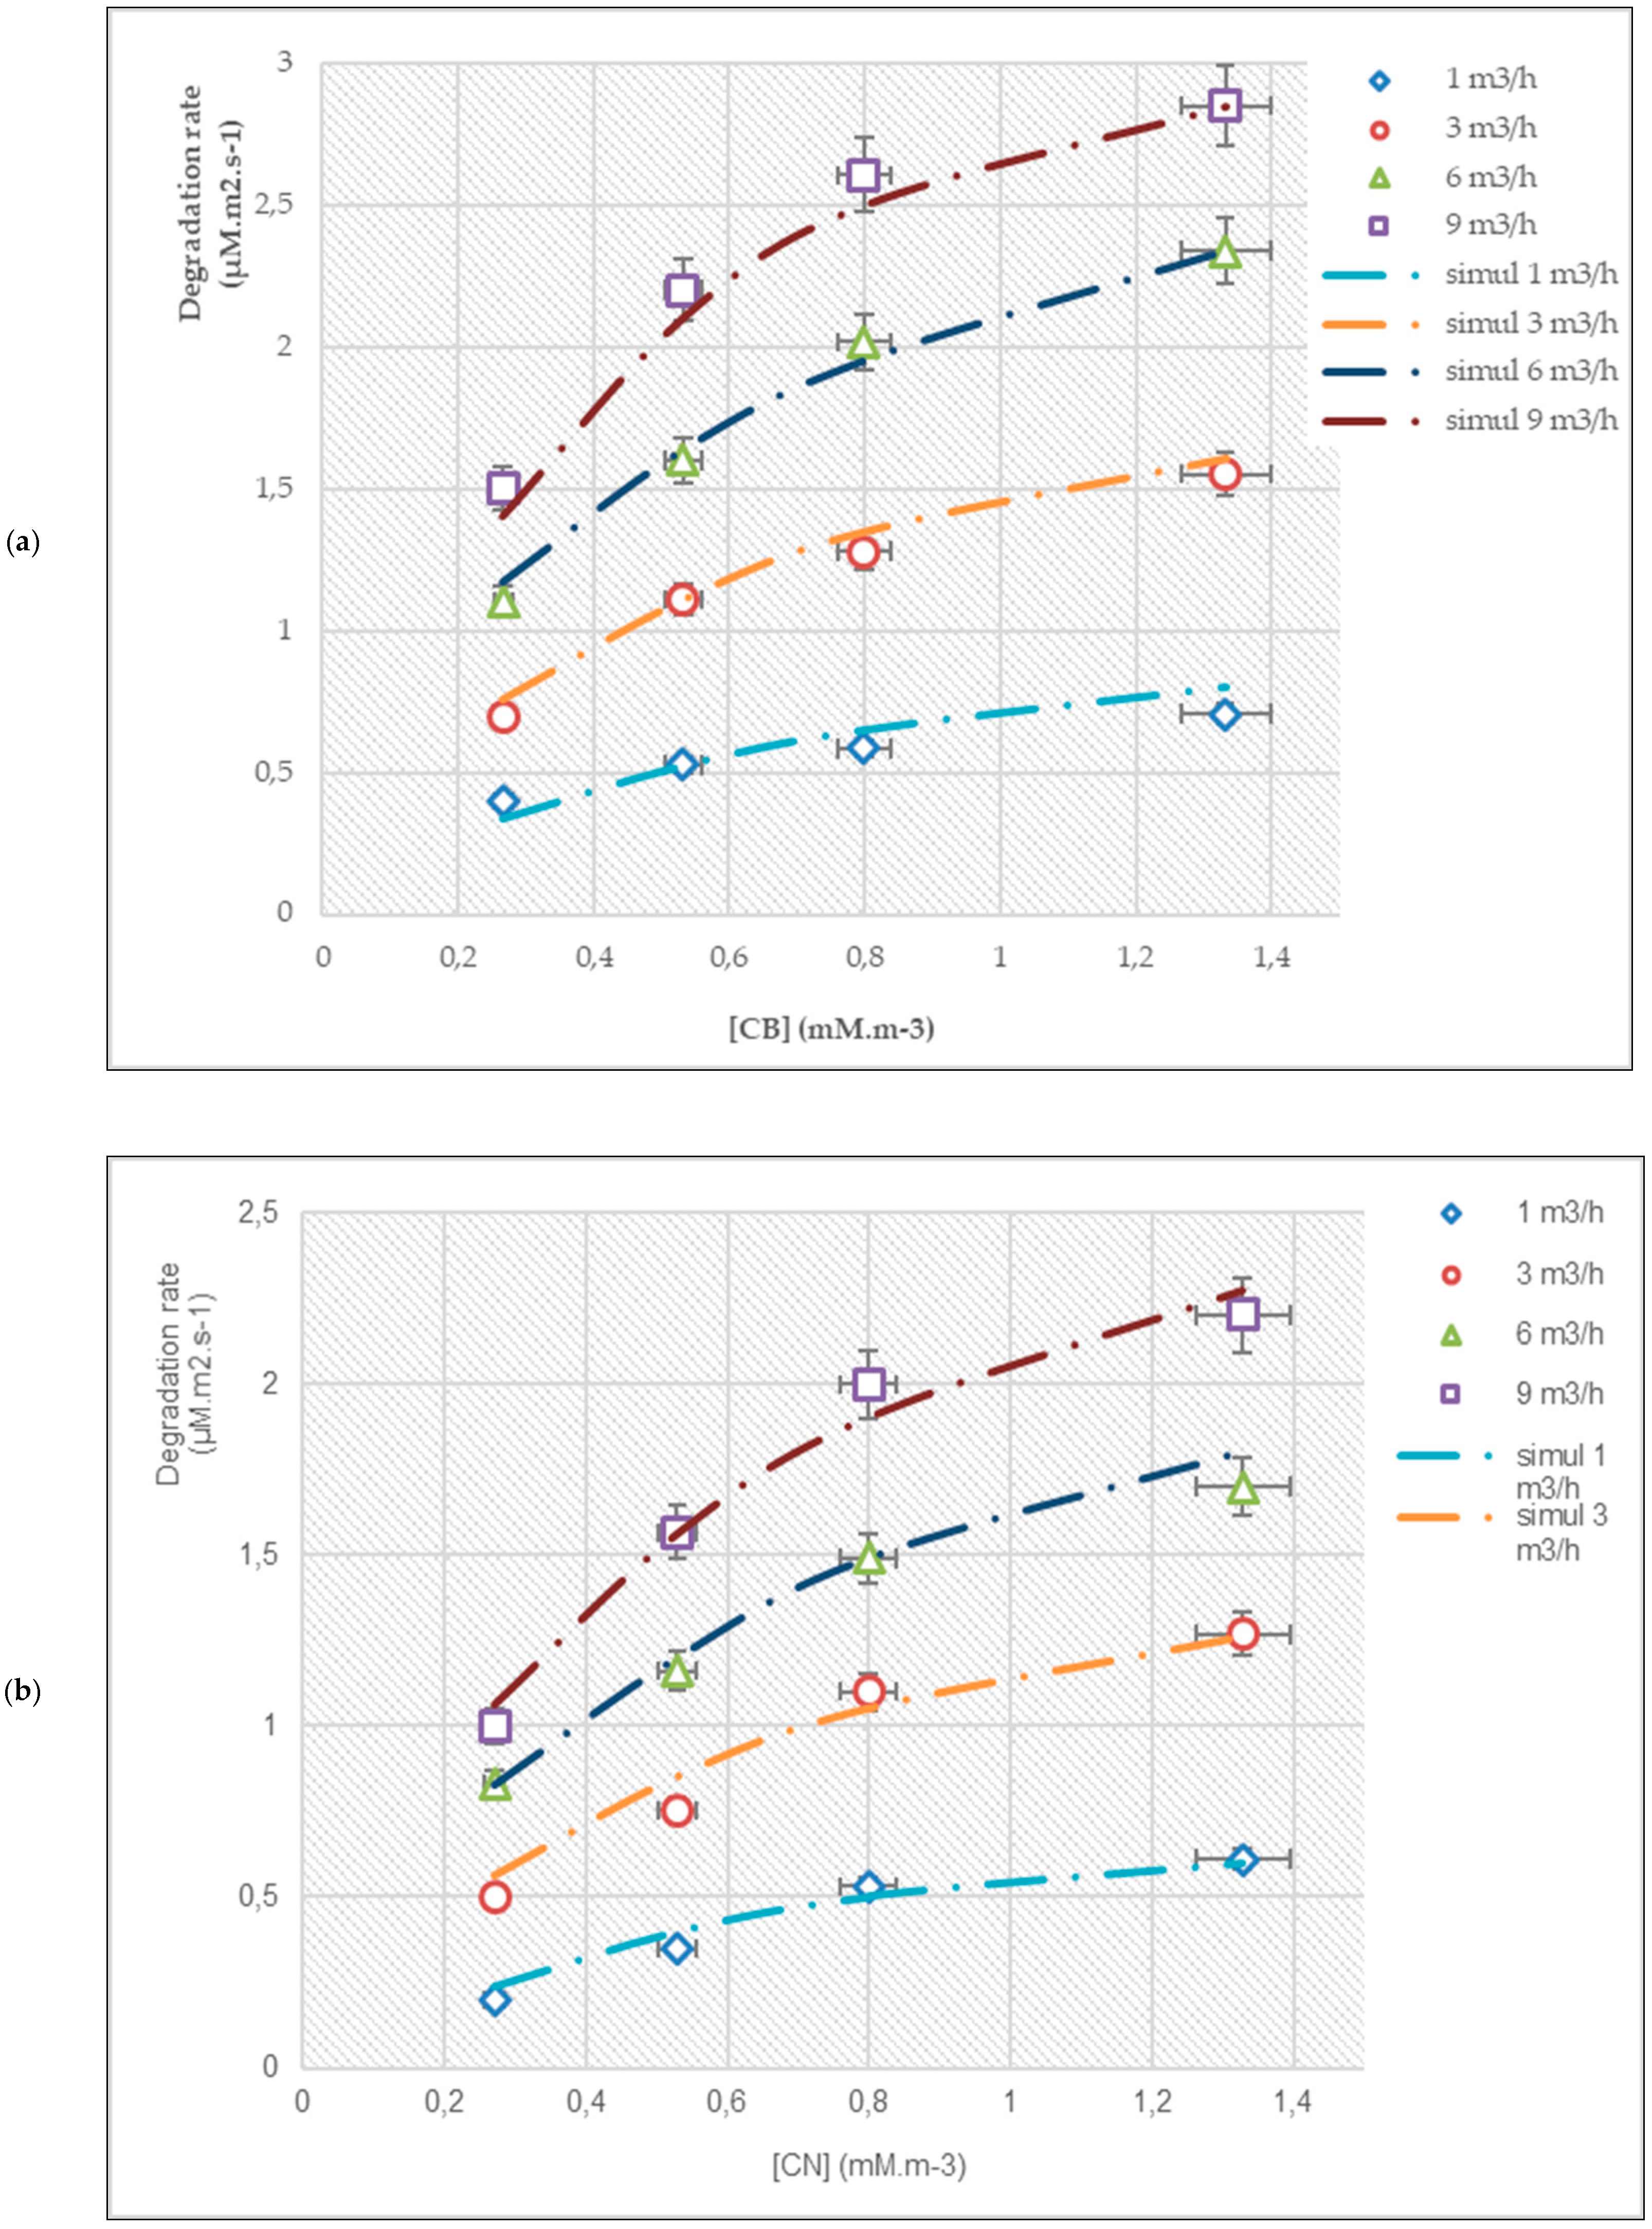
3.1. Effect of Flow Rate and Inlet Concentration

In this section, only the surface step reaction is considered, i.e., the mass transfer is neglected, in order to describe the photocatalytic reaction in the gas–solid phase.
Table 1 presents the semi-empirical formulas necessary to find the external mass transfer coefficient for tangential flow reactors.
Table 2 illustrates the Reynolds number, diffusivity, and mass transfer coefficients for two components at various volumetric flow rates. The values of the coefficients kf resulting from these correlations are used to determine an equivalent diffusion. The numerical solution of the following equation can be used to evaluate the parameters k and K:
C i n C o u t = L · k m · a v 2 · u · [ C i n + 1 K + k k m · a v ( C i n + 1 K + k k m · a v ) 2 + 4 C i n K   ]
Figure 3a,b shows the modeling of the CB and CN degradation rates during photocatalysis.
The degradation rates of the two VOCs were identical. Whatever the flow rates, the DR was improved with an increasing concentration. However, CB degraded faster than CN under similar experimental conditions, in terms of the concentration and flow rate. Indeed, for a concentration of 1.328 mM·m−3, the DR of CB varied from 0.70 to 2.84 µM·m2·s−1 when the flow rate increased from 1 to 9 m3·h−1, while the DR of CN varied from 0.60 to 2.20 µM·m2·s−1 for the same flow rate interval. This difference in the DR may be related to the hydrophobicity and stability of the molecules (two aromatic rings) of CN on the surface of TiO2. This result is in agreement with a study [33] dealing with six aromatic compounds: benzene, toluene, ethylbenzene, and m-, o-, and p-xylenes. In their investigation, the authors showed that these compounds do not have the same photocatalytic reactivity. Benzene was the most challenging compound to degrade due to its extreme stability and the equivalence of its six carbons.
The simulation results shown in Figure 3a,b based on the L-H model are summarized in Table 3.
From Table 3, it is interesting to note that the kinetic constants (k) of the L-H model for CN are very different compared to those for CB. However, the two pollutants’ adsorption constants (K) were similar. This trend can be explained by the hydrophobicity and stability of the pollutants.
The degradation rates improved with an increasing flow rate and concentration. Indeed, as the flow rate and concentration increased, the species’ movement to the catalyst’s interface was enhanced. This analysis is in accordance with the work of Tulebekov and his group [34], who stated that the degradation rate improves with an increasing flow rate and VOC concentration. These results also agree with litterature [27,28,29]. Serhane and his co-workers [35] argued that the increase in the degradation rate is related to the availability of the active species, i.e., if the formation of the first radical species is facilitated; in this case, the degradation of the adsorbed pollutants starts faster, and the residence time could be shorter.

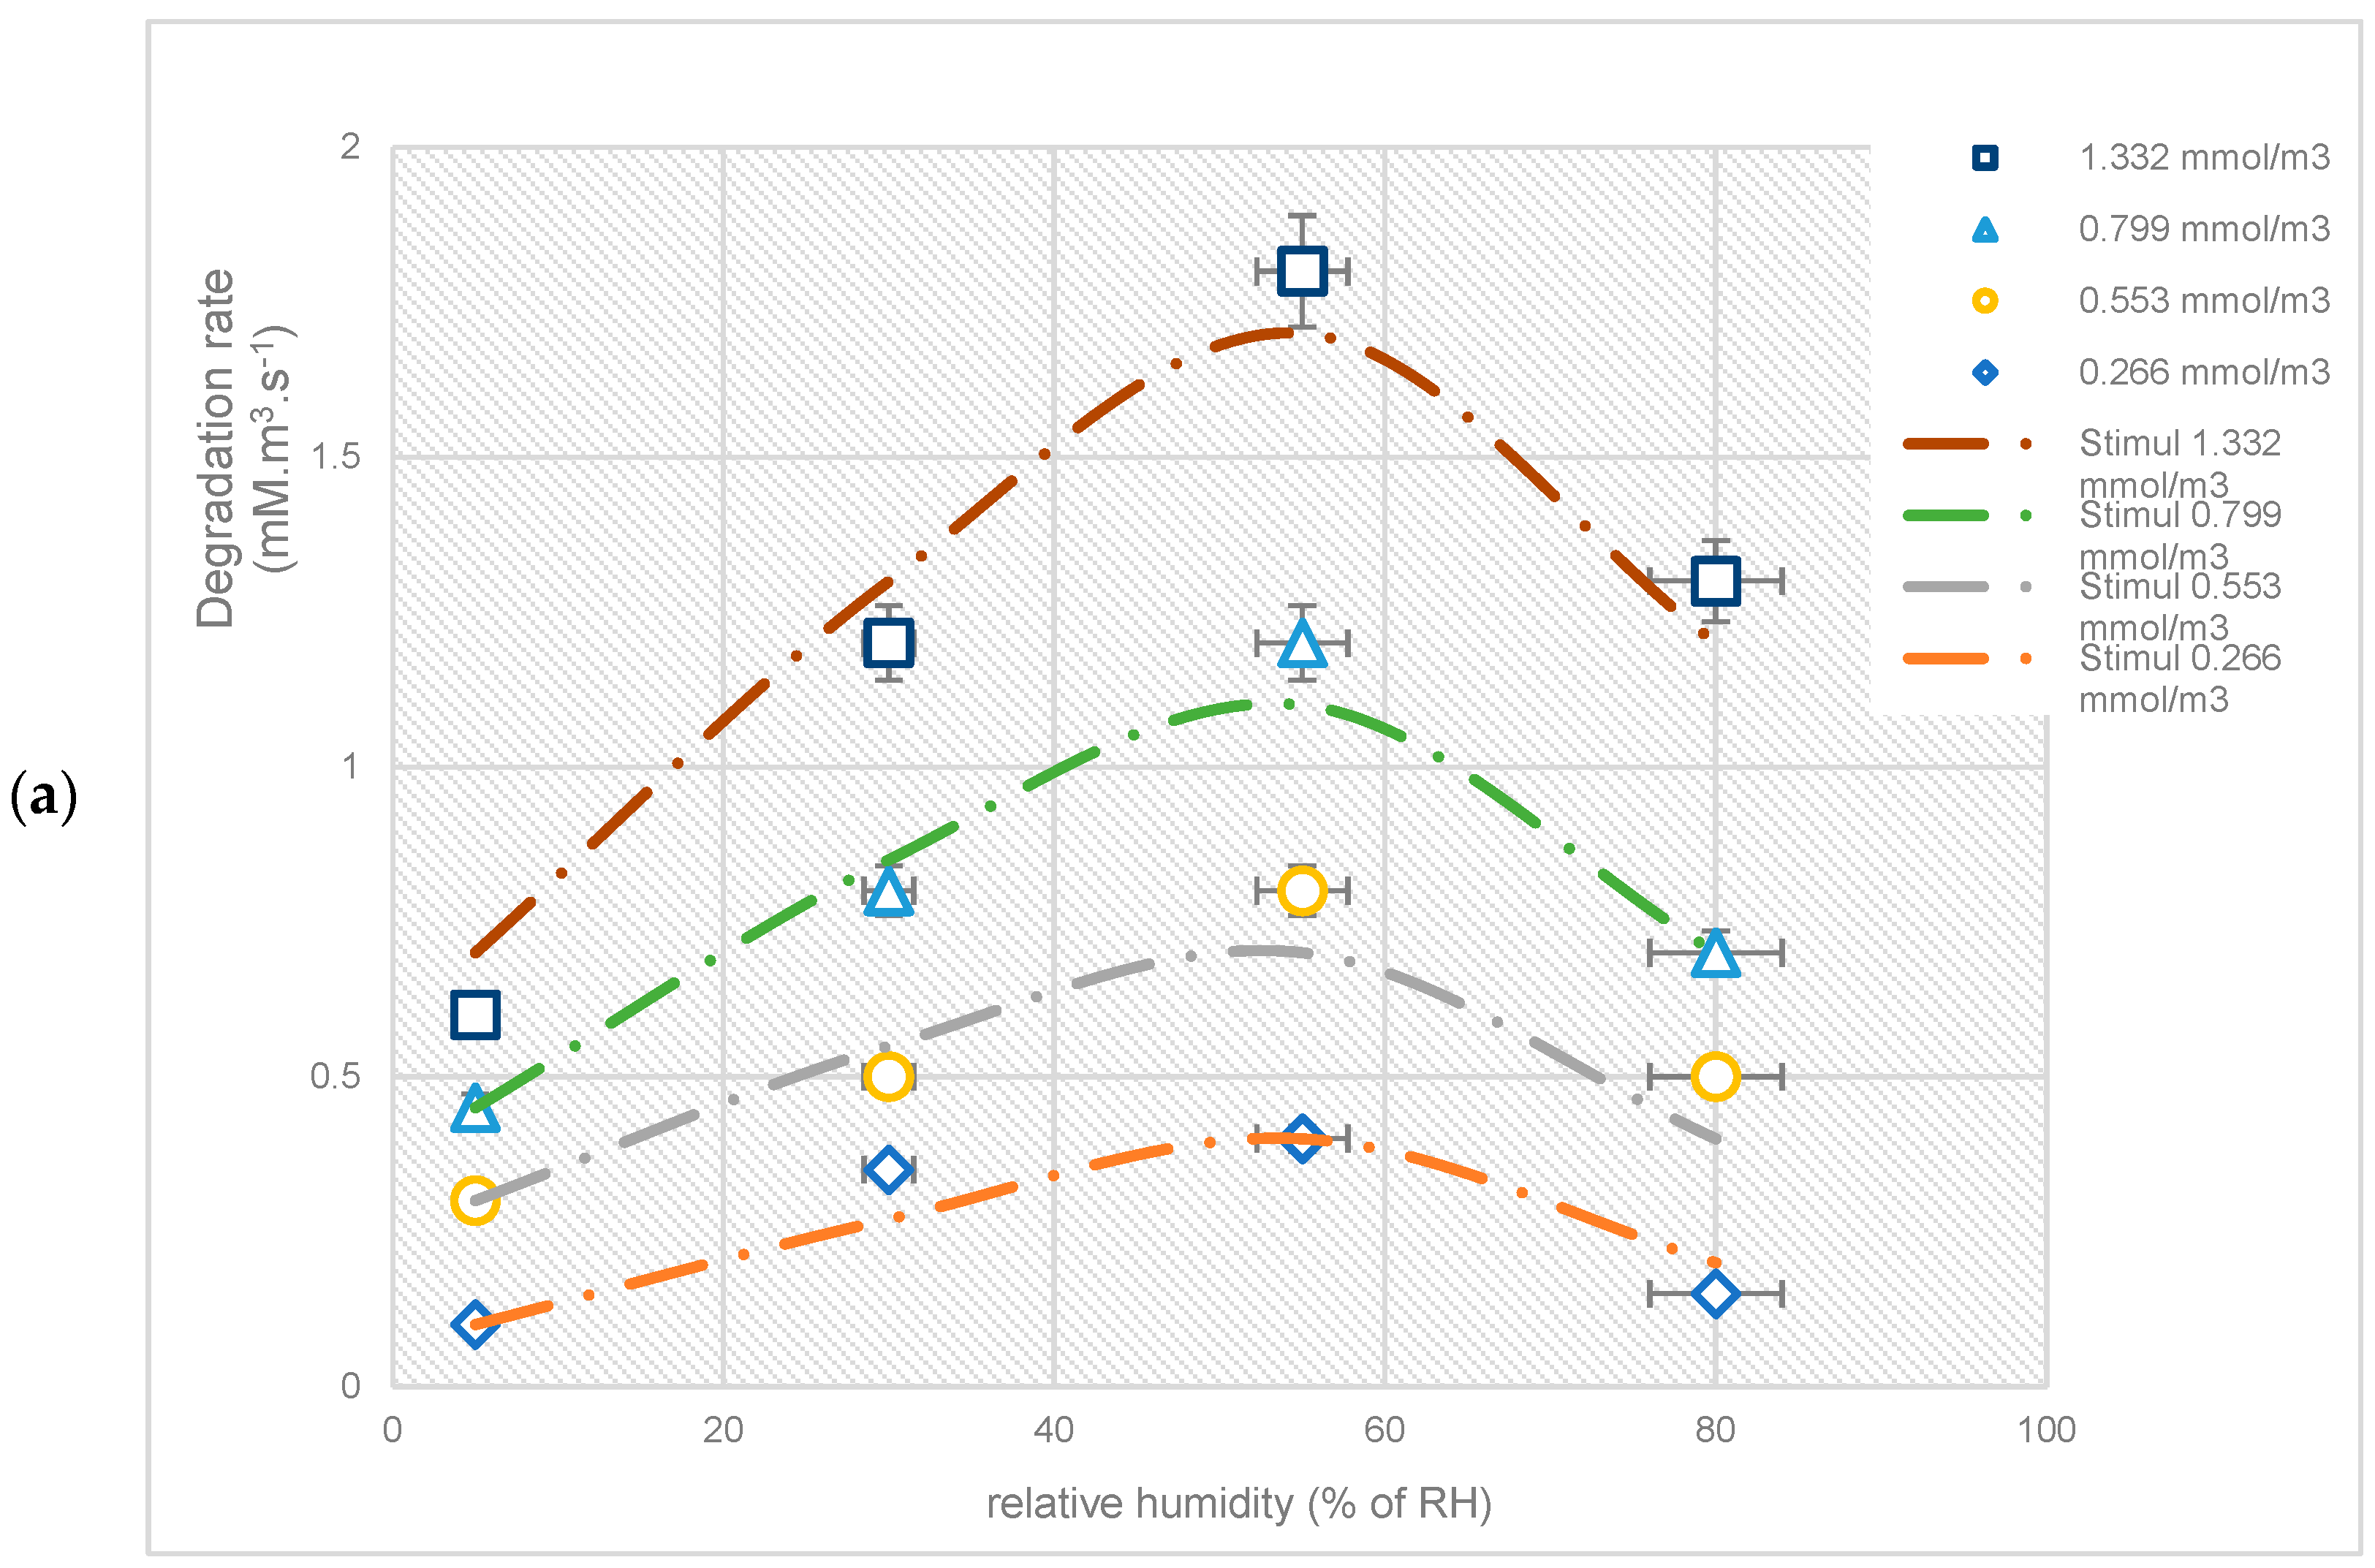
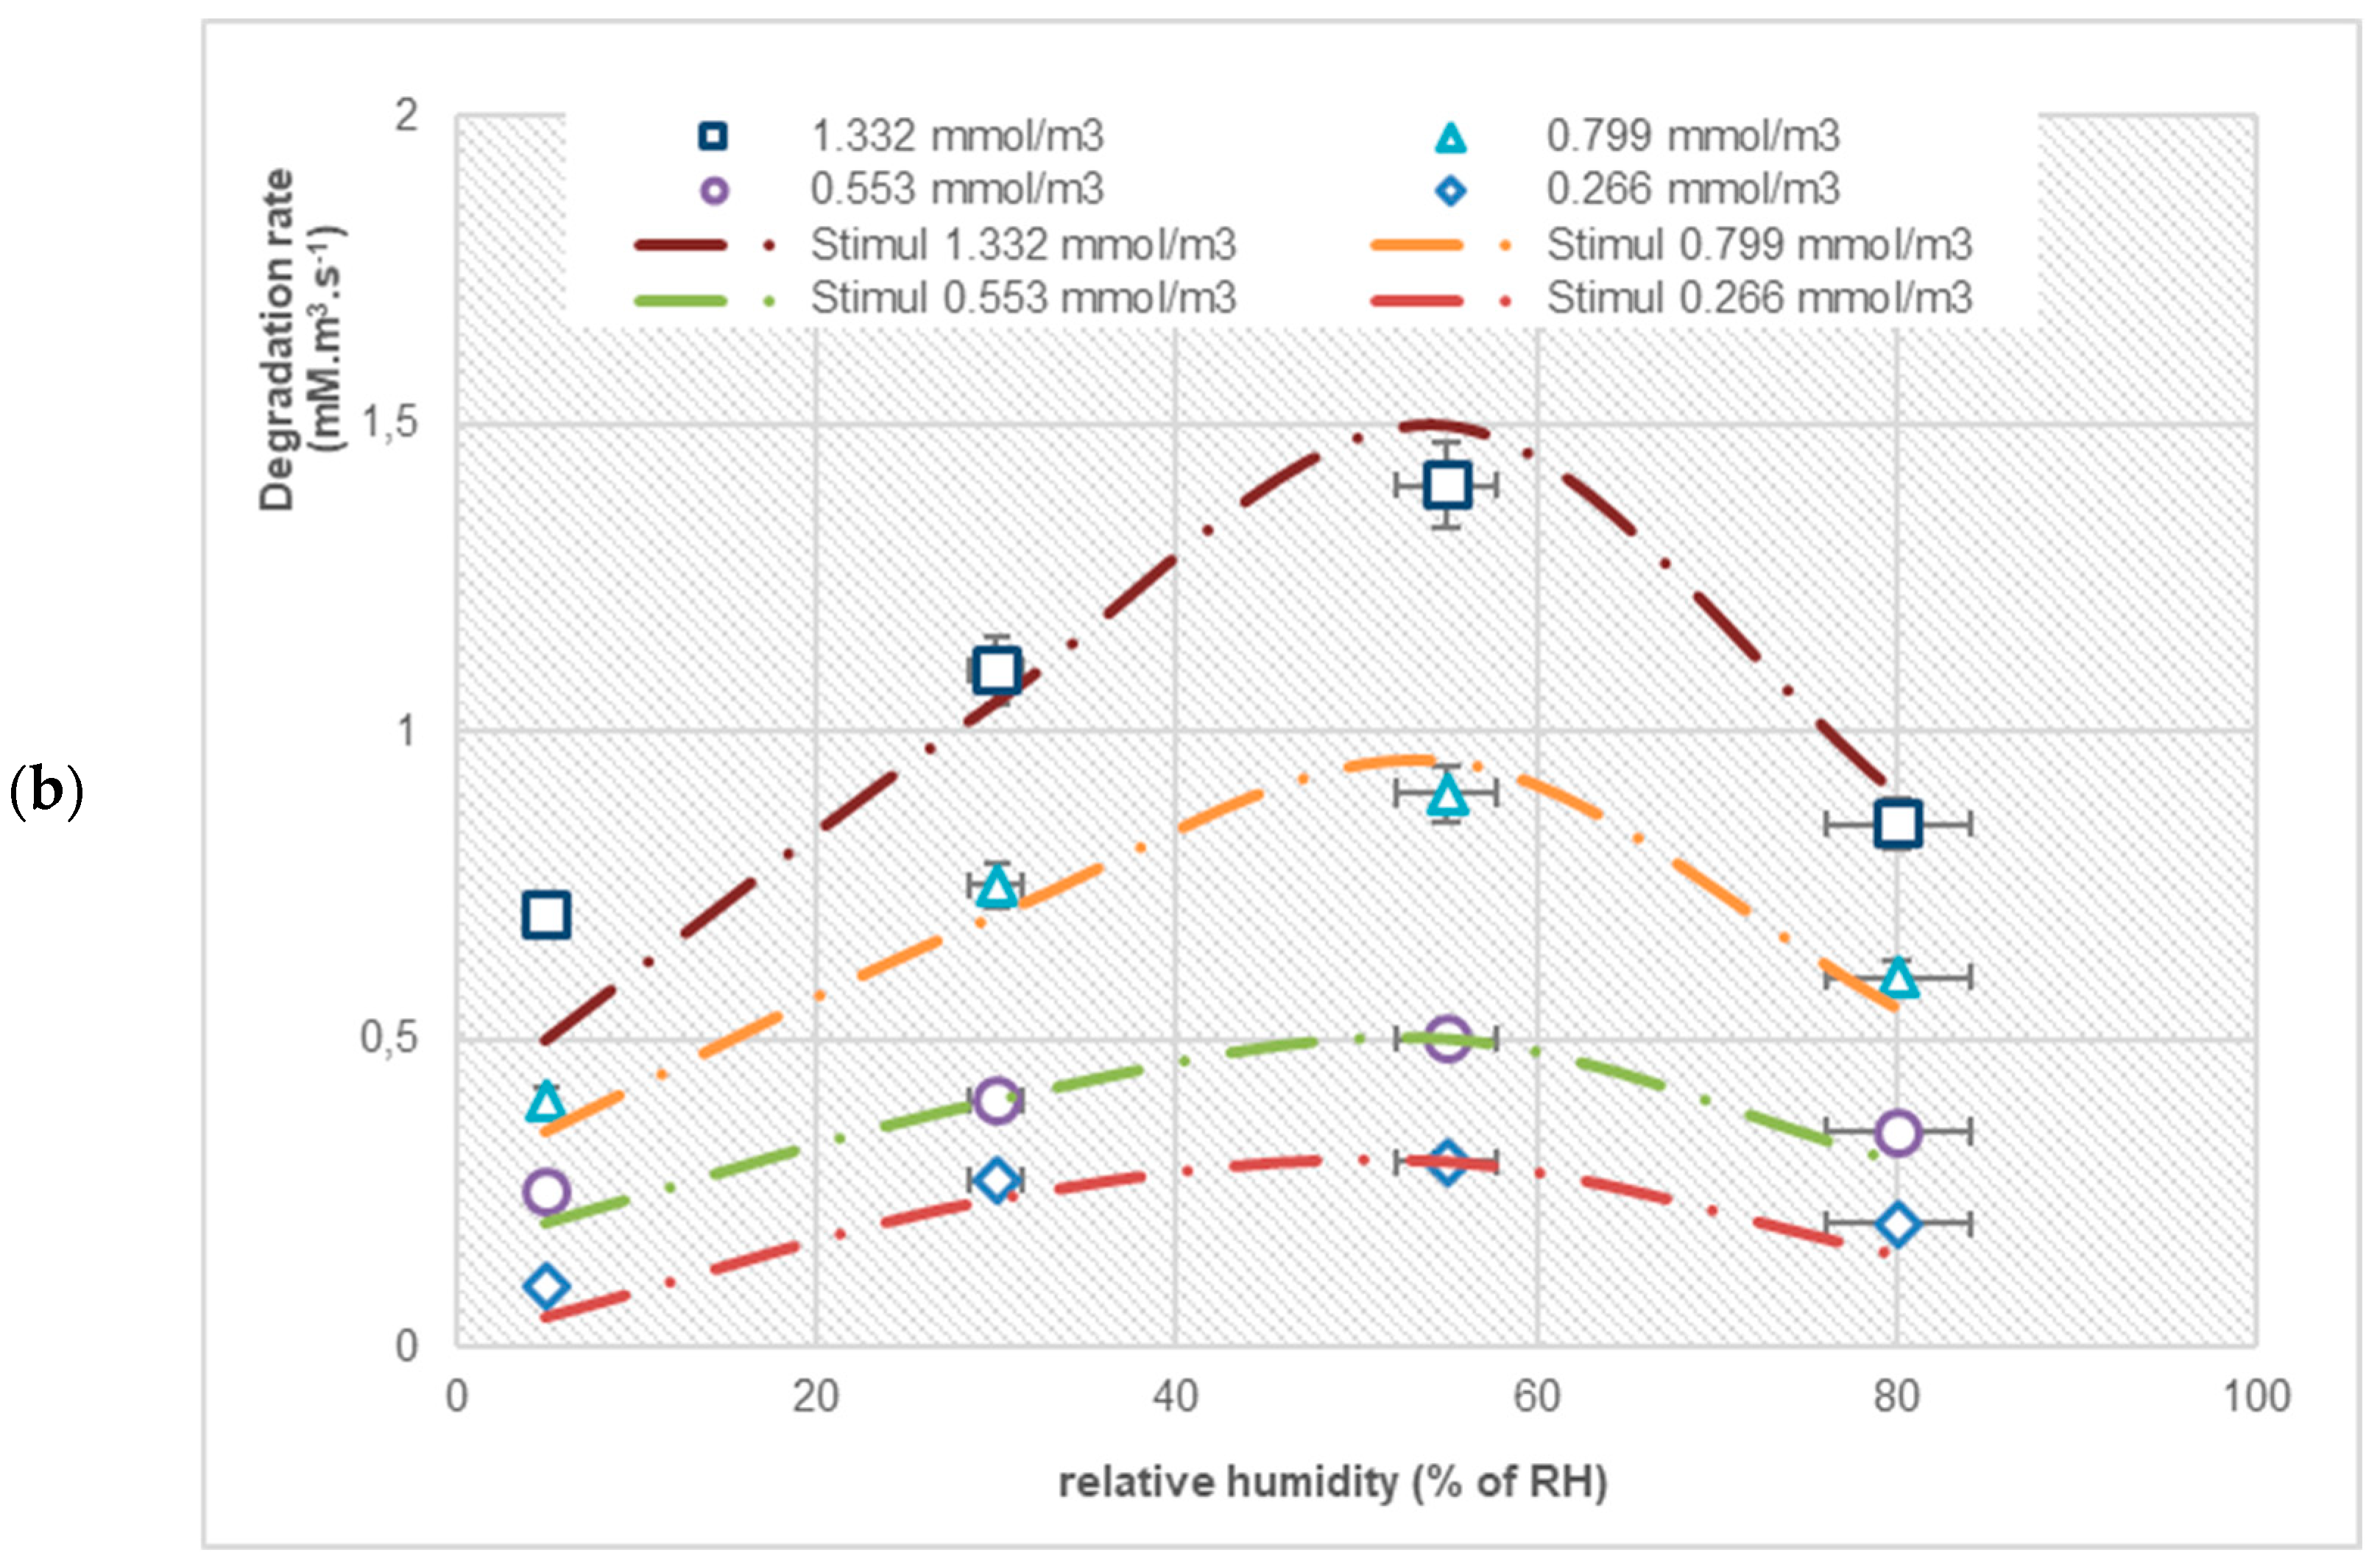
3.2. The Effect of Relative Humidity on the Degradation Rate

To corroborate the results obtained from the experimental tests, the Langmuir–Hinshelwood bimolecular model was used [36]. In this model, the water–VOC system is assimilated into a binary system. The degradation kinetics can be expressed as follows:
r A = k A · F A · F W
F A = K A · C A ( 1 + K A · C A + K w · C w )
F w = K w · C w 1 + K A · C A + K w · C w
r A = k A · K A · C A ( 1 + K A · C A + K w · C w ) · K w · C w ( 1 + K A · C A + K w · C w )
The constants kA and KA are obtained by considering the mass transfer in the previous study, with a relative humidity value of 5% (dry air). Cw is the water vapor concentration, Kw is the Langmuir adsorption constant of the water, and K’A and K’w are the competitive adsorption constant of the pollutant and water.
Table 4 displays values for the Langmuir-Hinshelwood model parameters for the Volatile Organic Compounds (VOCs) types, including reaction rate constants and adsorption constants.
Relative humidity (RH) modeling confirmed that H2O molecules greatly influence the kinetics of VOC conversion in the photocatalytic process. The pace of the simulated and experimental speeds was identical. Petit and his group [29] showed that the photocatalytic removal rate of cyclohexane increases with the amount of water vapor. However, above a certain threshold, there is a detrimental effect on the degradation rate. Refs. [30,37,38,39] have confirmed this assertion.
Figure 4a,b present the influence of water molecules on treating VOCs during heterogeneous photocatalysis.
The DR increased from 5 to 55% RH, while it decreased beyond 55% RH. The experimental and simulated speeds varied based on the flow and concentration conditions. When compared to CN, a higher CB degradation was observed under this study’s humidity conditions. It is well known that the influence of humidity on the degradation of VOCs depends on the nature of the pollutant, especially its hydrophilic character and the concentration of the injected VOCs.
Moreover, TiO2 has a polar surface, which favors the adoption of water molecules on the catalyst’s surface. Even though, there is a small amount of competition with the pollutants on the active’s sites, at a low water content, this compaction is accompanied by another photocatalytic reaction (the oxidation of water by photocatalysis), which forms OH° radicals [40]. Therefore, the water molecules in the vapor phase must be consumed over the catalyst surface to promote radical generation. The increase in humidity, thus, facilitates the reactions between the VOC molecules and the radicals formed through the strong OH* production from H2O at the interface, as shown in the following reactions:
H 2 O + e H * + O H * + e H 2 O + h + O H * + H +  
Oxygen can be transformed into a superoxide anion (O2*) by reacting with the photogenerated electrons on the surface of the catalyst, according to the following reaction [15]:
e + O 2 O 2 *
In the presence of water molecules, the superoxide anion (O2*−) can react with water molecules to generate OH*:
2 O 2 * + 2 H 2 O 2 O H * + 2 O H + O 2
Thus, increasing the amount of water can lead to an increase in the degradation rate due to the generation of more OH* radicals.
However, excess water can negatively impact the conversion of pollutants, as water molecules can compete with organic compounds on TiO2 adsorption sites. Comparing the degradation rate achieved in dry air (RH 5%) and wet air, it was observed that water has a beneficial effect. However, when the humidity level exceeded 55% RH, the adsorption constant significantly decreased, which has been supported by previous studies [28,35,40].
The value of the reaction constant can assume a minimum under dry air conditions and a maximum at about 55% relative humidity, and then decreases with increasing humidity. Under high-humidity conditions, the VOC must first penetrate the layers of water molecules before interacting with the catalyst surface or any radicals generated in the reactor. The lack of H2O molecules on the TiO2 surface limits radical generation in a dry air stream (5%). The water molecule favors photocatalytic reactions under relatively humid conditions (5% to 55%).
At a high humidity (80%), the mole fraction of water submerges the TiO2 adsorption sites. Mass transfer on and/or into the water film on the TiO2 surface dominates any potential photocatalytic reaction, as demonstrated by [41]. Therefore, the DR of the VOCs decreases regardless of the concentration of the VOCs in the medium.
The work of [42] on treating trichloromethane by photocatalysis showed that photocatalytic degradation is generally affected by H2O molecules. In most cases, the complete absence of water vapor is fatal to photocatalysis because it directly affects the amount of OH* formed. In addition, a very high relative humidity value can negatively affect the process due to competition between the water and pollutants. Zang and his co-workers [43] made the same remark in their study of the effect of relative humidity on the photocatalytic degradation mechanism of gaseous styrene.

3.3. Selectivity of CO2

Photocatalysis allows for the transformation of many VOCs into CO2 and H2O. The classic reaction of this chemical mechanism can be summarized as follows:
V O C s + O 2 T i O 2 U V b y p r o d u c t s a d s T i O 2 U V C O 2 + H 2 O
The selectivity is determined by the following formula [44]:
C O X s e l e c t i v i t y = [ C O X ] i n [ C O X ] o u t N c · R E % · [ V O C ] i n · 10 4
where N c is the number of carbon atoms in the pollutant, RE % is the removal efficiency, x = 1 for CO and x = 2 for CO2, and [ C O X ] i n and [ C O X ] o u t are, respectively, the concentrations in ppm of COX at the inlet and outlet of the reactor, and [ V O C ] i n is the inlet concentration of the VOC in ppm.

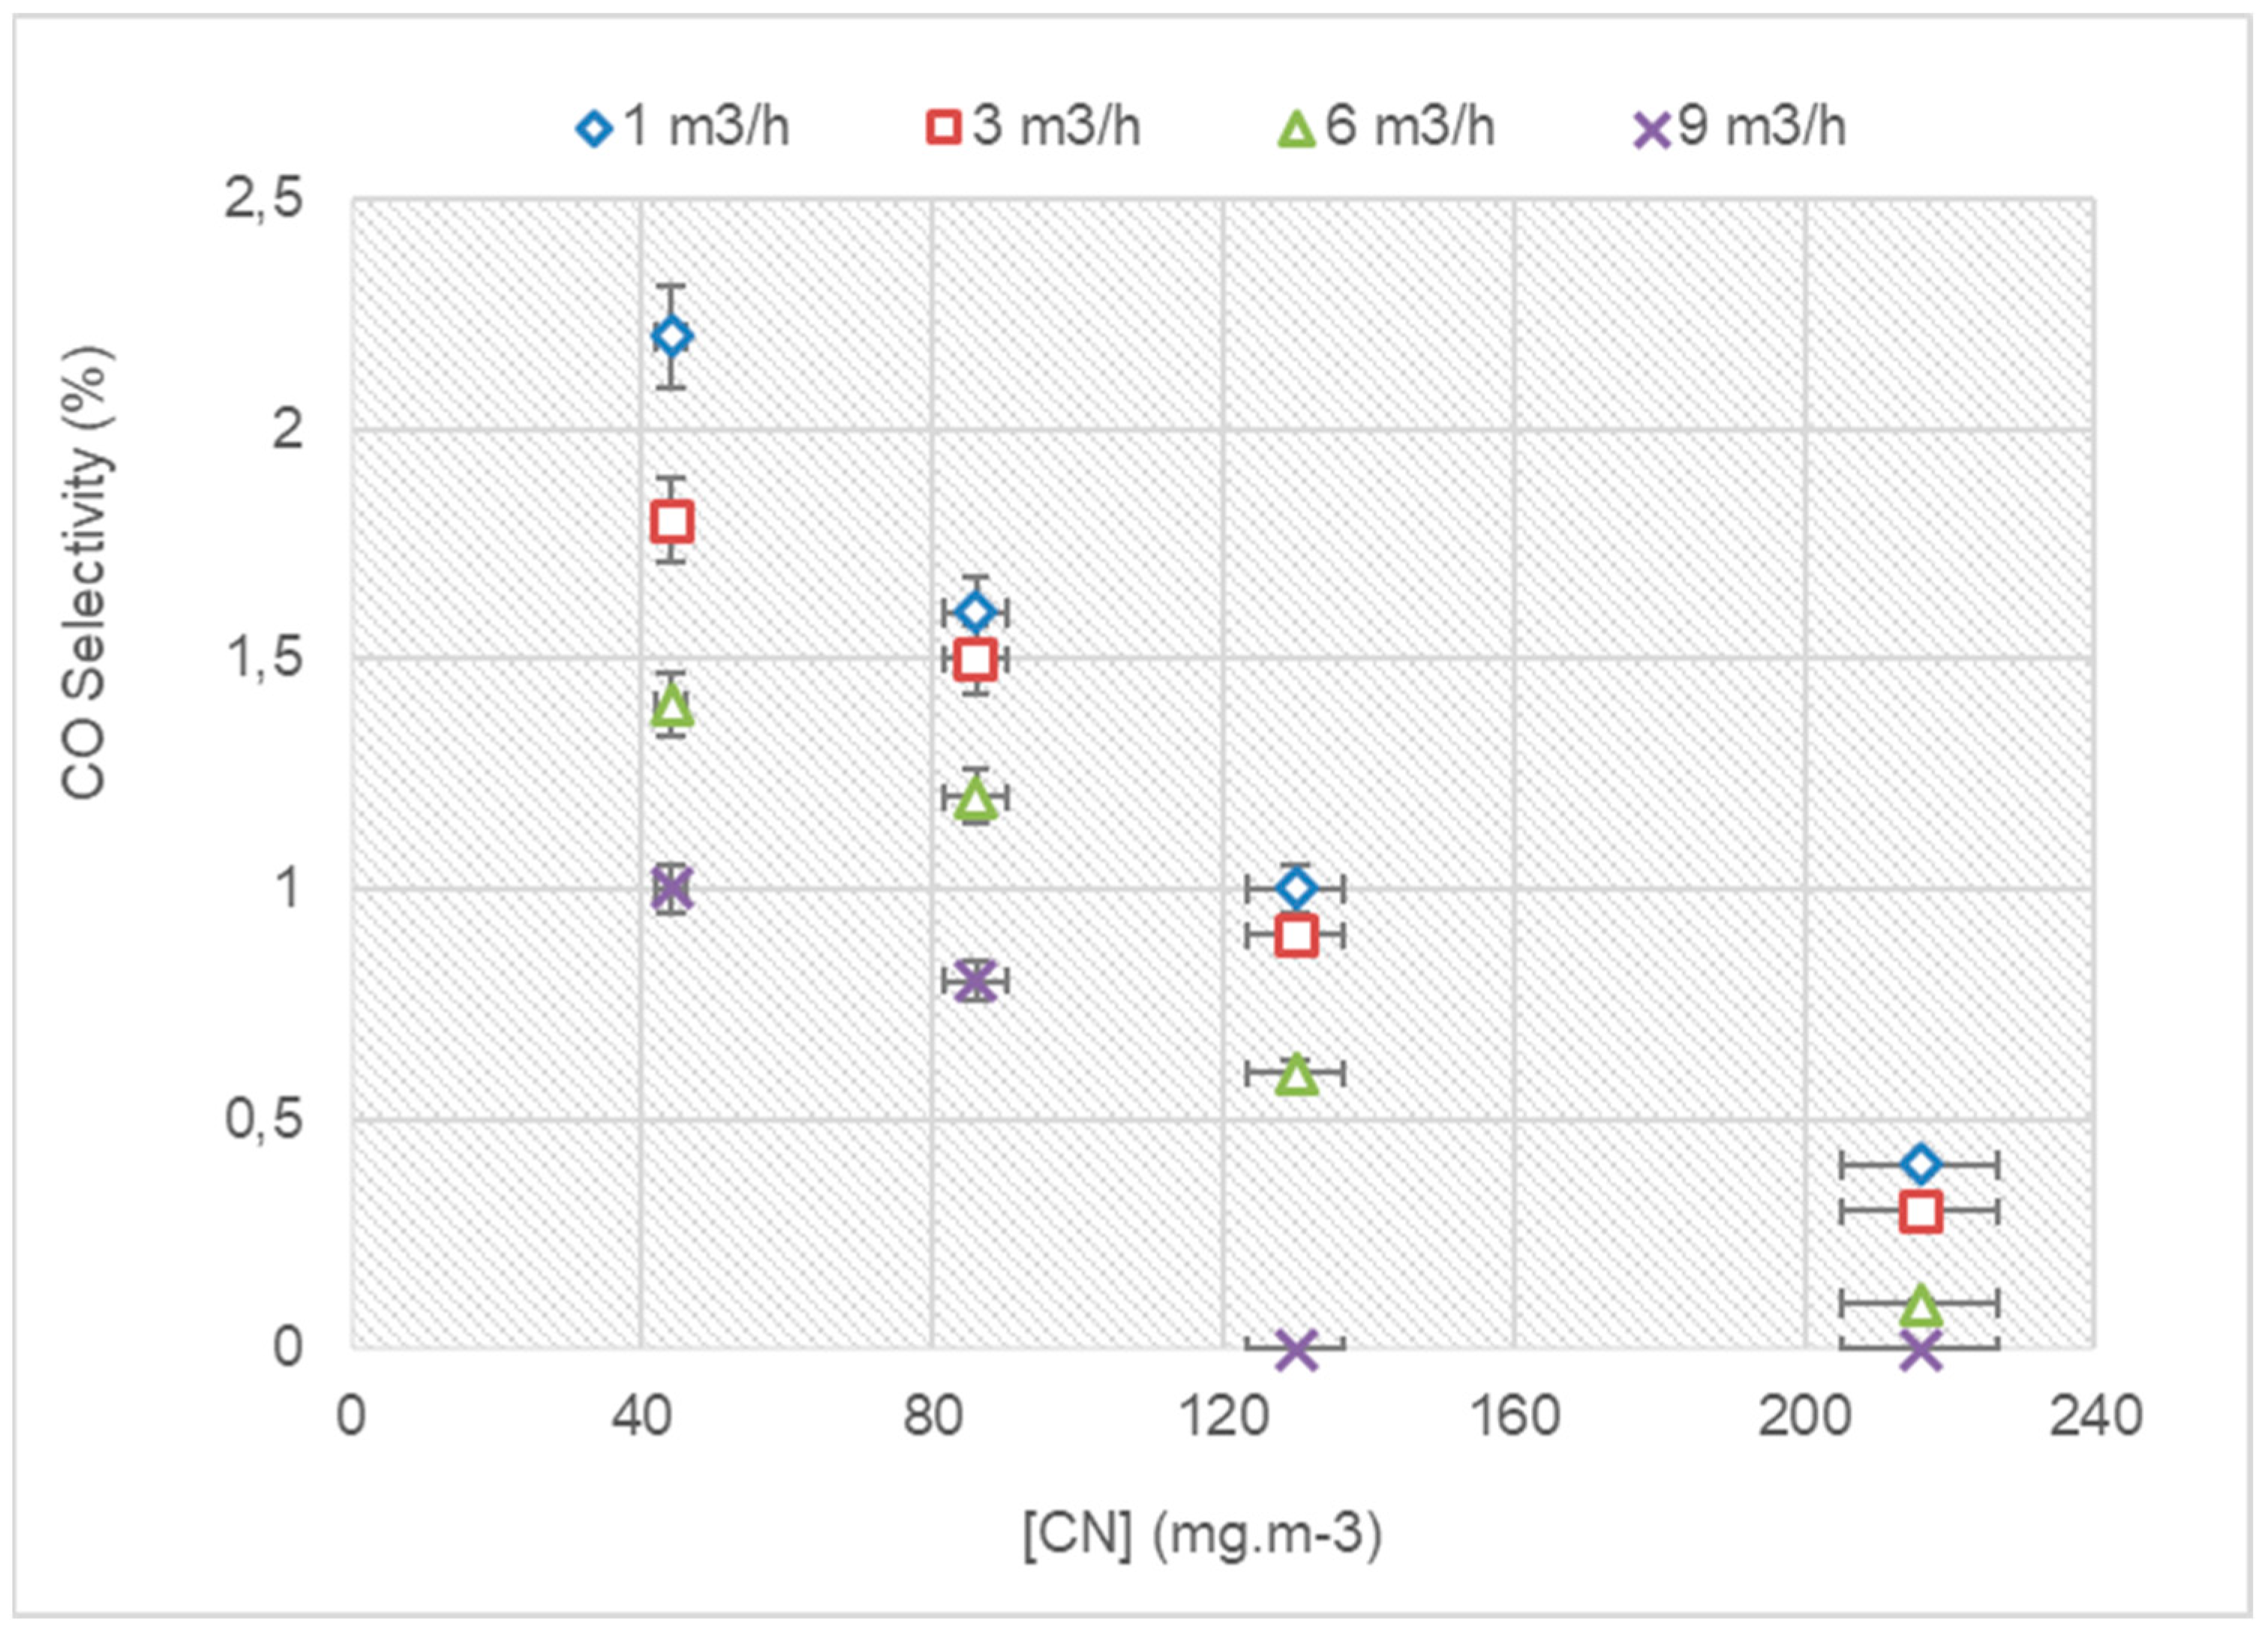
3.3.1. The COX Selectivity with a Variation in the Flow Rate and VOC Concentration

Figure 5 and Figure 6 display the selectivity of the VOCs, showing similar variations in the CO2 selectivity of CB and CN. The CO2 selectivity decreased with an increasing flow rate and concentration. The CO2 selectivity of CB varied from 49% to 15% for a concentration of 90 mg·m−3, when the flow rate was increased from 1 to 9 m3/h. For a flow rate of 3 m3/h, the CO2 selectivity of CB varied from 59% to 30%, when the concentration was increased from 30 to 150 mg·m−3.
For CN, the CO2 selectivity varied from 60% to 21% for a concentration of 130 mg·m−3 when the flow rate increased from 1 to 9 m3/h. For a flow rate of 3 m3/h, the CO2 selectivity of CB varied from 65% to 40% when the concentration increased from 44 to 216 mg·m−3.
Indeed, during the photocatalytic mechanism, the number of reactive species photogenerated and the active sites of the support remained constant. Thus, a small fraction was mineralized into CO2 for high concentrations of pollutants.
The improvement in CO2 selectivity was noticeable for small concentrations of pollutants injected at the inlet of the reactor, because the availability of the active sites of the catalyst remained greater, so the compounds were easily converted into CO2. Several studies [19,43,44,45], are unanimous regarding the fact that increasing the initial concentration and flow rate decreases the CO2 selectivity during the photocatalytic process.
The products of photocatalytic degradation are generally CO2 and H2O. However, the identification of CO at the reactor outlet has often been reported [45]. This point was found in this study only regarding the photocatalytic degradation of CN. Accordingly, the following figure shows the small amount of CO released.

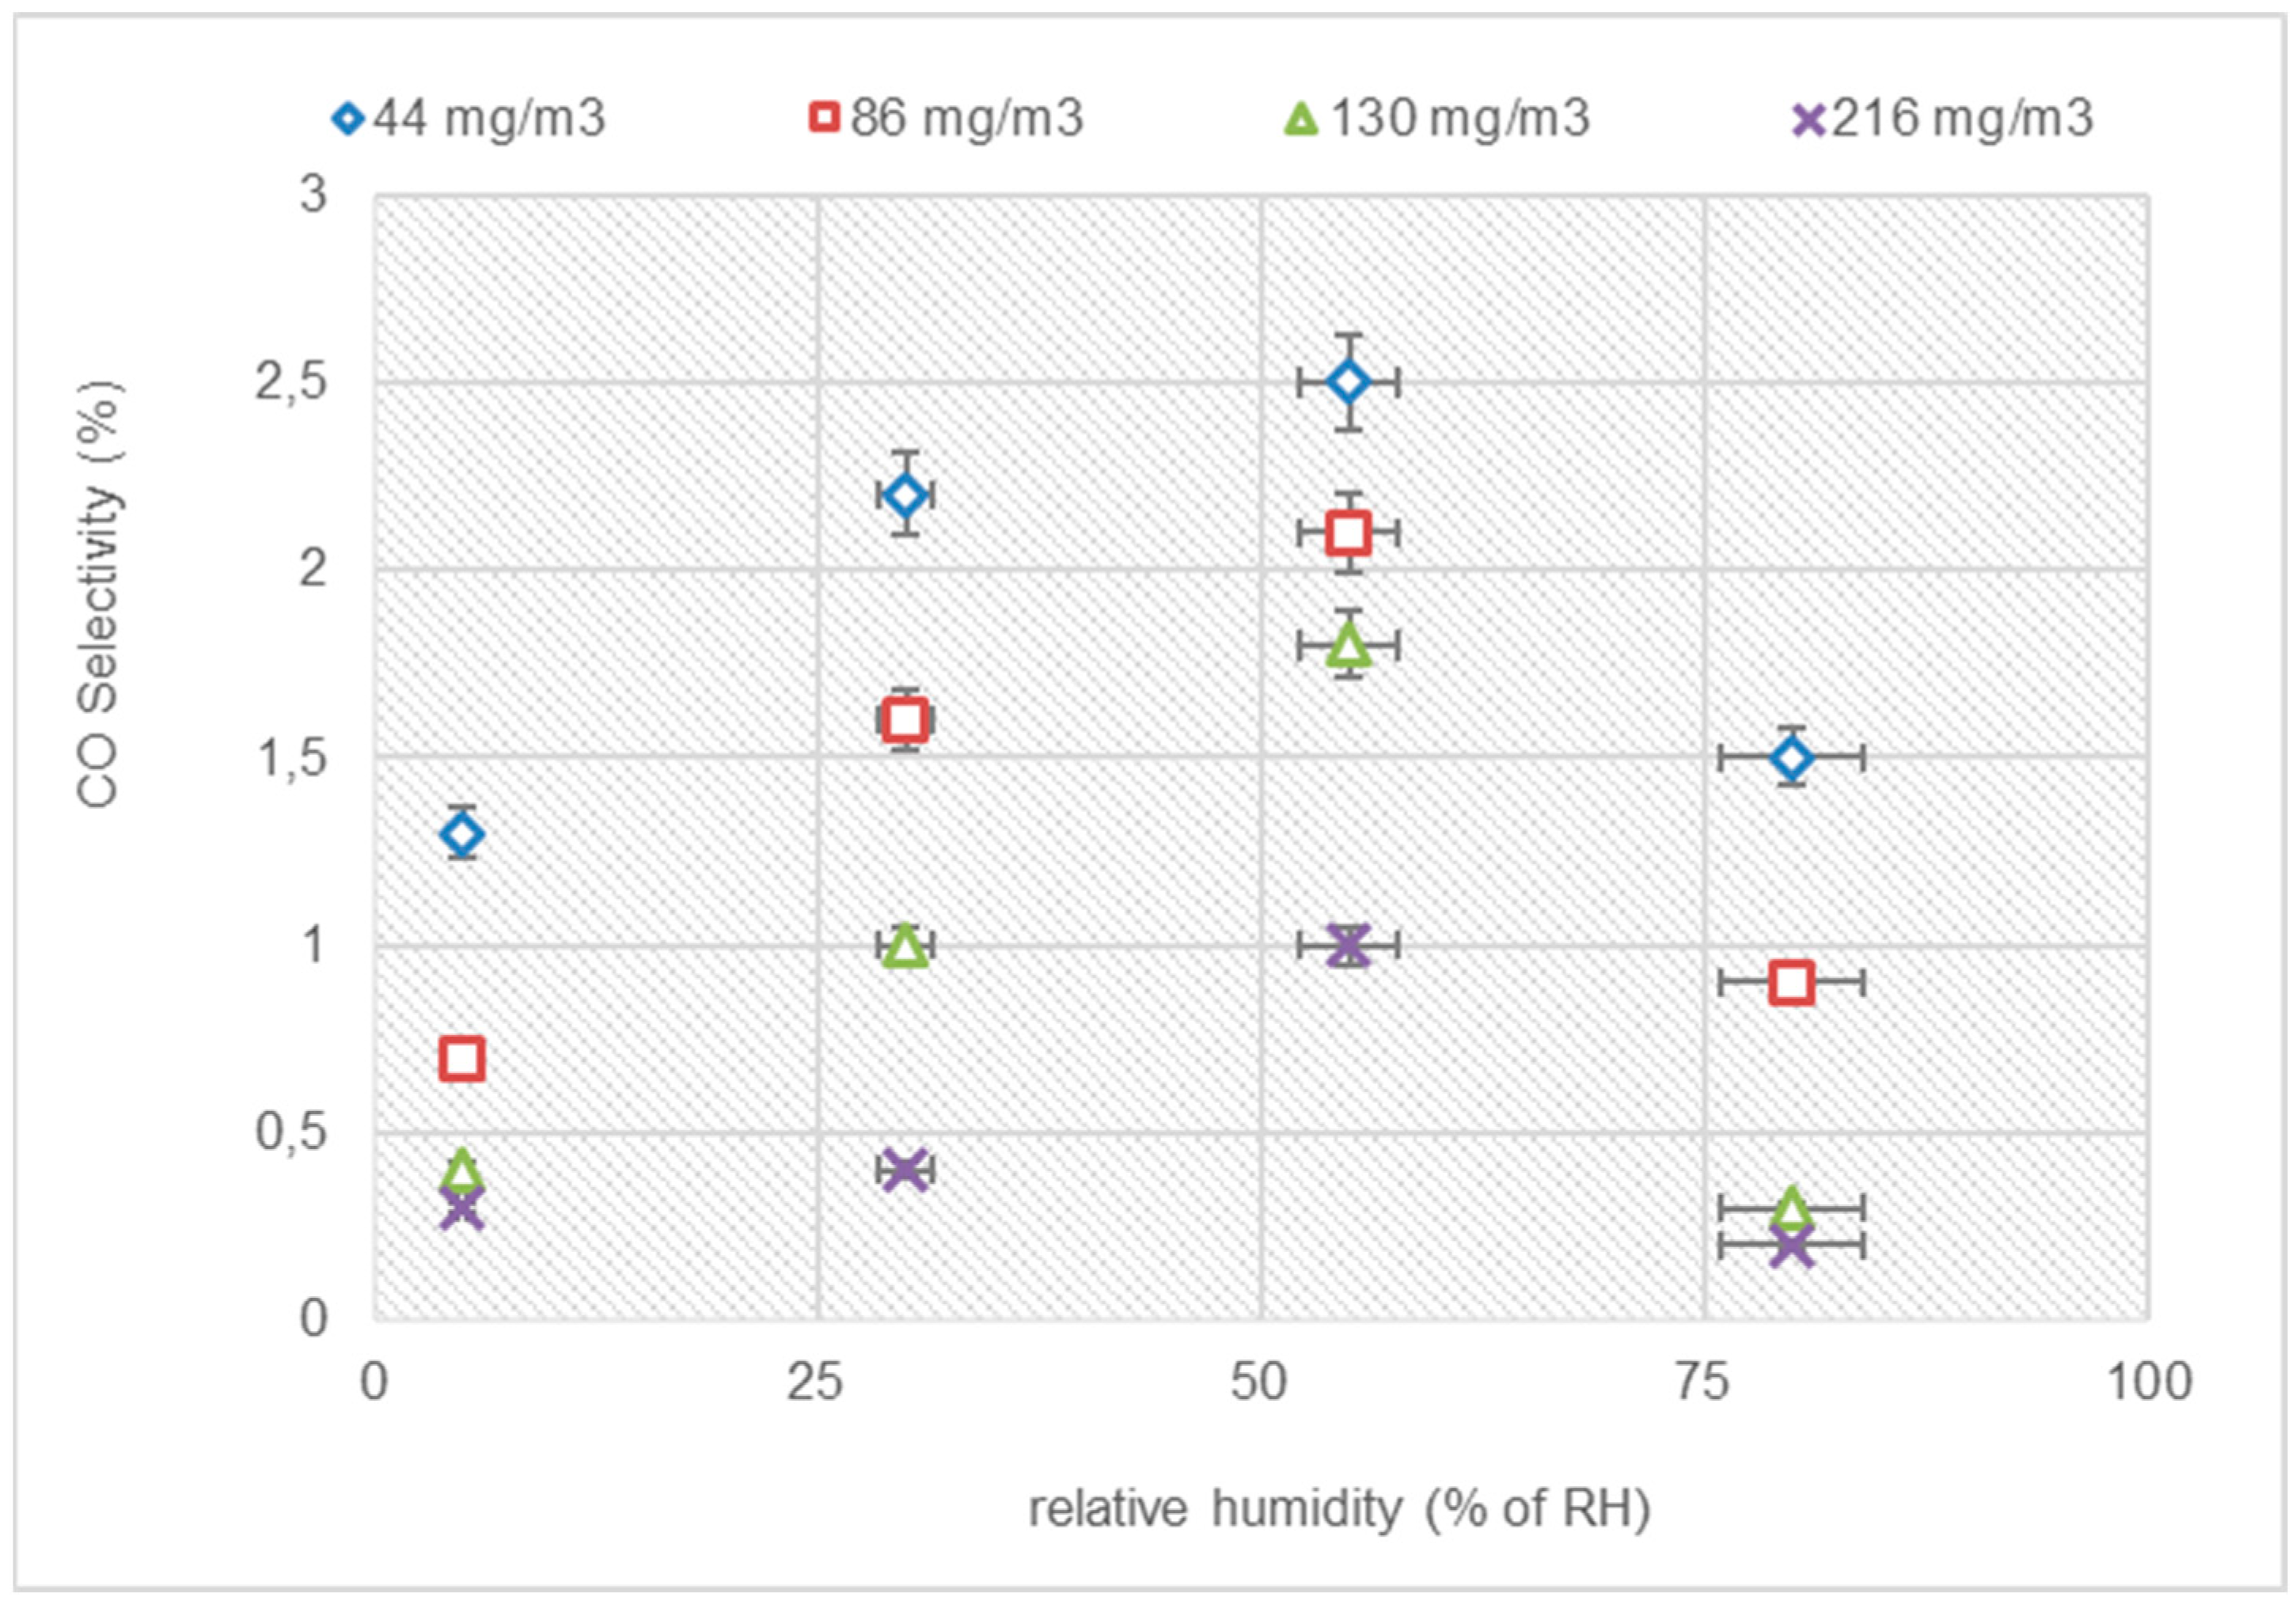
3.3.2. COX Selectivity with Variation in Humidity

The evaluation of CO2 selectivity in the presence of humid air was performed to determine the impact of the RH on CO2 production. As observed (Figure 7), the variations in CO2 selectivity were similar for both VOCs. Regarding CB, the CO2 selectivity showed a peak at 55% RH, regardless of the VOC concentration. Similarly, regarding CN, the CO2 selectivity also showed a peak at 55% RH. The CO2 selectivity of CB increased from 35% to 54%, and then decreased to 36%, at a concentration of 19 ppm. For the same concentration, the CO2 selectivity of CN increased from 50% to 66%, and then decreased to 52%. This same remark was made by [45].
This study shows that, above a specific value, the humidity harms the mineralization of VOCs, leading to a decrease in CO selectivity (Figure 8). This result seems logical because, at a crucial RH, an adsorption competition between water molecules and organic compounds takes place on the surface of TiO2 leading to a decrease in mineralization. The same conclusion was reached by Chikh and her group [45] following a study of the photocatalytic degradation of VOCs.
Table 5 compares reaction rate constants (k) and adsorption constants (K) for various pollutants processed in different types of reactors, as reported in the literature and this study.
The photocatalytic results are better than those found in the literature. This difference is due to the reactor configuration. The present configuration has a small air thickness, enhancing the mass transfer and obtaining attractive k and K values. In addition, it is interesting to note that these constants are not flow rate dependent. The influence of the flow regime is integrated completely through the parameter km. In fact, the separation of the mass transfer and the chemical reaction steps is obtained.

4. Conclusions

Based on this study’s findings, applying the L-H model for treating air containing chlorobenzene and chloronaphthalene using TiO2 photocatalysis demonstrates promising results. The degradation rates (DRs) were notably influenced by the inlet concentrations of the VOCs and the air effluent flow rate. Higher concentrations of VOCs and increased airflow rates correlated with improved DRs, suggesting an enhanced mass transfer and availability of active species. The facilitation of the initial radical species formation was identified as a critical factor in accelerating the degradation of the adsorbed pollutants, thereby reducing the residence time.
Furthermore, the L-H model reveals the significant impact of water molecules on the kinetics of VOC conversion during the photocatalytic process. An increase in water content from 5% to 55% enhanced the degradation rate due to the more significant generation of OH* radicals. However, a counteractive effect was observed with higher water quantities, wherein competition for the TiO2 adsorption sites reduced pollutant conversion. Interestingly, this study highlights a consistently higher chlorobenzene than chloronaphthalene degradation rate across varying flow rates, concentrations, and relative humidity conditions. These findings contribute valuable insights into optimizing photocatalytic processes for treating specific volatile organic compounds.

Author Contributions

Investigation, N.A.K., N.B. and Y.S.; formal analysis, N.A.K., N.B. and Y.S.; visualization, N.A.K., N.B. and Y.S.; writing original review, N.A.K., N.B. and Y.S.; conceptualization, L.K., S.L.C. and W.E.; funding acquisition L.K., S.L.C. and W.E.; methodology, L.C., A.B., A.A. and A.A.A.; project administration, L.C., A.B., A.A. and A.A.A.; supervision, L.C., A.B., A.A. and A.A.A.; writing-review and editing, L.C., A.B., A.A. and A.A.A. All authors have read and agreed to the published version of the manuscript.

Funding

This research received no external funding.

Institutional Review Board Statement

Not Applicable.

Informed Consent Statement

Not Applicable.

Data Availability Statement

The data supporting the conclusions of this study are accessible from the corresponding author upon reasonable request. The data are not publicly available due to privacy.

Acknowledgments

The authors gratefully acknowledge the support and funding provided by the Deanship of Scientific Research at Imam Mohammad Ibn Saud Islamic University (IMSIU) through the Research Partnership grant, grant number IMSIU-RP23076.

Conflicts of Interest

The authors declare no conflicts of interest.

References

  1. Abidi, M.; Hajjaji, A.; Bouzaza, A.; Lamaa, L.; Peruchon, L.; Brochier, C.; Rtimi, S.; Wolbert, D.; Bessais, B.; Assadi, A.A. Modeling of indoor air treatment using an innovative photocatalytic luminous textile: Reactor compactness and mass transfer enhancement. Chem. Eng. J. 2022, 430, 132636. [Google Scholar] [CrossRef]
  2. Abiev, R.S.; Sladkovskiy, D.A.; Semikin, K.V.; Murzin, D.Y.; Rebrov, E.V. Non-thermal plasma for process and energy intensification in dry reforming of methane. Catalysts 2020, 10, 1358. [Google Scholar] [CrossRef]
  3. Ahmadi, Y.; Kim, K.H. Modification strategies for visible-light photocatalysts and their performance-enhancing effects on photocatalytic degradation of volatile organic compounds. Renew. Sustain. Energy Rev. 2024, 189, 113948. [Google Scholar] [CrossRef]
  4. Alcázar-Medina, T.L.; Chairez-Hernández, I.; Lemus-Santana, A.A.; Núñez-Núñez, C.M.; Proal-Nájera, J.B. Amoxicillin Degradation by TiO2 P25 Solar Heterogeneous Photocatalysis: Influence of pH and Oxidizing Agent H2O2 Addition. Appl. Sci. 2023, 13, 7857. [Google Scholar] [CrossRef]
  5. Assadi, A.A. Efficient Photocatalytic Luminous Textile for Simulated Real Water Purification: Advancing Economical and Compact Reactors. Materials 2024, 17, 296. [Google Scholar] [CrossRef]
  6. Ashley, N.A.; McBride, N.; Krumholt, J.; Baker, B.; Valsaraj, K.T. Photocatalytic Reaction of Gas-Phase Naphthalene on Paint- and Sunscreen-Coated Surfaces. ISRN Chem. Eng. 2012, 2012, 72479. [Google Scholar] [CrossRef]
  7. Assadi, A.A.; Bouzaza, A.; Wolbert, D. Photocatalytic oxidation of trimethylamine and isovaleraldehyde in an annular reactor: Influence of the mass transfer and the relative humidity. J. Photochem. Photobiol. A Chem. 2012, 236, 61–69. [Google Scholar] [CrossRef]
  8. Bai, S.; Qiu, H.; Song, M.; He, G.; Wang, F.; Liu, Y.; Guo, L. Porous fixed-bed photoreactor for boosting C–C coupling in photocatalytic CO2 reduction. eScience 2022, 2, 428–437. [Google Scholar] [CrossRef]
  9. Boulamanti, A.K.; Korologos, C.A.; Philippopoulos, C.J. The rate of photocatalytic oxidation of aromatic volatile organic compounds in the gas-phase. Atmos. Environ. 2008, 42, 7844–7850. [Google Scholar] [CrossRef]
  10. Chang, Z.; Wang, C.; Zhang, G. Progress in degradation of volatile organic compounds based on low-temperature plasma technology. Plasma Process. Polym. 2020, 17, 1900131. [Google Scholar] [CrossRef]
  11. Chen, J.; Zhang, L.; Zhu, W.; Li, G.; An, T. Atomic-level insight into effect of substrate concentration and relative humidity on photocatalytic degradation mechanism of gaseous styrene. Chemosphere 2022, 291, 133074. [Google Scholar] [CrossRef]
  12. Cui, Y.; Ding, Z.; Sun, Y.; Yi, Y.; Xu, F.; Zhang, Q.; Wang, W. A theoretical study of OH radical-initiated atmospheric oxidation of 1-chloronaphthalene. Chem. Phys. Lett. 2018, 699, 40–47. [Google Scholar] [CrossRef]
  13. Dahiru, U.H.; Saleem, F.; Zhang, K.; Harvey, A. Plasma-assisted removal of methanol in N2, dry and humidified air using a dielectric barrier discharge (DBD) reactor. RSC Adv. 2022, 12, 10997–11007. [Google Scholar] [CrossRef]
  14. Ebrahimi, H.; Shahna, F.G.; Bahrami, A.; Jaleh, B.; Abedi, K.A.D. Photocatalytic degradation of volatile chlorinated organic compounds with ozone addition. Arch. Environ. Prot. 2017, 43, 65–72. [Google Scholar] [CrossRef]
  15. Khezami, L.; Assadi, A.A. Treatment of Mixture Pollutants with Combined Plasma Photocatalysis in Continuous Tubular Reactors with Atmospheric-Pressure Environment: Understanding Synergetic Effect Sources. Materials 2023, 16, 6857. [Google Scholar] [CrossRef]
  16. He, S.; Chen, Y.; Li, X.; Zeng, L.; Zhu, M. Heterogeneous Photocatalytic Activation of Persulfate for the Removal of Organic Contaminants in Water: A Critical Review. ACS ES&T Eng. 2022, 2, 527–546. [Google Scholar] [CrossRef]
  17. Jaison, A.; Mohan, A.; Lee, Y.C. Recent Developments in Photocatalytic Nanotechnology for Purifying Air Polluted with Volatile Organic Compounds: Effect of Operating Parameters and Catalyst Deactivation. Catalysts 2023, 13, 407. [Google Scholar] [CrossRef]
  18. Qi, J.; Wang, C.; Sun, J.; Li, S. TiO2 Assisted Photocatalytic Decomposition of 2-Chloronaphthalene on Iron Nanoparticles in Aqueous Systems: Synergistic Effect and Intermediate Products. Russ. J. Phys. Chem. A 2019, 93, 1620–1626. [Google Scholar] [CrossRef]
  19. Jo, W.K.; Park, K.H. Heterogeneous photocatalysis of aromatic and chlorinated volatile organic compounds (VOCs) for non-occupational indoor air application. Chemosphere 2004, 57, 555–565. [Google Scholar] [CrossRef] [PubMed]
  20. Kim, S.B.; Hong, S.C. Kinetic study for photocatalytic degradation of volatile organic compounds in air using thin film TiO2 photocatalyst. Appl. Catal. B Environ. 2002, 35, 305–315. [Google Scholar] [CrossRef]
  21. Kenfoud, H.; Baaloudj, O.; Nasrallah, N. Structural and electrochemical characterizations of Bi12CoO20 sillenite crystals: Degradation and reduction of organic and inorganic pollutants. J. Mater. Sci. Mater. Electron. 2021, 32, 16411–16420. [Google Scholar] [CrossRef]
  22. Koné, N.Z.A.; Belkessa, N.; Serhane, Y.; Coulibaly, S.L.; Kamagate, M. Chlorobenzene Mineralization Using Plasma/Photocatalysis Hybrid Reactor: Exploiting the Synergistic Effect. Catalysts 2023, 13, 431. [Google Scholar] [CrossRef]
  23. Kong, C.P.Y.; Suhaimi, N.A.A.; Shahri, N.N.M.; Lim, J.W.; Nur, M.; Hobley, J.; Usman, A. Auramine O UV Photocatalytic Degradation on TiO2 Nanoparticles in a Heterogeneous Aqueous Solution. Catalysts 2022, 12, 975. [Google Scholar] [CrossRef]
  24. Li, J.; Xie, X.; Li, L.; Wang, X.; Wang, H.; Jing, S.; Ying, Q.; Qin, M.; Hu, J. Fate of Oxygenated Volatile Organic Compounds in the Yangtze River Delta Region: Source Contributions and Impacts on the Atmospheric Oxidation Capacity. Environ. Sci. Technol. 2022, 56, 11212–11224. [Google Scholar] [CrossRef] [PubMed]
  25. Drhimer, F.; Rahmani, M.; Regraguy, B.; El Hajjaji, S.; Mabrouki, J.; Amrane, A.; Fourcade, F.; Assadi, A.A. Treatment of a Food Industry Dye, Brilliant Blue, at Low Concentration Using a New Photocatalytic Configuration. Sustainability 2023, 15, 5788. [Google Scholar] [CrossRef]
  26. Masresha, G.; Jabasingh, S.A.; Kebede, S.; Doo-Arhin, D.; Assefa, M. A review of prospects and challenges of photocatalytic decomposition of volatile organic compounds (VOCs) under humid environment. Can. J. Chem. Eng. 2023, 101, 6905–6918. [Google Scholar] [CrossRef]
  27. Maung, T.Z.; Bishop, J.E.; Holt, E.; Turner, A.M.; Pfrang, C. Indoor Air Pollution and the Health of Vulnerable Groups: A Systematic Review Focused on Particulate Matter (PM), Volatile Organic Compounds (VOCs) and Their Effects on Children and People with Pre-Existing Lung Disease. Int. J. Environ. Res. Public Health 2022, 19, 8752. [Google Scholar] [CrossRef]
  28. Mohammed, S.S.; Shnain, Z.Y.; Abid, M.F. Use of TiO2 in Photocatalysis for Air Purification and Wastewater Treatment: A Review. Eng. Technol. J. 2022, 3, 1131–1143. [Google Scholar] [CrossRef]
  29. Petit, N.; Bouzaza, A.; Wolbert, D.; Petit, P.; Dussaud, J. Photocatalytic degradation of gaseous perchloroethylene in continuous flow reactors: Rate enhancement by chlorine radicals. Catal. Today 2007, 124, 266–272. [Google Scholar] [CrossRef]
  30. Assadi, A.A.; Baaloudj, O.; Khezami, L.; Ben Hamadi, N.; Mouni, L.; Assadi, A.A.; Ghorbal, A. An Overview of Recent Developments in Improving the Photocatalytic Activity of TiO2-Based Materials for the Treatment of Indoor Air and Bacterial Inactivation. Materials 2023, 16, 2246. [Google Scholar] [CrossRef]
  31. Rissanen, K.; Aalto, J.; Gessler, A.; Hölttä, T.; Rigling, A.; Schaub, M.; Bäck, J. Drought effects on volatile organic compound emissions from Scots pine stems. Plant. Cell Environ. 2022, 45, 23–40. [Google Scholar] [CrossRef] [PubMed]
  32. Rouf, Z.; Dar, I.Y.; Javaid, M.; Dar, M.Y.; Jehangir, A. Volatile Organic Compounds Emission from Building Sector and Its Adverse Effects on Human Health. In Ecological and Health Effects of Building Materials; Springer International Publishing: Berlin/Heidelberg, Germany, 2022; pp. 67–86. [Google Scholar] [CrossRef]
  33. Serhane, Y.; Belkessa, N.; Bouzaza, A.; Wolbert, D.; Assadi, A.A. Continuous air purification by front flow photocatalytic reactor: Modelling of the influence of mass transfer step under simulated real conditions. Chemosphere 2022, 295, 133809. [Google Scholar] [CrossRef]
  34. Tulebekov, Y.; Orazov, Z.; Satybaldiyev, B.; Snow, D.D.; Schneider, R.; Uralbekov, B. Reaction Steps in Heterogeneous Photocatalytic Oxidation of Toluene in Gas Phase—A Review. Molecules 2023, 28, 6451. [Google Scholar] [CrossRef]
  35. Wang, Y.; Ding, L.; Shi, Q.; Liu, S.; Qian, L.; Yu, Z.; Wang, H.; Lei, J.; Gao, Z.; Long, H.; et al. Volatile organic compounds (VOC) emissions control in iron ore sintering process: Recent progress and future development. Chem. Eng. J. 2022, 448, 137601. [Google Scholar] [CrossRef]
  36. Wu, J.; Chen, Y.; Chien, Y.; Kurioka, T.; Sone, M.; Chen, C.; Chang, T.M.; Hsu, Y. Photocatalytic Fibers for Environmental Puri fi cation: Challenges and Opportunities in the Post-Pandemic Era. Adv. Energy Sustain. Res. 2023, 5, 2300212. [Google Scholar] [CrossRef]
  37. Xu, P.; Ding, C.; Li, Z.; Yu, R.; Cui, H.; Gao, S. Photocatalytic degradation of air pollutant by modified nano titanium oxide (TiO2) in a fluidized bed photoreactor: Optimizing and kinetic modeling. Chemosphere 2023, 319, 137995. [Google Scholar] [CrossRef] [PubMed]
  38. Yamazaki, S.; Tsukamoto, H.; Araki, K.; Tanimura, T.; Tejedor-Tejedor, I.; Anderson, M.A. Photocatalytic degradation of gaseous tetrachloroethylene on porous TiO2 pellets. Appl. Catal. B Environ. 2001, 33, 109–117. [Google Scholar] [CrossRef]
  39. Zadi, T.; Assadi, A.A.; Nasrallah, N.; Bouallouche, R.; Tri, P.N.; Bouzaza, A.; Azizi, M.M.; Maachi, R.; Wolbert, D. Treatment of hospital indoor air by a hybrid system of combined plasma with photocatalysis: Case of trichloromethane. Chem. Eng. J. 2018, 349, 276–286. [Google Scholar] [CrossRef]
  40. Zatta, D.; Segata, M.; Biasioli, F.; Allegretti, O.; Bochicchio, G.; Verucchi, R.; Chiavarini, F.; Cappellin, L. Comparative Analysis of Volatile Organic Compound Purification Techniques in Complex Cooking Emissions: Adsorption, Photocatalysis and Combined Systems. Molecules 2023, 28, 7658. [Google Scholar] [CrossRef]
  41. Zhang, L.; Moralejo, C.; Anderson, W.A. A review of the influence of humidity on photocatalytic decomposition of gaseous pollutants on TiO2-based catalysts. Can. J. Chem. Eng. 2020, 98, 263–273. [Google Scholar] [CrossRef]
  42. Zhang, L.; Sawell, S.; Moralejo, C.; Anderson, W.A. Heterogeneous photocatalytic decomposition of gas-phase chlorobenzene. Appl. Catal. B Environ. 2007, 71, 135–142. [Google Scholar] [CrossRef]
  43. Zhang, M.; An, T.; Fu, J.; Sheng, G.; Wang, X.; Hu, X.; Ding, X. Photocatalytic degradation of mixed gaseous carbonyl compounds at low level on adsorptive TiO2/SiO2 photocatalyst using a fluidized bed reactor. Chemosphere 2006, 64, 423–431. [Google Scholar] [CrossRef]
  44. Zhang, Y.; Zhou, B.; Chen, H.; Yuan, R. Heterogeneous photocatalytic oxidation for the removal of organophosphorus pollutants from aqueous solutions: A review. Sci. Total Environ. 2023, 856, 159048. [Google Scholar] [CrossRef] [PubMed]
  45. Cheikh, S.; Imessaoudene, A.; Bollinger, J.-C.; Hadadi, A.; Manseri, A.; Bouzaza, A.; Assadi, A.; Amrane, A.; Zamouche, M.; El Jery, A.; et al. Complete Elimination of the Ciprofloxacin Antibiotic from Water by the Combination of Adsorption–Photocatalysis Process Using Natural Hydroxyapatite and TiO2. Catalysts 2023, 13, 336. [Google Scholar] [CrossRef]
Figure 1. The schematic of the experimental setup.
Applsci 14 01507 g001
Figure 2. (a) The schematic of the reactor setup and (b) a cross section of the concentric cylindrical Pyrex glass tube reactor.
Applsci 14 01507 g002
Figure 3. The variation in the degradation rate of CB (a) and CN (b) with the inlet concentration at different flow rates (I = 20 W·m−2; RH = 30%; T = 20 °C).
Applsci 14 01507 g003
Figure 4. The influence of humidity on the degradation rates of CB (a) and CN (b) (I = 20 W·m−2, T = 20 °C, Q = 1 m3·h−1).
Applsci 14 01507 g004aApplsci 14 01507 g004b
Figure 5. The variation in the CO2 selectivity of CB and CN at different flow rates and inlet concentrations (I = 20 W·m−2; RH = 30%; T = 20 °C).
Applsci 14 01507 g005
Figure 6. The variation in the CO selectivity of CN at different flow rates and inlet concentrations (RH = 30%; T = 0 °C).
Applsci 14 01507 g006
Figure 7. The variation in the CO2 selectivity (%) of CB (A) and CN (B) at different humidity and inlet concentrations (I = 20 W·m−2; Q = 1 m3·h−1; T = 20 °C).
Applsci 14 01507 g007
Figure 8. The variation in the CO selectivity (%) of CN at different humidity and inlet concentrations (I = 20 W·m−2; Q = 1 m3·h−1; T = 20 °C).
Applsci 14 01507 g008
Table 1. The semi-empirical formulas for the estimation of kf.
ReactorsFormulasConditions
Tangential flow reactor S h = 1.029 · R e 0.55 × S c 0.33 · ( L d e q ) 0.472 Si R e   2500
S h = 0.095 · R e 0.85 · S c 0.33 · ( L d e q ) 0.472 Si R e   2500
L: length; deq: equivalent diameter of the reactor.
Table 2. Reynolds number, diffusivity, and mass transfer coefficients.
Q (m3·h−1) ReDmol (cm2·s−1)Kf (×103 m·s−1)
CBCNCBCN
12130.04940.04780.400.39
36391.021.00
612791.851.81
919192.602.55
Table 3. k and K values for CB and CN for model TM.
VOCsk (mM/m3·s)K (m3/mM)R2 (%)
CB0.928.499
CN0.109.199
Table 4. Values for model L–H.
VOCskA
(mM·m−3·s−1)
KA
(m3·mM−1)
KW
(m3·mmol−1)
K’A
(m3·mmol−1)
K’W
(m3·mmol−1)
CB0.9208.4000.0291.5000.456
CN0.1009.1000.021781.7560.200
Table 5. A comparison of k and K values obtained from the literature.
ReferencesReactorsPollutantsk
(mM·m−3·s−1)
K
(m3·mM−1)
[29]Front-flow continuous reactorCyclohexane0.0257.12
[28]Annular reactorIsovaleraldehyde0.491.62
Trimethylamine0.691.19
[27]Continuous reactorChloroform0.042.74
Glutaraldehyde0.091.16
This studyCylindric reactorChlorobenzene0.928.4
Chloronaphthalene0.109.1
Disclaimer/Publisher’s Note: The statements, opinions and data contained in all publications are solely those of the individual author(s) and contributor(s) and not of MDPI and/or the editor(s). MDPI and/or the editor(s) disclaim responsibility for any injury to people or property resulting from any ideas, methods, instructions or products referred to in the content.

