Article

Detecting Multiple Mixed Bacteria Using Dual-Mode Hyperspectral Imaging and Deep Neural Networks

1
Centre for Optical and Electromagnetic Research, College of Optical Science and Engineering, Zhejiang University, Hangzhou 310058, China
2
Taizhou Hospital, Zhejiang University, Taizhou 317000, China
3
Taizhou Research Institute, Zhejiang University, Taizhou 317700, China
*
Author to whom correspondence should be addressed.
Appl. Sci. 2024, 14(4), 1525; https://doi.org/10.3390/app14041525
Submission received: 11 November 2023 / Revised: 18 January 2024 / Accepted: 11 February 2024 / Published: 14 February 2024
(This article belongs to the Special Issue Fast and Accurate Sensing Technologies for Bacteria)

Abstract

:
Identifying and analyzing mixed pathogenic bacteria is important for clinical diagnosis and antibiotic therapy of multiple bacterial infection. In this paper, a dual-mode hyperspectral microscopic detection technology with hybrid deep neural networks (DNNs) was proposed for simultaneous quantitative analysis of four kinds of pathogenic bacteria in mixed samples. To acquire both transmission and fluorescence spectra regarding the mixed pathogens, we developed a dual-mode hyperspectral detection system with fine spectral resolution and wide wavelength range, which can also generate spatial images that can be used to calculate the total amount of mixed bacteria. The dual-mode spectra were regarded as mixed proportion characteristics and the input of the neural network for predicting the proportion of each bacterium present in the mixture. To better analyze the dual-mode spectral data, we customized a mixed bacteria measurement network (MB-Net) with hybrid DNNs architectures based on spectral feature fusion. Using the fusion strategy, two DNNs frameworks applied for transmission/fluorescence spectral feature processing were stacked to form the MB-Net that processes these features simultaneously, and the achieved average coefficient of determination (R2) and RMSE of validation set are 0.96 and 0.03, respectively. To the best of our knowledge, it is the first time of simultaneously detecting four types of mixed pathogenic bacteria using spectral detection technology, showing excellent potential in clinical practice.

1. Introduction

Foodborne or waterborne bacterial pathogens can be easily transmitted and spread through the fecal–oral route, which may cause diarrhea, vomiting, fever, and other symptoms, and can be life-threatening in some severe cases [1,2]. Bacterial infection has been a large and growing public health problem in recent decades [3]. To achieve efficient treatment of bacterial infections, bacterial species identification is one of the key processes, providing guidance for the correct use of antibiotics. Routine bacteria testing strategies such as culture-based methods using selective media [4], nucleic acid-based polymerase chain reaction (PCR) methods [5], and mass spectrometry [6], have been widely used in clinical target pathogen detection. However, these methods can be of high recurring cost or time-consuming, and limited to the identification of single bacterial species [7].
Actually, in many clinical or daily environments, multiple pathogenic bacteria often coexist together. Some pathogenic infections are caused by mixtures of multiple bacteria, resulting in similar symptoms as a single bacterial infection, such as vomiting, nausea, and warming, which can be hardly distinguished using traditional testing strategies [8]. Therefore, it is necessary to develop sensitive and effective methods for the identification and analysis of mixed bacteria.
Studies on simultaneous detection of multiple mixed bacteria have been carried out in laboratory settings [9,10]. Wang et al. presented a bi-channel surface-enhanced Raman scattering (SERS)-based lateral flow immunoassay (LFA) device for simultaneous detection of multiple pathogens in a single test [9]. Shen et al. reported a newly SERS-label using Au-shell-coated graphene oxide nanosheets (GO@Au) for multiple determination of three major foodborne pathogens [10]. However, these detection devices are difficult to be widely used in ordinary laboratories due to their complex fabrication procedures, time-consuming nature, high cost, and the professional operation that is required.
Hyperspectral detection, as a non-invasive, chemical-free technique (see e.g., [11]), can provide spectral information that serves as the bacteria’s fingerprint, and has been widely utilized in pathogenic bacteria identification and classification, with the advantages of rapid detection, low production cost, and convenient operation [12,13]. A few studies focused on combining hyperspectral detection with different machine learning (ML) frameworks, e.g., support vector machine (SVM) [14], fusion-net [15], and BI-Net [16], to increase the number of identified bacteria species and improve classification accuracy. These studies further confirmed the validity and capability of ML coupled with spectral analysis in rapid and high-accuracy discrimination of bacterial strains. Furthermore, such strategy has great potential of quantitative analysis of mixed bacterial samples, as ML algorithms provide opportunities for more effective spectral data analytics and processing [17,18,19,20]. Feng et al. developed a principal component analysis–Monte Carlo (PCA–MC) model and a neural network inversion model for spectral separation of two types of mixed bacteria and concentration estimation [18]. Zhang et al. established a multi-molecular infrared (MM-IR) spectroscopy system based on PCA and SIMCA for simultaneous detection of two mixed pathogenic bacteria in food [8]. Recently, our research group demonstrated a hyperspectral microscopic imaging system combined with PCA–SVM method for rapid identification of mixed bacteria to the single-cell level [19]. Achieving more comprehensive and sensitive detection of multiple bacteria in mixed samples with hyperspectral techniques combined with ML methods entails higher requirements for specific spectral data and appropriate ML frameworks.
In this paper, we proposed a dual-mode hyperspectral detection method coupled with deep learning algorithms for simultaneous quantitative analysis of pathogenic bacteria in the mixed samples. Four kinds of pathogenic bacteria, Staphylococcus aureus (S. aureus), Escherichia coliform (E. coli), Pseudomonas aeruginosa (P. aeruginosa), and Serratia marcescens (S. marcescens), were selected and studied in the experiments. They are widespread in natural environment, such as soil, sewage, and excrement, and serve as the main culprits for many infectious diseases, inflammation, and various other abnormal symptoms. Our self-developed hyperspectral detection system collected both transmission and fluorescence spectral data of the mixed bacterial samples, which can be used as the characteristics of concentration estimation. The system can also generate transmission hyperspectral images of mixed samples for sample observation and calculation of the total concentration mixed bacteria using cell counting methods. In terms of algorithms, we developed a multiple mixed bacteria measurement network (MB-Net) with hybrid deep learning (DL) architectures based on spectral feature fusion. The DL architectures depending on different spectral types are jointly optimized, which are then stacked together using a fusion strategy, forming a MB-Net for processing and optimizing dual-mode hyperspectral data. The experimental results show that the predicted proportion of the four types of pathogenic bacteria indeed corresponds well to the actual proportion both in training sets and validation sets. Combining the predicted proportion with total concentration results measured through the transmission hyperspectral images, the detailed concentration of each bacterium in mixed samples can be calculated. Compared with commercial microscope and spectrometer, our self-developed system has the advantages of low-cost, favorable scalability, and convenient operation. Our study presents a highly effective quantitative analysis method for multiple bacteria found in clinical samples.

2. Materials and Methods

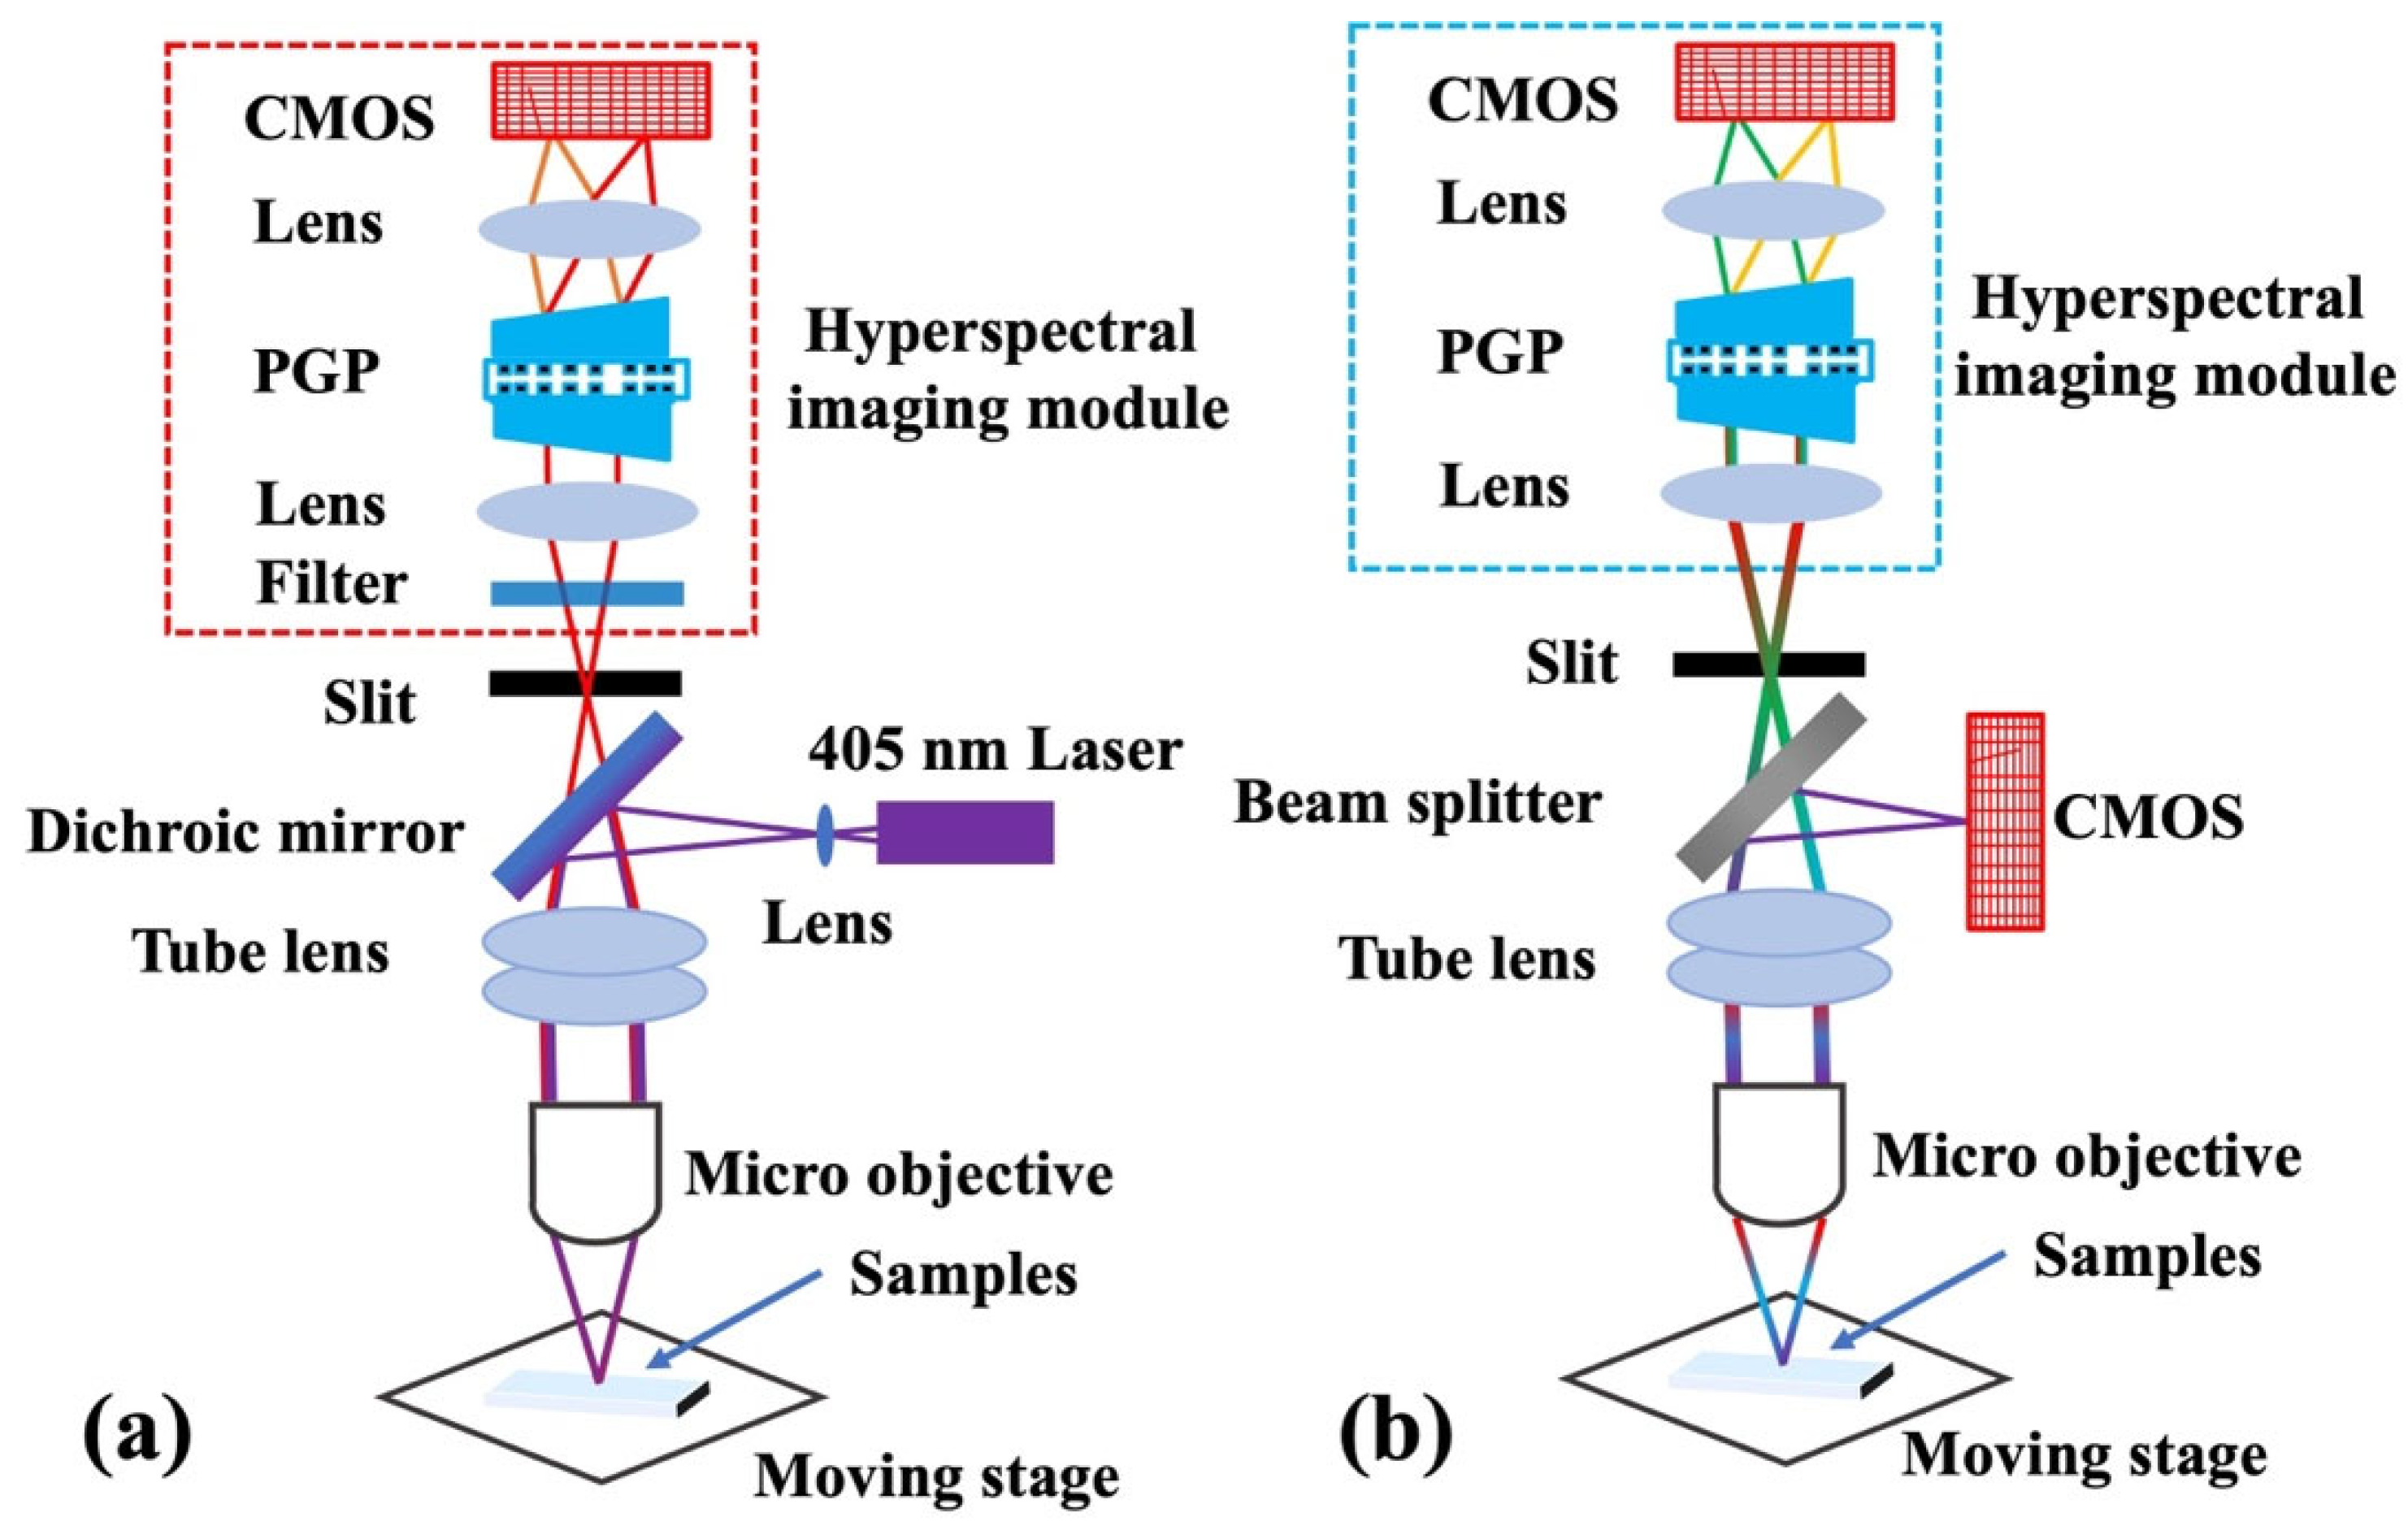
2.1. System Setup and Calibration

Multi-wavelength fluorescence/transmission spectra of bacterial suspensions were measured by our self-developed dual-mode hyperspectral microscopic detection system, whose detailed light path diagrams in two different modes are displayed in Figure 1. In fluorescence hyperspectral mode, a 405 nm laser is utilized as the excitation light source. After being reflected by a dichroic mirror, the 405 nm laser passes through a tube lens (Thorlabs, Newton, NJ, USA), a 10× micro-objective (Olympus, Tokyo, Japan; Lumplflw), and illuminates at the measurement sample. The sample is placed on a moving stage, which can be adjusted along x, y, and z direction to ensure the proper focus depth and illumination position. The sample that is irradiated by the laser generates fluorescent light, which returns along the original light path sequentially travelling through the micro-objective, tube lens, dichroic mirror, and is converged and imaged at the place where a 10 μm width slit is placed. A 450 nm long-pass filter (HENG YANG GUANG XUE, Guangzhou, China) in front of the slit is used to filter out the reflected excitation light and glass fluorescence. After passing through the slit, the fluorescent light of the bacterial sample is collimated by a collimator lens, and then dispersed at the spectral dimension in the range of 450–800 nm by the prism-grating-prism, and finally focused on a CMOS-1 by an imaging lens to form a spectral image of the line region. The spectral images the line regions after image preprocessing were used as the raw input of the deep neural networks at the next step.
In the transmission hyperspectral mode, a white light-emitting diode (LED) with spectral range covering visible bands is used as lighting source, which directly irradiates the bacterial sample in a trans-illumination way. The transmission signal from the bacterial sample is then collected by the micro-objective, passing through the tube lens, and is divided into two paths by a beam splitter with splitting ratio of 50:50. One path of the incident light directly travels through the beam splitter and the slit. One line region of the transmission light enters the hyperspectral detection module, forming a corresponding spectral image. Transmission hyperspectral imaging can also be performed using the system. Using the moving stage to manipulate the movement of the specimen holder along the x or y direction, different line regions of the measurement sample can undergo continuous passage through the slit, allowing for the collection of corresponding spectral images from different line regions. In this way, complete transmission hyperspectral images containing bacterial characteristic spectra and shape profile can be collected, which can be used for cell counting. As for the other path of the transmission light, it is reflected by the beam splitter and imaged at the CMOS-2 plane to form a grayscale microscopic image. The two imaging planes of CMOS-1 (in the hyperspectral detection module) and CMOS-2 are conjugate, enabling sample observation to determine whether it is in focus or not, and to adjust the setting position.
Prior to hyperspectral measurement, a wavelength calibration was carried out to establish a corresponding relationship between pixel index x and wavelength value λ at the spectral axis (along the direction of spectral expansion) of the hyperspectral image [21]. The calibration method is as follows. A mercury argon source with known spectral features was utilized as the standard calibration light source, and corresponding hyperspectral image was collected by the spectral detection module, as shown in Figure 2a. The calibration source has several spectral characteristic peaks at the wavelength λ, corresponding to the distinct lines (with pixel index x), as seen in Figure 2a. The relationship between the pixel index x and wavelength value λ can be described by a second-order polynomial function:
λ = a 0 + a 1 x + a 2 x 2
where a0, a1, and a2 are the calibration coefficients. Using the polynomial least square method, the polynomial fitting curve can be calculated; Figure 2b,c show the spectral curve of the calibration source measured by the spectral detection module after wavelength calibration. The full-width at half of the maximum (FWHM) of the spectral peak is around 1 nm, indicating the spectral resolution of the system is 1 nm.
Spatial resolution of the system was characterized using a standard resolution test plane (LBTEK, Shenzhen, China; USAF1951 RB-J). The standard resolution test plane was placed at the focal plane of the system, and corresponding hyperspectral images were collected, as seen in Figure 2d. The minimum line pair interval of the resolution plane is 2.19 µm, which can be clearly distinguished in the hyperspectral microscopic image. Thus, the spatial resolution of the system is less than 2.19 µm.

2.2. Sample Preparation

Four types of bacterial pathogen, including Staphylococcus aureus (S. aureus), Escherichia coliform (E. coli), Pseudomonas aeruginosa (P. aeruginosa), and Serratia marcescens (S. marcescens), were studied in this paper. These bacterial samples were provided by Taizhou Enze Medical Center, came from various clinical diagnosis samples including blood, sputum, urine, tissue fluid, and so on.
The bacterial separation and cultivation processes are illustrated as follows. First, using the streak plate method, the originally mixed bacteria in the clinical samples grew and multiplied along the lines on the plate surface and formed dispersive individual colonies. A single colony should represent a bacterium in the original sample. These separated bacterial strains were then transplanted to a new culture dish (blood plates), and cultivated in incubators at 37 °C for about 48 h to produce purified colonies. During experiments, a portion of the purified bacteria was taken from the cultured dish and the bacterial samples were dissolved into sterile deionized (DI) water to prepare bacterial solutions for experimental measurement. The concentrations of the four pathogenic bacteria were about 109/mL, measured by conventional cell counting method.
After preparing the above single bacteria samples, 84 groups of mixed bacterial samples composed of different proportions of S. aureus, E. coli, P. aeruginosa, and S. marcescens were also prepared. The total volume of the mixed bacteria samples in each group was maintained at 28 µL. Table 1 shows the exact volume ratio of the four types of bacteria.

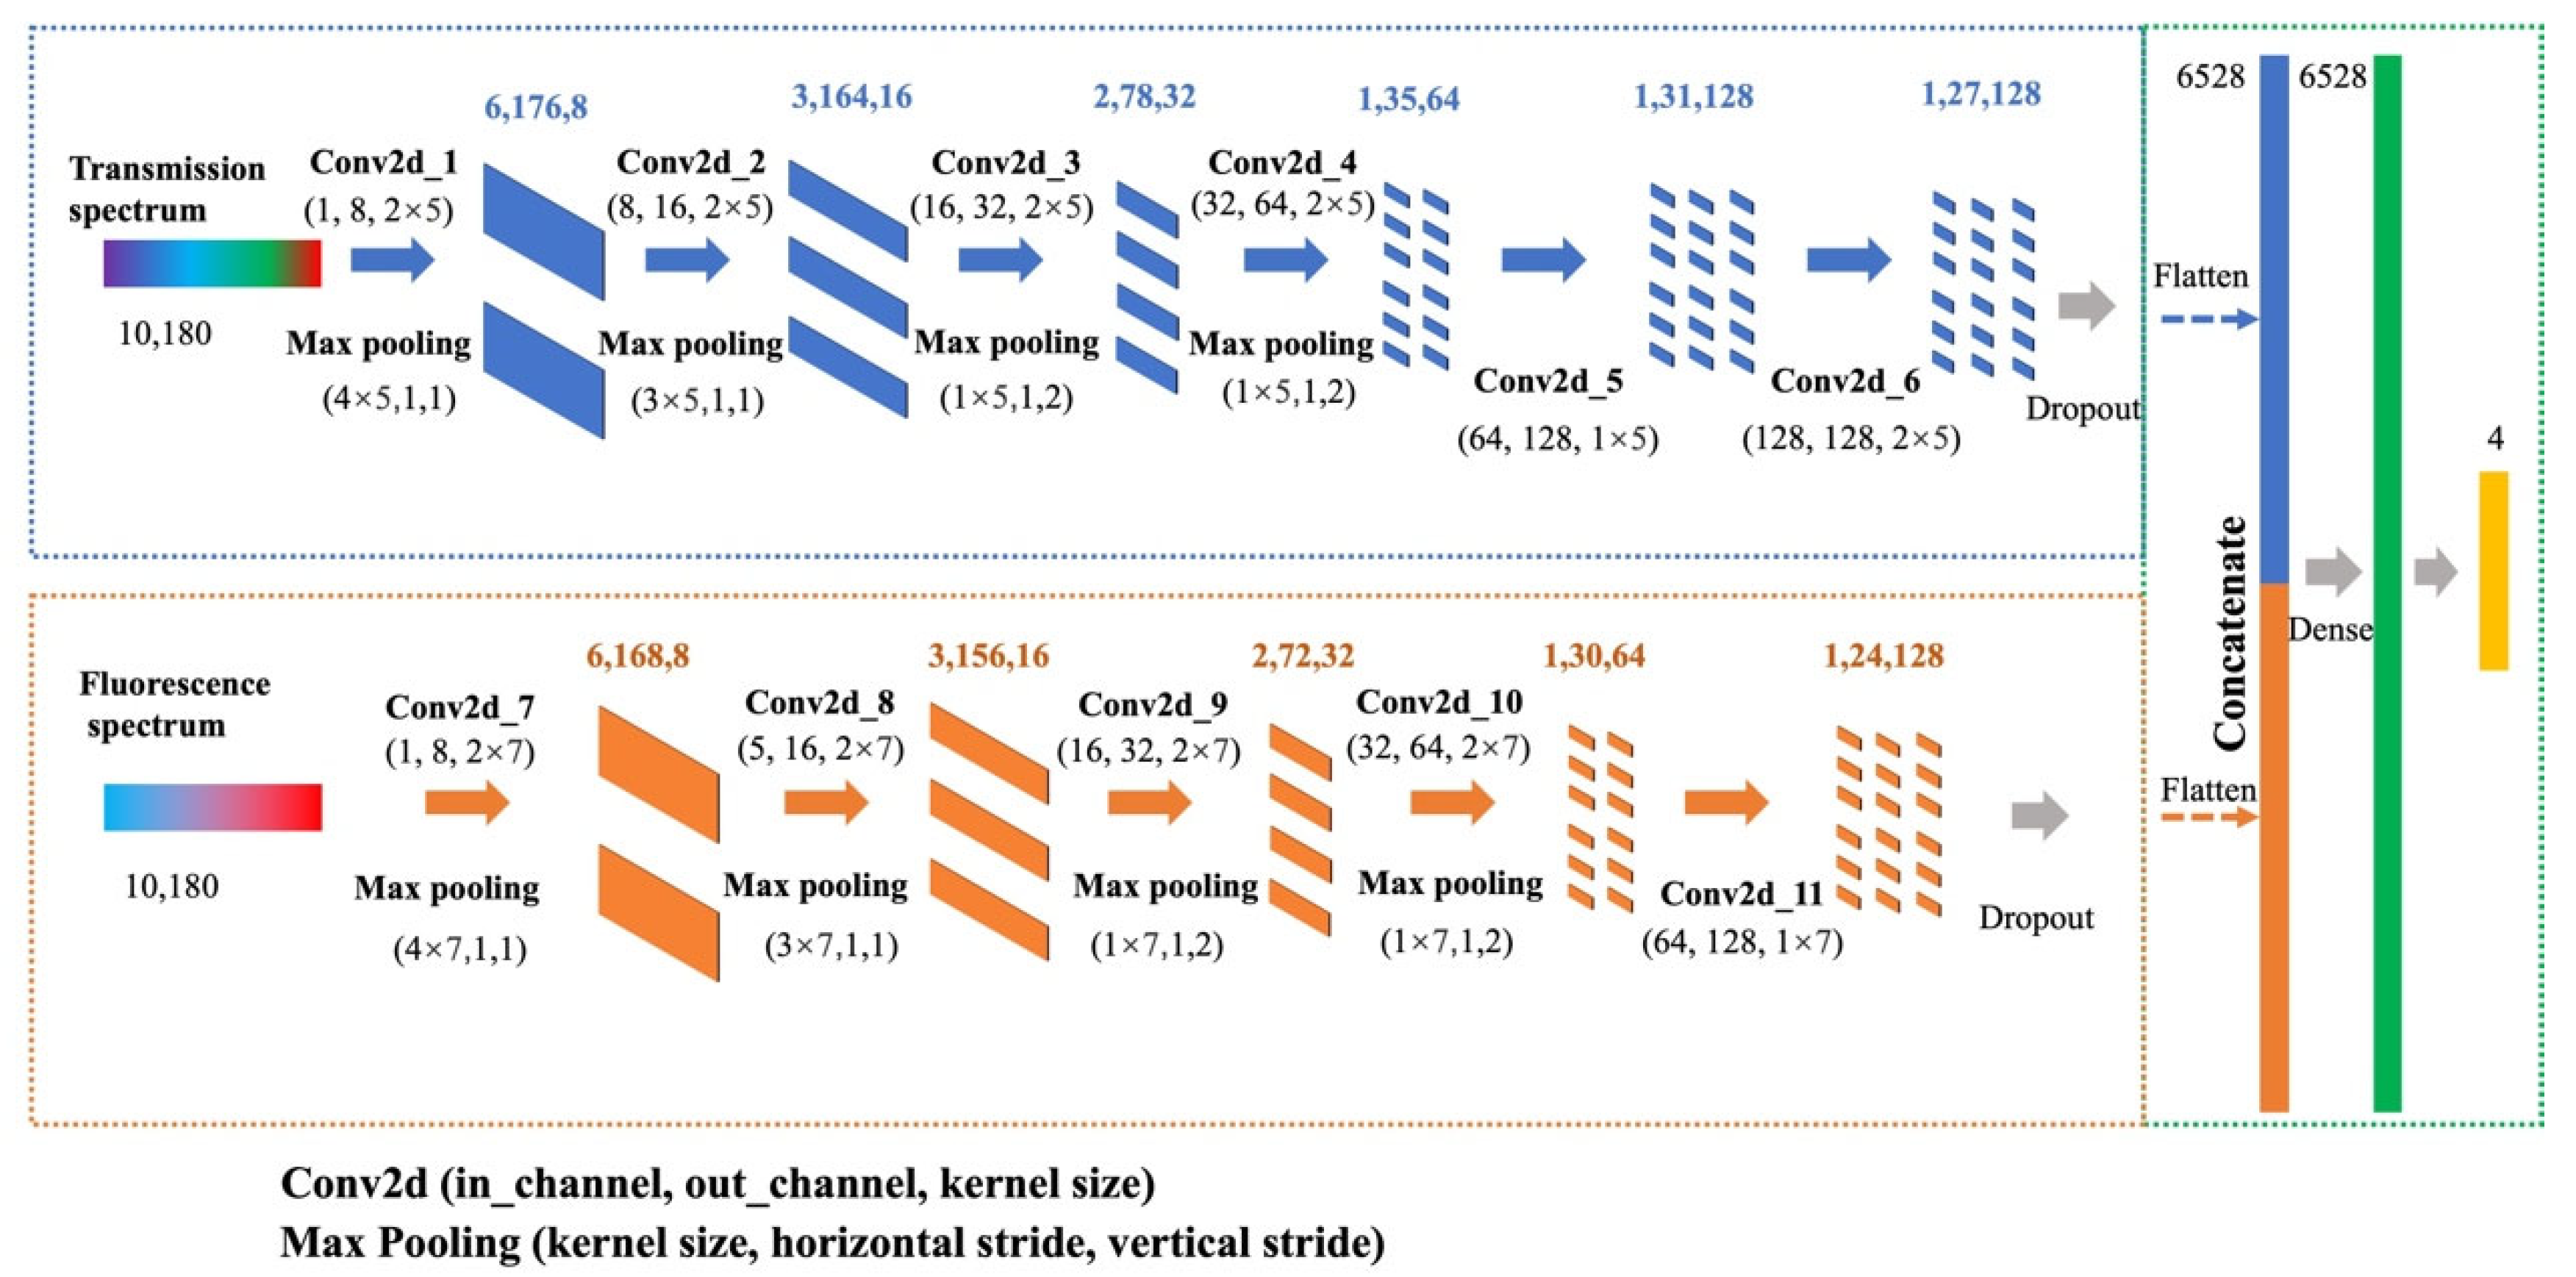
2.3. Deep Learning Architecture

Aiming at dual-mode spectral features (transmission spectra and fluorescence spectra), we customized a mixed bacteria measurement network (MB-Net) with multiple DL architecture based on spectral feature fusion. The detailed framework of MB-Net is shown in Figure 3. Two convolutional neural network (CNN) architectures with different optimized structure parameters were selected to process the transmission/fluorescence spectral images, respectively. Before model training, image cropping and down sampling were performed to reduce data redundancy and prevent overfitting. The input images were transformed into a form with a spatial dimension of 10 and a spectral dimension of 180. The spectra data were input into a convolution layer with parameters of (1, 8, 2 × 5), where 1 is the number of input channel, 8 is the number of output channel, and 2 × 5 is the size of the convolution kernel. The strides of the all convolution layers were set to 1. Different from conventional CNNs, here, we utilized the rectangular convolution kernel for feature extraction. In the hyperspectral dimension, the size of the convolution kernel is larger, which can help extract more comprehensive spectral features. Regarding spatial dimension, spatial information is not the primary focus of the network. Therefore, only small-scale convolution kernels are used here to perform basic filtering operations on spatial data. The utilization of rectangular convolution kernels enables targeted processing of information across different dimensions, extracting pertinent features and reducing inference from redundant information. This leads to improved operational efficiency. After convolutional operation, max pooling operation was employed to reduce the spatial dimensionality of an input volume by selecting the maximum value within each region, helping to extract the most dominant features. The parameters of the max pooling layer are (4 × 5, 1, 1), where 4 × 5 is the kernel size, the middle 1 is the horizontal stride, and the last 1 is the vertical stride. The input data were transformed into a new data after processing by the two layers, with dimension of 6×176 and channel numbers of 8, marked as (6, 176, 8) in Figure 3.
After a series of convolutional and max pooling operations, the dimensions of feature maps output by the final module were 1 × 27, with 128 output channels. The feature maps were processed by a dropout layer in order to alleviate overfitting, and were flattened into a vector. To analyze transmission and fluorescence simultaneously, we employed a feature fusion strategy. The outputs of the two CNN models (one is for the process of transmission hyperspectral images, and the other is for the process of fluorescence hyperspectral images) were directly concatenated together, forming a dense layer with a total of 6528 nodes, where the latent transmission spectral features and fluorescence spectral features each contribute equally. In addition, another fully connected dense layer consisting of 6528 nodes was employed for the purpose of feature sorting. This was then followed by a fully connected layer comprising four nodes, outputting the regression results corresponding to concentration ratio of four types of bacteria.
The MB-Net model was trained in the computer equipped with GTX4090 GPU (NVIDIA, Santa Clara, CA, USA), I9-13,900K CPU (Intel, Santa Clara, CA, USA), and 32 GB of memory. To prevent the MB-Net from overfitting, so as to validate its performance, we randomly divided the datasets into training set and validation set with ratios 0.80/0.20. The activation function is ReLu function, training with Adam optimizer. The loss function is defined as the mean square error (MSE) between the network output and the sample label. The training goal of the MB-Net is to minimize the MSE.

3. Results and Discussion

In this section, we detailed the transmission/fluorescence hyperspectral measurement results of mixed bacteria samples with various ratios, and analyzed the corresponding spectral difference. The performance of the MB-Net to predict the mixed ratio of four types of bacteria is also displayed, which demonstrates the capability and validity of our new methods in measuring concentration/ratio of mixed bacteria samples. Bacterial experiments were conducted exclusively in the microbiology laboratory at Taizhou Hospital to prepare and manage pathogenic bacteria.

3.1. Spectral Analysis of Multiple Mixed Bacteria

Figure 4a displays the transmission hyperspectral image of the mixed sample (imaged at 40× micro-objective) containing four types of bacteria: S. aureus, E. coli, P. aeruginosa, and S. marcescens. They can hardly be distinguished based solely on their morphological characteristics. The transmission hyperspectral images are used for sample observation and the calculation of the total concentration mixed bacteria using cell counting methods. Combined with the predicted proportion of the mixed bacteria from the MB-Net, the detailed concentration of each bacterium in the mixed sample can be calculated. Figure 4b shows the transmission spectra of several groups of mixed bacteria with varying proportions. The spectral characteristics varies with different mixed ratio. As for the fluorescence spectra, bacteria display similar fluorescent chromophores, but variations in the fluorescent chromophore content, bacterial cellular structure, and the extent of laser energy absorption by different bacteria give rise to distinct bacterial fluorescence spectra. Compared with other bacteria, P. aeruginosa has a unique fluorescent peak located at 635 nm, which can be used as specific characteristic in the detection of mixed samples. Figure 4c shows the fluorescence spectra of several groups of mixed bacteria with varying P. aeruginosa proportions. The P. aeruginosa proportion of sample 01, sample 07, sample 28, and sample 77 are 0.1, 0.7, 0.1, and 0.3, respectively. The fluorescent intensity at 635 nm varies with different P. aeruginosa concentration, which can be used to quantitatively measure the P. aeruginosa concentration among pure or mixed bacterial samples. Sample 01 and sample 28 have the same P. aeruginosa proportions, resulting in the similar fluorescent intensity at 635 nm. In our studies, the fluorescence spectra provided in the additional optical Information relate to bacteria composition and mixed ratio, improving the precision of the MB-Net in predicting mixed bacterial concentration.

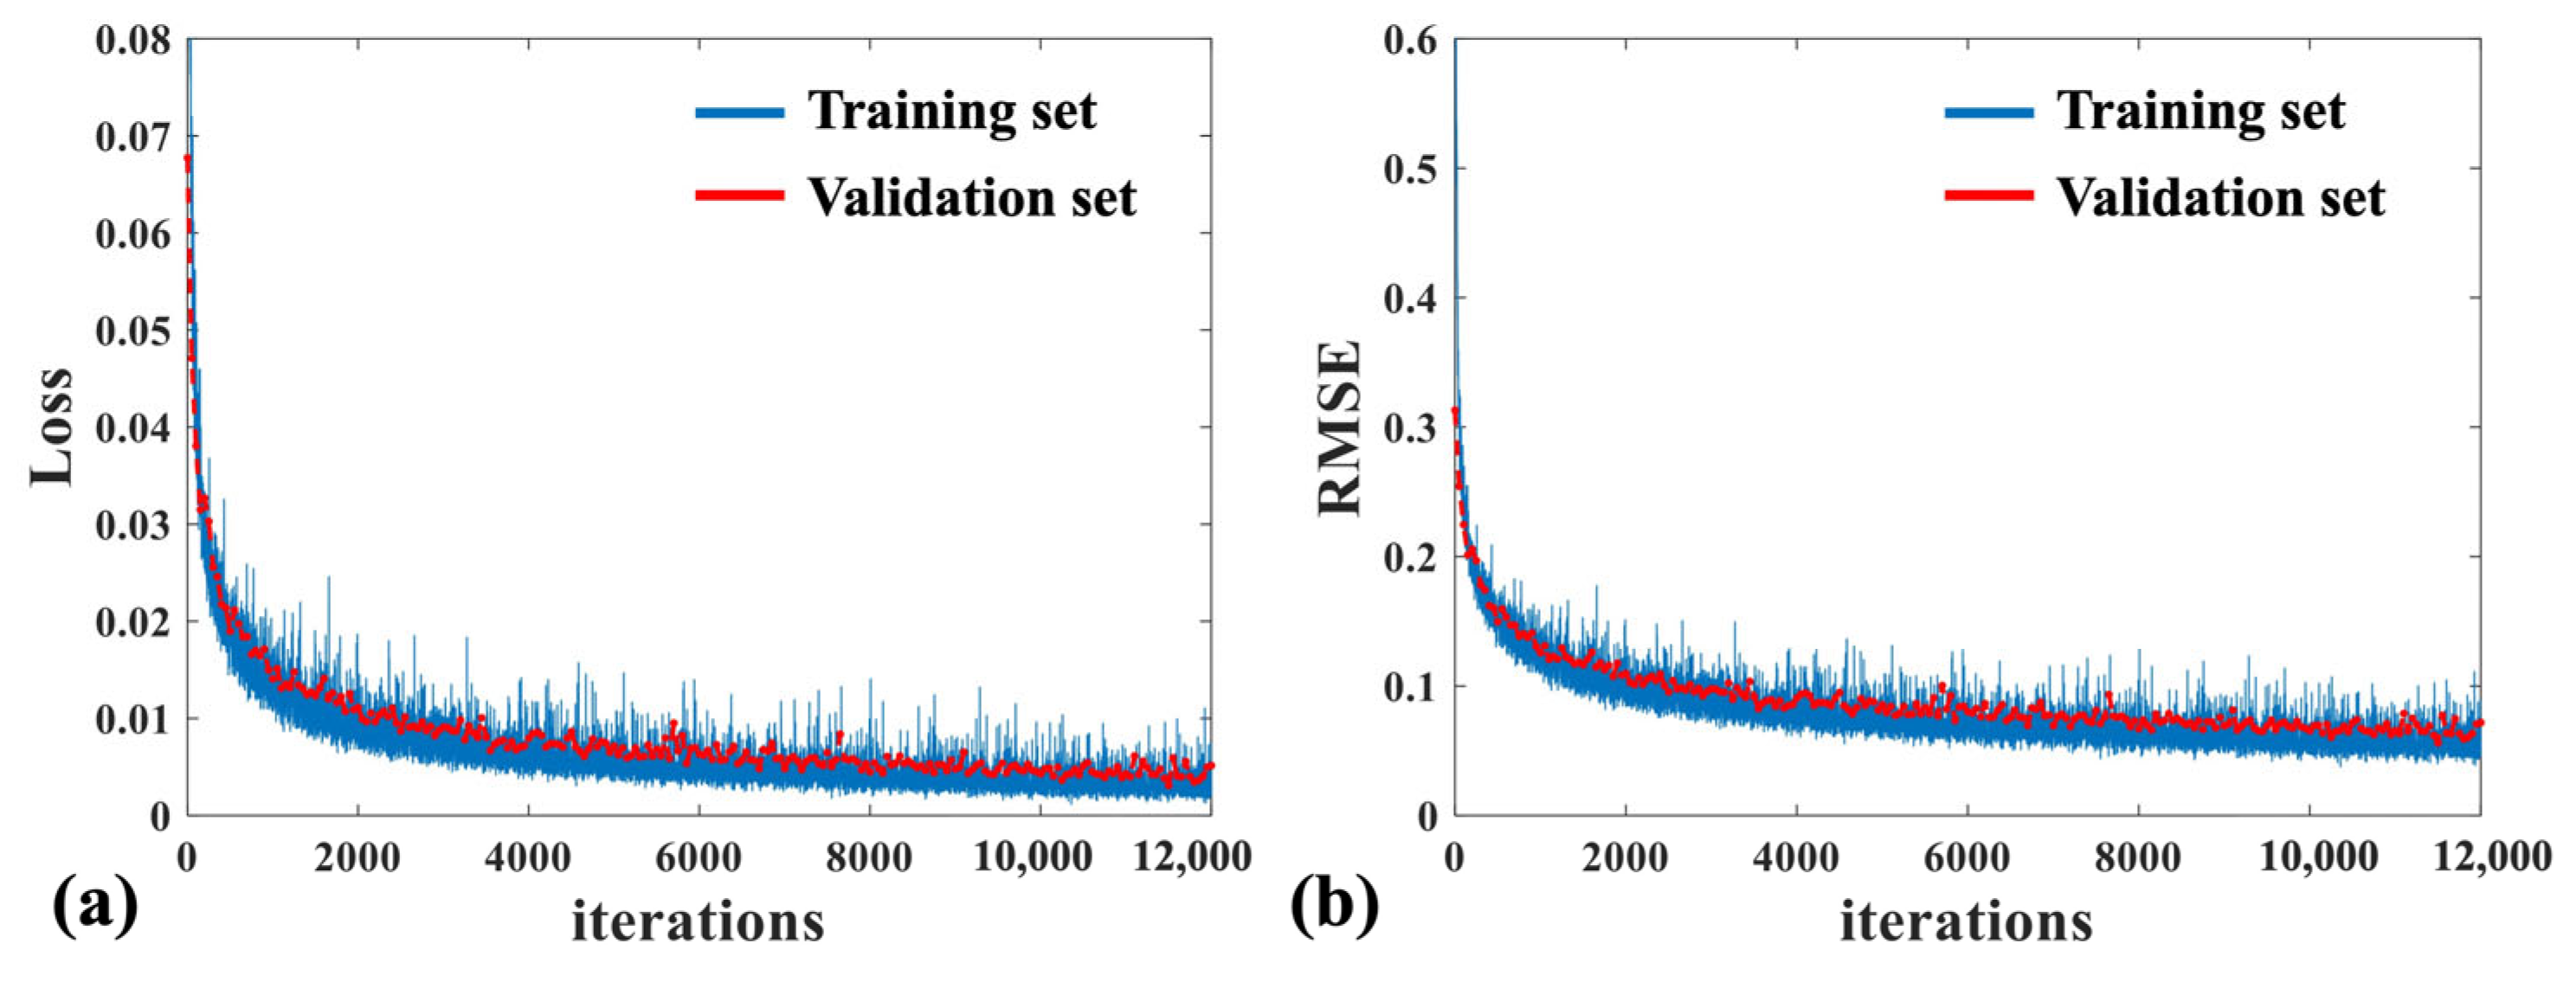
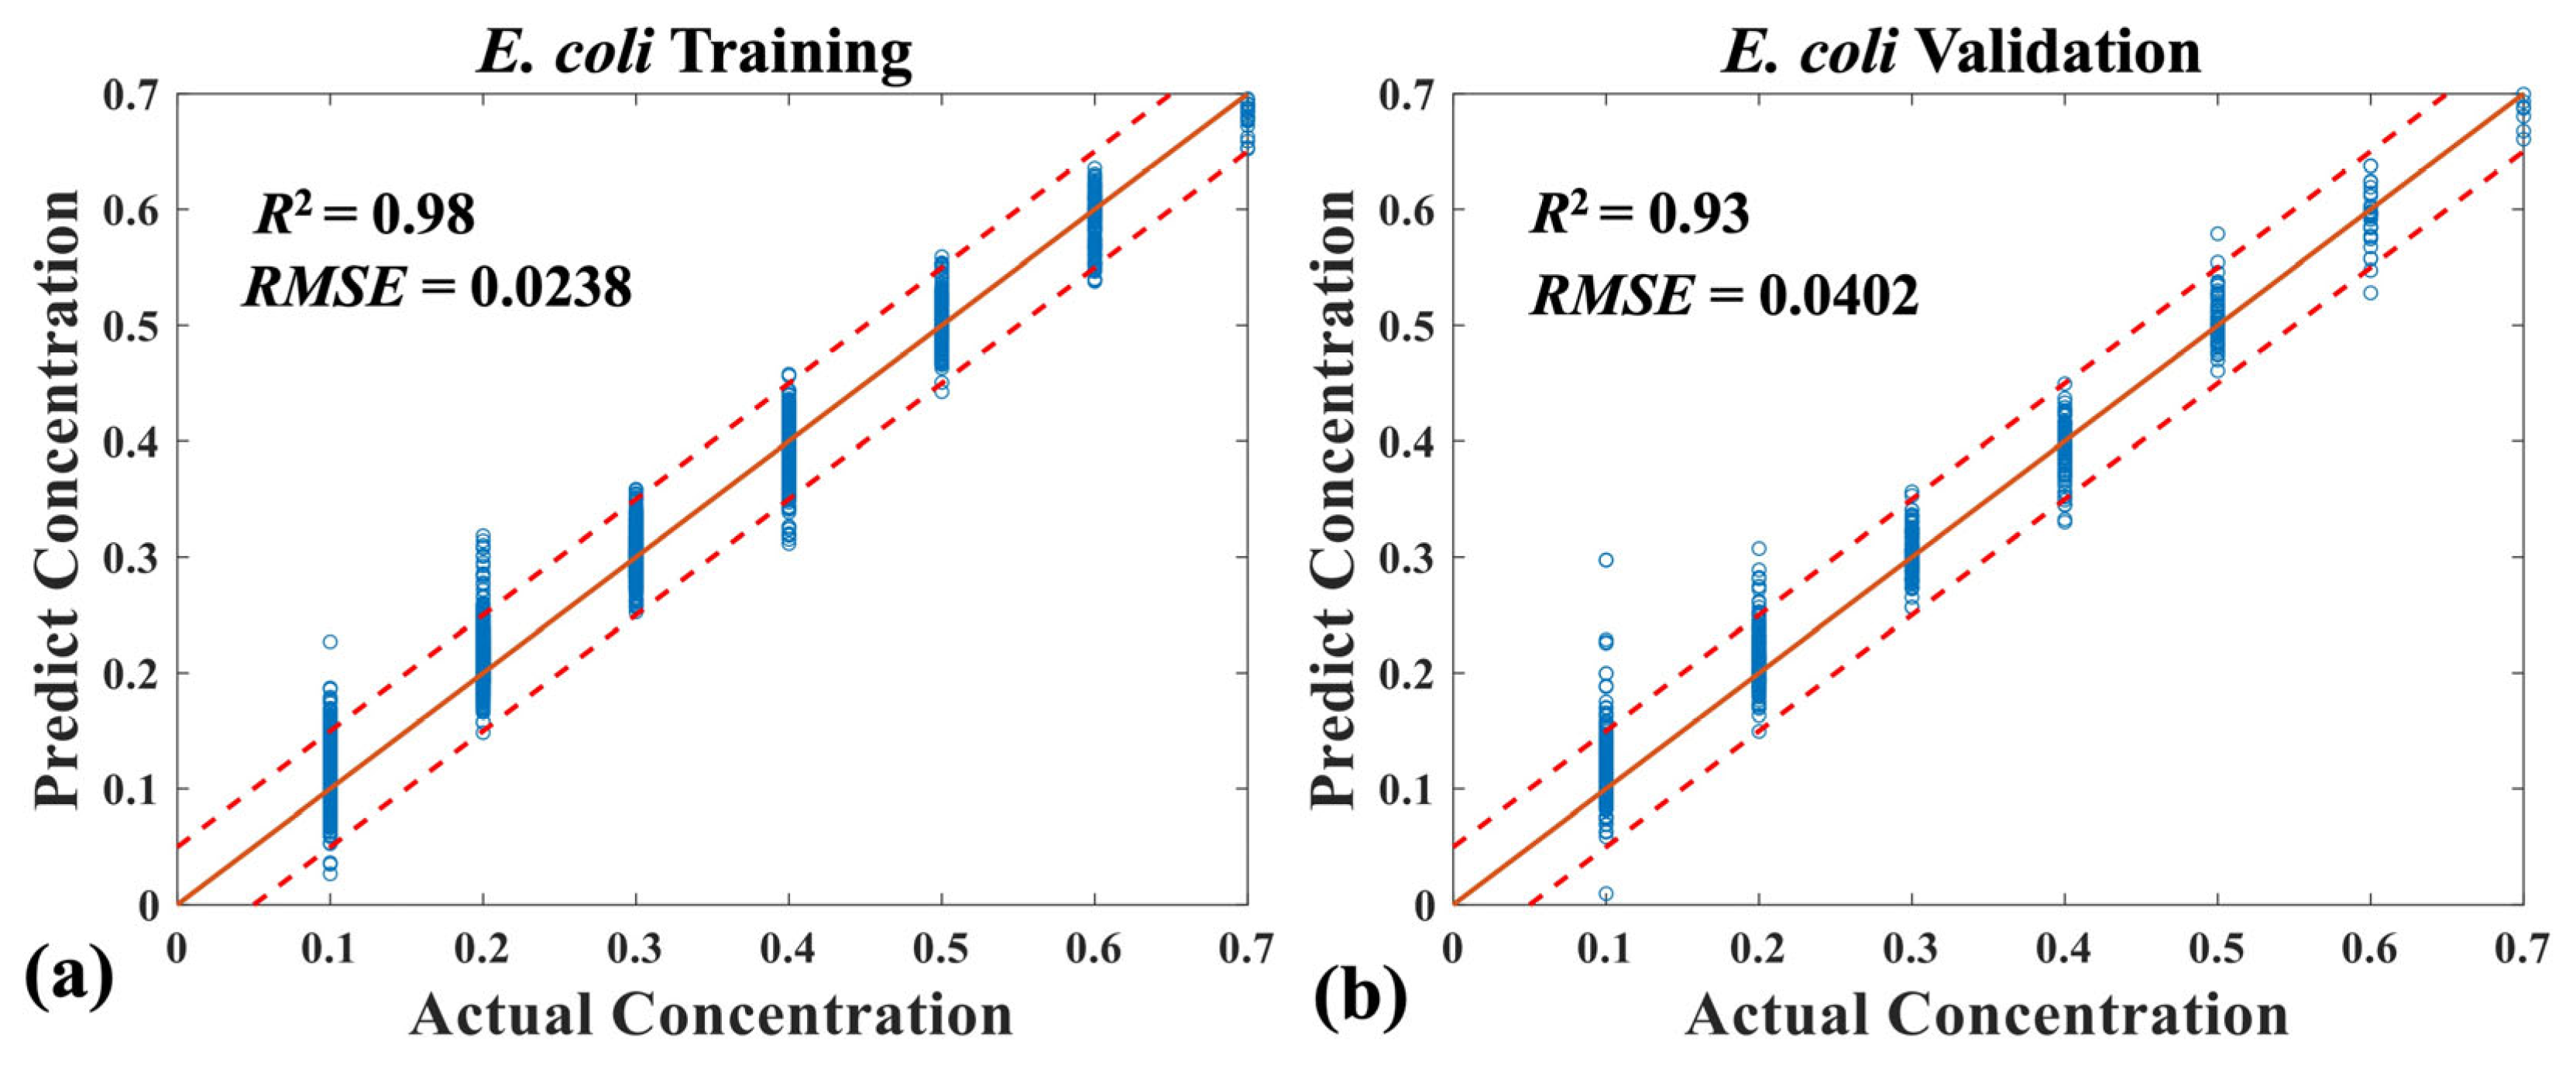
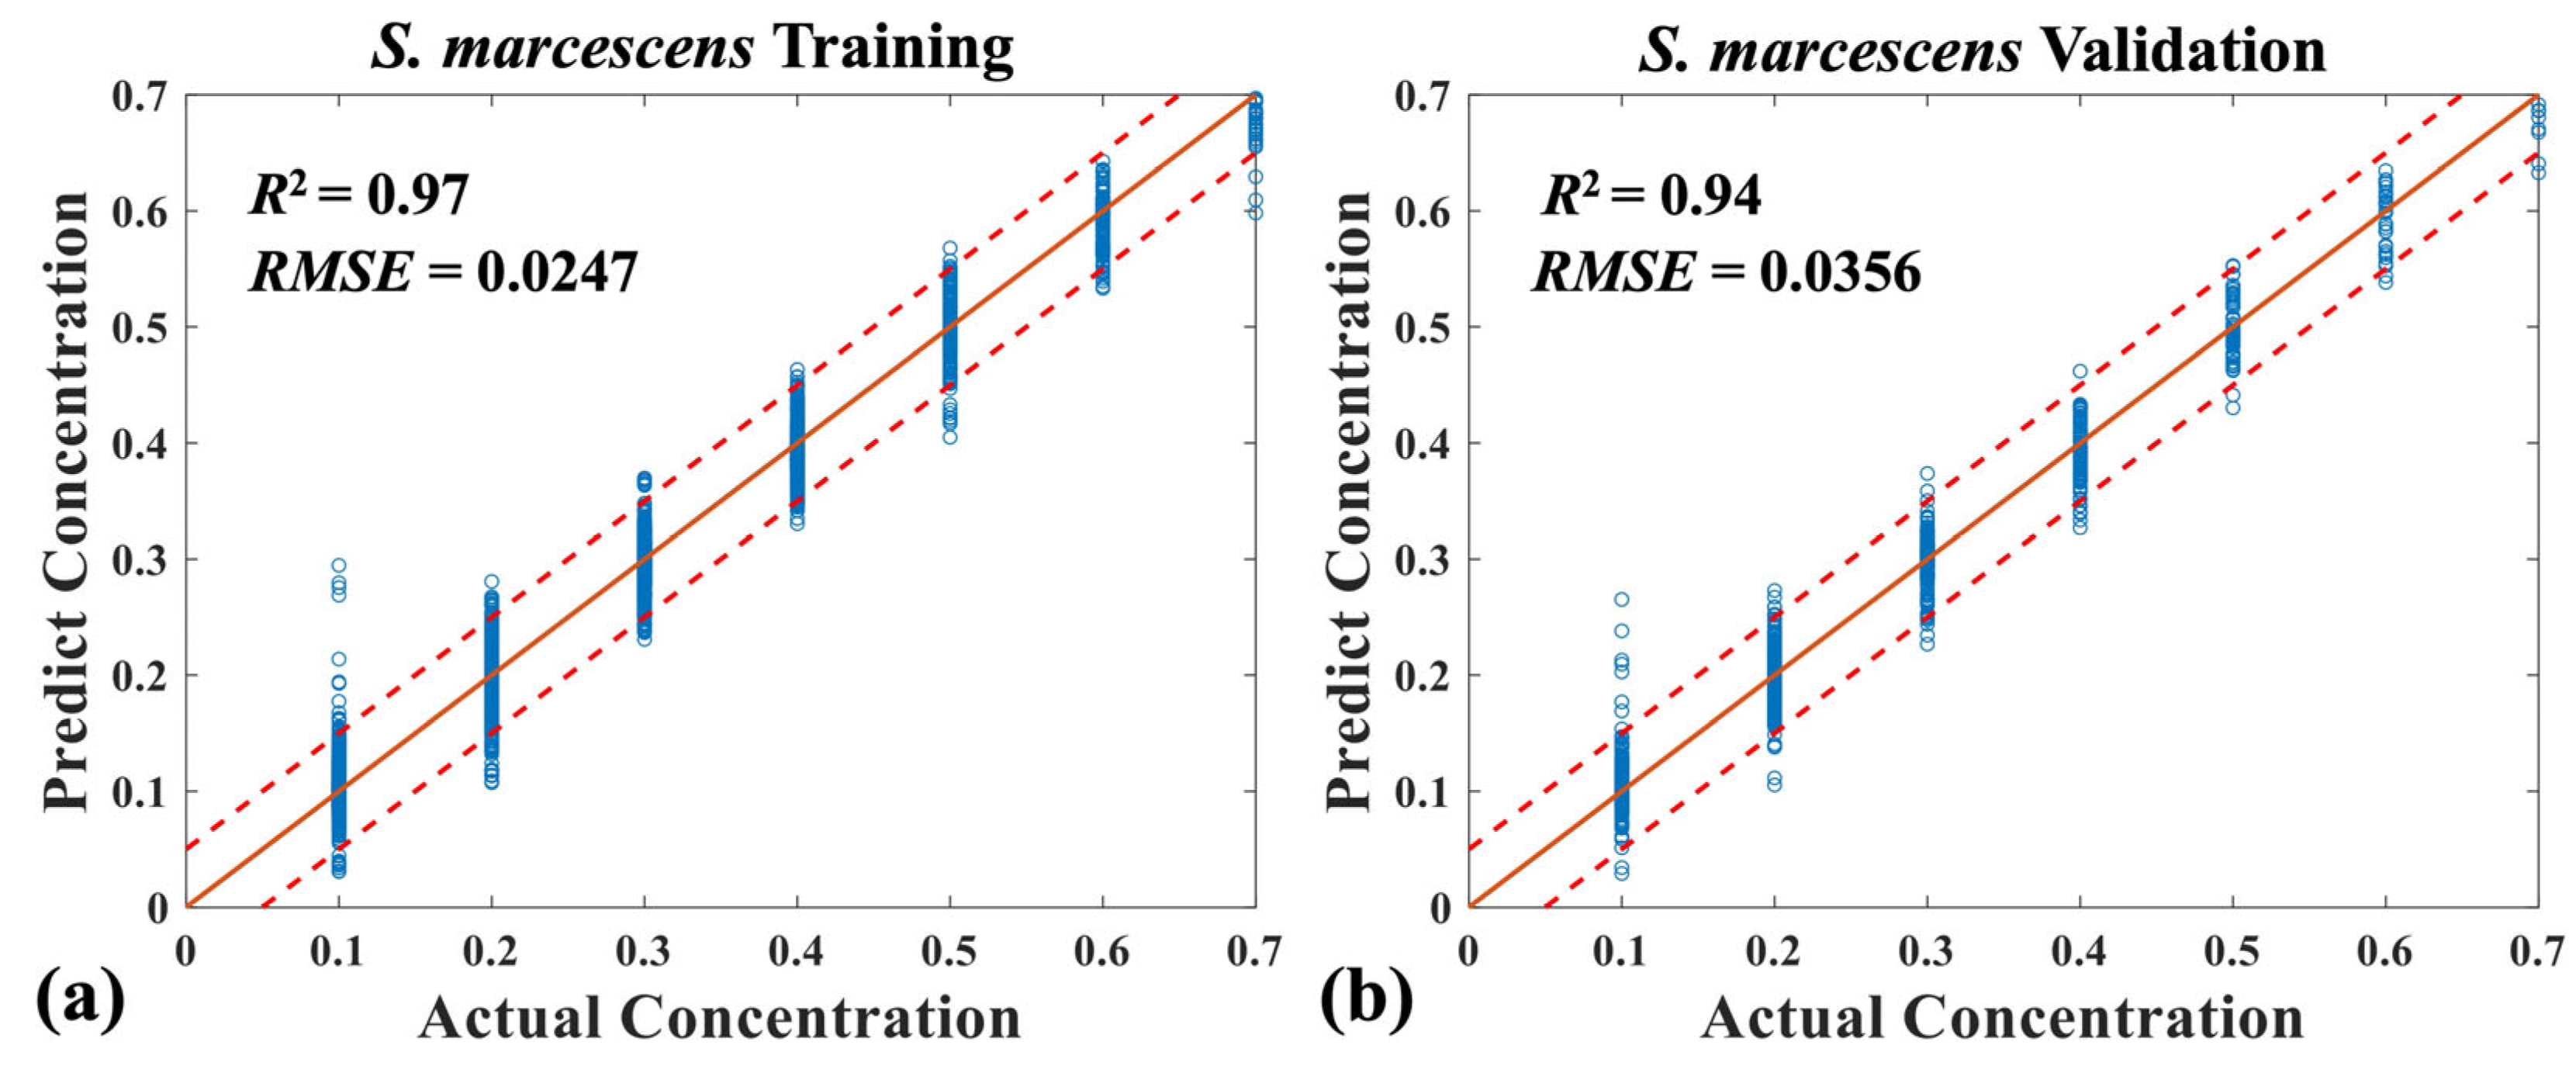
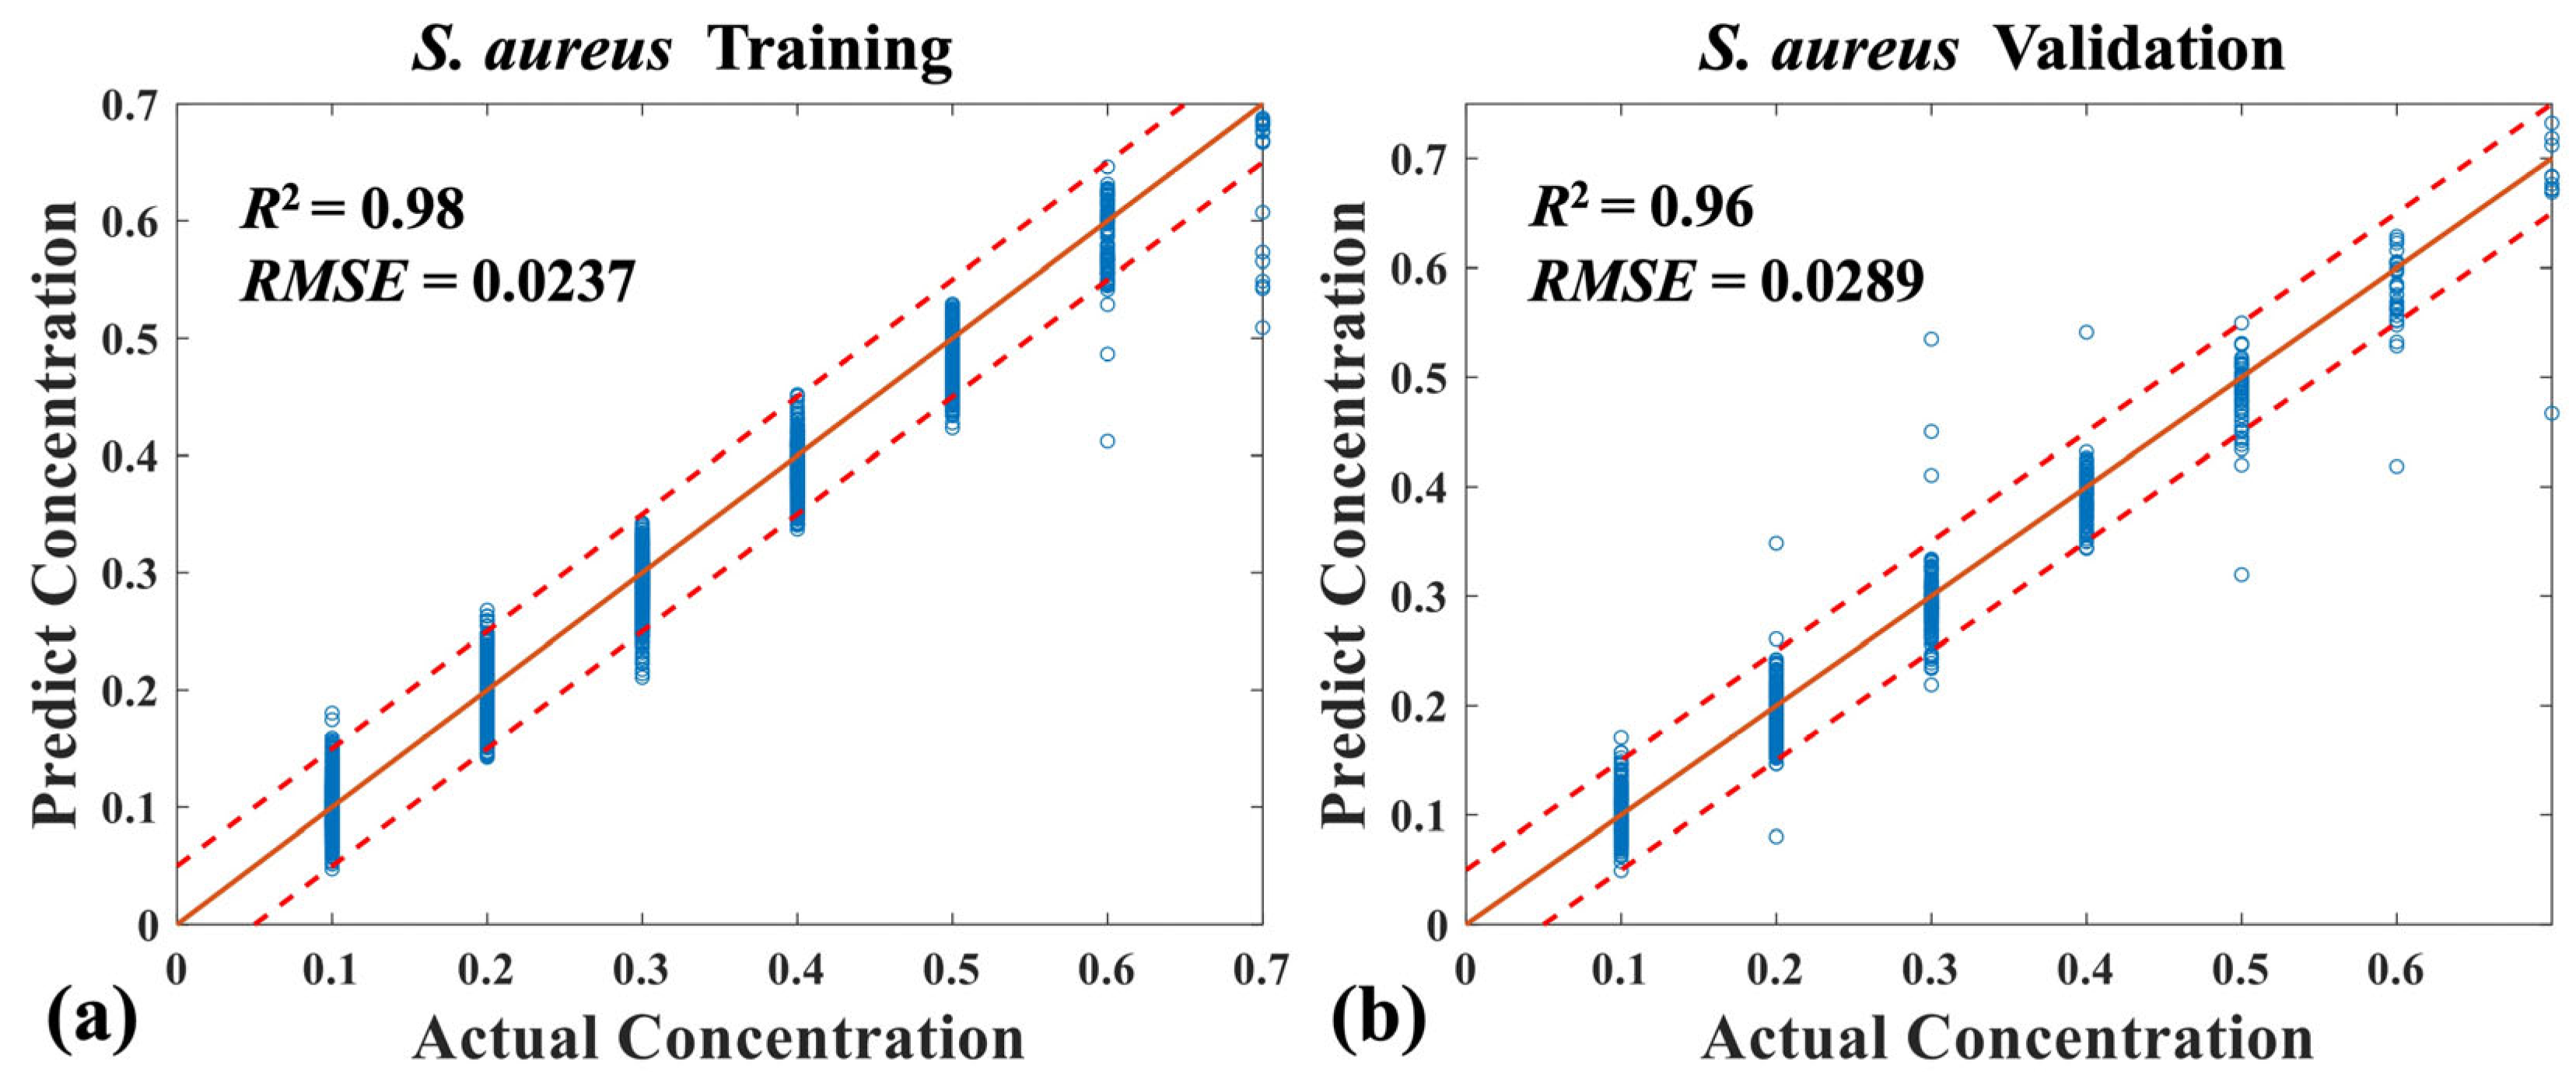
3.2. Quantitative Analysis of Four Mixed Bacteria Using MB-Net

As shown in Table 1, 84 groups of mixed bacterial samples with various mixing proportions were prepared for transmission and fluorescence spectra collection and analysis. Using the dual-mode hyperspectral detection system, we collected 50 sets of transmission spectra data and 50 sets of fluorescence spectra data for each measurement sample group with specific mixed ratio. In total, for 84 groups of mixed samples, 8400 sets of dual-mode transmission/fluorescence spectra data were obtained, forming the datasets in the experiments.
After data preprocessing, the dual-mode spectral data were input into the MB-Net, generating the regression results of mixing proportions or the composition of each bacterium. Figure 5 shows the training process of the MB-Net. With the increase in iterations, the network parameters are gradually optimized and the loss gradually decreases. Here, the root mean square error (named RMSE) is also used as the key index for performance evaluation of the MB-Net both in the training set and validation set, indicating the magnitude of the error in model predictions. The losses of the MB-Net in both training set and validation set are less than 0.01, which demonstrates the capability of the network model in nonlinear conversation, which can cope well with the dual-mode hyperspectral information to build a sensitive and robust prediction model.
In Figure 6, Figure 7, Figure 8 and Figure 9, we compare the actual concentration and predicted concentration of E. coli, S. marcescens, P. aeruginosa, and S. aureus, respectively. The red line region indicates the accuracy interval with precision of 0.1. Five-fold cross-validation was applied for performance evaluation of the model, calculating the average RMSE and correlation coefficient R2. Corresponding values are indicated at Figure 6, Figure 7, Figure 8 and Figure 9. R2 is utilized to evaluate the adequacy of the model in estimating the concentration of each bacterial class, thus, indicating the goodness of fit. R2 is defined as the following expression
R 2 = 1 i y ^ i y i 2 i y ¯ i y i 2
where yi and y ^ i are the actual value and predicted value of the i-th sample, respectively, and y ¯ i is the mean of y-values.
Table 2 summarizes and compares the prediction performance (RMSE and R2 of validation set) using transmission spectra only and dual-mode spectra. It can be seen that the prediction performance is greatly improved by combining transmission and fluorescence spectra in deep learning method. It is worth noting that the R2 of P. aeruginosa is significantly improved from 0.90 to 0.99. This is because the fluorescence spectra of P. aeruginosa provide additional fluorescent information related to the bacterial concentration, effectively increasing the accuracy of concentration prediction. The average RMSE of validation set of E. coli, S. marcescens, P. aeruginosa, and S. aureus are calculated to be 0.0402, 0.0356, 0.0181, and 0.0289, respectively. The total bacterial content can be counted using the transmission hyperspectral images, while the MB-Net provides the predicted proportion of each bacterium in the mixed samples. Therefore, the combination of hyperspectral detection and DL provides an effective strategy in simultaneous quantitative analysis of multiple mixed bacterial samples.

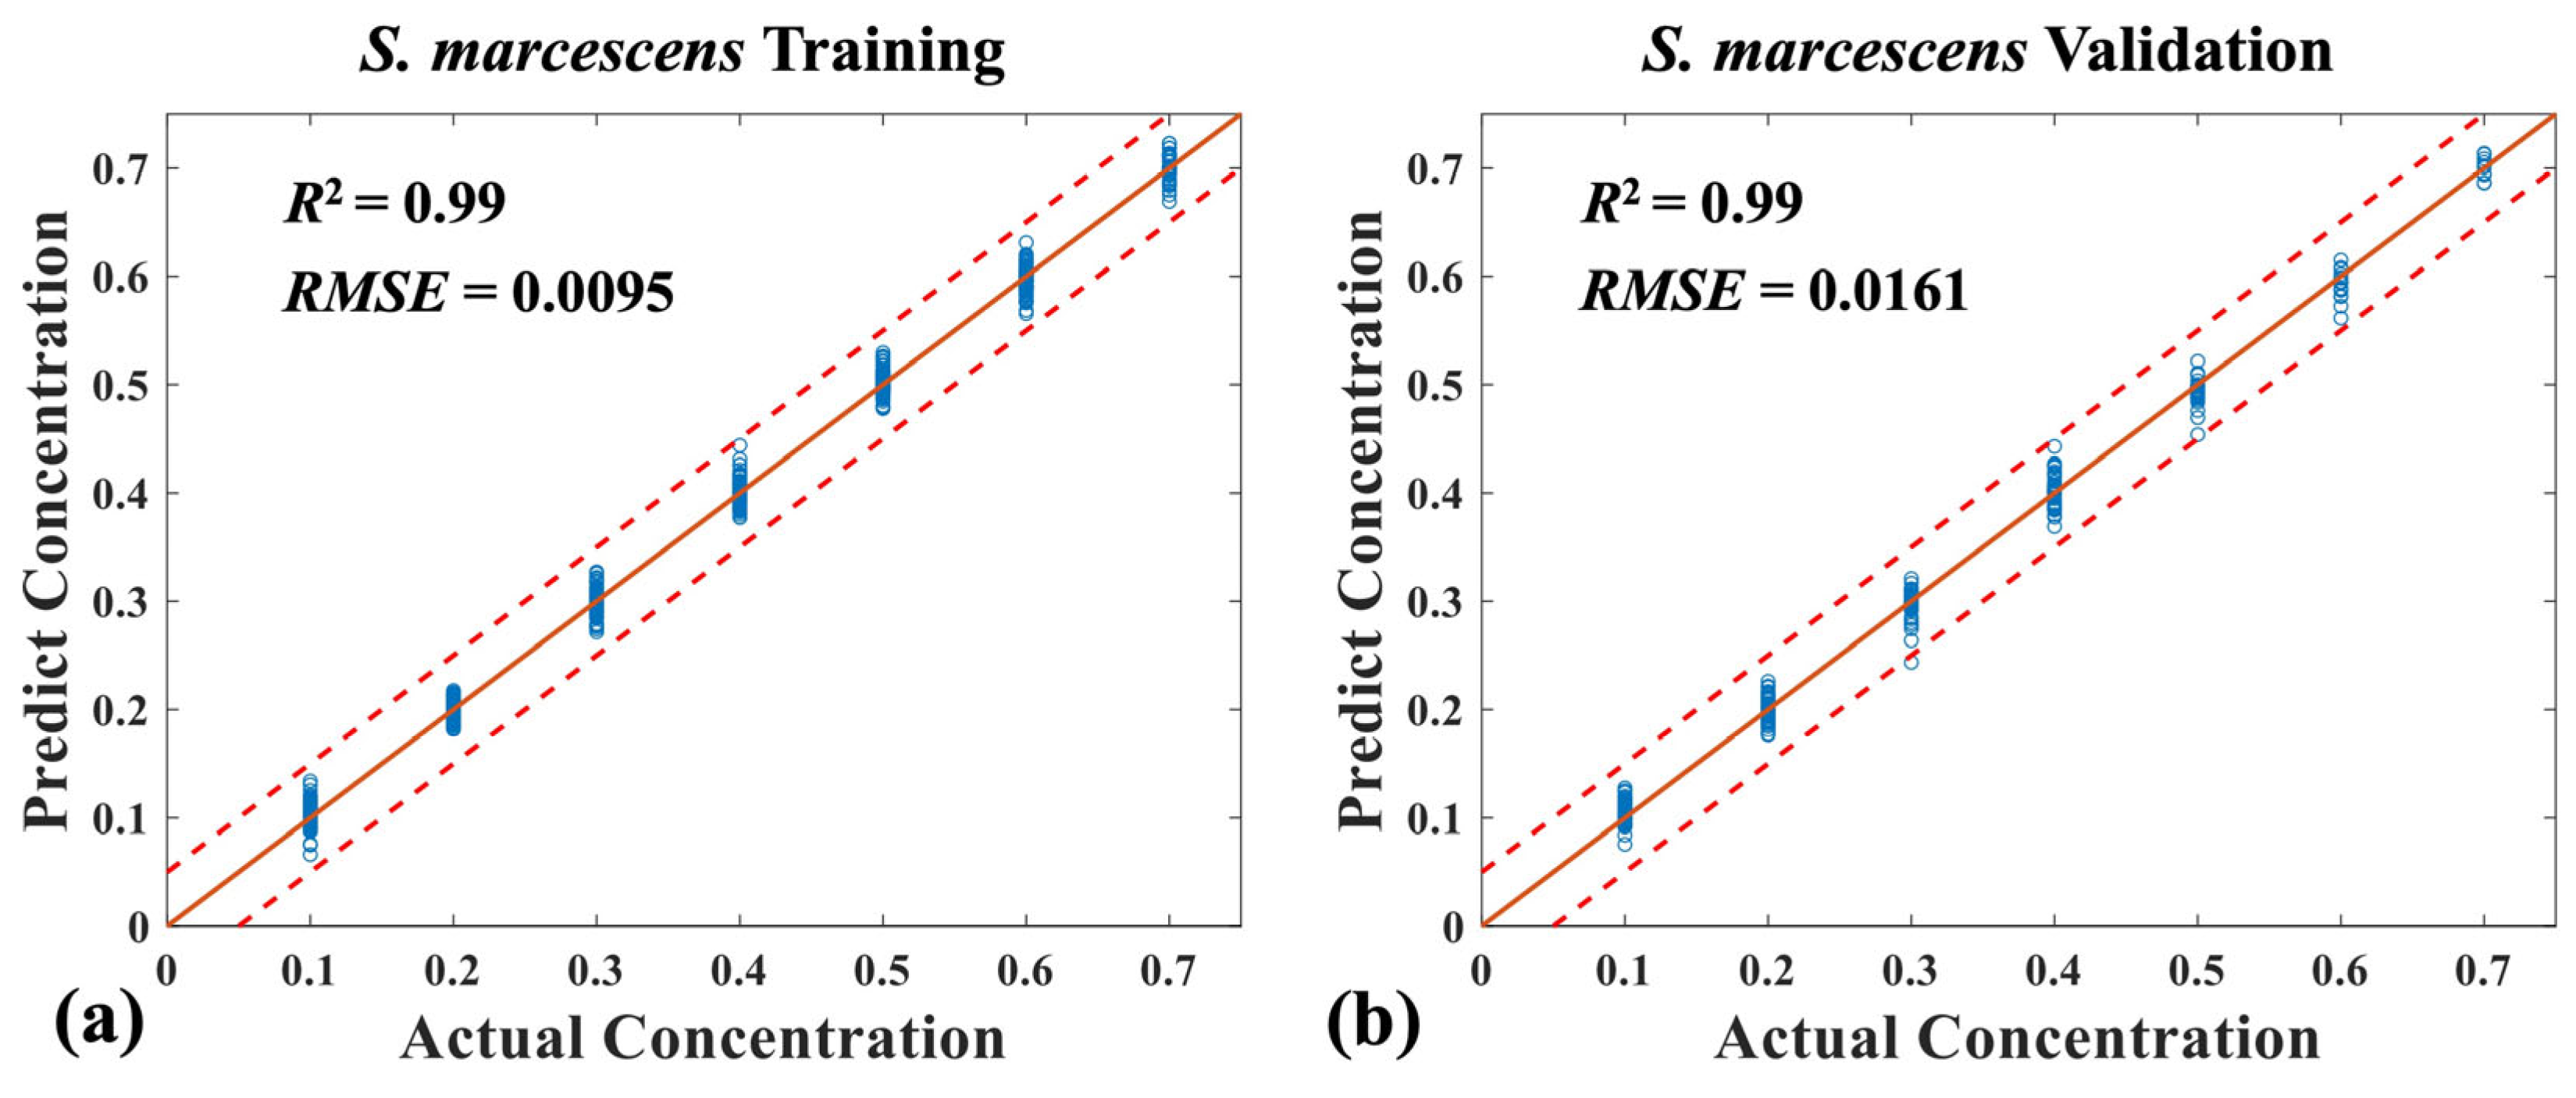
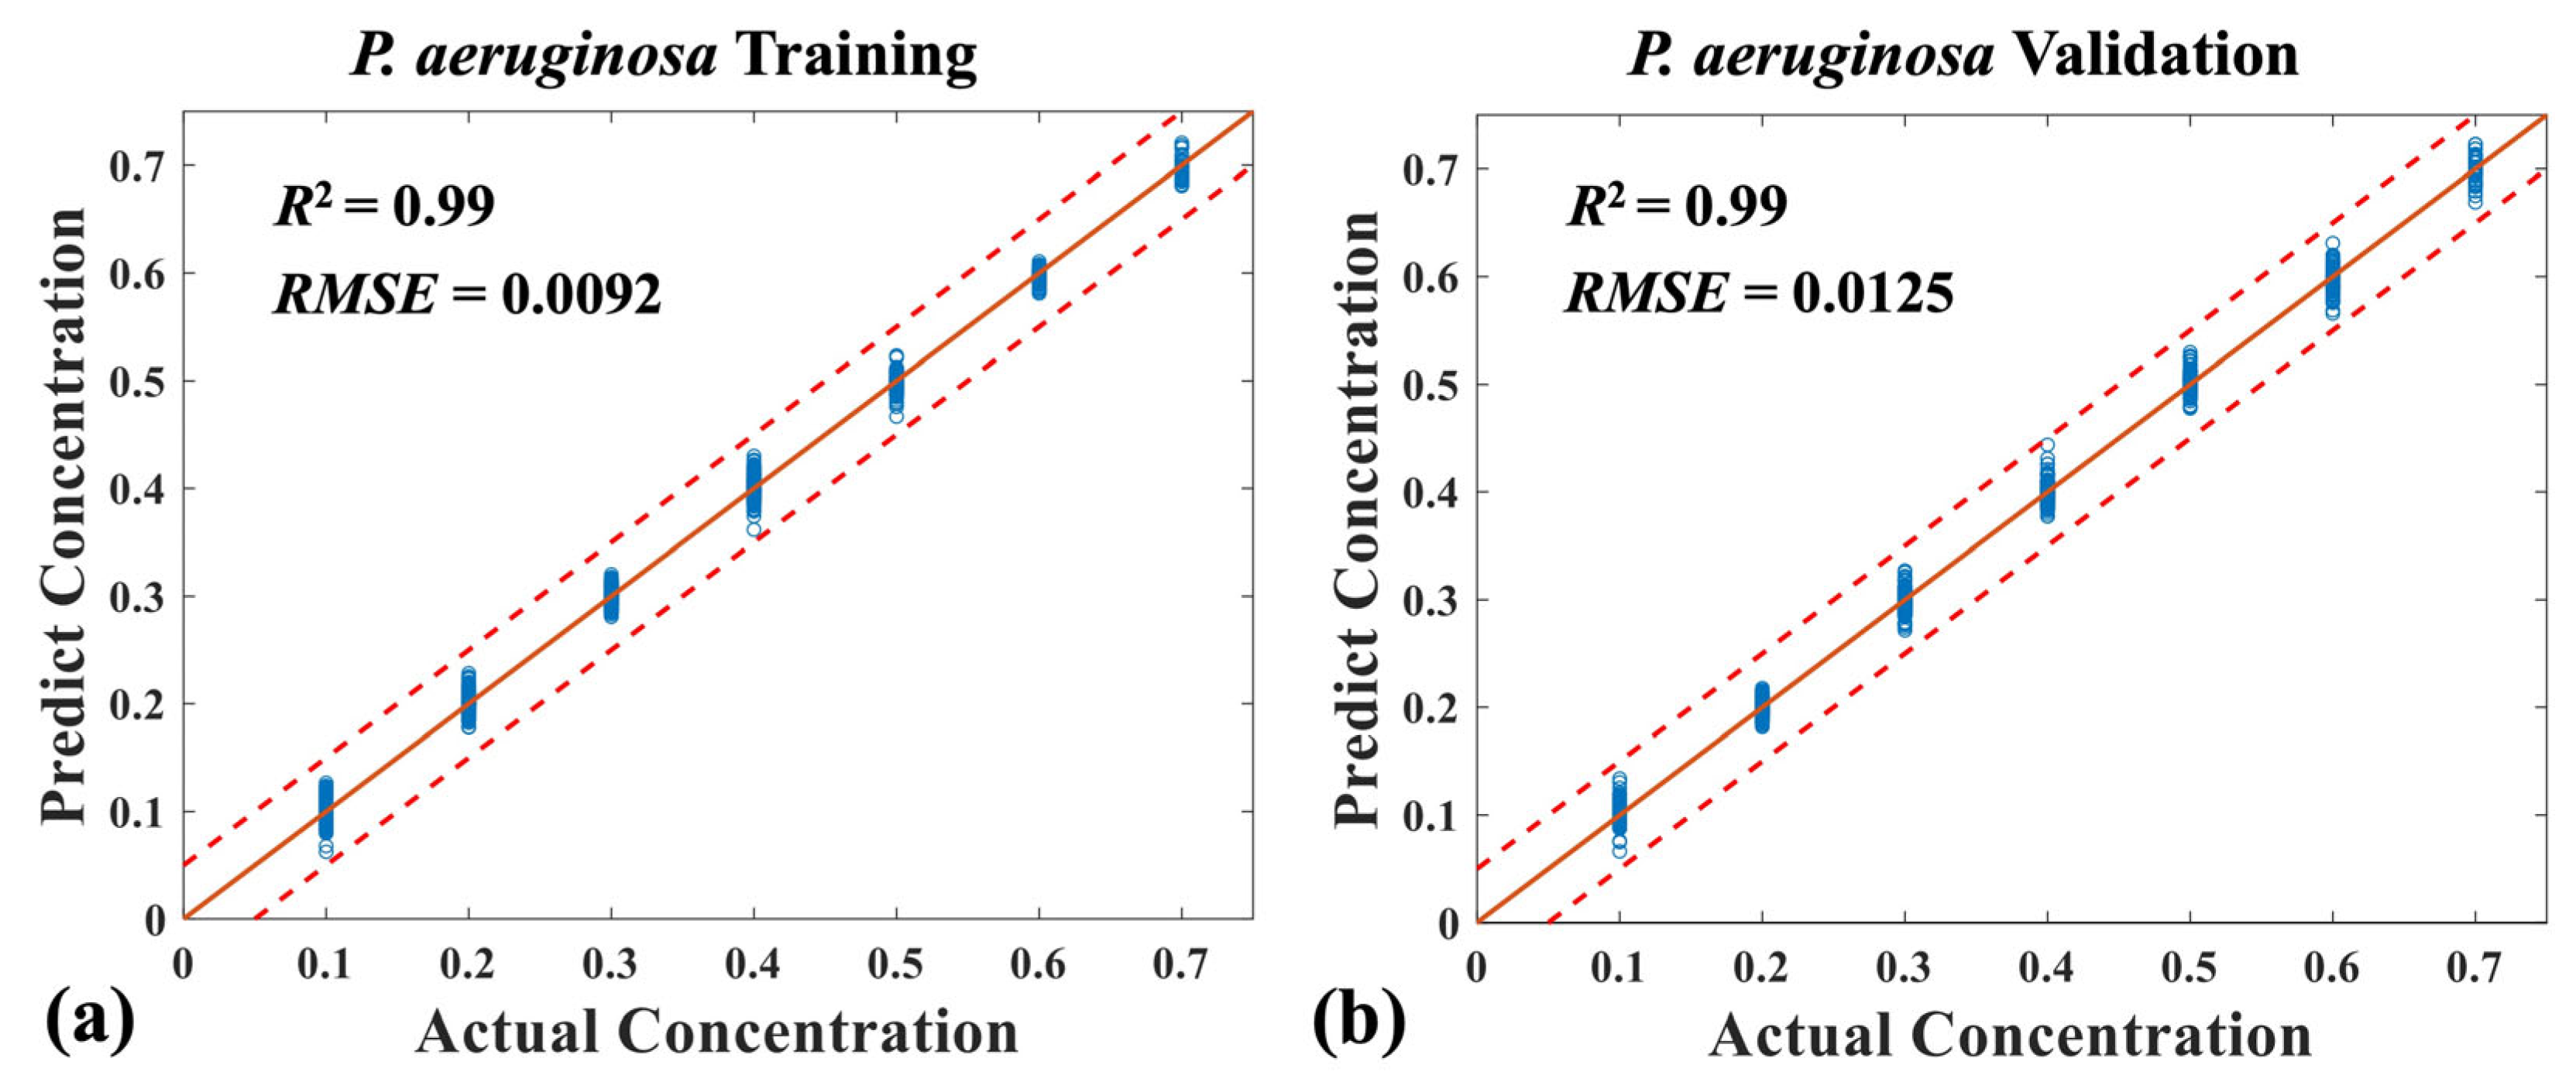
3.3. Quantitative Analysis of Three Mixed Bacteria Using MB-Net

We have also considered the measurements for a specific bacterium ratio of 0, with the results shown in Figure 10, Figure 11 and Figure 12. Table 3 shows the labels of the mixed bacterial samples and exact volume ratio of three types of bacteria. In Figure 10, Figure 11 and Figure 12, we compare the actual concentration and predicted concentration of S. marcescens, P. aeruginosa, and S. aureus, respectively. The parameters of prediction performance (RMSE and R2) are indicated in corresponding figures. It can be seen that the mixed samples with ratio 0 for specific bacterium can also been detected correctly using the MB-Net model, showing excellent performance with average RMSE and R2 (validation set) of 0.0145 and 0.99.
Table 4 compares the technical methods and performance of current research on spectral measurement of mixed bacteria ratio. To the best of our knowledge, this is the first time simultaneously detecting four types of mixed pathogenic bacteria using hyperspectral detection technology, showing excellent potential in clinical practice.

4. Summary and Outlook

In summary, a dual-mode hyperspectral detection technique combined with hybrid deep neural networks (DNNs) has been introduced in the present paper. It has the ability of quantitative analysis of mixed pathogenic samples, and has been used to detect a variety of bacteria including S. aureus, E. coli, P. aeruginosa, and S. marcescens at the same time, successfully predicting their different mixing ratios. We have utilized our self-developed hyperspectral detection system to collect both transmission and fluorescence spectral data of the mixed bacterial samples, and established a mixed bacteria measurement network (MB-Net) for the prediction of mixed bacteria ratio according to the dual-mode spectral features. The MB-Net with hybrid DL architectures enhances the representation ability of features by stacking and fusing two DNN frameworks applied for transmission/fluorescence spectral feature processing, and the achieved average coefficient of determination (R2) and RMSE on the validation set are 0.96 and 0.03, respectively. Furthermore, the hyperspectral detection system can also generate transmission hyperspectral images of mixed samples for calculation of the total concentration of mixed bacteria using cell counting methods. Combined with the predicted proportion of the mixed bacteria from the MB-Net, the detailed concentration of each bacterium in the mixed samples can be calculated. As implemented, our self-developed system has the advantages of low-cost, scalability, and convenient operation compared with commercial instruments. We explored the quantitative analysis methods of multiple mixed pathogens by using more advanced models and more comprehensive spectral data related to the bacterial properties, resulting in the rapid and effective analysis of mixed bacterial samples. This study lays the foundation for the spectral analysis of multiple mixed pathogens. The future research direction including establishing a spectrum library of a variety of bacteria, extending the spectral range covering ultraviolet (UV) and infrared (IR) to provide rich fingerprint features, conducting clinical bacteria testing, and so on.

Author Contributions

Conceptualization, S.H.; formal analysis, H.Z. and J.L.; funding acquisition, S.H.; methodology, H.Z. and S.H.; resources, software, J.L.; supervision, S.H.; validation, H.Z. and J.L.; visualization, H.Z. and J.L.; writing—original draft, H.Z.; writing—review and editing, S.H. All authors have read and agreed to the published version of the manuscript.

Funding

This work is partially supported by the “Pioneer” and “Leading Goose” R&D Program of Zhejiang (No. 2023C03083 and 2023C03135), Ningbo Science and Technology Project (2023Z122 and 2023Z179), the National Key Research and Development Program of China (No. 2022YFC2010000 and 2022YFC3601000), and the National Natural Science Foundation of China (No. 11621101).

Data Availability Statement

Data underlying the results presented in this paper are not publicly available at this time but may be obtained from the authors upon reasonable request.

Acknowledgments

The authors gratefully thank Jiao Qian of Taizhou Hospital and Julian Evans of Zhejiang University for helpful discussion.

Conflicts of Interest

The authors declare no conflicts of interest.

References

  1. Saxena, T.; Kaushik, P.; Mohan, M.K. Prevalence of E. coli O157:H7 in water sources: An overview on associated diseases, outbreaks and detection methods. Diagn. Microbiol. Infect. Dis. 2015, 82, 249–264. [Google Scholar] [CrossRef] [PubMed]
  2. Miller, L.S.; Cho, J.S. Immunity against Staphylococcus aureus cutaneous infections. Nat. Rev. Immunol. 2011, 11, 505–518. [Google Scholar] [CrossRef] [PubMed]
  3. Ward, J.L.; Azzopardi, P.S.; Francis, K.L.; Santelli, J.S.; Skirbekk, V.; Sawyer, S.M.; Kassebaum, N.J.; Mokdad, A.H.; Hay, S.I.; Abd-Allah, F.; et al. Global, regional, and national mortality among young people aged 10–24 years, 1950–2019: A systematic analysis for the Global Burden of Disease Study 2019. Lancet 2021, 398, 1593–1618. [Google Scholar] [CrossRef]
  4. Sharma, H.; Mutharasan, R. Review of biosensors for foodborne pathogens and toxins. Sens. Actuators B Chem. 2013, 183, 535–549. [Google Scholar] [CrossRef]
  5. Engelmann, I.; Alidjinou, E.K.; Ogiez, J.; Pagneux, Q.; Miloudi, S.; Benhalima, I.; Ouafi, M.; Sane, F.; Hober, D.; Roussel, A.; et al. Preanalytical Issues and Cycle Threshold Values in SARS-CoV-2 Real-Time RT-PCR Testing: Should Test Results Include These? ACS Omega 2021, 6, 6528–6536. [Google Scholar] [CrossRef]
  6. Krásný, L.; Hynek, R.; Hochel, I. Identification of bacteria using mass spectrometry techniques. Int. J. Mass Spectrom. 2013, 353, 67–79. [Google Scholar] [CrossRef]
  7. Law, J.W.-F.; Mutalib, N.-S.A.; Chan, K.-G.; Lee, L.H. Rapid methods for the detection of foodborne bacterial pathogens: Principles, applications, advantages and limitations. Front. Microbiol. 2015, 5, 770. [Google Scholar] [CrossRef] [PubMed]
  8. Zhang, L.; Liu, Y.Y.; Tao, N.P.; Wang, X.C.; Deng, S.; Lu, Y.; Xu, C.H. Simultaneous detection of mixed foodborne pathogens by multi-molecular infrared spectroscopy identification system. Food Control. 2022, 136, 108861. [Google Scholar] [CrossRef]
  9. Wang, C.; Wang, C.; Li, J.; Tu, Z.; Gu, B.; Wang, S. Ultrasensitive and multiplex detection of four pathogenic bacteria on a bi-channel lateral flow immunoassay strip with three-dimensional membrane-like SERS nanostickers. Biosens. Bioelectron. 2022, 214, 114525. [Google Scholar] [CrossRef]
  10. Shen, W.; Wang, C.; Zheng, S.; Jiang, B.; Li, J.; Pang, Y.; Wang, C.; Hao, R.; Xiao, R. Ultrasensitive multichannel immunochromatographic assay for rapid detection of food-borne bacteria based on two-dimensional film-like SERS labels. J. Hazard. Mater. 2022, 437, 129347. [Google Scholar] [CrossRef]
  11. Luo, J.; Lin, Z.; Xing, Y.; Forsberg, E.; Wu, C.; Zhu, X.; Guo, T.; Wang, G.; Bian, B.; Wu, D.; et al. Portable 4D Snapshot Hyperspectral Imager for Fastspectral and Surface Morphology Measurements. Prog. Electromagn. Res. 2022, 173, 25–36. [Google Scholar] [CrossRef]
  12. Park, B.; Yoon, S.C.; Lee, S.; Sundaram, J.; Windham, W.R.; Hinton, A.; Lawrence, K.C. Acousto-Optic Tunable Filter Hyperspectral Microscope Imaging Method for Characterizing Spectra from Foodborne Pathogens. Trans. ASABE 2012, 55, 1997–2006. [Google Scholar] [CrossRef]
  13. Smith, J.M.; Huffman, D.E.; Acosta, D.; Serebrennikova, Y.; Garcia-Rubio, L.; Leparc, G.F. Reagent-free bacterial identification using multivariate analysis of transmission spectra. J. Biomed. Opt. 2012, 17, 1070021–1070029. [Google Scholar] [CrossRef] [PubMed]
  14. Seo, Y.; Park, B.; Hinton, A.; Yoon, S.-C.; Lawrence, K.C. Identification of Staphylococcus species with hyperspectral microscope imaging and classification algorithms. J. Food Meas. Charact. 2016, 10, 253–263. [Google Scholar] [CrossRef]
  15. Kang, R.; Park, B.; Eady, M.; Ouyang, Q.; Chen, K. Single-cell classification of foodborne pathogens using hyperspectral microscope imaging coupled with deep learning frameworks. Sens. Actuators B Chem. 2020, 309, 127789. [Google Scholar] [CrossRef]
  16. Tao, C.; Du, J.; Wang, J.; Hu, B.; Zhang, Z. Rapid Identification of Infectious Pathogens at the Single-Cell Level via Combining Hyperspectral Microscopic Images and Deep Learning. Cells 2023, 12, 379. [Google Scholar] [CrossRef]
  17. Salman, A.; Shufan, E.; Sharaha, U.; Lapidot, I.; Mordechai, S.; Huleihel, M. Distinction between mixed genus bacteria using infrared spectroscopy and multivariate analysis. Vib. Spectrosc. 2019, 100, 6–13. [Google Scholar] [CrossRef]
  18. Feng, C.; Zhao, N.; Yin, G.; Gan, T.; Yang, R.; Chen, M.; Duan, J.; Hu, Y. A new method for detecting mixed bacteria based on multi-wavelength transmission spec-troscopy technology. Spectrochim. Acta Part A-Mol. Biomol. Spectrosc. 2022, 270, 120852. [Google Scholar] [CrossRef]
  19. Zhu, H.; Luo, J.; Liao, J.; He, S. High-accuracy Rapid Identification and Classification of Mixed Bacteria Using Hyperspectral Transmission Microscopic Imaging and Machine Learning. Prog. Electromagn. Res. 2023, 178, 49–62. [Google Scholar] [CrossRef]
  20. Zhao, Y.; Zhang, Z.; Ning, Y.; Miao, P.; Li, Z.; Wang, H. Simultaneous quantitative analysis of Escherichia coli, Staphylococcus aureus and Salmonella typhimurium using surface-enhanced Raman spectroscopy coupled with partial least squares regression and artificial neural net-works. Spectrochim. Acta Part A-Mol. Biomol. Spectrosc. 2023, 293, 122510. [Google Scholar] [CrossRef]
  21. Cho, J.; Gemperline, P.J.; Walker, D. Wavelength Calibration Method for a CCD Detector and Multichannel Fiber-Optic Probes. Appl. Spectrosc. 1995, 49, 1841–1845. [Google Scholar] [CrossRef]
Figure 1. The schematic diagram of the dual-mode hyperspectral detection system in (a) fluorescence hyperspectral mode and (b) transmission hyperspectral mode.
Applsci 14 01525 g001
Figure 2. (a) Spectral image of the mercury argon calibration source. (b) Relationship between the wavelength value and pixel index. (c) Spectral curve of the mercury argon calibration source measured by the system. (d) Spectral image of the standard resolution test board imaged by the system.
Applsci 14 01525 g002
Figure 3. The framework of MB-Net.
Applsci 14 01525 g003
Figure 4. (a) Spectral image of the mixed bacteria (using 40× micro-objective). (b) Transmission spectral curves and (c) fluorescent spectral curves of the mixed bacterial samples with different mixed ratios. Sample 01: 0.1/0.1/0.1/0.7; sample 07: 0.1/0.1/0.7/0.1; sample 28: 0.1/0.7/0.1/0.1; sample 77: 0.5/0.1/0.3/0.1. (Sequence: E. coli/S. marcescens/P. aeruginosa/S. aureus).
Applsci 14 01525 g004
Figure 5. (a) Loss value and (b) RMSE during training process of the MB-Net.
Applsci 14 01525 g005
Figure 6. Consistency between the predict concentration of the E. coli and actual concentration (in samples with four mixed bacteria). Input datasets: (a) training set; (b) validation set.
Applsci 14 01525 g006
Figure 7. Consistency between the predict concentration of the S. marcescens and actual concentration (in samples with four mixed bacteria). Input datasets: (a) training set; (b) validation set.
Applsci 14 01525 g007
Figure 8. Consistency between the predict concentration of the P. aeruginosa and actual concentration. Input datasets (in samples with four mixed bacteria): (a) training set; (b) validation set.
Applsci 14 01525 g008
Figure 9. Consistency between the predict concentration of the S. aureus and actual concentration. Input datasets (in samples with four mixed bacteria): (a) training set; (b) validation set.
Applsci 14 01525 g009
Figure 10. Consistency between the predict concentration of the S. marcescens and actual concentration. Input datasets (in samples with three mixed bacteria): (a) Training set; (b) Validation set.
Applsci 14 01525 g010
Figure 11. Consistency between the predict concentration of the P. aeruginosa and actual concentration (in samples with three mixed bacteria). Input datasets: (a) Training set; (b) Validation set.
Applsci 14 01525 g011
Figure 12. Consistency between the predict concentration of the S. aureus and actual concentration (in samples with three mixed bacteria). Input datasets: (a) training set; (b) validation set.
Applsci 14 01525 g012
Table 1. The composition of the four mixed bacteria samples.
SampleE. coli
(Ratio)
S. marcescens
(Ratio)
P. aeruginosa
(Ratio)
S. aureus
(Ratio)
1–70.10.10.1, 0.2, …→ 0.70.7, 0.6, …→ 0.1
8–130.10.20.1, 0.2, …→ 0.60.6, 0.5, …→ 0.1
14–180.10.30.1, 0.2, …→ 0.50.5, 0.4, …→ 0.1
19–220.10.40.1, 0.2, …→ 0.40.4, 0.3, …→ 0.1
23–250.10.50.1, 0.2, 0.30.3, 0.2, 0.1
26, 270.10.60.1, 0.20.2, 0.1
280.10.70.10.1
29–340.20.10.1, 0.2, …→ 0.60.6, 0.5, …→ 0.1
35–390.20.20.1, 0.2, …→ 0.50.5, 0.4, …→ 0.1
40–430.20.30.1, 0.2, …→ 0.40.4, 0.3, …→ 0.1
44–460.20.40.1, 0.2, 0.30.3, 0.2, 0.1
47, 480.20.50.1, 0.20.2, 0.1
490.20.60.10.1
50–540.30.10.1, 0.2, …→ 0.50.5, 0.4, …→ 0.1
55–580.30.20.1, 0.2, …→ 0.40.4, 0.3, …→ 0.1
59–610.30.30.1, 0.2, 0.30.3, 0.2, 0.1
62, 630.30.40.1, 0.20.2, 0.1
640.30.50.10.1
65–680.40.10.1, 0.2, …→ 0.40.4, 0.3, …→ 0.1
69–710.40.20.1, 0.2, 0.30.3, 0.2, 0.1
72, 730.40.30.1, 0.20.2, 0.1
740.40.40.10.1
75–770.50.10.1, 0.2, 0.30.3, 0.2, 0.1
78, 790.50.20.1, 0.20.2, 0.1
800.50.30.10.1
81, 820.60.10.1, 0.20.2, 0.1
830.60.20.10.1
840.70.10.10.1
Table 2. Prediction performance (RMSE and R2 of validation set) using transmission spectra only and dual-mode spectra.
E. coliS. marcescensP. aeruginosaS. aureus
Transmission spectra onlyRMSE0.04040.04060.05230.0751
R20.920.930.900.92
Dual-mode spectraRMSE0.04020.03560.01810.0289
R20.930.940.990.96
Table 3. The composition of the three mixed bacteria samples.
Sample S. marcescens (Ratio)P. aeruginosa (Ratio)S. aureus (Ratio)
1–70.10.1, 0.2, …→ 0.70.7, 0.6, …→ 0.1
8–130.20.1, 0.2, …→ 0.60.6, 0.5, …→ 0.1
14–180.30.1, 0.2, …→ 0.50.5, 0.4, …→ 0.1
19–220.40.1, 0.2, …→ 0.40.4, 0.3, …→ 0.1
23–250.50.1, 0.2, 0.30.3, 0.2, 0.1
26, 270.60.1, 0.20.2, 0.1
280.70.10.1
Table 4. Comparison of researches on spectral measurement of mixed bacteria ratio.
RefSpectral MethodStatistics AnalysisThe Number of Mixed Bacterial TypesThe Number of Measured Mixing RatiosPerformance
[17] Infrared spectroscopy PCA and LDA2590% (at the ratio of 9:1)
[18] Transmission spectroscopy PCA–MC
BPNN
2110.9954 (R2)
[8]MM-IR spectroscopyPCA and SIMCA27100% (recognition rate)
[20]SERSPLSR/ANNs3660.95 (R2)
0.06 (RMSE)
OurFluorescence and transmission hyperspectral detectionMB-Net4840.96 (R2)
0.03 (RMSE)
PCA: Principal components analysis; LDA: linear discriminant analysis; PCA–MC: Principal component analysis–Monte Carlo; BPNN: back propagation neural network; MM-IR: multi-molecular infrared; SIMCA: soft independent modeling of class analogy; SERS: surface enhancement of Raman scattering; PLSR: partial least squares regression; ANNs: artificial neural networks.
Disclaimer/Publisher’s Note: The statements, opinions and data contained in all publications are solely those of the individual author(s) and contributor(s) and not of MDPI and/or the editor(s). MDPI and/or the editor(s) disclaim responsibility for any injury to people or property resulting from any ideas, methods, instructions or products referred to in the content.

