Featured Application
The developed prototype is a tool to evaluate a supply situation and to plan required infrastructures more efficiently and precisely. It is part of a proposal for an integrated planning tool that covers several areas of supply planning.
Abstract
Dynamic processes in society and demographics require a rapid response and adaptation of the existing public service infrastructure. Responsible planners must be able to analyse the situation, identify gaps in provision and derive decisions. The paper presents a web application that supports finding answers to various questions and planning decisions in the context of public service infrastructures (e.g., schools, pharmacies, supermarkets). Due to the high complexity, the combination of multi-criteria decision analysis and geographical information systems, especially in the web context, is still rarely implemented. With this spatial decision support system, we are pursuing an approach that makes multi-criteria analyses with spatially explicit methods available to the planning domain. By using this application, the user can select and adjust input parameters independently and thus strongly influence the analysis process and results—without a deep knowledge of decision-making methods or software skills. With such a centrally provided online multi-criteria spatial decision support system, the transparency and the quality of the analysis increase, while the workload for the planners is reduced, since they no longer have to spend time on preliminary data search and integration or on building complex methods and models themselves.
1. Introduction
The administrative authorities of many advanced countries face the challenge of ensuring equal or at least equivalent provision of public services and goods in all administrative areas (access to food, health, education, public transport, etc.). However, due to dynamic processes, national or regional administrations deal with manifold problems, such as low birth rate [1], dynamic inflow or outflow of population groups [2], limited or ageing (human/structural/technical) resources for the operation of infrastructures and services. In addition, the role of ageing societies and the associated changes in needs and demands should not be underestimated. The latter is especially true for most of the developed countries of the G-20 in the near future [3]. The even or equitable distribution of public services/infrastructure places various demands on planners. They must have an overview of the supply situation of current and future infrastructure components (food markets, healthcare locations, educational facilities, public transport, etc.), as well as the current and future demand potential of the population. However, for planning purposes this alone is not enough, as it is important to evaluate the situation in small-scale spatial units and to be able to respond with planning actions. The reaction could be an infrastructure decision or measure of a recommendatory nature for decision makers. In order to fulfil the requirements roughly outlined in this introduction, a wide range of data, complex models, technical analysis, and planning tools (in the form of a spatial decision support system, short SDSS) in combination with a well-structured user interface are required.
Overall, high demands are placed on the access to data, but also on the methodological and computational models with which the analysis is realised, as well as on the process of user guidance. This paper proposes for an integrated planning tool with multicriteria—spatial decision support system (MC-SDSS) functionality (term based on [4]) for public services, which is fully usable as an online tool for a defined group of planners in the federal state of Lower Saxony/Germany.
This paper is linked to key concepts in the context of services of general interest and SDSS (Section 2). In doing so, we focus on the situation of previous web-based SDSS examinations and explain the background and objectives of this study. This lays the foundations for explaining the prerequisites for our application development, describing use cases and presenting our analysis concept and methods (Section 3). We then present our implementation with the illustration of our user interface and provide a look at an exemplary results map (Section 4). Our work concludes with a summary (Section 5) and an outlook (Section 6).
2. Preliminary Remarks and Basic Systematisation
In this section, we define the relevant concepts. We start with the terms MCDA and MC-SDSS and focus on an insight into the latest web-specific developments related to SDSS. Based on this, the current limitations of web tools are highlighted. We then place the restrictions in the context of spatial planning for services of general interest, which leads us to the background and goals of our investigation.
2.1. Multi-Criteria Decision Analysis and Spatial Decision Support Systems
Multi-criteria decision analysis (MCDA) is a heading for various formal approaches to the explicit consideration of multiple criteria that help individuals or groups to make decisions. MCDA is concerned with the process of decision making in the presence of multiple, usually conflicting, criteria [5,6,7]. In general, the existing MCDA methods are separated into the following categories:
- Goal, aspiration, or reference level methods;
- Outranking methods;
- Value measurement methods.
This work is to be categorised as a value measurement method. At this point, we will not go into further detail on individual aspects of the various method, since they have already been described in the literature [7,8,9,10,11].
Spatial analyses and in particular spatial decision support systems, as a sub-area of geographic information systems (GIS), offer many synergies for implementing MCDA. GIS are systems for collecting, storing, manipulating, analysing, and presenting geographical data and can generate information for decision making. According to Malczewski and Rinner, the main advantage of merging MCDA into GIS is that the decision maker can introduce value judgements (i.e., preferences in terms of weighting, evaluation criteria, and/or decision alternatives) into a spatial decision support system [7]. The coupling of MCDA techniques with GIS in GIS-MCDA procedures is a key element in the implementation of a multi-criteria spatial decision support system (MC-SDSS). An MC-SDSS can be understood as an interactive, computer-based system that effectively supports one or more users (planners or decision makers) in making decisions on semi-structured problems in which multiple criteria are considered. The unstructured aspects are implemented by the user, while the structured facets can be implemented in part by computerisation [7].
2.2. Web-Based Multicriteria Analysis Methods for Spatial Decision Support Systems
As Malczewski summarised 15 years ago, combined research on GIS and MCDA has focused on technical aspects of integrating MCDA and GIS methods [12] (p. 718). According to him, finding solutions for real spatial problems was a downstream concern, as certain progress in technical integration between MCDA and GIS fields of work had to be achieved first. Since then, a large number of publications have appeared that attempt to solve spatial problems with the help of MCDA methods in combination with spatial analytical methods (cf. [13,14,15,16,17,18,19]). However, looking at the methods of the mentioned literature, even today another point of Malczewski’s cannot be completely invalidated [12] (p. 718): Some MCDA methods have a number of strict assumptions that are difficult to substantiate in real situations or use methodologically simplified models of spatial analysis procedures. From his perspective, these points would be largely ignored by the GIS-MCDA community (status 2006). Together with Jankowski, Malcezewski recently stated that a large part of GIS-MCDA studies are (still) spatially implicit [20] (p. 1258). This means that evaluation criteria are defined based on the concept of spatial relationships such as proximity, neighbourhood, and contiguity. And even if some recent work indicates a paradigm shift towards spatially explicit analysis methods, the path to MCDA methods that explicitly takes spatial variability into account has not yet been fully trodden. The web application presented in this paper provides an MCDA approach based on spatially explicit criteria such as accessibility and distance decay. The application allows the user to choose from different distance decay options for the given infrastructures. The distance decays are calculated using network analysis components (via an OpenStreetMap road network).
Since the turn of the millennium, web-based decision support tools are receiving more attention in research (examples include [21,22,23,24]). Nevertheless, the results of these studies should rather be considered as feasibility and perspective studies or to only implement partial technical aspects of a GIS-MCDA. To the best knowledge of the authors, comprehensive online MCDA tools do not exist.
Even though the corona pandemic has given a real boost to new web-based presentation and data analysis tools, such as dashboards with map integration, the resulting COVID-19 tools for planners and interested citizens often have only rudimentary GIS or geo-operations in use [25]. Even if there are certain differences in the comparison of the dashboards [26] (p. 3), they are mainly used for the daily visualisation of infection events or the regional health status of the population. Examples of this are the description of a global dashboard for the WHO by [26], for Ghana by [15], for Mexico by [27], and for Germany by [28]. Further, there are numerous works that take an analytical approach by combining MCDA and spatial analytical methods to support planners and governments in decision making. Examples are studies on risks estimation of overshoot of regional hospital bed capacities for Brazil [29] and analyses to ensure national food supply in case of production losses on agricultural land, as in Nepal [30] or China [31]. However, these studies do not include web components. Online GIS applications for public administration, of which the level of interaction goes beyond dashboards and which incorporate spatial MCDA analyses in the stricter sense, do not exist yet. This applies in particular to online systems that provide dynamic user interaction options for the GIS and MCDA functionalities.
Currently, the results of MCDA are often static maps that are partly presented online. This means that planners have no possibility to adjust the analysis (e.g., input variables, model components, and parameterization) or to compare different analysis results in order to understand the complex situation of a study area. However, for state and regional planning, a comprehensive picture can only be obtained if an MC-SDSS is available and the analysis and its results are interactively explorable. The web application developed in this investigation makes this functionality centrally available. It could be hosted by a (regional) government for its administrative planners, for example.
2.3. Services of General Interest
Services of general interest are often based on a broad understanding of provision, which includes the availability of immaterial (services) as well as physical goods (infrastructures) for the general public [32]. In addition, the concept of services of general interest is determined dynamically depending on context and time (cf. [33] (pp. 35–40); cf. [34] (p. 24), which makes a sharp definition difficult. The derivation of definitional aspects is often very complex and, hence, is not deepened here (deeper insights: [32,34]). Generally, services of general interest are often described by examples: healthcare facilities (hospitals, medical practices, pharmacies), education (day-care centres, schools), and local amenities (food for daily needs) should be provided nationwide within reasonable distance at socially acceptable prices and minimum acceptable quality [32]. In this study, we restrict the analysis of services of general interest to the examples mentioned above. Such structural infrastructures have an impact on the supply situation of the population in a given area. We do not consider the more technical infrastructures such as the fresh water supply, wastewater disposal, waste disposal, or internet services.
How the quality of supply can be defined across all the services and infrastructures is highly variable and therefore very difficult to capture. With the help of our integrated MC-SDSS, we provide a proposal for planners to keep the variability and still provide a powerful tool to measure the quality of supply.
2.4. Background and Goals of the Study
Since 2017, the Federal State of Lower Saxony has been developing and operating the Digitaler Daseinsvorsorgeatlas Niedersachsen (Digital Atlas of the Provision of Public Services in Lower Saxony, or DVAN for short). Therefore, the data of the relevant infrastructure types had to be collected from numerous public administrations of the municipalities and the state of Lower Saxony and integrated into a harmonized data base. A major goal of the DVAN is to make these infrastructure data more usable for planners in regional and state administration. It is a web application with simple spatial analysis tools. Unique to the tool is a rather large dataset consisting of a variety of infrastructure data from different service areas. Due to the legal protection of the data (and in some cases due to a licensing obligation), access to the application is restricted for planners of the Lower Saxony authorities. The provided basic functionalities of the web application include a calculation of infrastructure supply degrees in a given area and simple accessibility analyses. In a cooperation with the Dresden University of Technology, this has been extended to a decision support system including spatial multi-criteria analyses.
The aim is to provide the planers with an overall picture of the supply situation with the help of spatial analysis methods with adjustable parameters. Despite the high complexity of parameter selection and modelling that spatial multi-criteria analyses entail, the user should be able to select the analysis area and set decisive model parameters via a simple and straightforward user interface.
In summary, the contributions of this paper are as follows:
- The further development and use of a web-based MC-SDSS in spatial planning (services of general interest);
- The implementation of a web-based online GIS solution with DSS functionality;
- The presentation of a technical solution and a user interface as a result of the application–orientated approach.
3. Requirements and Methodology
In this section, we describe the decision problems and the user requirements that arise in the area of services of general interest. Based on this, we derive the basic factors that are necessary for the implementation of the MC-SDSS. Generally, users should be able to regulate as many variables and parameters as possible. For an MCDA, they should be able to select criteria and define parameters (e.g., weights) in order to adjust the analysis to the specific decision problem. This is in conflict with the fact that, due to the complexity of the MCDA, most of the addressed users would hardly be able to create the analysis model independently. Further, due to usability considerations, the implementation as a web application requires some simplification and presetting of parameters. This analysis concept will be discussed at the end of the section.
3.1. User Requirements of Planning Institutions
As already mentioned in the introduction, in order to offer a suitable solution for public service planners, a wide range of requirements are placed on data, models, technical analysis, and planning tools (in the form of SDSS) in combination with a well-structured user interface:
- Data: Planners and decision makers need an overview of the spatial situation and distribution of population and supply locations, as well as of the transport links between them. This requires small-scale data bases that map the population distribution, reflect the locations but also the utilisation capacities of the infrastructures in question, and allow for analysis of the accessibility, i.e., the connection between the population points and the infrastructure facilities (network data).
- Complex models: Appropriate models must be used to map the utilisation of the infrastructures and to determine the capacity limits. In addition, the applicable planning regulations, which can also be understood as an influencing factor on models, parameters or criteria, must be considered.
- Technical analysis and planning tool in the form of a spatial decision support system (SDSS): In order to give a planner a nearly realistic picture of the current situation or a scenario, the planner must be able to set individual parameters from the corresponding specialist domain. The professional preferences of the respective domain are decisive here.
- User interface: A simple and user-friendly interface is needed to be able to carry out complex analyses and present the results according to preferences.
For the development of a system that is intended to support the decisions of regional and state planners, it is necessary to understand the scope of tasks and the type of decisions that should be made. Therefore, several workshops were held to define the decision-making problem. Some of the workshop sessions were conducted with administrative staff from Lower Saxony. Representatives from the offices of regional state development and from the ministries entrusted with state development and planning were present. In order to obtain further important impulses and ideas for application development, another workshop was explicitly aimed at planners who were not part of the Lower Saxony state administration [35]. This resulted in two specifications for the application. On the one hand, we were able to agree on the selection of criteria and the necessary criteria with the help of the workshops and by surveying the participants. We used an interactive mock-up to triangulate the necessary functions and criteria with the users. On the other hand, three key decision-making tasks and problems were identified and integrated into the tool:
- Supporting the alignment of funding areas and funding allocation: The multi-criteria analysis can support both the identification of priority funding areas and the evaluation of funding applications for various areas of services of general interest. For example, under-supplied villages can be predestined for funding when setting up a community shop because it is possible to make comparative statements about the need and necessity. Another example is the targeted promotion of the establishment of new medical practices in underserved planning areas within small, limited areas (villages).
- Review of basic and (partly) centralised provision: The MCDA can support the review and designation of central places. For example, an assessment of the central functions can be made by jointly considering the amenities (including accessibility, etc.). Likewise, localities that fulfil the characteristics of service centres for the population but are not designated as basic or (sub)central places can be identified.
- Support in the designation of settlement areas: In the course of increasing land consumption, settlements should be developed with caution. The multi-criteria analysis can support municipalities in identifying suitable settlement areas, e.g., areas that are suitable for sustainable settlement area designation due to existing infrastructure facilities or their accessibility.
3.2. Criteria, Data, and Weights
The scope of our planning tool is to enable the planner to assess the available infrastructure of general interest (supply side) in relation to the requirements of the population (demand side). On the supply side, this mainly includes
- Supermarkets, discounters, and other grocery shops (bakers, butchers, etc.);
- The health sector with the locations of pharmacies, clinics, and all primary care specialists (from general practitioners to outpatient surgeons);
- The education sector, consisting of day-care centres, primary schools, and secondary schools.
On the demand side, this includes the residential locations of the population. Here, we used small-scale data with a resolution of 100 × 100 m edge length per grid cell for the total population and for the different age groups.
Table 1 provides an overview of the integrated data. For the federal state of Lower Saxony, a total of 112,326 data points (i.e., infrastructure locations) are provided in the categories of local supply, health, and education.

Table 1.
Overview of the provided datasets.
According to the user requirements (problem definition), there are different dimensions of weighting. The first dimension is the relative importance of one type of infrastructure to another. The second dimension is the distance decay of the supply over an increasing distance (road network) between the supply location and the demand location.
The latter is of particular importance because in many countries, including Germany, minimum standards for the supply of an infrastructure are legally set: undersupply is stated if a certain distance (or travelling time) from the place of residence to an infrastructure is exceeded. Countermeasures must be taken for residential locations in undersupplied areas. For example, the distance to child day-care facilities in cities may be a maximum of five kilometres. Thus, distance is not only a spatial weighting factor (the further away, the less important it is for the decision problem), but also a constraint if it exceeds a certain distance. For German planners, we set these weighting factors and constraints for all existing infrastructures in the application on the basis of case law and legislation (where available) [36]. Within the application, however, we ensured that the planner or decision maker can adjust these default settings via the interface. The default pre-assignment was therefore only a suggestion based on the legal situation for the infrastructure in question.
Figure 1 schematically illustrates the application goal of a gradual distance decay for one criterion. The supply situation becomes unfavourable as the distance increases. However, the distance boundaries (or respective travelling time limits) are predefined and can be manually changed by the planer.
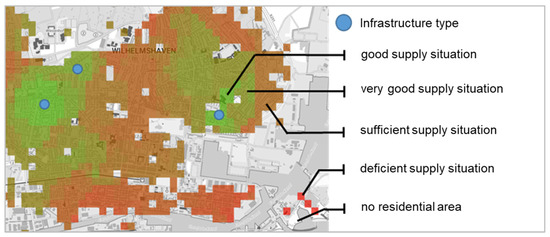
Figure 1.
Schematic representation distance decay with the planner’s parameter decision (right) and the exemplary effect in space (left) for a given infrastructure (blue dot). The distance in the supply status can be set individually.
3.3. Concept and Methods
In the following, we present a decision process valid for the application, which integrates most elements of the framework for MCDA according to Makczewski [12] (shown in Figure 2). Due to the complexity of the MCDA process for a user, the online tool handles the elements in separate steps. In the illustration, we have added the steps in which the frame elements are edited in the online tool (user interface in Section 4).
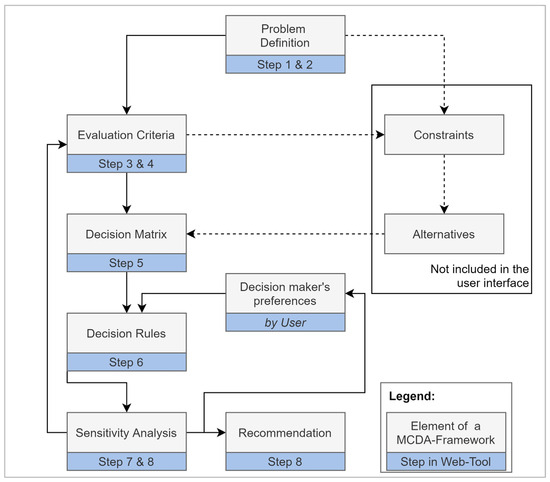
Figure 2.
Framework for spatial MCDA (according to [12]). For an overview, the framework elements are linked with the corresponding process steps of the workflow of our online tool.
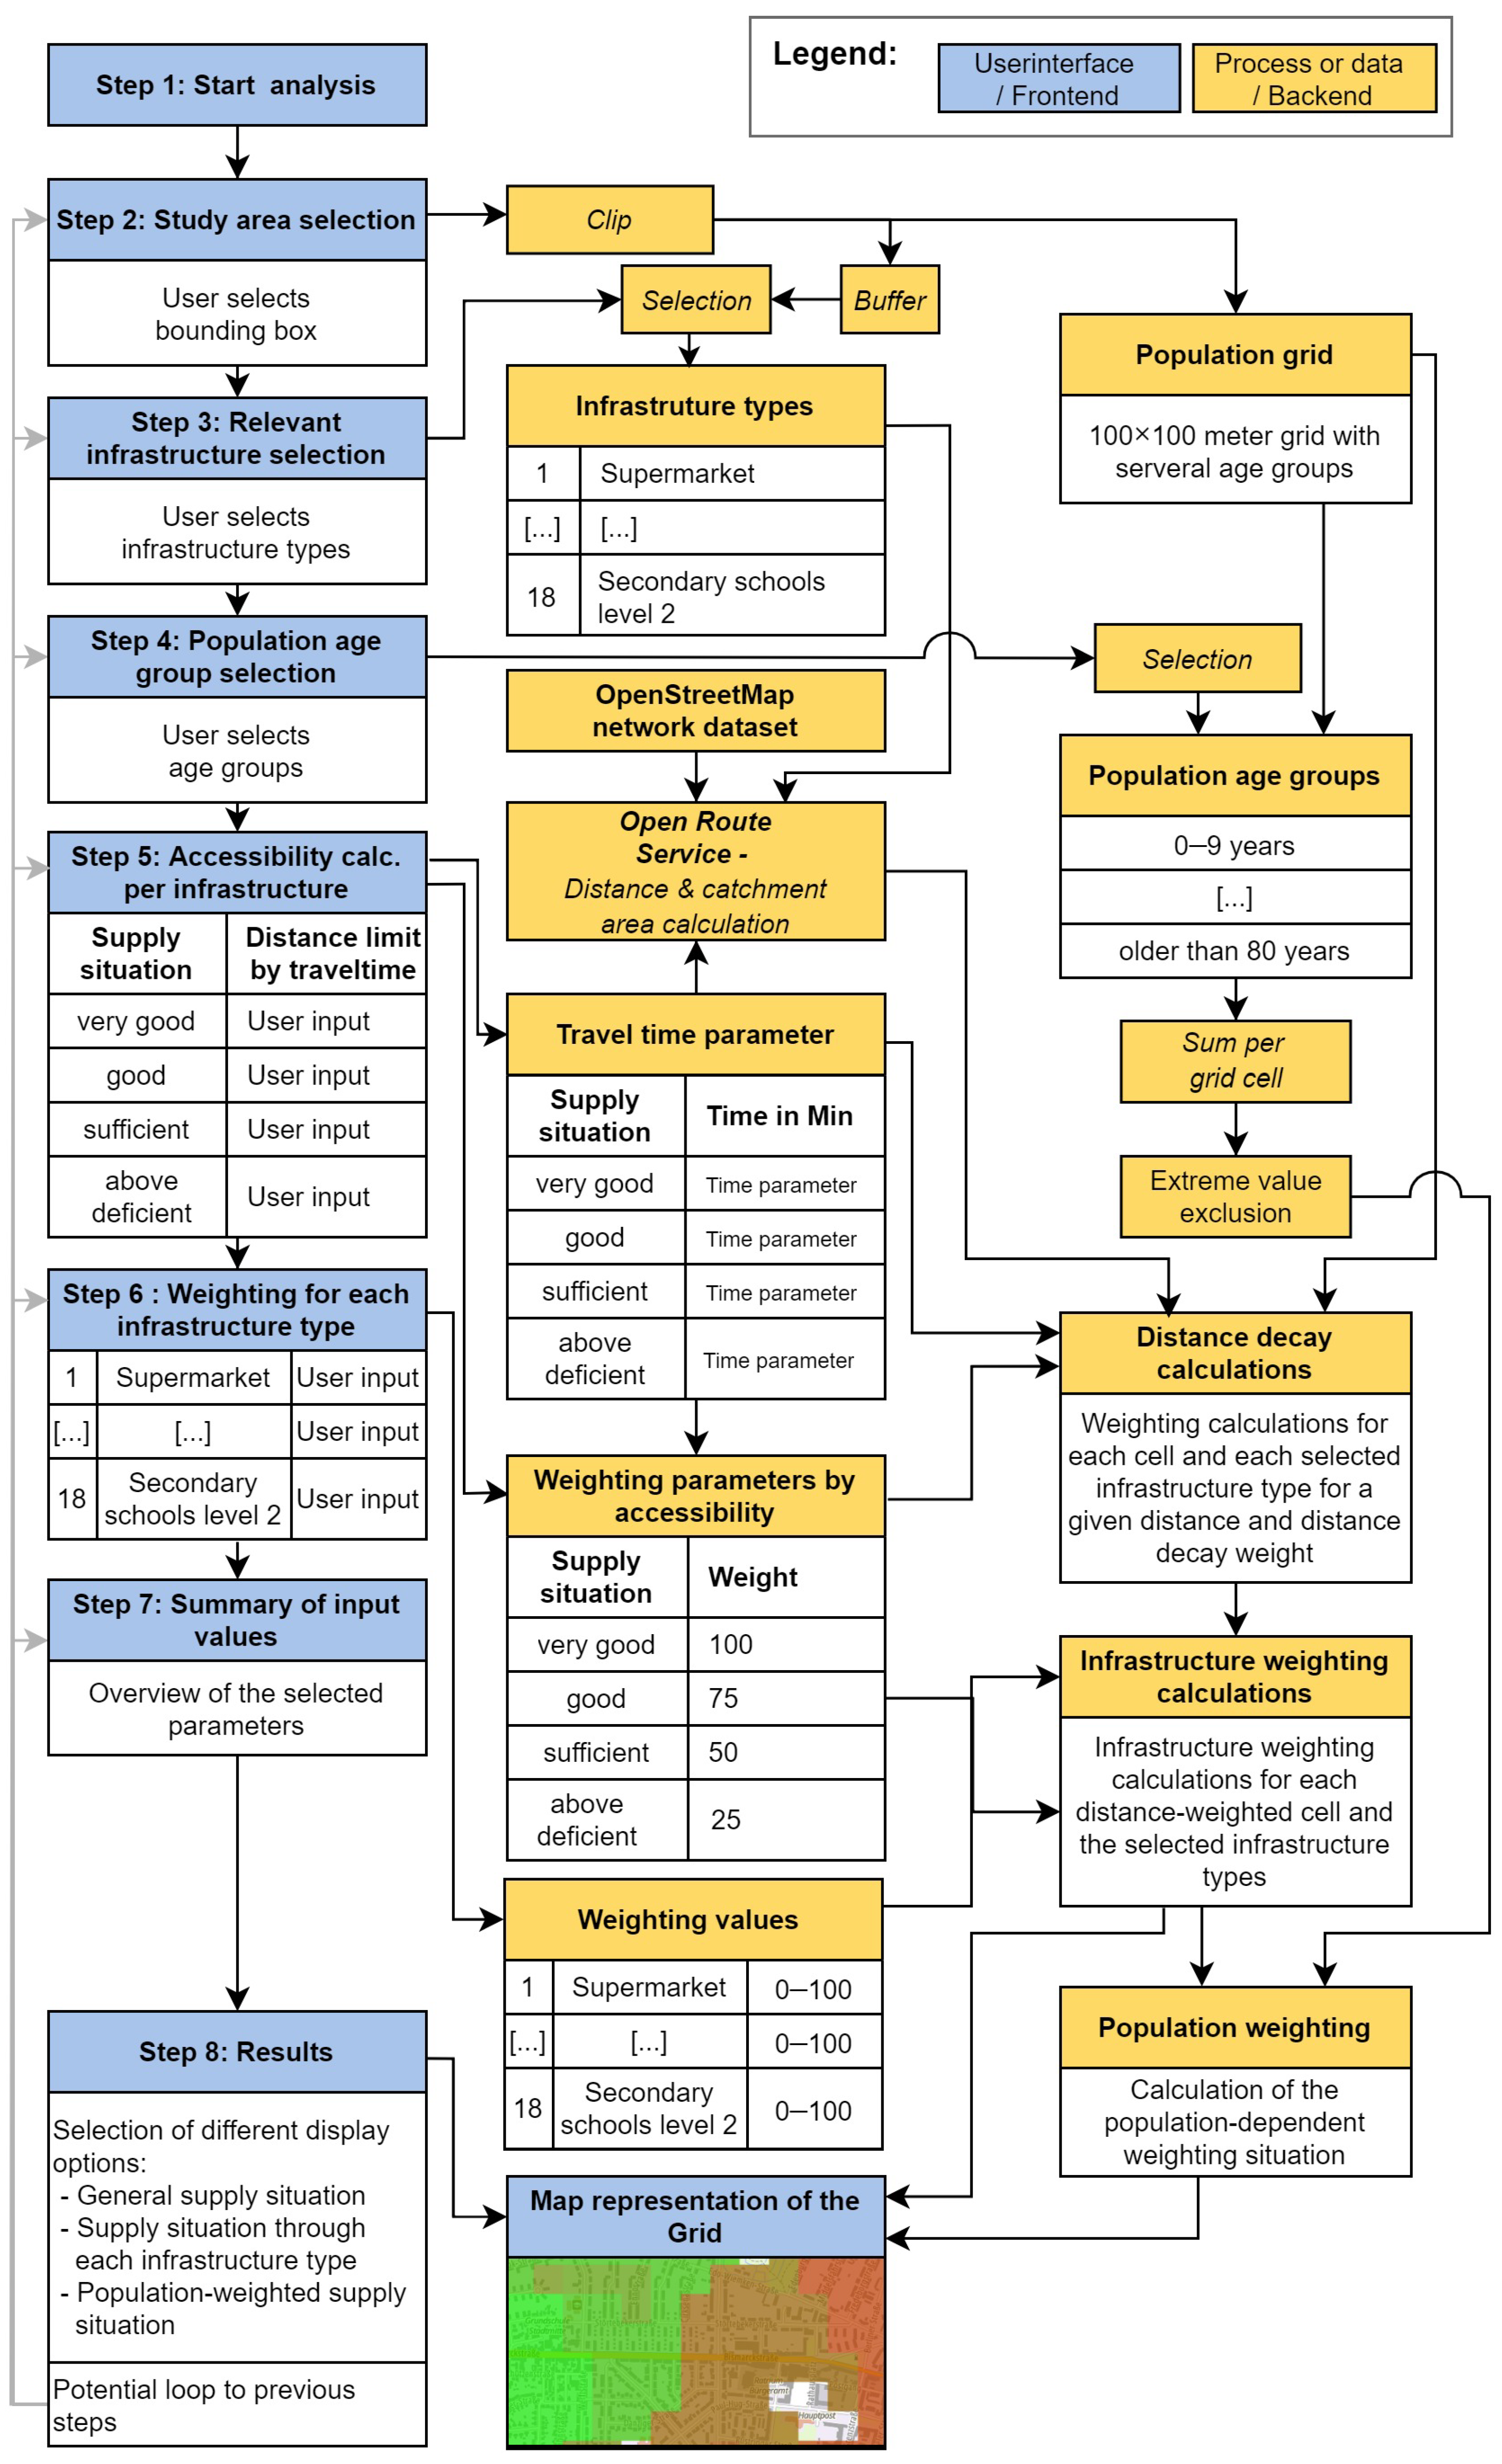
In Figure 3, we describe the process from the user’s perspective (blue) and refer to the analysis process that takes place in the backend (yellow). In order to meet the aforementioned user requirements and offer a high degree of flexibility in parameterisation, we need a clear and standardised process in the user interface and a methodical/analytical process flow in the backend of our application. To offer an appealing user interface that fulfils our technical requirements, we have chosen the MasterPortal [37] as a platform. It is a responsive and modular application based on Vue.js, which already contains OpenLayers for map functions. It mainly provides functionalities for map integration, but additional components for more complex custom implementations are also possible.
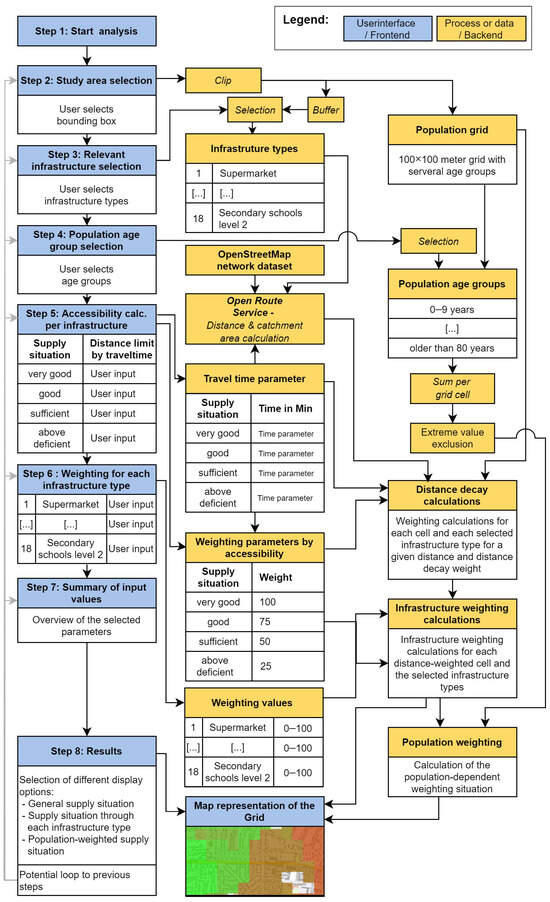
Figure 3.
Workflow of the analysis process in interaction with the user interface.
In the following, we explain the analysis process step by step and the corresponding parameterisation by the user in a slightly simplified manner. We also name the used methods and describe the technical components:
After the user has received introductory information in step 1, the user defines the analysis area in step 2. This is used to clip the population grid to the area of interest.
In step 3, the user selects the infrastructure types relevant for the analysis purposes via a checkbox for each infrastructure type.
The following step 4 allows for selection of the specific population age groups to be considered. On the one hand, this can be the entire population. However, it is also possible to consider only selected age groups. This expands the analysis options as, for example, only the younger age groups can be considered when evaluating the supply situation for early childhood education, while the older age groups could be taken into account for the supply analysis of geriatric infrastructure. In the background, the desired age groups are used according to the user selection from the population grid and, if necessary, summed.
Step 5: The criteria map is created at this point. Thanks to the user’s individual parameterisations, it contains the spatial weighting [17]. Simplified: According to the definition by the user, distant locations are less important for the supply. The innovation here is that the user themselves decides how and where the threshold values for this run. We use the midvalue method introduced by [38] as a stepwise distance decay function. The user defines which threshold values apply for accessibility in order to map the supply situation for each infrastructure. These travel-time parameters provide the basis for the distance-decay calculations over a street network dataset. The calculation is performed by an instance of the open-route service (ORS). This is a freely available software for routing and catchment area calculation by the Heidelberg Institute for Geoinformation Technology [39]. The following basic data and input parameters are required to calculate the distance decay: The infrastructure locations for the types selected in step 3, a network dataset for routing between the given infrastructure locations, and the populations grid cells from step 2 and 4 (calculate distances and catchment areas). Additionally, the accessibility weighting parameters have been predefined but can also be adjusted by the user.
In step 6, the relative weights for the selected infrastructure types are defined by the user. The relative value between the types is determined by the weighting on a scale of 0–100. With reference to Makczewski [17], the decision was made to use a ranking method based on the ratio estimation procedure—whereby, in this case, equivalent rankings are permitted. As Makczewski [17] also mentions, the method can be criticised for its lack of formal and theoretical background. However, even if the accuracy of the estimation of the criteria importance is affected, this method is suitable here as it is very quick and easy for a user to understand. In this case, we can provide planners and decision makers with intuitive access to MCDA methods and comprehensive map results. As described in more detail in the following two steps, the individual values and the overall result can be traced logically and intuitively in the final maps. The map result is much more comprehensible for the user.
Once the user has stored the desired weights in the interface, the simple additive weighting methods (SAW), also referred to as weighted linear combination (WLC) or scoring methods, are implemented. The WLC process consists of the following six steps:
- Defining each criterion in the form of a map layer;
- Standardising each criterion layer;
- Defining a weighting for each criterion;
- Creating the weighted standardised criteria layers;
- Generating an overall assessment by totalling the selected standardised criteria layers;
- Categorising the alternatives according to the overall performance rating.
After a summary of the input parameters is given in step 7, the user can finally view the analysis results in step 8. Here, the user has various options: It is possible to view the general supply situation (corresponding to the parameters set). This allows for the identification of good and deficient supply situations. The optional inclusion of population weighting makes it easier to identify deficient supply situations which affect large sections of the population. However, the user can also analyse individual results and assess the supply situation (and values) of each individual infrastructure type.
In the context of this web-based implementation, we refrained from an in-depth realisation of a technical–methodical sensitivity analysis, mainly because of usability and performance reasons. Such an analysis examines the relationship between the result achieved and the input parameters. The aim is to show the extent to which the assumptions made and the preferences of the decision maker have an influence on the result. The sensitivity analysis can therefore be used to deal with uncertainties in the weighting or the design of alternatives and criteria values. On the other side, the parametrization and the resulting representation of such an analysis is complex and would overburden the user interface of our web application. Further, practical tests have showed that the calculation times of a sensibility analysis would not be acceptable in the context of such a web application. However, if the influence of a specific input parameter is to be analysed, a manual procedure allows for the user to switch back to step 3, influence criteria, change weights and thresholds, and explore the effects in an iterative process.
After we work out the details of the analysis process, we will discuss the implemented user interface and the analysis results in the following section.
4. Prototypical Implementation
It is important that the user has the widest possible range of settings at their disposal to solve the decision problem flexibly and independently. This requires that the user is well guided through the decision-making process (clear and structured visualised process), that they can carry out modifications in each process step (parameter adjustment on the backend models), that they know about the consequences of the settings and model influences (description and notes in our interface), and that they can archive the results and reload the calculation at any time. This shall be illustrated in the following example. Here, we assume that a planner wants to designate a new development area for single-family houses in a rural area outside a large city. The planner wants to be supported in viewing potential alternatives of priority areas according to the self-defined preferences.
4.1. User Interface and Parameter Control
At this point, we would like to present the setting options mentioned in the previous sections using a potential application example with the user interface. The MCDA runs through the following eight steps. The corresponding tab in the user interface can be seen in Figure 2 and Figure 3:
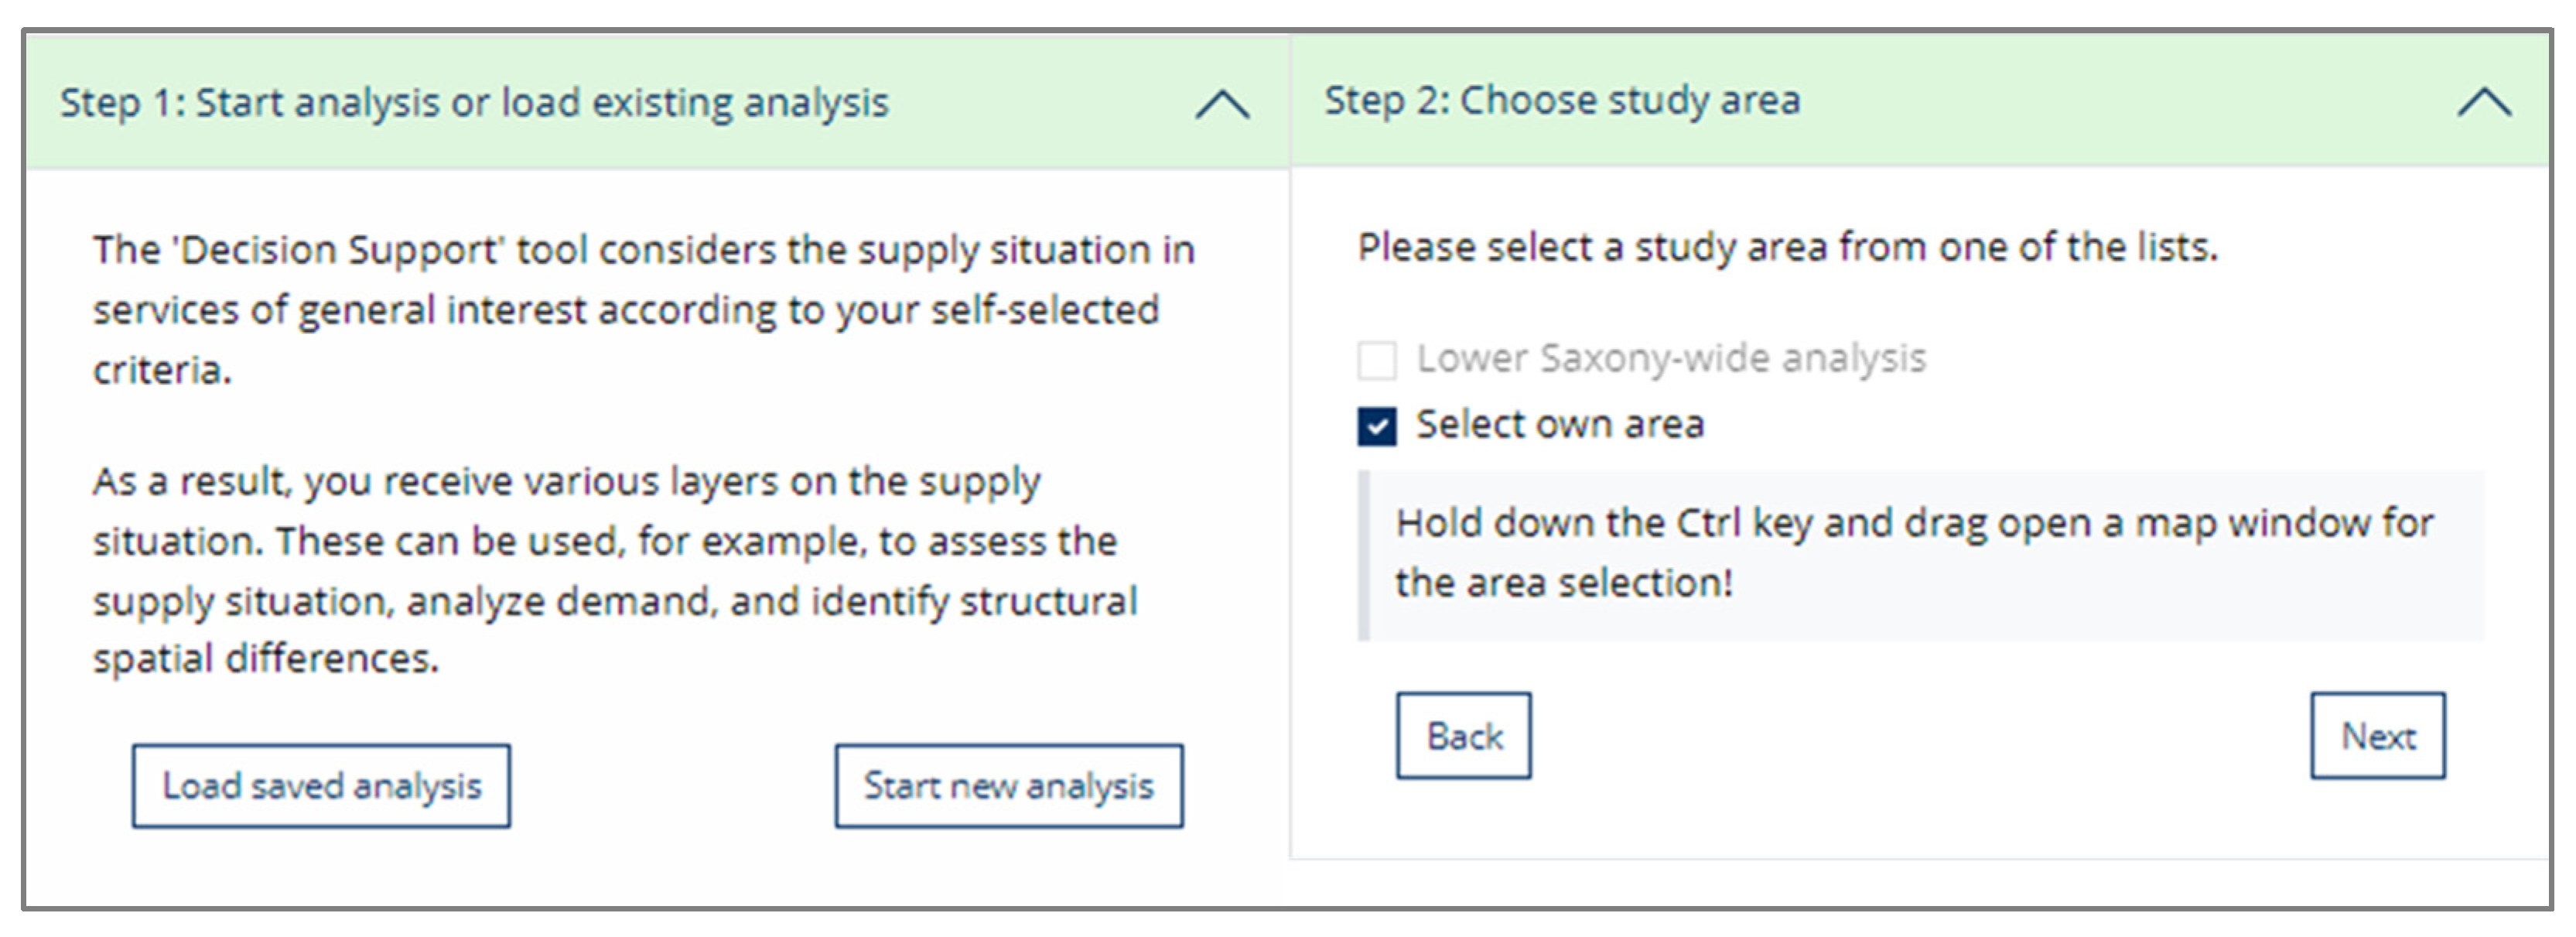
- Step 1—Start analysis or load existing analysis: If the user has already performed an analysis, the parameters of the performed analysis can be reloaded. The parameters are then reloaded into the analysis. Otherwise, they can perform a new analysis (Figure 4, left).
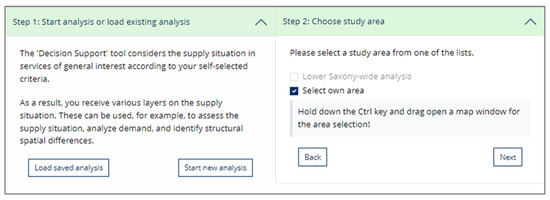 Figure 4. Step 1 and step 2 of the user interface.
- Step 2—Select study area: The user can select their study area via area selection in the map window (Figure 4, right).
- Step 3—Select relevant infrastructures: According to their decision problem or analysis objective, the user can add the relevant infrastructures/criteria to the analysis. This forms the supply side mentioned in Section 3.2 (Figure 5, left). In this analysis example, only the infrastructure types relevant for the purposes of the study are selected from the categories local supply, health, and education (user and analysis preference).
- Step 4—Select age groups of the population to be considered: The user selects the population groups that need to be considered in the analysis (age of people in family formation phases and the age of children). This selection might not be relevant for all decision problems (Figure 5, right).
- Step 5—Accessibility calculation: The user specifies the mode of temporal distance calculation over the road network (car, public transport, foot), defines the distance of undersupply (for simplicity we have preset recommendations), and the weighting of the supply line as a function of distance. All values are preset and can be adjusted by the user (Figure 6, left).
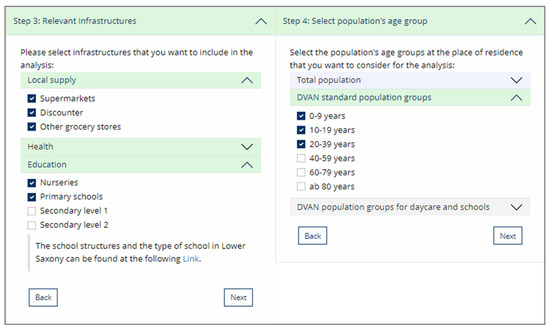
Figure 5.
Step 3 and step 4 of the user interface.
Figure 5.
Step 3 and step 4 of the user interface.
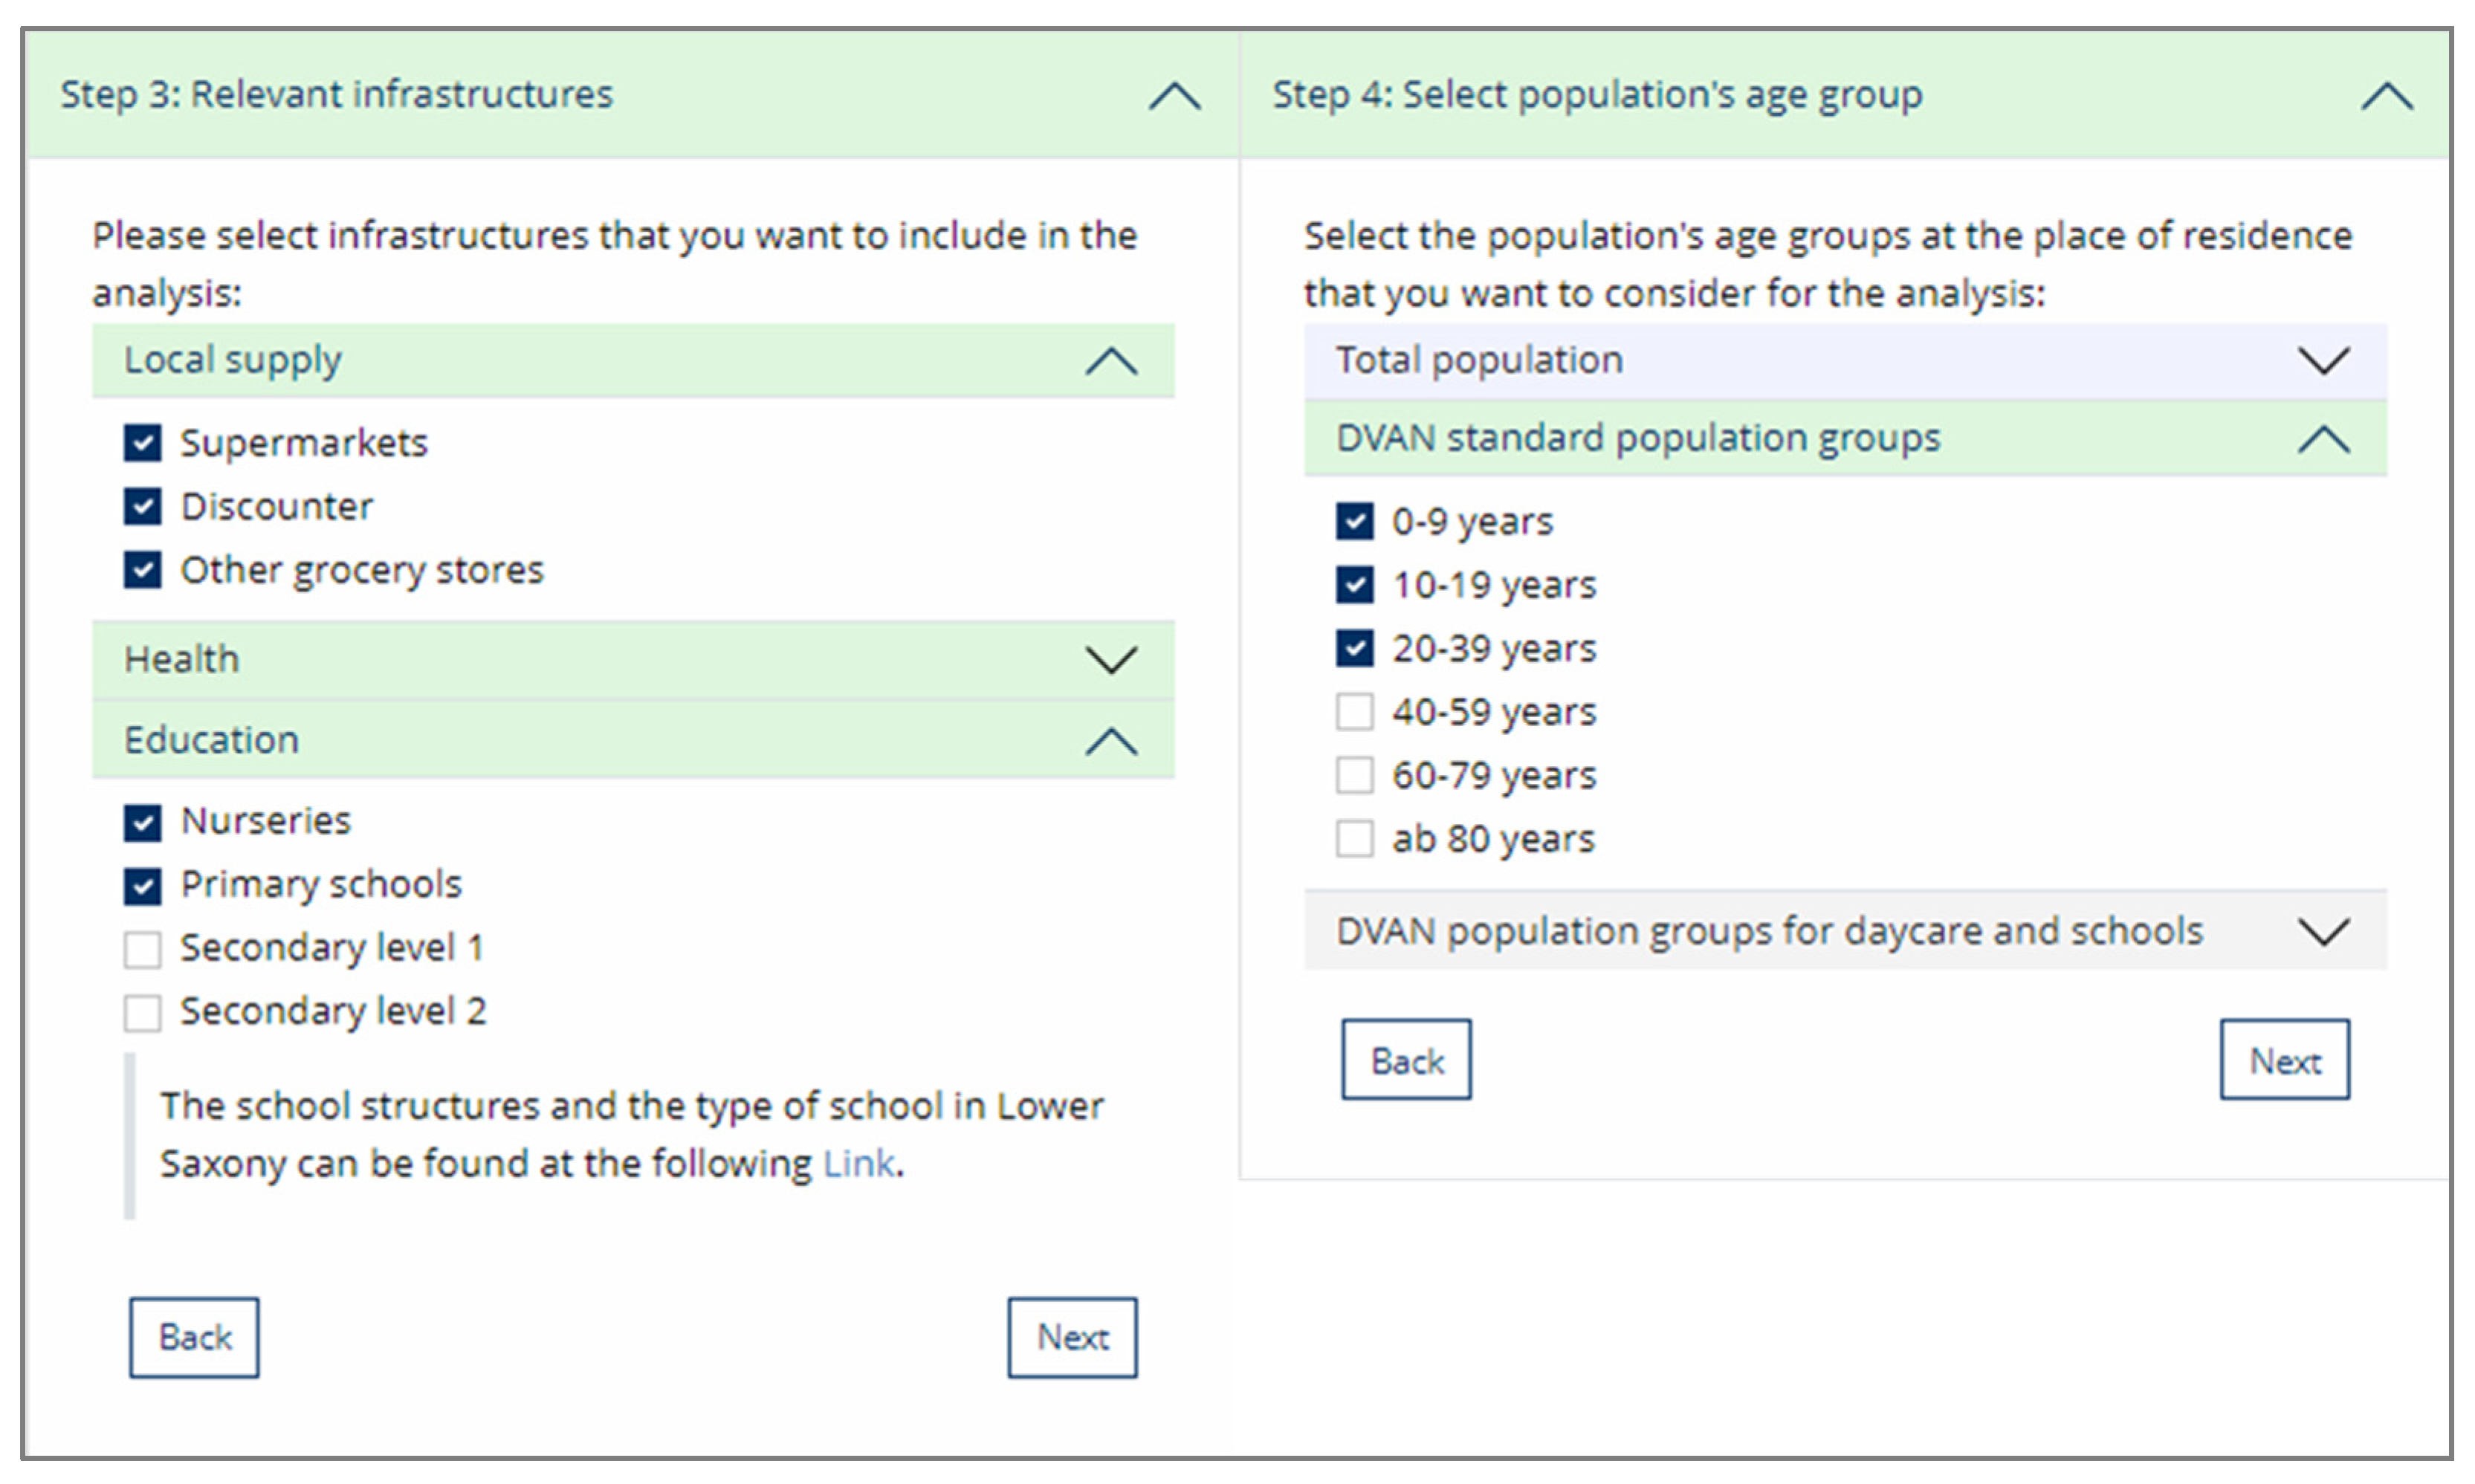
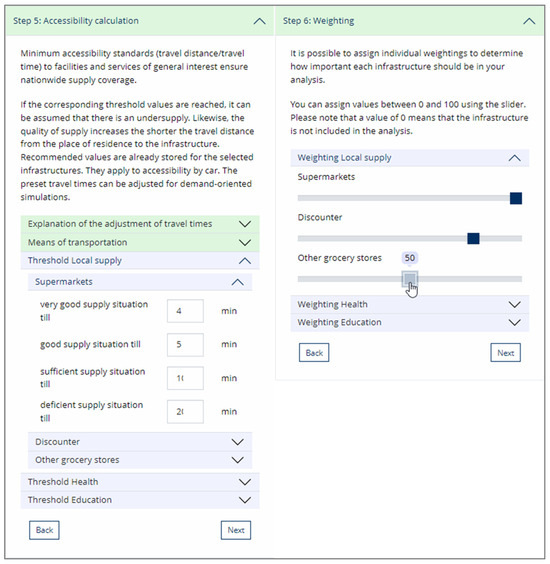
Figure 6.
Step 5 and step 6 of the user interface.
Figure 6.
Step 5 and step 6 of the user interface.
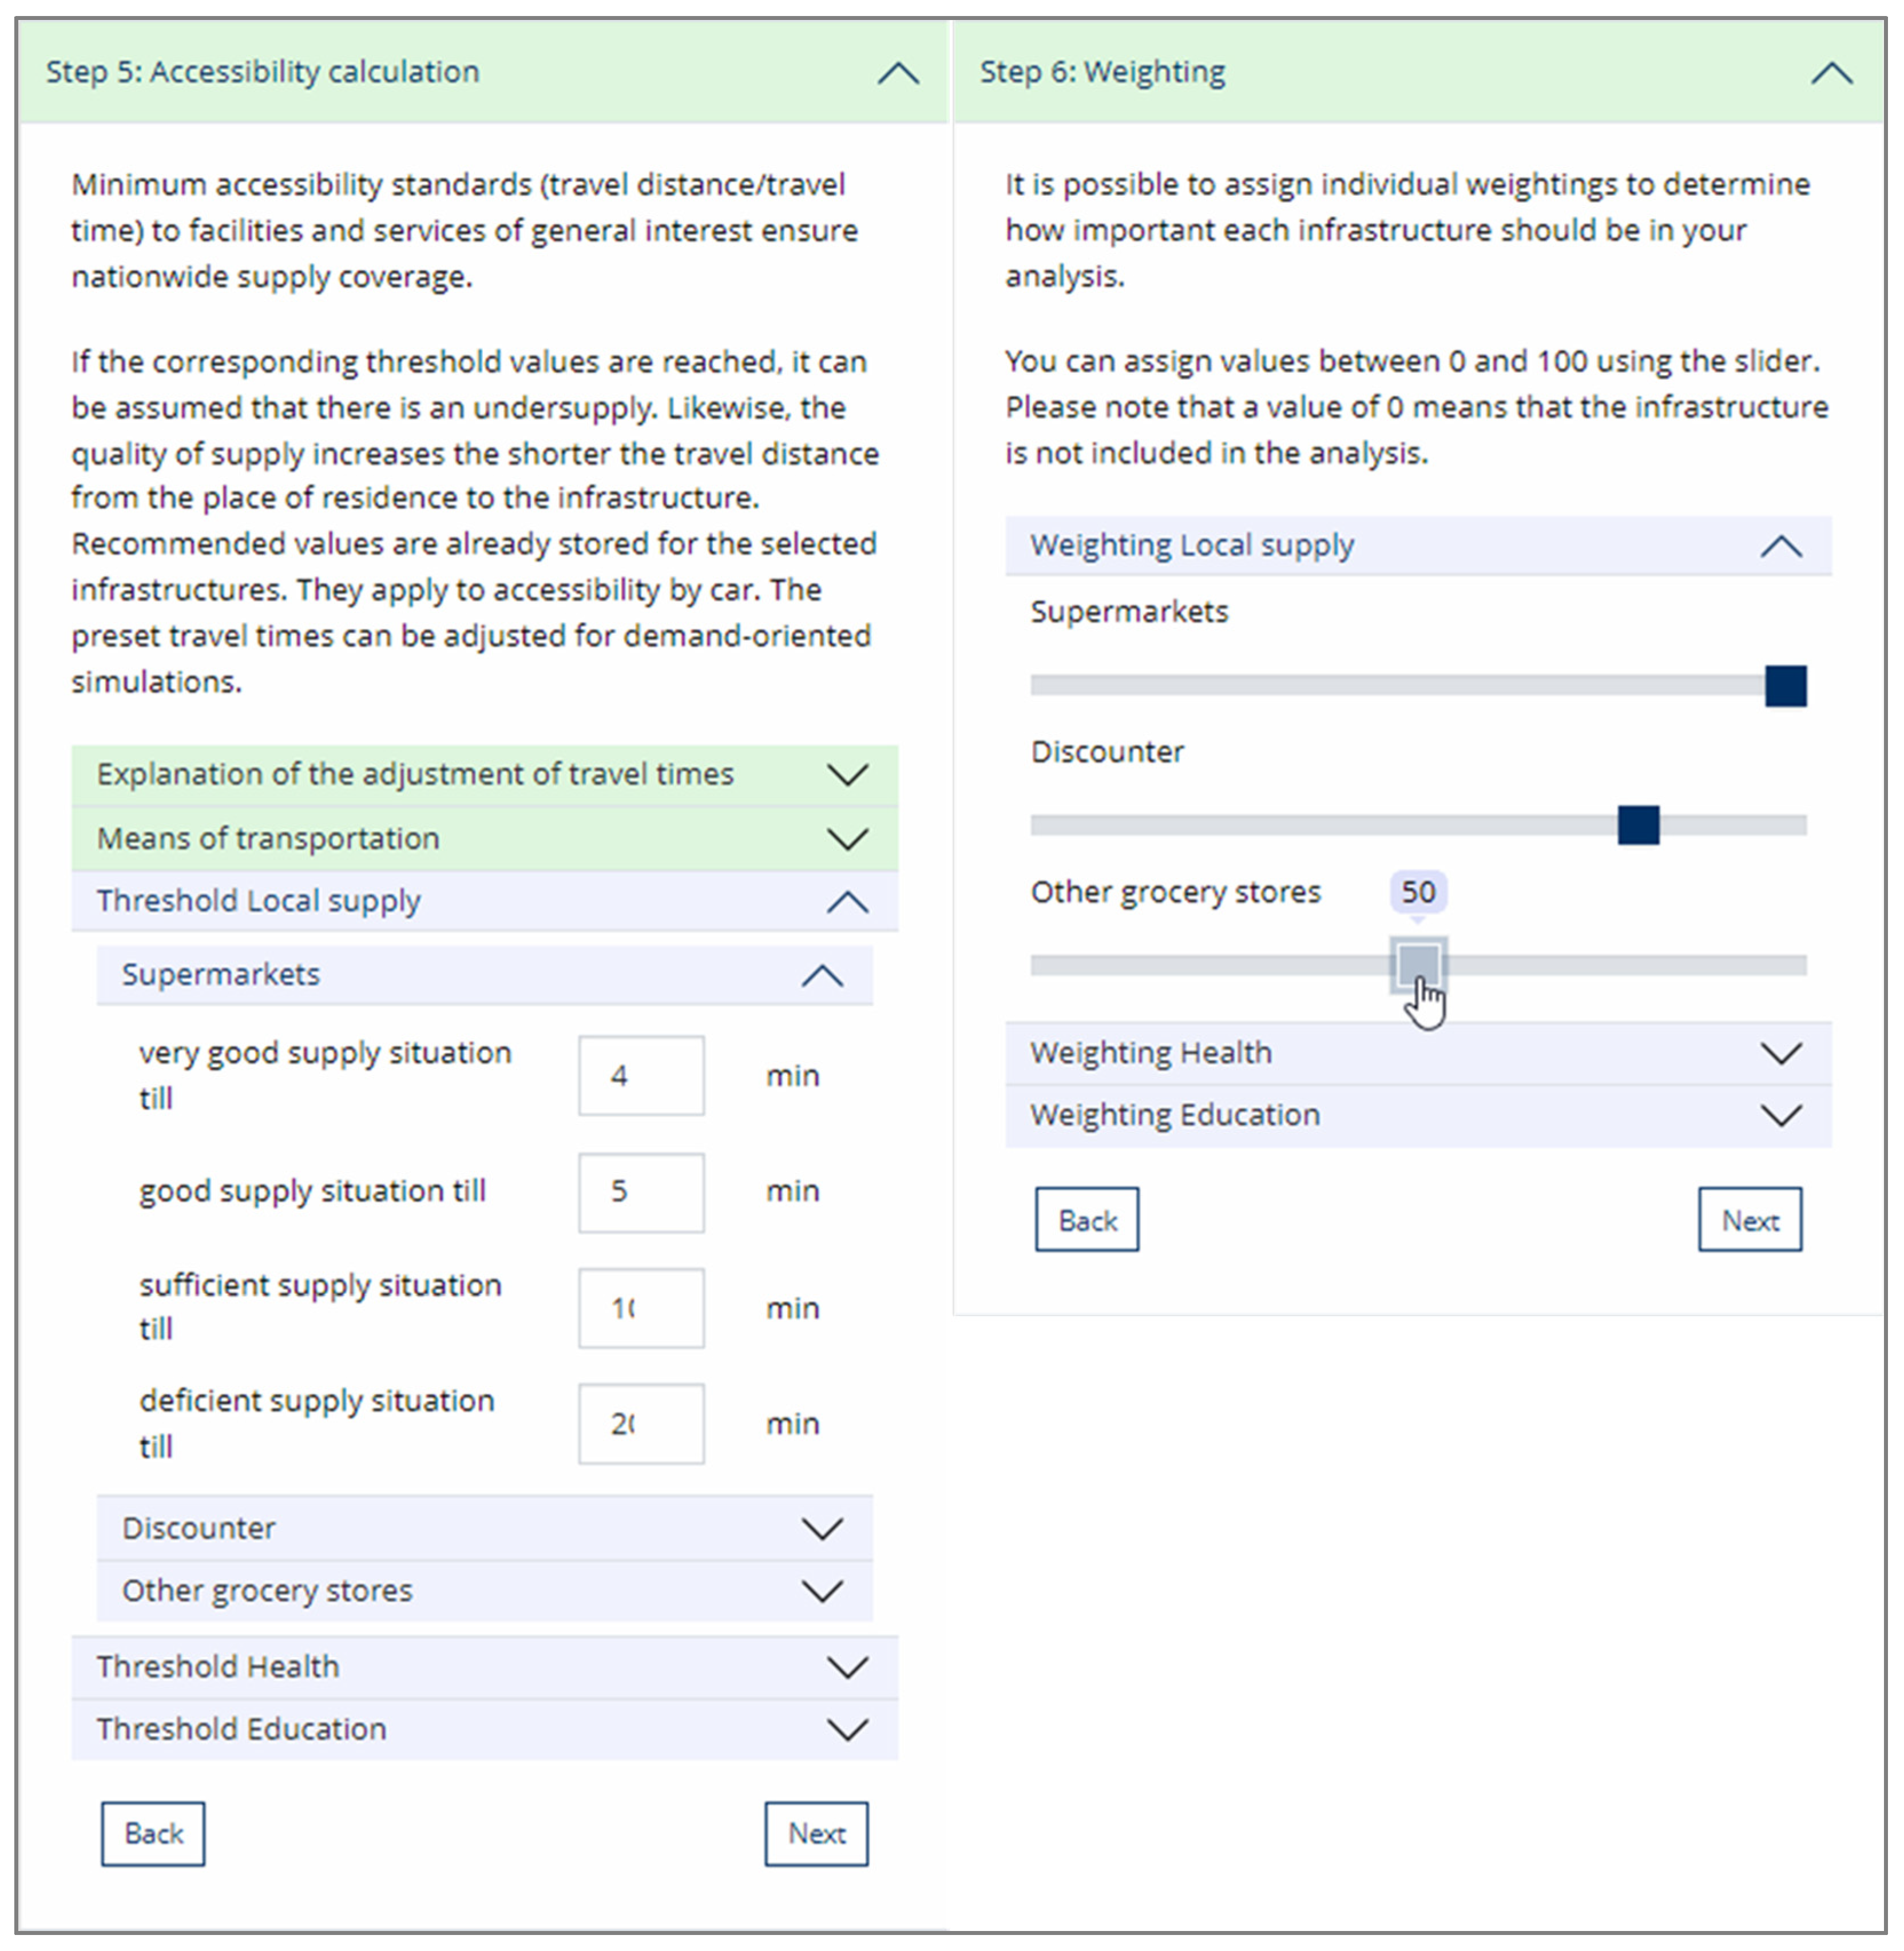
- Step 6—Weighting: The user sets the relative importance of the selected infrastructures to each other by sliders with values between 0 and 100 (Figure 6, right).
- Step 7—Summary: The user receives an overview of the settings made. After checking and possibly adjusting the parameters, the analysis can be started and the parameters are passed on to the backend (Figure 7, left).
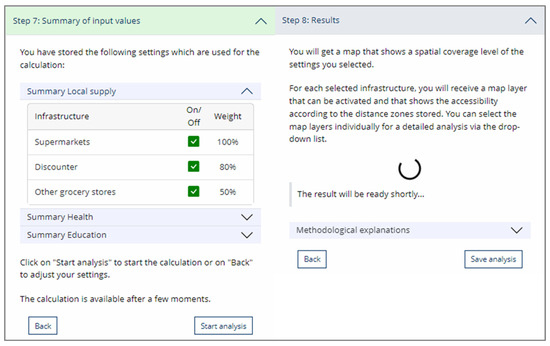 Figure 7. Step 7 and step 8 of the user interface.
 - Step 8—Results: After a calculation time of a few seconds (depending on the size of the study area; Figure 7, right) the calculation results of the entire supply situation are displayed in a 100 × 100 m grid on the map (Figure 8). It is also possible to view the map results as a heat map instead of a grid and the results of the individual infrastructures with the individual spatial weighting limits from step 5. It is easily conceivable to go back to change parameters and run the analysis again. The possibility to export parameter settings makes it possible to keep an overview of the different calculations.
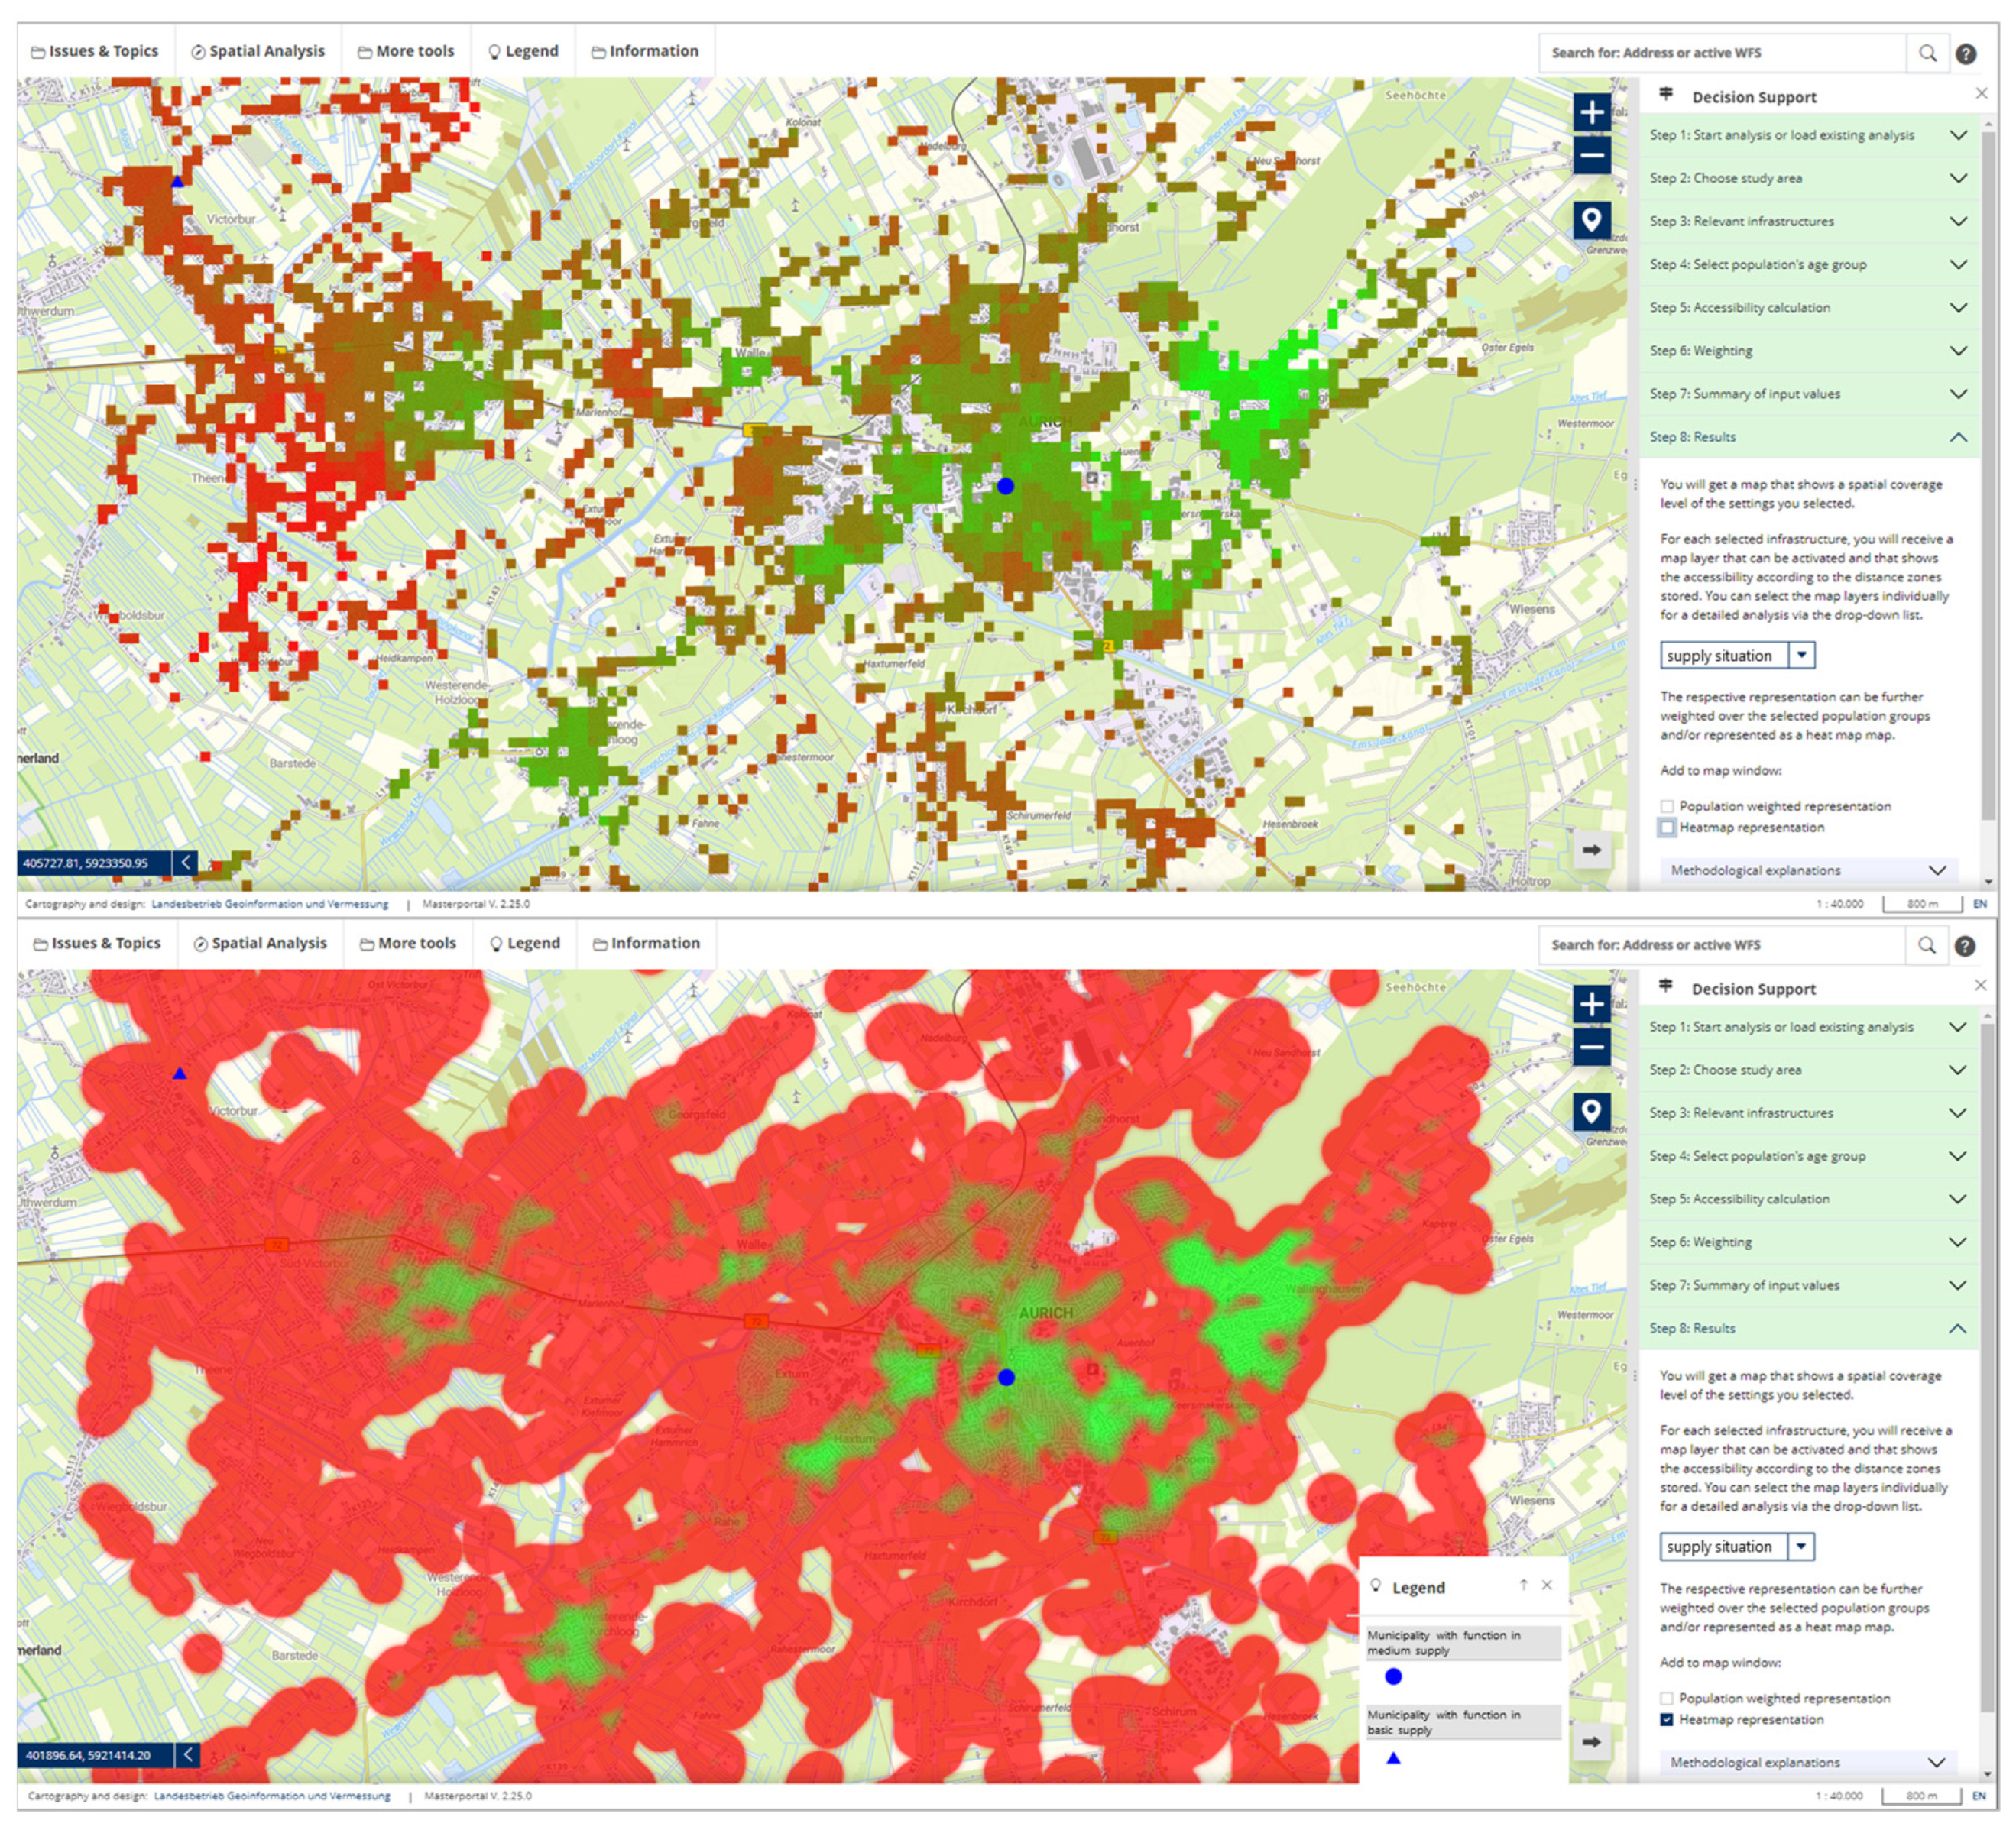
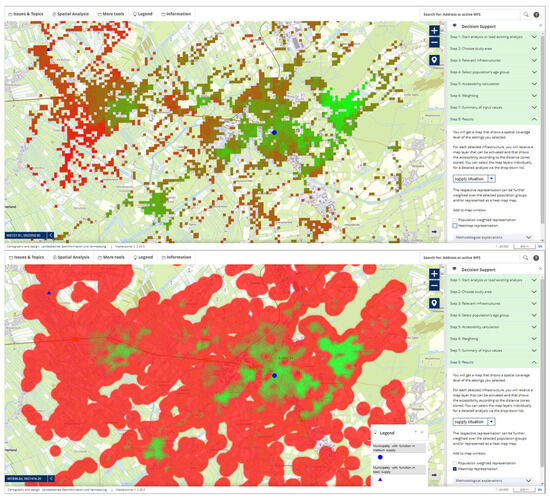 Figure 8. One of the many options for analysing the result of an area of interest. The better the suitability of the area, the stronger the shade of green. Above: criteria map of the overall result. Below: heat map showing only the suitability areas in green.
4.2. Analysis Results
The resulting map visualisation (Figure 8) can be displayed in grid cells or as a heat map. The map example in the upper part of the figure shows the supply situation according to the selected infrastructures, parameters, and restrictions in a colour ramp from green (good) to red (bad) in a grid representation with an edge length of 100 metres. A ranking of the cells can also be derived as the characteristic values of each grid feature take on values from 0 to 100. The value 100 (green) can only be reached for a cell if all selected infrastructures (step 3) from this cell have the best accessibility (step 5 has very good supply situation until 2 min). Another comparative visualisation option is the heat map, as shown in the lower part of the figure. Although values are represented much less accurately, the advantage is that spatial distribution patterns (e.g., hotspots) are better visualised. The user can switch between the two visualisations. Now, the planner has the possibility to readjust parameters in the user interface. After completing this process, the planner can identify suitable residential areas according to their preferences and model parameters. The map will help to recommend the most suitable areas. In our example of the designation of new development areas for single-family homes, these can now be located near the areas marked in green, as this is where the supply situation is best according to the settings made.
Section 4.1 and Section 4.2 presented the planning case support in the designation of settlement areas. However, we would also like to use Figure 8 to establish a link to the use case review of basic and (partly) centralised provision. In the figure, we have used a blue symbol to represent municipalities with function in medium supply (circle) and municipality’s with function in basic supply (triangle). As can be seen in the map, the location, which from a planning perspective should fulfil the function of basic supply, is valued in practice (or at least in the analysis) with a rather low supply performance. In this context, other municipalities that have not been designated as “central” in planning appear to be better connected in terms of supply (in this case better connected to discount stores, supermarkets, pharmacies, general practitioners, kindergartens, primary schools). Planners tasked with this analysis would certainly define different parameters, criteria, and distance weightings for the accessibility of infrastructure. The statement may therefore not hold up to specialist viewpoints. With this example, however, we want to demonstrate the technical and analytical possibilities. The aim is to demonstrate the methodological diversity thanks to flexible customisation options. The example thus serves as a showcase for the developed tool, which is useful for a wide range of applications in the spatial planning context.
5. Conclusions
This paper presents a novel approach to public service planning that combines MCDA with GIS customised for web applications. This integration is characterised by its potential to improve decision-making processes in the provision of public services, as it provides a user-friendly interface that does not require in-depth technical knowledge.
The introduced MC-SDSS allows for planners to independently analyse complex decision problems in public services with a centrally provided web system. A major advantage of the online system is that the planners no longer have to spend time on preliminary data search and integration or build complex methods and models themselves. The application gives users many options to select criteria and make adjustments without having to be an expert in data handling, GIS, or decision support systems. The user interface guides through the well-structured process and the setting options.
The efforts in the preparation of the required data and in the implementation of the software are relatively high. Therefore, the initial investment of time and technology to provide such a system within an administration is very high. However, we believe that such a tool offers strategic benefits that by far outweigh the set-up and operating costs. The efforts are worthwhile, especially if the social or political pressure due to social transformation processes (demographic change, shortage of human resources, etc.) is strong and the system is frequently used by many planners in different regions. The updating of existing data should always be performed centrally and with a high degree of automation in order to keep operating and maintenance costs as low as possible. This is also the main limitation if the system is to be transferred to another region: The availability of the data must be ensured and the initial costs are quite high in order to harmonise and integrate the data. For the planning context, the existing user setting options are so variable that no major interface adjustments need to be made in another region. Any changes in other regions that might be necessary at the user’s request would affect calculation parameters and methods. The effort required then depends on the type of change desired. The application is designed for planning issues and analyses relating to the evaluation of public services. Transferability to other issues is not considered in this application proposal.
This implementation makes it possible to determine and evaluate the supply situation in a map representation in short time (several minutes). Thanks to the MC-SDSS approach, the supply situation can be analysed according to the planner’s professional background. This enables decision makers to make the following decisions depending on the use case:
- Which areas/cities/towns/villages have the lowest supply according to the criteria set and, therefore, require funding?
- Are the designated regional supply centres for the population fulfilling their supply task, or have other centres emerged as a result of free market principles (freedom of location)?
- If new settlement areas are built, where can these be planned without having to build new infrastructures for services of general interest because existing ones can be better utilised?
The application of MCDA methods should not be explicitly understood as an exclusively technical and automatic process, and the decision should not be taken away from the responsible planners or decision makers. The task of this tool is to inform about the supply situation and to compare the situation at different locations using a criteria map.
6. Outlook
In the future, we plan to include functionalities that support the management and comparison of different (potentially fictive) planning scenarios. Further, the analysis results shall be represented in a population-weighted fashion. There are many possible solutions to address this problem, as the population weights in the grid cells are very inhomogeneous (from one to several hundred inhabitants per cell). However, to improve this functionality we have to consider the planners’ preferences, which have not yet been clarified. Furthermore, we believe that such an MC-SDSS can only be one part of a more complex analysis landscape for planners and should be complemented by further specific analysis or planning tools. Usually, it is the sole task of the state or a regional planner alone to reflect on the identified supply deficits. The infrastructural decision is often left to specific planning domains such as health planning, education planning, retail, etc. In the future, this tool could therefore be a starting point for integrating other planning domains to enable an interdisciplinary integrated planning. For the health domain, we have already proposed a planning tool providing such analysis based on the two-step floating catchment area method (2SFCA) [40]. We expect new, interesting use cases for the spectrum of public services planning by joining web-DSSS and 2SFCA with more location-allocation-based components, as has been performed in [41].
Author Contributions
Conceptualization, F.K. and S.M.; methodology, F.K.; software, F.K., P.H. and E.B.; formal analysis, F.K. and P.H.; investigation, F.K.; resources, F.K.; data curation, F.K.; writing—original draft preparation, F.K.; writing—review and editing, S.M.; visualization, F.K.; supervision, S.M.; project administration, S.M. and F.K.; funding acquisition, S.M. All authors have read and agreed to the published version of the manuscript.
Funding
This research was funded by Lower Saxony Ministry of the Interior and Sport and the Lower Saxony Ministry of Federal and European Affairs and Regional Development.
Institutional Review Board Statement
Not applicable.
Informed Consent Statement
Not applicable.
Data Availability Statement
3rd Party Data: Restrictions apply to the availability of these data. Data was obtained from Lower Saxony Ministry of Federal and European Affairs and Regional Development. Access to the data can be requested via the Ministry. Please contact us via the authors’ correspondence address.
Conflicts of Interest
The authors declare no conflicts of interest. The funders had no role in the design of the study; in the collection, analyses, or interpretation of data; in the writing of the manuscript; or in the decision to publish the results.
References
- de Wenden, C.W. The Future European Union Facing Migration. In The New Generations of Europeans: Demography and Families in the Enlarged European Union; Lutz, W., Ed.; Taylor and Francis: Hoboken, NJ, USA, 2010; pp. 247–256. ISBN 9781849775915. [Google Scholar]
- Cordón, J.A.F. Low Fertility and the Scope for Social Policy: Understanding the Context. In The New Generations of Europeans: Demography and Families in the Enlarged European Union; Lutz, W., Ed.; Taylor and Francis: Hoboken, NJ, USA, 2010; pp. 29–55. ISBN 9781849775915. [Google Scholar]
- Nübel, K.; Bühler, M.M.; Jelinek, T. Federated Digital Platforms: Value Chain Integration for Sustainable Infrastructure Planning and Delivery. Sustainability 2021, 13, 8996. [Google Scholar] [CrossRef]
- Malczewski, J. Multiple Criteria Decision Analysis and Geographic Information Systems. In Trends in Multiple Criteria Decision Analysis; Ehrgott, M., Figueira, J.R., Greco, S., Eds.; Springer: Boston, MA, USA, 2010; pp. 369–395. ISBN 978-1-4419-5903-4. [Google Scholar]
- Belton, V.; Stewart, T. Problem Structuring and Multiple Criteria Decision Analysis. In Trends in Multiple Criteria Decision Analysis; Ehrgott, M., Figueira, J.R., Greco, S., Eds.; Springer: Boston, MA, USA, 2010; pp. 209–239. ISBN 978-1-4419-5903-4. [Google Scholar]
- Keeney, R.L.; Raiffa, H. Decisions with Multiple Objectives: Preferences and Value Trade-Offs; Cambridge University Press: Cambridge, UK; New York, NY, USA; Melbourne, Australia, 1993; ISBN 0521438837. [Google Scholar]
- Malczewski, J.; Rinner, C. (Eds.) Multicriteria Decision Analysis in Geographic Information Science; Springer: Berlin/Heidelberg, Germany, 2015; ISBN 978-3-540-74756-7. [Google Scholar]
- Ishizaka, A.; Nemery, P. Multi-Criteria Decision Analysis: Methods and Software; Wiley: Hoboken, NJ, USA, 2013; ISBN 9781119974079. [Google Scholar]
- Blagojević, B.; Lundqvist, R.; Björheden, R.; Nordström, E.-M.; Lindroos, O. Subject review Multi-Criteria Decision Analysis (MCDA) in Forest Operations—An Introductional Review. Croat. J. For. Eng. 2019, 40, 191–205. [Google Scholar]
- Mühlbacher, A.C.; Kaczynski, A. Making Good Decisions in Healthcare with Multi-Criteria Decision Analysis: The Use, Current Research and Future Development of MCDA. Appl. Health Econ. Health Policy 2016, 14, 29–40. [Google Scholar] [CrossRef] [PubMed]
- Abdullah, M.F.; Siraj, S.; Hodgett, R.E. An Overview of Multi-Criteria Decision Analysis (MCDA) Application in Managing Water-Related Disaster Events: Analyzing 20 Years of Literature for Flood and Drought Events. Water 2021, 13, 1358. [Google Scholar] [CrossRef]
- Malczewski, J. GIS-based multicriteria decision analysis: A survey of the literature. Int. J. Geogr. Inf. Sci. 2006, 20, 703–726. [Google Scholar] [CrossRef]
- Nobrega, R.; O’Hara, C.G.; Sadasivuni, R.; Dumas, J. Bridging decision-making process and environmental needs in corridor planning. Manag. Environ. Qual. 2009, 20, 622–637. [Google Scholar] [CrossRef]
- Vogel, R. GIS-basierte multikriterielle Bewertung der Retentionseignung von Auenflächen—Am Beispiel der Elbe. Ph.D. Thesis, The University of Rostock, Rostock, Germany, 2010. [Google Scholar]
- Sarfo, A.K.; Karuppannan, S. Application of Geospatial Technologies in the COVID-19 Fight of Ghana. Trans. Indian Natl. Acad. Eng. 2020, 5, 193–204. [Google Scholar] [CrossRef]
- De Souza, M.F.; Pinto, P.H.G.; Teixeira, R.B.A.; Nascimento, C.d.O.L.; Nóbrega, R.A.d.A. Dry port location optimization to foster sustainable regional development. Sustentabilidade Debate 2020, 11, 208–237. [Google Scholar] [CrossRef]
- Ajibade, F.O.; Ajibade, T.F.; Idowu, T.E.; Nwogwu, N.A.; Adelodun, B.; Lasisi, K.H.; Opafola, O.T.; Ajala, O.A.; Fadugba, O.G.; Adewumi, J.R. Flood-prone area mapping using GIS -based analytical hierarchy frameworks for Ibadan city, Nigeria. J. Multi-Criteria Decis. Anal. 2021, 28, 283–295. [Google Scholar] [CrossRef]
- Devarakonda, P.; Sadasivuni, R.; Nobrega, R.A.A.; Wu, J. Application of spatial multicriteria decision analysis in healthcare: Identifying drivers and triggers of infectious disease outbreaks using ensemble learning. J. Multi-Criteria Decis. Anal. 2021, 29, 23–36. [Google Scholar] [CrossRef]
- Zolfaghary, P.; Zakerinia, M.; Kazemi, H. A model for the use of urban treated wastewater in agriculture using multiple criteria decision making (MCDM) and geographic information system (GIS). Agric. Water Manag. 2021, 243, 106490. [Google Scholar] [CrossRef]
- Malczewski, J.; Jankowski, P. Emerging trends and research frontiers in spatial multicriteria analysis. Int. J. Geogr. Inf. Sci. 2020, 34, 1257–1282. [Google Scholar] [CrossRef]
- Lotov, A.V. Internet tools for supporting of lay stakeholders in the framework of the democratic paradigm of environmental decision making. J. Multi-Criteria Decis. Anal. 2003, 12, 145–162. [Google Scholar] [CrossRef]
- Ostländer, N. Creating Specific Decision Support Systems in Spatial Data Infrastructures: An Approach for Conceptualisation, Design and Implementation. Ph.D. Thesis, Wästfälische Wilhelms-Universität Münster, Münster, Germany, 2008. [Google Scholar]
- Markieta, M.; Rinner, C. Using Distributed Map Overlay and Layer Opacity for Visual Multi-Criteria Analysis. Geomatica 2014, 68, 95–105. [Google Scholar] [CrossRef]
- Dowie, J.; Kjer Kaltoft, M.; Salkeld, G.; Cunich, M. Towards generic online multicriteria decision support in patient-centred health care. Health Expect. 2015, 18, 689–702. [Google Scholar] [CrossRef]
- Franch-Pardo, I.; Desjardins, M.R.; Barea-Navarro, I.; Cerdà, A. A review of GIS methodologies to analyze the dynamics of COVID-19 in the second half of 2020. Trans. GIS 2021, 25, 2191–2239. [Google Scholar] [CrossRef] [PubMed]
- Kamel Boulos, M.N.; Geraghty, E.M. Geographical tracking and mapping of coronavirus disease COVID-19/severe acute respiratory syndrome coronavirus 2 (SARS-CoV-2) epidemic and associated events around the world: How 21st century GIS technologies are supporting the global fight against outbreaks and epidemics. Int. J. Health Geogr. 2020, 19, 8. [Google Scholar] [CrossRef]
- Ghilardi, A.; Ruiz-Mercado, I.; Navarrete, A.; Sturdivant, E.; Velasco-Segura, R.; Orozco, A.; Franch-Pardo, I.; Larrazába, A.; Gascón, M.; Teutle Ixehuat, C.; et al. Plataforma de información geográfica de la UNAM sobre COVID-19 en México. BioTecnología 2020, 24, 39–53. [Google Scholar]
- Blätgen, N.; Milbert, A. Analysen raumzeitlicher Ausbreitungsmuster von COVID-19 mit Corona Regional, dem Analysetool des BBSR. Stadtforsch. Stat. Z. Des Verb. Dtsch. Städtestatistiker 2021, 34, 2–7. [Google Scholar]
- Requia, W.J.; Kondo, E.K.; Adams, M.D.; Gold, D.R.; Struchiner, C.J. Risk of the Brazilian health care system over 5572 municipalities to exceed health care capacity due to the 2019 novel coronavirus (COVID-19). Sci. Total Environ. 2020, 730, 139144. [Google Scholar] [CrossRef]
- Maharjan, B.; Maharjan, A.; Dhakal, S.; Gadtaula, M.; Shrestha, S.B.; Adhikari, R. Geospatial mapping of COVID-19 cases, risk and agriculture hotspots in decision-making of lockdown relaxation in Nepal. Appl. Sci. Technol. Ann. 2020, 1, 1–8. [Google Scholar] [CrossRef]
- Yao, H.; Zuo, X.; Zuo, D.; Lin, H.; Huang, X.; Zang, C. Study on soybean potential productivity and food security in China under the influence of COVID-19 outbreak. Geogr. Sustain. 2020, 1, 163–171. [Google Scholar] [CrossRef]
- Milstein, A. Daseinsvorsorge. In Handwörterbuch der Stadt- und Raumentwicklung, 2018th ed.; Akademie für Raumforschung und Landesplanung: Hannover, Germany, 2018; pp. 361–373. ISBN 978-3-88838-559-9. [Google Scholar]
- Schäfer, M. Kommunalwirtschaft: Eine Gesellschaftspolitische und Volkswirtschaftliche Analyse; Springer Gabler: Wiesbaden, Germany, 2014; ISBN 978-3-658-05838-8. [Google Scholar]
- Kersten, J. Wandel der Daseinsvorsorge—Von der Gleichwertigkeit der Lebensverhältnisse zur wirtschaftlichen, sozialen und territorialen Kohäsion. In Daseinsvorsorge: Eine Gesellschaftswissenschaftliche Annäherung, 1st ed.; Neu, C., Ed.; VS Verlag für Sozialwissenschaften: Wiesbaden, Germany, 2009; pp. 22–35. ISBN 978-3-531-16627-8. [Google Scholar]
- Hecht, R.; Büttner, B.; Jehle, U.; Klaus, M.; Krügel, F.; McCormick, B.; Pajares, E.; Reiter, D.; Rieche, T.; Seisenberger, S.; et al. Erreichbarkeits- und Analyseinstrumente für die Daseinsvorsorgeplanung; Hecht, R., Büttner, B., Jehle, U., Klaus, M., Krügel, F., McCormick, B., Pajares, E., Reiter, D., Rieche, T., Seisenberger, S., et al., Eds.; Rhombos-Verlag: Berlin, Germany, 2022. [Google Scholar]
- Klaus, M.; Käker, R.; Mäs, S.; Weitkamp, A. Daseinsvorsorge sichern und überwachen: Der Daseinsvorsorge-Atlas Niedersachsen. Flächenmanag. Bodenordn. 2020, 82, 223–234. [Google Scholar]
- MasterPortal Hamburg. Available online: https://bitbucket.org/geowerkstatt-hamburg/masterportal/src/dev/ (accessed on 9 November 2023).
- Bodily, S.E. Modern Decision Making: A Guide to Modeling with Decision Support Systems; McGraw-Hill: New York, NY, USA, 1985; ISBN 9780070063600. [Google Scholar]
- HeiGIT. Openrouteservice. Available online: https://openrouteservice.org/ (accessed on 9 November 2023).
- Krügel, F.; Mäs, S. A Web-Application for Measuring Spatial Accessibility in Health Planning. Agil. GIScience Ser. 2023, 4, 1–11. [Google Scholar] [CrossRef]
- Song, Y.; Liu, L.; Xia, L. An integrated approach based on two-objective optimization and 2SFCA model for health-care facility location-allocation problems. J. Phys. Conf. Ser. 2021, 1883, 12114. [Google Scholar] [CrossRef]


Disclaimer/Publisher’s Note: The statements, opinions and data contained in all publications are solely those of the individual author(s) and contributor(s) and not of MDPI and/or the editor(s). MDPI and/or the editor(s) disclaim responsibility for any injury to people or property resulting from any ideas, methods, instructions or products referred to in the content. |
© 2024 by the authors. Licensee MDPI, Basel, Switzerland. This article is an open access article distributed under the terms and conditions of the Creative Commons Attribution (CC BY) license (https://creativecommons.org/licenses/by/4.0/).