Detecting Multiple Mixed Bacteria Using Dual-Mode Hyperspectral Imaging and Deep Neural Networks
Abstract
:1. Introduction
2. Materials and Methods
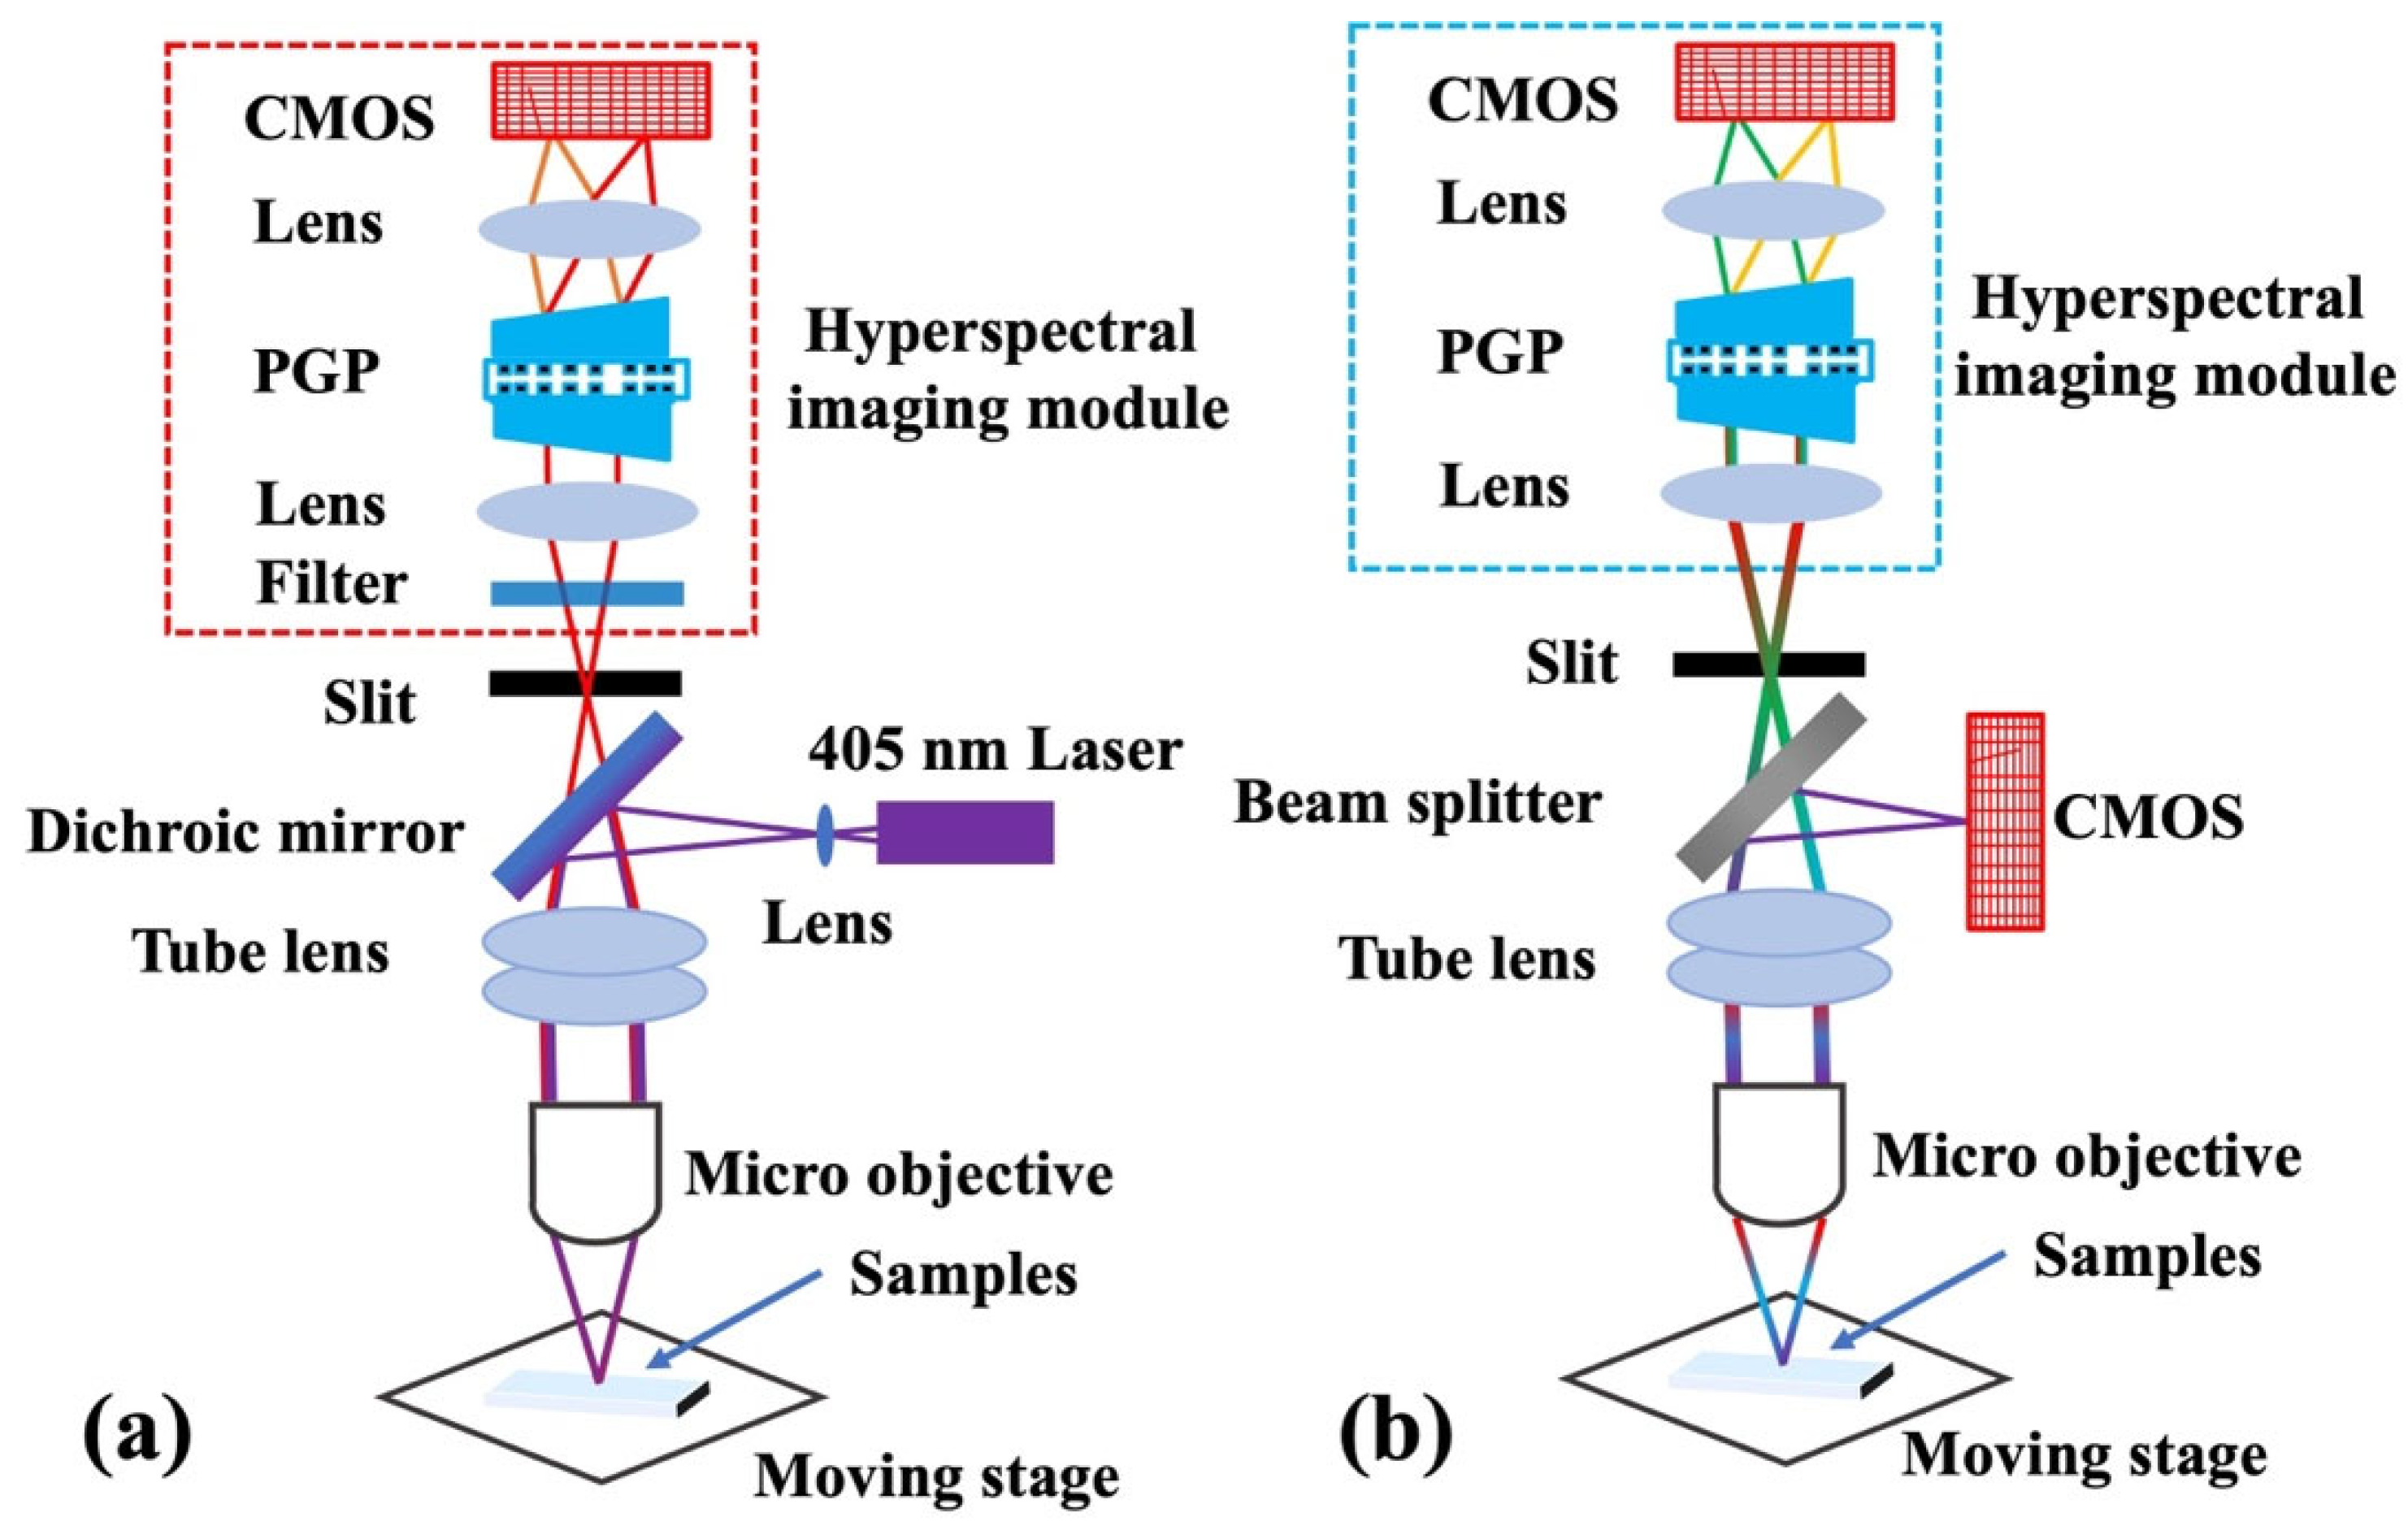
2.1. System Setup and Calibration
2.2. Sample Preparation
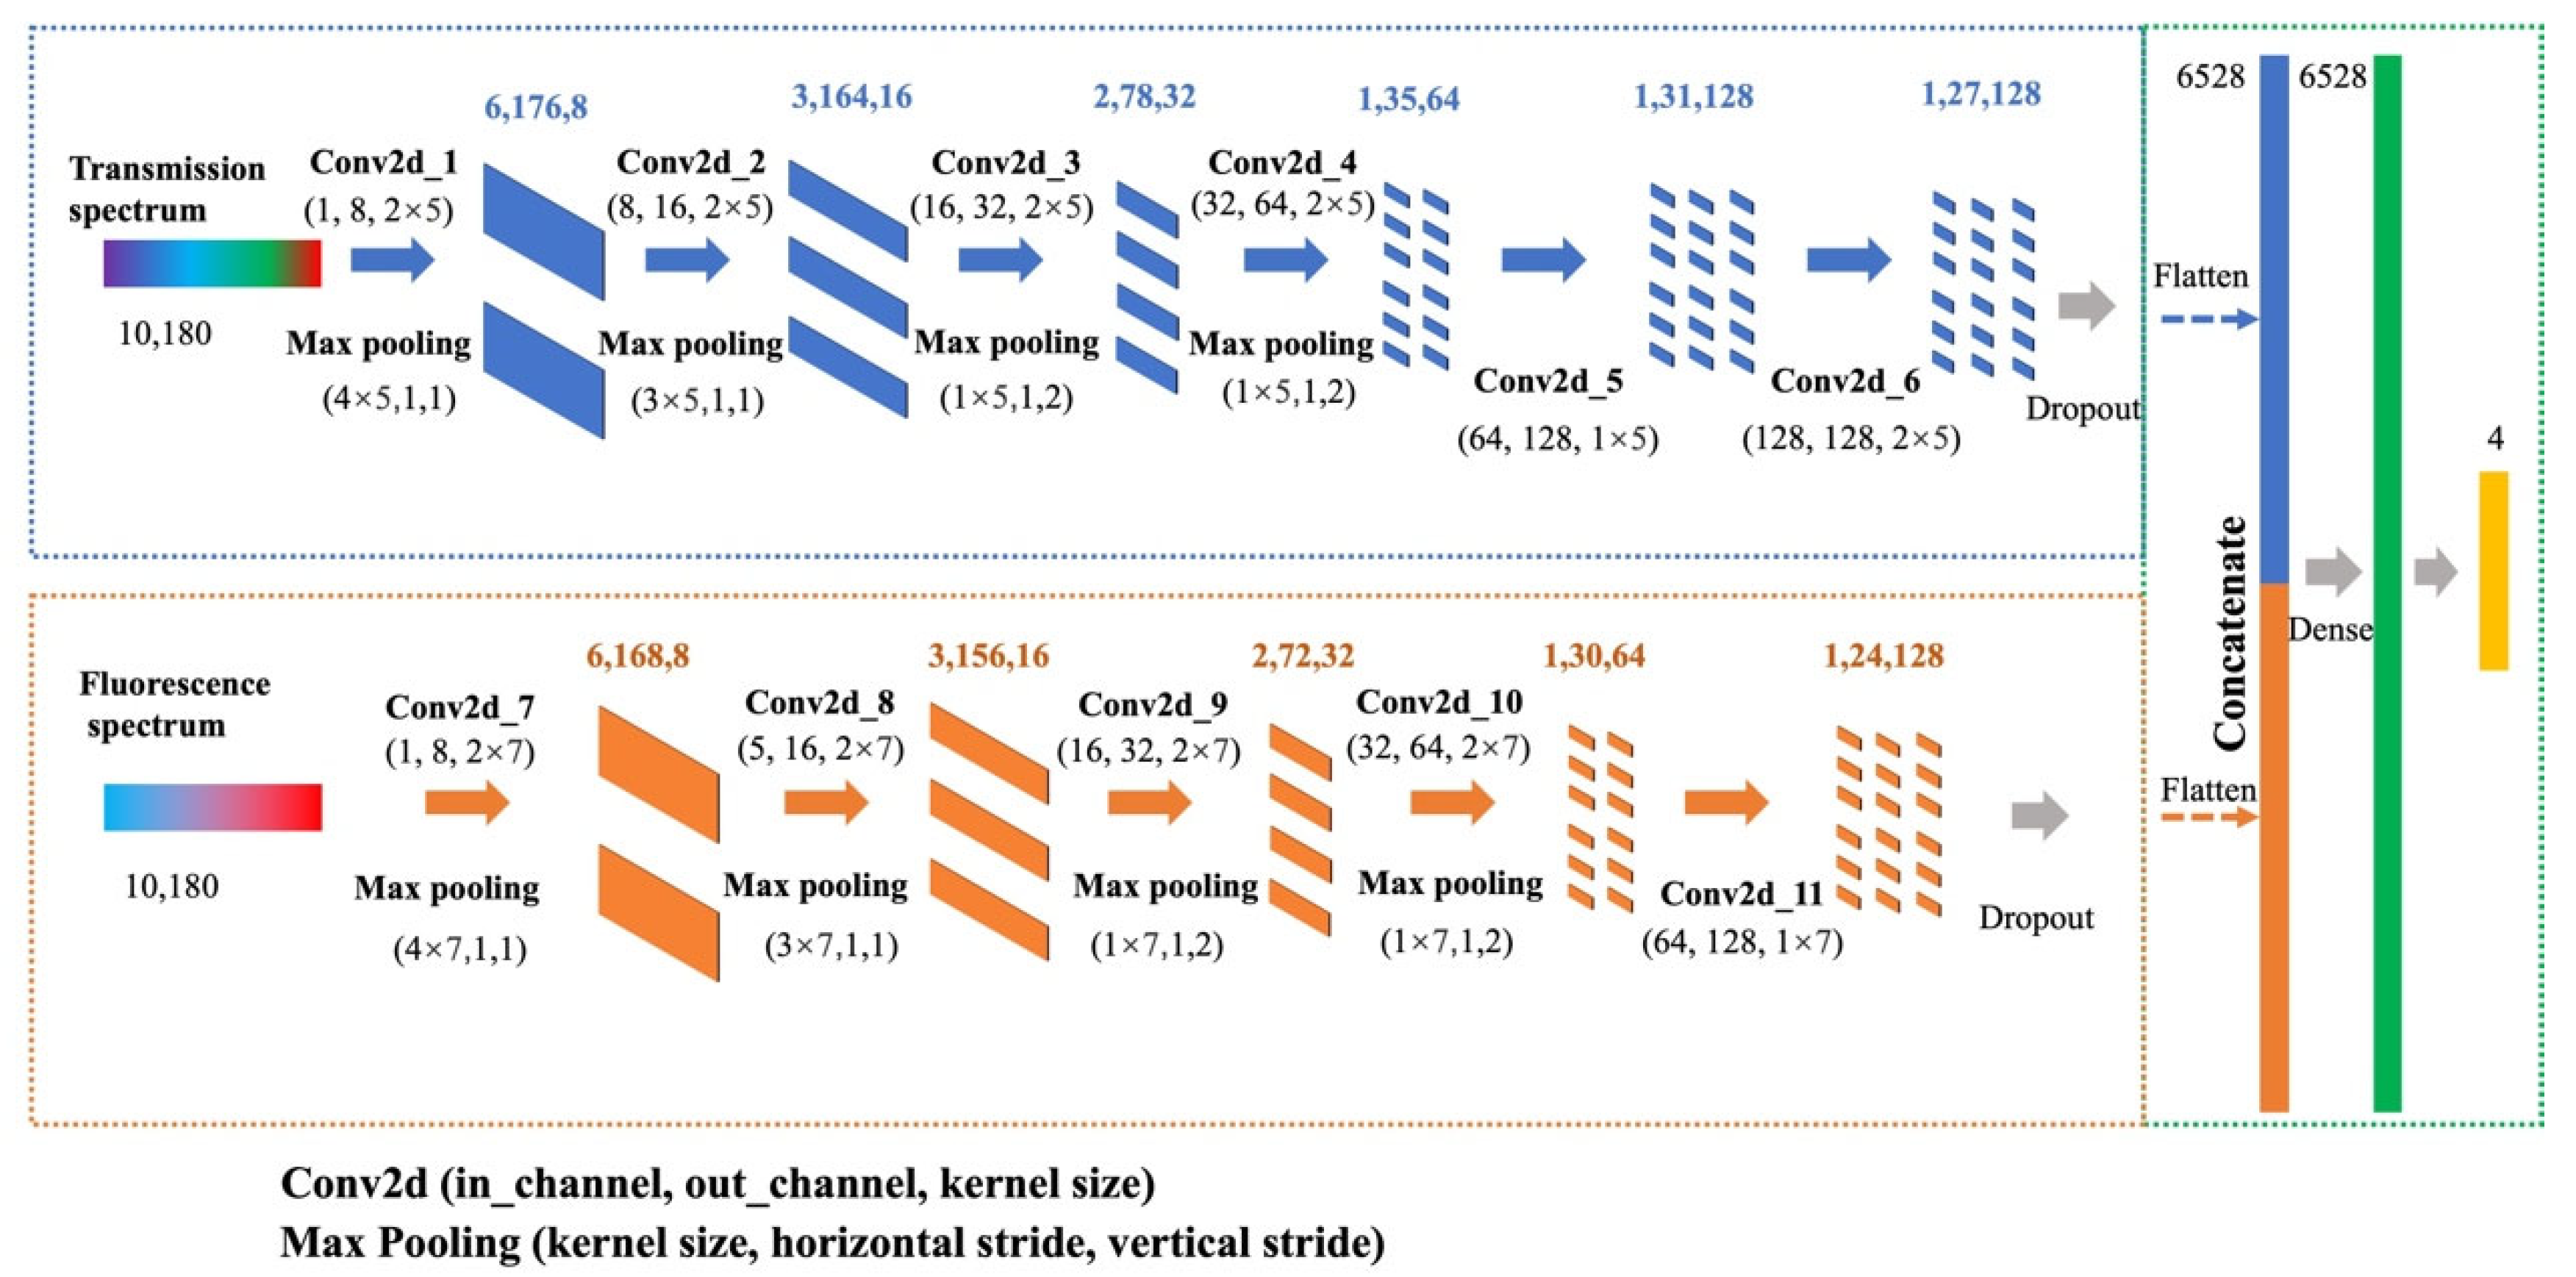
2.3. Deep Learning Architecture
3. Results and Discussion
3.1. Spectral Analysis of Multiple Mixed Bacteria
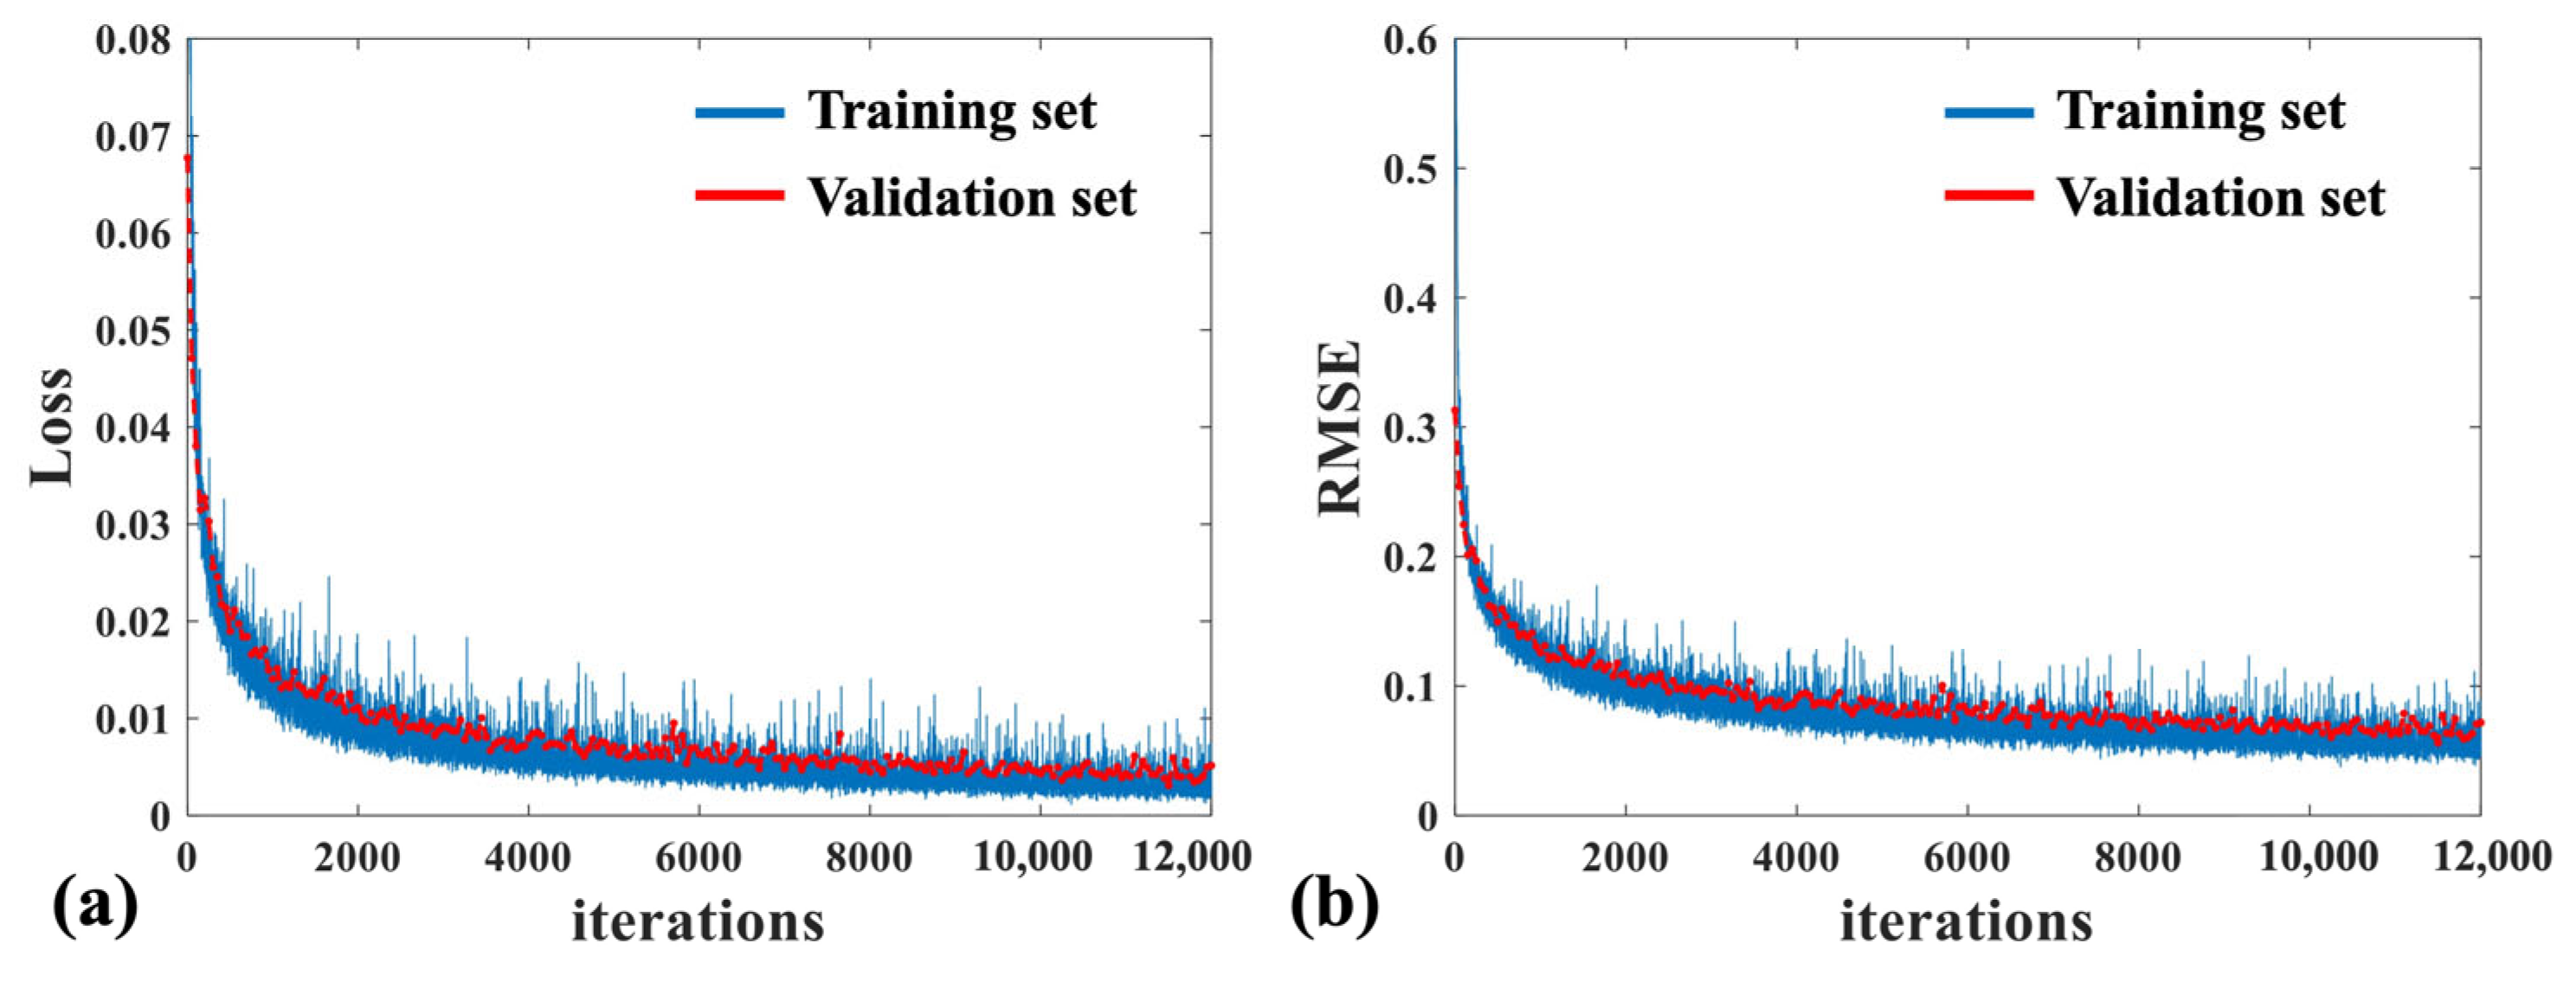
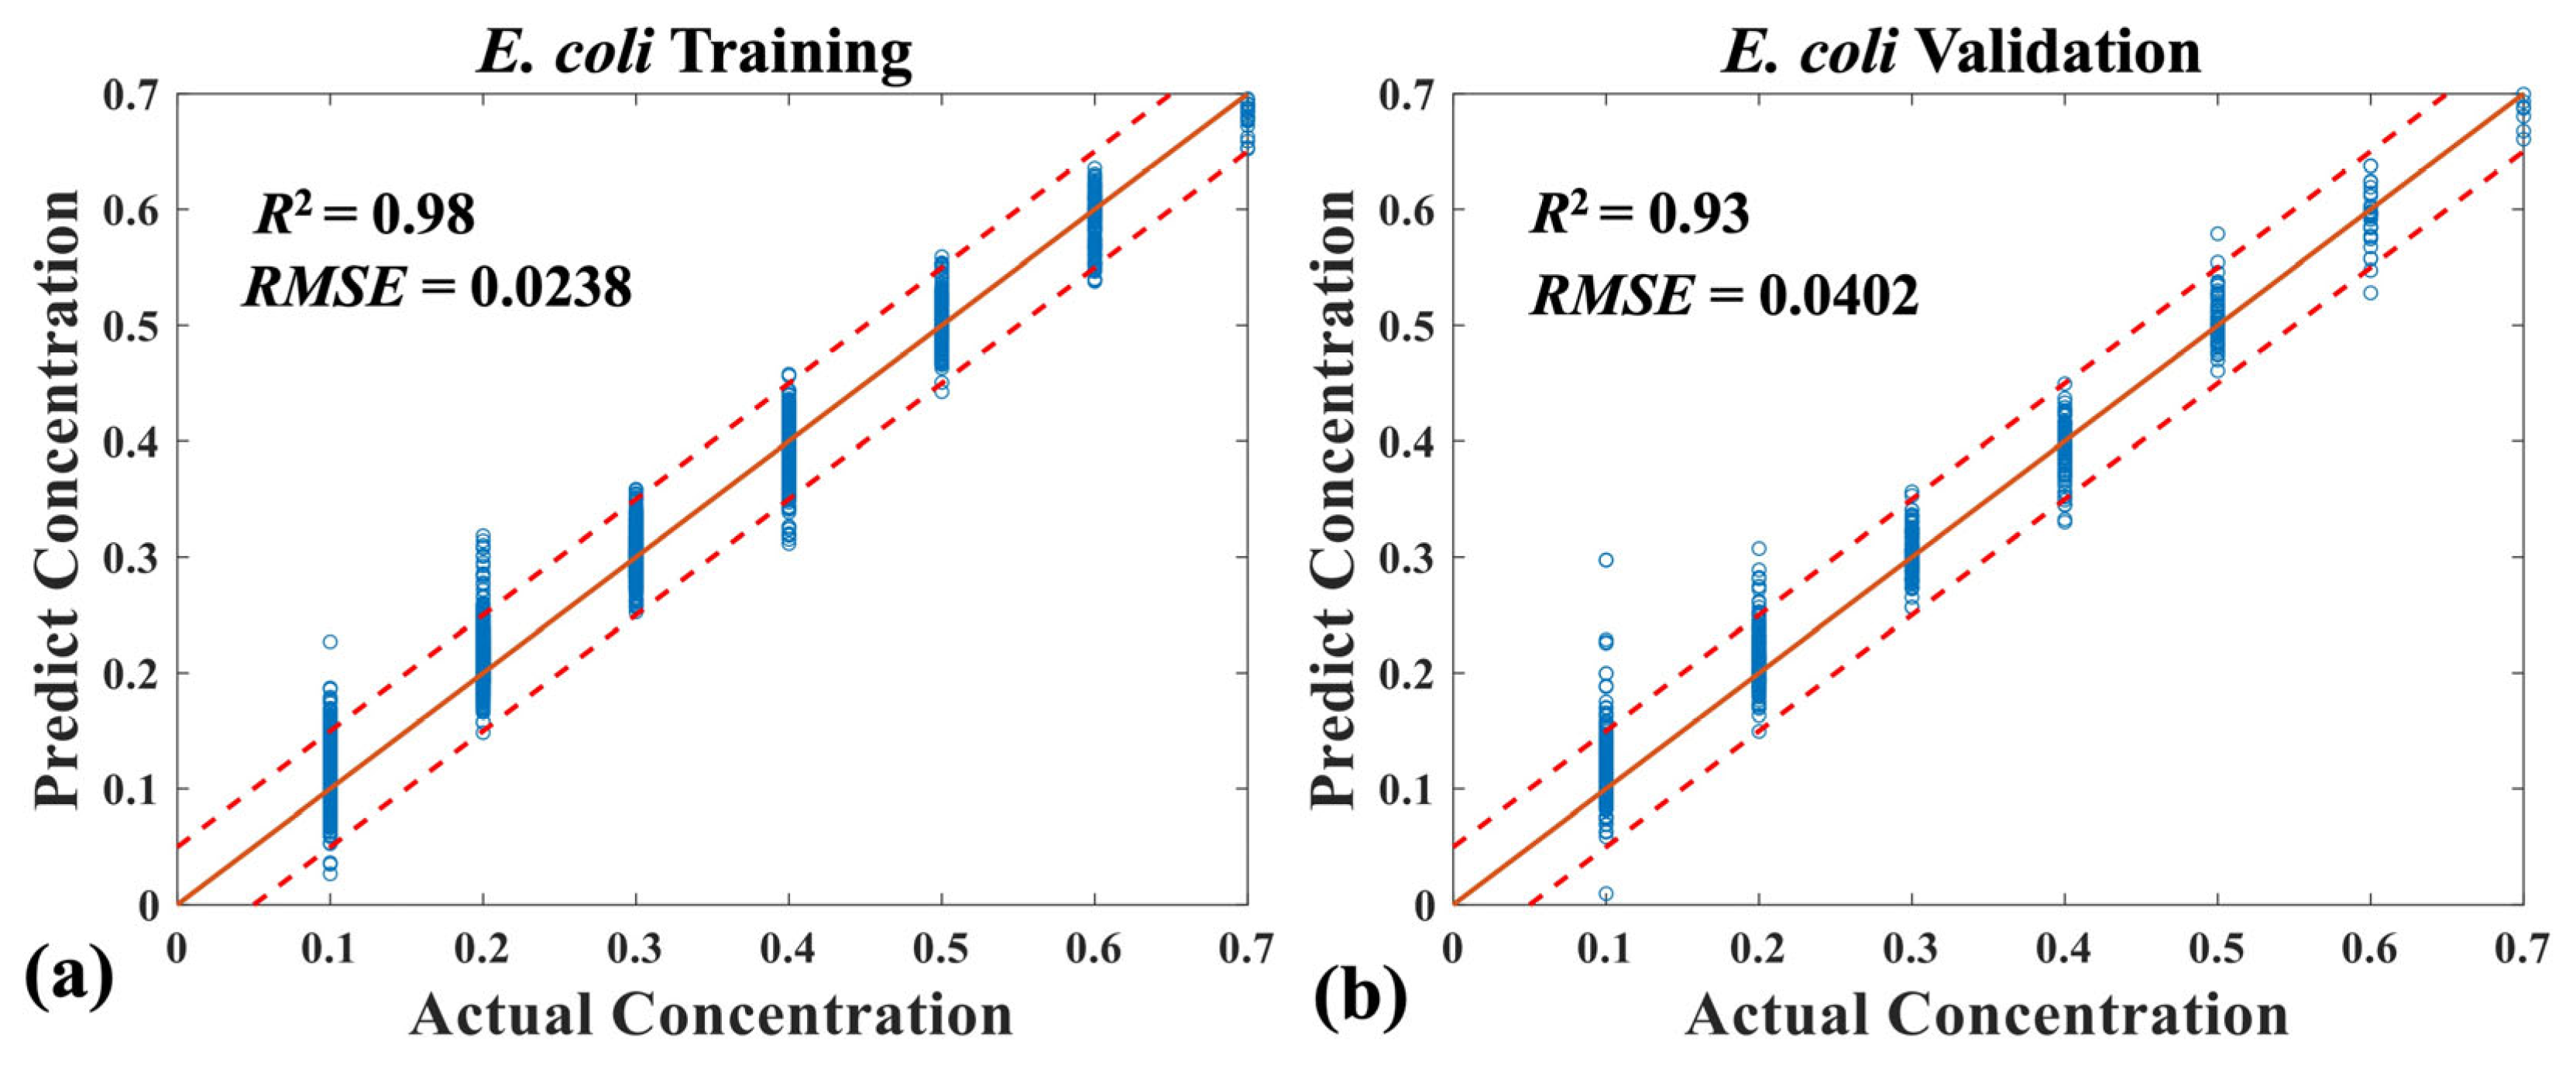
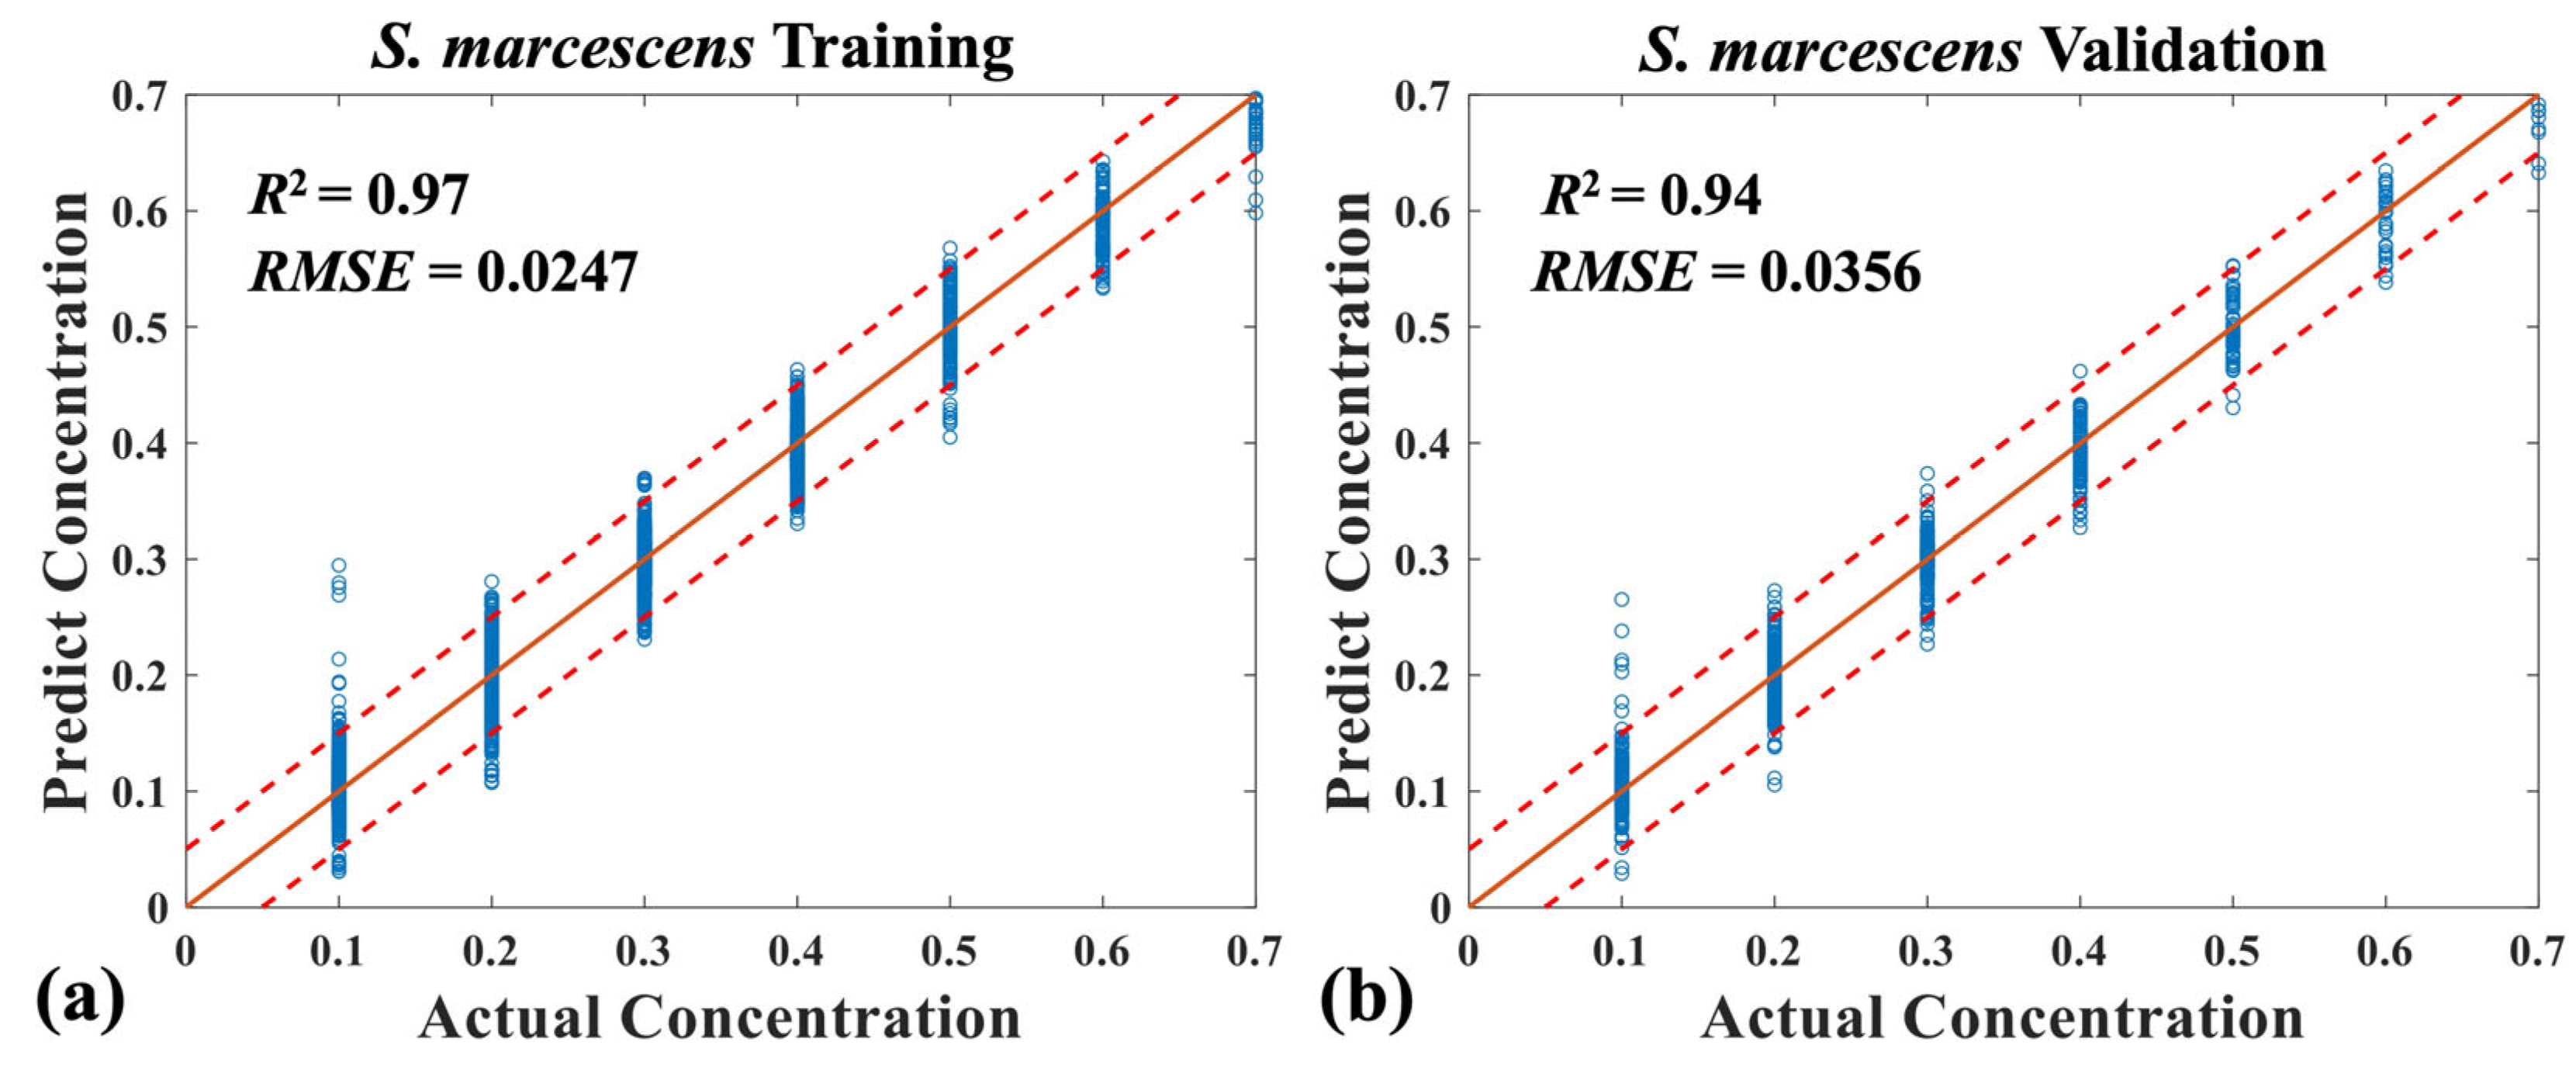
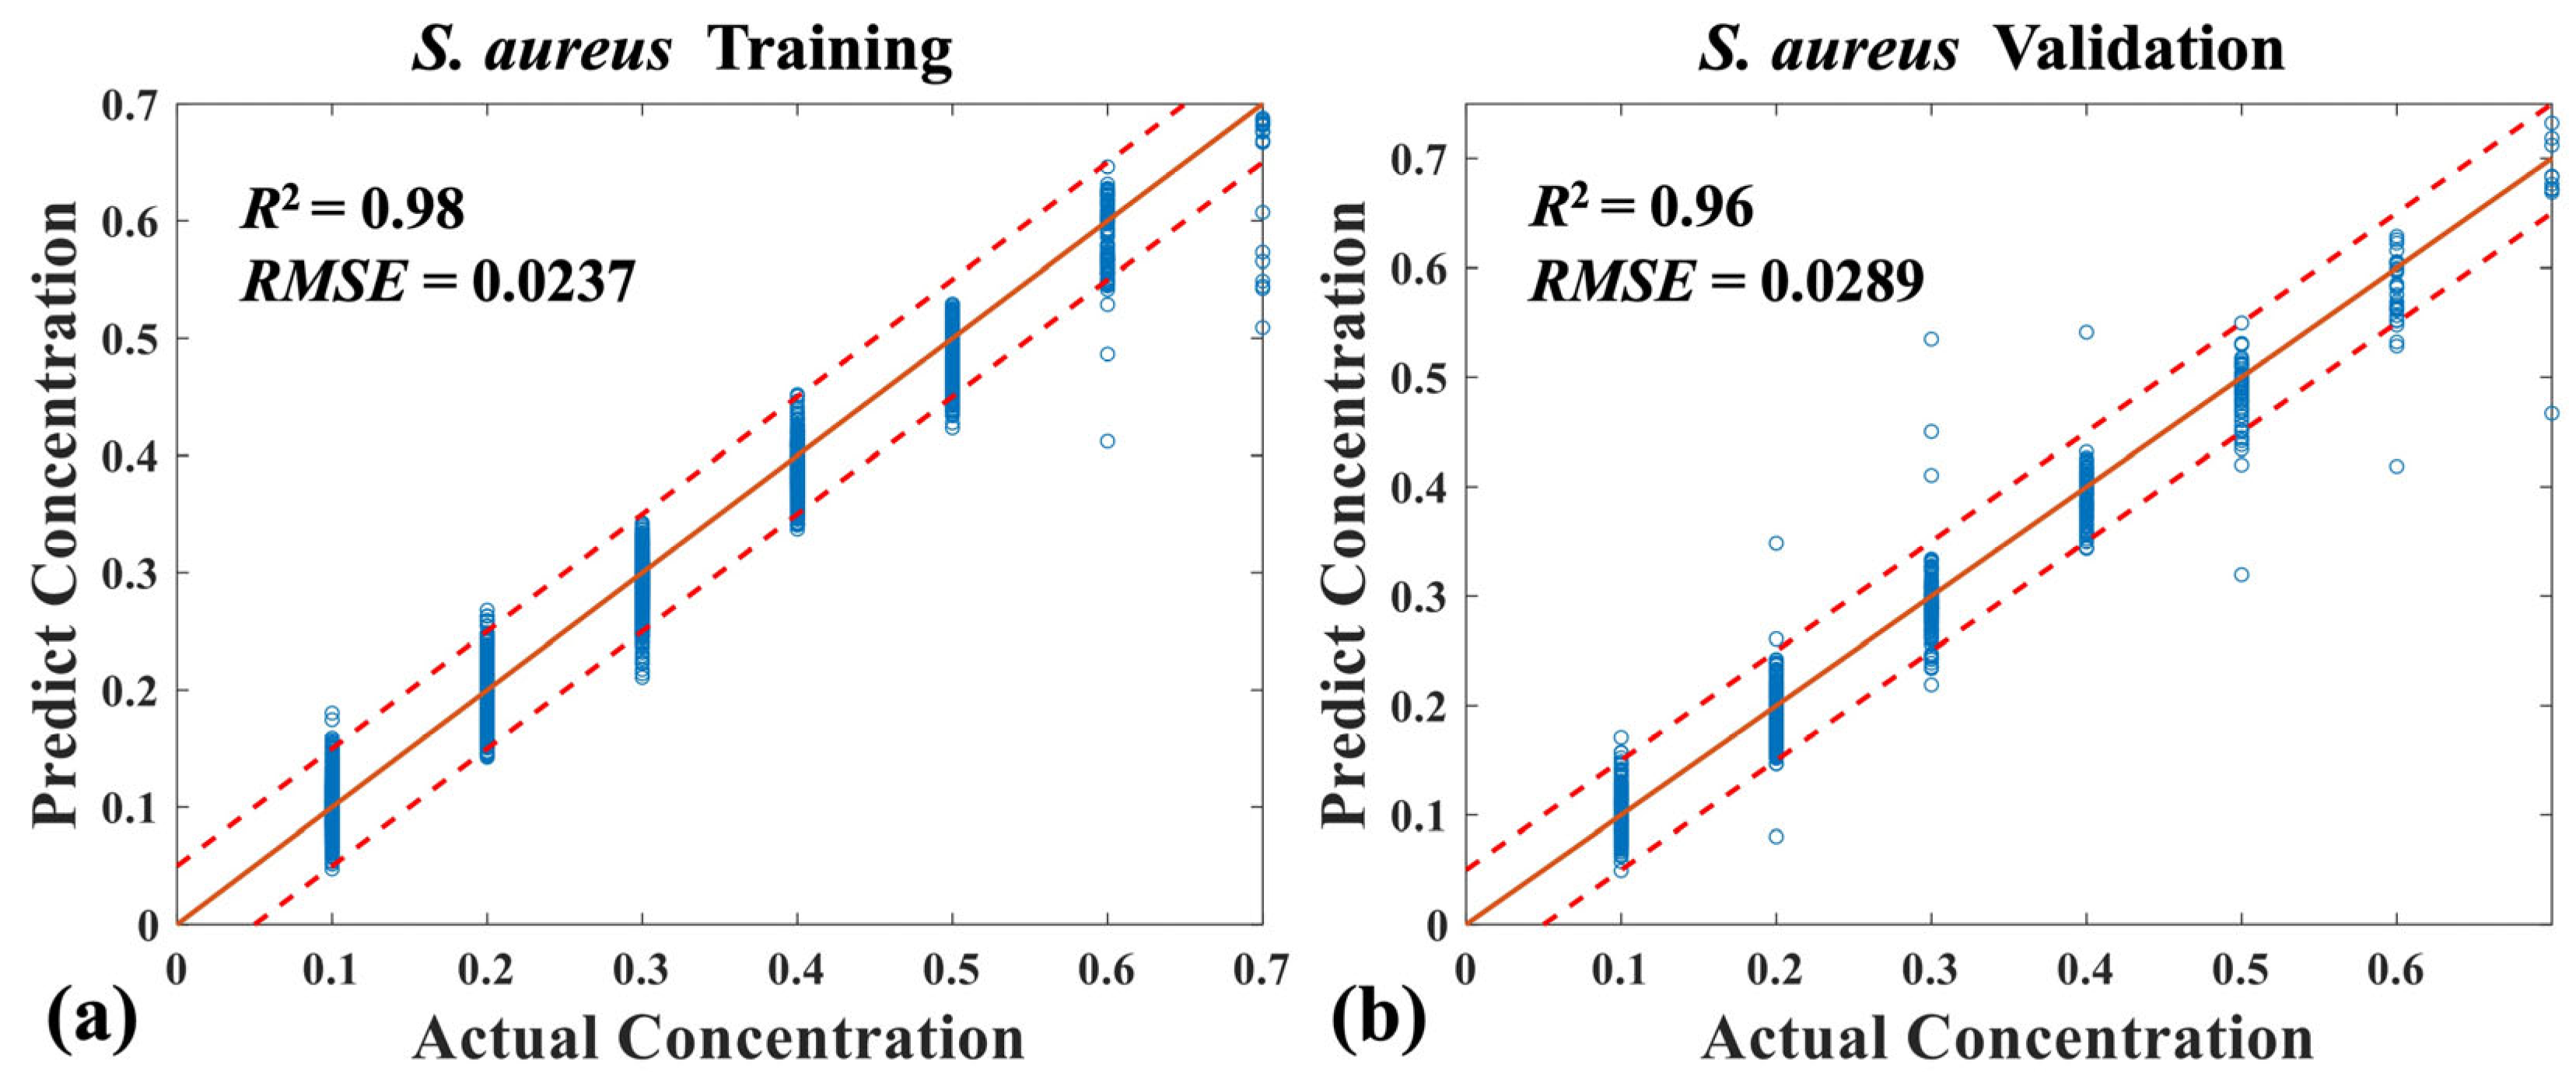
3.2. Quantitative Analysis of Four Mixed Bacteria Using MB-Net
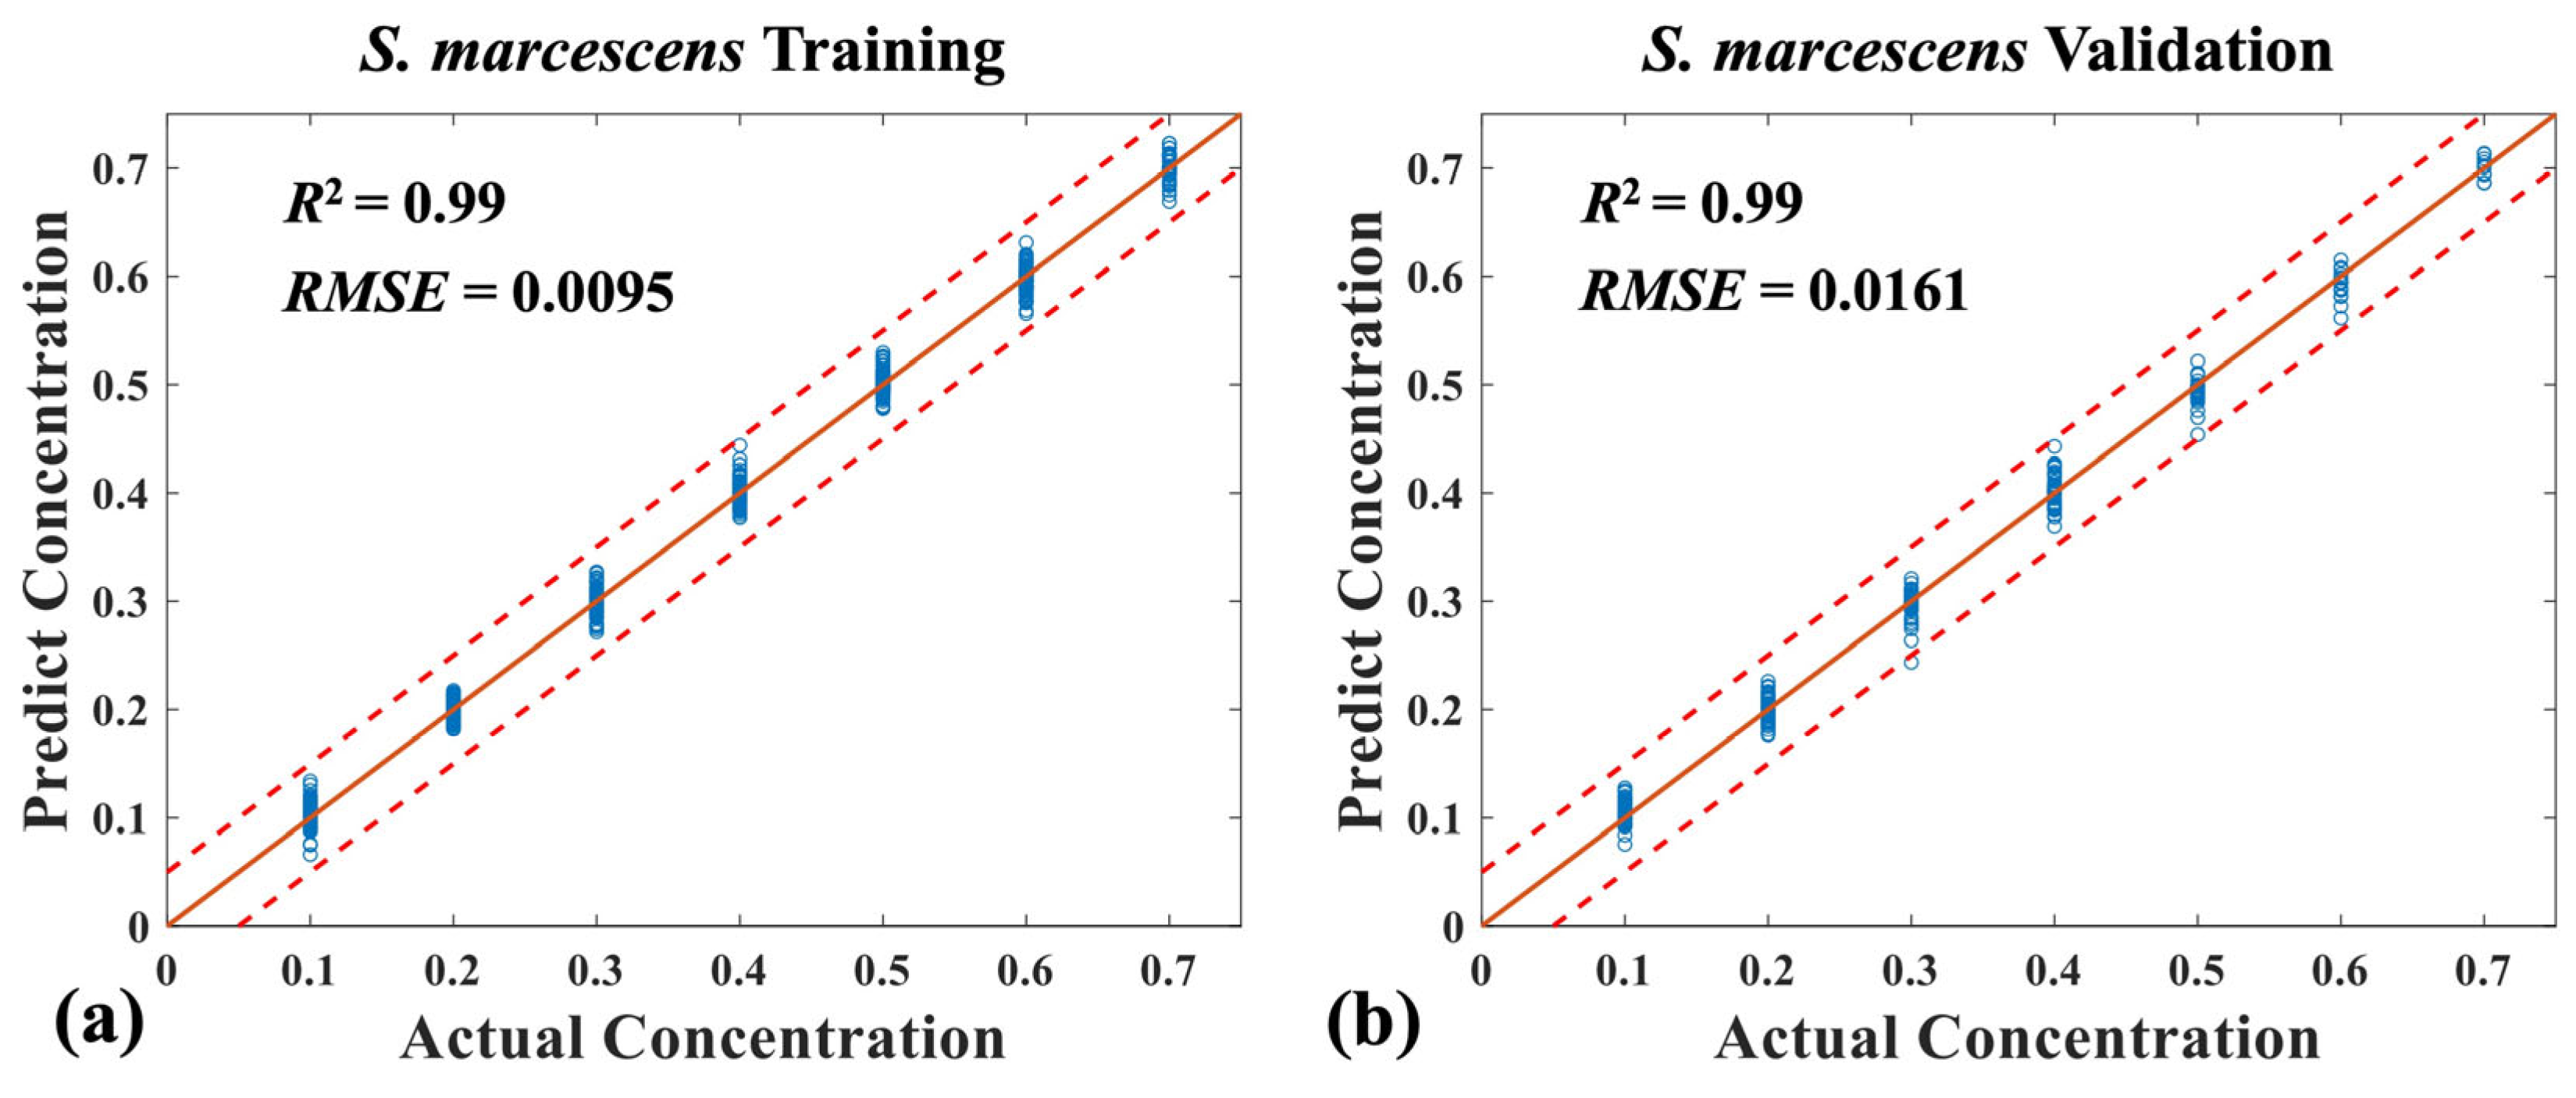
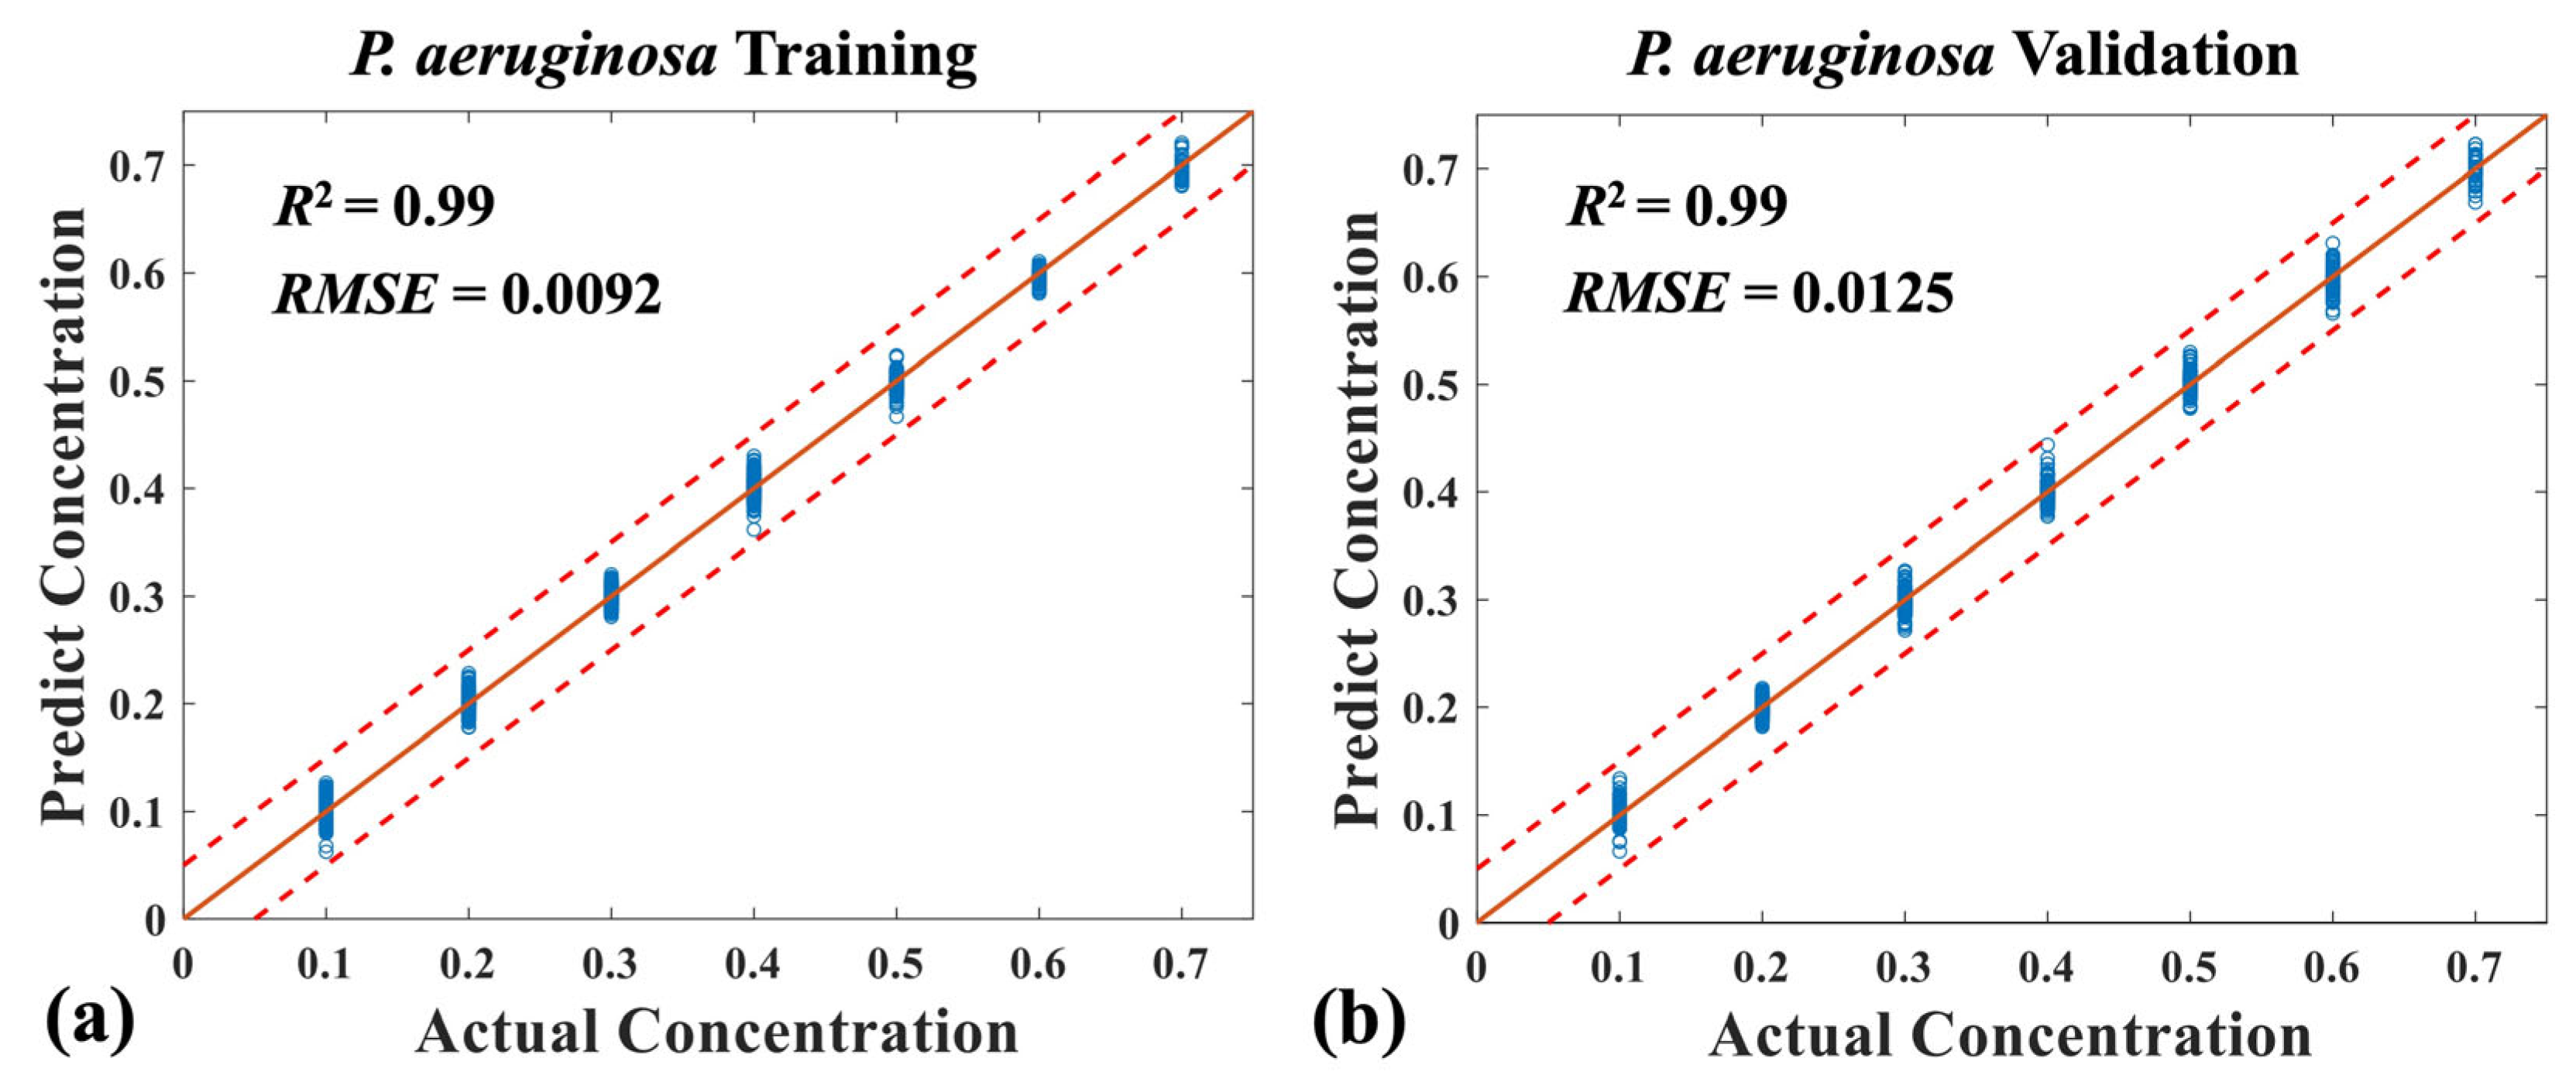
3.3. Quantitative Analysis of Three Mixed Bacteria Using MB-Net
4. Summary and Outlook
Author Contributions
Funding
Data Availability Statement
Acknowledgments
Conflicts of Interest
References
- Saxena, T.; Kaushik, P.; Mohan, M.K. Prevalence of E. coli O157:H7 in water sources: An overview on associated diseases, outbreaks and detection methods. Diagn. Microbiol. Infect. Dis. 2015, 82, 249–264. [Google Scholar] [CrossRef] [PubMed]
- Miller, L.S.; Cho, J.S. Immunity against Staphylococcus aureus cutaneous infections. Nat. Rev. Immunol. 2011, 11, 505–518. [Google Scholar] [CrossRef] [PubMed]
- Ward, J.L.; Azzopardi, P.S.; Francis, K.L.; Santelli, J.S.; Skirbekk, V.; Sawyer, S.M.; Kassebaum, N.J.; Mokdad, A.H.; Hay, S.I.; Abd-Allah, F.; et al. Global, regional, and national mortality among young people aged 10–24 years, 1950–2019: A systematic analysis for the Global Burden of Disease Study 2019. Lancet 2021, 398, 1593–1618. [Google Scholar] [CrossRef]
- Sharma, H.; Mutharasan, R. Review of biosensors for foodborne pathogens and toxins. Sens. Actuators B Chem. 2013, 183, 535–549. [Google Scholar] [CrossRef]
- Engelmann, I.; Alidjinou, E.K.; Ogiez, J.; Pagneux, Q.; Miloudi, S.; Benhalima, I.; Ouafi, M.; Sane, F.; Hober, D.; Roussel, A.; et al. Preanalytical Issues and Cycle Threshold Values in SARS-CoV-2 Real-Time RT-PCR Testing: Should Test Results Include These? ACS Omega 2021, 6, 6528–6536. [Google Scholar] [CrossRef]
- Krásný, L.; Hynek, R.; Hochel, I. Identification of bacteria using mass spectrometry techniques. Int. J. Mass Spectrom. 2013, 353, 67–79. [Google Scholar] [CrossRef]
- Law, J.W.-F.; Mutalib, N.-S.A.; Chan, K.-G.; Lee, L.H. Rapid methods for the detection of foodborne bacterial pathogens: Principles, applications, advantages and limitations. Front. Microbiol. 2015, 5, 770. [Google Scholar] [CrossRef] [PubMed]
- Zhang, L.; Liu, Y.Y.; Tao, N.P.; Wang, X.C.; Deng, S.; Lu, Y.; Xu, C.H. Simultaneous detection of mixed foodborne pathogens by multi-molecular infrared spectroscopy identification system. Food Control. 2022, 136, 108861. [Google Scholar] [CrossRef]
- Wang, C.; Wang, C.; Li, J.; Tu, Z.; Gu, B.; Wang, S. Ultrasensitive and multiplex detection of four pathogenic bacteria on a bi-channel lateral flow immunoassay strip with three-dimensional membrane-like SERS nanostickers. Biosens. Bioelectron. 2022, 214, 114525. [Google Scholar] [CrossRef]
- Shen, W.; Wang, C.; Zheng, S.; Jiang, B.; Li, J.; Pang, Y.; Wang, C.; Hao, R.; Xiao, R. Ultrasensitive multichannel immunochromatographic assay for rapid detection of food-borne bacteria based on two-dimensional film-like SERS labels. J. Hazard. Mater. 2022, 437, 129347. [Google Scholar] [CrossRef]
- Luo, J.; Lin, Z.; Xing, Y.; Forsberg, E.; Wu, C.; Zhu, X.; Guo, T.; Wang, G.; Bian, B.; Wu, D.; et al. Portable 4D Snapshot Hyperspectral Imager for Fastspectral and Surface Morphology Measurements. Prog. Electromagn. Res. 2022, 173, 25–36. [Google Scholar] [CrossRef]
- Park, B.; Yoon, S.C.; Lee, S.; Sundaram, J.; Windham, W.R.; Hinton, A.; Lawrence, K.C. Acousto-Optic Tunable Filter Hyperspectral Microscope Imaging Method for Characterizing Spectra from Foodborne Pathogens. Trans. ASABE 2012, 55, 1997–2006. [Google Scholar] [CrossRef]
- Smith, J.M.; Huffman, D.E.; Acosta, D.; Serebrennikova, Y.; Garcia-Rubio, L.; Leparc, G.F. Reagent-free bacterial identification using multivariate analysis of transmission spectra. J. Biomed. Opt. 2012, 17, 1070021–1070029. [Google Scholar] [CrossRef] [PubMed]
- Seo, Y.; Park, B.; Hinton, A.; Yoon, S.-C.; Lawrence, K.C. Identification of Staphylococcus species with hyperspectral microscope imaging and classification algorithms. J. Food Meas. Charact. 2016, 10, 253–263. [Google Scholar] [CrossRef]
- Kang, R.; Park, B.; Eady, M.; Ouyang, Q.; Chen, K. Single-cell classification of foodborne pathogens using hyperspectral microscope imaging coupled with deep learning frameworks. Sens. Actuators B Chem. 2020, 309, 127789. [Google Scholar] [CrossRef]
- Tao, C.; Du, J.; Wang, J.; Hu, B.; Zhang, Z. Rapid Identification of Infectious Pathogens at the Single-Cell Level via Combining Hyperspectral Microscopic Images and Deep Learning. Cells 2023, 12, 379. [Google Scholar] [CrossRef]
- Salman, A.; Shufan, E.; Sharaha, U.; Lapidot, I.; Mordechai, S.; Huleihel, M. Distinction between mixed genus bacteria using infrared spectroscopy and multivariate analysis. Vib. Spectrosc. 2019, 100, 6–13. [Google Scholar] [CrossRef]
- Feng, C.; Zhao, N.; Yin, G.; Gan, T.; Yang, R.; Chen, M.; Duan, J.; Hu, Y. A new method for detecting mixed bacteria based on multi-wavelength transmission spec-troscopy technology. Spectrochim. Acta Part A-Mol. Biomol. Spectrosc. 2022, 270, 120852. [Google Scholar] [CrossRef]
- Zhu, H.; Luo, J.; Liao, J.; He, S. High-accuracy Rapid Identification and Classification of Mixed Bacteria Using Hyperspectral Transmission Microscopic Imaging and Machine Learning. Prog. Electromagn. Res. 2023, 178, 49–62. [Google Scholar] [CrossRef]
- Zhao, Y.; Zhang, Z.; Ning, Y.; Miao, P.; Li, Z.; Wang, H. Simultaneous quantitative analysis of Escherichia coli, Staphylococcus aureus and Salmonella typhimurium using surface-enhanced Raman spectroscopy coupled with partial least squares regression and artificial neural net-works. Spectrochim. Acta Part A-Mol. Biomol. Spectrosc. 2023, 293, 122510. [Google Scholar] [CrossRef]
- Cho, J.; Gemperline, P.J.; Walker, D. Wavelength Calibration Method for a CCD Detector and Multichannel Fiber-Optic Probes. Appl. Spectrosc. 1995, 49, 1841–1845. [Google Scholar] [CrossRef]



| Sample | E. coli (Ratio) | S. marcescens (Ratio) | P. aeruginosa (Ratio) | S. aureus (Ratio) |
|---|---|---|---|---|
| 1–7 | 0.1 | 0.1 | 0.1, 0.2, …→ 0.7 | 0.7, 0.6, …→ 0.1 |
| 8–13 | 0.1 | 0.2 | 0.1, 0.2, …→ 0.6 | 0.6, 0.5, …→ 0.1 |
| 14–18 | 0.1 | 0.3 | 0.1, 0.2, …→ 0.5 | 0.5, 0.4, …→ 0.1 |
| 19–22 | 0.1 | 0.4 | 0.1, 0.2, …→ 0.4 | 0.4, 0.3, …→ 0.1 |
| 23–25 | 0.1 | 0.5 | 0.1, 0.2, 0.3 | 0.3, 0.2, 0.1 |
| 26, 27 | 0.1 | 0.6 | 0.1, 0.2 | 0.2, 0.1 |
| 28 | 0.1 | 0.7 | 0.1 | 0.1 |
| 29–34 | 0.2 | 0.1 | 0.1, 0.2, …→ 0.6 | 0.6, 0.5, …→ 0.1 |
| 35–39 | 0.2 | 0.2 | 0.1, 0.2, …→ 0.5 | 0.5, 0.4, …→ 0.1 |
| 40–43 | 0.2 | 0.3 | 0.1, 0.2, …→ 0.4 | 0.4, 0.3, …→ 0.1 |
| 44–46 | 0.2 | 0.4 | 0.1, 0.2, 0.3 | 0.3, 0.2, 0.1 |
| 47, 48 | 0.2 | 0.5 | 0.1, 0.2 | 0.2, 0.1 |
| 49 | 0.2 | 0.6 | 0.1 | 0.1 |
| 50–54 | 0.3 | 0.1 | 0.1, 0.2, …→ 0.5 | 0.5, 0.4, …→ 0.1 |
| 55–58 | 0.3 | 0.2 | 0.1, 0.2, …→ 0.4 | 0.4, 0.3, …→ 0.1 |
| 59–61 | 0.3 | 0.3 | 0.1, 0.2, 0.3 | 0.3, 0.2, 0.1 |
| 62, 63 | 0.3 | 0.4 | 0.1, 0.2 | 0.2, 0.1 |
| 64 | 0.3 | 0.5 | 0.1 | 0.1 |
| 65–68 | 0.4 | 0.1 | 0.1, 0.2, …→ 0.4 | 0.4, 0.3, …→ 0.1 |
| 69–71 | 0.4 | 0.2 | 0.1, 0.2, 0.3 | 0.3, 0.2, 0.1 |
| 72, 73 | 0.4 | 0.3 | 0.1, 0.2 | 0.2, 0.1 |
| 74 | 0.4 | 0.4 | 0.1 | 0.1 |
| 75–77 | 0.5 | 0.1 | 0.1, 0.2, 0.3 | 0.3, 0.2, 0.1 |
| 78, 79 | 0.5 | 0.2 | 0.1, 0.2 | 0.2, 0.1 |
| 80 | 0.5 | 0.3 | 0.1 | 0.1 |
| 81, 82 | 0.6 | 0.1 | 0.1, 0.2 | 0.2, 0.1 |
| 83 | 0.6 | 0.2 | 0.1 | 0.1 |
| 84 | 0.7 | 0.1 | 0.1 | 0.1 |
| E. coli | S. marcescens | P. aeruginosa | S. aureus | ||
|---|---|---|---|---|---|
| Transmission spectra only | RMSE | 0.0404 | 0.0406 | 0.0523 | 0.0751 |
| R2 | 0.92 | 0.93 | 0.90 | 0.92 | |
| Dual-mode spectra | RMSE | 0.0402 | 0.0356 | 0.0181 | 0.0289 |
| R2 | 0.93 | 0.94 | 0.99 | 0.96 |
| Sample | S. marcescens (Ratio) | P. aeruginosa (Ratio) | S. aureus (Ratio) |
|---|---|---|---|
| 1–7 | 0.1 | 0.1, 0.2, …→ 0.7 | 0.7, 0.6, …→ 0.1 |
| 8–13 | 0.2 | 0.1, 0.2, …→ 0.6 | 0.6, 0.5, …→ 0.1 |
| 14–18 | 0.3 | 0.1, 0.2, …→ 0.5 | 0.5, 0.4, …→ 0.1 |
| 19–22 | 0.4 | 0.1, 0.2, …→ 0.4 | 0.4, 0.3, …→ 0.1 |
| 23–25 | 0.5 | 0.1, 0.2, 0.3 | 0.3, 0.2, 0.1 |
| 26, 27 | 0.6 | 0.1, 0.2 | 0.2, 0.1 |
| 28 | 0.7 | 0.1 | 0.1 |
| Ref | Spectral Method | Statistics Analysis | The Number of Mixed Bacterial Types | The Number of Measured Mixing Ratios | Performance |
|---|---|---|---|---|---|
| [17] | Infrared spectroscopy | PCA and LDA | 2 | 5 | 90% (at the ratio of 9:1) |
| [18] | Transmission spectroscopy |
PCA–MC BPNN | 2 | 11 | 0.9954 (R2) |
| [8] | MM-IR spectroscopy | PCA and SIMCA | 2 | 7 | 100% (recognition rate) |
| [20] | SERS | PLSR/ANNs | 3 | 66 | 0.95 (R2) 0.06 (RMSE) |
| Our | Fluorescence and transmission hyperspectral detection | MB-Net | 4 | 84 | 0.96 (R2) 0.03 (RMSE) |
Disclaimer/Publisher’s Note: The statements, opinions and data contained in all publications are solely those of the individual author(s) and contributor(s) and not of MDPI and/or the editor(s). MDPI and/or the editor(s) disclaim responsibility for any injury to people or property resulting from any ideas, methods, instructions or products referred to in the content. |
© 2024 by the authors. Licensee MDPI, Basel, Switzerland. This article is an open access article distributed under the terms and conditions of the Creative Commons Attribution (CC BY) license (https://creativecommons.org/licenses/by/4.0/).
Share and Cite
Zhu, H.; Luo, J.; He, S. Detecting Multiple Mixed Bacteria Using Dual-Mode Hyperspectral Imaging and Deep Neural Networks. Appl. Sci. 2024, 14, 1525. https://doi.org/10.3390/app14041525
Zhu H, Luo J, He S. Detecting Multiple Mixed Bacteria Using Dual-Mode Hyperspectral Imaging and Deep Neural Networks. Applied Sciences. 2024; 14(4):1525. https://doi.org/10.3390/app14041525
Chicago/Turabian StyleZhu, He, Jing Luo, and Sailing He. 2024. "Detecting Multiple Mixed Bacteria Using Dual-Mode Hyperspectral Imaging and Deep Neural Networks" Applied Sciences 14, no. 4: 1525. https://doi.org/10.3390/app14041525
APA StyleZhu, H., Luo, J., & He, S. (2024). Detecting Multiple Mixed Bacteria Using Dual-Mode Hyperspectral Imaging and Deep Neural Networks. Applied Sciences, 14(4), 1525. https://doi.org/10.3390/app14041525


