Abstract
Musculoskeletal disorders not only impact workers’ health but also result in significant economic losses to society. Sanitation workers often have to lift waste bags from containers, leading to shoulder joint flexion of 90° or more, exposing them to hazardous environments for extended periods. This study combines deep learning and image recognition to create a Quick Capture Evaluation System (QCES). By comparing body angles captured in the sanitation workers’ work environment with those from OptiTrack motion capture, the system showed an average Root Mean Square Error of 5.64 for 18 different postures, and an average Spearman’s rho of 0.87, indicating its precision. Compared with scores assessed by three experts, the system demonstrated an average Cohen’s kappa of 0.766, proving its reliability. Practical assessments of sanitation workers revealed that tilting the waste containers could significantly improve their posture and reduce the risk of Work-Related Musculoskeletal Disorders. It proves that the QCES system can accurately and rapidly assess the on-site posture of a particular occupation.
1. Introduction
Work-Related Musculoskeletal Disorders (WMSDs) are inevitable occupational health issues for workers and significantly impact their quality of life. Damage caused by exposure to problematic work environments can hurt workers’ employment potential [1], and this is becoming a serious societal issue as it may lead to increased operational costs for businesses and society as a whole [2]. The European Union’s Labour Force Survey special module on “Accidents at work and other work-related health problems” report states that 60% of the population suffers from musculoskeletal disorders [3].
Early stage musculoskeletal disorders are often not immediately apparent and may be delayed, making them easy to overlook [4]. This not only hampers work efficiency but also poses significant safety risks. Research indicates that the construction industry, healthcare professionals, manual labor, manufacturing, and related populations are at high risk of WMSDs. Remaining in high-risk work environments with unaddressed musculoskeletal disorders for prolonged periods can hinder workers’ ability to perform their duties normally and increase the likelihood of safety accidents, leading to significant socio-economic losses [5]. According to the statistical research of the US Bureau of Labor, the total investment of the United States in WMSDs is $45 billion to $54 billion each year. From 1999 to 2013, 43% of the compensable claims in Washington State were caused by musculoskeletal diseases [6]. At the aspect of productivity, in the European Union, the total cost of productivity loss due to WMSDs among the working-age population may reach up to 2% of the Gross Domestic Product (GDP) [7].
Michel Aptel and his team examined on-site labor data and the health of workers to determine the primary factors that affect WMSDs, including biomechanical, environmental, labor organization, and psychosocial factors [8]. Construction workers face a high risk of musculoskeletal diseases due to prolonged repetitive bending and uncomfortable lifting positions [9]. Cleaners, who engage in sweeping, lifting, furniture moving, and handling cleaning waste [10], are also susceptible to WMSDs because environmental limitations frequently require cleaners to adopt static or awkward positions when cleaning difficult-to-reach areas, such as high or narrow spaces [11,12].
Bazazan et al. found a higher prevalence of WMSDs among control room operators. Through a 12-month intervention targeting work postures, the results indicated a significant alleviation of WMSD symptoms and fatigue among the operators [13]. Furthermore, research suggests that conducting job assessments for workers and implementing prevention and intervention measures for unfavorable work conditions is the most effective approach to addressing WMSDs. Therefore, establishing a systematic method for assessing and preventing WMSDs has become a focal point of research in safety management science, human factors engineering, and related disciplines.
1.1. Existing Ergonomic Assessment Methods
1.1.1. Self-Report and Questionnaire Methods
Epidemiological assessment methods are employed to investigate the distribution of WMSDs by examining the prevalence of the disease and its associated risk factors within a population. This method is the most commonly used approach for studying, analyzing, and evaluating WMSDs. The most renowned questionnaire for this purpose is the Nordic Musculoskeletal Questionnaire (NMQ) [14], designed by Kuorinka et al. in 1987. The process involves interviewing, designing, and collecting questionnaires, investigating potential adverse factors in the actual workplace, and subsequently utilizing statistical knowledge to analyze the collected data and determine the prevalence of MSDs within the target group [15]. However, the evaluation results of such methods are overly reliant on the cultural level of the subjects, exhibiting significant randomness [16]. Unfortunately, existing research has not provided detailed methods to address and correct this issue.
1.1.2. Direct Measurement Methods
These methods often rely on sensors to collect the human body’s bioelectrical signals or posture data and analyze changes in bodily data. In ergonomic studies focused on WMSD risk, there are various applications of human bioelectrical signals, with the most common being electroencephalography (EEG) for measuring brain electrical activity [17] and electromyography (EMG) for measuring muscle electrical activity [18]. Additionally, for a more comprehensive ergonomic assessment, Ana Colim et al. utilized quantitative data collected from EMG and an inertial measurement unit (IMU) to achieve user-centered aircraft handle design [19]. Therefore, we believe that direct measurements using different sensors in WMSD research can provide the high-precision human motion data required for the study, while also serving as a standard for validating the accuracy of other assessment systems, but often incurring high research costs [20].
1.1.3. Observational Methods
The ergonomic assessment methods are mainly divided into motion analysis, strength testing, and posture evaluation, and these methods are currently more widely applied in WMSD assessment, with typical examples such as the Rapid Entire Body Assessment (REBA) [21], Ovako Working Posture Analysis System (OWAS) [22], and NIOSE [23]. There are differences between these methods, and this paper lists several common ergonomic assessment methods at home and abroad as shown in Table 1. Although ergonomic assessment methods are cost-effective and easy to master, the assessment process is cumbersome, and the assessment efficiency is low. Therefore, when evaluating job positions that require a large amount of data, it is easy to make mistakes due to fatigue, and there may be subjective biases from the assessors’ judgments [24,25].

Table 1.
Common observation and assessment methods.
1.2. Examples of Technologies to Support Ergonomic Assessments
With the development of artificial intelligence technology, Cruz-Montecinos et al. have proposed the integration of computer image recognition technology with self-reports, questionnaires, and observational methods to improve assessment efficiency and accuracy [28]. However, different implementation methods of technological assessment have fundamental differences in the human skeleton recognition module and are typically divided into two categories: one involves hardware-assisted recognition, and the other relies solely on algorithms, such as convolutional neural networks and convolutional pose machines. Currently, in research utilizing hardware-assisted recognition, Kinect depth cameras are widely used, capable of recognizing the three-dimensional positions of over twenty human body joints [29]. The accompanying software uses decision trees and random forest classification algorithms to classify and identify human skeletal joints. However, the studies by Ahmed Humadi et al. [30] and GonzÁles A. et al. [29] have both indicated that when Kinect is used for the on-site assessment of workers, it exhibits significant instability due to on-site environmental factors, object occlusion, and lighting, leading to a substantial decrease in accuracy. In the purely algorithmic domain, significant progress has been made in the field of image processing with the advent of deep learning technology, particularly Convolutional Neural Networks (CNN) [31]. Meanwhile, in the human skeletal recognition algorithm, Jian He et al. demonstrated in the field of autonomous driving that based on a Convolutional Pose Machine (CPM), the rapid recognition and prediction of traffic police gestures can be achieved [32]. Abobakr et al. predicted human body joints from a single image and used angle data for MSD risk assessment, achieving a prediction accuracy of 89% and a kappa index of 0.71 [33]. Therefore, we believe that the combined application of Convolutional Neural Networks (CNN) and CPMs is a means of the real-time recognition of work postures. Although some open-source software, such as Mediapipe and YOLOv7 pose capture frameworks, can generate real-time detection on CPUs, they lack neck capture. Seong-oh Jeong et al. mentioned in their research the use of inverse kinematics to calculate the neck and waist joints to supplement Mediapipe and used Unity 3D for result analysis [34]. However, this approach has high computer hardware requirements and has a certain installation and learning cost.
1.3. Research Purposes
We are focused on ergonomic methods validated to assess risk factors associated with WMSDs occurrence, therefore, our comparative study of the four assessment methods revealed that that self-report and questionnaire methods are suitable for preliminary surveys and clarifying research objectives and subjects. Direct measurement methods are suitable for in-depth subsequent investigations, while observational methods are suitable as the primary assessment method, widely used to explore the risk levels of WMSDs. Furthermore, the development of an WMSD risk assessment system utilizing body skeleton recognition algorithms in image recognition technology can effectively enhance assessment accuracy and save assessment time. Currently, in the assessment of workers’ musculoskeletal disorders, the random forest algorithm is mostly used. Compared to CNNs, this algorithm lacks high precision and portability. The CNN method has been successfully integrated into surveillance detectors and has been proven to be an effective method for surveillance detectors [35]. However, there is limited research on the application of CNNs in ergonomic assessments. Therefore, this study, starting from the perspective of workers’ occupational health, combined knowledge from ergonomics, musculoskeletal models, deep learning, and image recognition to establish a posture recognition-based musculoskeletal disorder risk assessment system, detailed in the framework shown in Figure 1.
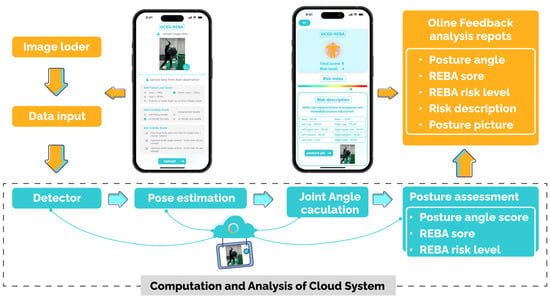
Figure 1.
The system architecture of the QCES system.
The main research objectives are: (1) to integrate the risk calculation formula (HRC) and Convolutional Pose Machine (CPM) based on observational assessment methods and image recognition-based assessment methods using smartphones as carriers to improve the accuracy of WMSD assessment scores, eliminate human error factors during the assessment process, improve the accuracy and portability of human posture recognition algorithms, and simplify the use of supporting facilities; (2) to investigate whether sanitation workers’ existing work postures pose a risk of WMSDs; and (3) to explore whether changing the tilt angle of waste containers can intervene in work postures to reduce risk. However, due to time constraints, we have not yet applied the QCES system to the assessment of WMSDs in different occupations. Therefore, multi-occupational validation to demonstrate the system’s universality is our subsequent research direction.
2. Materials and Methods
2.1. Rapid Evaluation System Based on CPM
To address the aforementioned issues, this study integrates knowledge from artificial intelligence, human pose recognition, and ergonomics, and proposes the development of a simple, user-friendly, and lightweight WMSD risk assessment system named the Quick Capture Evaluation System (QCES). This system is based on observational assessment methods and image-based assessment methods, integrating the risk calculation formula (HRC) and Convolutional Pose Machine (CPM). Utilizing a smartphone as the platform, it aims to enhance the accuracy of WMSD assessment scores, eliminate the interference of human errors during the assessment process, improve the accuracy and portability of human pose recognition algorithms, and simplify the use of supporting facilities.
In this work, the QCES system’s body skeletal recognition algorithm module, musculoskeletal disorder risk assessment module, and assessment report generation module as shown in Figure 1, were developed using relevant languages, tools, and function libraries such as C++, Visual studio 2015, ngrok (international version), OpenPose files, and the Windows Presentation Foundation library (NET Framework 4). These three modules were packaged as an API for server calls using the PHP language and PHP study tool. Additionally, pertinent interfaces for image and data collection modules were established. The current version of the QCES system has the following environmental configuration requirements: operating system: Windows 10, processor: CPU Intel (R) i7-8750H 2.00 GHz, 8 GB RAM, GPU Nvidia GeForce GTX1050Ti; memory: 2 GB (minimum); hard disk space: 2.5 GB (minimum); CUDA version: cuda_8.0.61_win10; cuDNN version: cudnn-8.0-windows10-x64-v5.1.
2.1.1. Human Skeleton Algorithm Recognition Module
The human skeletal recognition algorithm module is a crucial application of image recognition technology, as it automatically extracts relevant parameters of workers’ operational postures from images, such as body pose skeletons and the states of limb bending, twisting, overlapping, and so on.
Therefore, based on CPM, this paper developed a human skeletal recognition algorithm for identifying the two-dimensional positions of human body joints and designed a multi-stage algorithm structure composed of multiple convolutional pooling groups. As shown in Figure 2, the different stages of the algorithm network structure are distinguished by different colored blocks. Here, C represents the convolution operation in the convolutional neural network, and 9 × 9 represents the size of the convolution kernel in the convolution operation. P represents the pooling operation in the convolutional neural network, and 2× represents the step size in the pooling operation. h represents the height of the image, w represents the width of the image, and the height and width of the image are based on pixel values. n represents the number of joints, where n + 1 represents the number of joints plus the background response feature map. Loss represents the calculated loss value after the algorithm runs. Concat is the image concatenation function. In the first stage, the algorithm can directly complete the recognition of the human skeleton, outputting a feature map containing joint position information. Subsequently, in the second stage and beyond, the feature map output from the previous stage is used as input for iteration, with the algorithm utilizing image space features, image texture features, and image center constraints as joint inputs [36]. The algorithm continuously iterates to recognize higher-precision joint feature maps.
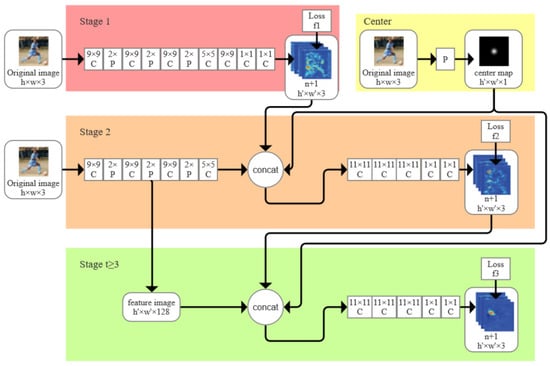
Figure 2.
Algorithm architecture of human skeleton recognition of QCES system.
Texture features are extracted in different convolution pooling groups. (i.e., shallow features, with smaller convolution receptive fields in the early convolutional pooling operations, enabling the generated feature maps to reflect local texture features of the image) and spatial features (i.e., deep features, with larger convolution receptive fields in the later pooling operations, enabling the generated feature maps to reflect global spatial relationship features of the image) are extracted separately. These features are concatenated to fully utilize the features extracted by the network, enhancing the detection effect. This is specifically manifested in (1) the feature map regression for visually observable joints, such as the ankles, knees, and shoulder joints, which show clear central areas; and (2) the feature maps for visually unobservable joints, such as the left hip joint, which appear more ambiguous. However, due to the algorithm network’s limb association prediction and implicit modeling, the position prediction accuracy for these occluded and visually unobservable joints remains high, as shown in Figure 3a.

Figure 3.
(a) Characteristics of joints and limbs of human body; (b) The skeleton diagram of human working posture output by the algorithm.
The human pose recognition algorithm network structure in this study is staged. During training, calculating the loss value using only the output of the final stage and the labeled results in the training dataset would lead to the gradient backpropagating to the previous stage. This would result in a significant decrease in error at the output layer after multiple layers of backpropagation, leading to the phenomenon of vanishing gradients. To address this issue, the intermediate supervision algorithm is adopted. Specifically, the loss value is calculated between the output layer of each stage and the corresponding labeled results, and these loss values are then summed to form the overall network loss value. This approach can prevent the occurrence of vanishing gradients [37]. The specific calculation process is depicted in Figure 4.
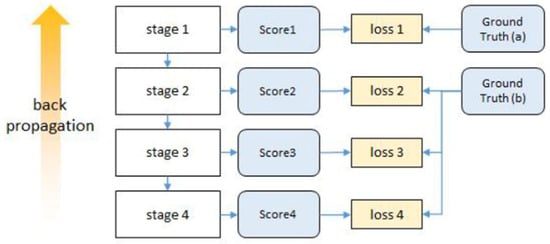
Figure 4.
The calculation process of the loss value for the human skeleton recognition algorithm.
The central position of the final feature map of each recognized joint corresponds to the coordinate position of the respective joint. After obtaining the joint position data, the human skeletal structure is drawn on the original image, as shown in Figure 3b. Following the transformation of joint coordinates, the limb angle values are calculated to determine the special status of the limbs. Subsequently, the data are input into the musculoskeletal disorder risk assessment module to further evaluate the level of WMSDs risk.
2.1.2. Risk Assessment Module for WMSDs
Based on the accurate capture of skeletal points, further calculations of limb angle values based on the human skeletal joint coordinate data are required to analyze the special status presented by the occupational posture [38]. Additionally, differences in the spatial coordinates of images in image recognition can also affect limb angles. Therefore, in this study, the limb Li is defined as being composed of two adjacent joints Pi = (xi, yi, zi) and Pi + 1 = (xi + 1, yi + 1, zi + 1), i.e., Li = PiPi + 1. Due to the complexity of three-dimensional spatial angles, in this research, the projection of limbs on the sagittal plane, coronal plane, and vertical plane and the projection angle between the sagittal axis, coronal axis, and vertical axis are used to analyze the working posture. Firstly, the length Di of the limb Li in three-dimensional space is defined as shown in Formula (1)
And the angles , , and between the limb Li and the sagittal axis, coronal axis, and vertical axis base directions can be calculated using the spatial straight line projection relationship, as seen in Formulas (2)–(4).
Building upon the limb angle output and the REBA and RULA methods for human posture assessment, the foundational theory, formulas, and methods are written into modular code using computer programming methods. The work-related musculoskeletal disorder (WMSD) risk assessment module is based on the C language, with C++ as a supplementary language, and the entire coding work is completed in VS2015 software. The specific workflow is depicted in Figure 5.
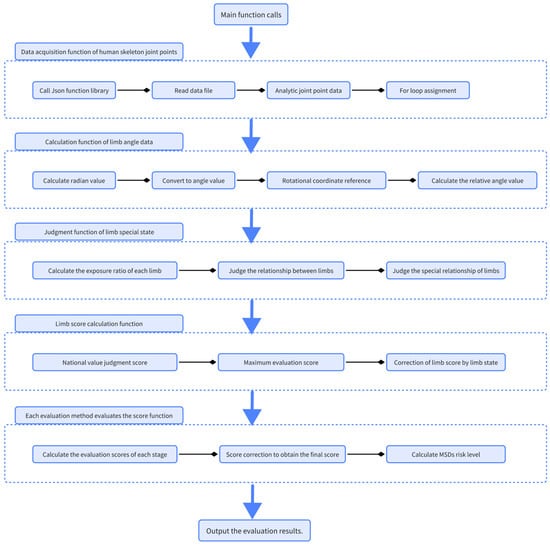
Figure 5.
Evaluation process of the risk assessment module for musculoskeletal diseases.
2.1.3. Evaluation Report Generation Module
The assessment report generation module organizes the output data from the previous modules and provides feedback to the mobile end in the form of online and offline reports, completing the entire process of assessing the WMSD risk of workers’ occupational postures. The online report on the mobile end simplifies the current assessment of the occupational posture’s WMSD risk score, risk level assessment results and descriptions, and special data alerts, as shown in Figure 6a.
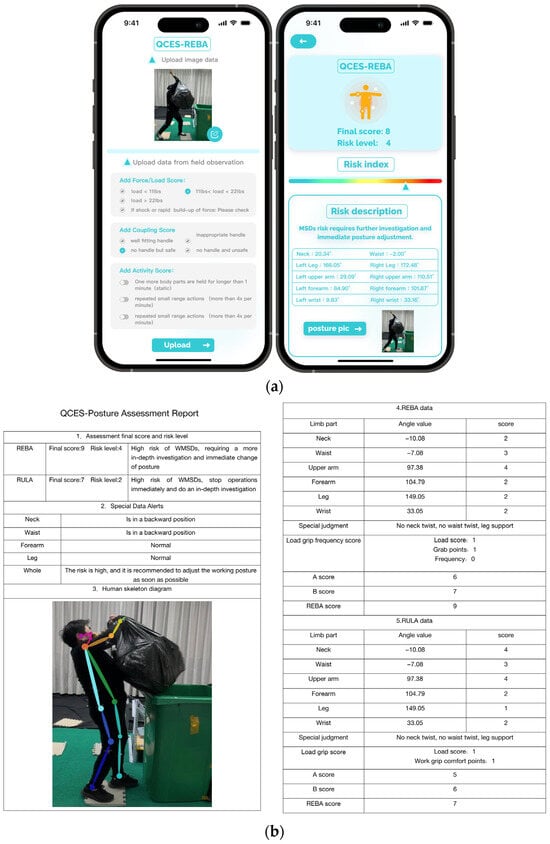
Figure 6.
(a) QCES system online evaluation report. (b) QCES system offline version evaluation report. Case researched and applied.
The visual recognition-based QCES system faces challenges in evaluating other factors in assessment methods such as REBA and RULA. Therefore, we have incorporated simple manual input options on the mobile end of the system, as depicted in Figure 6a. Taking the assessment of REBA as an example, the Force/Load Score, Coupling Score, and Activity Score are observed and recorded during the assessment process. Hence, when using the QCES system, users are required to input these as known variables for the assessment. Furthermore, this study is capable of generating a more detailed offline report by invoking the basic function libraries of Microsoft Office 2015, including MSWORD.OLB, VBE6EXT.OLB, and MSO.DLL, to automatically generate and save the report in Word format for assessors to download. The offline report comprises six main sections, including assessment scores and risk levels, special data alerts, human skeletal diagrams, REBA data, and RULA data. The assessment scores and risk levels section record the final assessment scores or posture codes, risk level grades, and relevant risk descriptions using the REBA and RULA assessment methods, as illustrated in Figure 6b.
3. Research on Sanitation Workers
3.1. Research Direction and Variable Collection of Sanitation Workers
In the global service industry, sanitation workers have become a vulnerable group in society due to factors such as their generally older age and a higher proportion of female workers. Specifically, the median age of sanitation workers in the United States is 48 years [39], and in Guangzhou, China, 86% of sanitation workers are aged 50–60 years. JP Zock’s global survey found a relatively high proportion of women in the sanitation workforce [40], and female sanitation workers have a 50% higher probability of developing MSDs compared to men under similar tasks [41].
One essential task is to remove and pack waste bags from waste containers. With a waste container capacity of 240 L and a height of 108 cm, the average height of women in China is currently 160.1 cm, and for men, it is 169.7 cm. According to the survey, the mean waste bag weight is 16 kg. This makes it difficult for sanitation workers to remove fully loaded waste bags from the containers, and during the process, it is likely that sanitation workers are exposed to physical risk factors associated with lower back pain (LBP) and Work-Related Musculoskeletal Disorders (WMSDs).
However, research on WMSDs in this population involved in waste container emptying is currently lacking, which may result in a lack of consideration for the process of waste removal by sanitation workers in making urban waste management decisions and redesigning waste containers, leading to the long-term exposure of sanitation workers to hazards and increased construction investment costs.
It is evident that enabling researchers to understand the occupational hazards sanitation workers may be exposed to while cleaning waste is crucial in reducing unnecessary losses. Therefore, in this study, when using the QCES system to assess sanitation workers, a motion capture device is simultaneously used to compare and evaluate the body angles of sanitation workers when collecting waste, from the perspective of changing the way waste is removed. To collect more authentic and detailed experimental data and improve the accuracy of the experimental results, this study distributed surveys to sanitation workers in schools and residential areas in Guangzhou, Guangdong Province, China, collecting a total of 342 questionnaires, of which 320 were valid. The processed questionnaire results revealed that: (1) the common capacity of waste containers at waste collection points is 240 L, with dimensions of 71 cm × 57 cm × 107 cm; (2) sanitation workers remove waste bags from containers when they reach a weight of 10–15 kg, as shown in Figure 7; (3) sanitation workers repeat the action of removing waste bags from waste containers 28–35 times per day; (4) sanitation workers, due to factors such as weight and height, are unable to vertically remove waste from the containers. The most commonly used solution is to tilt the waste container, lean sideways, and remove the waste with one hand, effectively lowering the height of the container’s opening, as shown in Figure 7.
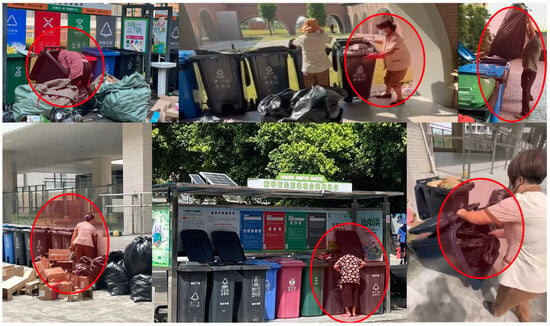
Figure 7.
A scene image of sanitation workers removing waste bags from containers.
In the preliminary investigation, we discovered that sanitation workers encounter significant difficulties in removing waste due to their height and the weight of the waste bags when removing them from containers that are perpendicular to the ground. The survey results also indicated that some sanitation workers tilt the waste containers and then lean sideways to remove the waste bag. While this action reduces the difficulty of the task, it puts the body in an unbalanced state. Similarly, Allread W [20] mentioned in a study on the risk of WMSDs among hotel service personnel that working in an unstable posture increases the probability of developing illnesses, and using adjustable long-handled tools can enhance worker safety. Therefore, this study aims to investigate whether changing the angle of the waste containers perpendicular to the ground, without altering the original structure of the waste containers, can lower the height at which sanitation workers remove waste, thus improving their posture. Two angles, 60° and 45°, were selected for the tilt, with 90° being the prevalent form of waste containers in current practice. Additionally, in this study, 45° was the maximum tilt angle considered, as excessively tilting the waste containers would compromise its primary function of waste storage, rendering it of no research value.
3.2. Experimental Design
This experiment was conducted in October 2023 at the Human–Machine Engineering Laboratory of South China University of Technology. Three types of waste containers with angles of 45°, 60°, and 90° perpendicular to the ground were constructed, as shown in Figure 8. The experiment involved capturing the posture of the subjects simultaneously using the QCES system and the OptiTrack motion capture system to verify the consistency of the two methods in identifying posture and to assess the consistency of QCES in evaluating WMSDs risk and expert evaluation scores. The study also aimed to evaluate the risk of sanitation workers developing WMSDs when removing waste and whether changing the angle of the waste containers could reduce the risk of WMSDs. Therefore, the following hypotheses were proposed:
Hypothesis H1:
The QCES system and the OptiTrack motion capture system yield consistent body angle measurements.
Hypothesis H2:
The QCES system’s evaluation scores for REBA and RULA are consistent with expert evaluation scores.
Hypothesis H3:
Changing the tilt angle of the waste containers can significantly reduce the evaluation scores of REBA and RULA.
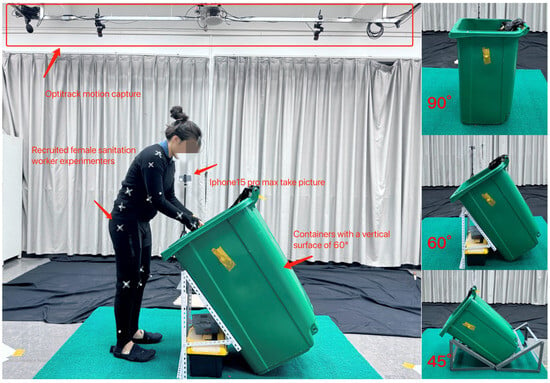
Figure 8.
Schematic diagram of experimental setup scene and container inclination angle.
3.2.1. Experimental Participants
Six subjects were recruited, and garbage weighing 12 kg was taken out of the waste containers with the above-mentioned three inclined angles. None of the subjects had any physiological diseases and could normally complete the required actions in the experiment. The participants consisted of three males and three females, with an average height of 158.3 cm an average weight of 58.3 kg for the males, an average height of 156.7 cm, and an average weight of 64.5 kg for the females. All participants were sanitation workers with six or more years of waste collection experience. Additionally, three human factors engineering experts with over ten years of experience in WMSDs-related research were involved in the experiment. The REBA and RULA evaluation methods were used for assessment throughout the experiment. Prior to the commencement of the experiment, all participants were required to sign informed consent forms.
3.2.2. Equipment and Instruments
The motion capture system, produced and installed by OptiTrack in 2020, consisted of eight infrared digital cameras (Slimx13, resolution 1280 × 1024, native frame rate 240 HZ), a set of medium-sized motion capture suits, and a Windows 10 system with an Intel Core i7-13700H CPU laptop. The Motive 2.3.0 software, paired with the OptiTrack cameras, was used to drive the instrument for skeletal data acquisition, while the seeker software was installed to analyze the obtained data and calculate limb angles. Furthermore, the QCES system was connected to a Windows 10 operating system with an Intel Core i7-13700H CPU running its backend server. The QCES program was installed on an iPhone 15 Promax, connected to a tripod to capture the target data.
The experimental setup included 240 L outdoor waste containers with standardized dimensions of 71 cm × 57 cm × 107 cm, a 12.5 kg bag of household waste, a 60° tripod, and two 45° tripods. The simulated data were generated using survey data to mimic actual work situations.
For the three human factors engineering experts, laptops were provided with Kinovea-0.9.4-x64 [42], calibration angle software and REBA and RULA evaluation forms to facilitate rapid, intuitive, and accurate assessment of operational postures at different tilt angles.
3.2.3. Experimental Setup and Process
The experimental setup is depicted in Figure 8. A green mat is positioned at the center of both capture methods to prevent data errors. Each participant is required to wear a motion capture suit compatible with OptiTrack during every experimental session. Referring to the research by Manghisi et al., a total of 18 motion markers are placed on the body at specified locations and quantities [43]. Following the participants’ preparation, the OptiTrack motion capture system is calibrated using L-shaped and T-shaped rods. The QCES system is positioned beside the participant, supported by a tripod to ensure that the smartphone is 130 cm from the ground and 220 cm from the participant’s sagittal plane.
Three ergonomics experts were allowed to walk outside the green carpet when the subjects took out the garbage at different inclination angles, so as to record the information needed for evaluation at all times.
The specific experimental procedure, as illustrated in Figure 8, consists of three different tilt angles for waste contains, as mentioned earlier: 90°, 60°, and 45°. To assess the participants’ working postures during waste removal and ensure that they are always positioned at the center of the field, all six participants complete one angle, then rest for 10 min before repeating the simulation following the aforementioned steps. This process is repeated for each angle. Once the simulations for the three angles are completed, the OpTirack motion capture system saves the data for each posture as c3d files. The QCES system uploads the data to the backend for automatic posture analysis and generates RULA and REBA assessment reports in PDF format. The experts independently assess the postures by scoring using a computer, calculate the REBA and RULA risk scores for all postures, and store the results in an Excel (Microsoft Excel 2021) file.
3.3. Data Collection and Analysis
The data collected in the aforementioned experiment were statistically analyzed using SPSS version 29.0. Prior to analysis, the data documents were divided into three categories: (1) the c3d files saved from OptiTrack were imported into Nokov seeker 1.6.2.1 software for coordinate point processing and output of limb angle data, (2) ten limb angle data were extracted from the assessment reports generated by QCES for each posture, and (3) experts provided detailed REBA and RULA scores for each posture.
Firstly, to verify hypothesis H1, Knova seeker software was used to output ten joint angles required for REBA and RULA assessment based on the skeletal point coordinate data, as shown in Table 1. t-test analysis was applied to evaluate the differences between the OptiTrack motion capture system and the QCES system in different parts of the body, verifying whether there were differences between the two capture methods overall. Subsequently, the Root Mean Square Error (RMSE) was used to compare the ten limb angles identified by the OptiTrack motion capture system and QCES system, verifying whether there were significant differences between the two systems in detail. Finally, the Spearman’s rho (p) correlation coefficient was used to compare the consistency of the two systems in angle recognition under each working posture, verifying the consistency of the two systems in angle recognition.
Secondly, to verify hypothesis H2, the RMSE and Cohen’s kappa coefficient based on linear weighting were calculated to compare the consistency of the QCES system with the human factors engineering experts in evaluation scores [28,44], verifying whether the QCES system can simulate expert scoring in evaluation scores.
4. Feasibility Validation of the QCES System
In order to analyze the reliability of the QCES system designed in this study in recognizing the limb angles of working postures, a comparison was first made between the QCES system and the OptiTrack motion capture system in terms of the mean, standard deviation, and t-test of limb angles of working postures, as shown in Table 2.

Table 2.
Results of t-tests between the OptiTrack motion capture system and the QCES system.
From the table, it can be seen that the mean (standard deviation) of the QCES system in limb positions such as the neck, right leg, left upper arm, right upper arm, right forearm, left wrist, and right wrist are relatively close to the corresponding data of the motion capture system. The two systems have certain similarities in recognizing the limb angles of working postures. Moreover, there is no significant difference in the angle values of all limb positions. These results to some extent prove that the QCES system can replace the OptiTrack motion capture system as a tool for recognizing the limb angles of workers’ working postures. Secondly, in terms of arm angle capture, there is a certain difference between the QCES system (64.48 ± 32.09) and the OptiTrack motion capture system (69.46 ± 37.01) in the left upper arm, as well as in the limb angle of the right forearm, where the QCES system (79.2 ± 35.40) and the OptiTrack motion capture system (108.07 ± 31.93) also differ slightly. However, the differences between the two are not significant. Therefore, this study analyzed the captured limb angles of each posture in more detail.
To conduct a more detailed analysis of the differences between the QCES system and the OptiTrack motion capture, this study expanded on the limb angles recognized by both methods, as shown in Table 3. The table lists the RMSEs and ρ correlations calculated by the QCES system and the OptiTrack motion capture for all limb angles. These results indicate that the RMSE errors of different limb angles in various working postures are relatively small, with an average RMSE error of 5.64 for 18 movements. Among them, the capture situation of the working posture labeled as W2-60 is the best, with an average RMSE value of 3.16 (where 9 out of 10 limb angles have error values less than 5), while M1-60 exhibits a poorer performance with an average error value of 8.93 (where only 4 out of 10 limb angles have error values less than 5). Furthermore, this study conducted a more detailed analysis of the correlation between the QCES system and the OptiTrack motion capture in limb angles across 18 different postures. The average Spearman’s rank coefficient of correlation for 10 limb angles is 0.87, with the Neck, left upper arm, Left forearm, Left wrist, right upper arm, and Right forearm all exceeding 0.85. These results clearly demonstrate the validity of hypothesis H1. The QCES system designed in this study maintains consistency with the OptiTrack motion capture in the recognition of limb angles.

Table 3.
Comparison of RMSE (SD) and ρ correlation between QCES system and motion capture system.
In the previous sections, this study verified the consistency of the QCES system in capturing data for 10 limb angles compared to the data captured by the OptiTrack motion capture system. In the evaluation results, this study separately calculated the average scores of three experts and the QCES system for the final REBA scores, scores A and B, and RULA final scores, scores A and B, as benchmarks for subsequent validation. As shown in Figure 9, bar charts and independent sample t-tests were used to demonstrate the comparison between the expert ratings on the final REBA and RULA scores and the QCES system’s capture. The results in the figure indicate significant differences in the REBA scores for postures M2-60 and M2-90 (p < 0.01), and significant differences in the RULA scores for posture M2-60. However, the scores for other postures are consistent with the expert assessments.
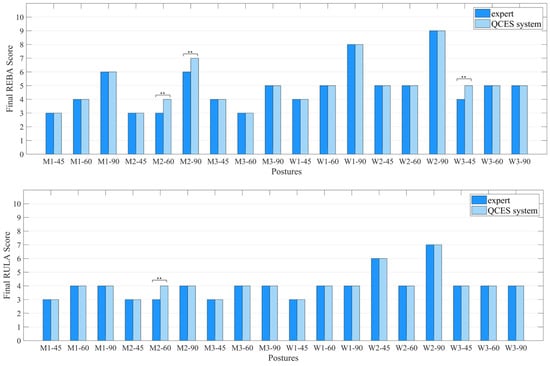
Figure 9.
Comparison of QCES system and experts in the final scores of REBA and RULA, **: significant difference (p < 0.01).
As shown in Table 4, it is evident that there is a “strong” consistency between the QCES system proposed in this study and the experts in terms of the REBA and RULA assessment scores (p < 0.01, 0.664 < kappa < 0.894, with an average RMSE value of 0.368). Therefore, this study can demonstrate that the QCES system can perfectly replace expert scoring in outputting assessment results and rapidly generate assessment results comparable to those of experts. This also confirms the validity of hypothesis H2.

Table 4.
Comparing linearly weighted Cohen kappa and RMSE, the consistency between QCES system and expert evaluation results was observed.
In the previous sections, the accuracy of the QCES system in assessing WMSDs was thoroughly validated. Therefore, this study utilized the assessment data from the QCES system to visually demonstrate the scores of different tilt angles of waste containers in the REBA and RULA assessment methods using bar charts, as shown in Figure 10. When waste collectors retrieve garbage from waste containers positioned at a 90° tilt angle perpendicular to the ground, both the REBA and RULA assessments indicate a moderate risk of WMSDs, necessitating further investigation and posture modification. However, after modification, the tilt angles of the waste containers at 45° and 60° show significant improvement in the workers’ postures, leading to a significant reduction in WMSD risk. Particularly, the waste containers with a 45° tilt angle are assessed as having a low WMSD risk. This confirms the validity of hypothesis H3, indicating that the QCES system can be fully utilized for WMSD risk assessment in a specific occupation and supports in-depth analysis for posture improvement.
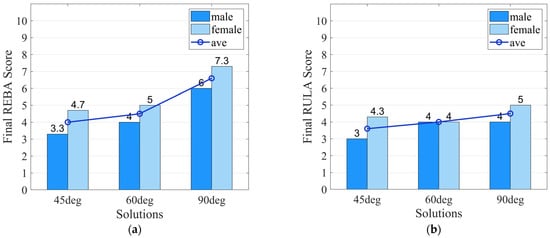
Figure 10.
(a) The total REBA assessment score for males and females. (b) The total RULA assessment score for males and females.
5. Discussion
5.1. Discussion on Experimental Results
The QCES system performs human skeleton recognition on all the working posture images collected in the experiment, generating human skeleton diagrams as shown in Figure 11. The generated human skeleton diagrams show no obvious defects or limb misalignments, indicating that the QCES recognition effect is good, and the coordinate data of the identified key points can be used for subsequent analysis.
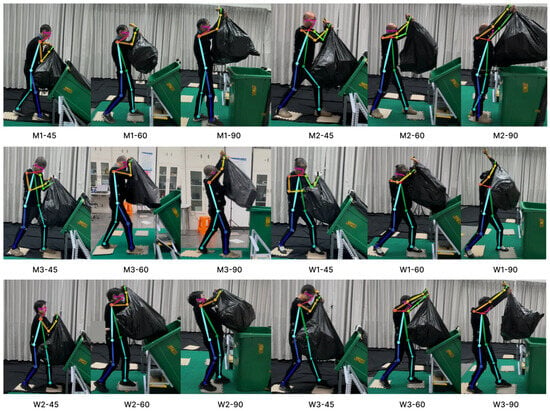
Figure 11.
In this experiment, all subjects QCES identified the human skeleton map generated.
The skeletal points of the working posture recorded by the OptiTrack motion capture system are depicted in Figure 12a, and the joint angles created in the seeker software from these three skeletal points are shown in Figure 12b. The overall recorded posture data is complete, with no missing key points, and the coordinate data of the identified key points can be used for subsequent analysis.

Figure 12.
(a) The human skeleton points identified by OptiTrack motion capture device in this experiment (b) The joint angles generated by seeker software.
The previous sections completed the quantitative statistical identification and analysis of the verification experiment, validating the reliability and feasibility of the QCES system. The study demonstrated that the QCES system has good consistency with the motion capture system in recognizing limb angle data. It also maintains strong consistency with expert assessments in REBA and RULA evaluation scores. However, some detailed data in the experimental results show differences, requiring further analysis and discussion.
In the angle analysis, the average Spearman correlation coefficient for 18 postures is 0.87, slightly higher than the coefficient mentioned in Shum et al.’s study [45] as shown in Table 3. In the REBA and RULA assessments, 81.45% of the QCES system’s evaluation results are entirely consistent with the expert assessment results. The Cohen’s kappa coefficient’s average value in the six evaluation tables is 0.766, and the average Root Mean Square Error (RSME) is 0.408. Both are higher than the results of Shum et al.’s study [45] (average Cohen’s kappa coefficient of 0.624), Abobakr et al. [33] (average Cohen’s kappa coefficient of 0.71, average RSME of 0.41), and Shum et al. [45] (average Cohen’s kappa coefficient of 0.714, average RSME of 0.646). This demonstrates that the QCES system currently exhibits higher accuracy and stability in limb angle recognition and RULA and REBA assessment results, outperforming similar available products.
However, as shown in Table 3, the RMSE values for the two arms in limb angle are relatively high, with the RMSE values for the left upper arm, left forearm, right upper arm, and right forearm being 7.81, 5.94, 5.30, and 7.78, respectively. This could be due to the fact that when the subjects are removing garbage bags, the bags may obstruct the arms to varying degrees, affecting the recognition performance. It is recommended to handle the objects held in hand during the evaluation calculation to avoid obstruction.
The study found that the QCES system and expert assessment results showed slight differences in the REBA scores for postures W3-45, M2-60, and M2-90, as well as in the RULA score for posture M2-60. However, for all other postures, the QCES system’s assessment results were entirely consistent with the expert assessments. Upon retracing the original data, it was discovered that in the REBA assessment of posture W3-45, the expert assessment score for score A was 5 points, while the QCES system assessment score was 4 points. This discrepancy was due to a deviation in the judgment of the forward tilt angle of the neck. The REBA assessment rules state that a neck twist exceeding 20° is scored as +4 points, while a twist within 20° is scored as +2 points. The QCES system identified the angle as 18.16°, while the expert subjectively judged that the forward tilt of the neck exceeded 20°. Similarly, in the assessment of posture M2-90, the discrepancy arose because the assessment result for the right upper arm was close to the boundary angle specified in the assessment rules. The QCES system’s recognition result was 97.49°, while the REBA assessment uses 90° as the boundary angle for the assessment of the right upper arm, leading to a slight difference in the assessment score. In the assessment of posture M2-60, the discrepancy also occurred due to a deviation in the assessment angle of the right wrist. The QCES system’s recognition result was 18.17°, while both REBA and RULA use 15° as the boundary angle for the assessment of the wrist. It was analyzed that at the wrist, due to the need to grab garbage bags, many working postures exhibit bending while also twisting upward or downward, necessitating consideration of the overall spatial angles. However, it is difficult to make accurate judgments solely through observation. This demonstrates that the QCES system’s more objective image analysis method can compensate for potential errors made by experts.
5.2. Discussion on Theposture of Sanitation Workers
Sorting and removing urban waste is one of the primary tasks of sanitation workers. Nayak Sudhir et al. indicated that sanitation workers perform physically demanding tasks in malodorous environments while removing garbage, significantly impacting their physical health [4]. In China, sanitation workers are required to remove garbage at least once a day at centralized urban and rural waste collection points to ensure daily cleaning [46]. One essential task involves removing and packaging garbage bags from trash bins. With a height of 108 cm, a 240 L trash bin poses challenges for sanitation workers, especially considering that the average height of women in China is 160.1 cm, and for men, it is 169.7 cm. Based on surveys, the mode weight of garbage bags was found to be 16 kg. This makes it difficult for sanitation workers to lift heavy garbage bags out of the bins, potentially exposing them to physical risk factors associated with Lower Back Pain (LBP) and Musculoskeletal Disorders (MSDs) during their work. Da Silva et al. [47] found that in developing countries, the activity of lifting waste bags from waste containers often involves shoulder flexion exceeding 90°, increasing the likelihood of developing WMSDs. However, their study had a small sample size of only three individuals without gender differentiation, making it challenging to delve into the specific causes of WMSDs. Furthermore, based on preliminary questionnaires and literature, we have learned that sanitation workers often cannot work in a stable posture due to reasons such as inappropriate dimensions, which can increase the probability of WMSDs risk. However, intervention and changes in working posture can have a mitigating effect [20].
This research is dedicated to investigating the work postures of sanitation workers to understand the causes of work-related musculoskeletal disorders (WMSDs) and fill in existing research gaps. The specific findings of this study indicate that the posture of removing a bag from the waste container at a 90° angle to the ground poses a significant risk, warranting immediate attention and further investigation. Furthermore, the study observed a noticeable improvement when considering the two methods of changing tilt angles, where 45° tilted waste containers were more effective in improving posture than the 60° tilted containers, with a negligible difference. The maximum difference in REBA and RULA scores was 0.5. However, 60° tilted waste containers have a smaller impact on the waste containers’ capacity. In the preliminary field visits, it was noted that sanitation workers typically do not wait for the waste containers to fill up before removing garbage, as fully loaded garbage bags usually weigh between 23–27 kg, making the removal of the garbage bags more difficult. Additionally, this study classified the evaluation results by gender and found that under the same conditions, women generally have a higher probability of suffering from WMSDs than men. As shown in Figure 10, the average REBA assessment result for men was 4.43, and for RULA, it was 3.67, while for women, the REBA assessment result was 5.67, and for RULA, it was 4.43. This may be due to the greater strength of men compared to women, which is consistent with the results of Choi et al.’s study [41].
5.3. Research Contribution and Limitations
The theoretical and practical contributions of this research are as follows:
- (1)
- This study constructs a human body skeletal joint model for analyzing workers’ working postures, defines limb angle calculation formulas and limb state judgment procedures, and discusses the feasibility of musculoskeletal disorder assessment from work posture analysis, enriching the fundamental theoretical research of musculoskeletal disorder risk assessment.
- (2)
- This study combines artificial intelligence algorithms such as convolutional neural networks, pose machines, and convolutional pose machines to apply body skeletal recognition algorithms to musculoskeletal disorder risk assessment, enriching the application of image recognition and other artificial intelligence algorithms in the field of human factors engineering. The research also develops calculation modules for the REBA and RULA assessment methods, improving the accuracy of the system’s assessment and providing new ideas for the development of subsequent assessment methods.
- (3)
- This study conducts comparative validation experiments of the QCES system with OptiTrack motion capture and human factors engineering experts, verifying the reliability of the body skeletal recognition algorithm in the application of musculoskeletal disorder risk assessment and the feasibility of automated assessment procedures for musculoskeletal disorder risk assessment. The experimental design and data analysis methods and results in this study can provide new insights and references for subsequent research on musculoskeletal disorder risk assessment and system validation experiments in the field of human factors engineering.
From an academic paper perspective, the engineering contributions of this study are as follows:
- (1)
- The proposed system in this study utilizes smartphones as carriers, addressing the cumbersome and time-consuming nature of musculoskeletal disorder assessments. This innovation enables the widespread application of intelligent assessment systems for evaluating factory workers’ working postures. For example, as mentioned in this paper, city management personnel can use the assessment results of the QCES system to improve the tilt angle of waste containers in decision-making, thereby minimizing the risk of WMSDs for sanitation workers when handling garbage bags and reducing the consumption of human and material resources.
- (2)
- In experimental validation, we found that the QCES system exhibits high assessment efficiency and accuracy. The assessment reports provide detailed evaluation data for multiple assessment methods, offering a powerful assessment tool for researchers in related fields to conduct in-depth investigations and analyses.
- (3)
- In the study of sanitation workers, this research found that adjusting the tilt angle of waste containers, without altering their original design, can improve the working posture of sanitation workers when removing garbage and reduce the risk of musculoskeletal disorders associated with such tasks.
There are still some limitations that need to be addressed, including:
- (1)
- The current system only completed comprehensive assessments of the REBA and RULA assessment methods, providing detailed data for the assessments conducted by these two methods. However, each assessment method has its own strengths and limitations in practical work. Therefore, it is necessary to further expand the musculoskeletal disorder risk assessment methods based on the proposed system to meet the needs of different working environments for musculoskeletal disorder risk assessment methods.
- (2)
- The experimental design included the assessment of WMSDs risks for sanitation workers when clearing waste containers and the comparative assessment of the improved solution, forming a relatively complete process of assessing-dangerous postures-improvement-results comparison. However, this study only evaluated and tested one occupation. In terms of algorithm extension, it is necessary to test the impact of different operational positions on the system’s recognition and assessment accuracy.
6. Conclusions
This study proposes a Work-Related Musculoskeletal Disorder risk assessment system based on posture recognition. The system does not interfere with workers’ normal tasks during usage and does not require complex equipment. Assessors only need to use a smartphone to capture images of workers’ postures and input the necessary data. After uploading, the QCES system provides musculoskeletal disorder risk assessment results for the current task posture in the form of a report on the mobile end. Assessors can directly guide workers to correct their task postures based on improvement suggestions provided in an online report or download detailed offline reports for in-depth analysis. Furthermore, this study verified the accuracy of the QCES system in recognizing limb angles through a comparative analysis with OptiTrack motion capture. The study also found high consistency between the scores of the REBA and RULA assessments and those provided by three experts. Finally, the application of the QCES system in assessing the postures of sanitation workers and exploring optimal intervention methods demonstrated that the existing work methods pose safety hazards, and changing the angle of the trash bin can improve WMSDs. Additionally, the study confirmed that the QCES system not only helps managers quickly identify problems but also supports researchers in conducting more in-depth studies.
Author Contributions
Conceptualization, R.Z. and M.H.; methodology, R.Z.; software, M.H.; validation, M.H.; investigation, M.H.; resources, R.Z.; data curation, M.H.; writing—original draft preparation, M.H.; writing—review and editing, R.Z.; visualization, M.H.; supervision, R.Z.; project administration, R.Z.; funding acquisition, R.Z. All authors have read and agreed to the published version of the manuscript.
Funding
This work was found by Guangzhou Science and Technology Program Key Research and Development Project (grant number.2023B04J0106, 2023B04J0121). And This research was funded Ministry of Education Humanities and Social Science Research Planning Fund (grant number: 23YJAZH201).
Institutional Review Board Statement
The study was conducted in accordance with the Declaration of Helsinki, and approved by the Institutional Review Board of Committee for the Review of Institutions at Guangzhou Elderly Hospital (protocol code MR-44-23-027541 and date of approval (1 April 2023)).
Informed Consent Statement
Informed consent was obtained from all subjects involved in the study.
Data Availability Statement
The raw data supporting the concluslons of this article will be made avallable by the authors on request.
Acknowledgments
Thanks to the OptiTrack motion capture provided by the International Cooperation Center for Design Strategy of Guangdong, Hong Kong, and Macao Greater Bay Area, and to all the sanitation workers and ergonomics experts who participated in the experiment.
Conflicts of Interest
The authors declare no conflicts of interest.
References
- Kee, D. Characteristics of Work-Related Musculoskeletal Disorders in Korea. Int. J. Environ. Res. Public Health 2023, 20, 1024. [Google Scholar] [CrossRef] [PubMed]
- Schneider, E.; Irastorza, X.; Copsey, S. OSH (Occupational Safety and Health) in Figures: Work-Related Musculoskeletal Disorders in the EU-Facts and Figures; Office for Official Publications of the European Communities: Luxembourg, Luxembourg, 2010. [Google Scholar]
- Kok, J.; Vroonhof, P.; Snijders, J.; Roullis, G.; Clarke, M.; Peereboom, K.; Dorst, P.; Isusi, I. Work-Related Musculoskeletal Disorders: Prevalence, Costs and Demographics in the EU; Publications Office: Luxembourg, 2020. [Google Scholar]
- Nayak, S.; Shenoi, S.; Kaur, G.; Bisen, N.; Purkayastha, A.; Chalissery, J. Dermatologic evaluation of street sanitation workers. Indian J. Dermatol. 2013, 58, 246. [Google Scholar] [CrossRef] [PubMed]
- Ferguson, S.A.; Marras, W.S.; Allread, W.G.; Knapik, G.G.; Vandlen, K.A.; Splittstoesser, R.E.; Yang, G. Musculoskeletal disorder risk as a function of vehicle rotation angle during assembly tasks. Appl. Ergon. 2011, 42, 699–709. [Google Scholar] [CrossRef] [PubMed]
- Jennifer, M.; Darrin, A. Work-related musculoskeletal disorder surveillance using the Washington state workers’ compensation system: Recent declines and patterns by industry, 1999–2013. Am. J. Ind. Med. 2017, 60, 457–471. [Google Scholar]
- Bevan, S. Economic impact of musculoskeletal disorders (MSDs) on work in Europe. Best Res. Clin. Pract. Rheumatol. 2015, 29, 356–373. [Google Scholar] [CrossRef]
- Aptel, M.; Aublet-Cuvelier, A.; Cnockaert, J.C. Work-related musculoskeletal disorders of the upper limb. Jt. Bone Spine 2002, 69, 546–555. [Google Scholar] [CrossRef] [PubMed]
- Nath, N.D.; Akhavian, R.; Behzadan, A.H. Ergonomic analysis of construction worker’s body postures using wearable mobile sensors. Appl. Ergon. 2017, 62, 107–117. [Google Scholar] [CrossRef]
- Johansson, S.E.; Ljunggren, G. Perceived exertion during a self-imposed pace of work for a group of cleaners. Appl. Ergon. 1989, 20, 307–312. [Google Scholar] [CrossRef]
- Wami, S.D.; Dessie, A.; Chercos, D.H. The impact of work-related risk factors on the development of neck and upper limb pain among low wage hotel housekeepers in Gondar town, Northwest Ethiopia: Institution-based cross-sectional study. Environ. Health Prev. Med. 2019, 24, 1–10. [Google Scholar] [CrossRef]
- Melese, H.; Gebreyesus, T.; Alamer, A. Prevalence and associated factors of musculoskeletal disorders among cleaners working at Mekelle University, Ethiopia. J. Pain Res. 2020, 13, 2239–2246. [Google Scholar] [CrossRef]
- Bazazan, A.; Dianat, I.; Feizollahi, N.; Mombeini, A.; Shirazi, A.H.; Castellucci, H.I. Effect of a posture correction based intervention on musculoskeletal symptoms and fatigue among control room operators. Appl. Ergon. 2019, 76, 12–19. [Google Scholar] [CrossRef] [PubMed]
- Kuorinka, I.; Jonsson, B.; Kilbom, A. Standardized Nordic Questionnaires for the Analysis of Musculoskeletal Symptoms. Appl. Ergon. 1987, 18, 233–237. [Google Scholar] [CrossRef]
- Munk, R.; Storheim, K.; Smastuen, M.C. Measuring Productivity Costs in Patients With Musculoskeletal Disorders: Measurement Properties of the Institute for Medical Technology Assessment Productivity Cost Questionnaire. Value Health 2019, 22, 1410–1416. [Google Scholar] [CrossRef]
- Hildebrandt, V.H.; Bongers, P.M.; Dijk, F. Dutch Musculoskeletal Questionnaire: Description and Basic Qualities. Ergonomics 2001, 44, 1038–1055. [Google Scholar] [CrossRef]
- Kołodziej, M.; Majkowski, A.; Rysz, A. Implementation of Machine Learning and Deep Learning Techniques for the Detection of Epileptic Seizures Using Intracranial Electroencephalography. Appl. Sci. 2023, 13, 8747. [Google Scholar] [CrossRef]
- Brinkmann, A.; Kowalski, C.; Lau, S.; Meyer, O.; Diekmann, R.; Hein, A. Chair squat performance as a potential predictor of nurses’ physical capabilities in ergonomic patient transfers. Sci. Rep. 2023, 13, 2825. [Google Scholar] [CrossRef]
- Colim, A.; Pereira, D.; Lima, P.; Cardoso, A.; Almeida, R.; Fernandes, D.; Mould, S.; Arezes, P. Designing a User-Centered Inspection Device’s Handle for the Aircraft Manufacturing Industry. Appl. Sci. 2023, 13, 11584. [Google Scholar] [CrossRef]
- Allread, W.G.; Vossenas, P. Comparisons of Trunk Motions and Low Back Injury Risk between Alternative Hotel Room Cleaning Methods. Int. J. Environ. Res. Public Health 2022, 19, 14907. [Google Scholar] [CrossRef]
- Hignett, S.; Mcatamney, L. Rapid Entire Body Assessment (REBA). Appl. Ergon. 2000, 31, 201–205. [Google Scholar] [CrossRef]
- Karhu, O.; Kansi, P.; Kuorinka, I. Correcting Working Postures in Industry: A Practical Method for Analysis. Appl. Ergon. 1977, 8, 199–201. [Google Scholar] [CrossRef]
- Waters, T.; Putz, A.V.; Garg, A. Revised NIOSH Equation for the Design and Evaluation of Manual Lifting Tasks. Ergonomics 1993, 36, 749–776. [Google Scholar] [CrossRef]
- Cardona, M.; García Cena, C.E.; Serrano, F.; Saltaren, R. ALICE: Conceptual Development of a Lower Limb Exoskeleton Robot Driven by an On-Board Musculoskeletal Simulator. Sensors 2020, 20, 789. [Google Scholar] [CrossRef]
- Zhang, M.; Shi, R.; Yang, Z. A critical review of vision-based occupational health and safety monitoring of construction site workers. Saf. Sci. 2020, 126, 104658. [Google Scholar] [CrossRef]
- Mcatamney, L.; Corlett, N. RULA: A Survey Method for the Investigation of Work-related Upper Limb Disorders. Appl. Ergon. 1993, 24, 91–99. [Google Scholar] [CrossRef]
- Garg, A.; Moore, J.S.; Kapellusch, J.M. The Revised Strain Index: An improved upper extremity exposure assessment model. Ergonomics 2016, 60, 912–922. [Google Scholar] [CrossRef]
- Cruz-Montecinos, C.; Cuesta-Vargas, A.; Muñoz, C.; Flores, D.; Ellsworth, J.; De la Fuente, C.; Calatayud, J.; Rivera-Lillo, G.; Soto-Arellano, V.; Tapia, C.; et al. Impact of Visual Biofeedback of Trunk Sway Smoothness on Motor Learning during Unipedal Stance. Sensors 2020, 20, 2585. [Google Scholar] [CrossRef]
- González, A.; Hayashibe, M.; Bonnet, V.; Fraisse, P. Whole body center of mass estimation with portable sensors: Using the statically equivalent serial chain and a Kinect. Sensors 2014, 14, 16955–16971. [Google Scholar] [CrossRef] [PubMed]
- Humadi, A.; Nazarahari, M.; Ahmad, R.; Rouhani, H. In-field instrumented ergonomic risk a ssessment: Inertial measurement units versus Kinect V2. Int. J. Ind. Ergon. 2021, 84, 103147. [Google Scholar] [CrossRef]
- Chen, L.Y.; Li, S.; Bai, Q. Review of Image Classification Algorithms Based on Convolutional Neural Networks. Remote Sens. 2021, 13, 4712. [Google Scholar] [CrossRef]
- He, J.; Zhang, C.; He, X.L. Visual Recognition of traffic police gestures with convolutional pose machine and handcrafted features. Neurocomputing 2020, 390, 248–259. [Google Scholar] [CrossRef]
- Abobakr, A.; Nahavandi, D.; Hossny, M.; Iskander, J.; Attia, M.; Nahavandi, S.; Smets, M. RGB-D ergonomic assessment system of adopted working postures. Appl. Ergon. 2019, 80, 75–88. [Google Scholar] [CrossRef]
- Jeong, S.-o.; Kook, J. CREBAS: Computer-Based REBA Evaluation System for Wood Manufacturers Using MediaPipe. Appl. Sci. 2023, 13, 938. [Google Scholar] [CrossRef]
- Gong, F.M.; Ma, Y.H.; Zheng, P. A deep model method for recognizing activities of workers on offshore drilling platform by multistage convolutional pose machine. J. Loss Prev. Process Ind. 2020, 64, 104043. [Google Scholar] [CrossRef]
- Wei, E.; Ramalrishna, V.; Kanade, T. Convolutional Pose Machines. In Proceedings of the IEEE Conference on Computer Vision and Pattern Recognition 2016, Las Vegas, NV, USA, 26 June–1 July 2016. [Google Scholar]
- Kong, Y.; Li, J.; Hu, L.; Li, X. Semi-Supervised Learning Matting Algorithm Based on Semantic Consistency of Trimaps. Appl. Sci. 2023, 13, 8616. [Google Scholar] [CrossRef]
- Zhang, R.Q.; Ze, L. Trends of Risk Assessment Methods for Musculoskeletal Diseases. Packag. Eng. 2020, 41, 49. [Google Scholar]
- U.S. Bureau of Labor Statistics. Labor Force Statistics from the Current Population Survey 2020. Table 11b. Employed Persons by Detailed Occupation Andage. 2021b. Available online: https://www.bls.gov/cps/cpsaat11b.htm (accessed on 18 February 2023).
- Zock, J.P. World at work: Cleaners. Occup. Environ. Med. 2005, 62, 581–584. [Google Scholar] [CrossRef] [PubMed]
- Choi, H.W.; Kim, Y.K.; Kang, D.M.; Kim, J.E.; Jang, B.Y. Characteristics of occupational musculoskeletal disorders of five sectors in service industry between 2004 and 2013. Ann. Occup. Environ. Med. 2017, 29, 41. [Google Scholar] [CrossRef]
- Fernández-González, P.; Koutsou, A.; Cuesta-Gómez, A.; Carratalá-Tejada, M.; Miangolarra-Page, J.C.; Molina-Rueda, F. Reliability of Kinovea® Software and Agreement with a Three-Dimensional Motion System for Gait Analysis in Healthy Subjects. Sensors 2020, 20, 3154. [Google Scholar] [CrossRef]
- Manghisi, V.M.; Uva, A.E.; Fiorentino, M.; Bevilacqua, V.; Trotta, G.F.; Monno, G. Real time RULA assessment using Kinect v2 sensor. Appl. Ergon. 2017, 65, 481–491. [Google Scholar] [CrossRef]
- Diego-Mas, J.A.; Alcaide-Marzal, J. Using Kinect Sensor in Observational Methods for Assessing Postures at Work. Appl. Ergon. 2014, 45, 976–985. [Google Scholar] [CrossRef]
- Plantard, P.; Shum, H.P.H.; Le Pierres, A.S.; Multon, F. Validation of an ergonomic assessment method using Kinect data in real workplace conditions. Appl. Ergon. 2017, 65, 562–569. [Google Scholar] [CrossRef] [PubMed]
- GB/T 41085-2021; Requirements for Cleaning Service of Urban and Rural Communities. The Standardization Administration of the State Administration for Market Regulation: Beijing China, 2021; pp. 4–5.
- Da Silva, L.; Forcelini, F.; Varnier, T.; Merino, G.S.; Merino, E.A. Contribution Ergonomic Assessment of Musculoskeletal Hazards in Waste Bag Removal from Containers. In Occupational and Environmental Safety and Health II; Springer International Publishing: Cham, Switzerland, 2020; pp. 323–330. [Google Scholar]
Disclaimer/Publisher’s Note: The statements, opinions and data contained in all publications are solely those of the individual author(s) and contributor(s) and not of MDPI and/or the editor(s). MDPI and/or the editor(s) disclaim responsibility for any injury to people or property resulting from any ideas, methods, instructions or products referred to in the content. |
© 2024 by the authors. Licensee MDPI, Basel, Switzerland. This article is an open access article distributed under the terms and conditions of the Creative Commons Attribution (CC BY) license (https://creativecommons.org/licenses/by/4.0/).