
Verification of the Applicability of Obstacle Recognition Distance as a Measure of Effectiveness of Road Lighting on Rainy and Foggy Roads
Abstract
:1. Introduction
2. Literature Review
3. Experimental Environment and Method
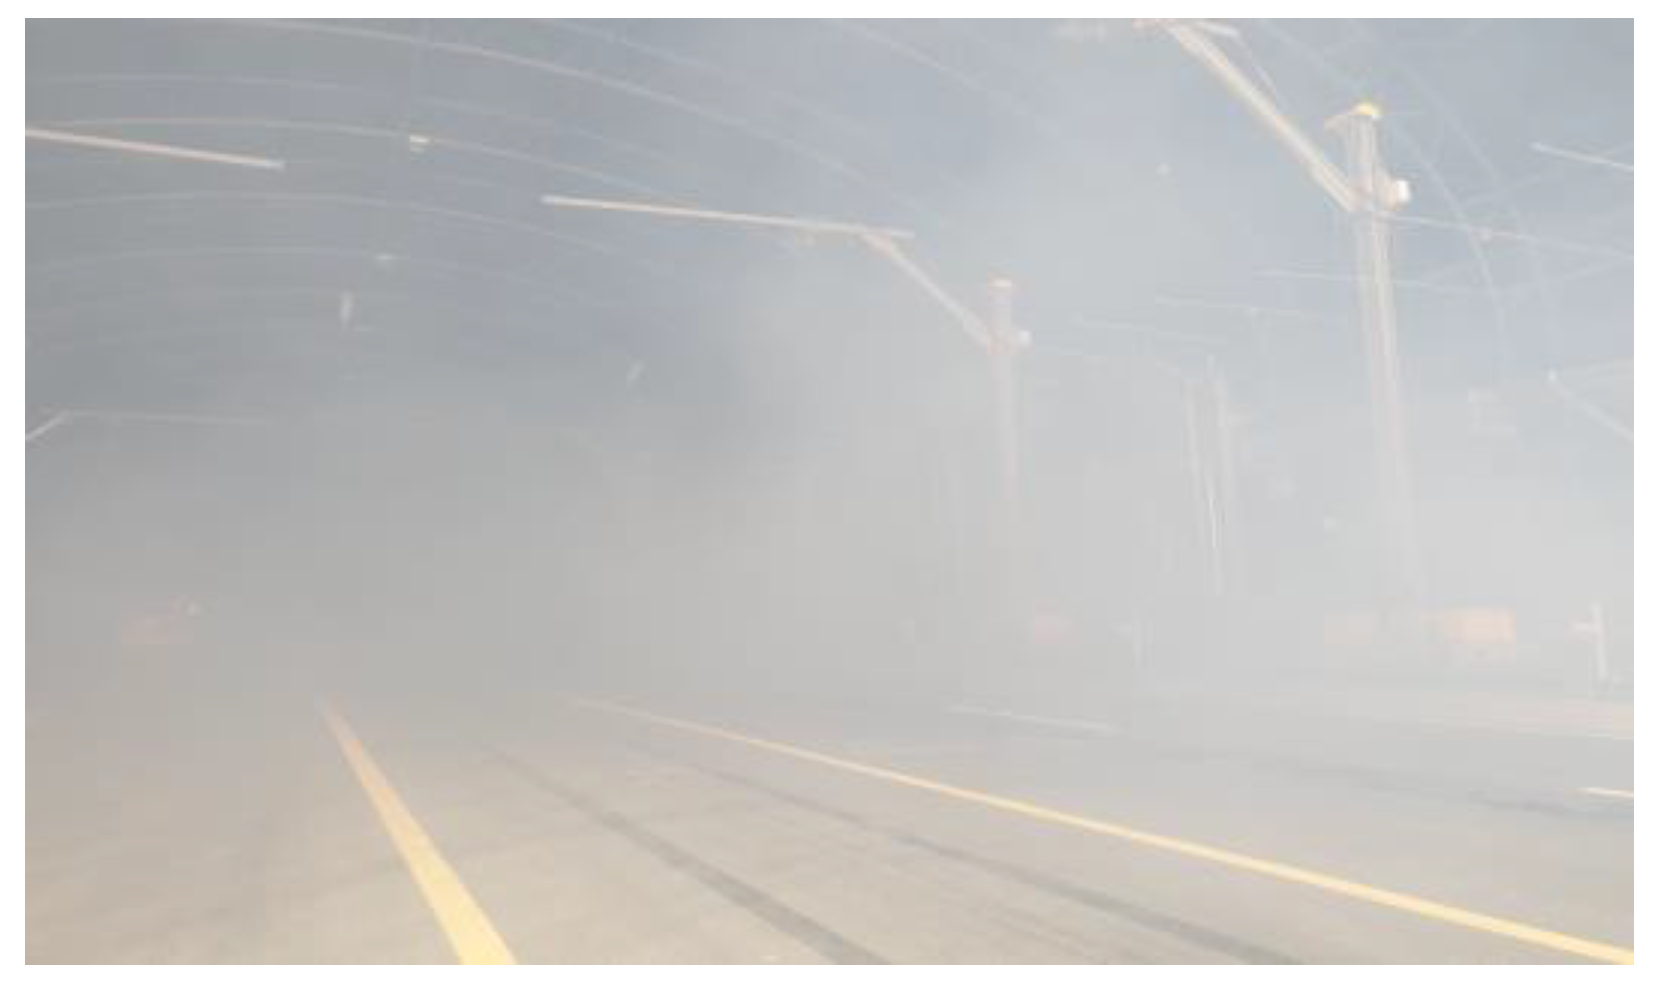
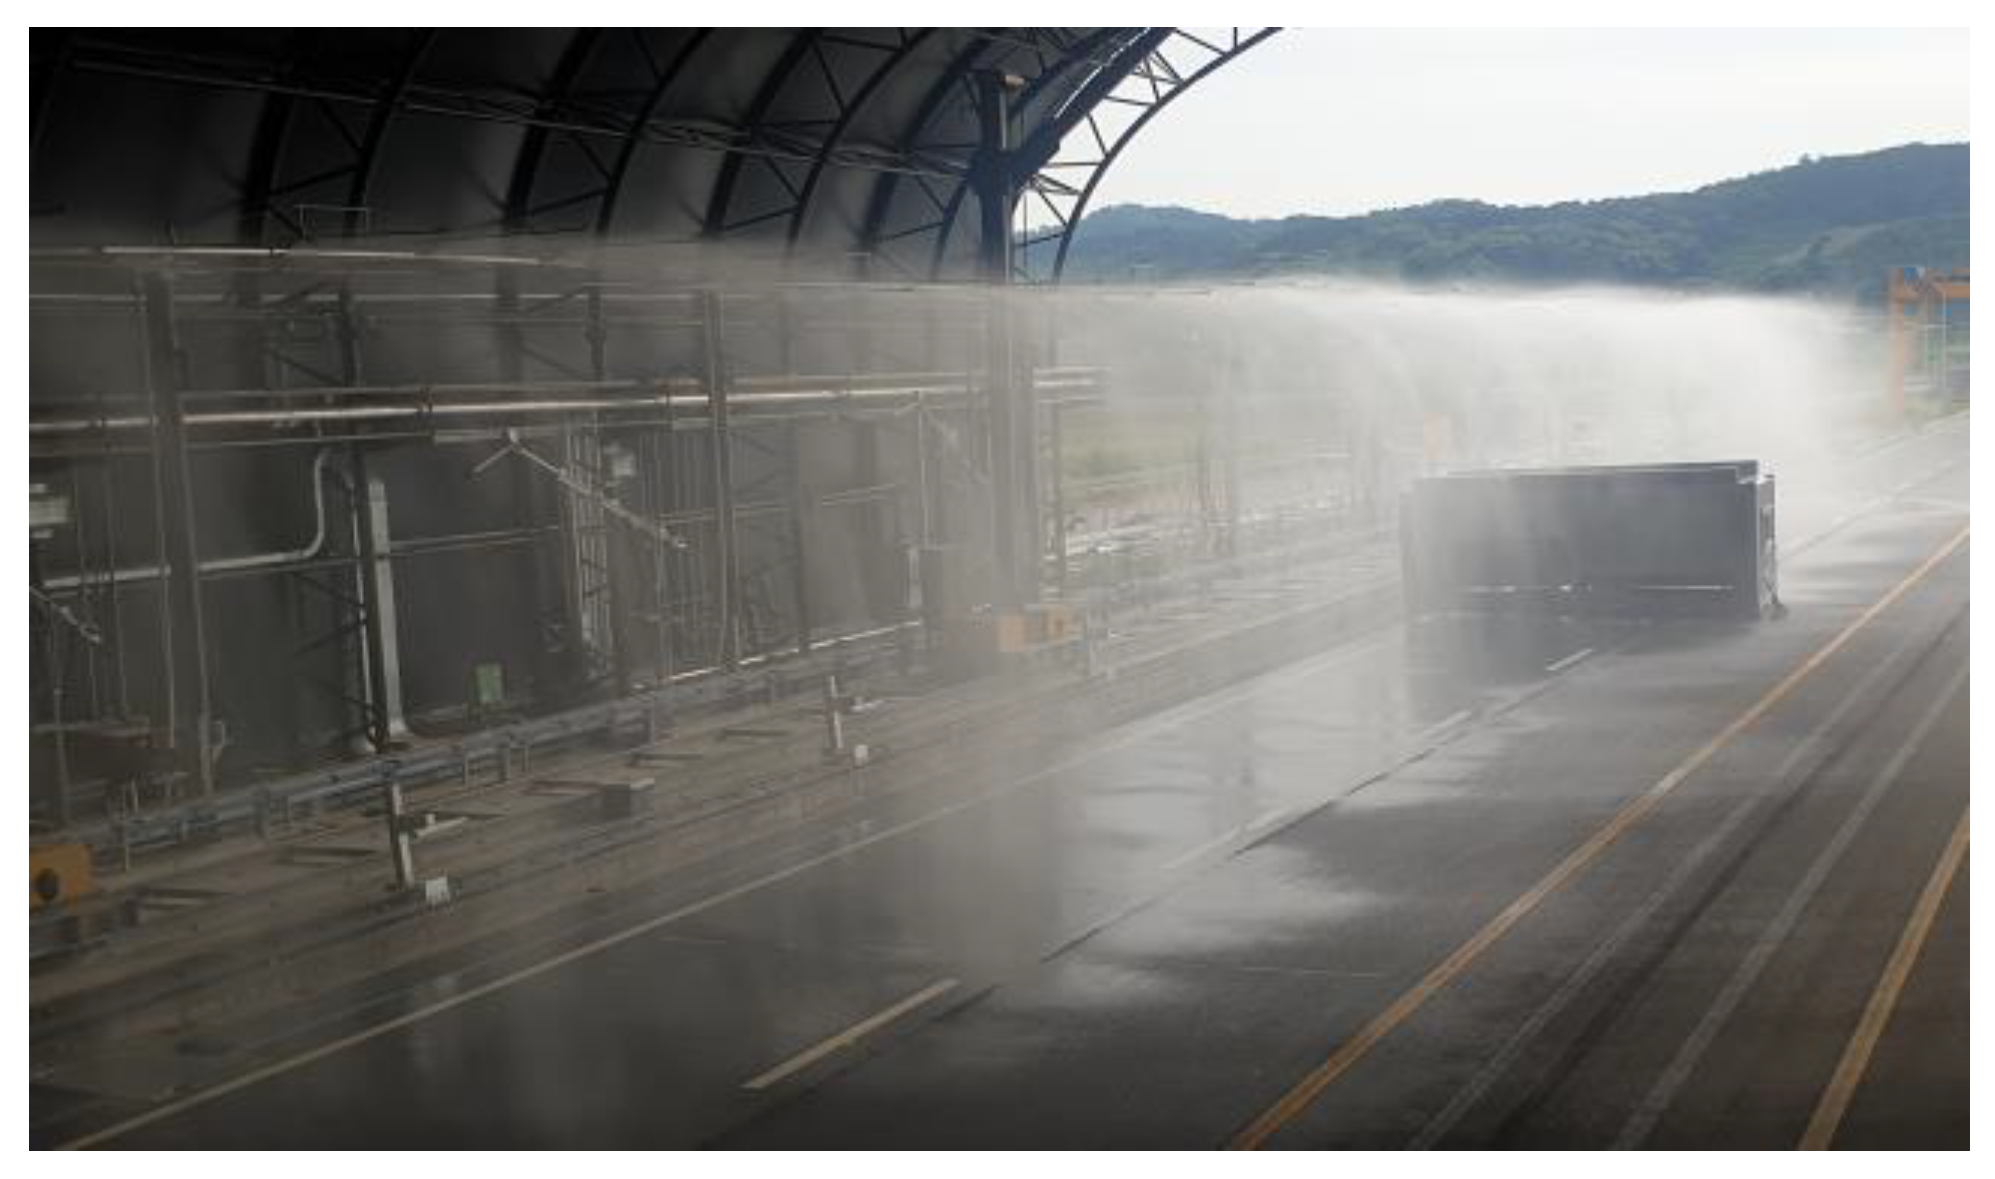
3.1. Experimental Location
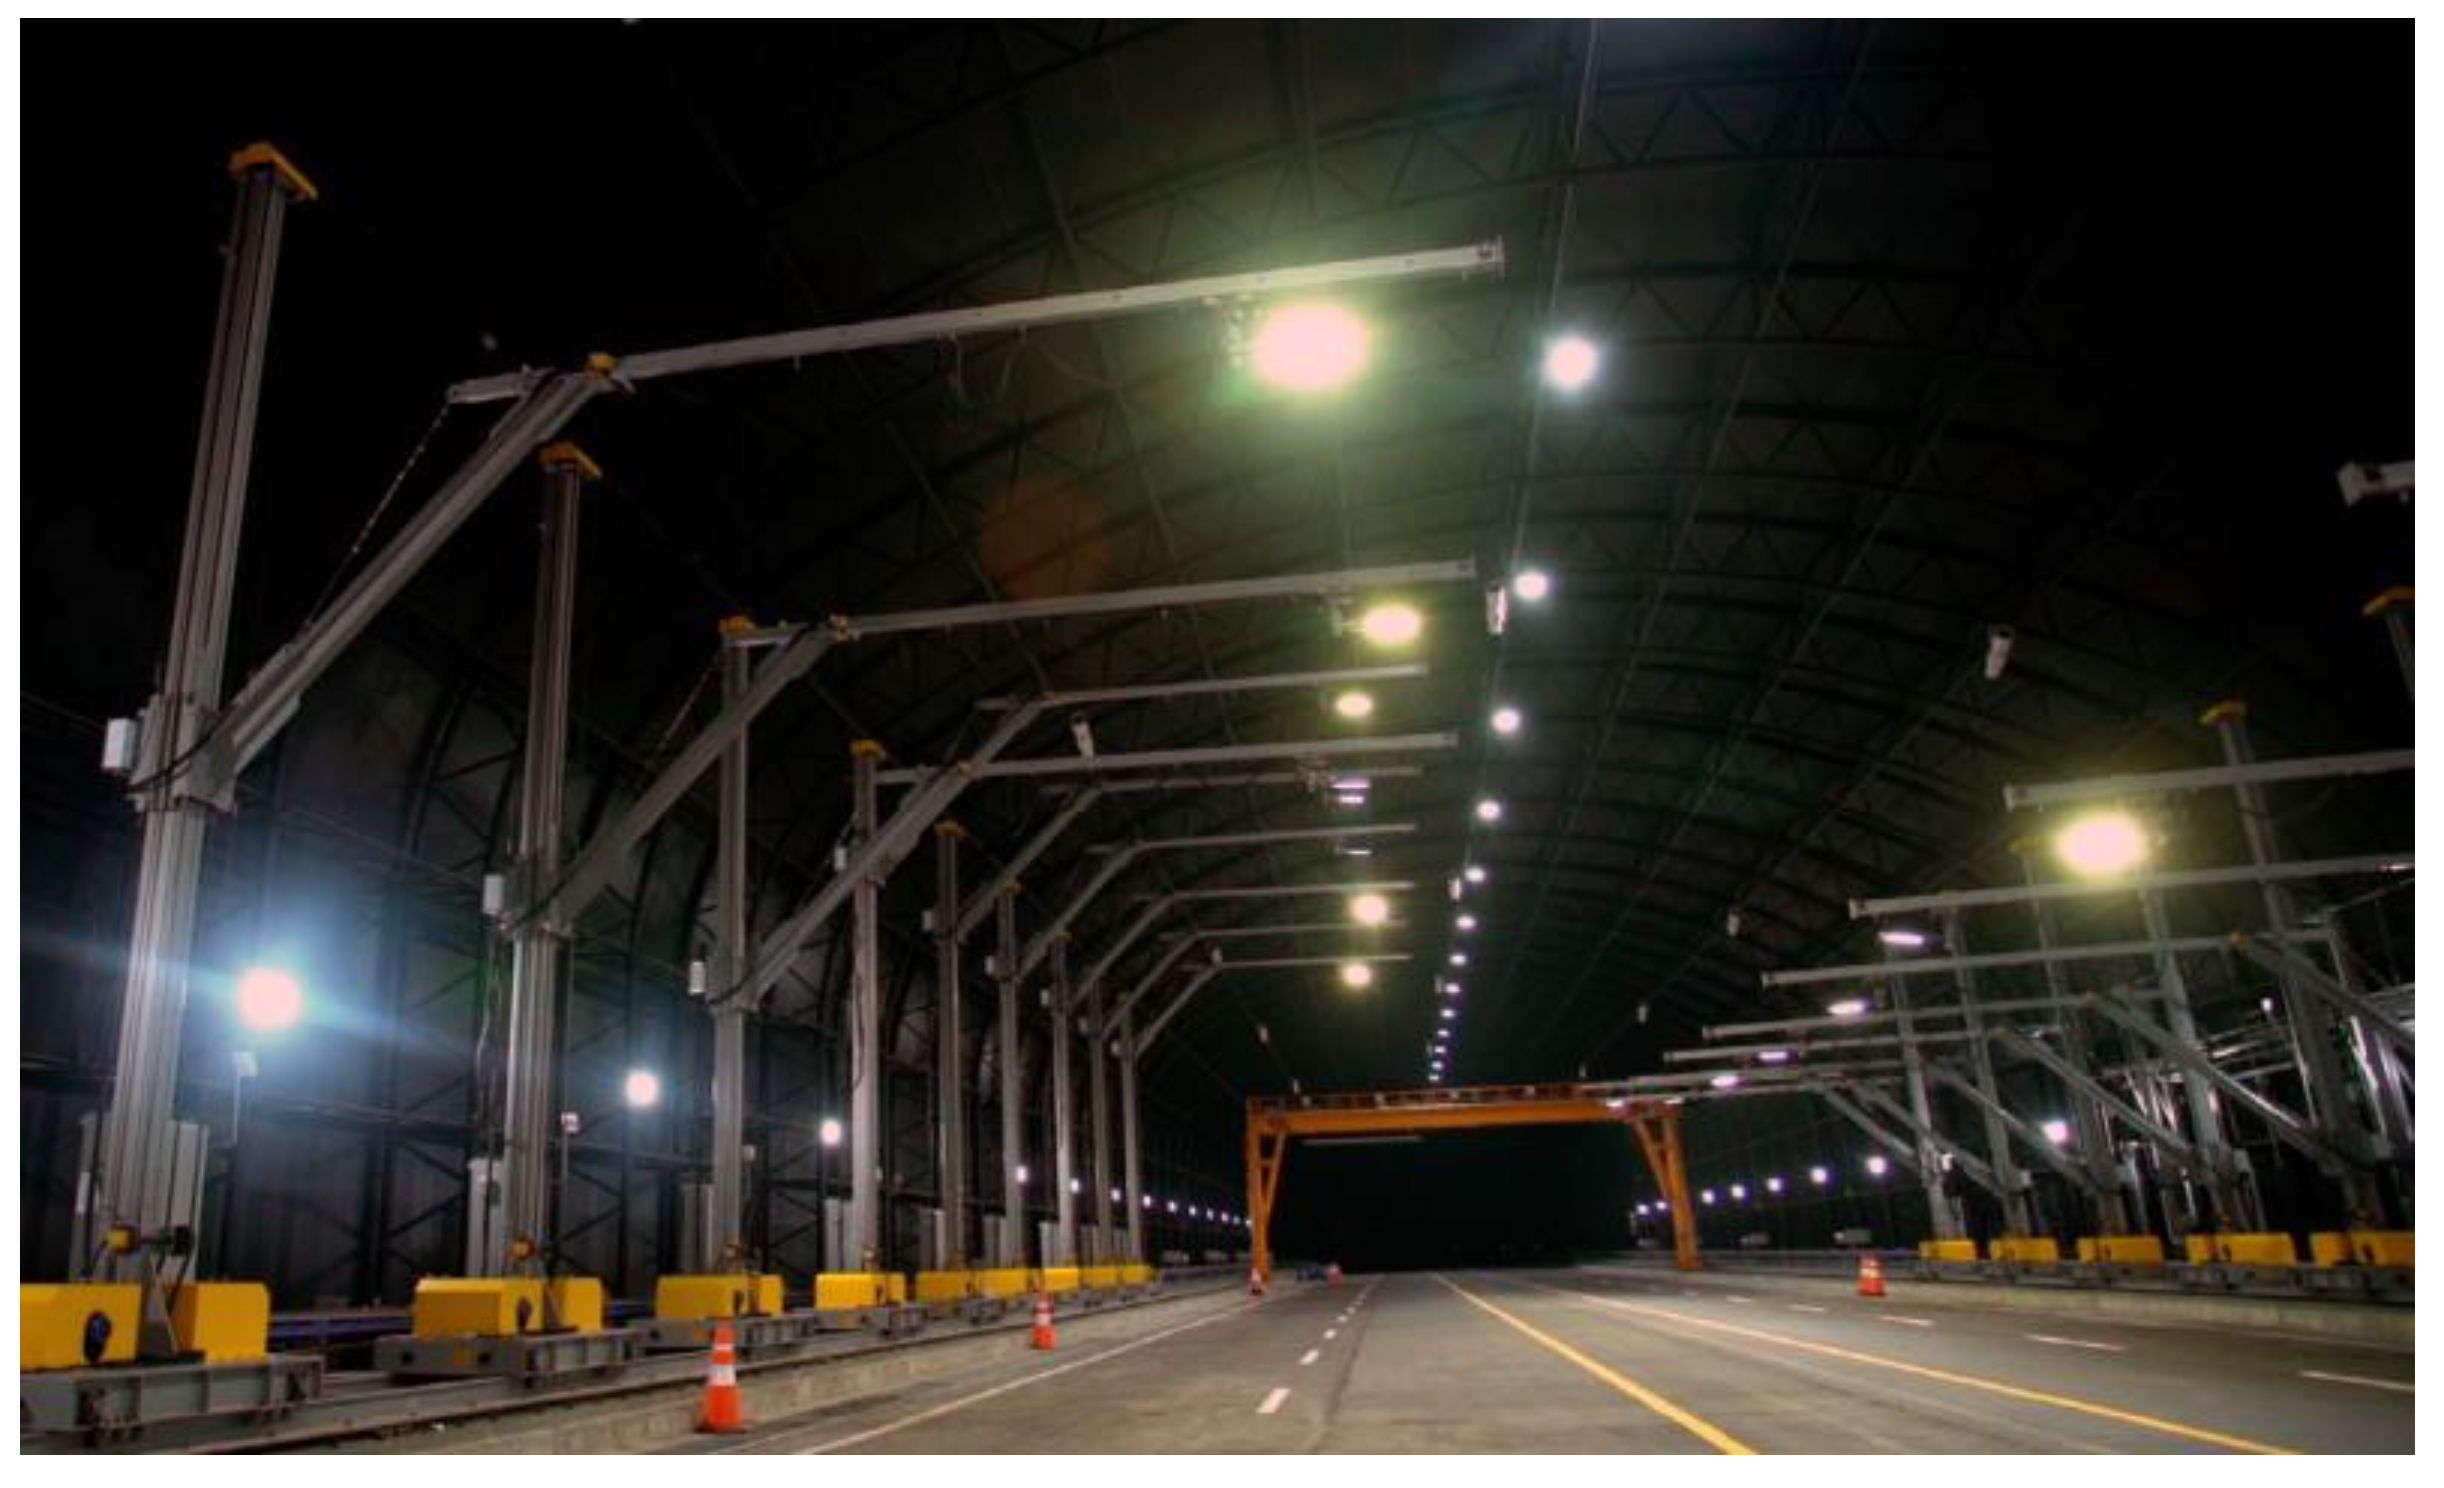
3.2. Experimental Road Lighting
3.3. Subject
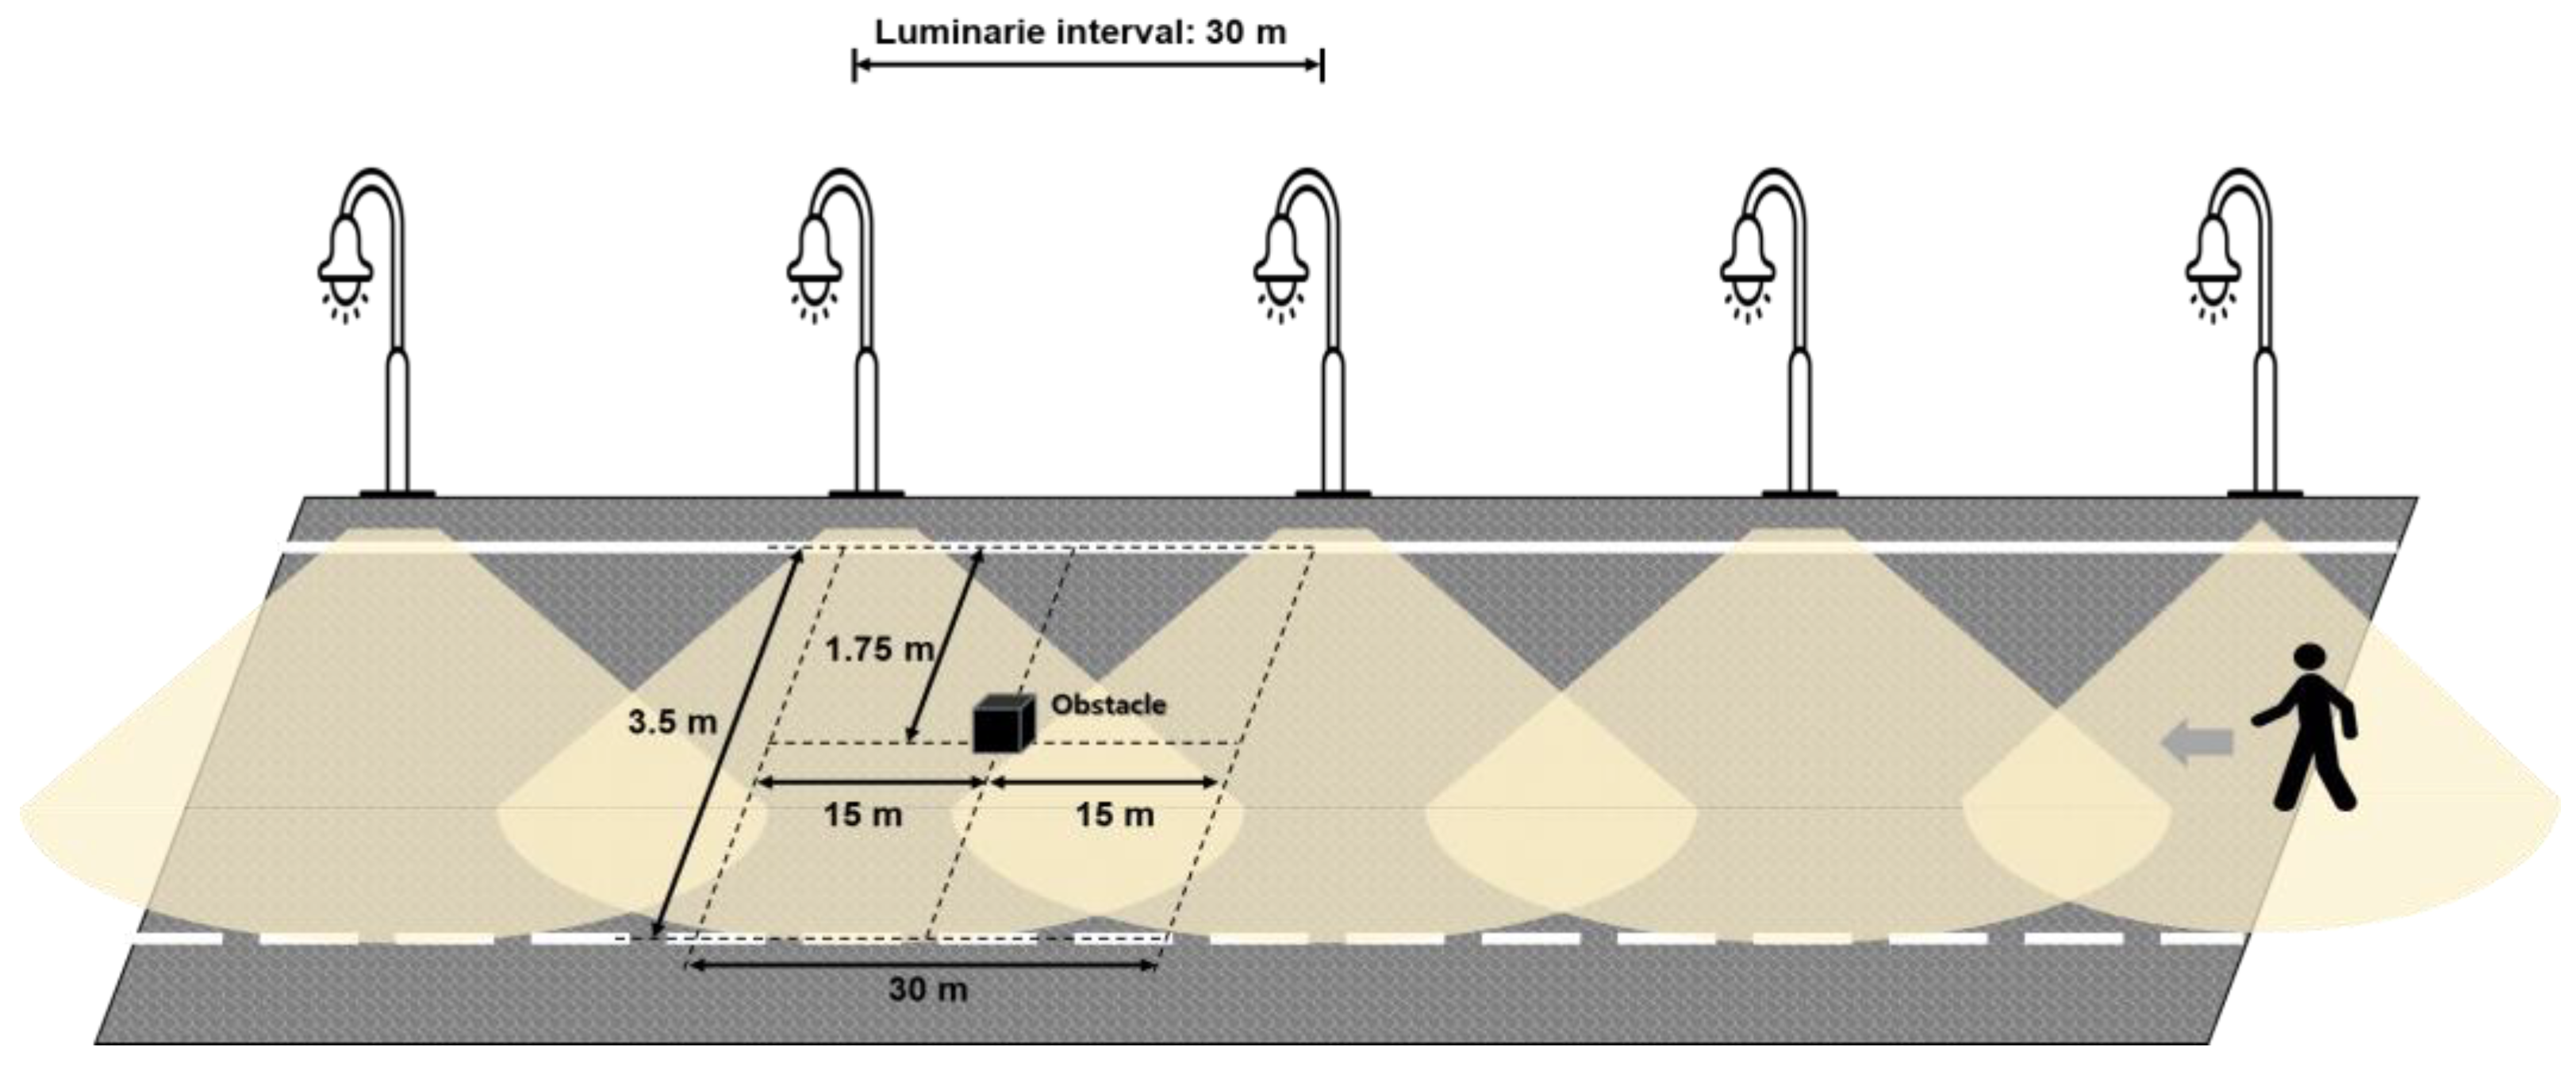
3.4. Obstacle
3.5. Test Procedure
4. Result
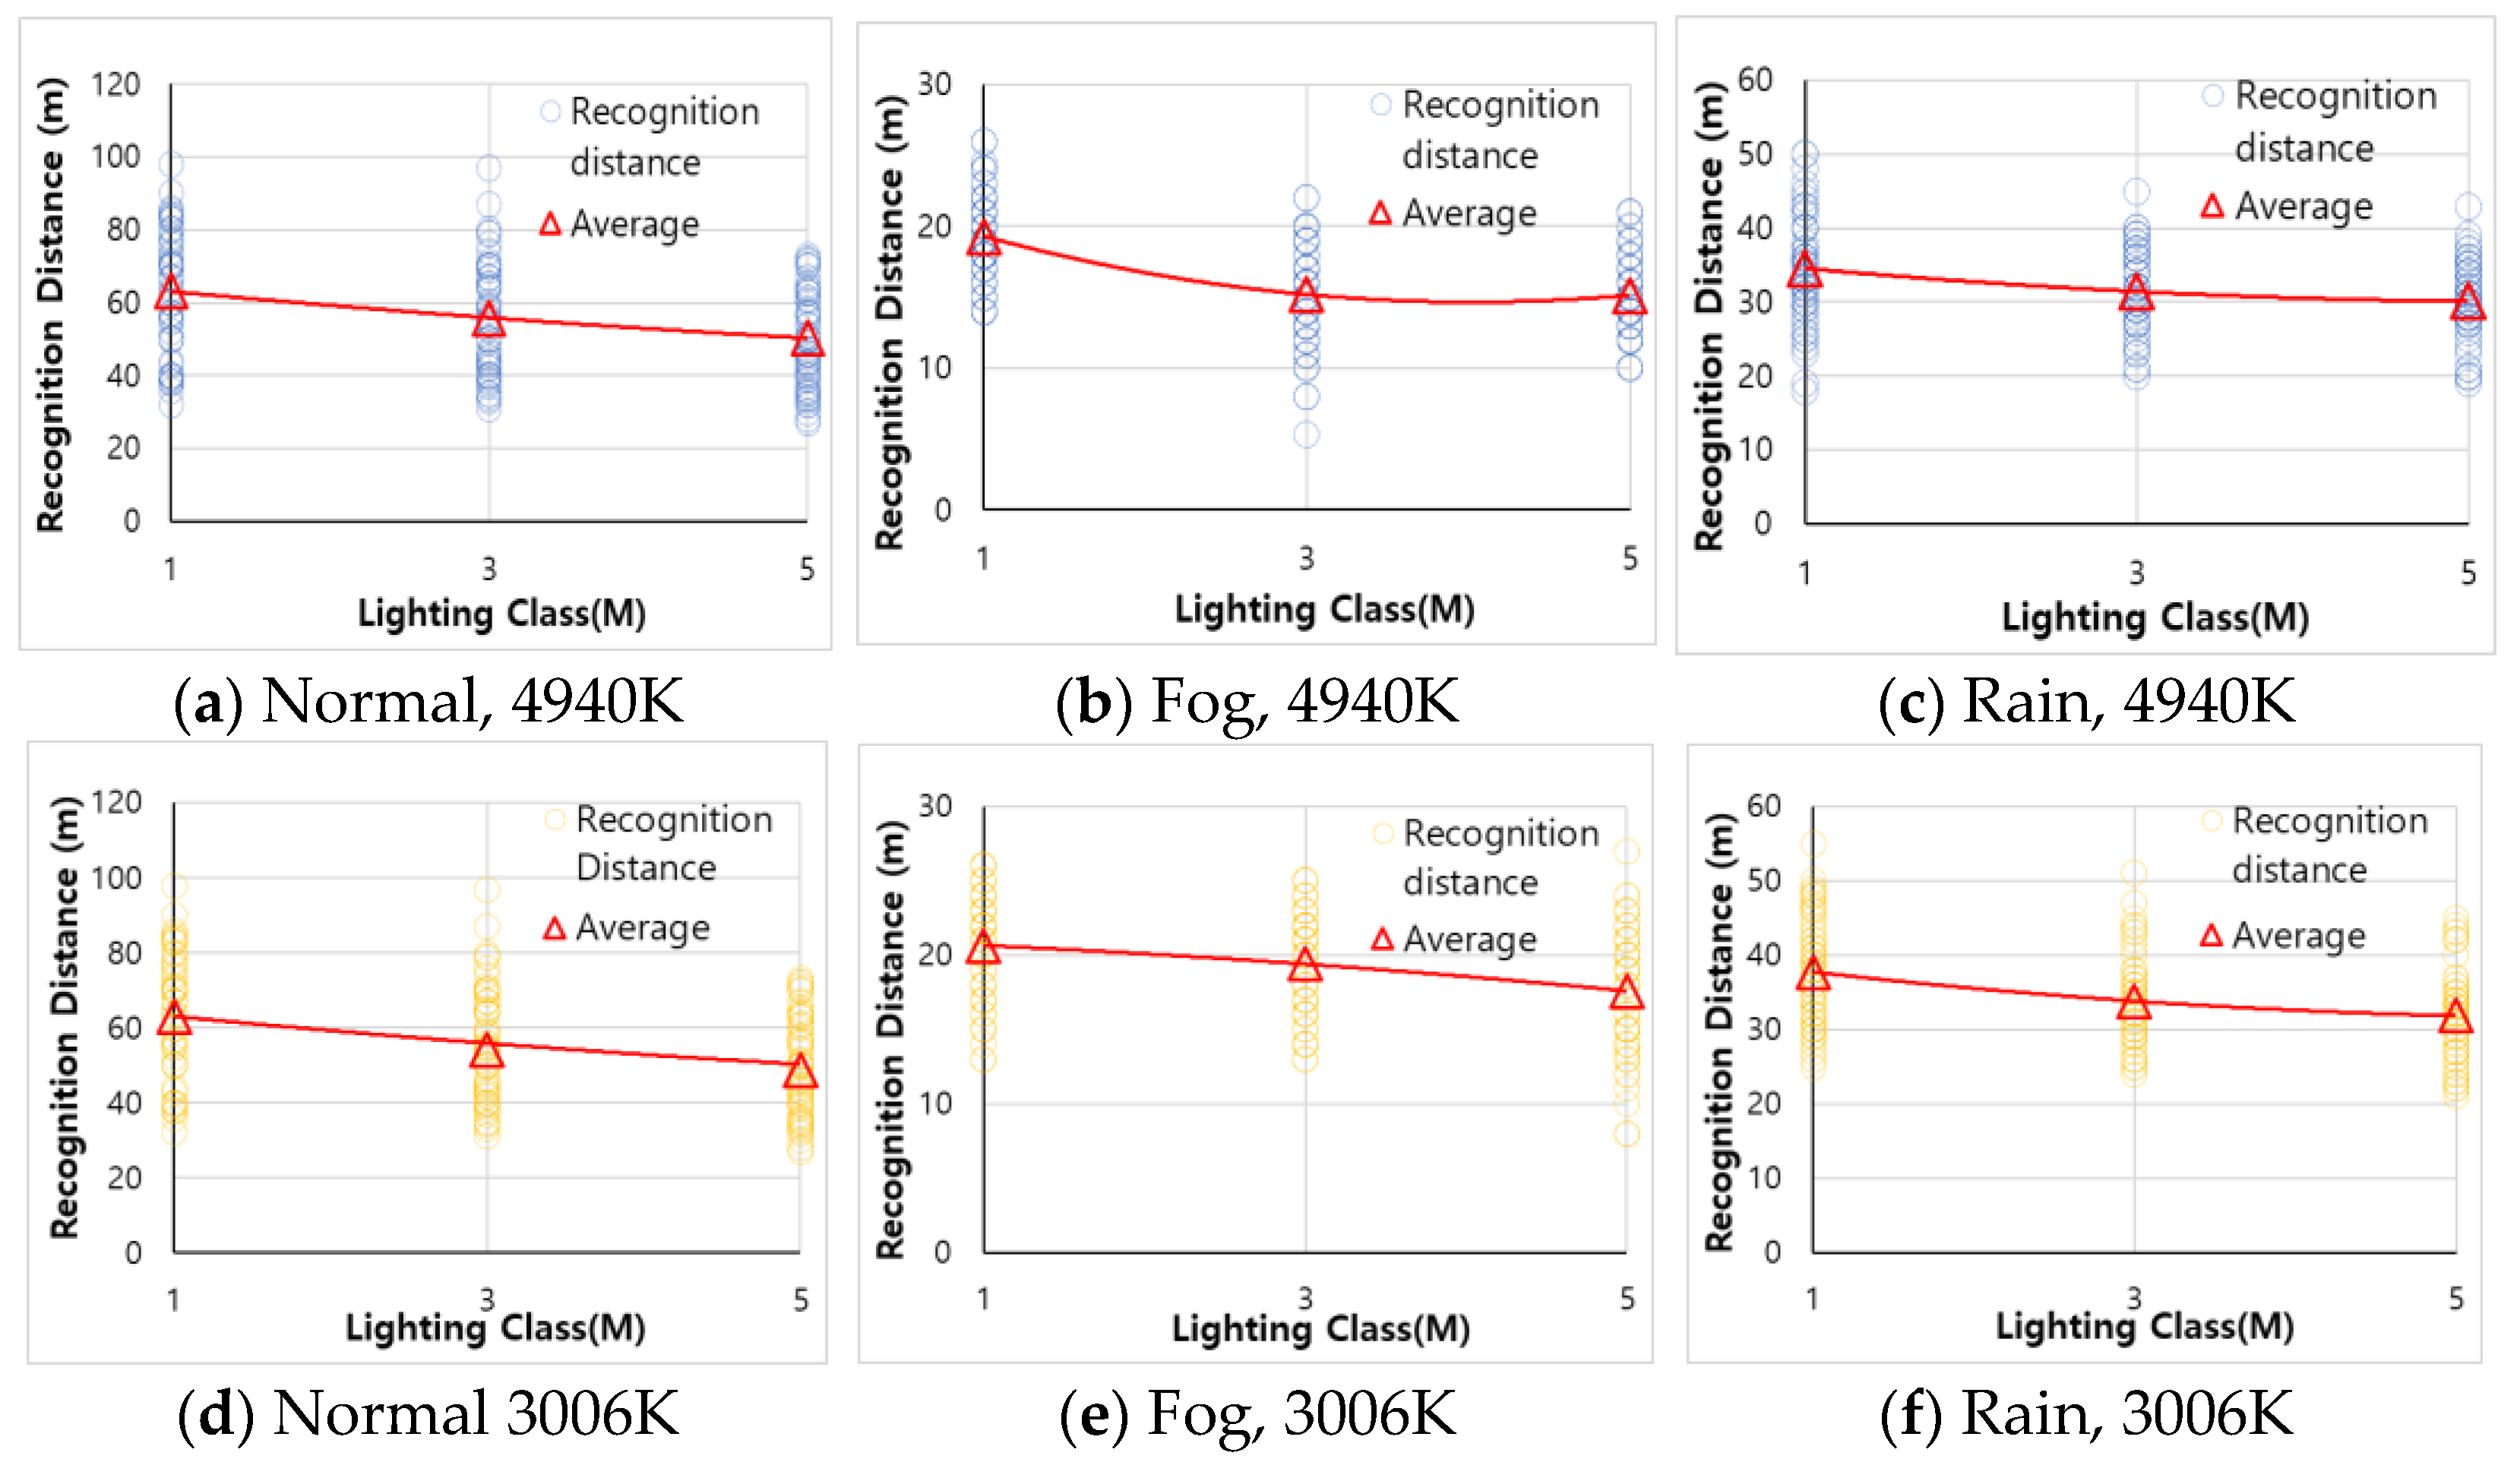
4.1. Obstacle Recognition Distance by Road Lighting Classes
4.2. Obstacle Recognition Distance by Road Lighting Classes
4.3. Obstacle Recognition Distance by Color Temperature of Road Lighting
5. Conclusions
- Under the same road lighting conditions, there is a difference in obstacle recognition distance according to weather conditions, and the obstacle recognition distance is longer in the order of normal > rain > fog; the difference is found to occur up to 72.86%. Through these results, it was verified that performance evaluation of road lighting according to weather conditions is necessary.
- Under the same weather conditions, there is a difference in obstacle recognition distance by road lighting grade, and the obstacle recognition distance is longer in the order of M1 > M3 > M5, so it was found that road lighting with a higher road lighting grade is more advantageous in securing visibility in rain and fog. The difference was found to occur up to 22.75%.
- Under normal weather conditions, the difference in obstacle recognition distance by color temperature is not significant when the road lighting level is the same, but in rain and fog situations, 3006 K (yellow light) was found to have a longer obstacle recognition distance than 4940 K (white light), and the difference was up to 21.87%.
Author Contributions
Funding
Institutional Review Board Statement
Informed Consent Statement
Data Availability Statement
Conflicts of Interest
References
- International Commission On Illumination. 140-2000, Road Lighting Calculations; International Commission On Illumination: Vienna, Austria, 2000. [Google Scholar]
- International Commission On Illumination. 115-2010, Lighting of Rods for Motor and Pedestrian Traffic; International Commission On Illumination: Vienna, Austria, 2010. [Google Scholar]
- Park, W.I.; Jin, M.S.; Kim, Y.S.; Lee, S.K. Evaluation of Driver Discomfort Glare for Road Lighting in Adverse Weather by Utilizing UGR (Unified Glare Rating). Int. J. Highw. Eng. 2020, 22, 165–175. [Google Scholar] [CrossRef]
- Hills, B.L. Vision, visibility, and perception in driving. Transport and Road Research Laboratory. Perception 1980, 9, 183–216. [Google Scholar] [CrossRef] [PubMed]
- Hassan, H.M.; Abdel-Aty, M.A. Analysis of drivers’ behavior under reduced visibility conditions using a Structural Equation Modeling approach. Transp. Res. Part F Traffic Psychol. Behav. 2011, 14, 614–625. [Google Scholar] [CrossRef]
- Boyce, P.R. Lighting for Driving: Roads, Vehicles, Signs, and Signals; CRC Press: Boca Raton, FL, USA, 2009; pp. 254–258. [Google Scholar]
- Peng, Y.; Jiang, Y.; Lu, J.; Zou, Y. Examining the effect of adverse weather on road transportation using weather and traffic sensors. PLoS ONE 2018, 13, e0205409. [Google Scholar] [CrossRef] [PubMed]
- Bommel, W.V. Road Lighting Fundamentals, Technology and Application; Springer: Berlin/Heidelberg, Germany, 2015; p. 194. [Google Scholar]
- Ali, F.; Khan, Z.H.; Khattak, K.S.; Gulliver, T.A. The effect of visibility on road traffic during foggy weather conditions. IET Int. Transp. Syst. 2023, 18, 47–57. [Google Scholar] [CrossRef]
- Sun, S.; Hu, J.; Wang, R. Correlation between visibility and traffic safety visual distance in foggy areas during the daytime. Traffic Inj. Prev. 2020, 22, 514–518. [Google Scholar] [CrossRef] [PubMed]
- KoROAD. 2023 Version (2022 Statistics) Traffic Accident Statistical Analysis; KoROAD: Wonju, Republic of Korea, 2023; 31p. [Google Scholar]
- National Highway Traffic Safety Administration. Traffic Safety Facts; NHTSA: Washington, DC, USA, 2020; p. 73. [Google Scholar]
- Yannis, G.; Kondyli, A.; Mitzalis, N. Effect of lighting on frequency and severity of road accidents. Transport 2013, 166, 271–281. [Google Scholar] [CrossRef]
- Wood, J.M.; Isoardi, G.; Black, A.; Cowling, I. Night-time driving visibility associated with LED streetlight dimming. Accid. Anal. Prev. 2018, 121, 295–300. [Google Scholar] [CrossRef] [PubMed]
- Davidovic, M.; Djokic, L.; Cabarkapa, A.; Djuretic, A.; Skerovic, V.; Kostic, M. Drivers’ Preference for the Color of LED Street Lighting. IEEE Access 2019, 7, 72850–72861. [Google Scholar] [CrossRef]
- Chenani, S.B.; Vaaja, M.T.; Kurkela, M.; Kosonen, I.; Luttinen, T. Target detection distances under different road lighting intensities. Eur. Transp. Res. Rev. 2017, 9, 17. [Google Scholar] [CrossRef]
- Jin, H.; Jin, S.; Chen, L.; Cen, S.; Yuan, K. Research on the Lighting Performance of LED Street Lights with Different Color Temperatures. IEEE Photonics J. 2015, 7, 1601309. [Google Scholar] [CrossRef]
- Williams, B.; Gibbons, R. The Assessment of New Roadway Lighting in Rain and Fog; Report #22-UR-114; National Surface Transportation Safety Center for Excellence: Blackburg, VA, USA, 2022. [Google Scholar]
- Ekrias, A.; Eloholma, M.; Halonen, L. Analysis of Road Lighting Quantity and Quality in Varying Weather Conditions. J. Illum. Eng. Soc. N. Am. 2013, 4, 89–98. [Google Scholar] [CrossRef]
- Mayeur, A.; Bremond, R.; Bastien, C.J.M. The effect of the driving activity on target detection as a function of the visibility level: Implications for road lighting. Transp. Res. Part F Traffic Psychol. Behav. 2010, 13, 115–128. [Google Scholar] [CrossRef]
- Park, W.I.; Jin, M.S.; Kim, Y.S.; Kim, K.S.; Lee, S.K. Investigating the effect of road lighting color temperature on road visibility in night foggy conditions. Appl. Ergon. 2023, 106, 103899. [Google Scholar] [CrossRef] [PubMed]
- Layton, R.; Dixon, K. Stopping Sight Distance Discussion Paper #1; The Kiewit Center for Infrastructure and Transportation: Corvallis, OR, USA, 2012; p. 11. [Google Scholar]


| Color Temperature | Lighting Classes | Dimming Value | Road Surface | |||
|---|---|---|---|---|---|---|
| Dry | Wet | |||||
| Average Road Surface Luminance | Overall Uniformity | Longitudinal Uniformity | Overall Uniformity | |||
| 4940 K | M1 | 228 | 2.020 | 0.764 | 0.703 | 0.284 |
| M3 | 160 | 1.000 | 0.776 | 0.713 | 0.289 | |
| M5 | 5 | 0.568 | 0.784 | 0.721 | 0.302 | |
| 3006 K | M1 | 230 | 2.010 | 0.840 | 0.791 | 0.275 |
| M3 | 161 | 1.000 | 0.838 | 0.791 | 0.358 | |
| M5 | 5 | 0.588 | 0.842 | 0.781 | 0.378 | |
| Category | Classification | Number of People | Rate |
|---|---|---|---|
| Gender | Male | 25 | 83.3% |
| Female | 5 | 16.7% | |
| Age range | Over 60 years old | 1 | 3.3% |
| 50~59 years old | 12 | 40.0% | |
| 40~49 years old | 4 | 13.3% | |
| 30~39 years old | 6 | 20.0% | |
| 20~29 years old | 7 | 23.3% |
| Dependent Variable | Explanatory Variable | n | Mean | SD | F | p | Post Hoc (Tukey HSD) | |
|---|---|---|---|---|---|---|---|---|
| Obstacle recognition distance (4940 K) | Normal | M1 (a) | 60 | 63.07 | 16.61 | 10.966 | <0.001 | b,c < a |
| M3 (b) | 60 | 55.89 | 15.16 | |||||
| M5 (c) | 60 | 50.29 | 12.97 | |||||
| Fog | M1 (a) | 60 | 19.29 | 2.95 | 35.412 | <0.001 | b,c < a | |
| M3 (b) | 60 | 15.17 | 3.61 | |||||
| M5 (c) | 60 | 15.07 | 2.79 | |||||
| Rain | M1 (a) | 60 | 34.53 | 7.03 | 9.126 | <0.001 | b,c < a | |
| M3 (b) | 60 | 31.40 | 5.34 | |||||
| M5 (c) | 60 | 30.07 | 5.04 | |||||
| Obstacle recognition Distance (3006 K) | Normal | M1 (a) | 60 | 63.07 | 16.61 | 10.966 | <0.001 | b,c < a |
| M3 (b) | 60 | 55.89 | 15.16 | |||||
| M5 (c) | 60 | 50.29 | 12.97 | |||||
| Fog | M1 (a) | 60 | 19.29 | 2.95 | 35.412 | <0.001 | b,c < a | |
| M3 (b) | 60 | 15.17 | 3.61 | |||||
| M5 (c) | 60 | 15.07 | 2.79 | |||||
| Rain | M1 (a) | 60 | 34.53 | 7.03 | 9.126 | <0.001 | b,c < a | |
| M3 (b) | 60 | 31.40 | 5.34 | |||||
| M5 (c) | 60 | 30.07 | 5.04 | |||||
| Classification | Obstacle Recognition Distance Ratio Compared to M1 | ||||||
|---|---|---|---|---|---|---|---|
| Color Temperature | 4940 K | 3006 K | |||||
| Weather | Normal | Fog | Rain | Normal | Fog | Rain | |
| Lighting classes | M1 | 100.00% | 100.00% | 100.00% | 100.00% | 100.00% | 100.00% |
| M3 | 88.62% | 78.64% | 90.94% | 85.80% | 93.94% | 89.66% | |
| M5 | 79.74% | 78.12% | 87.08% | 77.25% | 85.22% | 84.40% | |
| Dependent Variable | Explanatory Variable | n | Mean | SD | F | p | Post Hoc (Tukey HSD) | |
|---|---|---|---|---|---|---|---|---|
| Obstacle recognition distance (4940 K) | M1 | Normal (a) | 60 | 63.07 | 16.61 | 266.193 | <0.001 | b < c < a |
| Fog (b) | 60 | 19.29 | 2.95 | |||||
| Rain (c) | 60 | 34.53 | 7.03 | |||||
| M3 | Normal (a) | 60 | 55.89 | 15.16 | 278.712 | <0.001 | b < c < a | |
| Fog (b) | 60 | 15.17 | 3.61 | |||||
| Rain (c) | 60 | 31.4 | 5.34 | |||||
| M5 | Normal (a) | 60 | 50.29 | 12.97 | 279.312 | <0.001 | b < c < a | |
| Fog (b) | 60 | 15.07 | 2.79 | |||||
| Rain (c) | 60 | 30.07 | 5.04 | |||||
| Obstacle recognition distance (3006 K) | M1 | Normal (a) | 60 | 63.08 | 16.37 | 250.252 | <0.001 | b < c < a |
| Fog (b) | 60 | 20.63 | 3.39 | |||||
| Rain (c) | 60 | 37.7 | 6.98 | |||||
| M3 | Normal (a) | 60 | 54.12 | 15.08 | 199.725 | <0.001 | b < c < a | |
| Fog (b) | 60 | 19.38 | 3.36 | |||||
| Rain (c) | 60 | 33.8 | 5.99 | |||||
| M5 | Normal (a) | 60 | 48.73 | 14.69 | 163.672 | <0.001 | b < c < a | |
| Fog (b) | 60 | 17.58 | 4.09 | |||||
| Rain (c) | 60 | 31.82 | 5.93 | |||||
| Classification | Obstacle Recognition Distance Ratio Compared to Normal | ||||||
|---|---|---|---|---|---|---|---|
| Color Temperature | 4940 K | 3006 K | |||||
| Weather | Normal | Fog | Rain | Normal | Fog | Rain | |
| Lighting classes | M1 | 100.00% | 30.59% | 54.75% | 100.00% | 32.70% | 59.77% |
| M3 | 100.00% | 27.14% | 56.18% | 100.00% | 35.81% | 62.45% | |
| M5 | 100.00% | 29.97% | 59.79% | 100.00% | 36.08% | 65.30% | |
| Weather | Lighting Classes | Color Temperature | n | Mean | SD | t | p |
|---|---|---|---|---|---|---|---|
| Normal | M1 | 4940 K | 60 | 63.07 | 16.61 | −0.008 | 0.993 |
| 3006 K | 60 | 63.08 | 16.37 | ||||
| M3 | 4940 K | 60 | 55.89 | 15.16 | 1.240 | 0.220 | |
| 3006 K | 60 | 54.12 | 15.08 | ||||
| M5 | 4940 K | 60 | 50.29 | 12.97 | 1.546 | 0.128 | |
| 3006 K | 60 | 48.73 | 14.69 | ||||
| Fog | M1 | 4940 K | 60 | 19.29 | 2.95 | −3.826 | <0.001 |
| 3006 K | 60 | 20.63 | 3.39 | ||||
| M3 | 4940 K | 60 | 15.17 | 3.61 | −12.360 | <0.001 | |
| 3006 K | 60 | 19.38 | 3.36 | ||||
| M5 | 4940 K | 60 | 15.07 | 2.79 | −6.751 | <0.001 | |
| 3006 K | 60 | 17.58 | 4.09 | ||||
| Rain | M1 | 4940 K | 60 | 34.53 | 7.03 | −6.885 | <0.001 |
| 3006 K | 60 | 37.70 | 6.98 | ||||
| M3 | 4940 K | 60 | 31.40 | 5.34 | −5.867 | <0.001 | |
| 3006 K | 60 | 33.80 | 5.99 | ||||
| M5 | 4940 K | 60 | 30.07 | 5.04 | −3.943 | <0.001 | |
| 3006 K | 60 | 31.82 | 5.93 |
| Classification | Obstacle Recognition Distance Ratio Compared to 3006 K | ||||
|---|---|---|---|---|---|
| Weather | Fog | Rain | |||
| Color Temperature | 3006 K | 4940 K | 3006 K | 4940 K | |
| Lighting classes | M1 | 100.0% | 93.5% | 100.0% | 91.6% |
| M3 | 100.0% | 78.3% | 100.0% | 92.9% | |
| M5 | 100.0% | 85.7% | 100.0% | 94.5% | |
Disclaimer/Publisher’s Note: The statements, opinions and data contained in all publications are solely those of the individual author(s) and contributor(s) and not of MDPI and/or the editor(s). MDPI and/or the editor(s) disclaim responsibility for any injury to people or property resulting from any ideas, methods, instructions or products referred to in the content. |
© 2024 by the authors. Licensee MDPI, Basel, Switzerland. This article is an open access article distributed under the terms and conditions of the Creative Commons Attribution (CC BY) license (https://creativecommons.org/licenses/by/4.0/).
Share and Cite
Park, W.; Park, K.; Jeong, J. Verification of the Applicability of Obstacle Recognition Distance as a Measure of Effectiveness of Road Lighting on Rainy and Foggy Roads. Appl. Sci. 2024, 14, 1595. https://doi.org/10.3390/app14041595
Park W, Park K, Jeong J. Verification of the Applicability of Obstacle Recognition Distance as a Measure of Effectiveness of Road Lighting on Rainy and Foggy Roads. Applied Sciences. 2024; 14(4):1595. https://doi.org/10.3390/app14041595
Chicago/Turabian StylePark, Wonil, Kisoo Park, and Junhwa Jeong. 2024. "Verification of the Applicability of Obstacle Recognition Distance as a Measure of Effectiveness of Road Lighting on Rainy and Foggy Roads" Applied Sciences 14, no. 4: 1595. https://doi.org/10.3390/app14041595