Article

Strength Reduction Method for the Assessment of Existing Large Reinforced Concrete Structures

1
Department of Civil, Geological and Mining Engineering, Polytechnique Montréal, Montreal University Campus, 6079, Montreal, QC H3C 3A7, Canada
2
IDAE s.e.n.c., 204 Saint Sacrement Street, Montreal, QC H2Y 1W8, Canada
*
Author to whom correspondence should be addressed.
Appl. Sci. 2024, 14(4), 1614; https://doi.org/10.3390/app14041614
Submission received: 17 January 2024 / Revised: 3 February 2024 / Accepted: 6 February 2024 / Published: 17 February 2024
(This article belongs to the Special Issue Advanced Finite Element Method and Its Applications)

Abstract

:
This work presents a new developed assessment methodology based on strength reduction and finite element methods which is suitable for existing large reinforced concrete structures commonly used in hydraulic constructions. The methodology is based on a reloading phase of the finite element model and is preceded by an intermediate reduction phase of concrete tensile strength and an initial loading phase up to service level. Rosenblueth’s point estimate method was used to compute a global resistance factor and to deduce a design resistance value of the structure. After validations, the methodology was applied to two existing complex and large hydraulic structures: a spiral case and a draft tube. If compared with existing methodologies using sophisticated non-linear finite element methods, the developed approach is simpler, more practical, and provides results that are on the conservative side. Considering the difficulties in characterizing the tensile peak and post-peak strength of concrete, along with uncertainties regarding the damage conditions of facilities, the developed methodology is deemed robust and well suited for assessing existing critical large reinforced concrete infrastructures.

1. Introduction

Reinforced concrete (RC) structures are essential structures in today’s society. Most strategic RC infrastructures around the world (e.g., bridges, nuclear, or hydroelectric powerhouses) were built before the 1950s and are now reaching the end of their lifespan. It is estimated that the repair and rebuilding costs of concrete infrastructures, just in the United States, will be in the trillions of dollars, which will be paid by future generations [1]. As cement serves as the primary binding agent in concrete construction and contributes significantly to carbon dioxide emissions during the manufacturing process, concrete is recognized as a major contributor to the overall carbon footprint. The environmental costs of rebuilding will consequently have serious repercussions for the planet. Therefore, it is more profitable to extend the lifespan of existing critical RC structures using innovative and robust assessment tools, as well as targeted repair technologies. Although the designs of old RC structures were based on rather simplified models (e.g., 2D models versus 3D, no or limited redistribution of stresses, etc.) and conservative design approaches (e.g., the sectional design method), at present, more sophisticated numerical tools, such as advanced nonlinear finite element analysis, or ANFEA, are increasingly used. ANFEA, using constitutive concrete models, is a state-of-the-art analytic tool in the field of the numerical simulation of concrete structures [2]. It is based on a 3D discretization of structures using 3D elements, and it uses a smeared crack or discrete crack (e.g., XFEM) approach to represent the cracking process that takes place using initiation and propagation criteria. ANFEA is suitable for designing complex concrete structures [3], assessing reinforced and non-reinforced concrete structures with initial damage conditions, or structures that are subjected to extreme loads (e.g., [4,5,6,7]).
This work focuses on the assessment of the specific case of large reinforced concrete structures which are known to have complex structural behavior. An example of such a structure is illustrated in Figure 1, which showcases a typical powerhouse unit in a hydroelectric facility that will be considered in the application section of this study. These constructions, employing mass concrete with large aggregates (more than 40 mm in diameter), are commonly utilized in hydroelectric facilities to address stability concerns, necessitating larger concrete volumes. Compared with conventional concrete structures such as buildings and bridges, they exhibit more complex behavior due to factors such as early age thermal effects, the complexity of the geometry influenced by the waterway (3D complex geometry), and size effects with light reinforcement usage. Notably, these structures fall outside the scope of standard concrete design codes.
In the authors’ experience, the application of ANFEA to assess large reinforced concrete structures may present limitations. This is mainly due to the substantial influence of concrete’s tensile behavior (both peak and post-peak) on structural response, compounded by challenges in characterizing this behavior for existing facilities. Additionally, ANFEA is known for its high sensitivity to various input parameters, typically demanded by the concrete constitutive model.
Even if the computational framework of ANFEA has undergone a rigorous verification and validation (V&V) process that is suitable for the target assessed structure [3,8], it is still dependent on the quality of at least measurable concrete/reinforcement parameters that can be assessed from existing structures (e.g., using characterization tests on extracted cores). Examples of measurable RC mechanical parameters are the compressive strength of concrete ( f c ), the Young’s modulus and Poisson’s ratio values of concrete ( E c and ν c ), the direct tensile peak strength of concrete ( f t ), the tensile post-peak strength of concrete (e.g., fracture energy G F ), and reinforcement yield strength ( f y ) . In the authors’ view, relatively speaking, the parameters related to the tensile strength of concrete (mainly f t and G F ) are the most difficult to obtain and have higher uncertainties for several reasons, such as size effects, greater spatial variability within the structure, the difficulty of the experimental setup for characterization tests, the higher variability of parameters (e.g., coefficient of variation (COV) > 0.15   to   0.2 ), and requiring larger replication numbers. For a reliability assessment of an existing structure, a statistical assessment of the higher-order moments of these parameters is required (e.g., variance is required to compute the characteristic value of strength).
Strut and Tie or S&T Method [9] or equivalent Stress Field or SF Method [10] can be alternatively used for the assessment of existing large RC structures offering distinct advantages over the ANFEA in this context: (i) no dependency on the tensile behaviour of concrete; (ii) a lower bound solution based on equilibrium and the strength of used materials (essentially requiring only f c for concrete and f y for reinforcement). These two aspects offer some robustness and conservativeness to the assessment, making these methods widely used in engineering practice.
However, both S&T and SF methods cannot handle some important aspects relevant for the assessment of large RC structures: (i) Consideration of multi-physical phenomena that interact during the life span of structure from construction to operation. These phenomena impact stress state and internal crack distribution at service level [11]. For mass concrete structures, as the powerhouse example of Figure 1, thermal stresses at early age are known to cause more than 80% of the cracking pattern before water impoundment of the facility [3]; (ii) Consideration of the effect of existing discrete cracks on the structural capacity and failure mechanism at the ultimate stage; and (iii) Consideration of reliability aspects in the assessment, related to load and material strength variabilities [12,13].
The scope of this work is the development of new methodology, based on strength reduction and a point estimate probabilistic method, suitable for reliability assessment of existing large RC structures. The methodology addresses all the limitations previously mentioned for other available assessment methods.
The paper is organized as follows. Section 2 presents the assessment examples considered in this study and discusses the need for defining a new assessment strategy for these special RC structures. Section 3 introduces the developed assessment methodology. Validation examples are presented in Section 4. Finally, in Section 5, two application examples are considered to illustrate the performance of the proposed approach.

2. Why Strength Reduction for Large RC Structures?

2.1. FE and ANFE in the Field of Large RC Structures

Figure 1 presents the powerhouse hydroelectric unit considered in this study. It is a RC structure characterized by complex geometry attributable to the hydraulic passage, and large members with thicknesses exceeding one meter. Typically, such large RC structures have low reinforcement ratios rarely exceeding 0.5%. The justification for employing sophisticated analyses tools such as ANFEA in assessing this structure, arises from the interplay of various factors: complex 3D geometry, tensile stresses and crack development at early age due to heat of hydration effects and mechanical restraint to rock foundation and size effect.
Figure 1c displays a typical result from ANFEA for the semi-spiral case component of the powerhouse and for the critical short-circuit load case, schematically shown in Figure 1b. Despite the notably high magnitude of the short-circuit force F in this example (approximately 6000 kN, as detailed later), only a few elements exhibit cracking (coloured in red in Figure 1d), even though minimum reinforcement was provided in the model. This result is quite common in the field of mass hydraulic structures and can be attributed to three factors: (i) the contribution of the tensile strength of the concrete f t (in the order of 2 to 4 MPa), which triggers the initiation of cracks; (ii) the contribution of the post-cracking energy of concrete after crack initiation and during crack propagation. This fracture energy, G F , in the order of 0.1 to 0.5 N.mm/mm2 for mass concrete with coarse aggregates, would have important contribution in case of large concrete members due to the extensive cracked areas involved; (iii) the static redundancy of the structures also plays a crucial role by allowing redistribution of tensile stresses.
Based on the authors’ experience with ANFE, it is possible for a large RC structure to withstand external efforts solely through the contributions in tension and compression of concrete, without relying on any reinforcement. However, it becomes challenging to assert the adequacy of the structure’s behavior in this scenario, as the contribution of concrete in tension is not guaranteed unless all the complex interactions at early age and very early age (tensile creep, heat of hydration effects, maturity development) are meticulously incorporated into the simulation.
It can be inferred that assessing the actual demand on the reinforcement is not feasible using ANFEA, as it is somewhat hidden by the tensile contribution of concrete. In such cases, conventional linear elastic FE analyses may be used, and the demand on reinforcement can be evaluated after integrating stresses into sectional forces using available algorithms (e.g., [14]). However, this methodology becomes unusable when thermal effects are included in the FE model. High tensile sectional forces may arise due to temperature drops and to the large member size. These forces decrease instantaneously after initiation of the first crack and can be only be accurately considered within a non-linear computational framework.

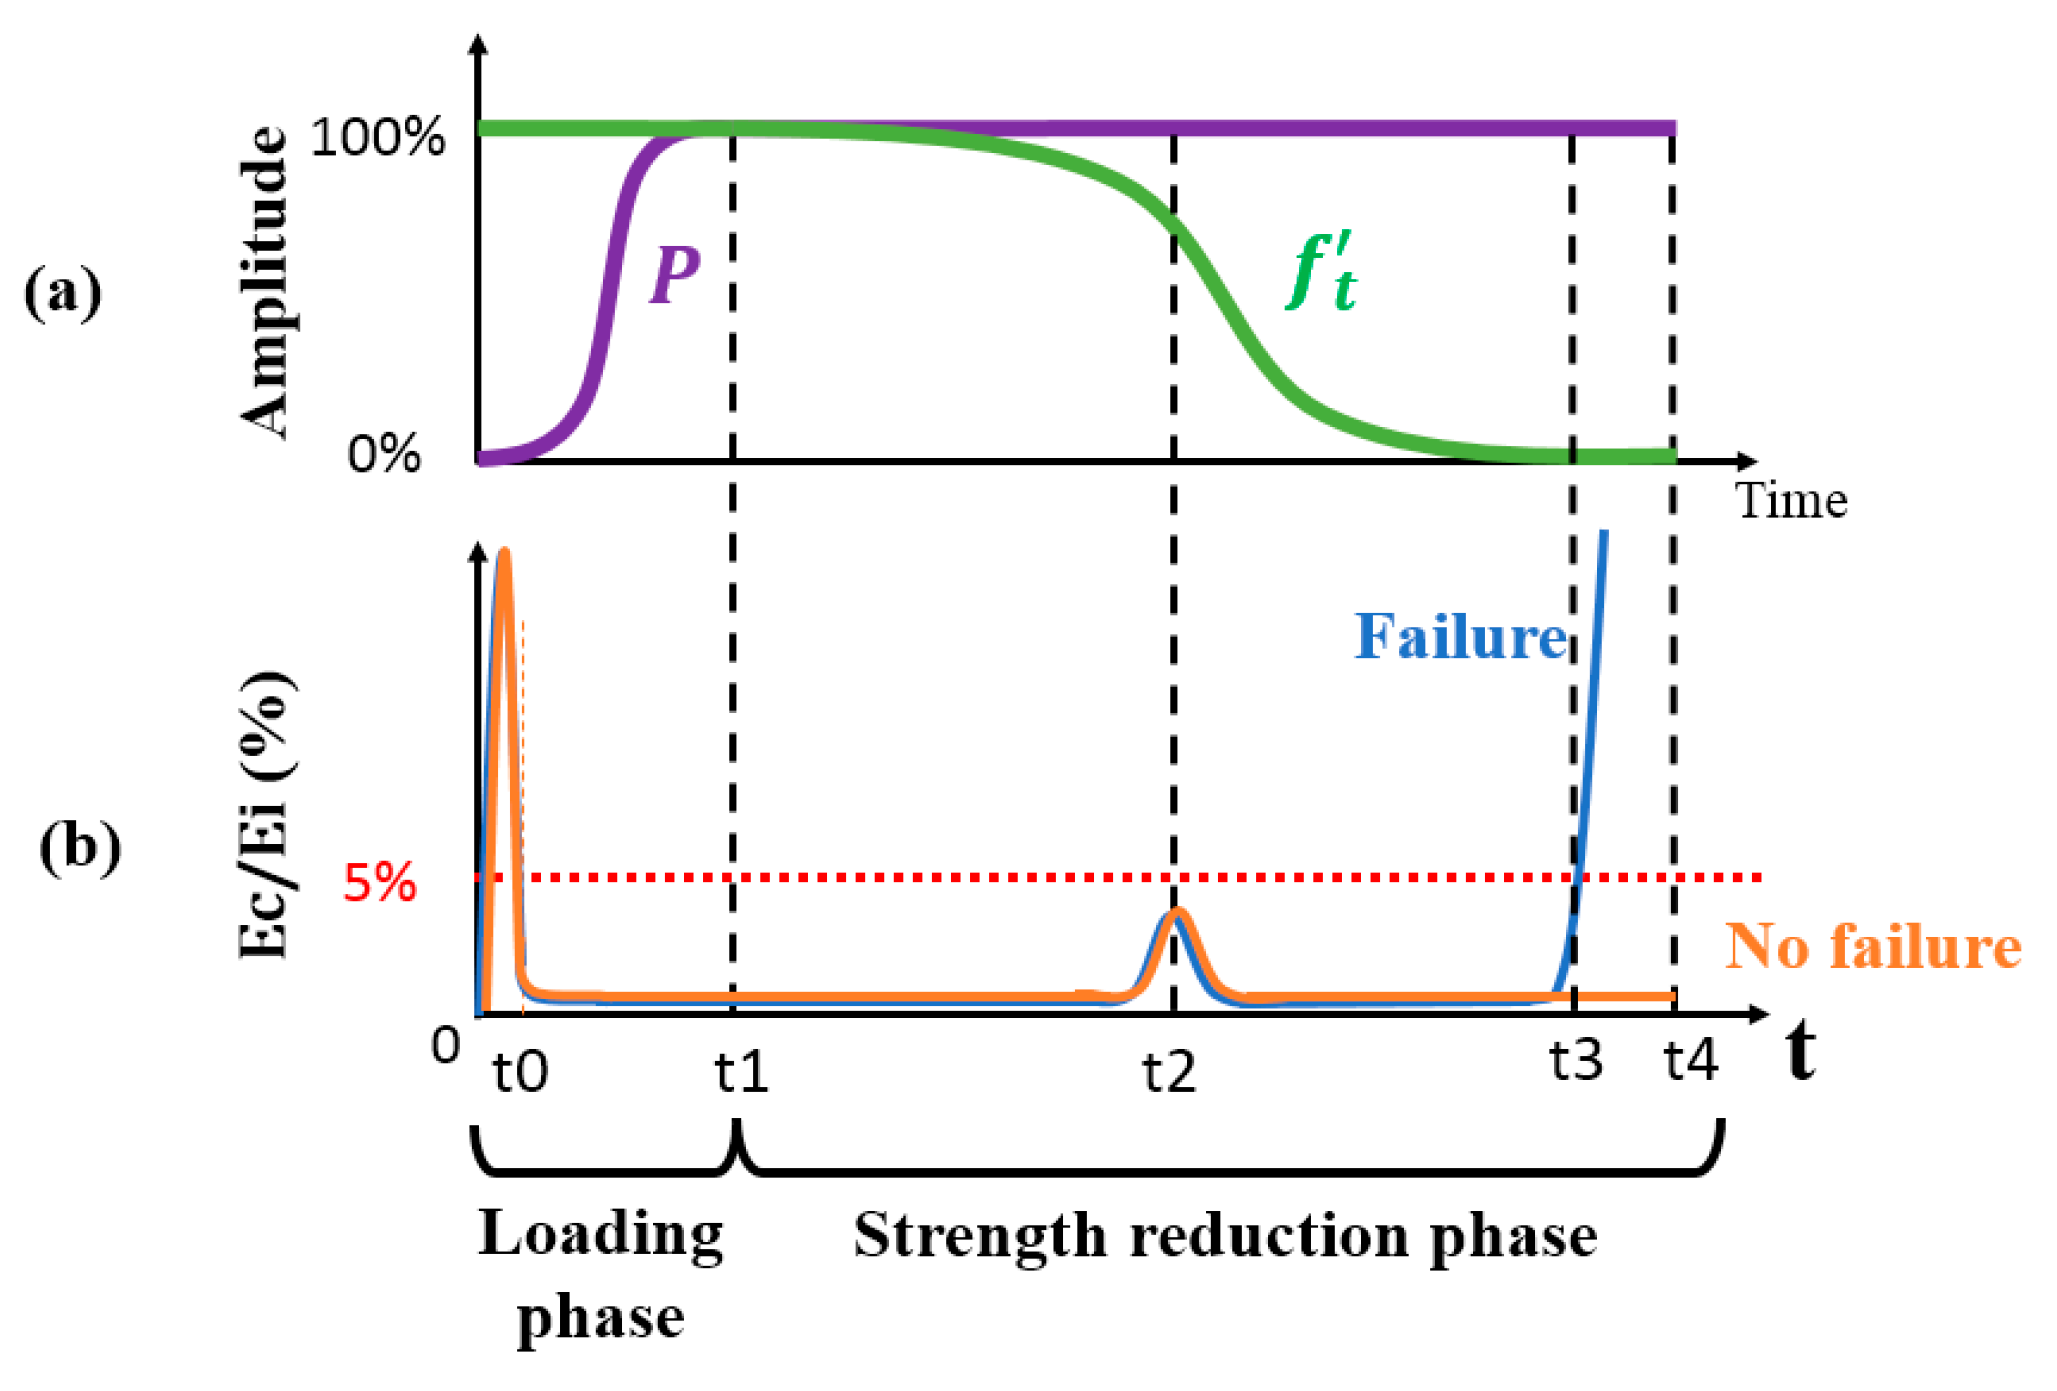
2.2. Strength Reduction

The strength reduction is a method originally developed in the geotechnical engineering field for quantifying slope stability. It was introduced by Zienkiewicz et al. (1975) [15] and is based on the gradual reduction of the resistive strength of materials along potential planes of weakness.
The tensile strength reduction analysis was developed by the authors as an alternative design solution for complex reinforced concrete structures in 2D configurations [16]. Recently, this approach was generalized to the case of 3D state of stresses [17], referred to as SRDM-3D for Strength Reduction Design Method. The concept involves applying the load on the structure using a simple linear constitutive model, followed by a progressive reduction of the tensile strength to allow the redistribution of stresses into purely compressive stresses in concrete (struts) and purely tensile stresses in reinforcement (ties).
Figure 2a schematically illustrates the analysis procedure, where P represents the external load applied smoothly and gradually during an initial loading phase. This load is maintained constant for the second strength reduction phase, during which the tensile strength of concrete gradually decreases to zero. If the initial tensile strength is chosen reasonably high ( f t at t = 0), the loading phase remains purely linear elastic. The redistribution of stresses between concrete and reinforcement in the reduction phase, is highly non-linear. Therefore, an explicit dynamics solver is employed using an incremental numerical scheme with a small stable increment time. The problem is solved using dynamic equilibrium equations, where conventional nodal forces are converted into inertia forces by assigning lumped masses to nodal degrees of freedom. The loading P is applied slowly enough to minimize the kinetic over internal energy ratio of the system E c / E i .
As depicted in Figure 2, intermediate non-linear events may occur during the strength reduction phase, such as crack initiation and propagation at t2. Two different situations may occur: (i) failure before the end of analysis (at t3), detectable through an irreversible increase of the kinetic over internal energy ratio; (ii) no failure before the end of the strength reduction phase at time t4, where the tensile strength reaches zero.
The advantage of this approach is that it uses a relatively simple constitutive modelling of concrete (compared to those used in ANFEA), requiring mainly the compressive strength of concrete as input parameter. In the typical design mode of SRDM-3D, the constitutive model of the reinforcement is chosen linear elastic and the required quantity of reinforcement can therefore be assessed at the end of the analysis, in case of no failure (t = t4). In fact, failure in this case can only occur in concrete, either through the crushing of the struts in pure compression or by incompatibility failure in nodal areas near the intersections of tensile ties in reinforcement and compressive struts in concrete. This failure can be monitored by the state variable β , defined as the ratio between the principal compressive stress σ m i n and the effective compressive strength f c :
β = σ m i n f c
As defined in [17], the effective compressive strength f c is a resistance value less than the uni-axial compressive strength of tested concrete f c due to the presence of incompatibility effects between concrete tensile strains (originating from strain compatibility with embedded reinforcement) and concrete compressive strains, as initially suggested in the modified compression field theory or MCFT [18]. In contrast to ANFEA, SRDM-3D does not use a real constitutive concrete model, as the objective is not to replicate the exact behaviour of concrete. More specifically, the behaviour in tension is disregarded. There is no need for initiation or propagation criteria for the cracking process, as the final objective is to reach an equilibrium configuration where concrete works only in compression, and tension is resisted exclusively by embedded reinforcement. The method inherits the ‘lower bound feature’ of the S&T method and can be considered as an intermediate approach between ANFEA approach using sophisticated concrete modelling and simplistic 2D approach using the S&T method. The two most important ingredients of the constitutive modelling are the uni-axial stress-strain law in compression and the incompatibility law in tension (relating f c to f c ). This incompatibility law must be calibrated using a reference S&T solution based on a minimum compatibility angle θ m i n between tension tie and compressive strut [17]. The Todeschini model was used for the uni-axial compressive stress ( σ )/strain ( ε ) law:
σ   = f c · ( ε ε c 0 ) 1 + ε ε c 0 2
where ε c 0 is the strain corresponding to the compressive peak taken as 0.002 in this study.
The following compatibility equation from MCFT was suggested in [17], and is retained in this study:
f c = f c 0.85 0.27   ε 1 ε 3 c
where ε 1 is the local concrete maximum tensile strain, ε 3 is the local concrete minimum compressive strain, and c is the calibration factor. The value c = 0.2 was found to be consistent with a limit incompatibility angle θ m i n = 20° in the previous authors work [17] and is retained in this study. For more details about the algorithm, constitutive equations and the calibration procedure, please refer to [17].
The application of SRDM-3D method yielded compelling results demonstrating comparable robustness and conservativeness to the S&T method, while being notably more straightforward to apply to complex and 3D reinforced concrete (RC) geometries [19]. The extension of this method to the assessment context of an existing RC structure has however shown three main limitations. The first is related to the iterative scheme used to assess the ultimate failure load, in the assessment mode, when non-linear constitutive laws for reinforcement are activated. Several SRDM-3D analyses must be carried out by increasing the load P, to reach a limit equilibrium configuration at the end of the reduction phase. This limit equilibrium corresponds to a critical condition of concrete in compression where the state variable β is close to 1.0 in some critical areas of the model (struts or nodal areas).
Secondly, the generalized isotropic strength degradation scenario was more suitable for the context of designing new RC structures. For the assessment context, it is interesting to consider the effect of existing discrete cracks (e.g., originating from temperature gradients) on the final configuration of the flow of stresses. Finally, for the SRDM-3D to be used in a design code or standard, a reliability framework must be developed and should align with the current safety margins implicitly provided by existing conventional design approaches. All of these limitations will be considered in the next section through a new enhanced Strength Reduction Assessment Methodology or SRAM.

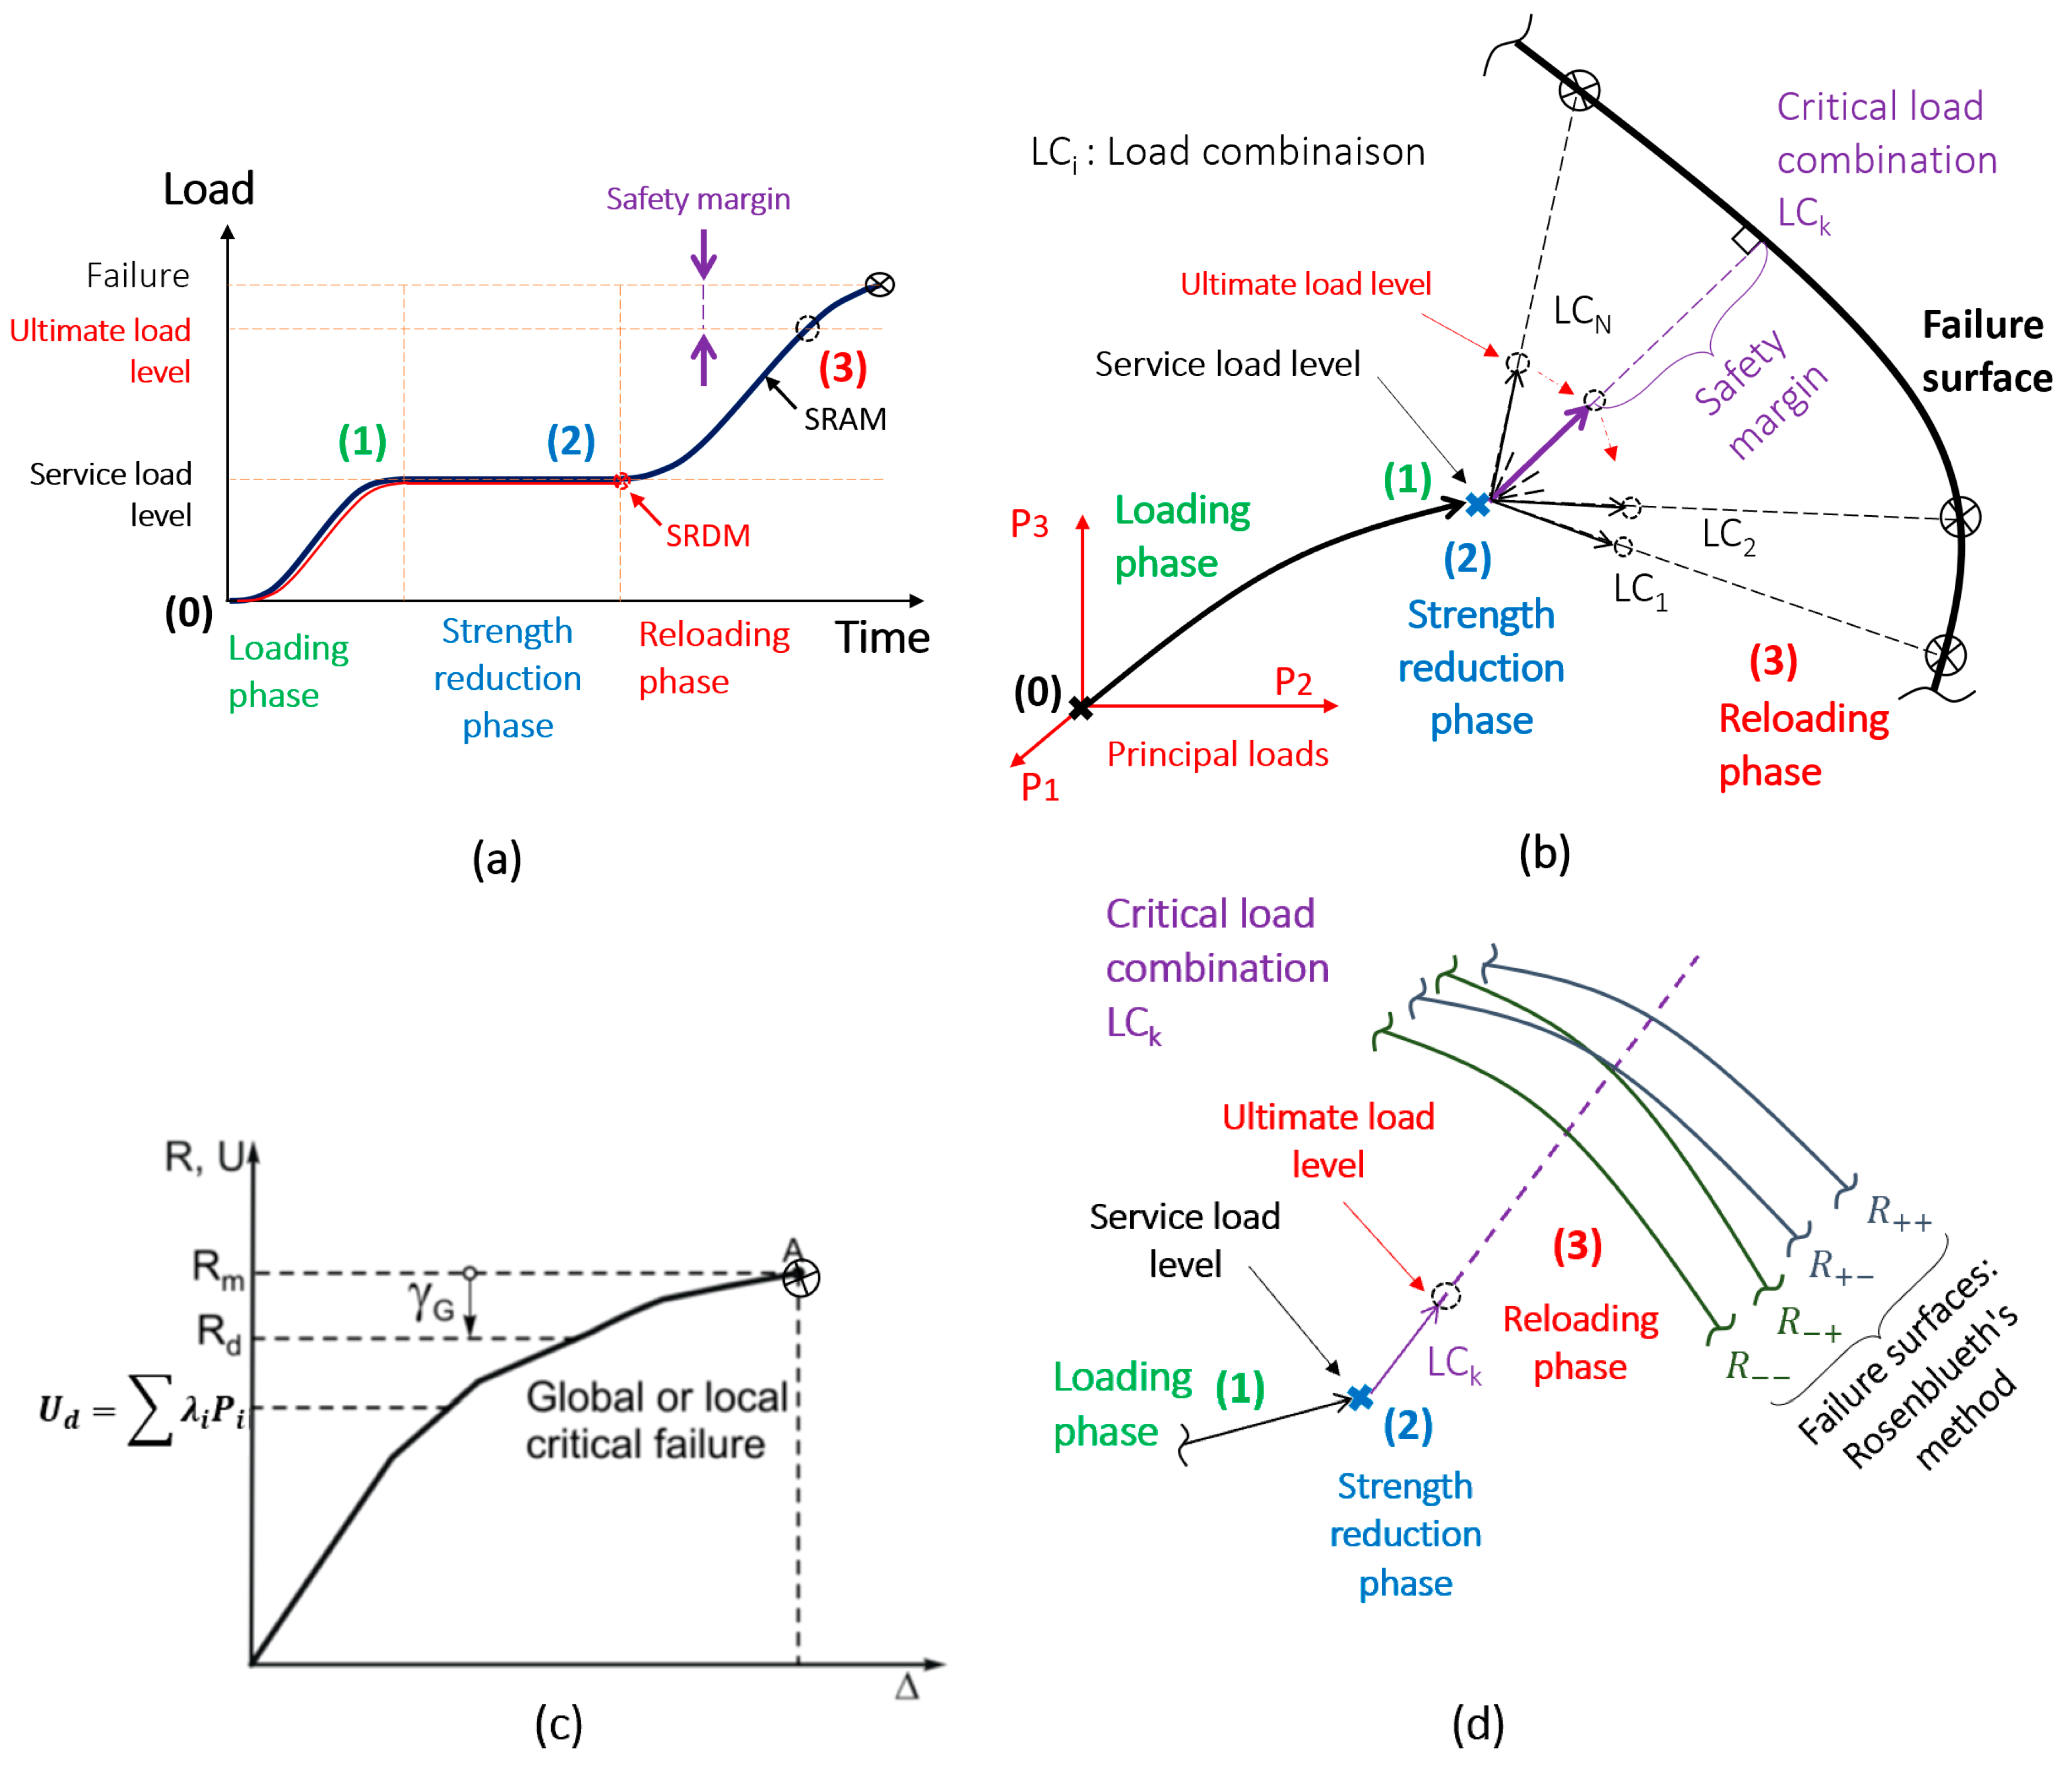
3. Strength Reduction Assessment Methodology

The developed SRAM is based on three key aspects that will be detailed in the following sections: the reloading phase, the service load condition and the reliability framework. The 3D constitutive modelling used in this work is the one derived in [17] and is therefore not detailed. A user material was programmed in the user-subroutine VUMAT used by the commercial package Abaqus-Explicit [20]. For more details, the reader is referred to [17].

3.1. The Reloading Phase

To solve iterations problem in search of the ultimate load, a reloading phase is introduced after the strength reduction phase, as shown in Figure 3a. Hence, at the end of the strength reduction phase, when the tensile strength reaches zero, the load is gradually increased until failure. The targeted load level at the end of the first loading phase is the service load level. The ultimate load level shown in Figure 3a corresponds to design level of factored loads.
The loading path is schematically shown in the virtual space of principal loads, in Figure 3b, assuming three principal loads for this conceptual example (P1, P2 and P3). The points at the beginning and the end of strength reduction phase are coincident, as shown. Different load paths can be followed at the beginning of reloading phase. Each path requires a different analysis and corresponds to a given load combination LCi of the principal loads: λ 1 , i P 1 + λ 2 , i P 2 + λ 3 , i P 1 , where λ j , i are load factors available from the codes (e.g., [19]). The search for the critical load path, corresponding to the critical load combination LCk is a common exercise in engineering practice. This critical load combination involves a minimum safety margin as schematically shown in Figure 3b.

3.2. Service Load Condition

For an existing structure, service load effects can be assessed using nominal load values available from codes or statistical information (e.g., structural health monitoring data). Additionally, the current condition of the structure can be updated using relevant site investigation. This information will contribute to “a better estimate” of the location of point (1) in Figure 3b. As an example, for hydraulic structures, available site-specific information using destructive and non-destructive techniques can be used to locate and define cracking planes originating from thermal effects at early age. This information can be used to adjust boundary conditions and calibrate relevant early age parameters feeding the ANFEA [21]. Alternatively, it can be used to directly define embedded weak planes into the geometry of the FE model using contact interfaces, as it will be shown later in validation example 1.

3.3. Reliability Framework

A reliability framework shall consider the random nature of resistance and load effect functions, respectively R and U, and the minimum required safety margins. In the practical field of structural concrete, engineers shall apply design code provisions based on a quasi-probabilistic approach, using for instance the concept of load and resistance factors [22]. Under-strength material factors (e.g., ϕ s for steel reinforcement and ϕ c for concrete) and overload factors (e.g., λ P factors for each load category P) are derived from probabilistic data and are compatible with a maximum allowable probability of failure p f or a minimum reliability index β m i n ([13,23]). This approach, also called the partial safety factor approach, can be extended to the field of ANFEA by using characteristic values of material inputs parameters (e.g., ϕ c f c for concrete or ϕ s f y for steel reinforcement) in the non-linear analyses. Different load combinations using different load factors can be considered for the search of the critical load path. This approach is not really suitable to all applications even if it is widely used in engineering practice due to its simplicity and consistency with current design code provisions [13,24]. For example, in non-linear analyses involving thermal effects, the use of characteristic or design values of material properties would result in a weaker material which may lead to unrealistic redistribution of internal forces.
A reliability framework has been suggested by second author in a previous work, for the context of concrete design using results of ANFEA [13]. It is based on the global resistance factor approach, and is well-suited for structural engineers who have access to nonlinear deterministic finite element packages with concrete models. This formwork suggests a reliability format that focuses on the variability on the resistance side while using the concept of critical load paths on the load side which is compatible with the philosophy of existing design codes (Figure 3c). A global resistance factor γ G is computed for each loading path and then used to deduce the design resistance value Rd from a mean resistance value Rm obtained by ANFEA, using the following equation:
R d = R m γ G
The global resistance factor is computed from the following expression:
γ G = e β m i n · α · V R
where: α = 0.80 and βmin is the minimum reliability index required by code provisions (typical values: 3.5 for a ductile failure and 4.25 for a brittle failure). VR is the coefficient of variation or c.o.v of the resistance function R estimated through the so-called Rosenblueth’s point estimate method [25]. Point estimate methods are simple and robust statistical methods used to evaluate statistical moments of a random function R (e.g., mean and variance) by using its values at particular points in the space of the input variables, called sampling points. These points are typically located around the mean value point plus or minus a standard deviation. Rosenblueth’s point estimate method [25] was specifically used and validated in a previous study [13], to assess VR, using a limited number of ANFE analyses. Typically, 2N analyses are required to assess the statistical moments of R, using the following equation:
E ( R m ) 2 N   p o i n t s p i R i m
where:
-
m is the moment order (e.g., m = 1 for the mean value). To compute the variance of R, Equation (6) is used twice to compute E R and E R 2 . Subsequently, the variance is determined using the equation: v a r R = E R 2 E R 2 ;
-
R i is the resistance evaluated at a given sampling point i, N is the number of random input variables, and p i is the discrete mass probability. In case of uncorrelated input variables: p i = 1 2 N .
The same reliability framework is used in this work. As the compressive strength of concrete ( f c ) and the yield strength of steel ( f y ) are the only required input parameters (N = 2), the total number of required strength reduction FE analyses is 2 N = 4 for each identified critical load path. An additional analysis using mean values of input parameters is also recommended to determine the average response of the structure, bringing the total number of analyses to 2 N + 1 for each potential critical load case. This methodology is illustrated in Figure 3d, in the principal load space. The direction for the reloading phase remains the same for the 2 2 analyses (also called Rosenblueth’s analyses), only the position of the failure surface changes. At each Rosenblueth’s analysis, a different structural strength corresponding to an ultimate failure load is obtained. The notation format used in this figure and elsewhere in this paper is Rcs, where c and s are associated with concrete and steel properties, respectively. The (+) sign indicates that the corresponding material properties used in the model are equal to the mean plus one standard deviation, whereas the (−) sign corresponds to the mean minus one standard deviation. For all examples in this study, the initial value of the tensile strength is computed from the compressive strength of concrete using the semi-empirical formula: f t = 0.45 f c (all the quantities are in MPa).

4. Validations

To assess the effectiveness of the developed strength reduction assessment methodology, three examples are presented in this section. The first example is a new suggested conceptual benchmark of a simply supported RC beam with a pre-existing discrete crack. The second and third examples are related to experiments from literature of a RC beam falling in shear and a RC tunnel box, respectively.

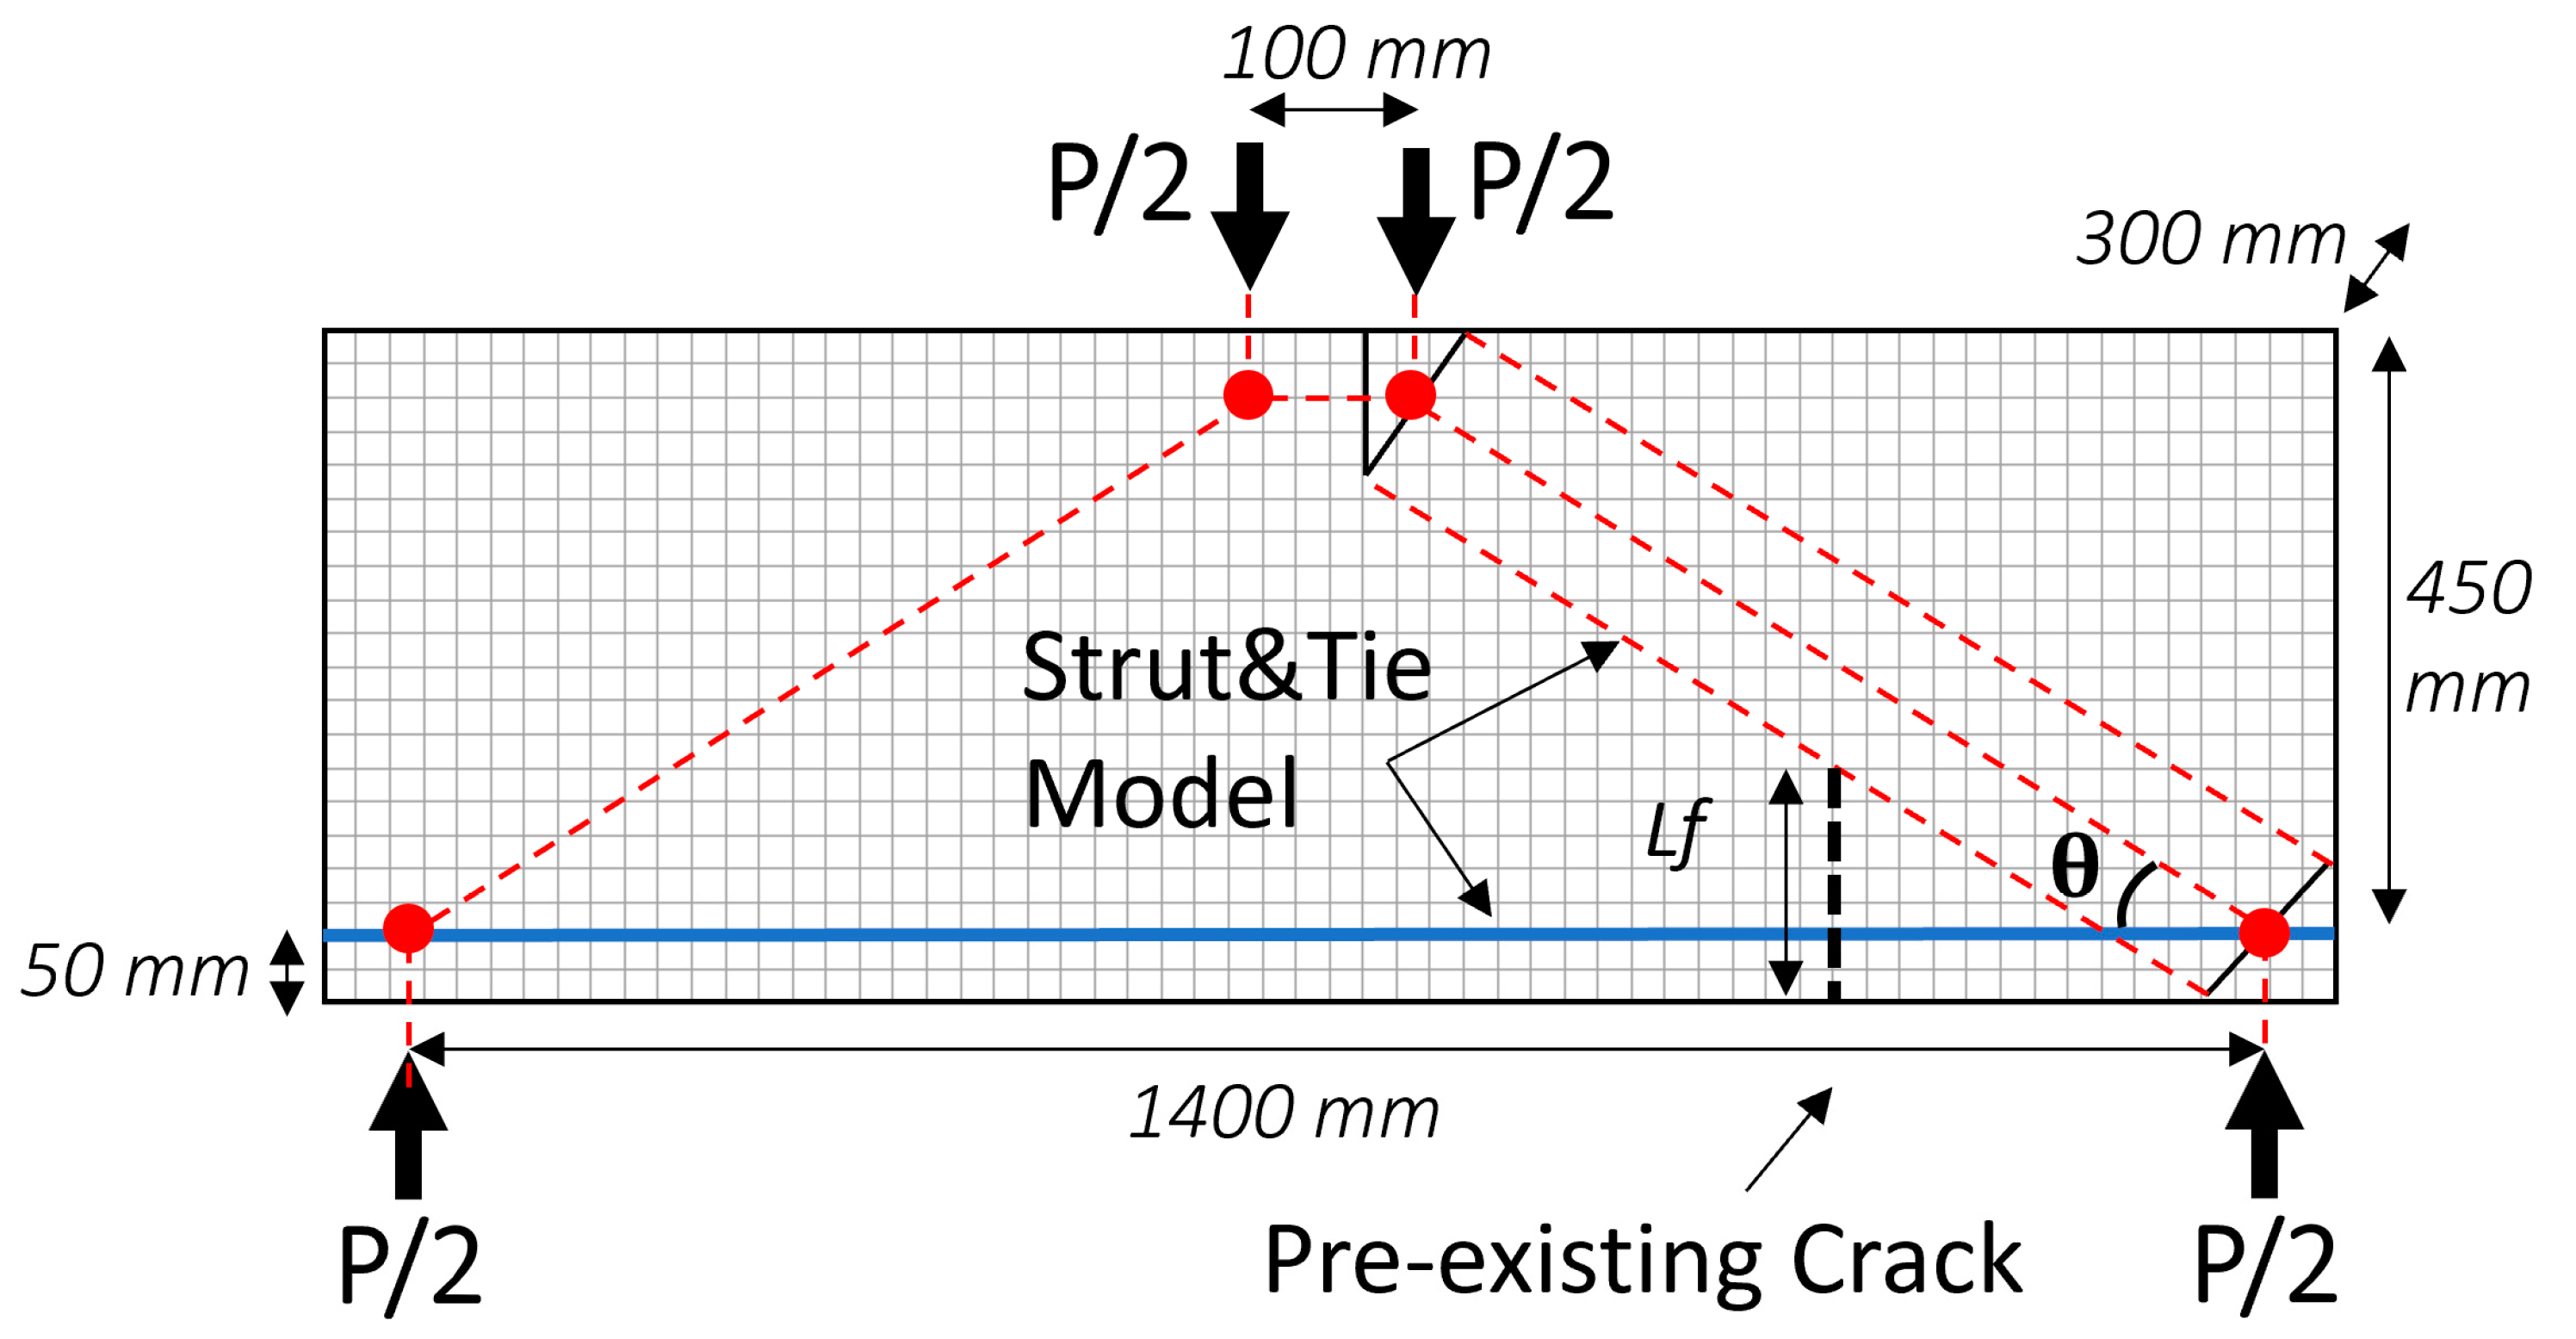
4.1. Example 1: RC Beam with Pre-Existing Crack

Figure 4 shows the geometry of the RC with a pre-existing crack. The objective of this newly developed benchmark is to demonstrate the feasibility of the SRAM for structures with identified pre-existing crack. In this scenario, the crack length L f is variable and SRAM results are compared to theoretical results using the S&T model shown on the same Figure 4.
Table 1 provides the material properties used in the example. In the simulations, reinforcement rebars are modeled as truss elements embedded within 3D solid elements. Five rebars, each with a cross-sectional area of 300 mm2 were used (20 M rebar). The mesh density is shown in Figure 4. Due to symmetry, only half the beam model was used in simulations. To model the pre-existing crack, a frictionless contact interface is used. This interface transfers only normal compressive contact forces and is present at the beginning of the analysis before application of load P.
The schematic representation of the S&T model employed in theoretical calculations is depicted overlaid on the FE mesh in Figure 4. As the crack length L f increases, the effective width of the inclined strut diminishes, impacting the strength of the theoretical model. Figure 5 presents a comparison between numerical (SRAM) and theoretical (S&T) results. The strength of cracked or uncracked beam corresponds to the maximum transferrable force P (Figure 4) before failure. Each point in the curve represents a different numerical simulation/theoretical computation. A good correlation is observed between both results. The strut path (principal compressive stresses) at the end of the reduction phase is also shown in Figure 5 for two different configurations: uncracked beam and pre-existing crack at 50% of the beam height. The disruptive effect of the crack is clearly evident. In all numerical simulations, the final failure mechanism was related to the compressive failure of the strut.
This example demonstrates the possibility to include weak planes in existing RC structures. Friction and cohesion effects can also be integrated into contact interfaces to more realistically represent the behavior of crack planes.

4.2. Example 2: RC Beam Falling in Shear (AW1 from [26])

Example 2 is a RC wide beam without shear reinforcement (span to depth ratio or a/d = 3.4), tested experimentally at the University of Toronto [26]. Figure 6a shows the geometry of the beam, and Table 2 gives the input parameters. Mean values of f c and f y are from the experiment and COV values are identical to the ones used in [3], for comparison purposes with ANFEA results.
When assessing an existing RC structure, the initial load applied at the beginning of the analysis or preload corresponds to service load level (Figure 2a and Figure 3a). The difference between service load and ultimate load levels is due to the overload factors as discussed in Section 3. For an experimental program, the service load level is a proportion of the failure load of the tested structure or structural element. In this case, the preload value would be a proportion of the experimental failure load. It was therefore decided for this example and for the next example to apply half of the experimental failure load (50% P u ) during the loading phase. Sensitivity analyses showed that preload values between 40% and 100% P u contributed to minor fluctuations in the obtained numerical failure load.
The purpose of this example is to apply the global resistance factor reliability framework and compare SRAM results with: (i) experimental results (in terms of the average value of ultimate strength); and (ii) numerical reliability results conducted in [3] using ANFEA (in terms of the average and c.o.v values of ultimate strength).
Table 2 presents the results, where SRAM values are considered (corresponding to the case 100 %   P u ) . As anticipated, SRAM results for ultimate shear load were on the conservative side, with an underestimation of 30% of the experimental shear failure load. The result was also 24% lower if compared to numerical failure load obtained by ANFEA in [3]. Comparison of the four SRAM Rosenblueth’s analyses shows that the parameter f y has no influence on the final resistances of the beam, which is consistent with the shear type of failure, or more precisely, the strut crushing failure obtained by SRAM as shown in Figure 6d. The c.o.v obtained by SRAM was slightly higher than the one obtained by ANFEA [3].

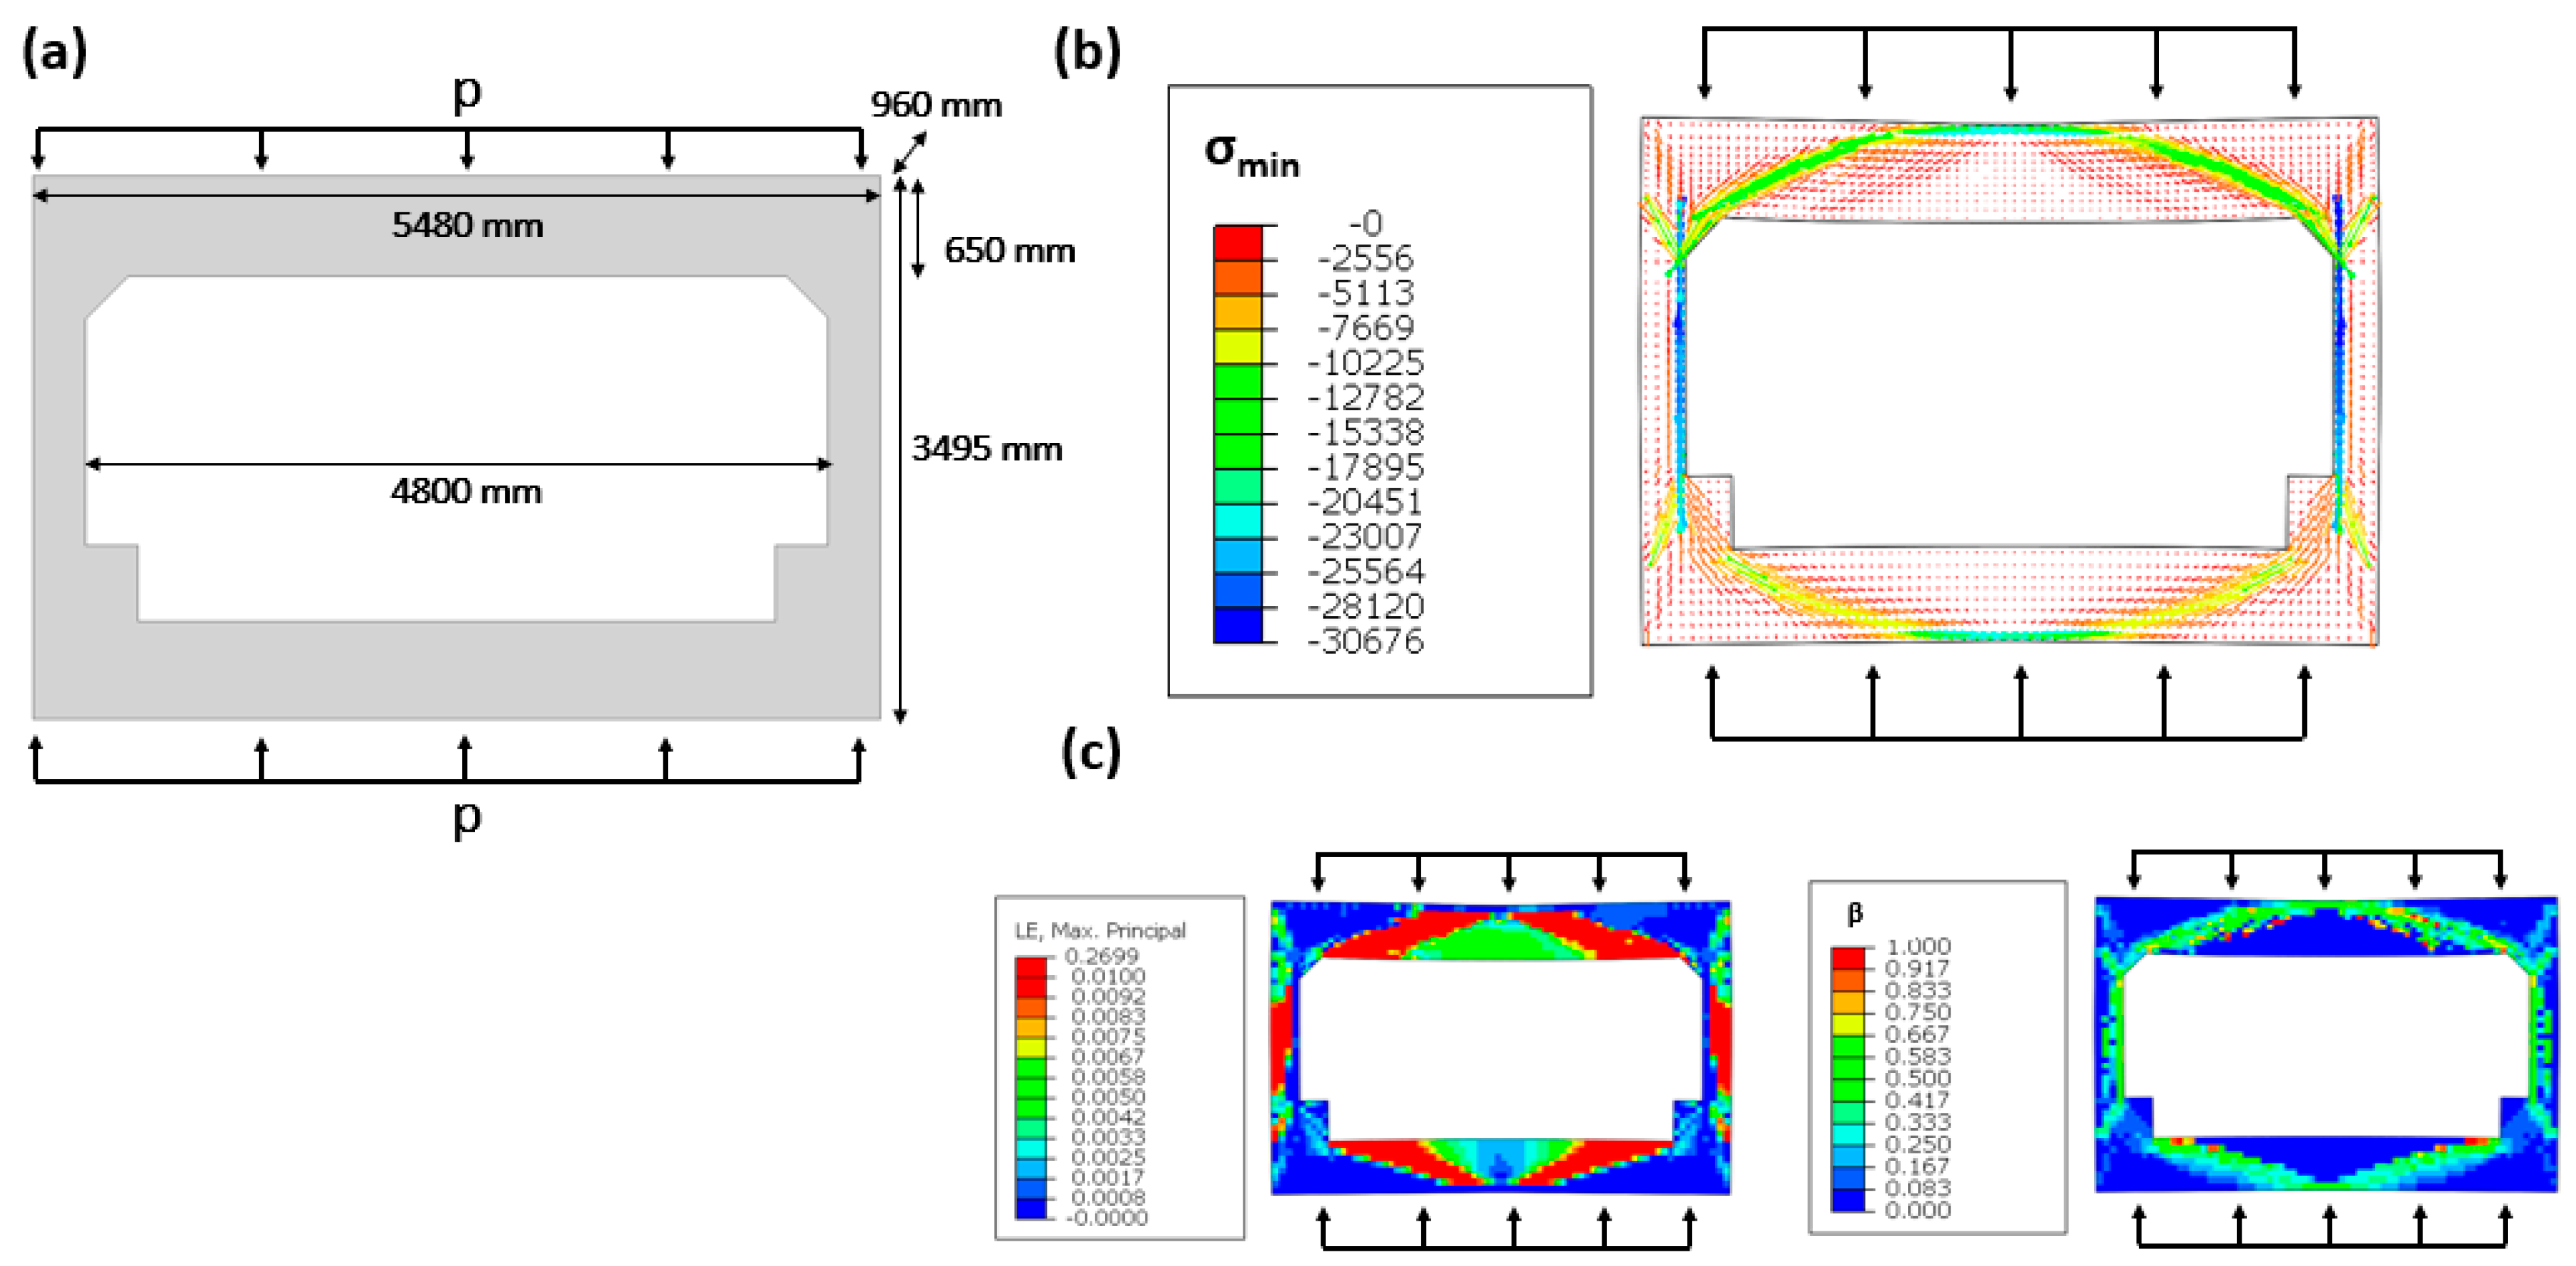
4.3. Example 3: RC Tunnel Section (from [27])

Example 3 is RC box structure without shear reinforcement, representative of a tunnel section tested by [27] and considered in [3]. The span to depth a/d ratio of the roof portion falling in shear is 1.9. Figure 7a shows the geometry of the beam, and Table 2 gives the input parameters. Mean values of f c and f y are from the experiment and c.o.v values are identical to the ones used in [3], for comparison purposes with ANFEA results. Table 2 presents the results, where SRAM values correspond to the case 50 %   P u . Again, SRAM results were on the conservative side, with an underestimation of 11% of the experimental shear failure load. The result was also 19% lower if compared to numerical failure load obtained by ANFEA in [3] (ANFEA in this case overestimated the capacity of the tunnel section). Although a shear failure mode was observed for the roof portion as in previous example 2, different conclusions regarding SRAM Rosenblueth’s analyses were obtained for this example. In fact, the four Rosenblueth’s analyses results were different for this example, meaning that both f c and f y had influence on the final failure mechanism. The c.o.v of the structural resistance was slightly lower than the one obtained by ANFEA. Also, this c.o.v was half the one obtained in the first example, though identical input c.o.v were used in both examples for f c and f y (Table 2). The same conclusions regarding the differences between the examples were drawn in [3], and were attributed to the difference in the a/d ratios between the two examples. It is believed that a smaller shear span ratio is favorable to the formation of a second resistance mechanism after the formation of the first shear crack. This second mechanism involves a direct concrete strut towards the support and a tie action from the bottom layer longitudinal reinforcement of the roof. This effect can be clearly seen in Figure 7b, and explains the influence of f y for this example.

5. Applications

The draft tube and the spiral case components of an existing hydroelectric facility are considered in this section. Both RC structures were designed using conventional linear elastic FE analyses, in-house post-processing tools for stress integration and algorithms available in literature for computation of the required reinforcement. In these linear FE analyses, only mechanical loads were considered (gravity loads + hydrostatic loads).
In this study, thermal loads will be considered for the draft tube and not for the spiral case. For reliability assessment, the partial safety factor approach is considered for the spiral case, whereas global resistance factor approach is used for the draft tube.

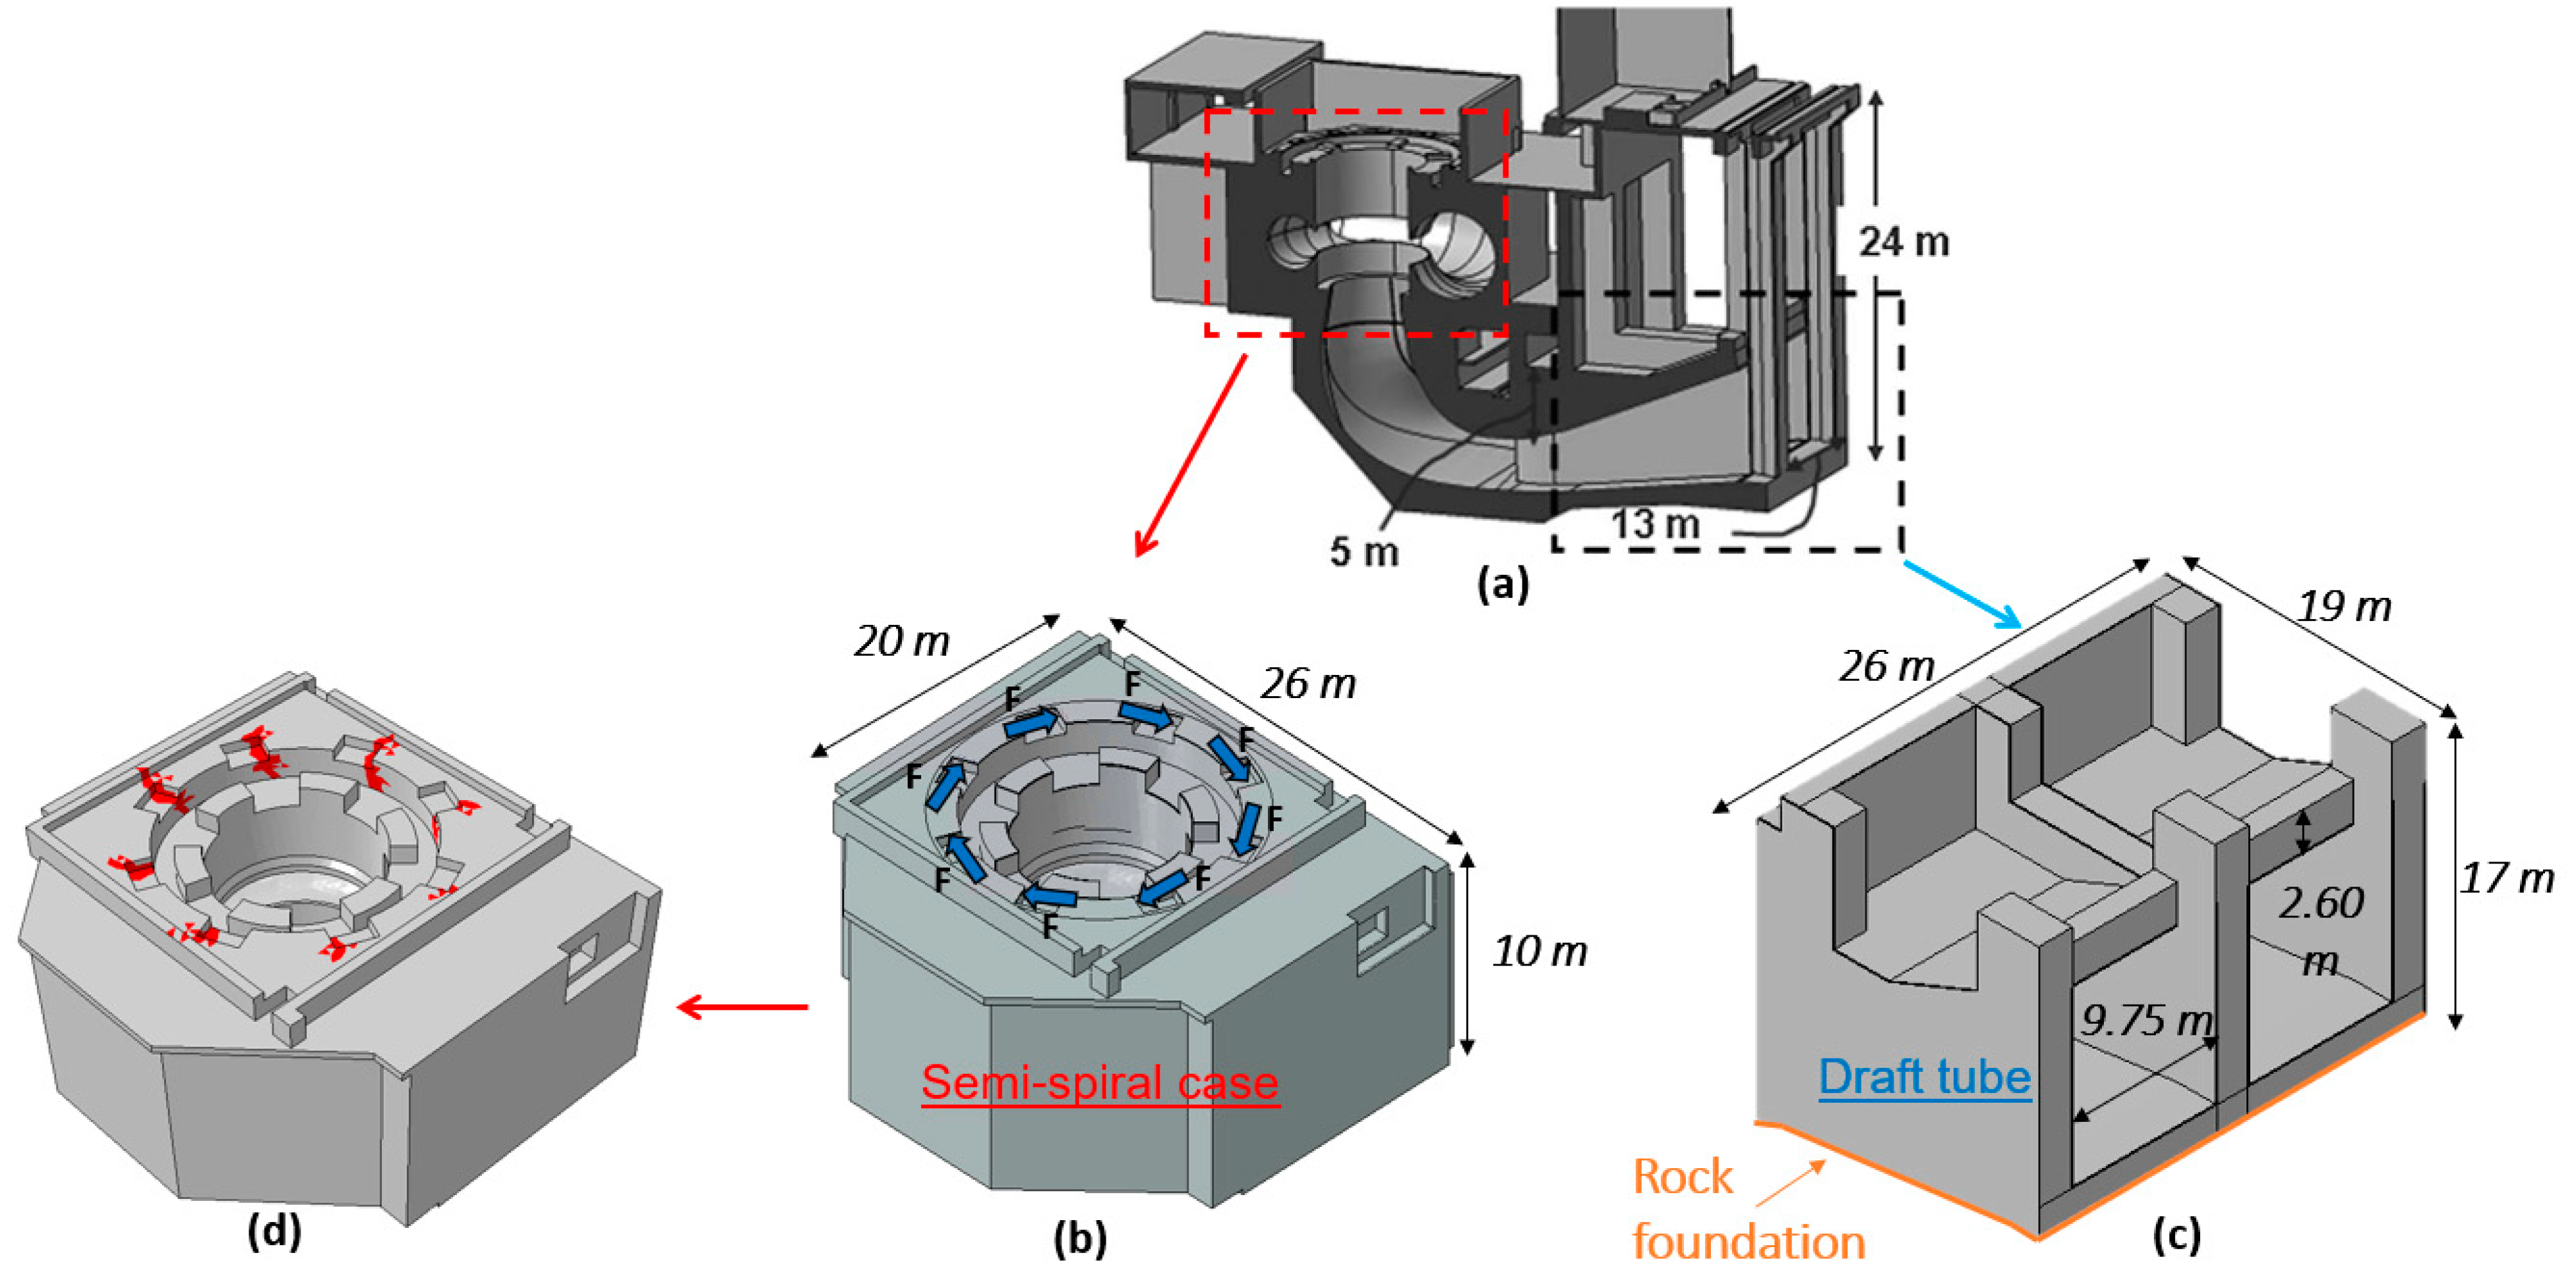
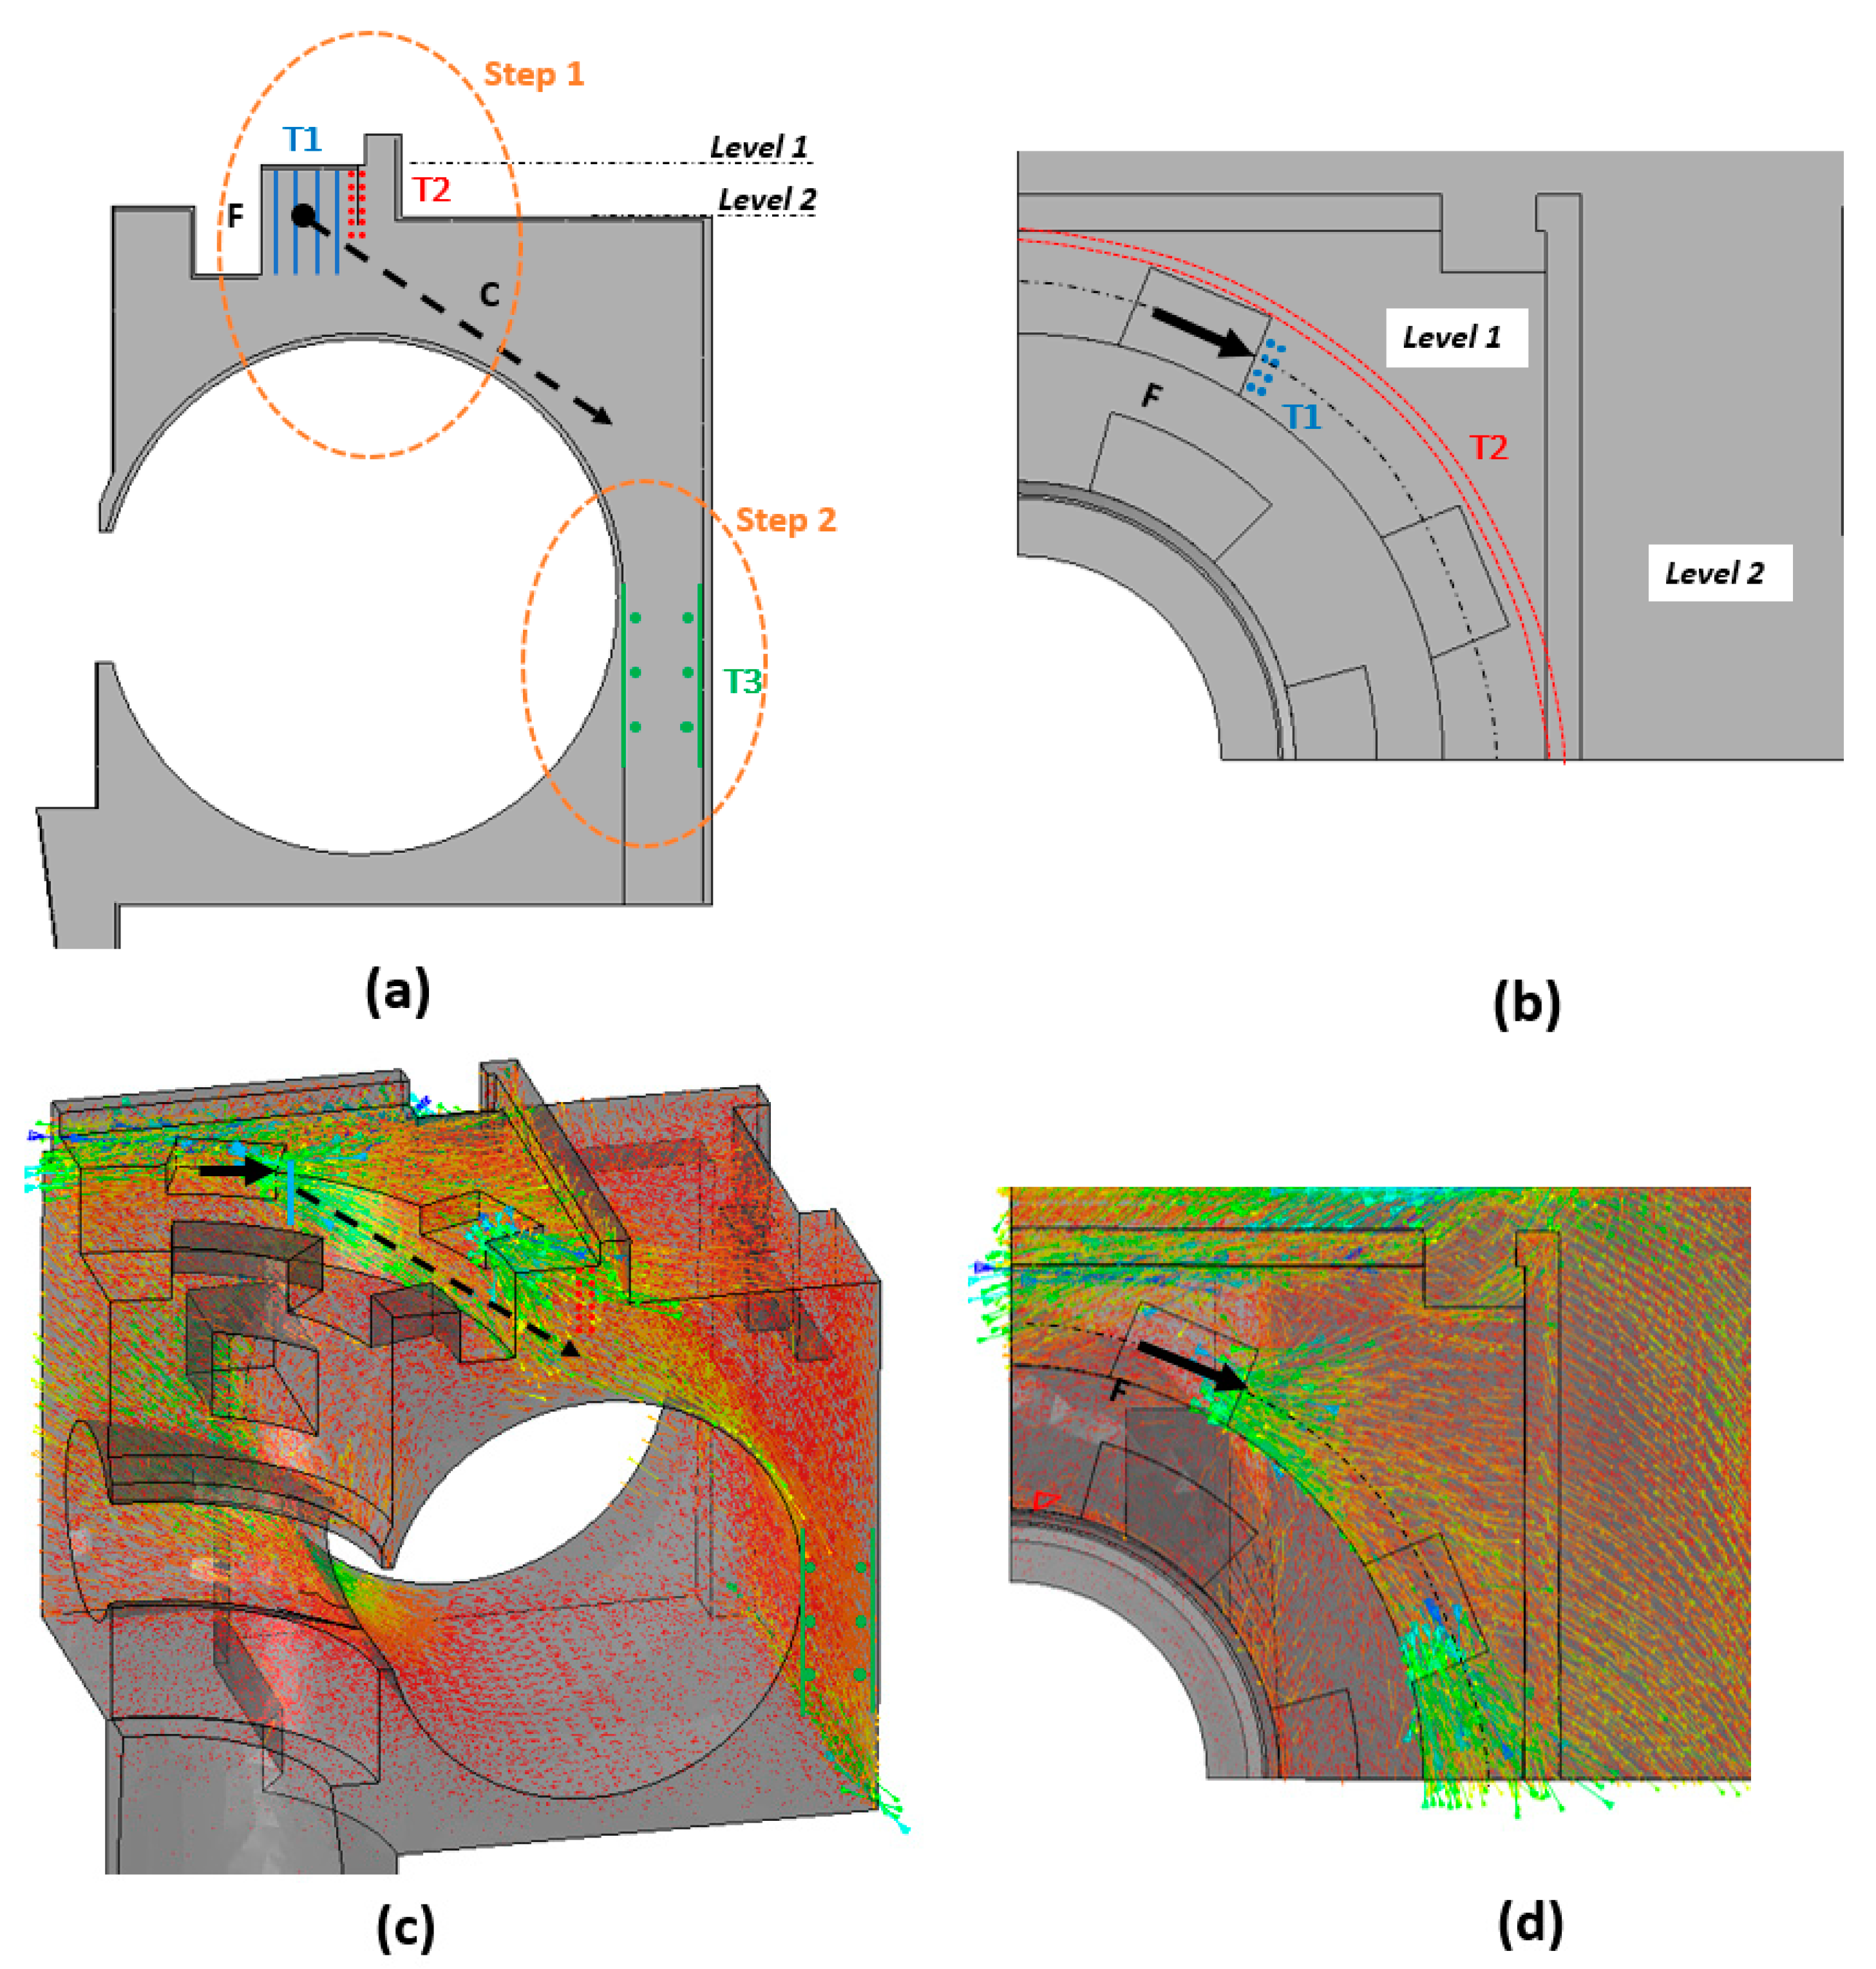
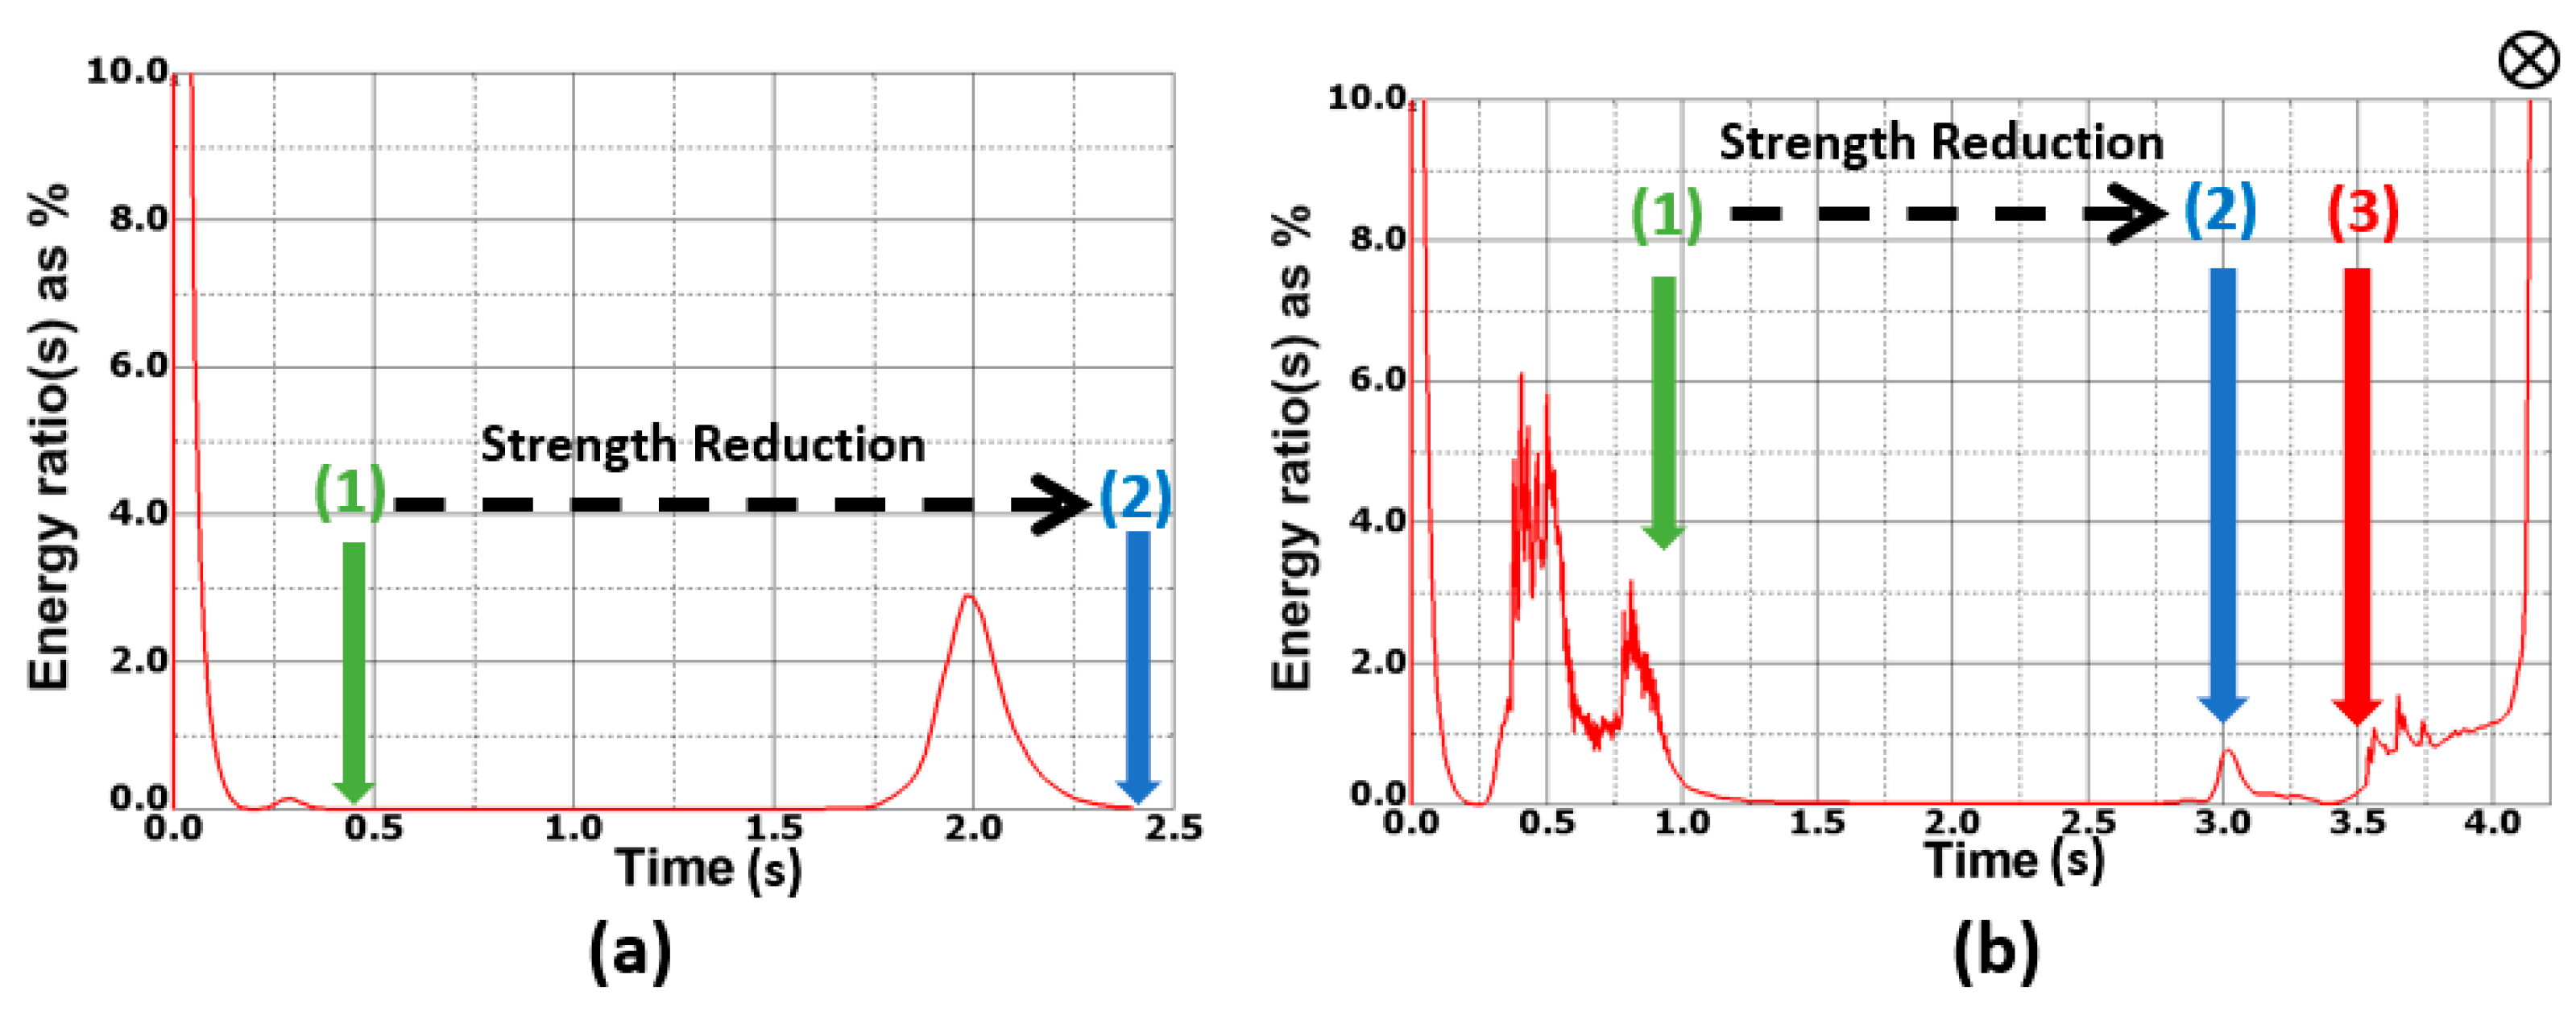
5.1. Application 1: Spiral Case

The spiral case is an example of a complex RC structure that has been rarely considered in literature. The normal load case for this structure involves full water pressurization, where the structure behaves as a pressure vessel. In this case, the load is mainly supported by and an internal steel liner containing the water (not shown in figures). The short-circuit load case considered is an accidental load case where the RC structure bears 100% of the load without the contribution of the steel liner. Large tangential loads F act simultaneously on each stator base (8 in total as shown in Figure 1b and Figure 8a), creating a high torque on the RC structure, in the order of 300,000 kN.m.
The short-circuit ultimate factored load case is: λ D L D L + λ S C S C where DL is the concrete dead load and SC are the 8 short circuit forces F, each of 6000 kN. λ D L = 0.85 is the dead load factor, and λ S C = 1.05 is the short-circuit load factor. The mean compressive strength of concrete is 40 MPa and the mean yield strength of reinforcement is 400 MPa.
The RC structure was designed to transfer the short-circuit loads to the spiral case foundation in two steps (Figure 9): (i) Step 1: from the stator support at level 1, to a lower level 2, using a combined system of struts and ties; (ii) Step 2: from level 2 to the foundation using a RC torsional resistance system.
A S&T model was used in step 1 (Figure 8c), composed of T1 and T2 reinforcement systems. T1 is required for a first downward deflection of the tangential and horizontal short-circuit forces. A 15 deg inclination angle with respect to horizontal was used from a rule of thumb in this industry, to set the inclination of S1 struts. This allowed to design the vertical T1 rebars which were welded to a horizontal steel plate located at level 1, as shown in Figure 9a. T2 is required for a second outward/downward deflection and consists of 12 horizontal continuous circumferential rebars as shown in Figure 8 and Figure 9. A system T3 of vertical and horizontal circumferential rebars was designed to take in the global torsional effect, once the short-circuit struts reach the external wall of the spiral case (Figure 9a).
The reinforcement was modeled (Figure 8b) and embedded into the spiral case concrete 3D solid elements. Both truss elements and surface elements were used for reinforcement, where surface elements allow to model two orthogonal layers of reinforcement.
The SRDM methodology was performed in this first example, using reduced values of input parameters: ϕ c f c , ϕ c f t for concrete and ϕ s f y for reinforcement at the beginning of analysis (partial safety factors approach).
Figure 10a shows the evolution of the kinetic over internal energy ratio during loading and reduction phases. It can be concluded that no failure occurred, and static equilibrium was reached at the end. This is confirmed by the results shown in Figure 11.
Figure 11a compares stress in reinforcement before and after strength reduction (envelope of maximum stresses for both directions for surface elements). Figure 11c shows (in red) reinforcement elements that yielded at the end of the reduction phase. Except for the T1 elements, yielding was limited to localized areas in other sections. Stresses in concrete struts at the end of reduction phase were not critical as shown Figure 11b. The variable β rarely exceeds the 0.5 value. Local yielding of some T1 vertical rebars means that the limit 15 deg inclination angle was exceeded by concrete struts S1 in some stator bases. Results in Figure 11a,b, prior to the strength reduction phase, can be considered analogous to ANFEA results (similar to Figure 1d). They affirm the significant influence of tensile peak and post-peak strength in the context of large reinforced concrete structures, emphasizing the importance of utilizing the strength reduction approach over ANFEA for such cases. Finally, there is a distributed tendency near the surface for the concrete struts observed at the end of the reduction phase (Figure 9c,d and Figure 11b). Nevertheless, their configuration is consistent with the reinforcement design model (Figure 8c and Figure 9a,b).

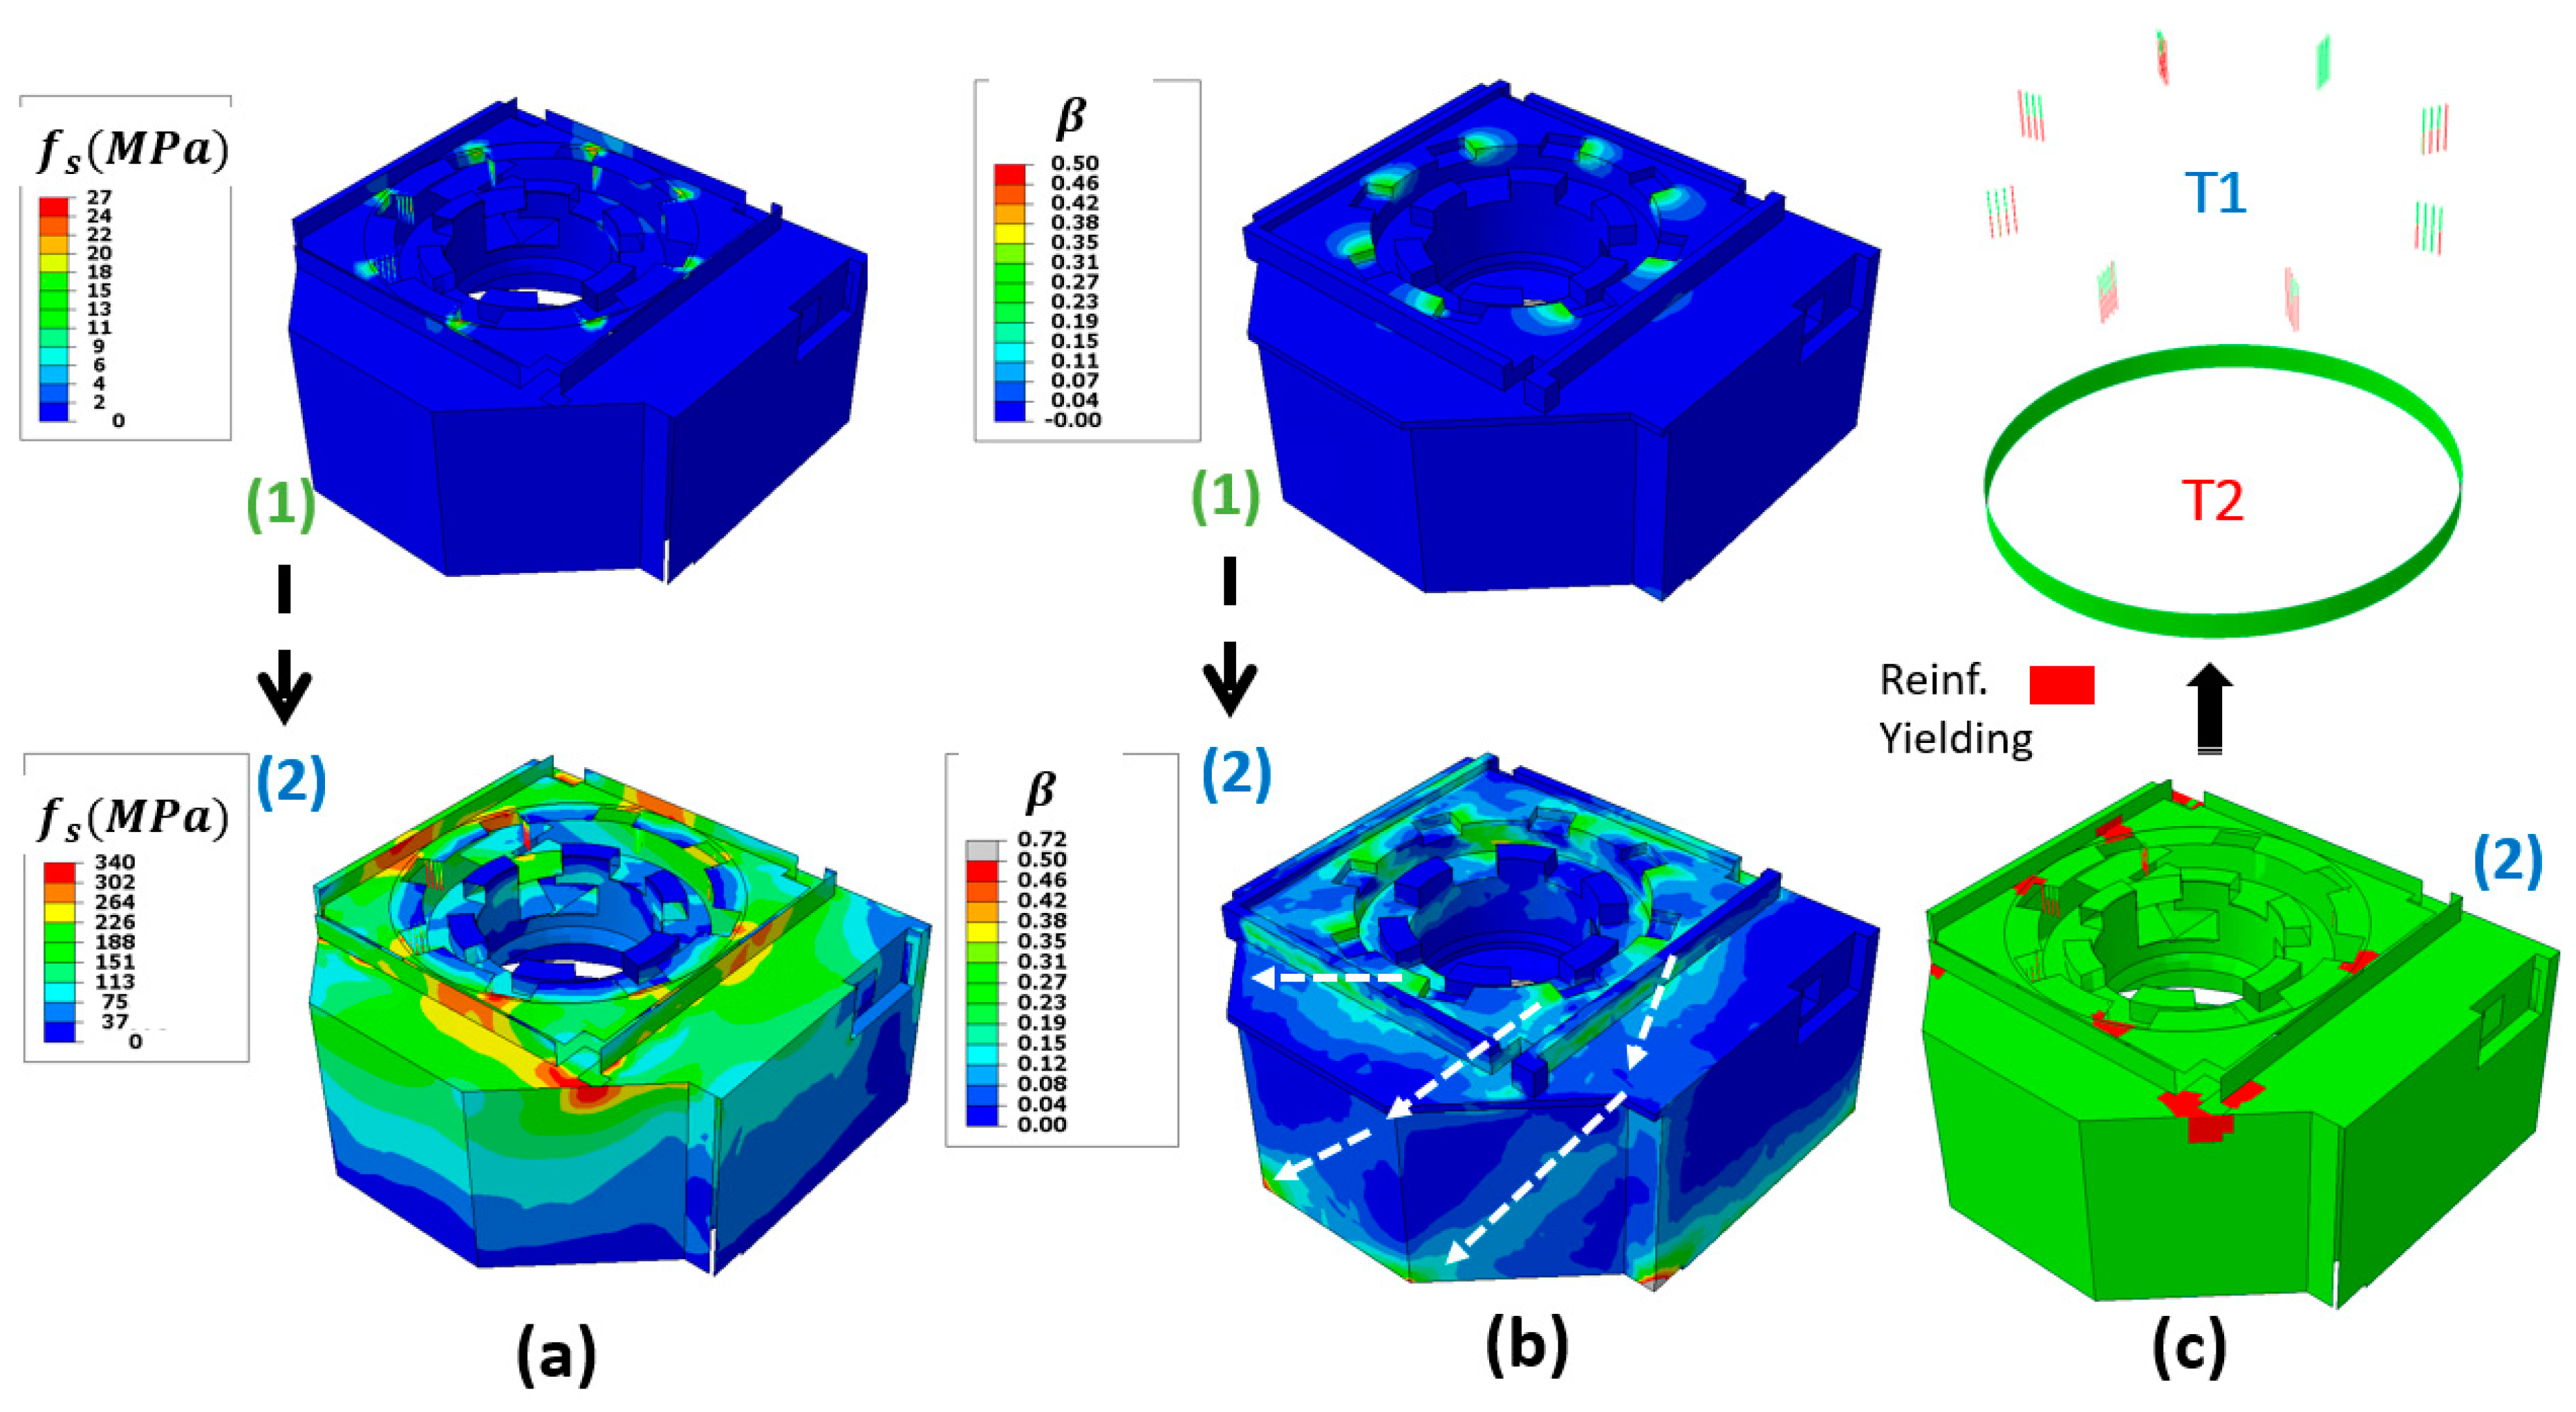
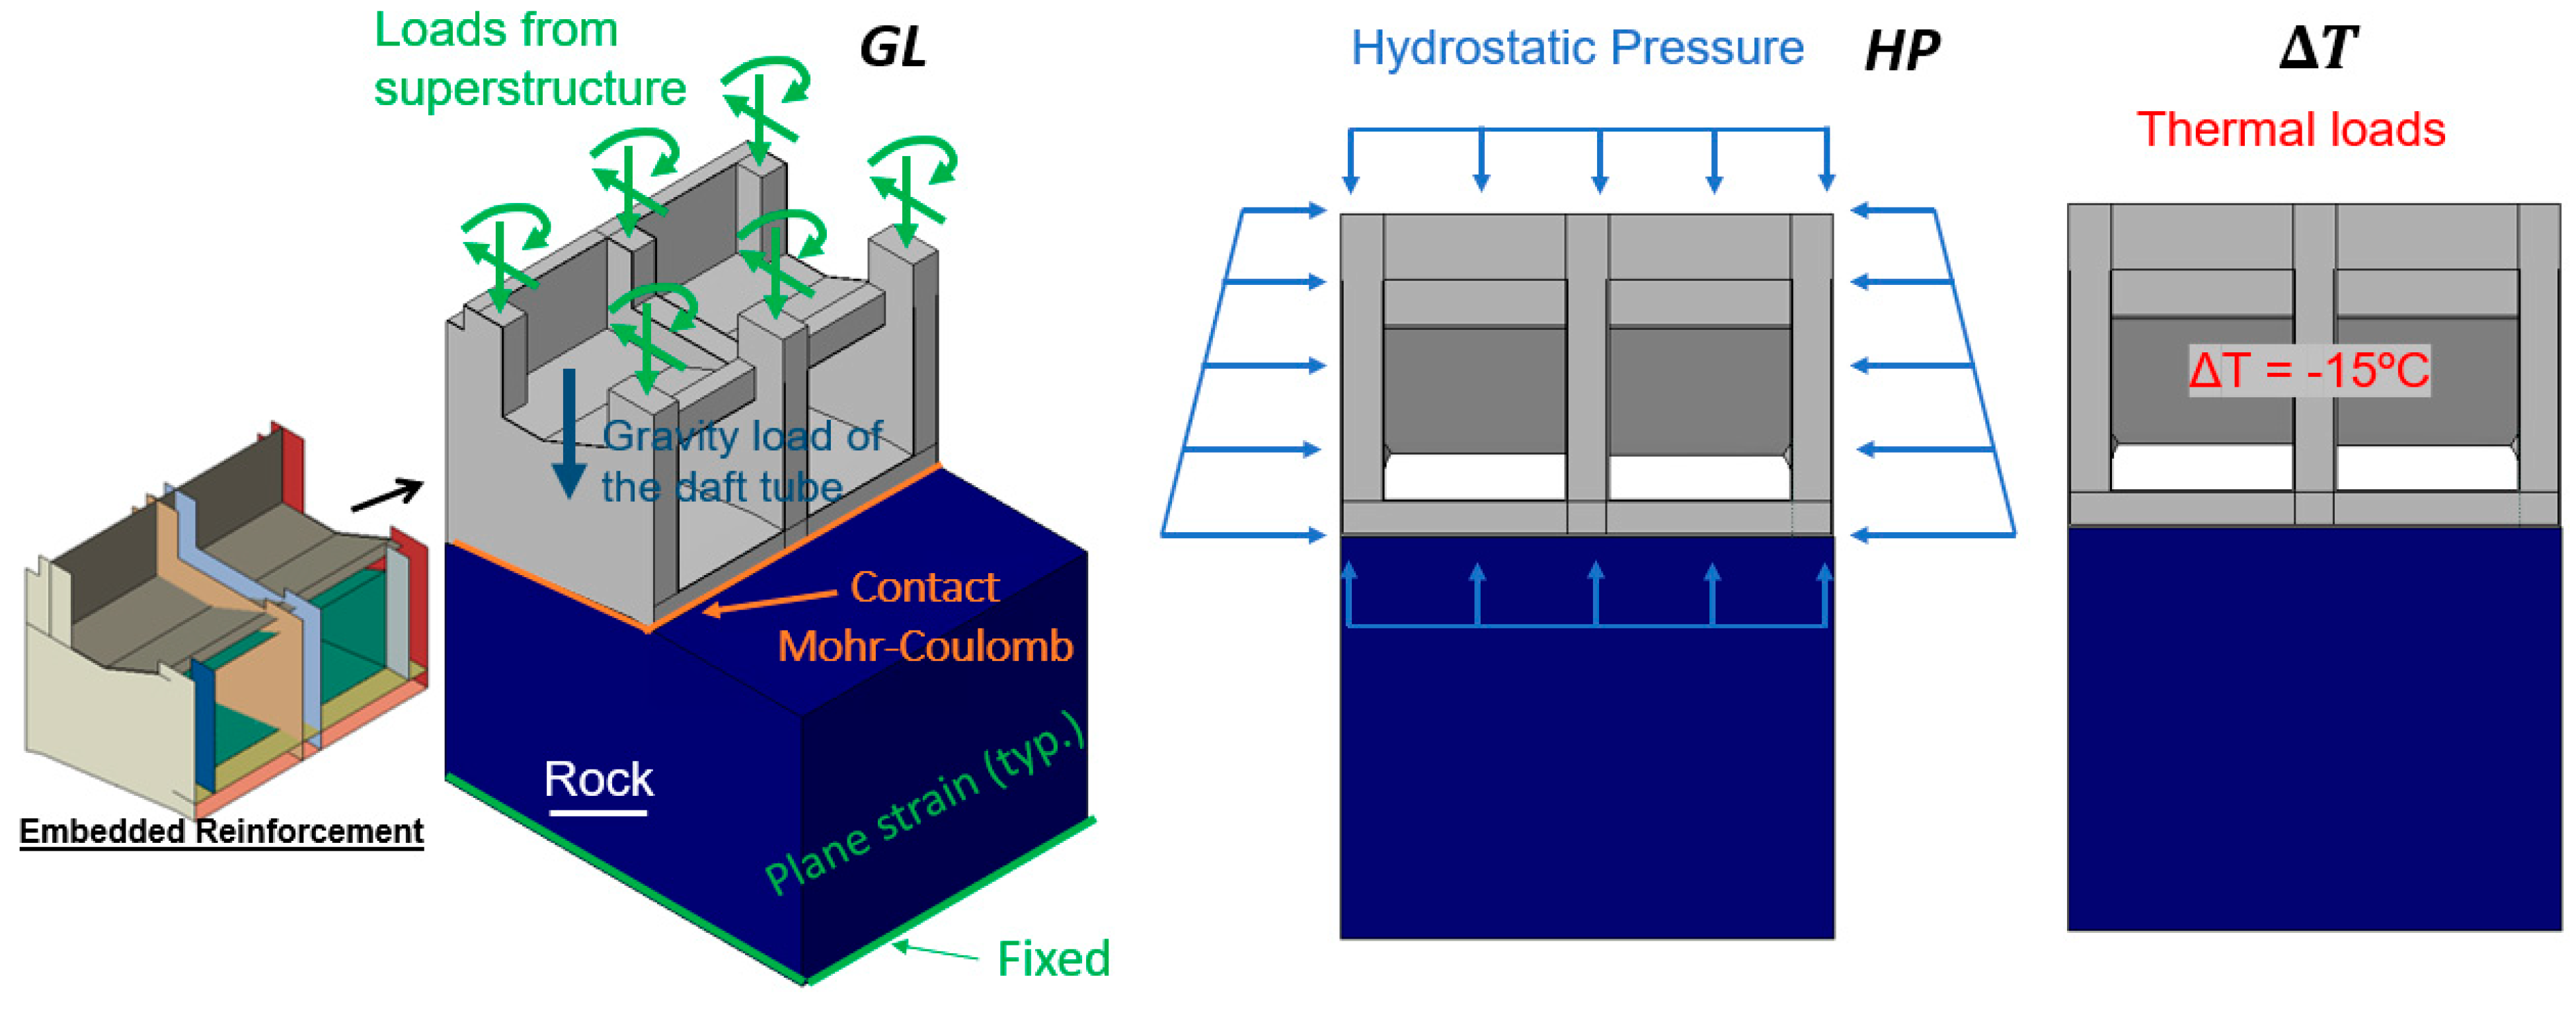
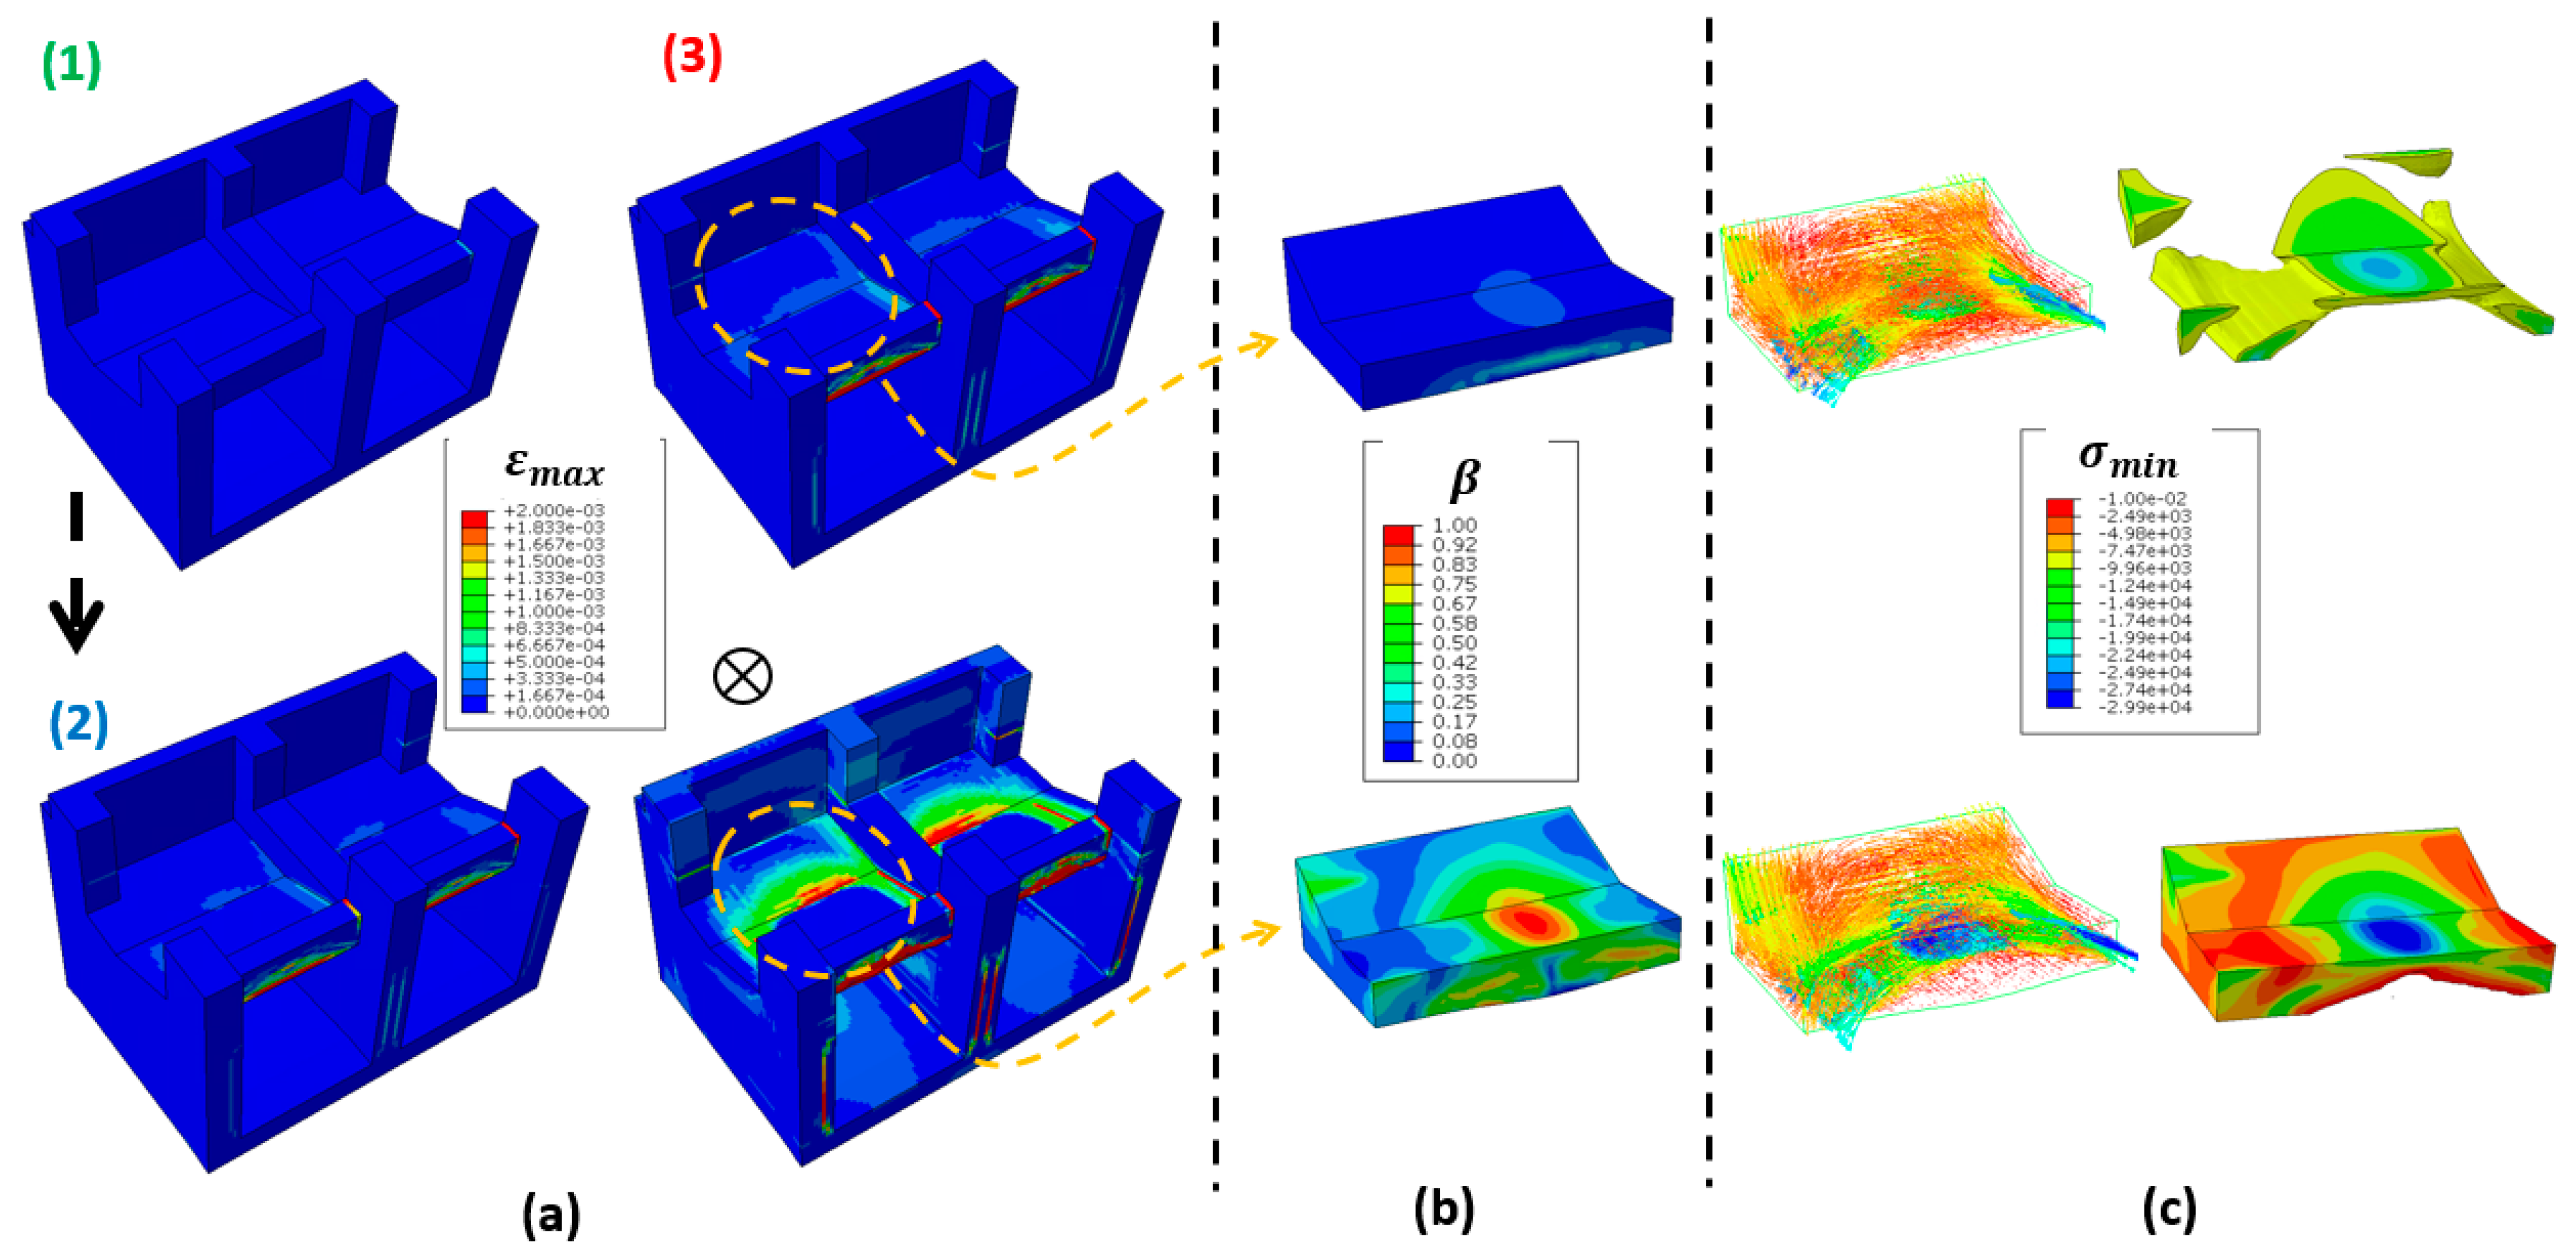
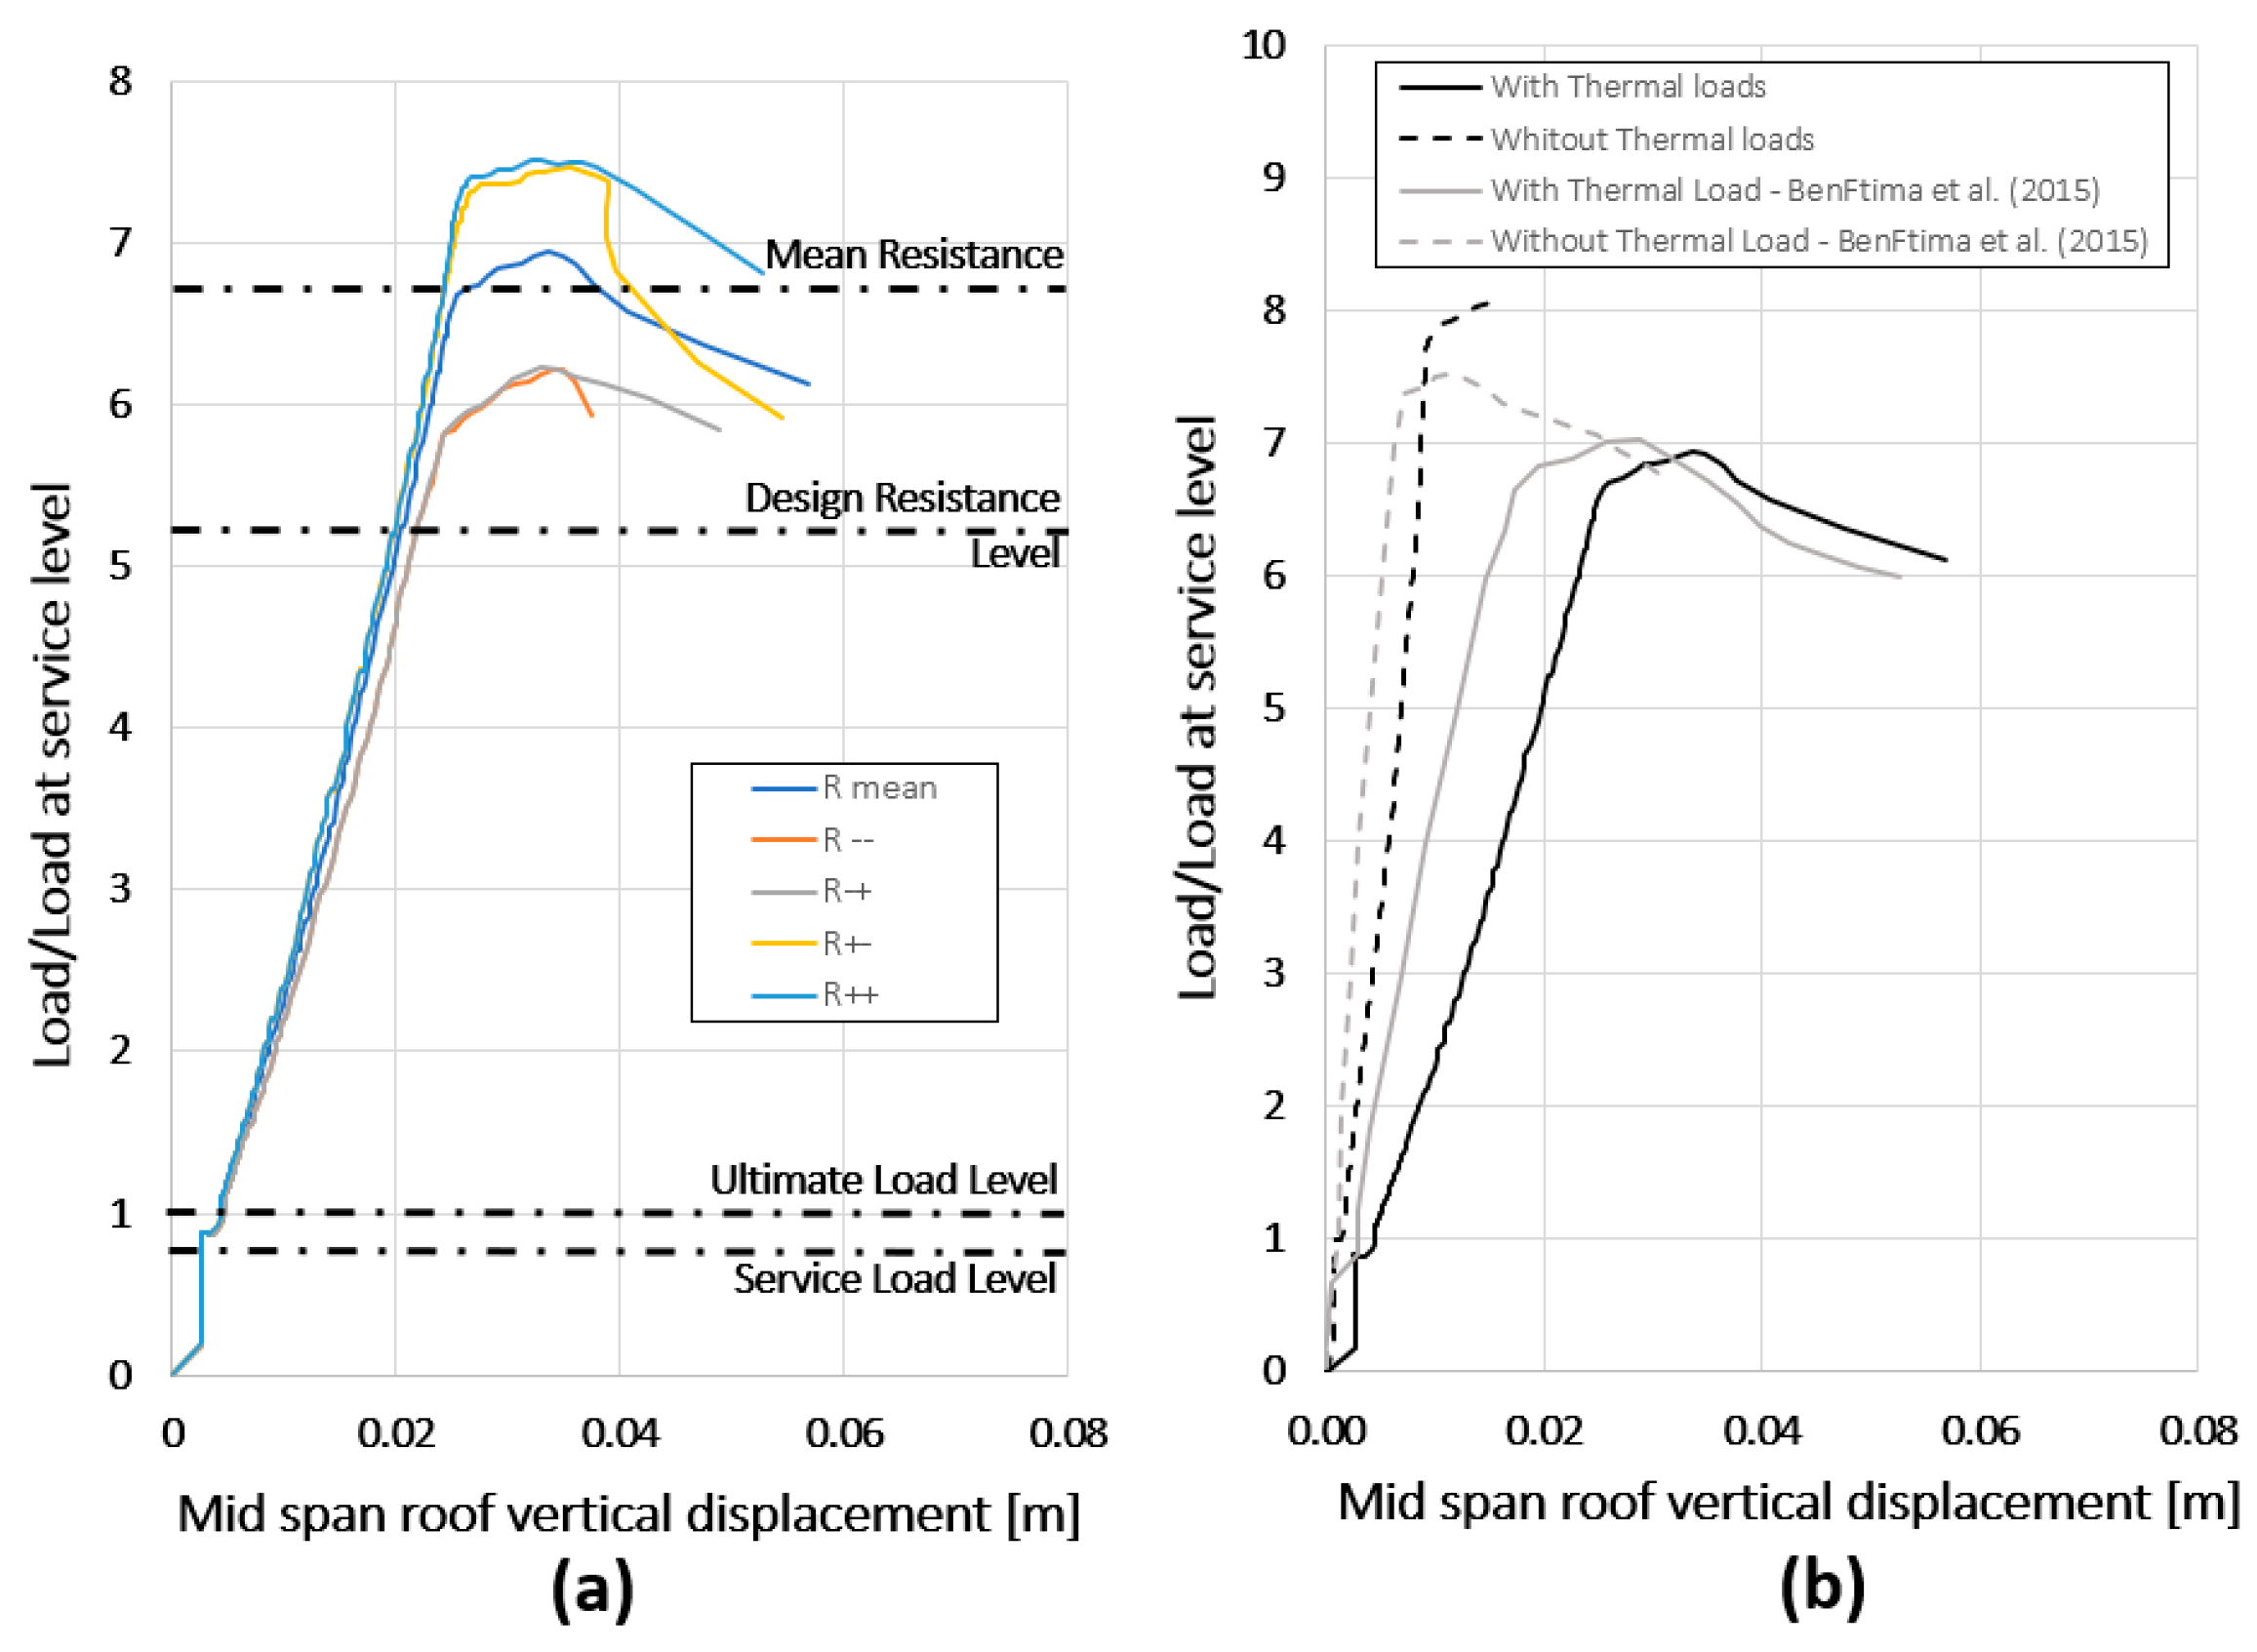
5.2. Application 2: Draft Tube

Figure 12 shows the geometry of the draft tube RC structure with its rock foundation and embedded reinforcement. A Mohr-Coulomb contact condition was used between concrete and rock and a fixed condition was used for the bottom face of the rock. Plane strain condition was imposed to all vertical rock surfaces and to the upstream concrete face of draft tube. The existing reinforcement was modeled and embedded in the model as shown. It was originally designed using linear elastic finite element analysis. Thermal effects were disregarded in the design stage and considered later for verification purposes using ANFEA [3].
In this example, thermal effects are considered. Due to these effects, and as explained before, S&T and linear elastic finite element methods are not applicable in this example. Only ANFEA can be used. SRAM is applied within the global resistance factor reliability approach. The geometry and material input parameters are taken similar to [3], for comparison purposes with ANFEA results.
The load case considered is the empty load case which governed the design of main reinforcement. Hydrostatic pressure loads are applied on external faces of the draft tube. The load combination used at service level is 1.0   G L + 1.0   H P + 1.0   Δ T . Loads are applied successively in the order: GL, Δ T and HP. The factored ultimate load considered is λ G L G L + λ H P H P + λ Δ T Δ T where λ G L = 1.25 , λ H P = 1.25 and λ Δ T = 1.25 are the load factors respectively for gravity, hydrostatic pressure and thermal loads. Hence, all loads are simultaneously increased starting from the service level and up to failure; following the incremental load direction (0.25; 0.25; 0.25) at ultimate which was considered critical for the roof of draft tube. Similar to the approach in [3], the mean values for concrete compressive strength and steel yield strength are: f c = 30   M P a et f y = 400   M P a . The coefficients of variation (C.o.vs) for concrete and steel are 0.2 and 0.09, respectively.
Figure 10b shows the evolution of kinetic over internal energy ratio during loading, reduction and reloading phases for the analysis with mean input parameters ( R m ). Failure is observed during the reloading phase. When compared to the previous application example (Figure 10a), an important peak can be noticed during the loading phase corresponding to thermal effects.
Considering the model with mean material properties, Figure 13 presents different results regarding the evolution of analysis and the final failure mechanism.
Even if it is difficult to talk about a real damage pattern in strength reduction analysis, the maximum principal strain ε m a x field, can still be used to represent the amount of elements that undergone softening. Based on authors experience, pattern of this deformation field is quite similar to the cracking damage pattern that can be observed with ANFEA and the smeared crack approach. However, ‘damage’ appears clearly more smeared in the case of strength reduction analysis. Figure 13a presents the evolution of ε m a x field during analysis. The roof failure can be clearly seen at the end of the analysis with a damage pattern consistent with the punching shear failure reported in [3]. Figure 13b,c compare σ m i n and β fields at the ultimate load level and at failure. The final 3D strut pattern can be clearly seen just before failure.
Figure 14a shows Rosenblueth’s analyses results ( 2 2 analyses plus an additional analysis using mean properties). The load in Figure 14 corresponds to the vertical load transferred by the roof, normalized by its service level value.
Comparison of the different curves shows that the results were less sensitive to the variation of f y , similar to example 1 considered in Section 3. Using Equation (6), and resistance values for each analysis, it is possible to compute V R = 0.09 , which is higher than the value of 0.05, found in [3] using ANFEA. This result is consistent with the results of previous Section 3.
Using Equation (5) and β m i n = 4.25 , the computed value of the global resistance factor is γ G = 1.36 which is slightly larger than the value of 1.19 obtained in [3] using ANFEA (without considering model error R = R ~ ). The design value of the draft tube resistance is accordingly shown in Figure 14. It is above the ultimate design load level, indicating that the draft tube is safe for the considered load case. The design value found in this study is 15% lower than the one found in [3] using ANFEA, confirming that SRAM results are always on the conservative side.
Finally, Figure 14b compares the results using mean input parameters with and without thermal loads. Consideration of thermal loads decreases by 14% the strength of the RC structure according to SRAM results of this study, whereas a 7% reduction was observed with ANFEA. The differences between SRAM and ANFEA results for this example are believed to result from the influence of the fracture energy G F on ANFEA results. As pointed out in [3], G F is responsible for stable crack propagation in RC structures, which has a beneficial effect on the resistance ( R m ) and a damping effect on its variability ( V R ). However, this beneficial effect may be counteracted by an increase in the variability of results ( V R   ) when considering the fracture energy as an additional third independent input parameter in Rosenblueth’s analyses (N = 3). This is still difficult to achieve since not only a good estimation of the mean fracture energy is required, but also an assessment of its variability ( c o v ( G F ) ) is required.

6. Conclusions

A new assessment methodology based on strength reduction method, named SRAM, is presented in this paper. It is well suited for reliability assessment of existing critical large reinforced concrete structures. After validation using literature-based results, the method is applied to two hydraulic structure examples. The key conclusions are as follows:
-
Compared to sophisticated non-linear finite element analysis, the method is simpler, more robust and allows to compute conservative value of structural resistance, excluding any contribution in tension from concrete;
-
The methodology is well-suited for the assessment of existing large RC structures, particularly complex 3D hydraulic structures.
-
The methodology can be used to assess disturbed 3D regions, with important advantages over conventional Strut & Tie model: possibility to include loads other than mechanical loads and to consider the structural effects of pre-existing cracks.
-
While the focus of this paper is on large RC structures, SRAM's applicability extends to various types of RC structures and can be seamlessly integrated into future design and assessment codes.

Author Contributions

O.A.: Writing—original draft, Visualization, Software, Investigation; M.B.F.: Writing—review & editing, Validation, Supervision, Project administration, Methodology, Funding acquisition, Conceptualization. All authors have read and agreed to the published version of the manuscript.

Funding

This research received no external funding.

Institutional Review Board Statement

Not applicable.

Informed Consent Statement

Not applicable.

Data Availability Statement

The original contributions presented in the study are included in the article, further inquiries can be directed to the corresponding author.

Conflicts of Interest

Oumaima Abra was employed by the company IDAE s.e.n.c. The remaining author declares that the research was conducted in the absence of any commercial or financial relationships that could be construed as a potential conflict of interest.

References

  1. Couland, R. Concrete Planet: The Strange and Fascinating Story of the World's Most Common Man-Made Material; Prometheus Books; Rowman & Littlefield: Lanham, MD, USA, 2011; 396p. [Google Scholar]
  2. FIB Task Group 4.4. Practitioners’ Guide to Finite Element Modelling of Reinforced Concrete Structures, State-of-the-Art Report- Bulletin 45; FIB: Lausanne, Switzerland, 2008; pp. 1–337. [Google Scholar]
  3. Ftima, B.M.; Massicotte, B. Utilization of nonlinear finite elements for the design and assessment of large concrete structures: Part I: Calibration and validation, part II: Applications. ASCE J. Struct. Eng. 2015, 141, 04014218. [Google Scholar] [CrossRef]
  4. Antoniou, M.; Mantakas, A.; Nikitas, N.; Fuentes, R. A numerical case study on the long-term seismic assessment of reinforced concrete tunnels in corrosive environments. J. Rock Mech. Geotech. Eng. 2023, 15, 551–572. [Google Scholar] [CrossRef]
  5. Wang, G.; Shu, Y.; Lu, W.; Chen, M.; Pan, X.; Lu, A. Damage prediction of concrete gravity dams subjected to penetration explosion. Eng. Fail. Anal. 2023, 143, 106855. [Google Scholar] [CrossRef]
  6. Fu, Q.L.; Tan, L.; Long, B.; Kang, S.B. Numerical investigations of progressive collapse behaviour of multi-storey reinforced concrete frames. Buildings 2023, 13, 533. [Google Scholar] [CrossRef]
  7. Chauhan, A.; Desai, M.D.; Banerjee, S.; Sharma, U.K. 3D simulation of non-uniform corrosion induced damage in reinforced concrete exposed to real climate. Structures 2023, 56, 104852. [Google Scholar] [CrossRef]
  8. Thacker, B.H.; Doebling, S.W.; Hemez, F.M.; Anderson, M.C.; Pepin, J.E.; Rodriguez, E.A. Concepts of Model Verification and Validation; Report LA-14167-MS; Los Alamos National Laboratory: Los Alamos, NM, USA, 2004. [Google Scholar]
  9. Schlaich, J.; Schafer, K.; Jennewein, M. Toward a consistent design of structural concrete. J. Prestress. Concr. Inst. 1987, 32, 74–150. [Google Scholar] [CrossRef]
  10. Muttoni, A.; Schwartz, J.; Thürlimann, B. Design of Concrete Structures with Stress Fields; Birkhaüser Verlag: Basel, Switzerland, 1997. [Google Scholar]
  11. Bentz, D.P. A Review of Early-Age Properties of Cement-Based Materials. Cem. Concr. Res. 2008, 38, 196–204. [Google Scholar] [CrossRef]
  12. Pimentel, M.; Bruhwiler, E.; Figueiras, J. Safety examination of existing concrete structures using the global resistance safety factor concept. Eng. Struct. 2014, 70, 130–143. [Google Scholar] [CrossRef]
  13. Ben Ftima, M.; Massicotte, B. Development of a reliability framework for the use of advanced nonlinear finite elements in the design of concrete structures. ASCE J. Struct. Eng. 2012, 138, 1054–1064. [Google Scholar] [CrossRef]
  14. Lourenço, P.B.; Figueiras, J.A. Automatic design of reinforcement in concrete plates and shells. Eng. Comput. 1993, 10, 519–541. [Google Scholar] [CrossRef]
  15. Zienkiewicz, O.C.; Humpheson, C.; Lewis, R.W. Associated and non-associated visco- plasticity and plasticity in soil mechanics. Geotechnique 1975, 25, 671–689. [Google Scholar] [CrossRef]
  16. Abra, O.; Ftima, M.B. Development of a new design approach of reinforced concrete structures based on strength reduction method. Eng. Struct. 2020, 207, 110192. [Google Scholar] [CrossRef]
  17. Abra, O.; Ftima, M.B. Strength reduction design method for reinforced concrete structures: Generalization. Eng. Struct. 2022, 258, 114134. [Google Scholar] [CrossRef]
  18. Vecchio, F.J.; Collins, M.P. Modified compression field theory for reinforced concrete elements subjected to shear. ACI J. 1986, 83, 219–231. [Google Scholar]
  19. CSA A23.3; Design of Concrete Structures. Canadian Standards Association: Toronto, ON, Canada, 2016.
  20. Hibbitt, H.D.; Karlson, B.I.; Sorensen, E.P. ABAQUS, version 6.14; Finite Element Program; Hibbitt, Karlson and Sorensen: Providence, RI, USA, 2014. [Google Scholar]
  21. ACI Committee. ACI231 R-10 Report. In Report on Early-Age Cracking: Causes, Measurement, and Mitigation; ACI Committee: Farmington Hills, MI, USA, 2010; Volume 231. [Google Scholar]
  22. Ellingwood, B.R.; Galambos, T.V.; MacGregor, J.G.; Cornell, C.A. Development of a Probability-Based Load Criterion for American National Standard A58, National Bureau of Standards; Department of Commerce: Washington, DC, USA, 1980. [Google Scholar]
  23. Melchers, R.E. Structural Reliability Analysis and Prediction, 2nd ed.; John Wiley & Sons: Chichester, England, 2001. [Google Scholar]
  24. Červenka, V. Global Safety Format for Nonlinear Calculation of Reinforced Concrete. In Beton- und Stahlbetonbau 103, Special ed.; Ernst & Sohn: Berlin, Germany, 2008; pp. 37–42. [Google Scholar]
  25. Rosenblueth, E. Point estimates for probability moments. Proc. Nat. Acad. Sci. USA 1975, 72, 3812–3814. [Google Scholar] [CrossRef]
  26. Lubell, A.S. Shear in Wide Reinforced Concrete Members. Ph.D. Thesis, Department of Civil Engineering, University of Toronto, Toronto, ON, Canada, 2006. [Google Scholar]
  27. Kuzmanovic, S. An Investigation of the Shear Design of a Reinforced Concrete Box Structure. Master’s Thesis, Department of Civil Engineering, University of Toronto, Toronto, ON, Canada, 1998. [Google Scholar]
Figure 1. Example of a large RC structure: (a) Longitudinal cross section view of a hydroelectric powerhouse unit; (b) semi-spiral case and short-circuit load case; (c) draft tube; (d) results of ANFEA.
Applsci 14 01614 g001
Figure 2. Strength reduction analysis procedure [17]: (a) Application of loads and reduction of strength; (b) Explicit analysis: Kinetic energy and internal energy ratio.
Applsci 14 01614 g002
Figure 3. Strength reduction assessment methodology: (a) SRAM and original SRDM; (b) Schematic representation of assessment analyses in the principal loads space; (c) Reliability problem and global resistance factor; (d) Schematic representation of Rosenblueth’s assessment analyses in the principal loads space.
Applsci 14 01614 g003
Figure 4. Example 1: RC beam with pre-existing crack.
Applsci 14 01614 g004
Figure 5. Example 1: comparison of numerical and theoretical results.
Applsci 14 01614 g005
Figure 6. Example 2: RC beam AW1 from [26], falling in shear: (a) Geometry of the beam; (b) Compressive stresses at failure; (c) Damage pattern at failure; (d) Deformed shape at failure.
Applsci 14 01614 g006
Figure 7. Example 3: RC tunnel section tested by [27]: (a) Geometry and loading; (b) Compressive stresses at failure; (c) Damage pattern at failure.
Applsci 14 01614 g007
Figure 8. Spiral case: (a) Geometry; (b) Embedded reinforcement; (c) S&T original design model for the short-circuit load case.
Applsci 14 01614 g008
Figure 9. Spiral case: (a,b): original design concept (c,d): numerical results in terms of concrete compressive stresses at the end of strength reduction phase.
Applsci 14 01614 g009
Figure 10. Energy ratio (kinetic over internal) for: (a) spiral case example; (b) draft tube example.
Applsci 14 01614 g010
Figure 11. Results for spiral case example: (a) stresses in reinforcement before and after strength reduction; (b) β field before and after strength reduction; (c) yielding state of reinforcement at the end of strength reduction.
Applsci 14 01614 g011
Figure 12. Draft tube example: geometry, boundary conditions and loads.
Applsci 14 01614 g012
Figure 13. Draft tube example results: (a) Maximum concrete tensile strain field; (b) β field in a roof at ultimate load level and at failure; (c) Compressive stresses in a roof at ultimate load level and at failure.
Applsci 14 01614 g013
Figure 14. Draft tube force-displacement results for (a) Rosenblueth’s analyses; (b) analyses with mean material properties and comparison with previous works [3].
Applsci 14 01614 g014
Table 1. Material properties used in example 1.
Material Property Value
Compressive strength of concrete f c 30 MPa
Tensile strength of concrete f t 2.9 MPa
Young modulus of concreteEc26,600 MPa
Poisson coefficient of concretev0.18
Reinforcement ratioρ0.011
Reinforcement yield stressfy400 MPa
Reinforcement Young modulusEs200,000 MPa
Table 2. Material properties and results for examples 2 and 3.
Input DataExp ResultSRAMANFE [3]
Examplef′c
(MPa)
fy
(MPa)
COV
(f′c)
COV
(fy)
Vexp (kN)Rm = Vu (kN) R ~ + +
( k N )
R ~ +
( k N )
R ~
( k N )
R ~ +
( k N )
COV   ( R ~ ) VANFE
(kN)
COV   ( R ~ )
Beam AW1374650.20.095854244604603533530.135350.10
Tunnel Box454900.20.098057227987146636910.078850.05
Disclaimer/Publisher’s Note: The statements, opinions and data contained in all publications are solely those of the individual author(s) and contributor(s) and not of MDPI and/or the editor(s). MDPI and/or the editor(s) disclaim responsibility for any injury to people or property resulting from any ideas, methods, instructions or products referred to in the content.

