Abstract
Model robustness is an important index in medical cybersecurity, and hard-negative samples in electronic medical records can provide more gradient information, which can effectively improve the robustness of a model. However, hard negatives pose difficulties in terms of their definition and acquisition. To solve these problems, a data augmentation approach consisting of fusing SimBERT and a knowledge graph for application to a hard-negative sample is proposed in this paper. Firstly, we selected 40 misdiagnosed cases of diabetic complications as the original data for data augmentation. Secondly, we divided the contents of the electronic medical records into two parts. One part consisted of the core disease phrases in the misdiagnosed case records, which a medical specialist selected. These denoted the critical diseases that the model diagnosed as negative samples. Based on these core symptom words, new symptom phrases were directly generated using the SimBERT model. On the other hand, the noncore phrases of misdiagnosed medical records were highly similar to the positive samples. We determined the cosine similarity between the embedding vector of the knowledge graph entities and a vector made up of the noncore phrases. Then, we used Top-K sampling to generate text. Finally, combining the generated text from the two parts and the disturbed numerical indexes resulted in 160 enhancement samples. Our experiment shows that the distances between the samples generated using the SimKG-BERT model’s samples were closer to those of the positive samples and the anchor points in the space vector were closer than those created using the other models. This finding is more in line with how hard negatives are defined. In addition, compared with the model without data augmentation, the F1 values in the three data sets of diabetic complications increased by 6.4%, 2.24%, and 5.54%, respectively. The SimKG-BERT model achieves data augmentation in the absence of misdiagnosed medical records, providing more gradient information to the model, which not only improves the robustness of the model but also meets the realistic needs of assisted-diagnosis safety.
1. Introduction
Robustness describes a model’s ability to maintain safe operation when its inputs, parameters, and conditions change slightly. At present, deep learning algorithms are widely used in the aided diagnosis of diseases, and we must address the robustness of disease-aided diagnosis models based on deep learning. However, two kinds of errors, namely, misdiagnosis and missed diagnosis, inevitably occur in disease-aided diagnosis models. Misdiagnosis and missed diagnosis are critical factors affecting the security of an aided-diagnosis model []. Clinical diagnostic data do not have an even distribution of positive and negative samples. This means that the corresponding model applied will learn biased prior information, which will weaken the model []. It is challenging to obtain electronic medical records, and it is even more difficult to obtain misdiagnosed medical records in clinical practice. If it only takes other common diseases as negative samples and ignores medical record information on misdiagnosis, a model cannot thoroughly learn the characteristics of misdiagnosis, and the results it yields will not conform to the actual clinical situation.
From a model security perspective, it is very harmful to the results when a large portion of the training samples only consists of simple negative samples. Although it is simple to train a model on negative samples, it will only receive a limited amount of gradient information. Finally, it is not easy to distinguish between hard-negative samples and positive samples []. Clinical misdiagnosis medical records are similar to positive sample medical records. Compared with other common medical records used as negative samples, misdiagnosed medical records are more consistent with the definition of hard negatives. Therefore, whether to address the need to enhance the security of a model or the practical difficulties faced by the clinic, models must be trained to recognize high-quality misdiagnosis medical records as negative samples. In addition, applying machine learning techniques to extensively distributed data may lead to disclosing sensitive information about the data’s subjects []. Data often contain sensitive identifiable information, and even if this information is protected, over-processing techniques employed in machine learning can be used to identify individuals, thus raising privacy concerns. Data collection performed when machine learning techniques are applied to medically assisted diagnoses can similarly involve patient-related privacy issues, especially concerning the collection of negative samples such as misdiagnosed medical records, which involve more significant ethical challenges []. Many organizations must ensure that the personal data they collect for data analytics are sufficiently anonymous to reduce the associated compliance burden []. However, this will inevitably lead to insufficient sample sizes and increased data collection costs. Determining how to achieve data augmentation without sacrificing user privacy and choosing how to maximize the usability of published data is the ultimate goal of privacy-preserving data publishing []. Therefore, from the perspective of model training and data privacy protection, suitable data augmentation methods are needed, as they can improve the robustness of medical models and reduce the data collection cost.
Data augmentation aims at generating additional synthetic training data in data-deficient scenarios. Data augmentation methods include rule-based methods, learnable generation-based methods, etc., ensuring the augmented data’s validity. Thus, data augmentation methods must ensure that the augmented data are valid for a given task, i.e., that they are regarded as part of the same distribution as the original data (Raille et al., 2020) []. For example, the semantic similarity in machine translation and labels in text categorization are the same as those about the original data. Therefore, data augmentation for misdiagnosed medical records should first solve the problem of defining the hard negatives. The training data obtained from data augmentation should be able to meet the definition of hard negatives because 95% of simple negative samples are unnecessary and insufficient, and only 5% of hard negatives are necessary and sufficient for improving accuracy in a given task (Tang et al., 2022) []. Currently, tasks such as text recommendation, information retrieval, word embedding, and knowledge graphs in natural language processing use hard-negative sampling to improve the safety performance of models. Somaiyeh Dehghan et al. (2022) employed multiple hard negatives in text comparison learning to improve model performance. They differentiated between positive and hard-negative examples by comparing the similarities in different sentences []. Lee Xiong et al. (2021) proposed the ANCE training approach, which involves continuously recording an entire document library according to the current updated model during the training process and then selecting texts with high similarity levels to query, while avoiding the selection of positive samples as negative examples []. Wei Lan et al. (2022) designed an improved graph convolutional network to acquire the feature vectors for circRNA and diseases and reduce the influence of noisy samples. The cited authors selected negative samples based on the similarity of the graph representations of circRNA and achieved better prediction performance []. It can be seen that a hard negative is the closest negative sample to the anchor or positive sample, i.e., the most similar sample in the embedding space. When using data augmentation to improve model robustness based on misdiagnosed medical records, the spatial similarity distance of augmented data from anchor points and positive samples must be considered to provide more gradient information to the model.
However, there are three approaches for data augmentation: interpretation-based, noise-based, and sampling-based approaches. The last two methods cannot guarantee that the results are similar to the original samples or that the generated results differ from the original sample labels. Applying data augmentation to negative samples of medical electronic records ensures that the results are similar to the actual samples and belong to the same label. The interpretation-based approach generates additional training samples while maintaining the original label, but direct generation will affect the similarity between the misdiagnosis and positive samples. Therefore, we need a new data augmentation approach for misdiagnosing medical records that can retain the negative sample labels and correspond to the definition of hard negatives.
Specifically, our research objectives are as follows:
To determine how to perform data augmentation without a sufficient number of misdiagnosed medical records;
To determine how enhanced data can meet the requirements of a hard-negative sample and improve a model’s security performance.
A data augmentation approach for application to hard-negative samples consisting of fusing SimBERT, and a knowledge graph is proposed in this paper, and the contributions are as follows:
We performed SimBERT generation using the core conditions in the text of the electronic medical records and generated non-core conditions through Top-K sampling of the similarity with the knowledge graph entities, thereby not only preserving the negative sample labels of the key variables of the misdiagnosed cases identified by the generative model but also the high similarity level of the overall samples about the positive samples, in addition to incorporating diabetic complications into the generative task using knowledge-graph-related domain knowledge. Through spatial similarity comparisons, we determined that the data augmented using Simkg-BERT fit the definition of hard negatives better and yielded better results regarding model prediction concerning the three diabetic complications datasets, making the model safer.
2. Related Work
The current mainstream data augmentation methods are paraphrase based, mainly based on making appropriate changes to a sentence to generate enhanced data with few semantic differences from the original data. These enhanced data convey information very similar to the original form. Mainstream interpretation-based approaches include synonym replacement, semantic embedding, machine translation, model generation, and so on []. Synonym replacement consists of obtaining all replaceable words for each sentence and randomly replacing n phrases. The more similar a new word is to the original word, the more likely it is to be replaced [,]. This approach is very convenient, but the scope of the enhanced words is limited. Failure to properly replace a word will also affect the semantics of the corresponding sentence. Semantic embedding methods use pre-trained word embedding, such as Glove, Word2Vec, FastText, etc. [], thus overcoming the problems that dictionary-based methods have with replacement ranges and parts of speech. However, since the corresponding model does not consider context information, it is still prone to precipitating ambiguity after replacement. Also, with the development of machine translation models and the availability of online APIs, machine translation has become a popular augmentation method for many tasks. This method is easy to use and guarantees correct syntax and invariant semantics but is poorly controllable and has limited diversity due to the involvement of fixed machine translation models []. Due to their excellent performance, pre-trained language models have become the mainstream models for data augmentation tasks in recent years. Masked language models such as BERT and Roberta can predict the masked words in text based on the context [], which can then be used for text data expansion. This approach considers context semantics and alleviates ambiguity. However, the data augmentation process is still limited to the words. If there are too many replacement words, the semantics of sentences will also be affected. For electronic medical records, masking the critical features of negative samples may impact the original text labels. Therefore, in some approaches, the Seq2Seq model is used to generate text without masking words directly. Li et al. (2020) used a transformer as the basic structure []. They used masked original sentences and their label sequences to train the corresponding model, which reconstructed masked fragments into enhanced data. Liu et al. (2020) used a pre-trained model to provide prior information to the proposed transformer-based model to generate context-sensitive answerable and unanswerable questions []. As shown in Table 1, we compared the advantages and limitations of each data augmentation method.

Table 1.
Comparison of various data augmentation models.
SimBERT is a semantic similarity model based on BERT that can generate data by being trained using a large-scale corpus []. Microsoft transformed BERT into a model that can handle the task of natural language generation, namely, the UniLM model []. Using UniLM, we can complete text generation, which is the premise behind using SimBERT to generate text. Currently, the SimBERT model is widely used for text data augmentation tasks. Hanyu Zhao et al. (2021) use SimBERT to produce a synonymous sentence for those new questions after entity and relation replacement to guarantee question corpus diversity. They generate ten synonymous sentences for each new question using SimBERT and randomly select one from those sentences to be the final version of the question []. Zhenlin W et al. (2023) generated a few samples using the SimBERT model and mixed them with the original samples to obtain a distributed balanced dataset. Then, the mixed dataset is inputted into a deep-learning model to complete the emotion classification task. The experimental results show that this method has good classification performance []. The generated model has a broader application range and can directly enhance data without masking words. However, the similarity to the original training samples may be reduced when generating electronic medical records due to the need for more medical knowledge in pre-trained language models such as BERT. In addition, the generated model will include redundant words, increasing the ambiguity of the enhanced data. A pre-trained model can bring training data to downstream tasks but requires data augmentation approaches for specific tasks. A knowledge graph contains rich, structured knowledge, which can capture low-frequency entity information to solve the problem of the long tail effect naturally existing in natural languages. A knowledge graph forms a triad of entities, relationships, and attributes by extracting and storing large-scale medical knowledge in a knowledge base. It can solve the problems of knowledge dispersion, heterogeneity, redundancy, and fragmentation in big medical data and provide an effective way of integrating and organizing medical knowledge [].
3. Materials and Methods
This section describes the basic theoretical concepts of the two components of the SimKG BERT model (Sim BERT model, knowledge graph entity similarity calculation), and also describes the enhanced data processing and pseudo code of the algorithm in combination with the diabetes complication misdiagnosis medical record data enhancement task.
A generation model is used to generate additional training samples while maintaining the original label. Still, direct generation will affect the similarity between the misdiagnosed medical records and the positive samples. We required a hard-negative sample with both negative sample labels and high similarity with respect to the positive sample. We integrated the SimBERT model and a knowledge graph to enhance the data. The processing flow is shown in Figure 1. Firstly, we divided the electronic medical records into two parts. One part is the critical symptom phrase K in the misdiagnosed cases selected by specialists, constituting the key symptoms diagnosed as negative samples. These core symptom phrases K are directly used in the Sim BERT model to generate new symptom phrases. The other part constitutes the other noncore phrases X, which are highly similar to the positive samples. We compared their cosine similarity with the embedding vector E of knowledge graph entities and selected entities in the knowledge graph for generation through Top-K sampling. In this way, using the generation model, we could retain the negative sample labels of the critical variables of misdiagnosis cases and the high similarity between the overall sample and the positive samples. In addition, the knowledge graph also incorporates domain knowledge related to diabetes complications into the generation task.
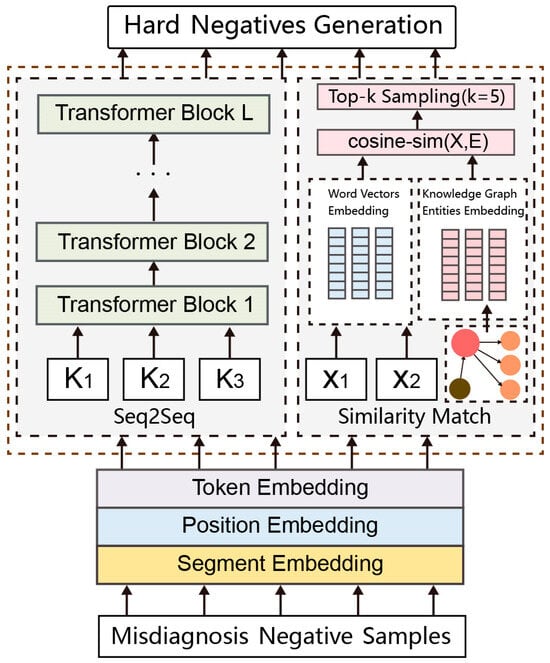
Figure 1.
SimKG-BERT model structure.
Take a case of the misdiagnosis of diabetes nephropathy as an example. The case history is “diffuse mesangial hyperplasia, diffuse mesangial immunoglobulin and complement deposition, accompanied by diabetes retinopathy, acute onset, sudden increase of urinary protein, high edema of the whole body, severe concave edema of both lower limbs, massive proteinuria, pleural effusion, elevated blood pressure, 24 h urine protein quantification: 9.8 g, diabetes duration: 12 years, serum creatinine elevation, fasting blood glucose: 8.2 mmol/L”. Among these symptoms, “diffuse mesangial hyperplasia, diffuse mesangial immunoglobulin and complement deposition, acute onset, and sudden increase of urinary protein” are the keys to the diagnosis of non-diabetes nephropathy. They are the core disease phrase K, which will be directly used in the Sim BERT model to generate new disease phrases. Other non-core disease phrases are generated through entities in the knowledge graph.
3.1. SimBERT Model
Data augmentation can address the bottleneck of unbalanced training samples by enriching existing data sets with additional synthetic data, thus improving a model’s performance. There are many approaches to data augmentation. One of the critical data augmentation approaches is using the superior language generation ability of pre-trained language models such as BERT to generate synthetic data and fine-tuning language models to generate new samples by using labels and a few initial words as model prompts. SimBERT is a semantic similarity model based on BERT that can generate data by learning a large-scale corpus. It can calculate the similarity score between two sentences. The higher the score, the more similar the semantics of the two sentences. We can use the SimBERT model to generate samples with similar but slightly different semantics.
A schematic diagram of the SimBERT model is shown in Figure 2, which is divided into two parts. The right part depicts the construction of the Seq2Seq task, as shown in Figure 2b, which can predict the corresponding similar text through the input text and concatenate the input text and the corresponding similar text through an SEP (a separator). For example, if Sentences 1 and 2 exist, the model converts input data into CLS_ Sentence 1_ SEP_ Sentence 2_ SEP and then predicts Sentence 2 according to Sentence 1. The left part depicts the construction of the semantic similarity task, as shown in Figure 2a; this task can calculate similarity according to the CLS vector corresponding to the text. The essence of the semantic similarity part is to select the dissimilar samples in this training batch as negative samples to attain a sentence vector matrix (where b is batch_size and d is hidden_size), perform normalization on the d dimension to attain the similarity matrix , and then calculate the inner product of two pairs to attain the similarity matrix , covering the diagonal part. Finally, each line uses the softmax function to increase the similarity of similar samples and reduce the similarity of other items so that the model can thoroughly learn the similarity between sentences. The six pieces of data are shown in Figure 2b; the first sample Sentence 1 is similar to Sentence 2, and the others are not similar. If this information was hidden, we obtained data such as Mask_ 1_ 0_ 0_ 0_ 0. SimBERT uses this training approach to complete similar text generation tasks. The pre-trained model Chinese_SimBert, which is more suitable for Chinese tasks, was used in this study.
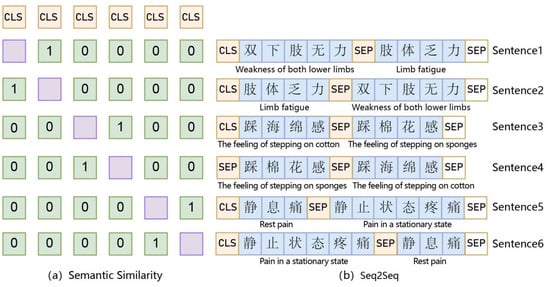
Figure 2.
SimBERT Model.
3.2. Knowledge Graph Entity Embedding and Similarity Calculation
DiaKG is currently the most comprehensive and high-quality Chinese data set of diabetes knowledge graphs. It was derived from diabetes guidelines and consensuses in 41 Chinese authoritative journals and contains the most extensive research content and popular research areas in recent years, such as clinical research, drug use, clinical cases, diagnosis, and treatment approaches, including 22,050 entities and 6890 relationships [] (https://tianchi.aliyun.com/dataset/datadetail?dataId=88836, accessed on 17 February 2024).
In addition, we obtained a diabetes complication knowledge graph (DCKG) through the named entity recognition and relationship extraction of the electronic medical records. This included many patients’ self-checking symptom entities. As shown in Figure 3.
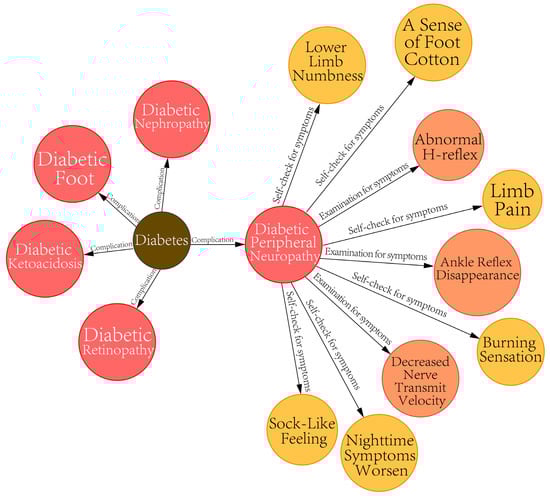
Figure 3.
Diabetic complications knowledge graph (DCKG).
The symptom entities in the knowledge graph were all extracted from clinical electronic medical records and the literature and are highly similar to the positive samples. All entities of DiaKG and DCKG were subjected to vectorized embedding to obtain vector E, and other noncore symptoms were subjected to word embedding to obtain vector X. Embedding vectorization of all symptomatic entities was performed before cosine similarity comparisons were made. After the cosine similarity between vectors X and E is calculated, sampling with replacement can ensure high similarity levels between the final enhanced data and the positive samples. However, the number of knowledge graph entities is enormous, and the distribution of similarity probabilities is relatively centralized. As shown in Figure 4, the symptom entity “bilateral lower extremity numbness” in diabetes complications can be found in the top nine symptom entities in the knowledge graph according to the cosine similarity, and the high similarity probability is mainly distributed in the first five symptoms.
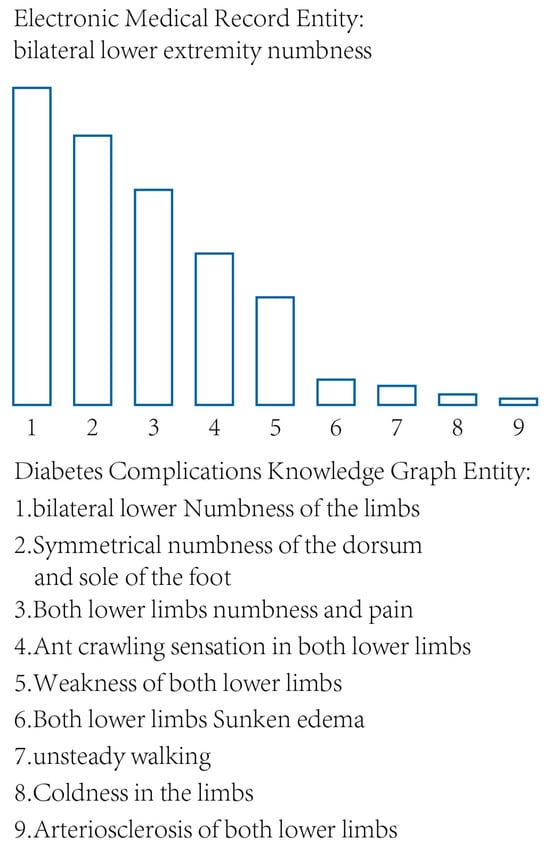
Figure 4.
A comparison of symptom entity similarity.
3.3. Top-K Sampling
Language generation is based on the assumption that the probability distribution of an entire sequence can be decomposed into the product of the conditional distribution of the next word:
where is the initial context sequence, and T is the length of the generated sequence.
The original greedy search method simply selects the word with the highest probability as its next word; this approach is simple and efficient but may result in the generated text being too monotonous and repetitive. Whereas random sampling, i.e., selecting a word randomly according to a probability distribution, can increase the diversity of generation but may lead to incoherent and meaningless generated text.
So, we conducted Top-K (K = 5) sampling for the similarity probability to reduce the sampling space. Here, the five words with the highest likelihood are retained to form a set, and then a word from this set is randomly selected as the final output based on the probability of the remaining words. Random sampling helps to improve the quality of generation. It allows the entities with the highest likelihood in the knowledge graph to be selected and ensures the diversity of the generated results. A probability distribution can be obtained from the t value of the model generation sequence . The sampling space is , and the final probability distribution for Top-K sampling can be expressed as follows:
3.4. Generation Data Processing
The data generated using SimBERT are prone to incorporating redundant and interrogative words, for example, “Reduced amplitude of conduction waves conduction waves in the ulnar nerve” and “How to treat limb movement disorders”. We need to process the data. Interrogative words such as “what”, “how”, “which”, and “What’s going on?” are filtered out by the algorithm, and then the redundant words are manually processed. In addition, there are some indicators such as diabetes duration (1 year) and random blood glucose (mmol/L: 11.7) in the diabetes complication data set. We made a medical-logic-related fine adjustment, such as for diabetes duration (2 years) and random blood glucose levels (mmol/L: 11.8), and removed the negative samples with medical logic errors as determined by the specialists.
We selected ten negative samples from each of the four types of negative samples of diabetes complications as the original samples in the input generation model, which generated 40 enhancement samples from each class. A total of 160 enhancement samples (diabetic peripheral neuropathy: 40, diabetic nephropathy: 40, diabetic feet: 40, and diabetic ketoacidosis: 40) were generated using the generation model, SimKG-BERT.
3.5. Algorithm Description
According to the model we proposed in the previous section, the SimKG-BERT algorithm was adapted in the manner shown in Algorithm 1:
| Algorithm 1. Simkg-BERT |
| Input: data set of diabetes complications misdiagnosis cases M1, M2, M3, M4 Output: new misdiagnosis cases data M1′, M2′, M3′, M4′ |
| # Data preprocessing 1 Divide the misdiagnosis record M of diabetes complications into key symptoms K and Non-critical symptoms X 2 The key symptom K becomes a vector through word embedding 3 Non-critical disease phrases X become vectors through word embeddings 4 Entity symptom set E of the knowledge graph of diabetes complications gets vector representation 5 through word embedding(n is the maximum number of embedded words) 6 Top5E # Seq2Seq 7 Function SimBERT 8 For 9 modeltr(trD1) 10 End for 11 End function 12 Generation of new symptomatic entities # Similarity Match 13 Function cosine-sim(X,E) 14 For all cosine-sim(X,E) in Distance Calculation do 15 If Calculate the 5 most similar ones then 16 17 End If 18 End for 19 End function 20 Obtain the five most similar knowledge graph entities 21 Function Top-K 22 For 23 modeltr(trD2) 24 End for 25 End function 26 Generation of new symptomatic entities X′ |
4. Results
This section focuses on experiments to verify the effectiveness of the SimKG-BERT model for the data enhancement of diabetic complication misdiagnosis medical records. Firstly, spatial similarity comparison experiments are conducted to confirm whether the SimKG-BERT enhanced data aligns more with the definition of hard negatives. Secondly, comparison experiments are conducted to verify whether the prediction effect of diabetic complications is improved after adding enhanced data to the training set.
4.1. Dataset Information
In this study, we conducted comparative experiments using four diabetic complications datasets (concerning diabetic peripheral neuropathy, diabetic nephropathy, diabetic foot, and diabetic ketoacidosis) to validate the effectiveness of the model employed. A total of 2678 valid samples were obtained, including 1478 positive samples and 1200 negative samples. The specific distribution of positive and negative samples for each dataset is shown in Table 2. We signed an agreement with the data provider in which it was stipulated that these data would only be used for research needs, and data desensitization was carried out, so there is no risk of personal information being leaked. Our study meets the ethical requirements. Table 2 shows the number of samples after data enhancement, in which the samples of common diseases are mainly in electronic medical records as hypertension, coronary heart disease, bronchitis, and thyroid disease, and the number of misdiagnosed medical records in each of the four datasets that did not undergo data enhancement is 10. The number of negative samples of common diseases is 230, and the number of positive samples remains unchanged.
Table 2.
Dataset information.
4.2. Experimental Setup
The sample size used in this study was small. In addition, there was no BatchNorm layer in the model, so the training batch size was set to 8: the size ratio of the training set to the test set was 7:3, the number of iterations was 50, and the word vector dimension was 768, so the test size was set to 0.3. The random state was 42, which is the default value, and the cross-entropy loss function was used.
4.3. Model Construction and Evaluation
Four indexes were used in this study, namely, Precision (P), Recall (R), F1 score, and AUC value, to evaluate the model’s effects. The formulas for P, R, and F1 are shown below:
A simple cross-validation approach was used in the model. Firstly, we randomly divided the electronic medical records into a training set and a test set with a ratio of 7:3 (with the training set constituting 70% and the test set constituting 30%). The training set was used to train the model, and the model and its parameters were verified in reference to the test set. Then, we shuffled the samples, re-divided the training and test sets in the same proportions, and continued to train and test the model. We only sampled the negative samples in the training set. All other training approaches and their steps are consistent with the above simple cross-validation approaches. All model parameters are consistent with the settings in Table 3.
Table 3.
Model parameter settings.
4.4. Spatial Similarity Comparison Experiment
Firstly, we determined the anchor sample A in each data set according to the typical symptoms of diabetic complications and then calculated the similarity distance between positive samples, samples enhanced with Simkg-BERT, and samples enhanced with SimBERT and anchor sample A using the SBERT algorithm.
t-SNE (t-distributed stochastic neighbor embedding) is the most mainstream and cutting-edge dimensionality reduction algorithm, for which the main goal is to project known high-dimensional data into a low-dimensional space. In this study, we projected the EHRs in the high-dimensional vector space to the two-dimensional coordinate space so that the position of each EHR in the space with respect to the anchor point was more clearly presented. We compared each of the 40 EHR samples generated using Simkg-BERT and SimBERT in the vector space, with the dark-blue points being positive samples, the red points being the Simkg-BERT-generated chart samples, and the yellow points being the SimBERT-generated chart samples. The two-dimensional position of each sample with respect to the anchor point for each of the four diabetes complications is shown in Figure 5. It can be seen that the red points are closer to the dark-blue points of the positive samples, while the yellow points are further away from the dark-blue points.
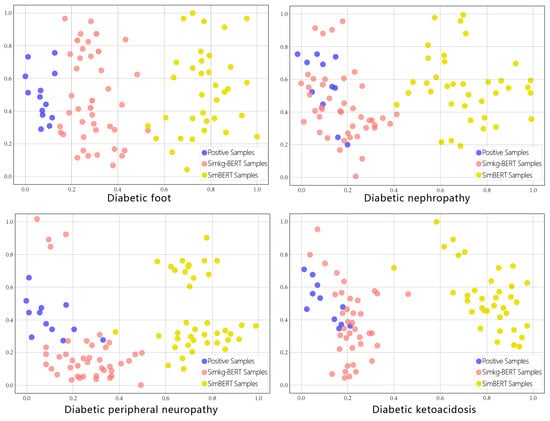
Figure 5.
Similarity distance of each sample of diabetic complications.
As reported by previous researchers, hard negatives are the closest negative samples to the anchor point or positive samples, i.e., the most similar samples in the embedding space. We calculated the average Euclidean distance from each type of sample to the anchor point, as shown in Table 4. We can see that the negative samples generated using the SimKG-BERT model are closer to the positive samples and the anchor point in the space vector compared to those generated with Sim-BERT; they are also more in line with the definition of a hard negative and able to provide more gradient information to the model during training. So, we deemed it appropriate to choose the SimKG-BERT model for the data augmentation of the misdiagnosis medical records.
Table 4.
The average Euclidean distance between samples and anchor points.
4.5. Comparative Experiment Regarding the Prediction Models
We input the negative samples generated using Simkg-BERT into the model for training and compared the results with those for the model without data augmentation (the training set only contained the first 10 original and other common negative samples). The test sets for the two models were the same, and they contained many negative samples of misdiagnosed medical records. These conditions are not only fair for the comparison of models but also conform to clinical reality.
After data augmentation via the Simkg-BERT model, the ability of the prediction model to identify misdiagnosed medical records improved. Compared with the model for which data augmentation was not applied, the F1-score increased 0.61%, 6.4%, 2.24%, and 5.54% for the four data sets, as shown in Table 5. Also, in comparison to the simBERT data augmentation model, the model proposed in this paper obtained better experimental results. Without a sufficient number of misdiagnosed medical records, the Simkg-BERT data augmentation approach yielded good results, mitigating the data bias to a certain extent and enhancing the robustness of the model.
Table 5.
Comparative experiment regarding the data augmentation model.
4.6. Comparative Experiment of Decision Curve Analysis
At present, decision curve analysis (DCA) is widely used to measure clinical practicability []. In this approach, the theoretical relationship between the threshold probability of a disease and a false positive and a false negative is used to determine the value of a prediction model. Then, this theoretical relationship is used to derive the net income of the model under different threshold probabilities.
We compared Simkg-BERT data augmentation and non-data augmentation models and constructed clinical decision curves for four diabetes complication data sets, as shown in Figure 6. Assuming that we choose to diagnose diabetes complications with a prediction probability of 80% and treat them, we can obtain higher net benefits from the SimKG-BERT data augmentation model than the non-data augmentation model for the four data sets. Taking diabetic ketoacidosis as an example, if the data augmentation model is used in the auxiliary diagnosis, 35 out of every 100 patients can benefit from it without harming the interests of any other person; only 26 out of every 100 patients can benefit from the model without data augmentation. It can be seen that the model gained additional medical security properties by augmenting the data with misdiagnosed medical records.
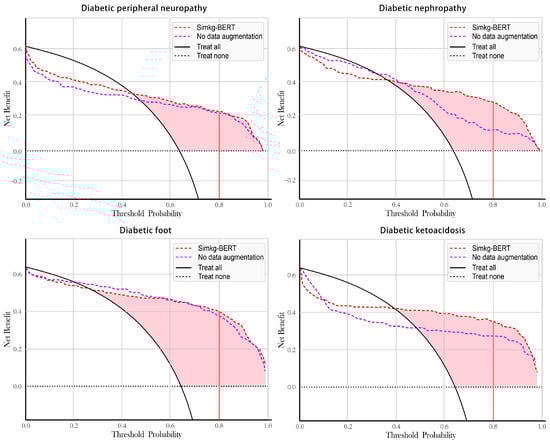
Figure 6.
Decision curve analysis for each dataset.
5. Discussion
By comparing the spatial similarities, we found that the data enhanced by Simkg-BERT are closer to the positive samples in terms of spatial similarity and more in line with the definition of a hard negative. The results of the comparison experiments show that the present model yielded good prediction results for all three diabetic complication datasets, realized data enhancement in the absence of misdiagnosed medical records, and provided more gradient information to the model, thus not only improving the robustness of the model but also meeting the realistic needs of auxiliary diagnostic safety.
6. Conclusions and Prospects
To address the difficulty of obtaining misdiagnosed medical records, a data augmentation approach based on hard-negative samples consisting of fusing SimBERT and a knowledge graph is proposed in this paper. Firstly, we selected 40 misdiagnosed cases of diabetic complications as the original data before data augmentation. Secondly, we divided the contents of electronic medical records into two parts. The key symptoms identified by the model as negative samples formed one part of the core symptom phrases of incorrectly diagnosed cases chosen by specialists. The SimBERT model directly transformed these core symptom phrases into new symptom phrases. Other noncore phrases were very similar to the positive samples. To find texts, we used Top-K sampling and compared their cosine similarities with the embedding vector of the knowledge graph entities. Finally, 160 enhancement samples were obtained by combining the generated texts of the two parts and the disturbed numerical indexes.
However, this paper still suffers from some shortcomings: First, the model’s enhancement effect on the diabetic peripheral neuropathy dataset was not noticeable, indicating that the data augmentation for misdiagnosed medical records for this dataset did not obtain enough training features. Second, data augmentation could not wholly replace the richness of the original misdiagnosed medical records, and the training information provided to the model still needed to be improved. Third, some complications of diabetes require image features for diagnosis. At the same time, this work does not involve multimodal features, so determining how to combine images for data augmentation is a worthwhile research direction. In the future direction of our work, firstly, we should increase the richness of the original data as much as possible so that the augmented data has more training information. Secondly, we can utilize methods such as adversarial training to perturb the positive samples to increase the feature information of the negative samples; thirdly, we can give the features of the hard negatives more weight through the innovation of the loss function, and lastly, we can construct the training features for the multimodal joint embedding a neural network model. These are the focuses of our future work’s direction.
Author Contributions
Conceptualization, S.L. and X.Y.; methodology, S.L.; software, S.L.; validation, S.L., X.Y. and P.C.; formal analysis, X.Y.; investigation, X.Y.; resources, X.Y.; data curation, S.L.; writing—original draft preparation, S.L.; writing—review and editing, X.Y.; visualization, X.Y.; supervision, P.C.; project administration, P.C.; funding acquisition, P.C. All authors have read and agreed to the published version of the manuscript.
Funding
This research was funded by The National Key Research and Development Program of China (Grant No. 2016YFC0802500).
Institutional Review Board Statement
Not applicable.
Informed Consent Statement
Not applicable.
Data Availability Statement
The data are openly available at https://tianchi.aliyun.com/dataset/datadetail?dataId=88836, accessed on 17 February 2024.
Conflicts of Interest
The authors declare no conflicts of interest.
References
- Guo, X.T.; Zhang, X.F.; Liu, X.X.; Doug, V. Research on data driven electronic health service management. J. Manag. Sci. 2017, 30, 3–14. [Google Scholar]
- Xu, M.; Shen, J.; Yu, H.Y. A Review on Data driven Healthcare Decision making Support. J. Ind. Eng. Manag. 2017, 22, 1–13. [Google Scholar]
- Li, X.Y.; Sun, X.F.; Meng, Y.X.; Liang, J.J.; Wu, F.; Li, J.W. Dice Loss for Data-imbalanced NLP Tasks. In Proceedings of the 58th Annual Meeting of the Association for Computational Linguistics, Seattle, Washington, DC, USA, 5–10 July 2020; Association for Computational Linguistics: Stroudsburg, PA, USA, 2020; pp. 465–476. [Google Scholar]
- Caruccio, L.; Desiato, D.; Polese, G.; Tortora, G.; Zannone, N. A decision-support framework for data anonymization with application to machine learning processes. Inf. Sci. 2022, 613, 1–32. [Google Scholar] [CrossRef]
- Riva, G.M.; Vasenev, A.; Zannone, N. SoK: Engineering privacy-aware high-tech systems. In Proceedings of the 15th International Conference on Availability, Reliability and Security, Allgäu, Germany, 25–28 August 2020; pp. 1–10. [Google Scholar]
- Caruccio, L.; Desiato, D.; Polese, G.; Tortora, G. GDPR compliant information confidentiality preservation in big data processing. IEEE Access 2020, 8, 205034–205050. [Google Scholar] [CrossRef]
- Yan, Y.; Herman, E.A.; Mahmood, A.; Feng, T.; Xie, P. A weighted k-member clustering algorithm for k-anonymization. Computing 2021, 103, 2251–2273. [Google Scholar] [CrossRef]
- Raille, G.; Djambazovska, S.; Musat, C. Fast cross domain data authorization through natural sentence editing. arXiv 2020, arXiv:2003.10254. [Google Scholar]
- Tang, Y.; Cheng, H.; Fang, Y.; Pan, Y. In-Batch Negatives’ Enhanced Self-Supervised Learning. In Proceedings of the 2022 IEEE 34th International Conference on Tools with Artificial Intelligence (ICTAI), Virtual Event, 31 October–2 November 2022; IEEE: Piscataway, NJ, USA, 2022; pp. 161–166. [Google Scholar]
- Dehghan, S.; Amasyali, M.F. SupMPN: Supervised Multiple Positives and Negative Negative Learning Model for Semantic Texture Similarity. J. Appl. Sci. 2022, 12, 9659. [Google Scholar] [CrossRef]
- Xiong, L.; Xiong, C.; Li, Y. Approximate nearest neighbor negative contrastive learning for dense text retrieval. arXiv 2020, arXiv:2007.00808. [Google Scholar]
- Lan, W.; Dong, Y.; Chen, Q.; Liu, J.; Wang, J.; Chen, Y.P.P.; Pan, S. IGNSCDA: Predicting CircRNA-disease associations based on improved graph convolutional network and negative sampling. IEEE/ACM Trans. Comput. Biol. Bioinform. 2021, 19, 3530–3538. [Google Scholar] [CrossRef] [PubMed]
- Li, B.; Hou, Y.; Che, W. Data authorization approaches in natural language processing: A survey. J. AI Open 2022, 3, 71–90. [Google Scholar] [CrossRef]
- Mueller, J.; Thyagarajan, A. Siamese recent architectures for learning sentence similarity. In Proceedings of the Thirtieth AAAI Conference on Artificial Intelligence, Phoenix, AZ, USA, 12–17 February 2016; Volume 30. [Google Scholar]
- Wei, J.; Zou, K. Eda: Easy data authentication techniques for boosting performance on text classification tasks. arXiv 2019, arXiv:1901.11196. [Google Scholar]
- Mengzhou, X.; Xiang, K.; Anastasopoulos, A.; Neubig, G. Generalized Data Augmentation for Low-Resource Translation. In Proceedings of the 57th Annual Meeting of the Association for Computational Linguistics, Florence, Italy, 28 July–2 August 2019; Association for Computational Linguistics: Stroudsburg, PA, USA, 2019; pp. 5786–5796. [Google Scholar]
- Jiao, X.Q.; Yin, Y.C.; Shang, L.F.; Jiang, X.; Chen, X.; Li, L.; Wang, F.; Liu, Q. TinyBERT: Distilling BERT for Natural Language Understanding. In Findings of the Association for Computational Linguistics: EMNLP 2020; Association for Computational Linguistics: Stroudsburg, PA, USA, 2020; pp. 4163–4174. [Google Scholar]
- Li, K.; Chen, C.; Quan, X.; Ling, Q.; Song, Y. Conditional Augmentation for Aspect Term Extraction via Masked Sequence-to-Sequence Generation. In Proceedings of the 58th Annual Meeting of the Association for Computational Linguistics, Seattle, WA, USA, 5–10 July 2020; Association for Computational Linguistics: Stroudsburg, PA, USA, 2020; pp. 7056–7066. [Google Scholar]
- Liu, D.; Gong, Y.; Fu, J.; Yan, Y.; Chen, J.; Lv, J.; Duan, N.; Zhou, M. Tell Me How to Ask Again: Question Data Augmentation with Controllable Rewriting in Continuous Space. In Proceedings of the 2020 Conference on Empirical Methods in Natural Language Processing (EMNLP), Virtually, 16–20 November 2020; Association for Computational Linguistics: Stroudsburg, PA, USA, 2020; pp. 5798–5810. [Google Scholar]
- Wang, H.; Fan, J. A FastText Classification Model Based on Simbert Data Augmentation. World Sci. Res. J. 2023, 9, 30–41. [Google Scholar]
- Dong, L.; Yang, N.; Wang, W.; Wei, F.; Liu, X.; Wang, Y.; Gao, J.; Zhou, M.; Hon, H.-W. Unified language model pre training for natural language understanding and generation. arXiv 2019, arXiv:1905.03197. [Google Scholar]
- Zhao, H.; Yuan, S.; Leng, J.; Pan, X.; Xue, Z.; Ma, Q.; Liang, Y. A Chinese Machine Reading Comprehension Dataset Automatic Generated Based on Knowledge Graph. In Proceedings of the 20th China National Conference on Chinese Computational Linguistics, Hohhot, China, 13–15 August 2021; Springer International Publishing: Cham, Switzerland, 2021; pp. 268–279. [Google Scholar]
- Wei, Z.; Wang, C.; Yang, X.; Zhao, W. Imbalanced sentiment classification of online reviews based on SimBERT. J. Intell. Fuzzy Syst. 2023, 45, 8015–8025. [Google Scholar]
- Zhang, K.; Zhao, X.; Zhang, L.; Xie, Q.; Zan, H. Knowledge Enabled Diagnosis Assistant Based on Observetic EMRs and Knowledge Graph. In Proceedings of the China National Conference on Chinese Computational Linguistics, Hainan, China, 30 October–1 November; Springer: Cham, Switzerland, 2020; pp. 444–457. [Google Scholar]
- Chang, D.; Chen, M.; Liu, C.; Liu, L.; Li, D.; Li, W.; Kong, F.; Liu, B.; Luo, X.; Qi, J.; et al. Diakg: An annotated diamonds dataset for medical knowledge graph construction. In Knowledge Graph and Semantic Computing: Knowledge Graph Empowers New Infrastructure Construction, Proceedings of the 6th China Conference, CCKS 2021, Guangzhou, China, 4–7 November 2021; Springer: Singapore, 2021; pp. 308–314. [Google Scholar]
- Vickers, A.J.; Elkin, E.B. Decision curve analysis: A new approach for evaluating prediction models. Med. Decis. Mak. 2006, 26, 565–574. [Google Scholar] [CrossRef] [PubMed]
Disclaimer/Publisher’s Note: The statements, opinions and data contained in all publications are solely those of the individual author(s) and contributor(s) and not of MDPI and/or the editor(s). MDPI and/or the editor(s) disclaim responsibility for any injury to people or property resulting from any ideas, methods, instructions or products referred to in the content. |
© 2024 by the authors. Licensee MDPI, Basel, Switzerland. This article is an open access article distributed under the terms and conditions of the Creative Commons Attribution (CC BY) license (https://creativecommons.org/licenses/by/4.0/).