
PLA-Sago Starch Implants: The Optimization of Injection Molding Parameter and Plasticizer Material Compositions
 , , ,
, , ,  , and
, and
Abstract
:1. Introduction
2. Material and Methodology
2.1. Materials
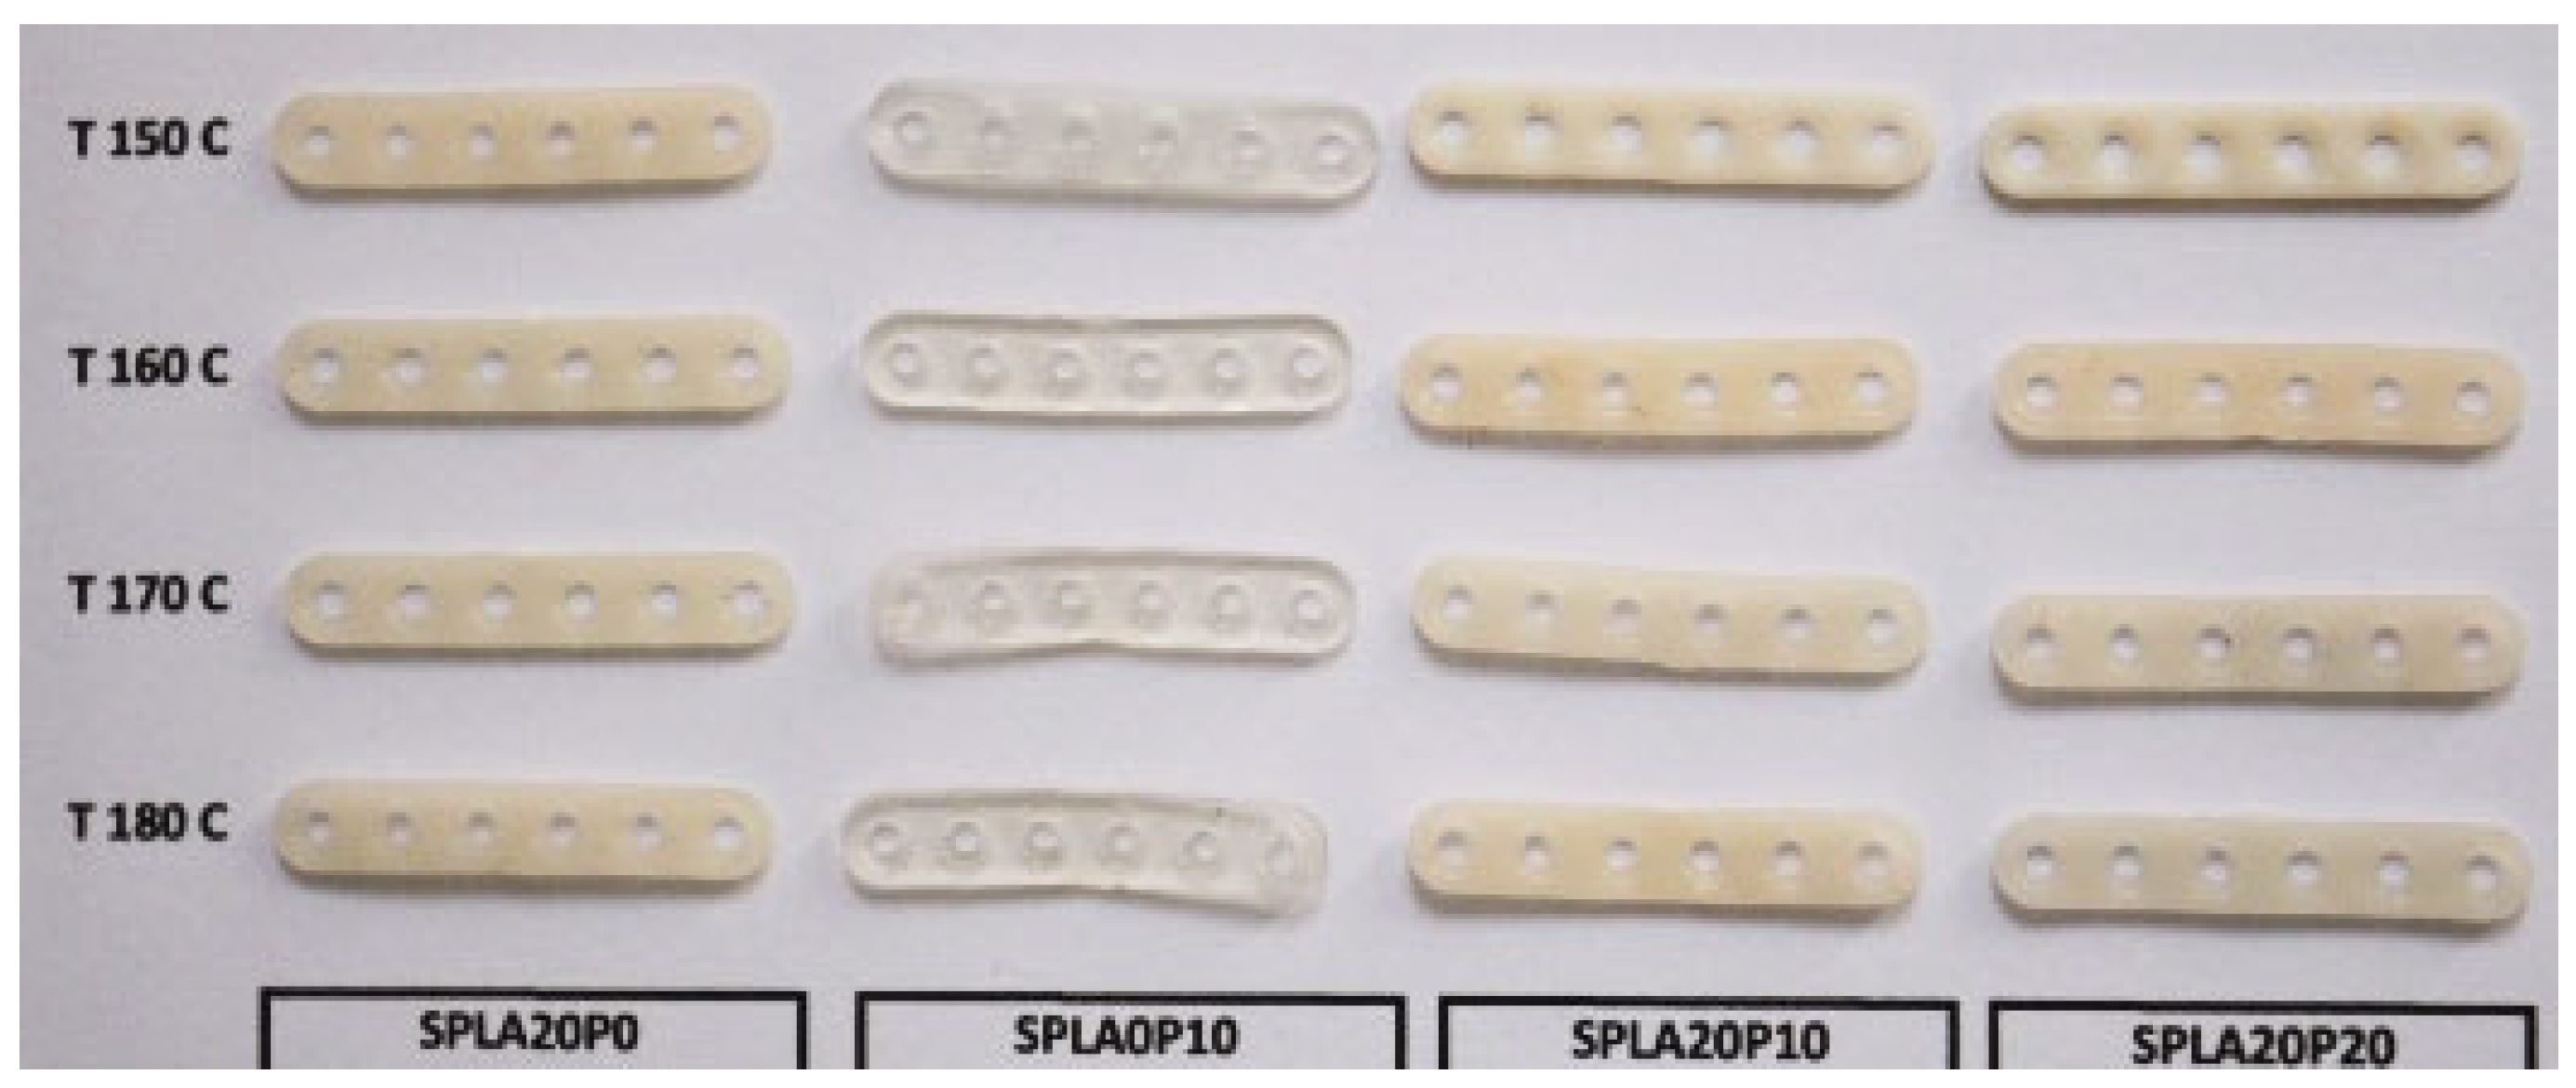
2.2. Miniplate Samples Preparation
2.3. Mechanical Properties Testing
2.4. Biodegradation Test
2.5. Scanning Electron Microscope (SEM)
2.6. Fourier Transform Infra Red (FT-IR) Spectroscopy
2.7. X-ray Diffraction (XRD)
2.8. Statistical Analysis
3. Results
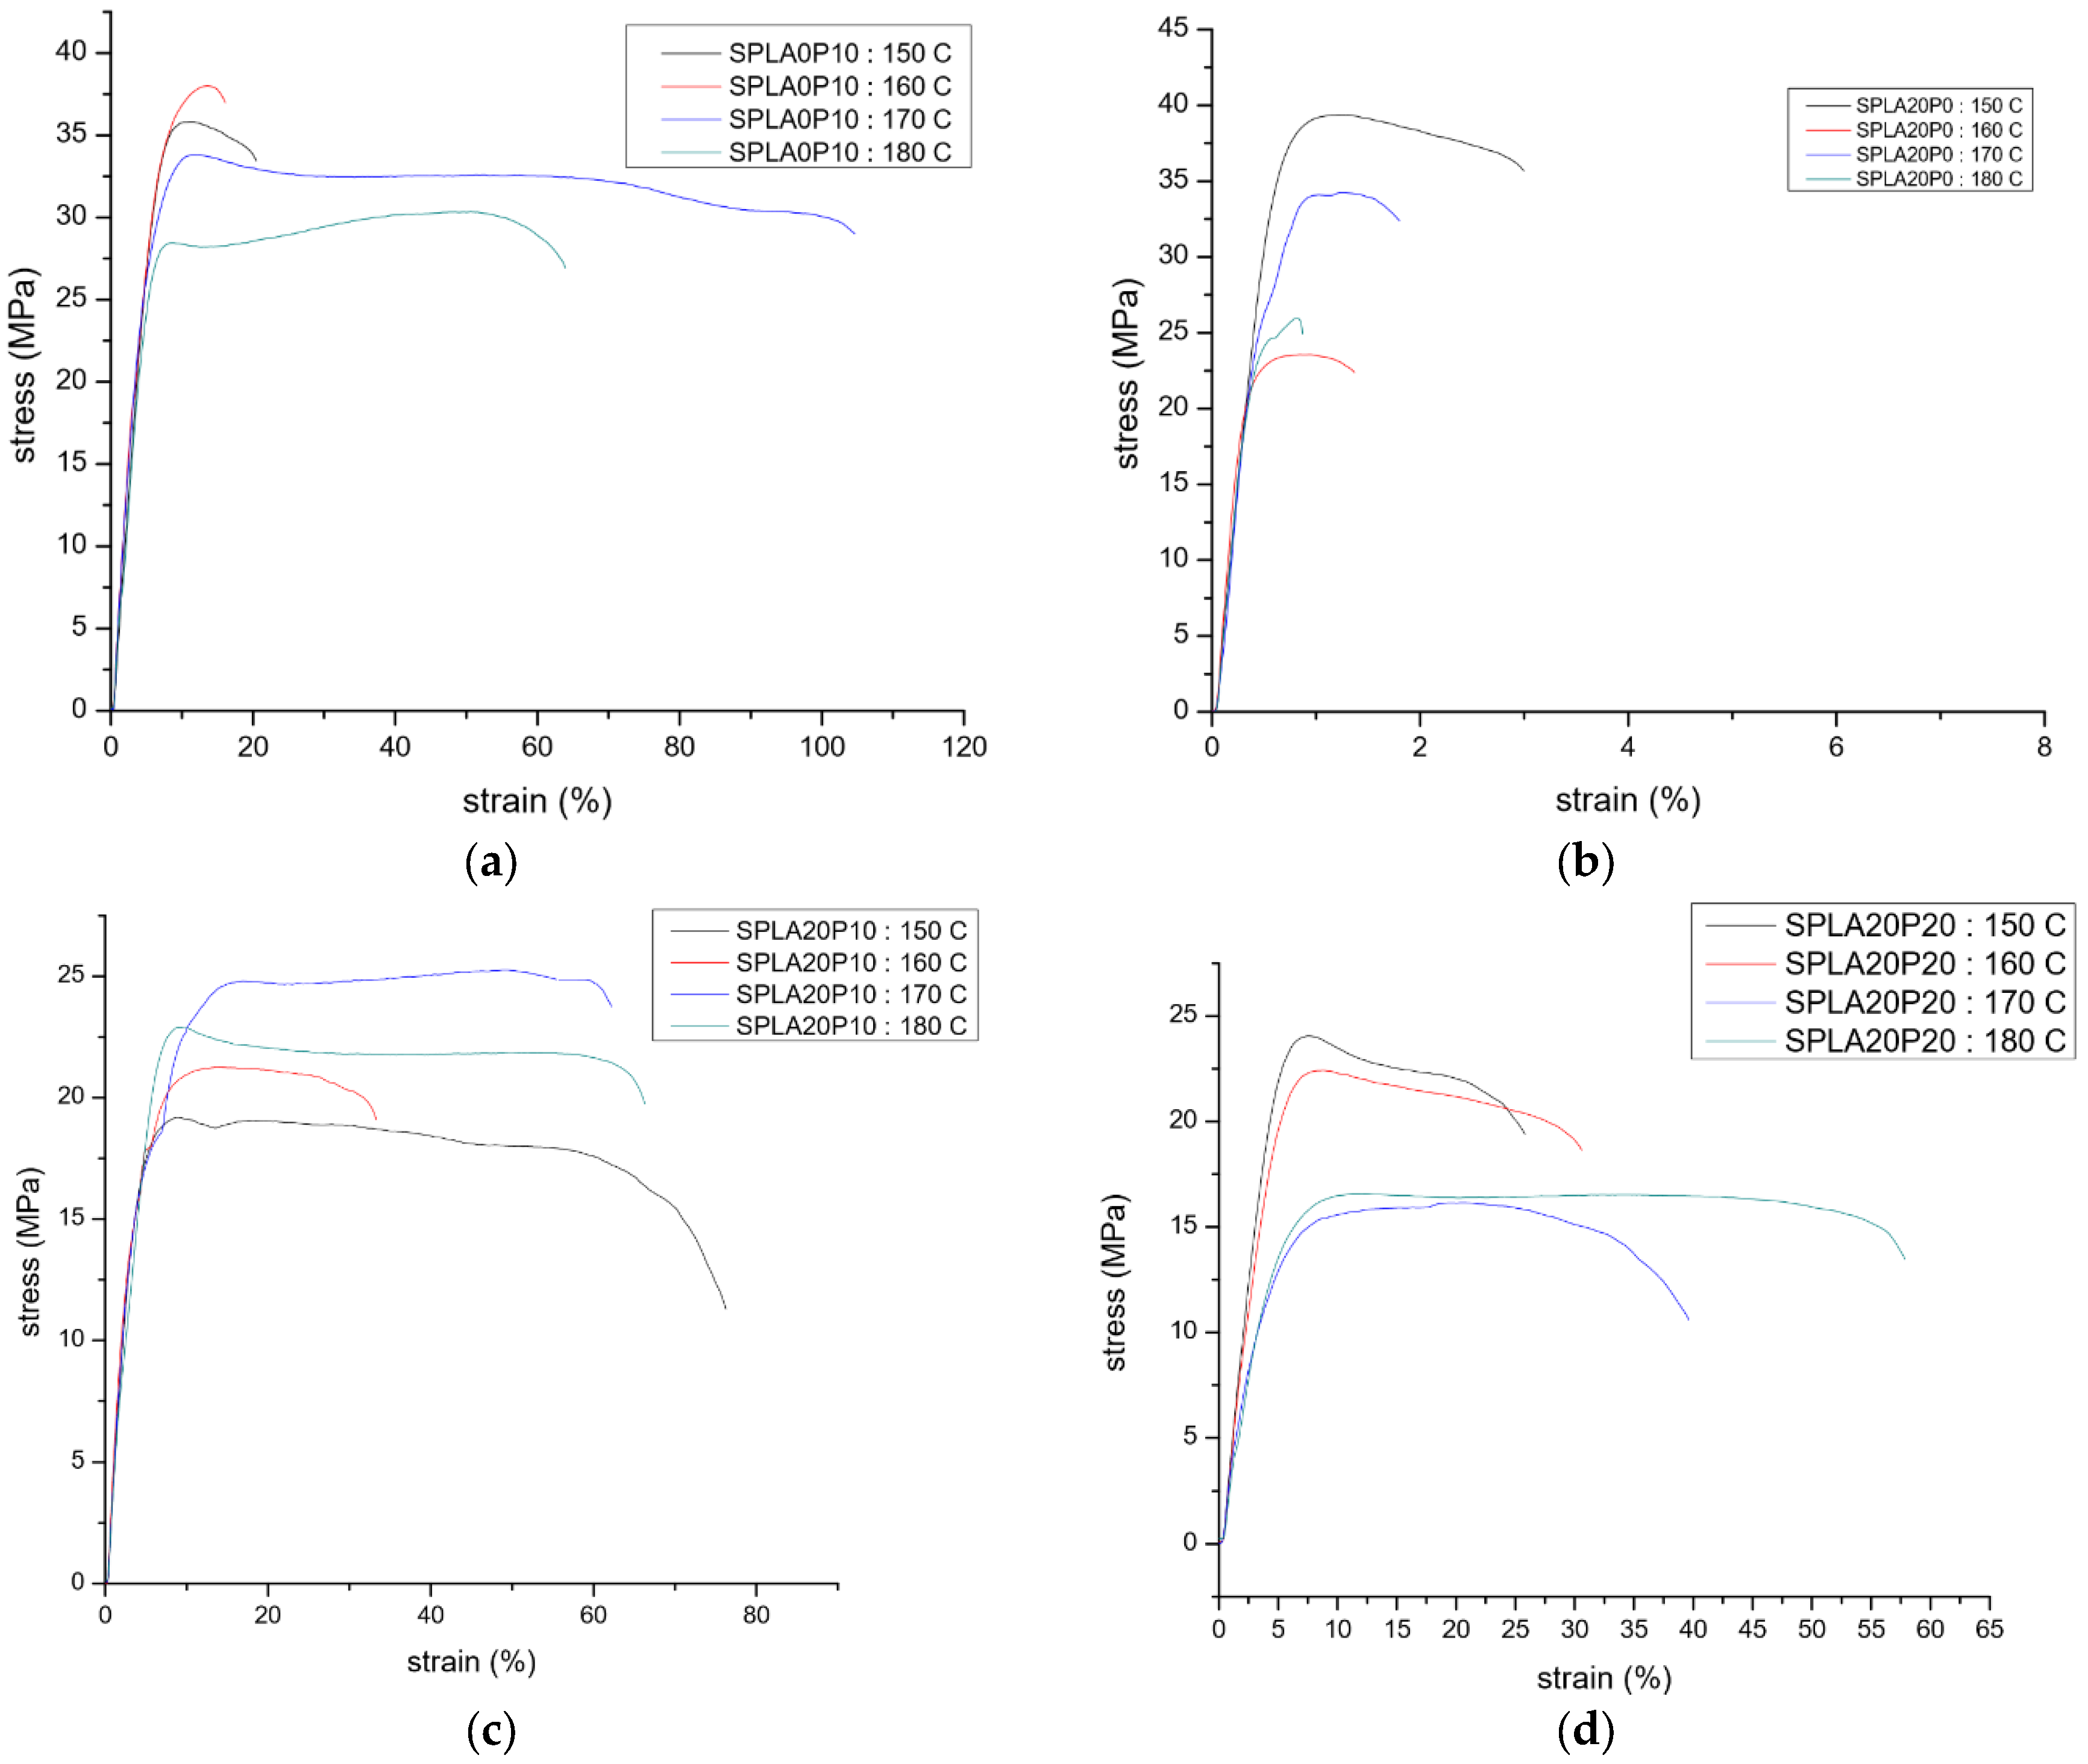
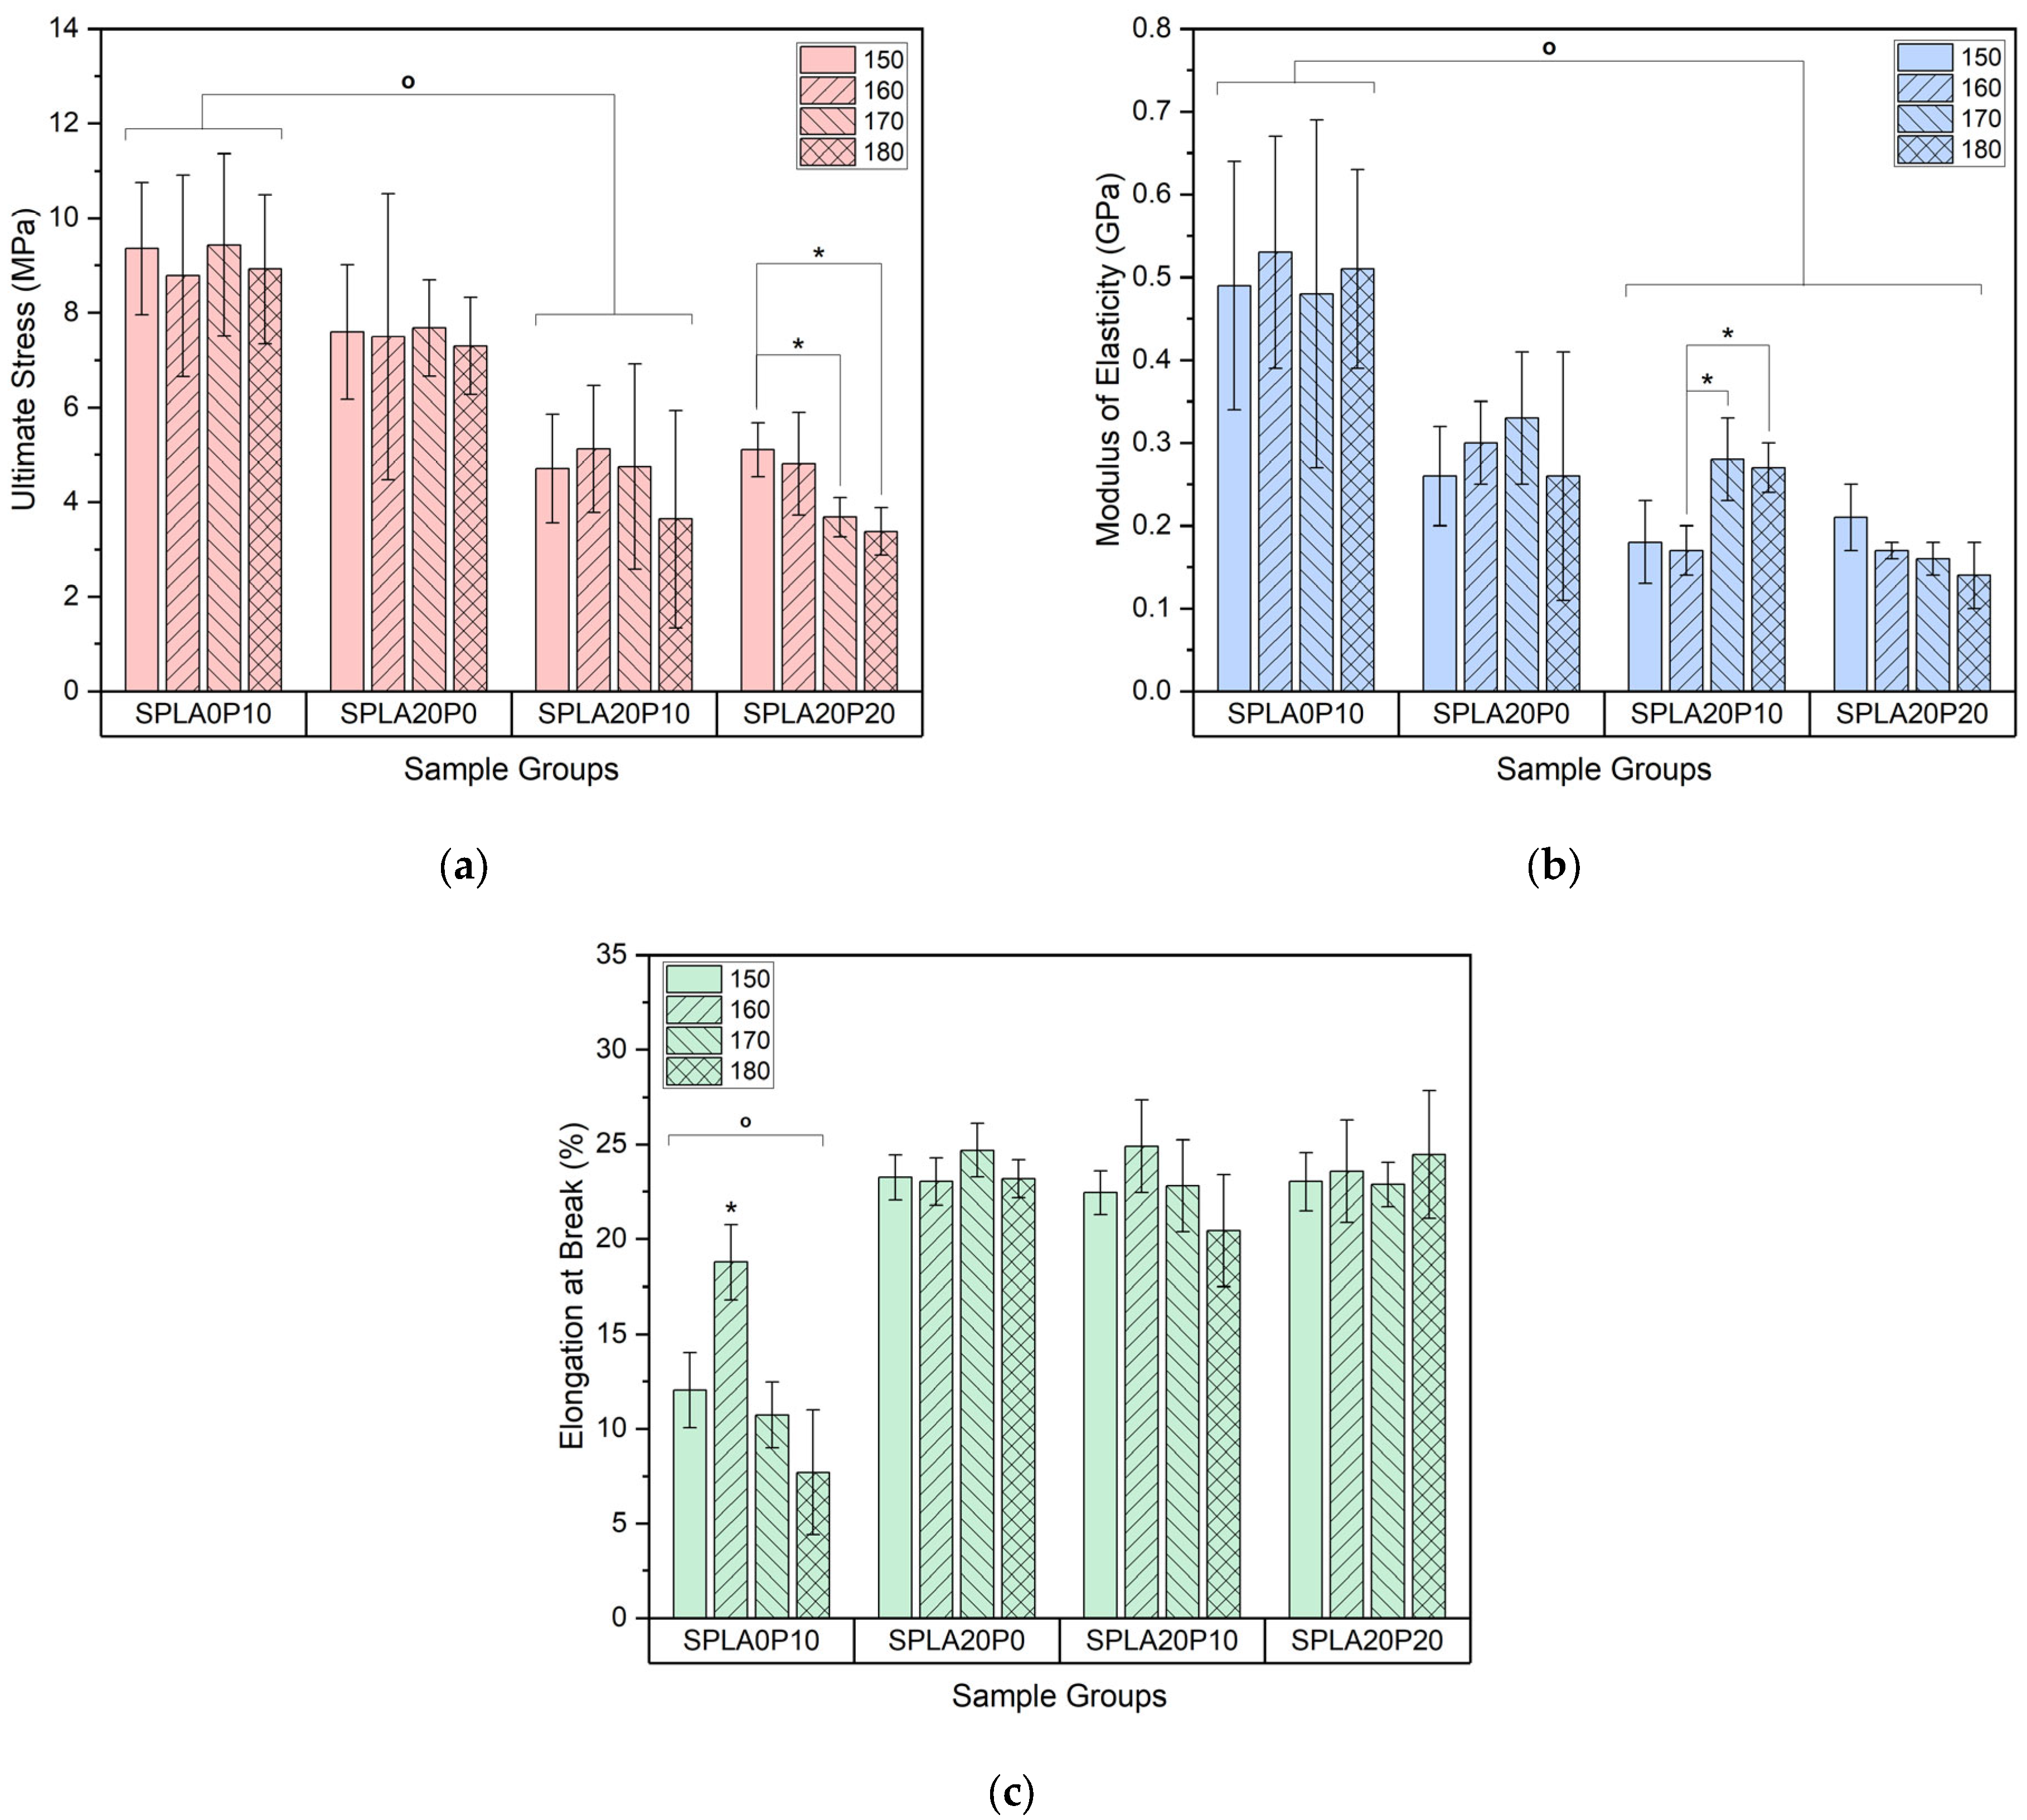
3.1. Tensile Test
3.2. Bending Test
3.3. Biodegradation Test
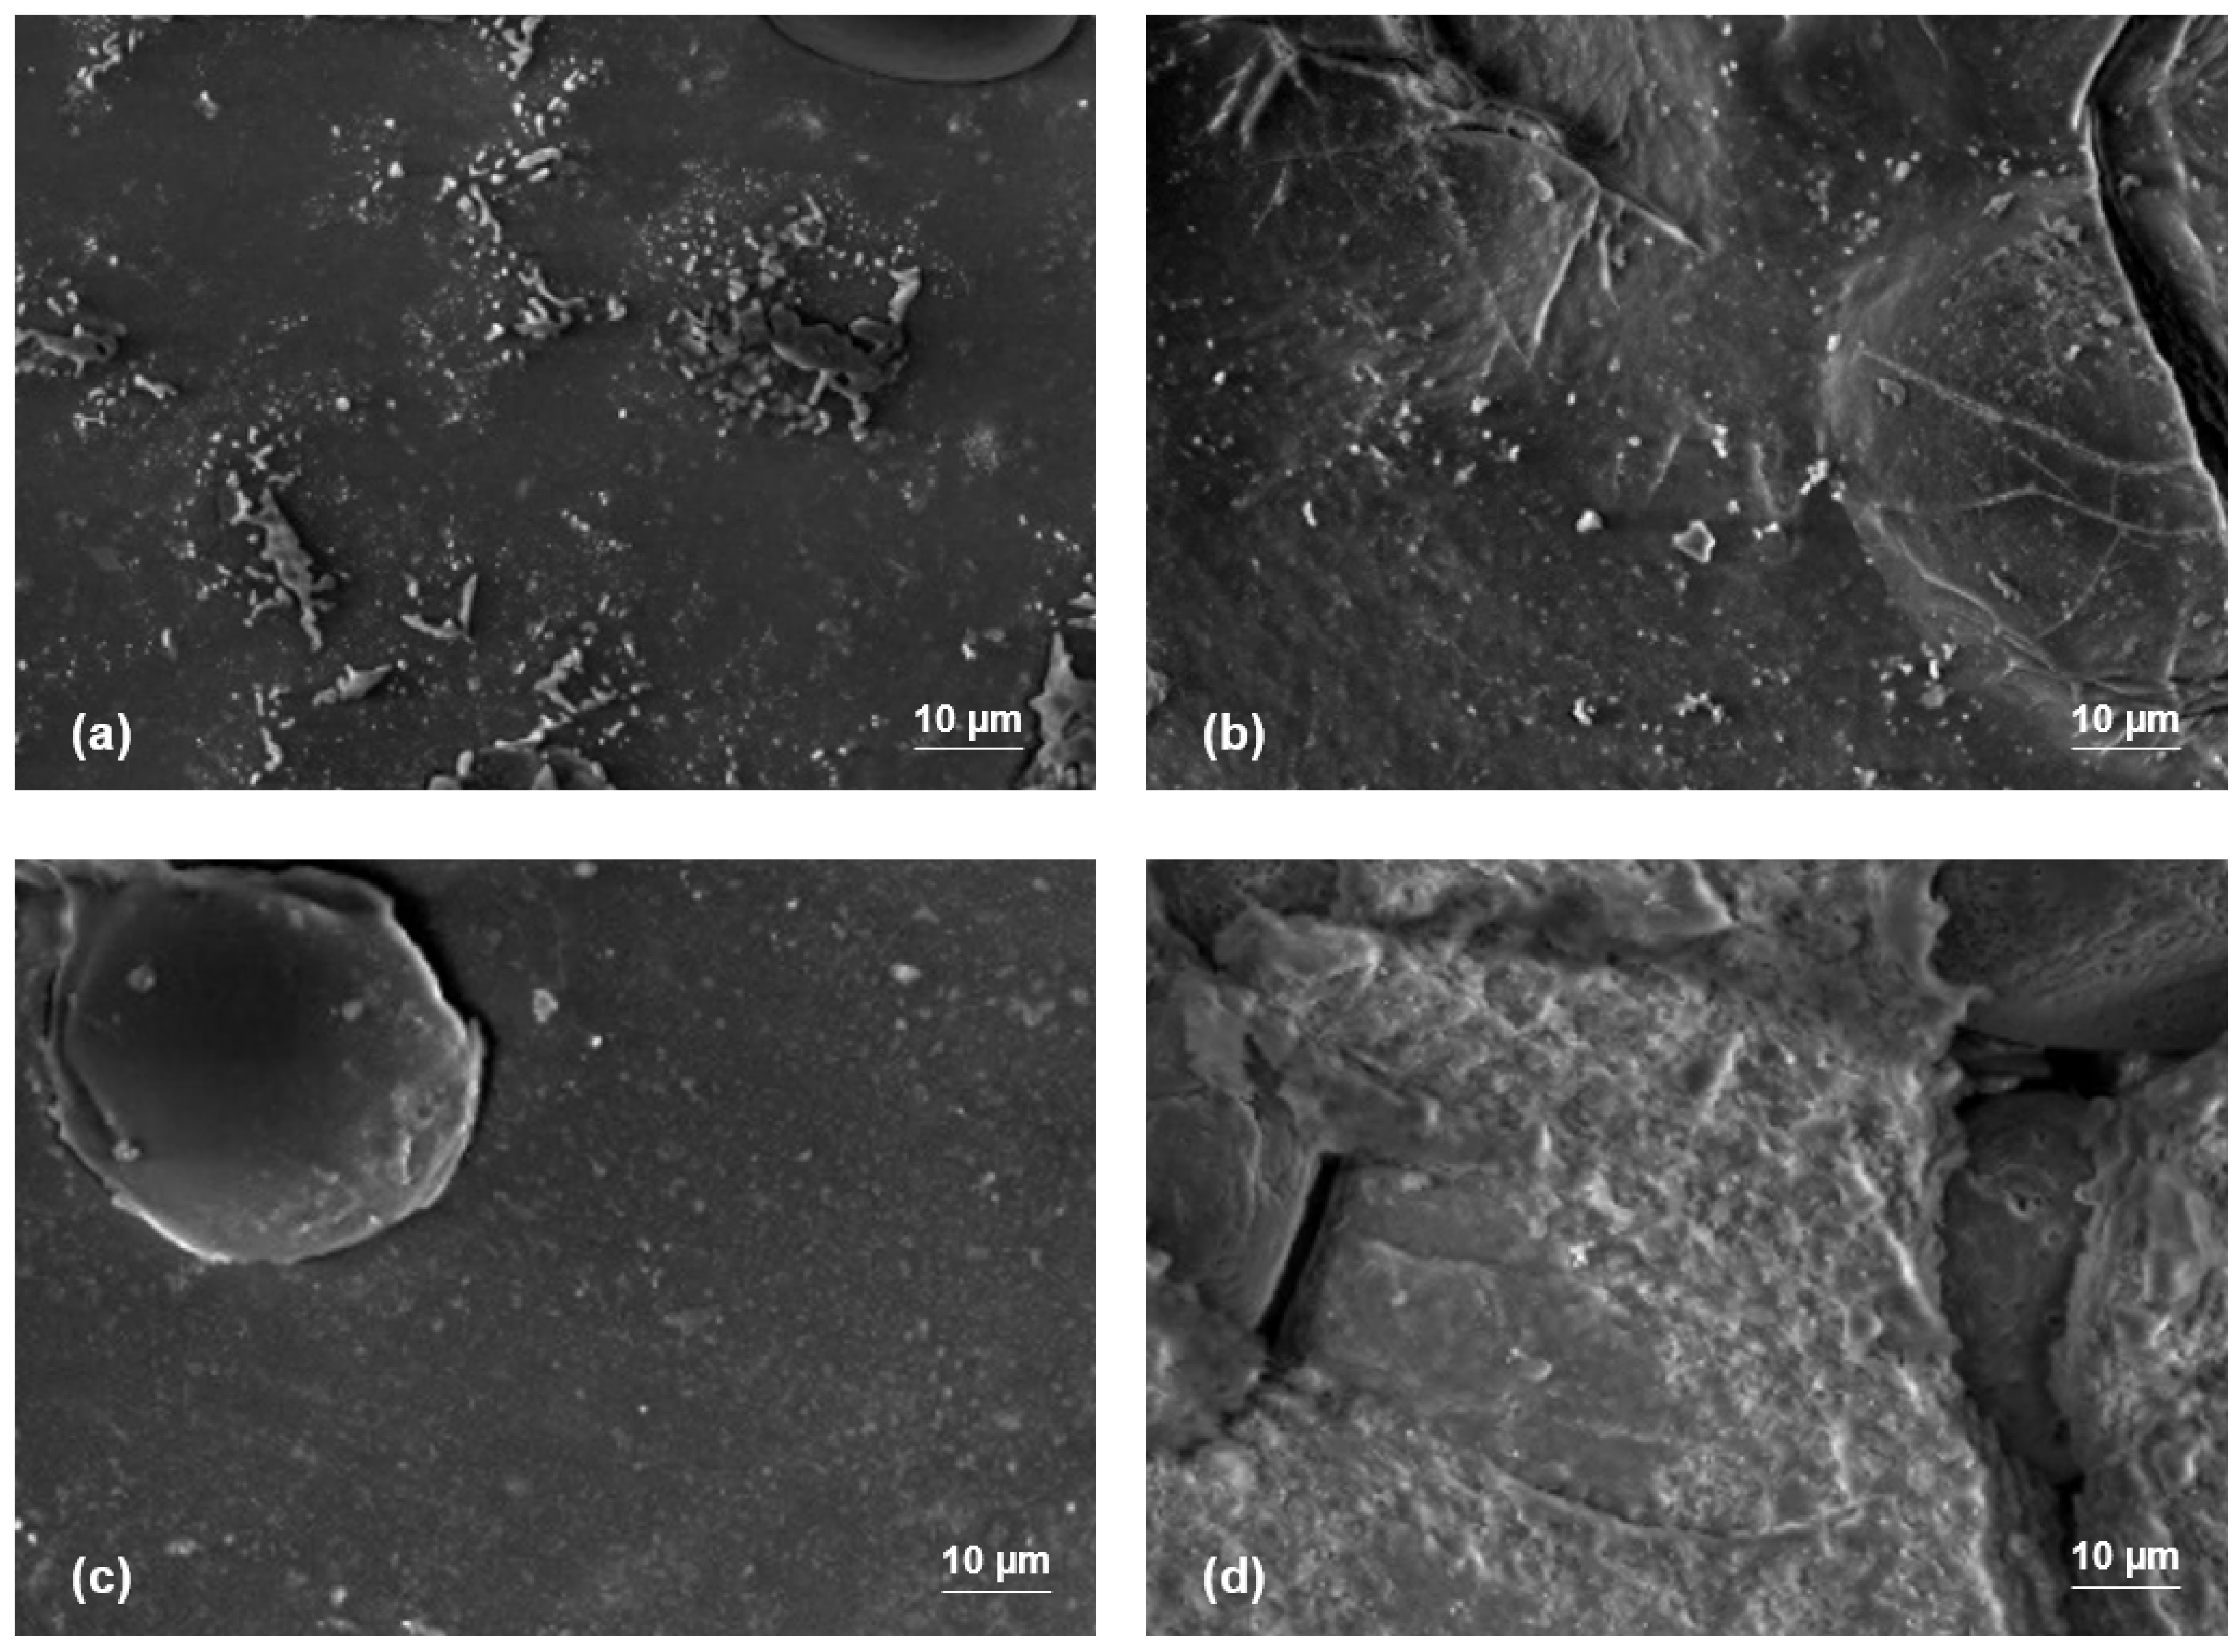
3.4. SEM Results
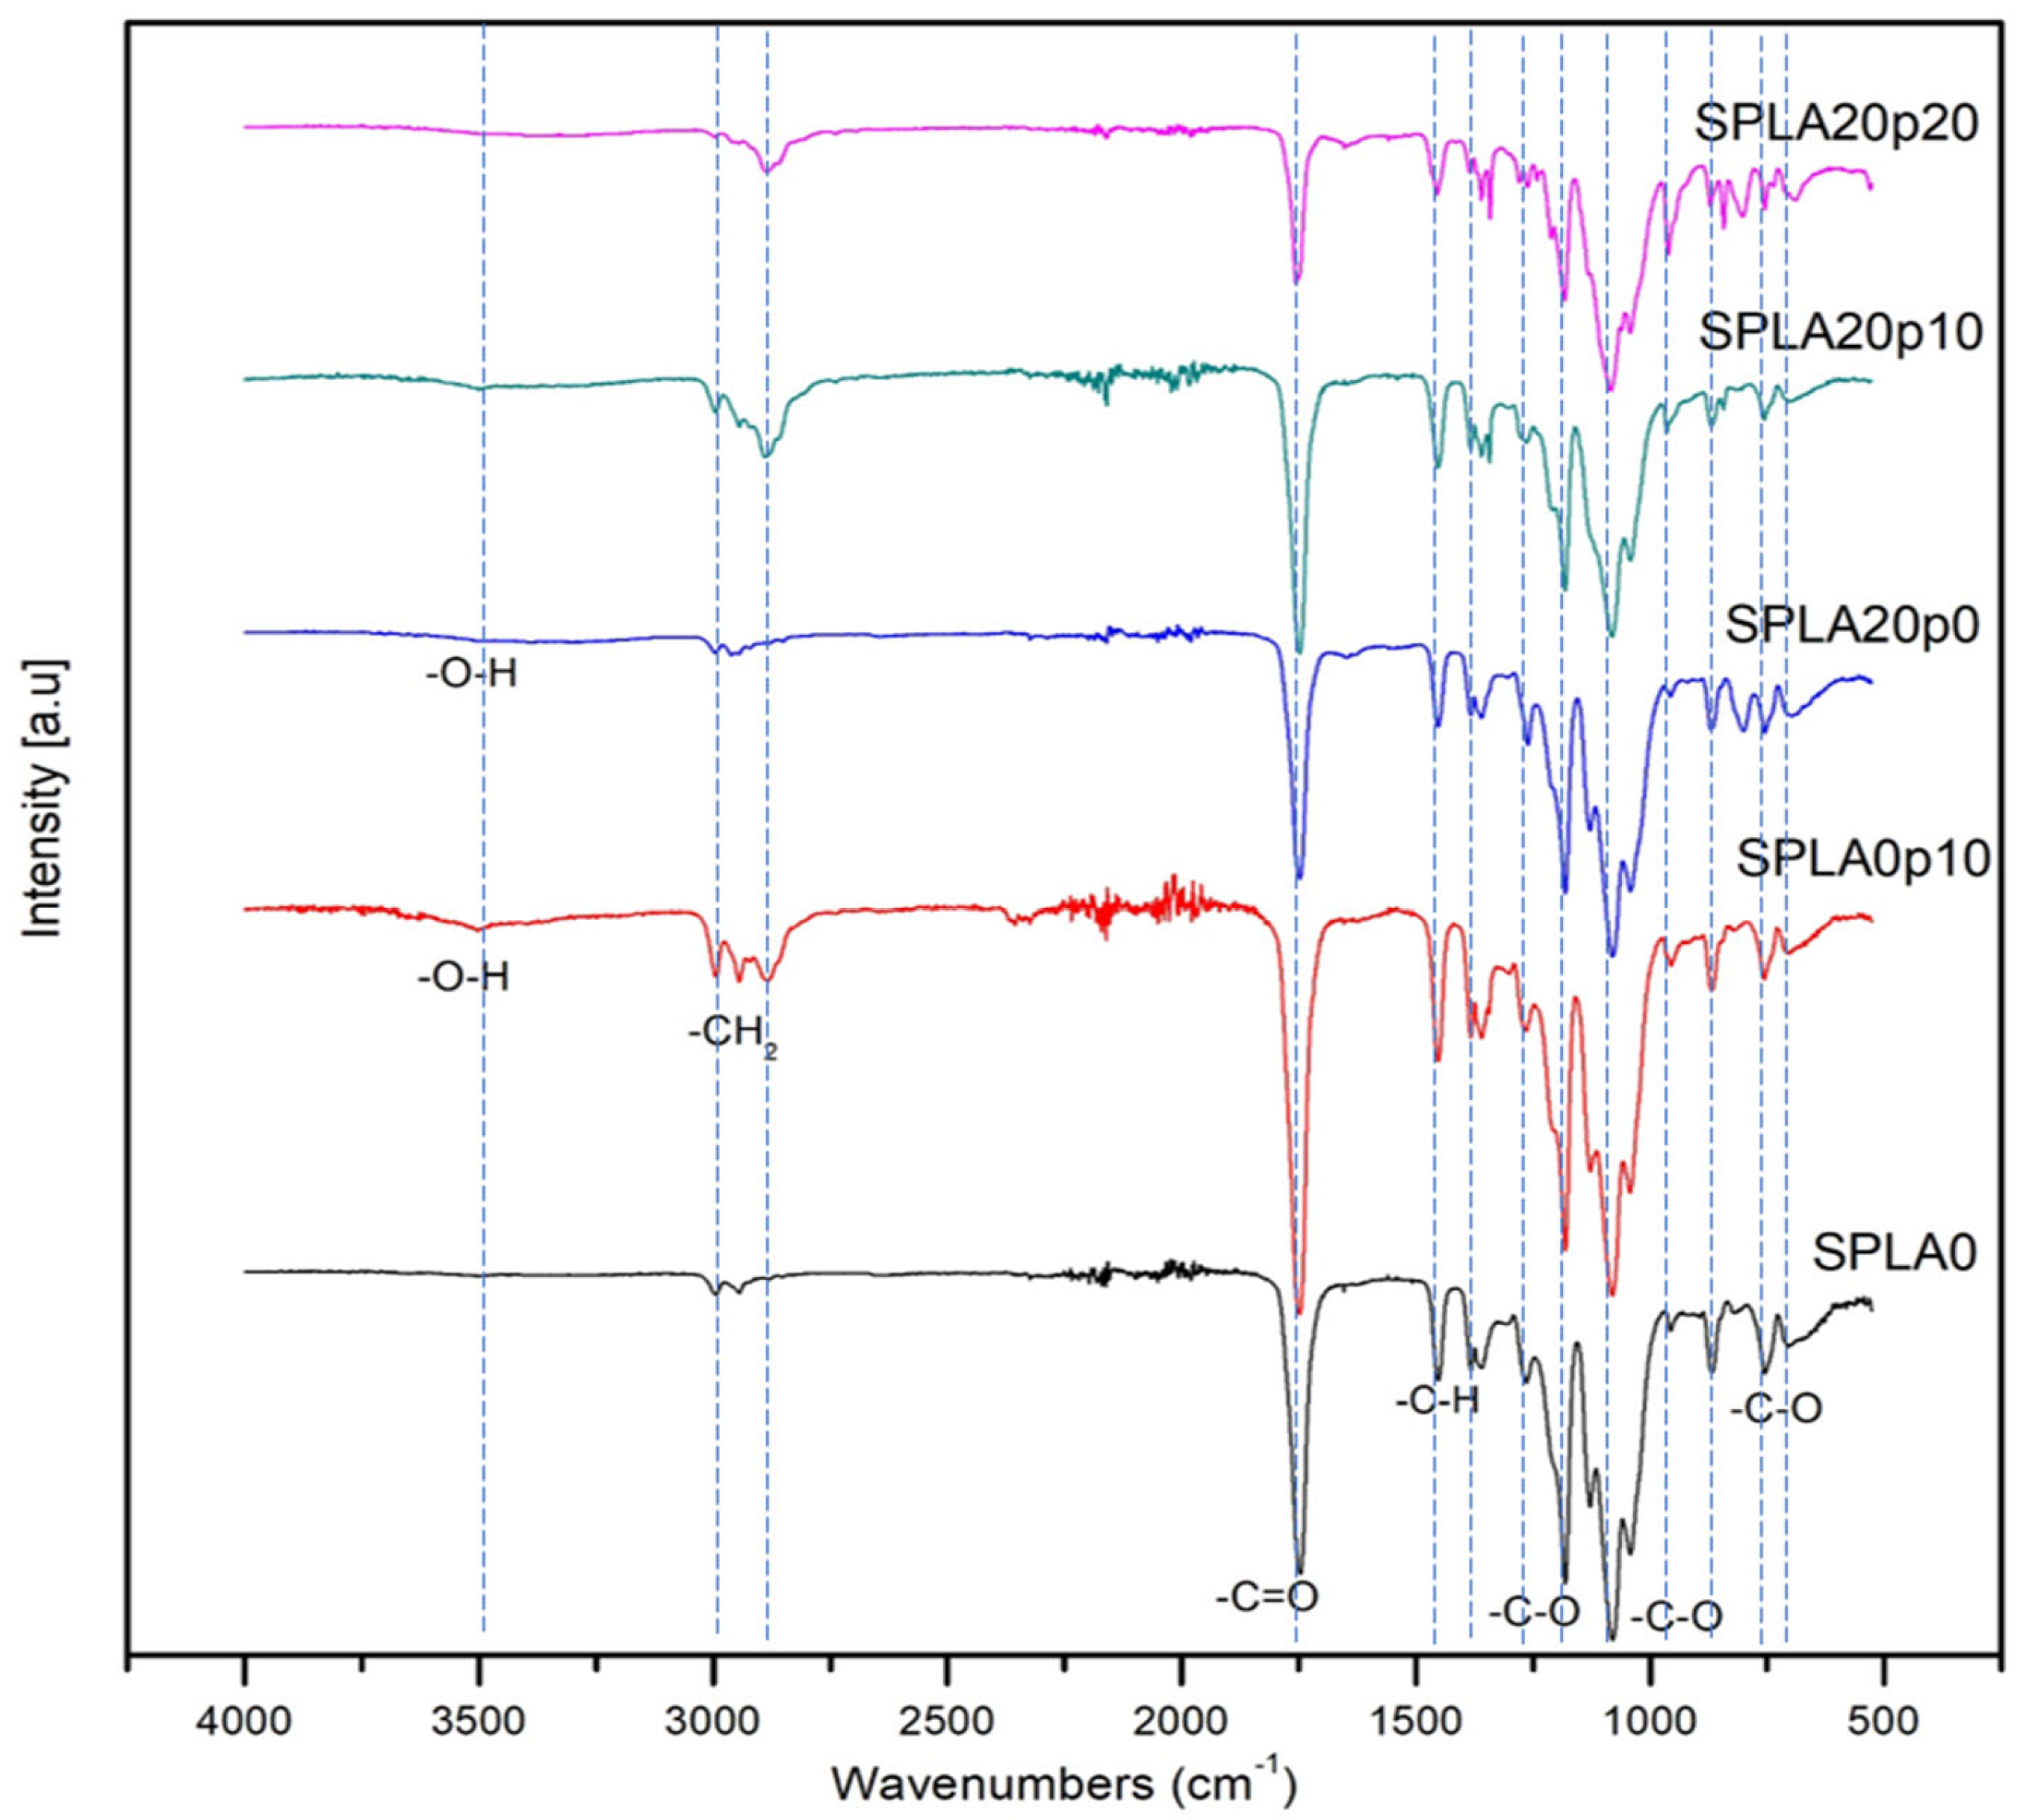
3.5. FT-IR Analysis
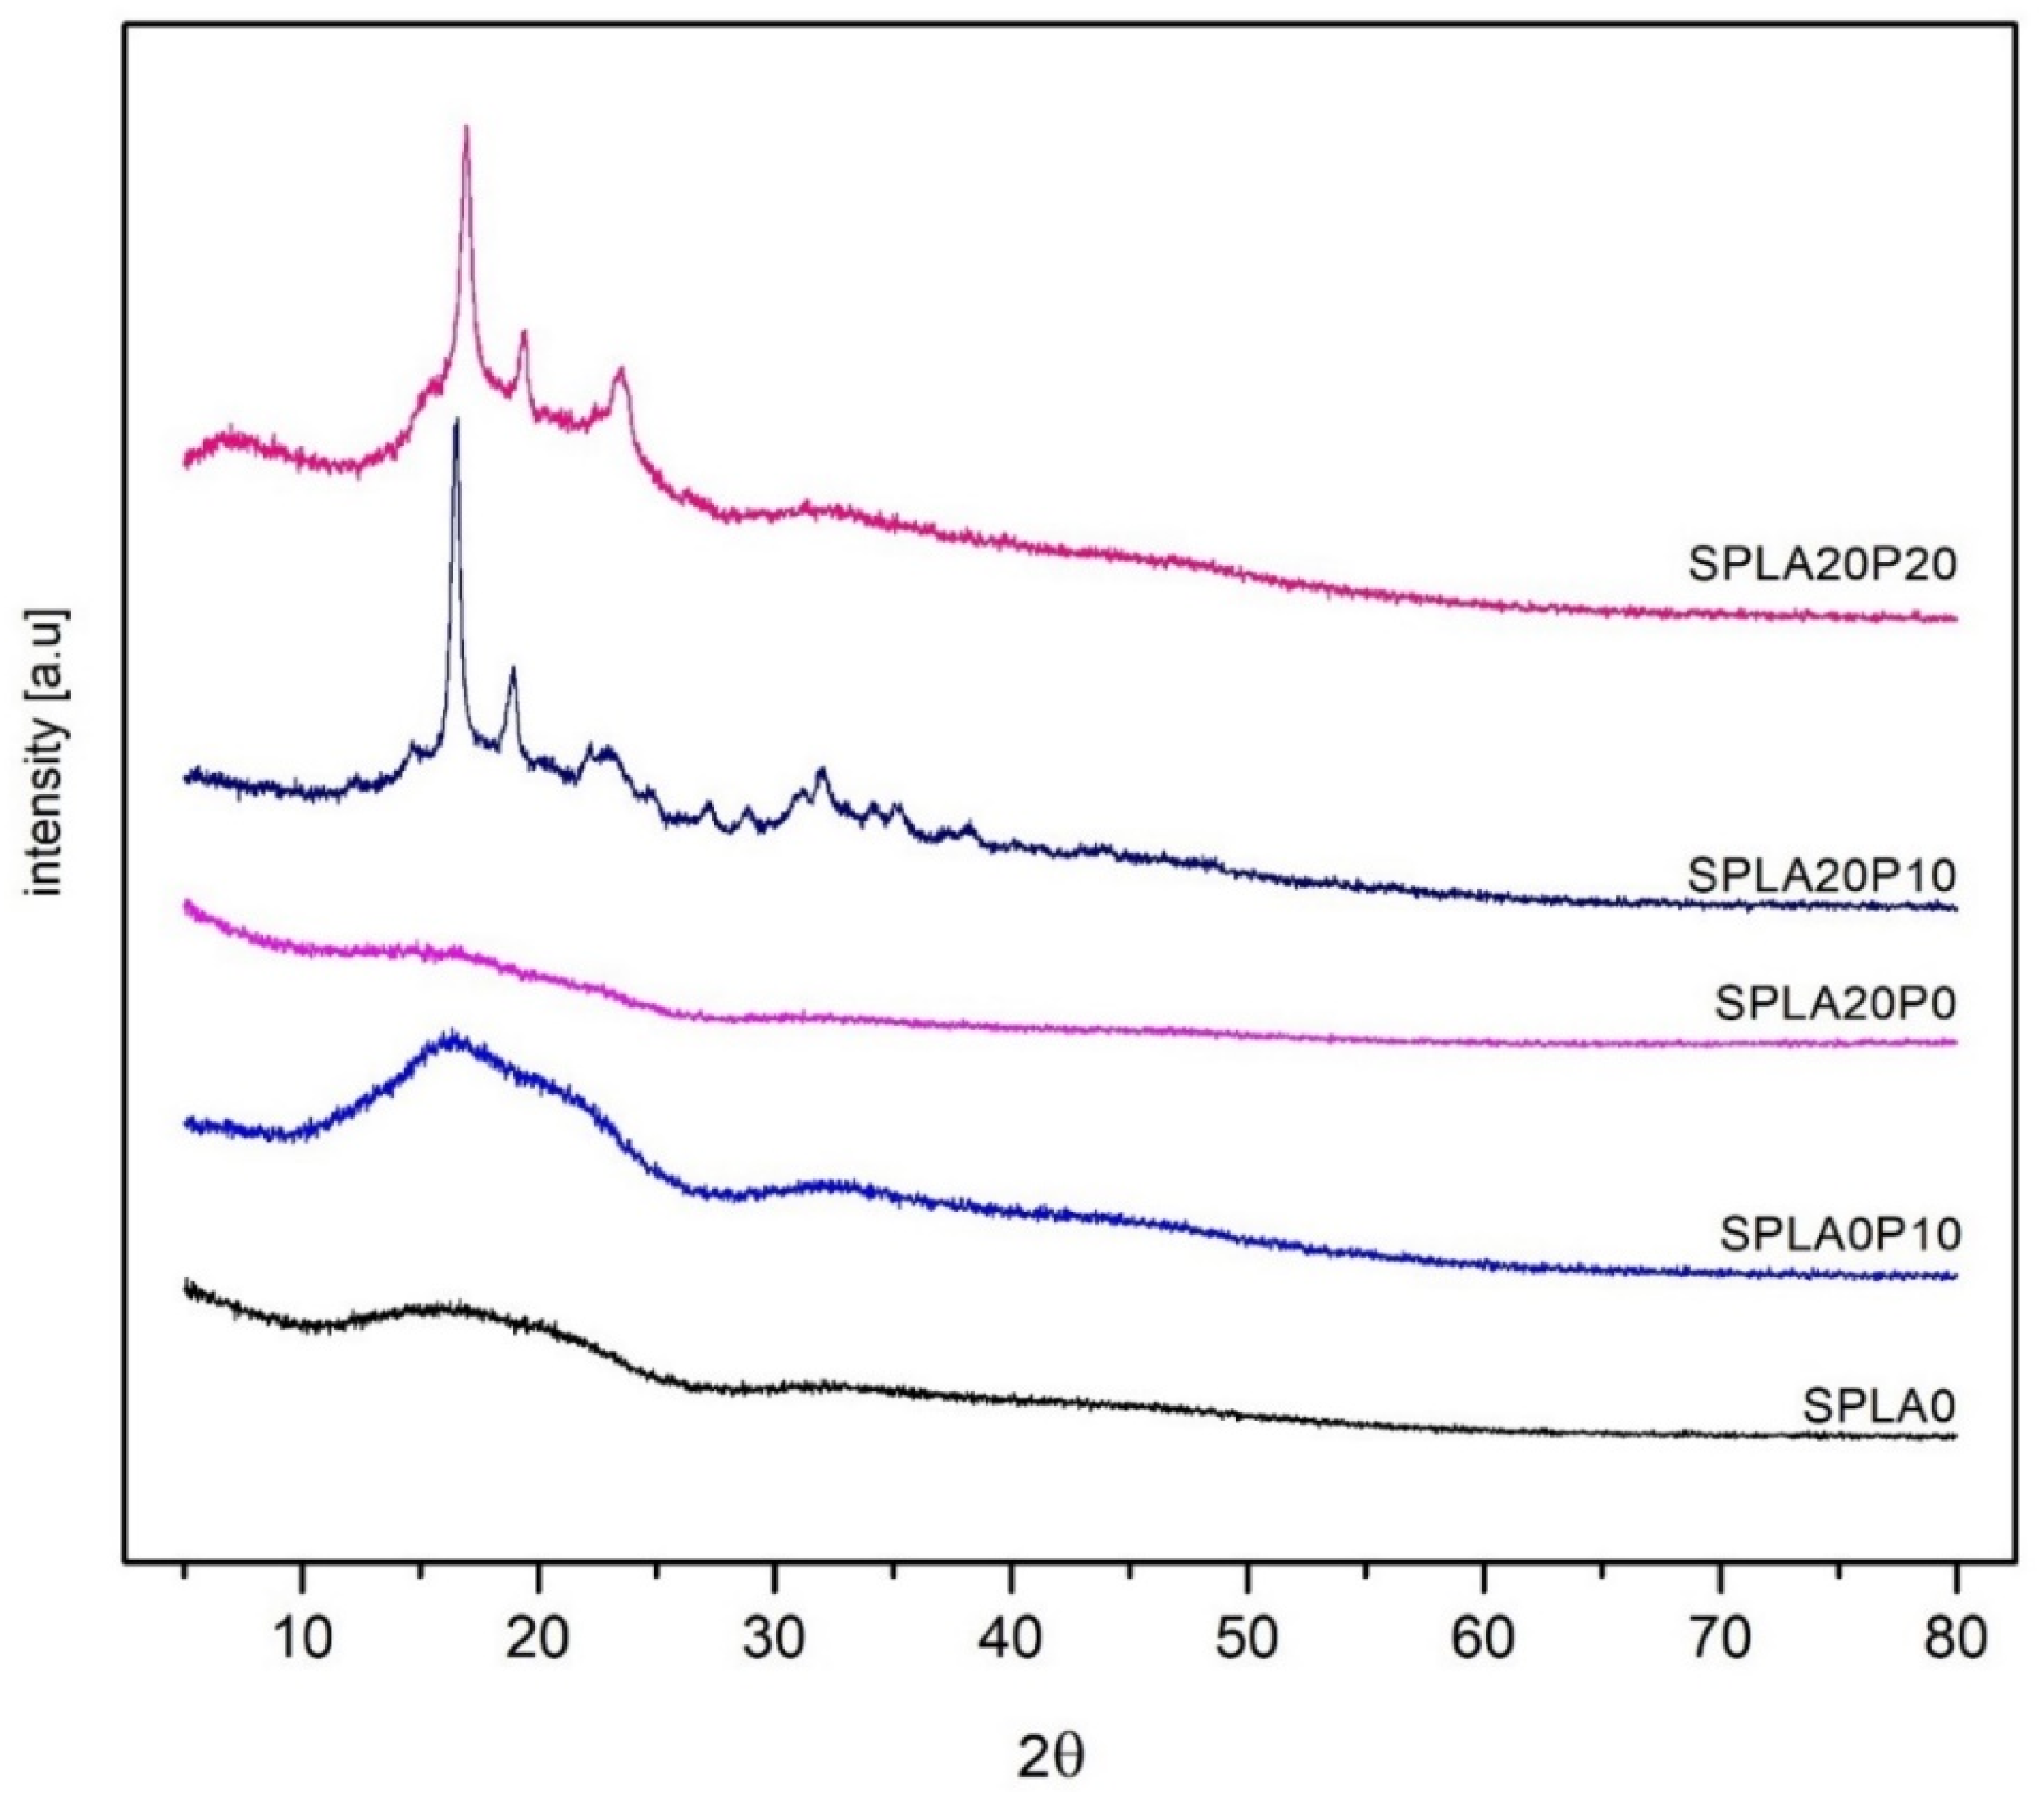
3.6. XRD Analysis
4. Discussions
5. Conclusions
- Optimal conditions for miniplate fabrication were identified at 170 °C for PLA/sago starch with 10% PEG, yielding favorable mechanical properties and a degradation rate of 7.97% over 28 days. For PLA/starch with 20% PEG, optimal conditions were at 150 °C, resulting in specific mechanical properties and a degradation rate of 10.22%.
- An antagonistic interaction between the sago starch and PEG plasticizer was indicated when blended into the PLA-based implant, affecting its mechanical properties.
- However, the role of sago starch concentration in the mixture resulted in an increased biodegradation rate.
- The addition of PEG plasticizer also had an impact on mechanical properties, yet it was attributed to the formation of an interphase layer by the PEG plasticizer, enhancing interaction between PLA and starch interfaces, indicated via SEM images.
- The higher injection molding temperatures were found to generally accelerate the degradation rate and break elongation percentage, which play a key role in balancing both mechanical and biodegradation performances of the PLA/sago starch/PEG miniplates.
Author Contributions
Funding
Data Availability Statement
Conflicts of Interest
References
- Arya, S.; Bhatt, K.; Bhutia, O.; Roychoudhury, A. Efficacy of bioresorbable plates in the osteosynthesis of linear mandibular fractures. Natl. J. Maxillofac. Surg. 2020, 11, 98–105. [Google Scholar] [CrossRef] [PubMed]
- Chocron, Y.; Azzi, A.J.; Cugno, S. Resorbable Implants for Mandibular Fracture Fixation: A Systematic Review and Meta-Analysis. Plast. Reconstr. Surg. Glob. Open 2019, 7, e2384. [Google Scholar] [CrossRef] [PubMed]
- Kim, D.Y.; Sung, I.Y.; Cho, Y.C.; Park, E.J.; Son, J.H. Bioabsorbable plates versus metal miniplate systems for use in endoscope-assisted open reduction and internal fixation of mandibular subcondylar fractures. J. Cranio-Maxillofac. Surg. 2018, 46, 413–417. [Google Scholar] [CrossRef] [PubMed]
- Nurmi, J.T.; Itälä, A.; Sihvonen, R.; Sillanpää, P.; Kannus, P.; Sievänen, H.; Järvinen, T.L.N. Bioabsorbable Versus Metal Screw in the Fixation of Tibial Tubercle Transfer: A Cadaveric Biomechanical Study. Orthop. J. Sports Med. 2017, 5, 2325967117714433. [Google Scholar] [CrossRef] [PubMed]
- Kanno, T.; Sukegawa, S.; Furuki, Y.; Nariai, Y.; Sekine, J. Overview of innovative advances in bioresorbable plate systems for oral and maxillofacial surgery. Jpn. Dent. Sci. Rev. 2018, 54, 127–138. [Google Scholar] [CrossRef] [PubMed]
- Lasprilla, A.J.; Martinez, G.A.; Lunelli, B.H.; Jardini, A.L.; Filho, R.M. Poly-lactic acid synthesis for application in biomedical devices—A review. Biotechnol. Adv. 2012, 30, 321–328. [Google Scholar] [CrossRef] [PubMed]
- Hur, W.; Park, M.; Lee, J.Y.; Kim, M.H.; Lee, S.H.; Park, C.G.; Kim, S.N.; Min, H.S.; Min, H.J.; Chai, J.H.; et al. Bioabsorbable bone plates enabled with local, sustained delivery of alendronate for bone regeneration. J. Control. Release 2016, 222, 97–106. [Google Scholar] [CrossRef]
- Chapman, S. The radiological dating of injuries. Arch. Dis. Child. 1992, 67, 1063–1065. [Google Scholar] [CrossRef]
- Park, Y.W. Bioabsorbable osteofixation for orthognathic surgery. Maxillofac. Plast. Reconstr. Surg. 2015, 37, 6. [Google Scholar] [CrossRef]
- Islam, O.; Soboleski, D.; Symons, S.; Davidson, L.K.; Ashworth, M.A.; Babyn, P. Development and duration of radiographic signs of bone healing in children. Am. J. Roentgenol. 2000, 175, 75–78. [Google Scholar] [CrossRef]
- Böstman, O.; Pihlajamäki, H.J.B. Clinical biocompatibility of biodegradable orthopaedic implants for internal fixation: A review. Biomaterials 2000, 21, 2615–2621. [Google Scholar] [CrossRef] [PubMed]
- da Silva, D.; Kaduri, M.; Poley, M.; Adir, O.; Krinsky, N.; Shainsky-Roitman, J.; Schroeder, A. Biocompatibility, biodegradation and excretion of polylactic acid (PLA) in medical implants and theranostic systems. Chem. Eng. J. 2018, 340, 9–14. [Google Scholar] [CrossRef] [PubMed]
- Fukushima, K.; Hirata, M.; Kimura, Y.J.M. Synthesis and characterization of stereoblock poly (lactic acid) s with nonequivalent D/L sequence ratios. Macromolecules 2007, 40, 3049–3055. [Google Scholar] [CrossRef]
- Xinteng, Z.; Weisan, P.; Ruhua, Z.; Feng, Z.J.D.P. Preparation and evaluation of poly (D, L-lactic acid)(PLA) or D, L-lactide/glycolide copolymer (PLGA) microspheres with estradiol. Die Pharm. 2002, 57, 695–697. [Google Scholar]
- Jamshidian, M.; Tehrany, E.A.; Imran, M.; Jacquot, M.; Desobry, S. Poly-lactic acid: Production, applications, nanocomposites, and release studies. Compr. Rev. Food Sci. Food Saf. 2010, 9, 552–571. [Google Scholar] [CrossRef] [PubMed]
- Pitt, G.; Gratzl, M.; Kimmel, G.; Surles, J.; Sohindler, A.J.B. Aliphatic polyesters II. The degradation of poly (DL-lactide), poly (ε-caprolactone), and their copolymers in vivo. Biomaterials 1981, 2, 215–220. [Google Scholar] [CrossRef] [PubMed]
- Grizzi, I.; Garreau, H.; Li, S.; Vert, M.J.B. Hydrolytic degradation of devices based on poly (DL-lactic acid) size-dependence. Biomaterials 1995, 16, 305–311. [Google Scholar] [CrossRef]
- De Jong, W.H.; Eelco Bergsma, J.; Robinson, J.E.; Bos, R.R.M. Tissue response to partially in vitro predegraded poly-L-lactide implants. Biomaterials 2005, 26, 1781–1791. [Google Scholar] [CrossRef]
- Mohapatra, A.K.; Mohanty, S.; Nayak, S.K. Effect of PEG on PLA/PEG blend and its nanocomposites: A study of thermo-mechanical and morphological characterization. Polym. Compos. 2014, 35, 283–293. [Google Scholar] [CrossRef]
- Reis, M.O.; Olivato, J.B.; Bilck, A.P.; Zanela, J.; Grossmann MV, E.; Yamashita, F. Biodegradable trays of thermoplastic starch/poly (lactic acid) coated with beeswax. Ind. Crops Prod. 2018, 112, 481–487. [Google Scholar] [CrossRef]
- DeStefano, V.; Khan, S.; Tabada, A. Applications of PLA in modern medicine. Eng. Regen. 2020, 1, 76–87. [Google Scholar] [CrossRef]
- Gutiérrez-Sánchez, M.; Escobar-Barrios, V.A.; Pozos-Guillén, A.; Escobar-García, D.M. RGD-functionalization of PLA/starch scaffolds obtained by electrospinning and evaluated in vitro for potential bone regeneration. Mater. Sci. Eng. C 2019, 96, 798–806. [Google Scholar] [CrossRef] [PubMed]
- García, N.L.; Lamanna, M.; D’Accorso, N.; Dufresne, A.; Aranguren, M.; Goyanes, S. Biodegradable materials from grafting of modified PLA onto starch nanocrystals. Polym. Degrad. Stab. 2012, 97, 2021–2026. [Google Scholar] [CrossRef]
- Diyana, Z.N.; Jumaidin, R.; Selamat, M.Z.; Ghazali, I.; Julmohammad, N.; Huda, N.; Ilyas, R.A. Physical Properties of Thermoplastic Starch Derived from Natural Resources and Its Blends: A Review. Polymers 2021, 13, 1396. [Google Scholar] [CrossRef] [PubMed]
- Rahman, M.; Hamdan, S.; Baini, R.; Bakri, M.K.; Muhammad, A.; Law Nyuk Khui, P.; Kakar, A.; Sanaullah, K. Chemically Treated Borneo Sago (Metroxylon sagu) Starch Reinforced Poly Lactic Acid Bio-composites. Bioresources 2020, 15, 1641–1655. [Google Scholar] [CrossRef]
- Umas, R.A.; Supriadi, S.; Whulanza, Y.; Hasan, A.A.A.F. Mechanical strength comparison study of biodegradable materials for miniplate implant using finite element analysis. AIP Conf. Proc. 2023, 2571, 030001. [Google Scholar]
- Whulanza, Y.; Azadi, A.; Supriadi, S.; Rahman, S.F.; Chalid, M.; Irsyad, M.; Nadhif, M.H.; Kreshanti, P. Tailoring mechanical properties and degradation rate of maxillofacial implant based on sago starch/polylactid acid blend. Heliyon 2022, 8, e08600. [Google Scholar] [CrossRef]
- Misman, M.A.; Azura, A.R.; Hamid, Z.A.A. The Effect of Acrylonitrile Concentration on Starch Grafted Acrylonitrile (ANS) Stability in Carboxylated Nitrile Butadiene Rubber (XNBR) Latex. Procedia Chem. 2016, 19, 770–775. [Google Scholar] [CrossRef]
- Wu, C.S. Improving polylactide/starch biocomposites by grafting polylactide with acrylic acid—Characterization and biodegradability assessment. Macromol. Biosci. 2005, 5, 352–361. [Google Scholar] [CrossRef]
- Casalini, T.; Rossi, F.; Castrovinci, A.; Perale, G. A Perspective on Polylactic Acid-Based Polymers Use for Nanoparticles Synthesis and Applications. Front. Bioeng. Biotechnol. 2019, 7, 259. [Google Scholar] [CrossRef]
- Kumar, R.; Alex, Y.; Nayak, B.; Mohanty, S. Effect of poly (ethylene glycol) on 3D printed PLA/PEG blend: A study of physical, mechanical characterization and printability assessment. J. Mech. Behav. Biomed. Mater. 2023, 141, 105813. [Google Scholar] [CrossRef]
- Yew, G.H.; Mohd Yusof, A.M.; Mohd Ishak, Z.A.; Ishiaku, U.S. Water absorption and enzymatic degradation of poly(lactic acid)/rice starch composites. Polym. Degrad. Stab. 2005, 90, 488–500. [Google Scholar] [CrossRef]
- Raj, S.A.; Muthukumaran, E.; Jayakrishna, K. A Case Study of 3D Printed PLA and Its Mechanical Properties. Mater. Today Proc. 2018, 5, 11219–11226. [Google Scholar] [CrossRef]
- Nugroho, A.; Ardiansyah, R.; Rusita, L.; Larasati, I.L. Effect of layer thickness on flexural properties of PLA (PolyLactid Acid) by 3D printing. J. Phys. Conf. Ser. 2018, 1130, 012017. [Google Scholar] [CrossRef]
- ISO 10993-5; Biological Evaluation of Medical Devices, Part 5: Tests for In Vitro Cytotoxicity. ISO (International Organization for Standardization): Geneva, Switzerland, 2009.
- Kim, C.-H.; Kim, D.-W.; Cho, K.Y. The influence of PEG molecular weight on the structural changes of corn starch in a starch/PEG blend. Polym. Bull. 2009, 63, 91–99. [Google Scholar] [CrossRef]
- Li, D.; Jiang, Y.; Lv, S.; Liu, X.; Gu, J.; Chen, Q.; Zhang, Y. Preparation of plasticized poly (lactic acid) and its influence on the properties of composite materials. PLoS ONE 2018, 13, e0193520. [Google Scholar] [CrossRef] [PubMed]
- Ferrarezi, M.M.F.; Oliveira Taipina, M.; Escobar da Silva, L.C.; Gonçalves, M.D.C. Poly(Ethylene Glycol) as a Compatibilizer for Poly(Lactic Acid)/Thermoplastic Starch Blends. J. Polym. Environ. 2013, 21, 151–159. [Google Scholar] [CrossRef]
- Akrami, M.; Ghasemi, I.; Azizi, H.; Karrabi, M.; Seyedabadi, M. A new approach in compatibilization of the poly(lactic acid)/thermoplastic starch (PLA/TPS) blends. Carbohydr. Polym. 2016, 144, 254–262. [Google Scholar] [CrossRef]
- Park, J.W.; Im, S.S.; Kim, S.H.; Kim, Y.H. Biodegradable polymer blends of poly(L-lactic acid) and gelatinized starch. Polym. Eng. Sci. 2000, 40, 2539–2550. [Google Scholar] [CrossRef]
- Rogovina, S.Z.; Aleksanyan, K.V.; Loginova, A.A.; Ivanushkina, N.E.; Vladimirov, L.V.; Prut, E.V.; Berlin, A.A. Influence of PEG on Mechanical Properties and Biodegradability of Composites Based on PLA and Starch. Starch-Stärke 2018, 70, 1700268. [Google Scholar] [CrossRef]
- Yu, Y.; Cheng, Y.; Ren, J.; Cao, E.; Fu, X.; Guo, W. Plasticizing effect of poly(ethylene glycol)s with different molecular weights in poly(lactic acid)/starch blends. J. Appl. Polym. Sci. 2015, 132, 41808. [Google Scholar] [CrossRef]
- Bhiogade, A.; Kannan, M.; Devanathan, S. Degradation kinetics study of Poly lactic acid(PLA) based biodegradable green composites. Mater. Today Proc. 2020, 24, 806–814. [Google Scholar] [CrossRef]
- Mikos, A.G.; Thorsen, A.J.; Czerwonka, L.A.; Bao, Y.; Langer, R.; Winslow, D.N.; Vacanti, J.P.J.P. Preparation and characterization of poly (L-lactic acid) foams. Polymer 1994, 35, 1068–1077. [Google Scholar] [CrossRef]
- Reed, A.; Gilding, D.J.P. Biodegradable polymers for use in surgery—Poly (glycolic)/poly (Iactic acid) homo and copolymers: 2. In vitro degradation. Polymer 1981, 22, 494–498. [Google Scholar] [CrossRef]
- Xu, L.; Crawford, K.; Gorman, C.B.J.M. Effects of temperature and pH on the degradation of poly (lactic acid) brushes. Macromolecules 2011, 44, 4777–4782. [Google Scholar] [CrossRef]
- Murariu, M.; Dubois, P. PLA composites: From production to properties. Adv. Drug Deliv. Rev. 2016, 107, 17–46. [Google Scholar] [CrossRef]
- Saragih, A.S.; Pradipta, R.S.; Supriadi, S.; Chalid, M.; Whulanza, Y. Mold design and simulation of polymer miniplate and screw implant in the micro injection molding. AIP Conf. Proc. 2023, 2837, 040008. [Google Scholar]
- Supriadi, S.; Whulanza, Y. TiBio teaching industry: Research based product development in the case of medical degradable implant. AIP Conf. Proc. 2023, 2536, 040012. [Google Scholar]
- Chalid, M.; Gustiraharjo, G.; Pangesty, A.-I.; Adyandra, A.; Whulanza, Y.; Supriadi, S. Effect of PEG Incorporation on Physicochemical and in vitro Degradation of PLLA/PDLLA Blends: Application in Biodegradable Implants. J. Renew. Mater. 2023, 11, 3043–3056. [Google Scholar] [CrossRef]
- Liu, H.; Zhang, J. Research progress in toughening modification of poly(lactic acid). J. Polym. Sci. Part B Polym. Phys. 2011, 49, 1051–1083. [Google Scholar] [CrossRef]
- Gamage, A.; Liyanapathiranage, A.; Manamperi, A.; Gunathilake, C.; Mani, S.; Merah, O.; Madhujith, T. Applications of Starch Biopolymers for a Sustainable Modern Agriculture. Sustainability 2022, 14, 6085. [Google Scholar] [CrossRef]
- Awale, R.J.; Ali, F.B.; Azmi, A.S.; Puad, N.I.M.; Anuar, H.; Hassan, A. Enhanced Flexibility of Biodegradable Polylactic Acid/Starch Blends Using Epoxidized Palm Oil as Plasticizer. Polymers 2018, 10, 977. [Google Scholar] [CrossRef]
- Kozlowski, M.; Masirek, R.; Piorkowska, E.; Gazicki-Lipman, M. Biodegradable blends of poly(L-lactide) and starch. J. Appl. Polym. Sci. 2007, 105, 269–277. [Google Scholar] [CrossRef]
- Su, Q.; Qiao, Y.; Xiao, Y.; Yang, S.; Wu, H.; Li, J.; He, X.; Hu, X.; Yang, H.; Yong, X. Research progress of 3D printed poly (ether ether ketone) in the reconstruction of craniomaxillofacial bone defects. Front. Bioeng. Biotechnol. 2023, 11, 1259696. [Google Scholar] [CrossRef]
- Zhang, T.; Wang, W.; Liu, J.; Wang, L.; Tang, Y.; Wang, K. A review on magnesium alloys for biomedical applications. Front. Bioeng. Biotechnol. 2022, 10, 953344. [Google Scholar] [CrossRef]


| Samples | Chemical Compounds | Weight Fraction of Sago Starch | Weight Fraction of PLA | Weight Fraction of PEG |
|---|---|---|---|---|
| SPLA20P0 | Sago starch/PLA | 20 | 80 | 0 |
| SPLA0P10 | Sago starch/PLA/PEG | 0 | 90 | 10 |
| SPLA20P10 | Sago starch/PLA/PEG | 20 | 70 | 10 |
| SPLA20P20 | Sago starch/PLA/PEG | 20 | 60 | 20 |
Disclaimer/Publisher’s Note: The statements, opinions and data contained in all publications are solely those of the individual author(s) and contributor(s) and not of MDPI and/or the editor(s). MDPI and/or the editor(s) disclaim responsibility for any injury to people or property resulting from any ideas, methods, instructions or products referred to in the content. |
© 2024 by the authors. Licensee MDPI, Basel, Switzerland. This article is an open access article distributed under the terms and conditions of the Creative Commons Attribution (CC BY) license (https://creativecommons.org/licenses/by/4.0/).
Share and Cite
Whulanza, Y.; Taufiqurrakhman, M.; Supriadi, S.; Chalid, M.; Kreshanti, P.; Azadi, A. PLA-Sago Starch Implants: The Optimization of Injection Molding Parameter and Plasticizer Material Compositions. Appl. Sci. 2024, 14, 1683. https://doi.org/10.3390/app14051683
Whulanza Y, Taufiqurrakhman M, Supriadi S, Chalid M, Kreshanti P, Azadi A. PLA-Sago Starch Implants: The Optimization of Injection Molding Parameter and Plasticizer Material Compositions. Applied Sciences. 2024; 14(5):1683. https://doi.org/10.3390/app14051683
Chicago/Turabian StyleWhulanza, Yudan, Mohamad Taufiqurrakhman, Sugeng Supriadi, Mochamad Chalid, Prasetyanugraheni Kreshanti, and Athoillah Azadi. 2024. "PLA-Sago Starch Implants: The Optimization of Injection Molding Parameter and Plasticizer Material Compositions" Applied Sciences 14, no. 5: 1683. https://doi.org/10.3390/app14051683