Article

Fault Controls on Hydrocarbon Migration—An Example from the Southwestern Pearl River Mouth Basin

1
School of Geosciences, China University of Petroleum (East China), Qingdao 266580, China
2
Energy and Sustainability Research Institute, University of Groningen, 9747 AG Groningen, The Netherlands
3
College of Earth and Engineering, Shandong University of Science and Technology, Qingdao 266590, China
*
Author to whom correspondence should be addressed.
Appl. Sci. 2024, 14(5), 1712; https://doi.org/10.3390/app14051712
Submission received: 28 December 2023 / Revised: 25 January 2024 / Accepted: 26 January 2024 / Published: 20 February 2024
(This article belongs to the Special Issue Rock Mass Characterization: Failure and Mechanical Behavior)

Abstract

:
Faults play a pivotal role in controlling fluid migration and retention within sedimentary basins, particularly in the context of fault-bound hydrocarbon reservoirs. Assessing the stability and sealing capabilities of faults enhances our comprehension of these systems and aids in the identification of pathways for fluid migration. In this study, we focus on a series of fault-bound hydrocarbon accumulations located in the southern Wenchang A subbasin within the Pearl River Mouth Basin. We emphasize the significant influence of faults in governing the processes of hydrocarbon migration and accumulation. By leveraging 3D seismic data and well information, we have assessed the sealing potential of ten faults that either currently retain hydrocarbon columns or have the potential to do so. Our analysis reveals that even faults with a relatively low Shale Gouge Ratio (as low as 15%) can effectively support substantial column heights. Taking into account factors, such as the source rock maturity, fault activity, geometry, sealing potential, and the distribution of hydrocarbon accumulations, we have formulated a conceptual model for hydrocarbon migration and accumulation within the study area. This model underscores potential fluid traps within the rift basin, shedding light on the complex dynamics of hydrocarbon movement in this region.

1. Introduction

Faults, which are commonly found in sedimentary basins, can serve as conduits, barriers, or combined barrier-conduit structures for fluid migration in the subsurface [1,2,3,4,5,6,7,8,9,10,11,12,13,14,15,16,17]. The primary factors that influence their control based on fluid flow are their episodic seismic activity and sealing capacity during quiescence periods [18,19,20,21,22,23,24,25]. Although faulting (reactivation) occurs for short geological periods and typically ceases as the tectonic activity stops, fault sealing plays a crucial role over long geological timescales [26,27,28], making it significant for hydrocarbon migration, accumulation, and other fluid-storage operations, such as carbon dioxide, hydrogen, and air.
There are three major mechanisms of fault sealing: juxtaposition seal, fault rock capillary seal, and cementation [29,30,31,32,33,34,35,36,37,38,39,40,41,42,43]. It is well-documented that even in reservoir/reservoir juxtaposition conditions, the low permeability of the fault gouge generated during the faulting process can effectively seal and support a high hydrocarbon column [44,45]. Therefore, evaluating and predicting the composition and distribution of the fault gouge along the fault surface and thus the sealing potential of the fault will provide a solid foundation for analyzing hydrocarbon migration and accumulation [28]. For quantitatively predicting the volume and type of fault gouge within the fault zone, several algorithms have been developed, including the Clay Smear Potential (CSP) [33], Shale Smear Factor (SSF) [35], and Shale Gouge Ratio (SGR) [36]. Empirically, a high clay content within the fault zone is associated with a high capillary threshold pressure, but calibration is still necessary to assess the fault sealing capacity [46,47]. In addition, an associated geochemical analysis would help to reconstruct the hydrocarbon flow process [48,49].
Here, we illustrate the control of faults on hydrocarbon migration and accumulations in the extensional setting of the south western Pearl River Mouth Basin (PRMB), which is one of the most important petroliferous basins in the northern South China Sea [50,51,52,53]. The fault geometries, activity history, and fault sealing potential are used to create a migration pathway model, which is then validated with the locations of verified hydrocarbon accumulations and used to predict potential unidentified accumulations.

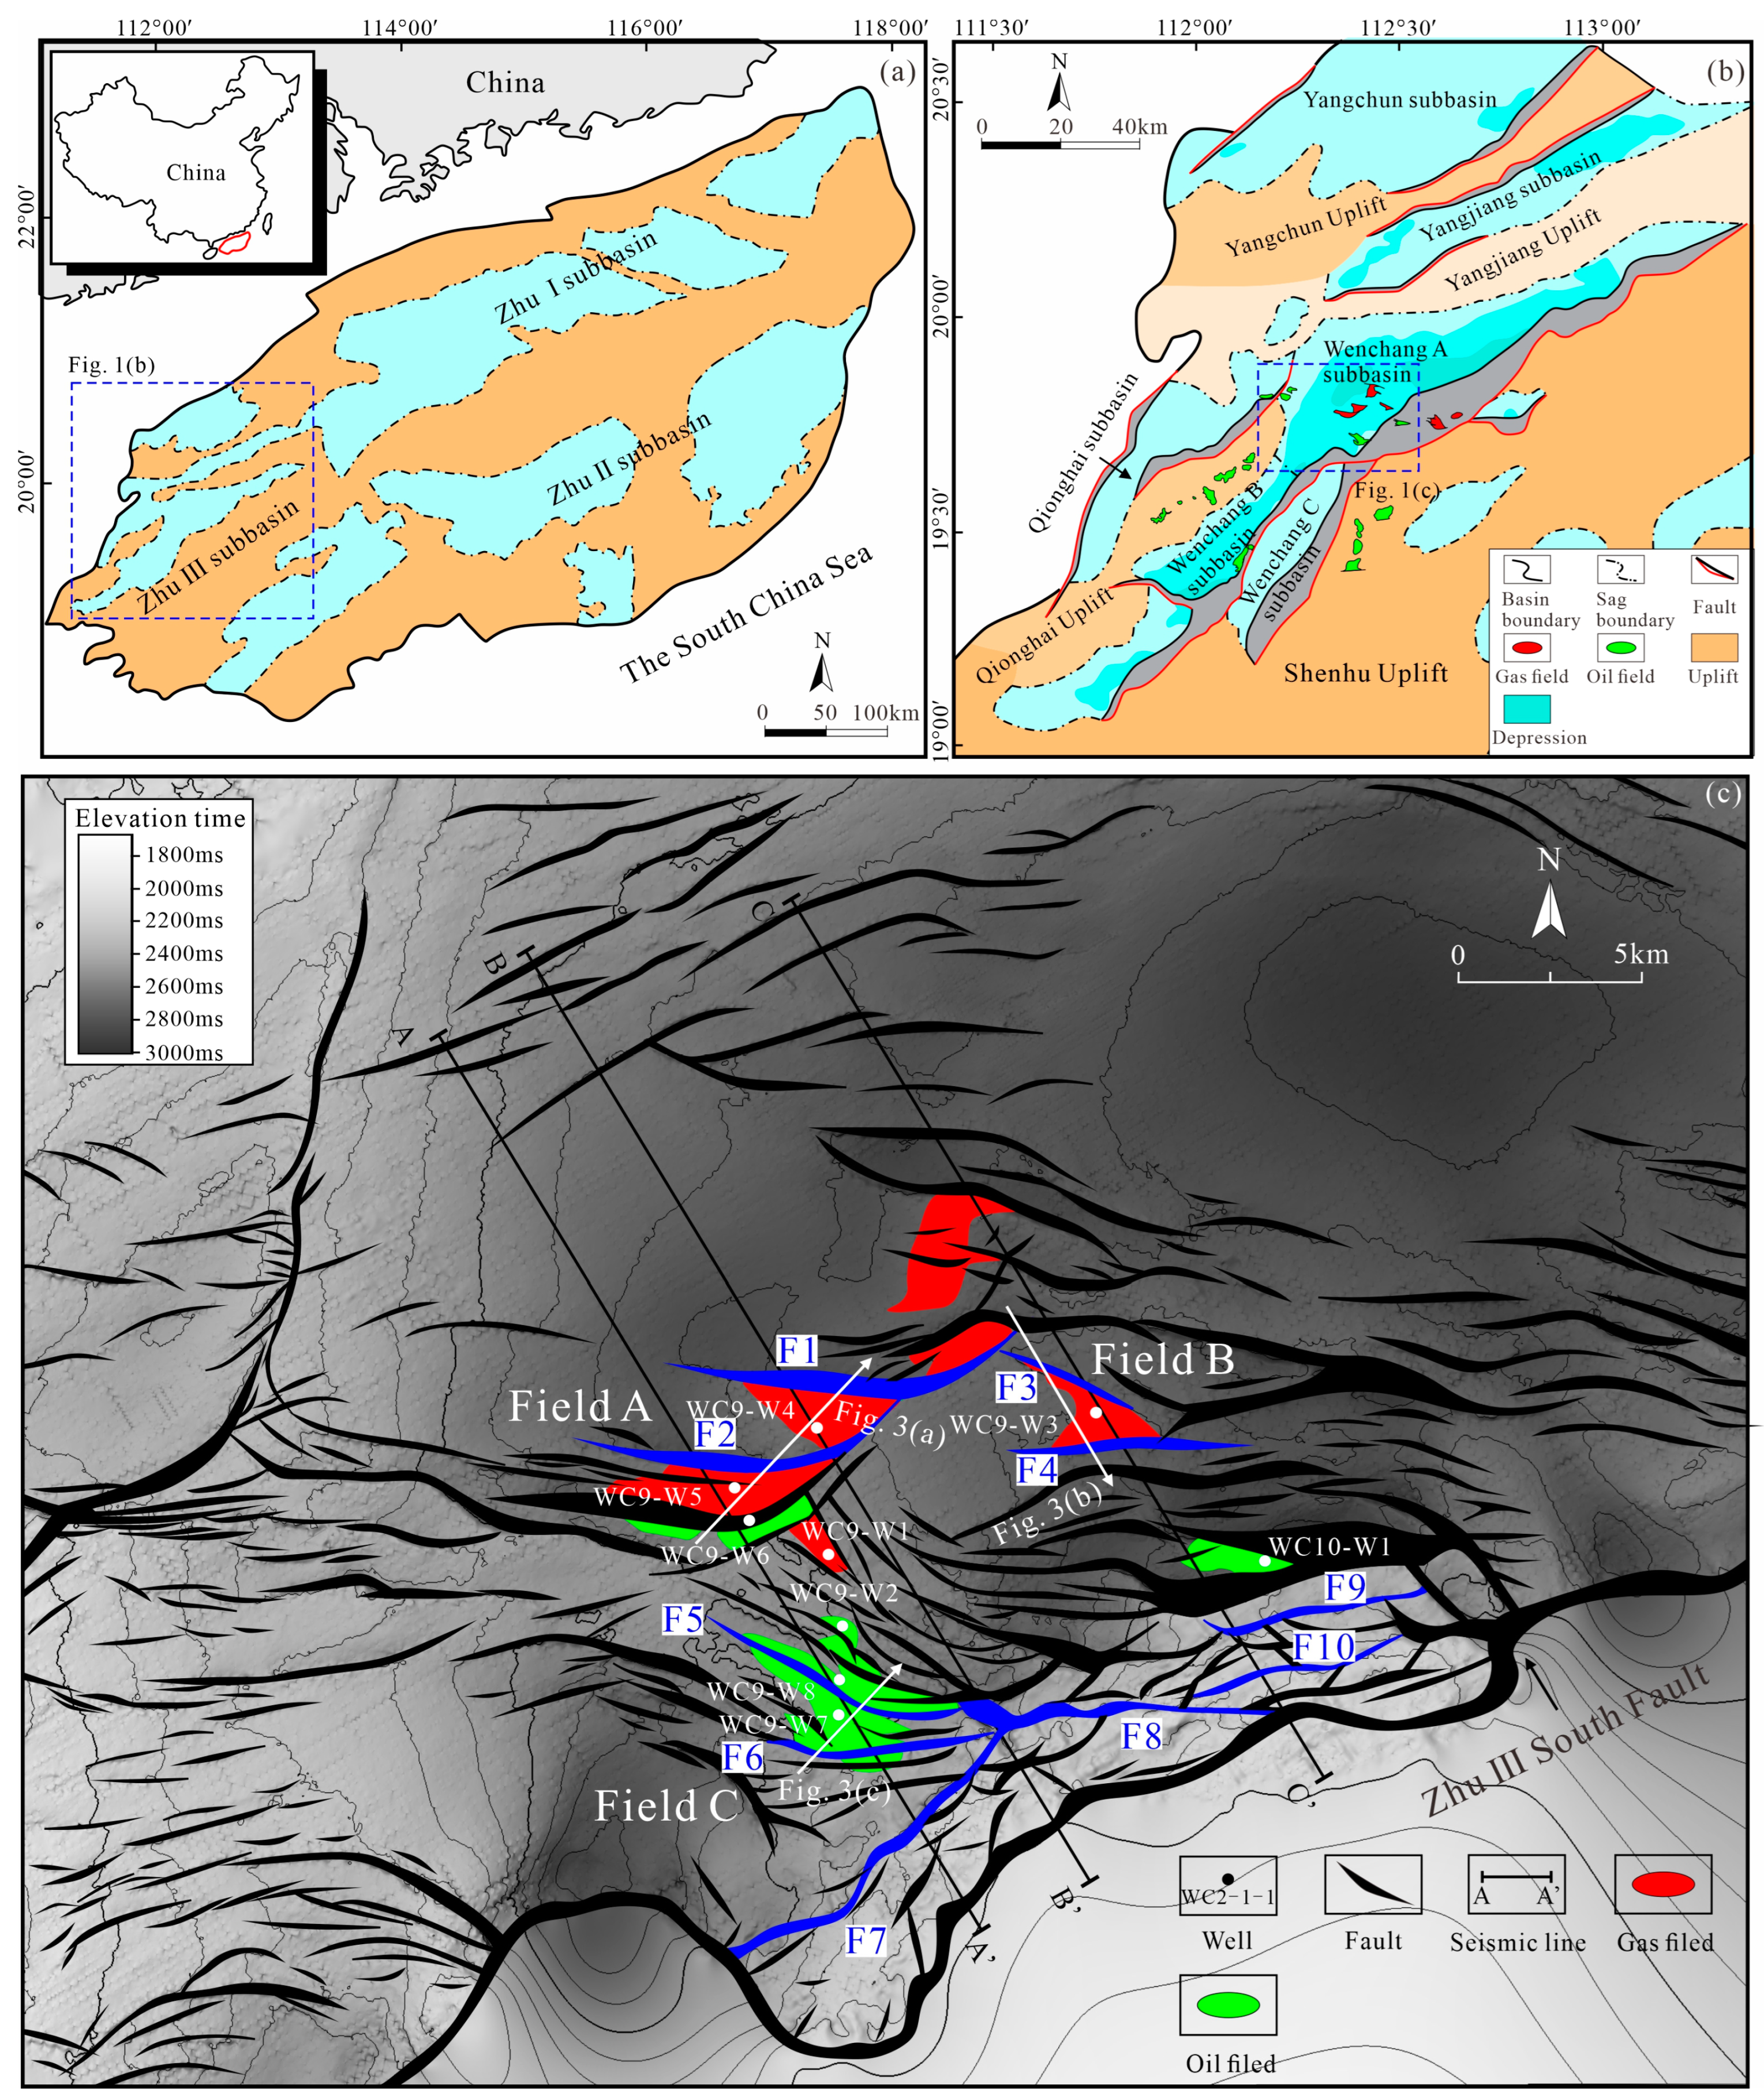
2. Geological Setting

The PRMB is an extensional rift located on the continental shelf and slope of the northern South China Sea [54,55]. The western part of the PRMB, called the Zhu III subbasin, consists of a series of SW-NE striking half-graben and graben structures separated by horst areas (Figure 1). The study area is located in the Wenchang A basin, which is one of these half-graben structures, with the main boundary faults in the south and east and onlapping sediments occurring in the north and west of the basin (Figure 1) [56,57]. The Cenozoic sedimentary succession of the basin comprises a good source–reservoir–seal vertical sequence (Figure 2), with Eocene and Oligocene lacustrine source rocks overlain by Oligocene to Miocene marine sandstone reservoirs, which are intercalated with marine mudstones, forming excellent seals (Figure 2) [53]. During its Cenozoic evolution, the basin experienced multiple tectonic phases, including a Paleocene-to-Early-Oligocene rifting stage, a Late-Oligocene-to-Early-Miocene post-rift subsidence stage and a Middle-Miocene-to-the-present-tectonic reactivation stage [58].
Under the influence of the clockwise-rotating stress field during the Cenozoic, the fault systems in the study area exhibit a complex pattern consisting of multiple stages and directions. During the Paleocene to Early Oligocene, the stress field was characterized by NW–SE extension, resulting in the formation of a series of NE-trending faults primarily within the Late Eocene and Early Oligocene Wenchang and Enping Formations (Figure 2) [53]. Subsequently, from the Late Oligocene to Middle Miocene, the stress field shifted towards near N–S extension, leading to the development of a series of nearly E-W-trending faults, predominantly distributed in the Zhuhai and Zhujiang Formations of the same age (Figure 2). Lastly, since the Late Miocene to the present, the stress field exhibited NNE–SSW extension, giving rise to a series of WNW-trending faults primarily developed within the Miocene Hanjiang and Yuehai Formations (Figure 2).
Figure 1. (a) Location and structural units of the PRMB. (b) Structural units and hydrocarbon distribution of the Zhu Ⅲ subbasin. See the location in Figure 1a. (c) The T62 fault system and the hydrocarbon distribution of the southern Wenchang A subbasin. See the location in Figure 1b.
Applsci 14 01712 g001
Figure 2. Stratigraphic column, structural evolution, and hydrocarbon accumulation history of the Wenchang A subbaisn. The main reservoirs and source rocks are indicated beside the lithology column.
Applsci 14 01712 g002
Hydrocarbon charging was initiated in the basin center during post-rift subsidence and has led to oil and gas filled reservoir intervals in the tilted fault blocks associated with the half graben structures at the southern edge of the basin, where several hydrocarbon fields have been discovered (Figure 3). All of these fields are fault-bound, and fault rock seals often control the column heights in the interbedded reservoir-seal intervals. Discoveries have been made in various strata, including the early Miocene (N1z2), late Oligocene (E3z), and even the early Oligocene (E3e) (Figure 3d). However, the main hydrocarbon accumulations are observed in the Mid-to-Late Oligocene E3z2 and E3z3 sequences as in the fault-bound fields Field A, Field B, and Field C (Figure 3). The hydrocarbon distribution pattern, both in the plan view and cross-section, indicates that faults F1 and F2 act as the major sealing faults for Field A (Figure 3a). In contrast, the accumulation of Field B primarily relies on the fault sealing provided by F3 (Figure 3b). Similarly, F5 controls the major hydrocarbon accumulation in Field C, acting as the primary sealing fault, while F6 serves as a secondary sealing fault (Figure 3c).
There is an evident and noteworthy pattern in the distribution of hydrocarbon fill within the basin. Specifically, the fields situated in the central region of the basin predominantly contain natural gas, whereas the accumulations towards the periphery of the basin contain crude oil. It is noteworthy that the oil accumulations near the basin’s edges are also positioned at higher elevations, prompting the inquiry of whether the oil has migrated away from the reservoirs, which are now gas-filled, and what role fault seals may have played during that process. A hydrocarbon migration model, including the sealing capacity of the faults, which appear to play a pivotal role in governing fluid migration within the study area, is thus needed to improve the understanding of the system and to be able to predict potential undiscovered hydrocarbon accumulations.

3. Data and Methods

3.1. Data

In this study, high-quality 3D data were utilized to analyze seven prominent basin-wide seismic reflection interfaces (T20, T40, T50, T60, T70, T80, and Tg, as shown in Figure 2) to identify and interpret the fault geometry. The time-depth conversion function used was derived from check shot data. A total of 32 wells with comprehensive logging data were gathered to assess the shale volume on the hanging wall and/or footwall of the faults. Additionally, three representative hydrocarbon reservoir profiles and hydrocarbon-water contact data from Field A, Field B, and Field C were collected. All of the aforementioned data were provided by Zhanjiang Oil Company Ltd., Zhanjiang, China, a subsidiary of the China National Offshore Oil Corporation (CNOOC), Beijing, China. Stress field data, including the magnitudes of Sv (27.1 MPa/km), SHmax (22.6 MPa/km), Shmin (18.5 MPa/km), and the azimuth of SHmax (120°), were obtained from published regional literature [59,60] and density logs (Sv).

3.2. Methods

Ten faults identified as potentially controlling fluid migration from the basin center to the southern horst were analyzed in terms of their geometry, activity history, and sealing capacity. The geometry of these faults was examined to understand their orientation, dip, and scale, which provides insights into the structural framework and connectivity between different reservoir units. The fault activity history was investigated to determine the timing of the fault movement and any associated tectonic events that may have influenced fluid migration patterns. Furthermore, the sealing capacity of these faults was evaluated. This involved assessing their ability to inhibit or prevent fluid migration across fault planes, as an understanding of the sealing capacity of these faults is crucial for assessing the potential for hydrocarbon accumulation and the effectiveness of fault barriers in controlling fluid migration pathways.

3.2.1. Evaluation of Fault Rock Seals

To assess the lateral sealing capacity of faults in sand-shale sequences, the focus was on the low-permeability of the fault gouge within the fault zones. The Shale Gouge Ratio (SGR) algorithm is commonly used to predict the type and distribution of the fault gouge along the fault surface [27,36,45]. Note that the composition of shale or mudstone sequences is difficult to predict, and different clay minerals usually present a similar physical property compared to sandstones, so this algorithm only considers the content of clay within the fault zone. The SGR value was calculated using Equation (1):
S G R = Σ s h a l e   b e d   t h i c k n e s s t h r o w × 100 %
The SGR value serves as a proxy for the fault sealing capacity, but it needs to be calibrated to establish a link with the actual sealing capacity. There are two common calibration methods. The first involves conducting laboratory experiments to determine the capillary threshold pressure of fault rock samples [38]. But this method needs a large number of fault rock samples, which is difficult to implement especially in offshore explorations. The second empirical method utilizes empirical pressure data from the strata on both the hanging wall and footwall of the sealing fault from a worldwide filed dataset to calculate the across-fault pressure difference (AFDP) or capillary threshold pressure (Pc) and relate it to the SGR [39,61]:
A F P D = 10 ( S G R 27 C )
where the unit of AFPD is bar; when the burial depth is less than 3.0 km, C is 0.5; when the burial depth between 3.0 and 3.5 km, C is 0.25; when the burial depth is greater than 3.5 km, C is 0.
P c = 0.3 × S G R 6
when the burial depth is less than 3 km.
P c = 0.15 × S G R + 1.9
when the burial depth is more than 3.5 km.
It is important to note that when using this method, it is necessary to define the lower limit of the SGR, which indicates the threshold at which hydrocarbons can be sealed. Otherwise, even if the SGR value is very low, it could still be calculated as a positive value, leading to the sealing of a certain column height of hydrocarbons. The buoyancy pressure generated by the hydrocarbon column can be treated as equivalent to the AFPD or capillary threshold pressure. However, further charging will result in the buoyancy pressure exceeding the capillary threshold pressure, leading to leakage. The height of the supported hydrocarbon column can be calculated using Equation (5):
H = P c ρ w ρ h g
where H represents the height of the hydrocarbon column (m), Pc is the capillary threshold pressure of the fault rock (MPa), ρw is the density of pore water (kg/m3), ρh is the density of hydrocarbons (kg/m3), and g is the acceleration due to gravity (m/s2). We assume an oil density between 750 kg/m3 [62], a gas density of 150 kg/m3, and a formation water density of 1035 kg/m3.

3.2.2. Evaluation of Fault Stability

Geomechanical analyses using the slip tendency and fracture stability approaches were carried out to evaluate fault stability and the risk of vertical fluid flow. Slip tendency (Ts) is a method used to quickly assess the relative likelihood of a fault surface experiencing slip under the current effective stress field. It is determined by the ratio of the resolved shear stress (τ) to resolved normal stress (σn) acting on the fault surface [63]. The slip tendency is expressed as follows:
T s = τ σ n
If Ts is equal to or greater than the coefficient of static friction (µs), which is typically assumed to be 0.6 [64,65], it indicates that slip is more likely to occur on the fault surface. The slip tendency method does not explicitly require the input of fault properties for modeling, but rather relies on the assumption of a friction coefficient. On the other hand, fracture stability (Fs) refers to the increase in pore pressure necessary to reduce the effective stresses to a point where a fault plane experiences shear, tensile, or hybrid failure [66]. Modeling fracture stability requires the consideration of failure envelopes, which necessitates the input of known rock properties, such as cohesion and the angle of internal friction. This approach explicitly requires the knowledge of the fault rock composition for accurate modeling. Both of fault lateral and vertical sealing analyses were conducted with the TrapTester® 7.2 software.

4. Results

In the following, the properties of the faults identified as potentially controlling fluid migration from the basin center to the southern uplift are presented, starting from the basin center to the horst located in the southern part.

4.1. Hydrocarbon Sealing Faults (F1–F6)

4.1.1. Fault Structure

Field A

The east-west trending and northward dipping F1 fault acts as the sealing fault for the northern part of Field A. In cross-section, the fault is steeply dipping, significantly offsets horizons and cuts downwards into the Late Eocene Wenchang Formation, and extends upwards to the Late Miocene Yuehai Formation. The F2 exhibits a similar geometry to the F1 fault, with a near east-west trend and northward dip, and serves as the sealing fault for the southern part of Field A (Figure 4). The F2 normal fault has a gentler dip angle and is of a smaller scale compared to the F1 fault. It cuts downwards into the Wenchang Formation and extends upwards to the first member of the Early Miocene Zhujiang Formation (N1z1).

Field B

Field B is bounded by the F3 and F4 faults. The F3 fault trends northwest and dips northeast, while the F4 fault is near east-west trending and dips southward. In the cross-section, both the F3 and F4 faults exhibit a listric geometry with relatively gentle dip angles (Figure 4). The F4 fault is located at a greater depth compared to the F3 fault, which cuts downwards into the Wenchang Formation and extends upwards to the second member of the Zhujiang Formation (N1z2). The F3 fault offsets a small upper segment of the F4 fault. The F4 fault can cut downwards into the Enping Formation and extend upwards to the bottom of the Yuehai Formation.

Field C

In Field C, the F5 and F6 faults act as the main sealing faults, dividing the oil field into several segments. The F5 fault trends northwest and dips northeast, while the F6 fault is near east-west trending and dips northward. In the cross-section, both the F5 and F6 faults exhibit a listric geometry with relatively gentle dip angles. The fault scale of the F5 is smaller than that of the F6. The F5 fault cuts downwards into the Enping Formation and extends upwards to the N1z1 strata, while the F6 fault cuts deeply into the Wenchang Formation and can extend upwards to the Hanjiang Formation.

4.1.2. Faulting History

The hydrocarbon-bounded faults F1–F6 exhibit a general trend of strong faulting activity during faulting initiation followed by a gradual weakening over time (Figure 5). Most faulting occurred during the Late Oligocene (E3z sequence) and the Early Miocene (N1z2 sequence) post-rifting stage, with only limited faulting occurring after the Middle Miocene. The F1 fault began its activity during the Early Oligocene (E3e sequence) when it displayed the highest displacement rate, approximately 60 m/Ma. From the Late Oligocene (E3z sequence) onwards, the displacement rate of the fault rapidly reduced to around 20 m/Ma, maintaining a relatively stable level of activity until the Late Miocene (N1y sequence). Similarly, the F2 fault also initiated its activity during the Early Oligocene, but with a relatively weaker displacement rate of no more than 20 m/Ma. It maintained a relatively stable level of activity until the Early Miocene, including the deposition of the N1z1 and N1z2 sequences. However, after the deposition of the N1z1 sequence (18.3–16 Ma), the displacement rate of the F2 fault rapidly decreased and eventually ceased. The F3 fault began its activity in the Late Oligocene, exhibiting very low displacement rates generally not exceeding 10 m/Ma. It stopped being active after the Middle Miocene (N1h sequence). The F4 fault followed a pattern of early activity starting in the Early Oligocene and ceasing during the deposition of the N1z2 sequence (23–18.3 Ma). Its displacement rate ranged between 20 and 30 m/Ma. The F5 fault was active from the Late Oligocene to the Early Miocene, but with a very low displacement rate. On the other hand, the F6 fault remained active for a significant duration, initiating its activity in the Oligocene and persisting until the Middle Miocene. The fault displacement rate of the F6 fault was generally very low, except during the deposition of the N1z1 sequence.

4.1.3. Fault-Sealing Capacity

To assess the capillary sealing capacity of the faults F1–F6, the SGR (Shale Gouge Ratio) values were calculated (Figure 6). The SGR values provide an indication of the sealing potential of the fault surfaces. In general, the F1, F2, and F3 faults exhibit relatively weak heterogeneities in the SGR distribution along their surfaces. The majority of these fault surfaces have SGR values between 35 and 50%, with some smaller sections ranging between 25 and 35% or even exceeding 50% (Figure 6a–c). This suggests that the capillary sealing capacity of these faults may be relatively consistent along their surfaces. In contrast, the F5 fault displays stronger heterogeneities in the SGR distribution along its surface. The upper part of the fault, between the T60 and T61 interfaces (on the footwall side), and a narrow section along the T62 interface (on the footwall side) exhibit low SGR values. However, other parts of the F5 fault surface show high SGR values (Figure 6d). This indicates that the sealing capacity of the F5 fault may vary along its surface, with certain sections potentially having better capillary sealing properties than others.
The calculated maximum column heights for both Reservoir I and II, determined using the SGR-capillary pressure relationships proposed by Bretan et al. [39] and Yielding [61] (Equations (3)–(5)), reveal a congruence with the measured column heights, as indicated in Table 1. Notably, the measured column heights generally align closely with the upper limits of column heights projected by the Bretan et al. [39] algorithm, constituting approximately 50% of the predicted values on average (Table 1). Remarkably, even SGR values as modest as 15.8 are shown to sustain significant oil column heights, notably up to 55.8 m (Figure 7). Conversely, the lowest observed SGR value that accommodates gas columns is 25, corresponding to a column height of 17.4 m. Note that for higher (>30) SGR values, supported column heights seem to vary drastically. These findings underscore the potential of fault sections in the study area with SGR values exceeding 15 to serve as effective hydrocarbon seals, while fault sections with SGR values lower than 15 serve as hydrocarbon leakage pathways. This further supports the notion that certain fault segments, characterized by SGR values beyond the threshold, can effectively contain hydrocarbon migration.

4.1.4. Fault Stability Analysis

Under a given stress field, the stress of a fault is determined based on its dip angle and strike, which in turn determines the stability of the fault. In general, faults with a low dip angle and near orthogonal to the direction of SHmax have a high normal stress and are relatively stable, and vice versa. Geomechanical analyses of faults F1, F2, F3, and F5 indicate that all four faults are stable under the present-day in situ stresses. Pore pressures within the fault rocks would need to be increased between 5.2 MPa (F5) and 8.8 MPa (F8) to force the faults into failure (Figure 8) as the faults have slip tendency values well below 0.6 (Figure 9). This indicates that the risk of vertical leakage due to fault reactivation is low and that fault stability is not controlling hydrocarbon column heights in the fault-bound traps.

4.2. Potentially Hydrocarbon Supporting Faults (F7–F10)

4.2.1. Fault Structure

In contrast to faults F1–F6, faults F7–F10 are situated in proximity to the basin boundary Zhu Ⅲ South Fault and are closely related to it. The F7 fault predominantly trends in a northeast direction and dips northwest, forming a segmented fault pattern in the plan view (Figure 1c). In the cross-section, it appears as a steeply dipping planar fault with a limited scale, extending downward into the Enping Formation and upward into the N1z2 strata.
In contrast, the F8 fault is oriented near east-west and dips to the north. Vertically, it assumes a slightly listric fault shape with a steep dip angle and features a relatively larger fault scale. This fault cuts downward into the Enping Formation and has the potential to extend upward into the Hangjiang Formation.
Faults F9 and F10 share a similar geometry, both trending near parallel in a northeast-east direction and dipping northwest. In the cross-section, both faults exhibit a small-scale planar fault configuration with a relatively gentle dip angle. These faults cut downward into the Zhuhai Formation and are truncated upward by the T60 seismic reflection interface.

4.2.2. Faulting History

In contrast to the hydrocarbon-bounded faults F1–F6, faults F7–F10 exhibit a comparatively shorter active duration and lower displacement rate (Figure 5). Specifically, the F7 fault displayed the highest displacement rate, surpassing 40 m/Ma since its activation in the Late Oligocene, and then experienced a slight reduction in the displacement rate during the deposition of the N1z2 sequence before coming to an abrupt halt. Among these faults, F8’s active duration is the most extended. It has been active since the Late Oligocene with a displacement rate of approximately 20 m/Ma. Subsequently, its displacement rate decreased rapidly and maintained a very weak level of activity until the middle Miocene. Both F9 and F10 faults were only active during the Late Oligocene, with displacement rates of 30 m/Ma and 13 m/Ma, respectively.

4.2.3. Fault Sealing Capacity

To explore potential hydrocarbon migration pathways and identify prospective areas for hydrocarbon accumulation in the study region, it is imperative to initially assess the lateral sealing capacity of faults F7–F10. This evaluation aims to ascertain which faults could serve as conduits for hydrocarbon fluids to cross and access fault array traps. Subsequently, for faults exhibiting robust lateral sealing, an assessment of their vertical sealing capacity is essential to determine the likelihood of hydrocarbon accumulation in the hanging wall traps.
In pursuit of this goal, we conducted SGR calculations for faults F7–F10. It is noteworthy that due to the complexity of seismic reflections, identifying the T61 seismic reflection interface on F7–F10 faults presents challenges. The outcomes of our analysis reveal significant heterogeneity in the SGR distribution along the F7 fault. Specifically, the upper fault segment displays a pattern of either non-sealing (SGR < 15) or moderate (15 < SGR < 25) lateral sealing, whereas the lower fault segment exhibits robust (SGR > 25) lateral sealing (Figure 10a). This observation suggests that the upper segment of F7 could function as a lateral conduit, while the lower segment is likely to act as a barrier to hydrocarbon flow. Conversely, F8 generally exhibits non-sealing behavior along its entire fault surface, except for a moderate lateral sealing capacity in its middle portion (Figure 10b). Consequently, it may be broadly considered a lateral conduit. On the other hand, both F9 and F10 demonstrate a consistent strong lateral sealing capacity along their fault surfaces (Figure 10c,d). This finding implies that both F9 and F10 are poised to act as formidable barriers, preventing the passage of hydrocarbon fluids across these fault zones.

4.2.4. Fault Stability Analysis

The vertical sealing capacity of faults F7, F9, and F10 was evaluated using slip tendency and fracture stability. Slip tendency analysis indicates that the majority of F7 exhibits values lower than 0.2, signifying a substantial margin of safety from failure (Figure 11). F9 and F10 display a similar slip tendency pattern, with roughly half of these faults experiencing moderate stress (0.3 < Ts < 0.5), while the other half remains significantly distant from failure (Ts < 0.2) (Figure 11).
In the context of fracture stability calculations, we employed low-friction fault rock parameters (cohesion C = 0.5 MPa; coefficient of internal friction μ = 0.45) to estimate the fracture stability for the mentioned faults. The outcomes reveal notable differences in pore pressure increasing requirements to induce failure. Specifically, F7 demonstrates a considerably high threshold of 13.8 MPa (Figure 11), whereas F9 and F10 exhibit comparatively moderate pore pressure thresholds of 6.5 MPa and 5.4 MPa, respectively (Figure 11).
By synthesizing the results from slip tendency and fracture stability analyses, it becomes evident that F7 remains in a stable stress state with a robust vertical sealing capacity. Conversely, F9 and F10 exhibit moderate levels of stable stress, translating to a moderate vertical sealing capacity within these faults.
Figure 11. Stereoplots illustrating the slip tendency and Mohr diagrams illustrating the fracture stability for F7, F9, and F10. Black arrows show the increase in pore pressure needed to force the fault into failure.
Applsci 14 01712 g011

5. Discussion

5.1. Role of Faults for Fluid Migration in the Wenchang A Subbasin

Hydrocarbon fluid flow within the Wenchang A subbasin is strongly linked to faults acting as both fluid pathways and flow baffles, with the hydrocarbon charge of fault-sealed reservoirs occurring along faults that cut into the deeply buried source rocks (e.g., F2, F4, F6).
The maturity of source rocks within the basin varies from post-mature (Ro 2.0–2.2%) in the central basin to mature (Ro 1.0–1.6%) close to the southern basin boundary fault, with hydrocarbon expulsion having been estimated to have primarily occurred between 26.5 and 16 Ma in the central basin and since the N1Z2 post-rift sequence (23–18.3 Ma) in the studied fault blocks [57]. During early hydrocarbon (oil) expulsion in the central part of the basin, the caprocks that form an integral part of today’s traps had not yet formed [67], leading to a loss of these early hydrocarbons. During later hydrocarbon expulsion, gas in the very mature central areas of the basin and oil in the areas with a lower vitrinite reflectance migrated vertically parallel to the fault and along permeable pathways in the fault damage zones of deeply seated faults, such as F2, F4, and F6. Note that the faults were seismically active during the hydrocarbon migration, which may have enhanced the permeability in the fault damage zone fracture networks as they were close to critically or critically stressed [20,68,69,70,71,72,73]. Hydrocarbon flow entered permeable reservoirs, which are capped by mudstones forming the top-seals. The period of fault active and charging was followed by a long structural quiescence from the Middle Miocene onwards and without reactivation of these hydrocarbon sealing faults. Faults located up dip have fault rock seals and form lateral flow barriers, leading to hydrocarbon accumulations. While these sealing faults may have been geomechanically unstable during the initial hydrocarbon migration, they are currently in stable conditions, and there are no indications for previous leakage from the reservoirs. The traps are all presently not filled to spill, and fault seal predictions using the Bretan et al. [39] algorithm suggest that the fault seals can support higher column heights.
Previous studies conducted in various rift basins located offshore China, such as the Zhu I subbasin of the PRMB [74], the Xihu subbasin of the East China Sea Shelf Basin [10], and the Qinan area [27,46], Tangbei area [75], and Bozhong subbasin of the Bohai Bay Basin [76], have indicated similar hydrocarbon migration and accumulation patterns controlled by fault seals, albeit with some differences. Besides China, the North Sea also exhibits a pattern of hydrocarbon migration, accumulation, and distribution under the control of fault sealing [21,23,42]. In all of these cases, it has been demonstrated that the sealing capacity of fault rocks directly influences whether faults act as conduits or barriers for the flow of hydrocarbons, thereby impacting the distribution of hydrocarbons. However, what sets our study apart is the unique phase configuration of hydrocarbons resulting from variations in source rock maturity and distribution, with gas generated from the basin center and oil generated from the slope/border of the basin.

5.2. Implications for Prospect Analysis in the Study Area

Based on our understanding of the relationship between SGR values and the lateral sealing capacity of faults, combined with the model of hydrocarbon migration and accumulation in the fault array traps described above, we can try to predict potentially undiscovered accumulations (Figure 12).
Hydrocarbons from the mature source rocks towards the basin edge continue to expell oil, which migrates vertically along permeable fault zones (F6–F10) and flows into permeable reservoir intervalls, where the presence of fault seals is crucial for the formation of hydrocarbon accumulations.
In this context, F8 exhibits weaker lateral fault sealing, allowing hydrocarbons to directly cross it and enter traps that are bounded by the basin boundary fault. This process can lead to hydrocarbon accumulation across the entire Zhuhai Formation reservoirs (Figure 12). In contrast, F7 demonstrates robust lateral sealing in its lower segment but weaker sealing in the upper portion. Its vertical sealing capacity is robust and far from failure. Consequently, hydrocarbons accumulate in the hanging wall trap of the E3z3 sequence (aligned with the lower fault segment), while in the E3z1 and E3z2 sequences (corresponding to the upper fault segment), hydrocarbon flow laterally permeates the fault zone and infiltrates the fault compartment bounded by the basin boundary fault (Figure 12).
Regarding F9 and F10, both exhibit pronounced lateral sealing and moderate vertical sealing. Importantly, F9 is positioned predominantly in front of F10 in terms of the hydrocarbon flow path. It acts as a lateral barrier, implying that hydrocarbons must breach the lateral sealing limit to access the fault array traps in front of or even behind F10. Considering the robust lateral sealing of F9 and F10, the highest likelihood for hydrocarbon accumulation exists in the hanging wall trap within the entire Zhuhai Formation of F9 (Figure 12).
Interestingly, hydrocarbon accumulations found on the Shenhu Uplift (see Figure 1b for locations) host oil, which is thought to have formed in the Wenchang A basin based on compositional analyses [67]. This would indicate that migration pathways through the studied fault block array, as well as through the basin boundary fault (Zhu III South Fault), exist. Note the potential limitations of this study, as the conceptual model of hydrocarbon migration and accumulation only considered the fault sealing capacity and the maturity and distribution of source rocks. Further related oil-source correlation and petroleum geochemistry research will improve this study.

6. Conclusions

In this study, the control of fault seals on basin-scale hydrocarbon migration and accumulations in the south western Pearl River Mouth Basin (PRMB) was illustrated. It has been shown that the primary hydrocarbon reservoirs within the southern Wenchang A subbasin are associated with fault-bounded structures, predominantly accumulating in the Oligocene Zhuhai Formation. The major faults of the study area, faults F1–F10, displayed their main activity during the deposition of the Late Oligocene E3z and Early Miocene N1z sequences, ceasing after the N1h sequence. However, the major hydrocarbon charging phase in the area was initiated around the middle Oligocene and has continued up to the present, coinciding with the faulting activity.
The assessment of the lateral sealing capacity of the key sealing faults (F1, F2, F3, and F5) reveals the following patterns: F1–F3 exhibit high SGR values with relatively uniform distributions along their fault surfaces, whereas F5 demonstrates more variable SGR values across its surface. A correlation between SGR values and hydrocarbon distribution has been established, with most hydrocarbon-bearing layers displaying SGR values at or exceeding 20%. Notably, the lower limit of SGR that supports hydrocarbon columns in this study is at 15.8%, indicating that significant cementation might have occurred within the major sealing faults.
An evaluation of the fault sealing characteristics of the bounding faults (F7–F10) in potential fault array traps yields the following insights: for fault lateral sealing, the upper segments of F7 and F8 act as lateral conduits, while the lower segments of F7, F9, and F10 function as lateral barriers. Regarding fault vertical sealing, F7 demonstrates robust vertical sealing capacity, while F9 and F10 exhibit moderate vertical sealing capabilities. Consequently, hydrocarbons are anticipated to directly traverse the upper segments of F7 and F8, accumulating in the fault array traps positioned behind these faults. Conversely, the lower portions of F7 and F9 hinder further hydrocarbon migration, leading to accumulation in the hanging wall traps associated with these two faults.

Author Contributions

Conceptualization: B.X.; writing—original draft preparation: B.X.; writing—review and editing: J.M.M.; project administration: Z.W.; Supervision: J.M.M., Y.C. (Yanjun Cheng) and Z.W.; Software: B.X., L.X. and S.M.; Visualization: B.X., W.S. and Y.C. (Yichen Chu). All authors have read and agreed to the published version of the manuscript.

Funding

This research was funded by the China Scholarship Council (Projected number 202106450037).

Institutional Review Board Statement

Not applicable.

Informed Consent Statement

Not applicable.

Data Availability Statement

The data, figures, and tables used to support the findings of this study are included in the article.

Acknowledgments

We thank the Zhanjiang Oil Company Ltd., CNOOC, for providing seismic data, well data, and a relevant research platform for this study.

Conflicts of Interest

The authors declare that they have no known competing financial interests or personal relationships that could have appeared to influence the work reported in this paper.

References

  1. Gibson, R.G. Fault-zone seals in siliciclastic strata of the Columbus basin, offshore Trinidad. AAPG Bull. 1994, 78, 1372–1385. [Google Scholar]
  2. Caine, J.S.; Evans, J.P.; Forster, C.B. Fault zone architecture and permeability structure. Geology 1996, 24, 1025–1028. [Google Scholar] [CrossRef]
  3. Knipe, R.J. Juxtaposition and seal diagrams to help analyze fault seals in hydrocarbon reservoirs. AAPG Bull. 1997, 81, 187–195. [Google Scholar]
  4. Molli, G.; Cortecci, G.; Vaselli, L.; Ottria, G.; Cortopassi, A.; Dinelli, E.; Mussi, M.; Barbieri, M. Fault zone structure and fluid-rock interaction of a high angle normal fault in Carrara Marble (NW Tuscany, Italy). J. Struct. Geol. 2010, 32, 1334–1348. [Google Scholar] [CrossRef]
  5. Pei, Y.W.; Paton, D.A.; Knipe, R.J.; Wu, K.Y. A review of fault sealing behaviour and its evaluation in siliciclastic rocks. Earth Sci. Rev. 2015, 150, 121–138. [Google Scholar] [CrossRef]
  6. Williams, R.T.; Goodwin, L.B.; Mozley, P.S.; Beard, B.L.; Johnson, C.M. Tectonic controls on fault zone flow pathways in the Rio Grande Rift, New Mexico, USA. Geology 2015, 43, 723–726. [Google Scholar] [CrossRef]
  7. Magee, C.; Duffy, O.B.; Purnell, K.; Bell, R.E.; Jackson, C.A.L.; Reeve, M.T. Fault-controlled fluid flow inferred from hydrothermal vents imaged in 3d seismic reflection data, offshore NW Australia. Basin Res. 2016, 28, 299–318. [Google Scholar] [CrossRef]
  8. Cooke, A.P.; Fisher, Q.J.; Michie, E.A.H.; Yielding, G. Investigating the controls on fault rock distribution in normal faulted shallow burial limestones, Malta, and the implications for fluid flow. J. Struct. Geol. 2018, 114, 22–42. [Google Scholar] [CrossRef]
  9. Xie, L.J.; Pei, Y.W.; Li, A.R.; Wu, K.Y. Implications of meso- to micro-scale deformation for fault sealing capacity: Insights from the Lenghu5 fold-and-thrust belt, Qaidam Basin, NE Tibetan Plateau. J. Asian Earth Sci. 2018, 158, 336–351. [Google Scholar] [CrossRef]
  10. Wang, F.W.; Chen, D.X.; Du, W.L.; Zeng, J.H.; Wang, Q.C.; Tian, Z.Y.; Chang, S.Y.; Jiang, M.Y. Improved method for quantitative evaluation of fault vertical sealing: A case study from the eastern Pinghu Slope Belt of the Xihu Depression, East China Sea Shelf Basin. Mar. Pet. Geol. 2021, 132, 105224. [Google Scholar] [CrossRef]
  11. Beaudoin, N.E.; Lacombe, O.; Hoareau, G.; Callot, J.P. How the geochemistry of syn-kinematic calcite cement depicts past fluid flow and assists structural interpretations: A review of concepts and applications in orogenic forelands. Geol. Mag. 2022, 159, 2157–2190. [Google Scholar] [CrossRef]
  12. Lacroix, B.; Travé, A.; Buatier, M.; Labaume, P.; Vennemann, T.; Dubois, M. Syntectonic fluid-flow along thrust faults: Example of the south-pyrenean fold-and-thrust belt. Mar. Pet. Geol. 2014, 49, 84–98. [Google Scholar] [CrossRef]
  13. Curzi, M.; Aldega, L.; Bernasconi, S.M.; Berra, F.; Billi, A.; Boschi, C.; Franchini, S.; Van der Lelij, R.; Viola, G.; Carminati, E. Architecture and evolution of an extensionally-inverted thrust (mt. Tancia thrust, central apennines): Geological, structural, geochemical, and k–ar geochronological constraints. J. Struct. Geol. 2020, 136, 104059. [Google Scholar] [CrossRef]
  14. Vignaroli, G.; Rossetti, F.; Petracchini, L.; Argante, V.; Bernasconi, S.M.; Brilli, M.; Giustini, F.; Yu, T.; Shen, C.; Soligo, M. Middle pleistocene fluid infiltration with 10–15 ka recurrence within the seismic cycle of the active monte morrone fault system (Central Apennines, Italy). Tectonophysics 2022, 827, 229269. [Google Scholar] [CrossRef]
  15. Smeraglia, L.; Berra, F.; Billi, A.; Boschi, C.; Carminati, E.; Doglioni, C. Origin and role of fluids involved in the seismic cycle of extensional faults in carbonate rocks. Earth Planet. Sci. Lett. 2016, 450, 292–305. [Google Scholar] [CrossRef]
  16. Smeraglia, L.; Bernasconi, S.; Manniello, C.; Spanos, D.; Pagoulatos, A.; Aldega, L.; Kylander-Clark, A.; Jaggi, M.; Agosta, F. Regional scale, fault-related fluid circulation in the ionian zone of the external hellenides fold-and-thrust belt, western greece; Clues for fluid flow in fractured carbonate reservoirs. Tectonics 2023, 42, e2023TC007867. [Google Scholar] [CrossRef]
  17. Smeraglia, L.; Fabbi, S.; Maffucci, R.; Albanesi, L.; Carminati, E.; Billi, A.; Cavinato, G.P. The role of post-orogenic normal faulting in hydrocarbon migration in fold-and-thrust belts: Insights from the central apennines, Italy. Mar. Pet. Geol. 2022, 136, 105429. [Google Scholar] [CrossRef]
  18. Smeraglia, L.; Bernasconi, S.M.; Berra, F.; Billi, A.; Boschi, C.; Caracausi, A.; Carminati, E.; Castorina, F.; Doglioni, C.; Italiano, F.; et al. Crustal-scale fluid circulation and co-seismic shallow comb-veining along the longest normal fault of the central apennines, Italy. Earth Planet. Sci. Lett. 2018, 498, 152–168. [Google Scholar] [CrossRef]
  19. Sibson, R.H.; Moore, J.M.; Rankin, A.H. Seismic pumping; A hydrothermal fluid transport mechanism. J. Geol. Soc. 1975, 131, 653–659. [Google Scholar] [CrossRef]
  20. Hooper, E.D.C. Fluid migration along growth faults in compacting sediments. J. Pet. Geol. 1991, 2, 161–180. [Google Scholar] [CrossRef]
  21. Fisher, Q.J.; Knipe, R.J. The permeability of faults within siliciclastic petroleum reservoirs of the North Sea and Norwegian Continental Shelf. Mar. Pet. Geol. 2001, 18, 1063–1081. [Google Scholar] [CrossRef]
  22. Fisher, Q.J.; Jolley, S.J. Treatment of faults in production simulation models. Geol. Soc. Lond. Spec. Publ. 2007, 292, 219–233. [Google Scholar] [CrossRef]
  23. Jolley, S.J.; Dijk, H.; Lamens, J.H.; Fisher, Q.J.; Manzocchi, T.; Eikmans, H.; Huang, Y. Faulting and fault sealing in production simulation models; Brent Province, northern North Sea. Petrol. Geosci. 2007, 13, 321–340. [Google Scholar] [CrossRef]
  24. Manzocchi, T.; Childs, C. Quantification of hydrodynamic effects on capillary seal capacity. Petrol. Geosci. 2013, 19, 105–121. [Google Scholar] [CrossRef]
  25. Hao, F.; Zhu, W.; Zou, H.; Li, P. Factors controlling petroleum accumulation and leakage in overpressured reservoirs. AAPG Bull. 2015, 99, 831–858. [Google Scholar] [CrossRef]
  26. Zhang, L.K.; Luo, X.R.; Liao, Q.J.; Yang, W.; Vasseur, G.; Yu, C.H.; Su, J.Q.; Yuan, S.Q.; Xiao, D.Q.; Wang, Z.M. Quantitative evaluation of synsedimentary fault opening and sealing properties using hydrocarbon connection probability assessment. AAPG Bull. 2010, 94, 1379–1399. [Google Scholar] [CrossRef]
  27. Song, X.Q.; Wang, H.X.; Fu, X.F.; Meng, L.D.; Sun, Y.H.; Liu, Z.D.; Du, R.S. Hydrocarbon retention and leakage in traps bounded by active faults: A case study from traps along the NDG fault in the Qinan area, Bohai Bay Basin, China. J. Pet. Sci. Eng. 2022, 208, 109344. [Google Scholar] [CrossRef]
  28. Vrolijk, P.J.; Urai, J.L.; Kettermann, M. Clay smear: Review of mechanisms and applications. J. Struct. Geol. 2016, 86, 95–152. [Google Scholar] [CrossRef]
  29. Smith, D.A. Theoretical considerations of sealing and non-sealing faults. AAPG Bull. 1966, 50, 363–374. [Google Scholar]
  30. Smith, D.A. Sealing and nonsealing faults in louisiana gulf coast salt basin. AAPG Bull. 1980, 64, 145–172. [Google Scholar]
  31. Watts, N.L. Theoretical aspects of cap-rock and fault seals for single- and two-phase hydrocarbon columns. Mar. Pet. Geol. 1987, 4, 274–307. [Google Scholar] [CrossRef]
  32. Allan, U.S. Model for hydrocarbon migration and entrapment within faulted structures. AAPG Bull. 1989, 73, 803–811. [Google Scholar]
  33. Bouvier, J.D.; Kaars-Sijpesteijn, C.H.; Kluesner, D.F.; Onyejekwe, C.C.; Van Der Pal, R.C. Three-dimensional seismic interpretation and fault sealing investigations, Nun River Field, Nigeria. AAPG Bull. 1989, 73, 1397–1414. [Google Scholar]
  34. Knipe, R.J.; Larsen, R.M.; Brekke, H.; Larsen, B.T.; Talleraas, E. Faulting processes and fault seal. In Structural and Tectonic Modelling and Its Application to Petroleum Geology, Proceedings of the Norwegian Petroleum Society Workshop, Stavanger, Norway, 18–20 October 1989; Elsevier: Amsterdam, The Netherlands, 1992; Volume 1, pp. 325–342. [Google Scholar]
  35. Lindsay, N.G.; Murphy, F.C.; Walsh, J.J.; Watterson, J.; Flint, S.S.; Bryant, I.D. Outcrop studies of shale smears on fault surfaces. Geol. Model. Hydrocarb. Reserv. 1993, 15, 113–123. [Google Scholar]
  36. Yielding, G.; Freeman, B.; Needham, D.T. Quantitative fault seal prediction. AAPG Bull. 1997, 81, 897–917. [Google Scholar]
  37. Fisher, Q.J.; Knipe, R.J. Fault sealing processes in siliciclastic sediments. Geol. Soc. Lond. Spec. Publ. 1998, 147, 117–134. [Google Scholar] [CrossRef]
  38. Sperrevik, S.; Gillespie, P.A.; Fisher, Q.J.; Halvorsen, T.; Knipe, R.J.; Norwegian, P.S.; Koestler, A.G.; Hunsdale, R. Empirical estimation of fault rock properties. In Norwegian Petroleum Society Special Publications, Proceedings of the Norwegian Petroleum Society Conference, Stavanger, Norway, 16–18 October 2000; Hydrocarbon Seal Quantification; Elsevier: Amsterdam, The Netherlands, 2002; Volume 11, pp. 109–125. [Google Scholar]
  39. Bretan, P.; Yielding, G.; Jones, H. Using calibrated shale gouge ratio to estimate hydrocarbon column heights. AAPG Bull. 2003, 87, 397–413. [Google Scholar] [CrossRef]
  40. Childs, C.; Walsh, J.J.; Manzocchi, T.; Strand, J.; Nicol, A.; Tomasso, M.; Schöpfer, M.P.J.; Aplin, A.C. Definition of a fault permeability predictor from outcrop studies of a faulted turbidite sequence, Taranaki, New Zealand. Geol. Soc. Lond. Spec. Publ. 2007, 292, 235–258. [Google Scholar] [CrossRef]
  41. Fossen, H.; Schultz, R.A.; Shipton, Z.K.; Mair, K. Deformation bands in sandstone; A review. J. Geol. Soc. 2007, 164, 755–769. [Google Scholar] [CrossRef]
  42. Childs, C.; Sylta, Ø.; Moriya, S.; Morewood, N.; Manzocchi, T.; Walsh, J.J.; Hermanssen, D. Calibrating fault seal using a hydrocarbon migration model of the Oseberg Syd Area, Viking Graben. Mar. Pet. Geol. 2009, 26, 764–774. [Google Scholar] [CrossRef]
  43. Eichhubl, P.; Davatzes, N.C.; Becker, S.P. Structural and diagenetic control of fluid migration and cementation along the Moab fault, Utah. AAPG Bull. 2009, 93, 653–681. [Google Scholar] [CrossRef]
  44. Fisher, Q.J.; Harris, S.D.; McAllister, E.; Knipe, R.J.; Bolton, A.J. Hydrocarbon flow across faults by capillary leakage revisited. Mar. Pet. Geol. 2001, 18, 251–271. [Google Scholar] [CrossRef]
  45. Yielding, G.; Bretan, P.; Freeman, B.; Jolley, S.J.; Fisher, Q.J.; Ainsworth, R.B.; Vrolijk, P.J.; Delisle, S. Fault seal calibration; A brief review. Geol. Soc. Spec. Publ. 2010, 347, 243–255. [Google Scholar] [CrossRef]
  46. Song, X.Q.; Meng, L.D.; Fu, X.F.; Wang, H.X.; Sun, Y.H.; Jiang, W.Y. Sealing capacity evolution of trap-bounding faults in sand-clay sequences: Insights from present and paleo-oil entrapment in fault-bounded traps in the Qinan area, Bohai Bay Basin, China. Mar. Pet. Geol. 2020, 122, 104680. [Google Scholar] [CrossRef]
  47. Karolytė, R.; Johnson, G.; Yielding, G.; Gilfillan, S.M.V. Fault seal modelling—The influence of fluid properties on fault sealing capacity in hydrocarbon and CO2 systems. Petrol. Geosci. 2020, 26, 481–497. [Google Scholar] [CrossRef]
  48. Jia, B.; Xian, C. Permeability measurement of the fracture-matrix system with 3d embedded discrete fracture model. Pet. Sci. 2022, 19, 1757–1765. [Google Scholar] [CrossRef]
  49. Jia, B.; Xian, C.G.; Tsau, J.S.; Zuo, X.; Jia, W.F. Status and outlook of oil filed chemistry-assusted analysis during the energy transition period. Energy Fuels 2022, 36, 12917–12945. [Google Scholar] [CrossRef]
  50. He, Z.; Yin, X.; Jiang, S.; Lei, M.; Liu, Y.; Zhao, R.; Zhu, B. Source rock classification, maturity and their implications in paleoenvironment reconstruction in the Zhu Ⅲ sub-basin, China. J. Pet. Sci. Eng. 2022, 216, 110799. [Google Scholar] [CrossRef]
  51. Xie, G.; Chen, D.; Chang, L.; Li, J.; Yin, Z. Migration and accumulation of crude oils in the Qionghai uplift, Pearl River Mouth Basin, offshore South China Sea. J. Pet. Sci. Eng. 2021, 205, 108943. [Google Scholar] [CrossRef]
  52. Quan, Y.; Hao, F.; Liu, J.; Zhao, D.; Tian, J.; Wang, Z. Source rock deposition controlled by tectonic subsidence and climate in the western Pearl River Mouth Basin, China: Evidence from organic and inorganic geochemistry. Mar. Pet. Geol. 2017, 79, 1–17. [Google Scholar] [CrossRef]
  53. Quan, Y.; Liu, J.; Hao, F.; Bao, X.; Xu, S.; Teng, C.; Wang, Z. Geochemical characteristics and origins of natural gas in the Zhu Ⅲ sub-basin, Pearl River Mouth Basin, China. Mar. Pet. Geol. 2019, 101, 117–131. [Google Scholar] [CrossRef]
  54. Fu, X.Y.; Chen, S.J.; You, J.J.; Li, H.; Lei, M.Z. Geochemical characteristics and sources of crude oil in the Wenchang B depression and the western Qionghai uplift of the Zhu-3 sub-basin, Pearl River Mouth Basin, south China sea. J. Pet. Sci. Eng. 2022, 219, 111091. [Google Scholar] [CrossRef]
  55. Liu, E.T.; Chen, S.; Yan, D.T.; Deng, Y.; Wang, H.; Jing, Z.H.; Pan, S.Q. Detrital zircon geochronology and heavy mineral composition constraints on provenance evolution in the western Pearl River Mouth basin, northern south China sea: A source to sink approach. Mar. Pet. Geol. 2022, 145, 105884. [Google Scholar] [CrossRef]
  56. Li, J.H.; Chen, D.X.; Chang, L.; Xie, G.J.; Shi, X.B.; Wang, F.W.; Liao, W.H.; Wang, Z.Y. Quality, hydrocarbon generation, and expulsion of the Eocene Enping Formation source rocks in the Wenchang Depression, western Pearl River Mouth Basin, South China Sea. Energy Explor. Exploit. 2020, 38, 2169–2198. [Google Scholar] [CrossRef]
  57. Chen, L.; Fan, C.W.; Liu, X.Y.; Li, M.; Lei, M.Z. Hydrocarbon enrichment laws and favorable exploration directions of Wenchang A sag, western Pearl River Mouth Basin. China Offshore Oil Gas 2021, 33, 14–23. [Google Scholar]
  58. Liu, Y.Q.; Wu, Z.P.; Cheng, Y.J.; Wu, K.Q.; He, M.; Zhang, J.; Zhang, M.; Chen, M.M. Spatial and temporal difference of Paleogene rift structure and its controlling factors in the nothern South China Sea: A case study of Pearl River Mouth Baisn. J. China Univ. Min. Technol. 2019, 48, 367–376. [Google Scholar]
  59. Jing, F.; Sheng, Q.; Zhang, Y.H.; Luo, C.W.; Liu, Y.K. Research on distribution rule of shallow crustal geostress in China mainland. Chin. J. Rock Mech. Eng. 2007, 26, 2056–2062. [Google Scholar]
  60. Li, R.B.; Chen, Z.M.; Shi, N.; Liu, B.J.; Liu, H.; Xu, W. Application of high-resolution formation microscanner image logs (FMI) to hydrocarbon exploration in Panyu B sub-sag, Pearl River Mouth Basin and its implications. Mar. Geol. Front. 2020, 36, 64–72. [Google Scholar]
  61. Yielding, G. Using probabilistic shale smear modelling to relate sgr predictions of column height to fault zone heterogeneity. Pet. Geosci. 2012, 18, 33–42. [Google Scholar] [CrossRef]
  62. Nie, F.J.; Li, S.T.; Wang, H.; Xie, X.N.; Wu, K.Q.; Jiang, M.Z. Lateral migration pathways of petroleum in the Zhu Ⅲ subbasin, Pearl River Mouth Basin, South China Sea. Mar. Pet. Geol. 2001, 18, 561–575. [Google Scholar]
  63. Morris, A.; Ferrill, D.A.; Henderson, D.B. Slip-tendency analysis and fault reactivation. Geology 1996, 24, 275–278. [Google Scholar] [CrossRef]
  64. Moeck, I.; Kwiatek, G.; Zimmermann, G. Slip tendency analysis, fault reactivation potential and induced seismicity in a deep geothermal reservoir. J. Struct. Geol. 2009, 31, 1174–1182. [Google Scholar] [CrossRef]
  65. Sibson, R.H. Brittle-failure controls on maximum sustainable overpressure in different tectonic regimes. AAPG Bull. 2003, 87, 901–908. [Google Scholar] [CrossRef]
  66. Handin, J.; Hager, R.V.; Friedman, M.; Feather, J.N. Experimental deformation of sedimentary rocks under confining pressure: Pore pressure tests. AAPG Bull. 1963, 47, 717–755. [Google Scholar]
  67. Quan, Y.B.; Liu, J.Z.; Zhao, D.J.; Hao, F.; Wang, Z.F.; Tian, J.Q. The origin and distribution of crude oil in Zhu III sub-basin, Pearl River Mouth Basin, China. Mar. Pet. Geol. 2015, 66, 732–747. [Google Scholar] [CrossRef]
  68. Barton, C.A.; Zoback, M.D.; Moos, D. Fluid flow along potentially active faults in crystalline rock. Geology 1995, 23, 683–686. [Google Scholar] [CrossRef]
  69. Smeraglia, L.; Fabbi, S.; Billi, A.; Carminati, E.; Cavinato, G.P. How hydrocarbons move along faults: Evidence from microstructural observations of hydrocarbon-bearing carbonate fault rocks. Earth Planet. Sci. Lett. 2022, 584, 117454. [Google Scholar] [CrossRef]
  70. Matthaei, S.K.; Roberts, S.G. The influence of fault permeability on single-phase fluid flow near fault-sand intersections; Results from steady-state high-resolution models of pressure-driven fluid flow. AAPG Bull. 1996, 80, 1763–1779. [Google Scholar]
  71. Moretti, I. The role of faults in hydrocarbon migration. Pet. Geosci. 1998, 4, 81–94. [Google Scholar] [CrossRef]
  72. Haney, M.M.; Snieder, R.; Sheiman, J.; Losh, S. A moving fluid pulse in a fault zone. Nature 2005, 437, 46. [Google Scholar] [CrossRef]
  73. Zhang, Y.; Gartrell, A.; Underschultz, J.R.; Dewhurst, D.N. Numerical modelling of strain localisation and fluid flow during extensional fault reactivation: Implications for hydrocarbon preservation. J. Struct. Geol. 2009, 31, 315–327. [Google Scholar] [CrossRef]
  74. Zhu, W.; Wu, K.; Ke, L.; Chen, K.; Liu, Z. Study on fault-controlled hydrocarbon migration and accumulation process and models in Zhu Ⅰ Depression. Acta Oceanol. Sin. 2021, 40, 107–113. [Google Scholar] [CrossRef]
  75. Xia, S.; Ahmad, N.; Zhang, Z.; Gao, L.; Ji, X.; Zhu, Y. Syn-depositional fault control on hydrocarbon migration and accumulation pattern: A case study from Tangbei Area, Bohai Bay Basin, NE China. Arab. J. Geosci. 2020, 13, 489. [Google Scholar] [CrossRef]
  76. Cong, F.; Zhang, H.; Hao, F.; Xu, S. Direct control of normal fault in hydrocarbon migration and accumulation in northwestern Bozhong subbasin, Bohai Bay Basin, China. Mar. Pet. Geol. 2020, 120, 104555. [Google Scholar] [CrossRef]
Figure 3. Cross-sections through (a) Field A, (b) Field B, and (c) Field C, and (d) an illustration of the vertical hydrocarbon distribution in the southern Wenchang A subbasin. For the locations of the cross-sections, see Figure 1c. Reservoir I and II are the major reservoirs within the Mid-to-Late Oligocene E3z2 and E3z3 sequences.
Applsci 14 01712 g003
Figure 4. Interpreted seismic profiles of the sealing faults F1–F6 and the potential hydrocarbon bounded target faults F7–F10. F1–F10 are indicated in blue. Relative gas reservoirs in red and oil reservoirs in green are shown in the seismic profiles. For the location of profiles, see Figure 3.
Applsci 14 01712 g004
Figure 5. The average dip-slip fault displacement rate of the F1–F10 during different deposition periods in the southern Wenchang A subbasin.
Applsci 14 01712 g005
Figure 6. Figure illustrating the SGR value distribution along the F1 (a), F2 (c), F3, (e) and F5 (g) faults and the associated Allan diagrams for F1 (b), F2 (d), F3 (f), F5 (h). View from the side of the hanging wall. For fault locations, see Figure 3.
Applsci 14 01712 g006
Figure 7. Plot illustrating the relationship between Shale-Gouge-Ratio and column heights for the hydrocarbon sealing faults of the three studied fields. For each fault, the SGR at the structurally highest point is given, as well as the measured and predicted column heights. Note that there is no clear correlation between SGR and column heights.
Applsci 14 01712 g007
Figure 8. Mohr diagrams illustrating the fracture stability for F1 (a), F2 (b), F3 (c), and F5 (d). Black arrows show the increase in pore pressure needed to force the fault into failure.
Applsci 14 01712 g008
Figure 9. Stereoplots illustrating the slip tendency for F1 (a), F2 (b), F3 (c), and F5 (d).
Applsci 14 01712 g009
Figure 10. SGR value distribution along faults F7 (a), F8 (b), F9 (c), and F10 (d). View from the side of hanging wall. See the fault locations in Figure 3.
Applsci 14 01712 g010
Figure 12. Conceptual model of the hydrocarbon migration and accumulation controlled by fault sealing in the southern Wenchang A subbasin.
Applsci 14 01712 g012
Table 1. Table listing the parameters used in the predicted hydrocarbon column height calculations of Field A, Field B, and Field C.
FieldFaultReservoirHydrocarbon TypeHydrocarbon Density (kg/m3)Water Density (kg/m3)SGRCalibration ApproachMax. Supported Column Height (m)Column Height Measured (m)% of Max. Column Height
Field AF1Reservoir IGas150103538.6Bretan et al. (2003) [39]303.9204.567%
Yielding (2012) [61]86.9235%
Field AF1Reservoir IIGas150103534.9Bretan et al. (2003) [39]221.6189.686%
Yielding (2012) [61]80.6235%
Field AF2Reservoir IGas150103534.6Bretan et al. (2003) [39]121.584.670%
Yielding (2012) [61]80.1106%
Field AF2Reservoir IIGas150103534.1Bretan et al. (2003) [39]116.4103.189%
Yielding (2012) [61]79.3130%
Field BF3Reservoir IGas150103525Bretan et al. (2003) [39]53.617.432%
Yielding (2012) [61]63.827%
Field BF3Reservoir IIGas150103535Bretan et al. (2003) [39]125.72923%
Yielding (2012) [61]80.836%
Field CF5Reservoir IOil750103515.8Bretan et al. (2003) [39]75.955.573%
Yielding (2012) [61]149.837%
Field CF5Reservoir IIOil750103519Bretan et al. (2003) [39]99.732.633%
Yielding (2012) [61]166.720%
Disclaimer/Publisher’s Note: The statements, opinions and data contained in all publications are solely those of the individual author(s) and contributor(s) and not of MDPI and/or the editor(s). MDPI and/or the editor(s) disclaim responsibility for any injury to people or property resulting from any ideas, methods, instructions or products referred to in the content.

