Article

Finite-Element Modeling of the Dynamic Behavior of a Crack-like Defect in an Internally Pressurized Thin-Walled Steel Cylinder

by
Nurlan Zhangabay
1,*,
Ulzhan Ibraimova
2,
Marco Bonopera
3,*,
Ulanbator Suleimenov
1,
Konstantin Avramov
4,
Maryna Chernobryvko
4,
Akmaral Utelbayeva
5 and
Borys Uspenskyi
4
1
Department of Architecture and Urban Planning, Mukhtar Auezov South Kazakhstan University, Av. Tauke Khan No. 5, Shymkent 160012, Kazakhstan
2
Department of Industrial Civil and Road Construction, Mukhtar Auezov South Kazakhstan University, Av. Tauke Khan No. 5, Shymkent 160012, Kazakhstan
3
Mechanics, Sound, & Vibration Laboratory, Department of Civil Engineering, College of Engineering, National Taiwan University, Roosevelt Rd. No. 1, Taipei 10617, Taiwan
4
Department of Reability & Dynamic Strength, A. Pidhornyi Institute of Mechanical Engineering Problems of National Academy of Sciences of Ukraine, 61046 Kharkiv, Ukraine
5
Department of Chemistry, Mukhtar Auezov South Kazakhstan University, Av. Tauke Khan No. 5, Shymkent 160012, Kazakhstan
*
Authors to whom correspondence should be addressed.
Appl. Sci. 2024, 14(5), 1790; https://doi.org/10.3390/app14051790
Submission received: 11 January 2024 / Revised: 18 February 2024 / Accepted: 19 February 2024 / Published: 22 February 2024

Abstract

:
This article presents one part of a study on the dynamic deformation and fracture of sections of steel gas pipelines with an external crack-like defect under the action of internal pressure. This work was performed on the basis of finite-element simulations using a cylindrical shell model executed by ANSYS-19.2 on the example of the section of the steel gas pipeline “Beineu–Bozoy–Shymkent” in the Republic of Kazakhstan. The propagation of the incipient crack-like defect along the pipeline and the resulting dynamic fracture in its tip area were investigated. The options of pipeline loading by working and critical internal pressure were both considered. It was found that, within the time of 1.0 ms, the formed crack expanded in the circumferential direction up to the maximum value, which depended on the value of the internal pressure. A further growth of cracks occurred along the longitudinal direction. At the operating pressure, the initial length of the crack increased by a factor of 5.6, while the equivalent stresses increased by a factor of 1.53 within 3.5 ms. Within the time of 3.75 ms, the equivalent stresses stopped growing due to the gas decompression. Specifically, there was a stop to the crack growth along the longitudinal direction. Vice versa, at the maximum pressure, the pipeline fracture did not change qualitatively, while at the time of the process, it decreased up to 3.5 ms. The finite-element results of the stress–strain state and pipeline fracture in the crack tip area at the working pressure showed that, within the time of 1.0 ms, the distance between the crack walls reached 23 mm at the free edge. Conversely, within the time periods of 2.25 and 3.5 ms, it increased two and three times, respectively. The crack elongation in the longitudinal direction occurred 5.8 times with time. Together, within the time of 3.5 ms, the equivalent stresses increased twice, after which the growth of the crack stopped due to the gas decompression. Moreover, studies on the growth of the crack-like defect in its tip area at the maximum pressure showed that additional considerations on the pressure on the crack edges led to an increment of 3.6% of the crack length. The results of this work can be used for the development of measurements for operating gas pipelines in the field of structural reinforcement.

1. Introduction

The transportation of natural gas to its destination is a very acute issue worldwide. To solve this issue, specialists used various methods of transportation: motor transport [1], tankers [2], railways [3], and main gas pipelines [4]. The latter method is currently the most acceptable due to its cost-effectiveness, which can be attributed to the following advantages: high speed of delivery to plants and storage points, wide geographical coverage, transporting the product over long distances, ensuring uninterrupted deliveries regardless of climatic conditions, and minimal resource losses during transit. However, there are also risks of emergencies during transportation by gas pipelines due to various reasons: corrosion of pipe material, stress concentration along structural elements, structural defects [5,6,7,8,9], and external impacts on the structural parts [10,11,12,13,14], which, as a result of the internal pressure impacts, are subject to destruction [15,16,17,18] and leading to accidents [19,20,21,22].
Since the middle of the 20th century, several studies have generally been devoted to investigating the issue of the destruction of main and conventional gas pipelines, on the basis of which a lot of design norms and codes were adopted [23,24,25,26,27,28,29,30]. Back in 1970, the problem of crack occurrences along pipelines and ways of stopping them were studied [31]. In 1980, full-scale investigations on the rupture of large-diameter pipes were carried out, where the emphasis was placed on the method of manufacture and mechanics of the pipe material [32,33]. In the studies performed in 1990 [34,35], the issue of mainline crack propagation, which is induced by the gas motion, was established. It was stated that the problem of main crack motion consists of three subproblems: analysis of the stress–strain state of the structure, gas propagation through the pipeline and the corresponding crack, and fracture mechanics. The development of a calculation program was described, which consists of three modules: stress state analysis, gas dynamics, and fracture modeling. Approaches to prevent the rapid crack movements were discussed. Particularly in Melenk and Babuska [36] and Moes et al. [37], the extended finite-element method was utilized to model the stress state close to the cracks, which, in turn, demonstrated its evaluation accuracy and reliability.
During the decade 2000–2010, a number of works along this research direction were carried out, where, in Yang et al. [38], the finite-element approach was specifically applied for modeling the fracture of pipelines. Based on their calculations, the crack tip opening angle was determined. This parameter was experimentally determined for each material. At the critical value of this parameter, crack growth occurs. Zhuang and O’Donoghue [39] discussed some methods to stop crack development. The use of wire and composite wraps to prevent crack movement was analyzed. Makino et al. [40] described a numerical procedure for modeling the gas dynamic processes that are commonly observed when the gas flows out of a pipeline. Conversely, in Dama et al. [41] and Panda et al. [42], experimental and numerical studies were executed on bending sections of gas pipelines under internal operating pressure to determine the critical points. Their outcomes showed that fatigue failure occurs in the bending area under repeated loading.
In the previous decade, studies were conducted to investigate the crack formation in large-diameter gas pipelines, where a computational approach for determining the mainline crack movement was proposed by Nordhagen et al. [43]. The commercial software LS-DYNA R-12.1.0 was used to calculate the stress state and crack propagation, while another software was implemented for dynamic issues along gas pipelines. The dependence on the strain rate was emphasized when analyzing the fracture of the entire structure. Near the crack tip, the plastic strain of the material was considered. Due to the development of plastic strains, crack growth occurred. On the other hand, plastic strains were induced by the action of gas on the crack banks. As follows from the numerical modeling, the gas movement occurred at a velocity between 100 and 300 m/s. In Yan et al. [44], existing analytical methods for calculating pipeline fractures were reviewed. The results of these calculations were compared with the findings from some experimental analyses of pipeline fractures. In Zhu [45], a review of analytical methods for calculating the gas pipeline fracture under the action of gas pressure was implemented. Methods for stopping the development of main cracks along gas pipelines were proposed. Di Biagio et al. [46] illustrated the research experience of the European Research Group on the strength of gas pipelines. Approaches for the analysis of the resistance of the plastic fracture were described. Specifically, a plastic fracture model based on a numerical analysis of the stress state was generated. In Fengping et al. [47], finite-element calculations together with experimental studies were applied to model the crack development, in which the velocity of crack propagation and gas decompression, which were in turn obtained after calculations, were considered. Their findings demonstrated that, under certain conditions, the rate of crack propagation was lower than that of gas decompression, which means that the simulated gas pipe can stop cracking by itself. Vice versa, the effects of the geometrical parameters and pipeline matrix variables on the crack propagation rate were analyzed by Ben et al. [48].
In recent years, as commercial gas is still the only acceptable energy source used worldwide, the relevance of this field has also attracted increased interest from scholars. Thus, in Zhang et al. [49], an extended finite-element study of X42 and X52 grade gas pipelines according to API 5L [25] was carried out, where the gas pipelines were subjected to internal pressure only. Defects in the form of corrosion with depths of 55% and 60% of the wall thickness were simulated to investigate the effect of cracking. Consequently, it was observed that for shorter cracks, the fracture pressure decreased with increasing the initial crack depth. In situ experimental studies of cracks and defect propagations were instead investigated by Shtremel et al. [50] and Zhangabay et al. [51]. Besides, a method for stopping cracks along gas pipelines by changing the configuration (flattening of the pipeline wall) of the pipe cross-section when a crack is approaching was proposed by Kaputkin and Arabey [52]. Thus far, the main causes of crack formation along pipelines were examined by Ghelloudj et al. [53], Dao et al. [54], Soomro et al. [55], Sliem et al. [56], and Biezma et al. [57].
Considering the aforementioned literature review, the task aimed at studying crack propagation in large-diameter gas pipelines requires further research since cost-effective and technically suitable methods for fracture localization were not proposed. In this regard, at this stage of the study, the main purpose of the work was to analyze the stress–strain state of the pipe section, taking into account the failures with an incipient crack and the failures in the crack tip zone on the example of the “Beineu–Bozoy–Shymkent” main gas pipeline [58]. In the future, it will give ideas about the mechanics of crack propagation formed on the surface of manistral gas pipelines. As a result, this will provide an initial understanding for the further application of the prestressing method for the localization of longitudinal propagation in gas pipelines, previously substantiated in the published works of the authors [59,60,61,62,63,64]. Indeed, there is a need to study the issue of steel gas pipeline failures with further development of a method for their prevention, which is very actual at the national scale, as today the wear of gas pipelines in the Republic of Kazakhstan is more than 70% [65].

2. Materials and Methods

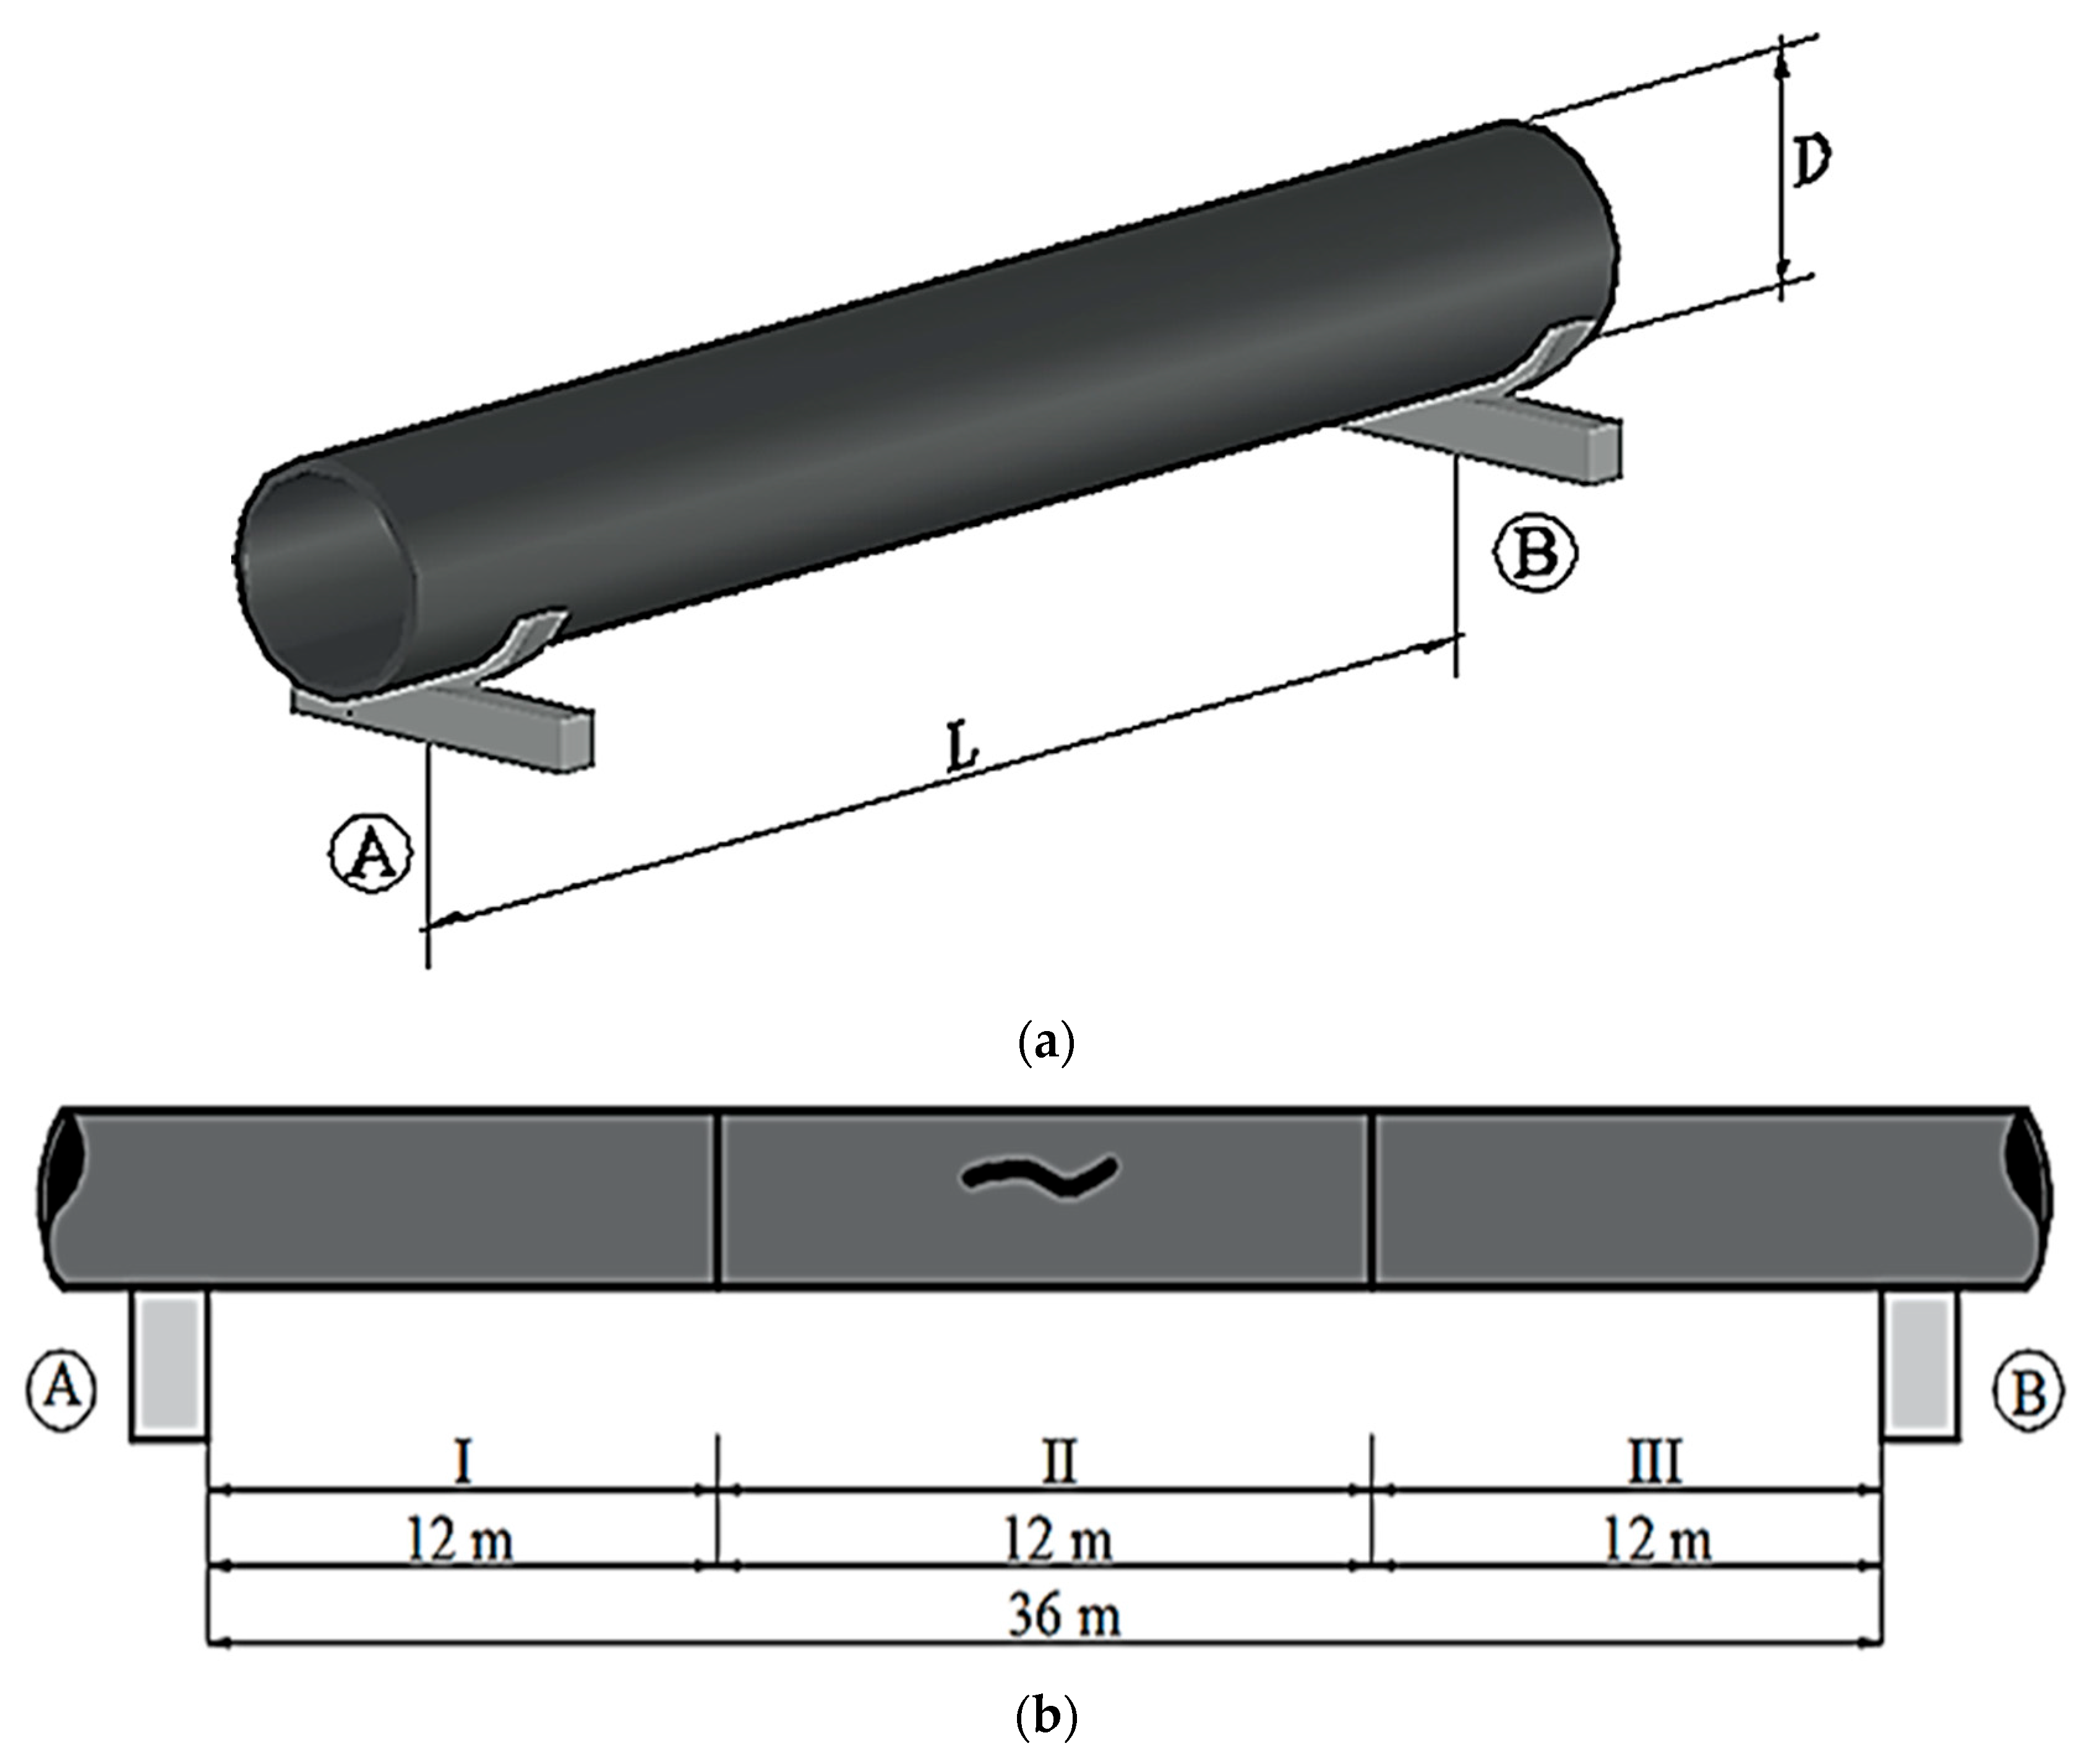
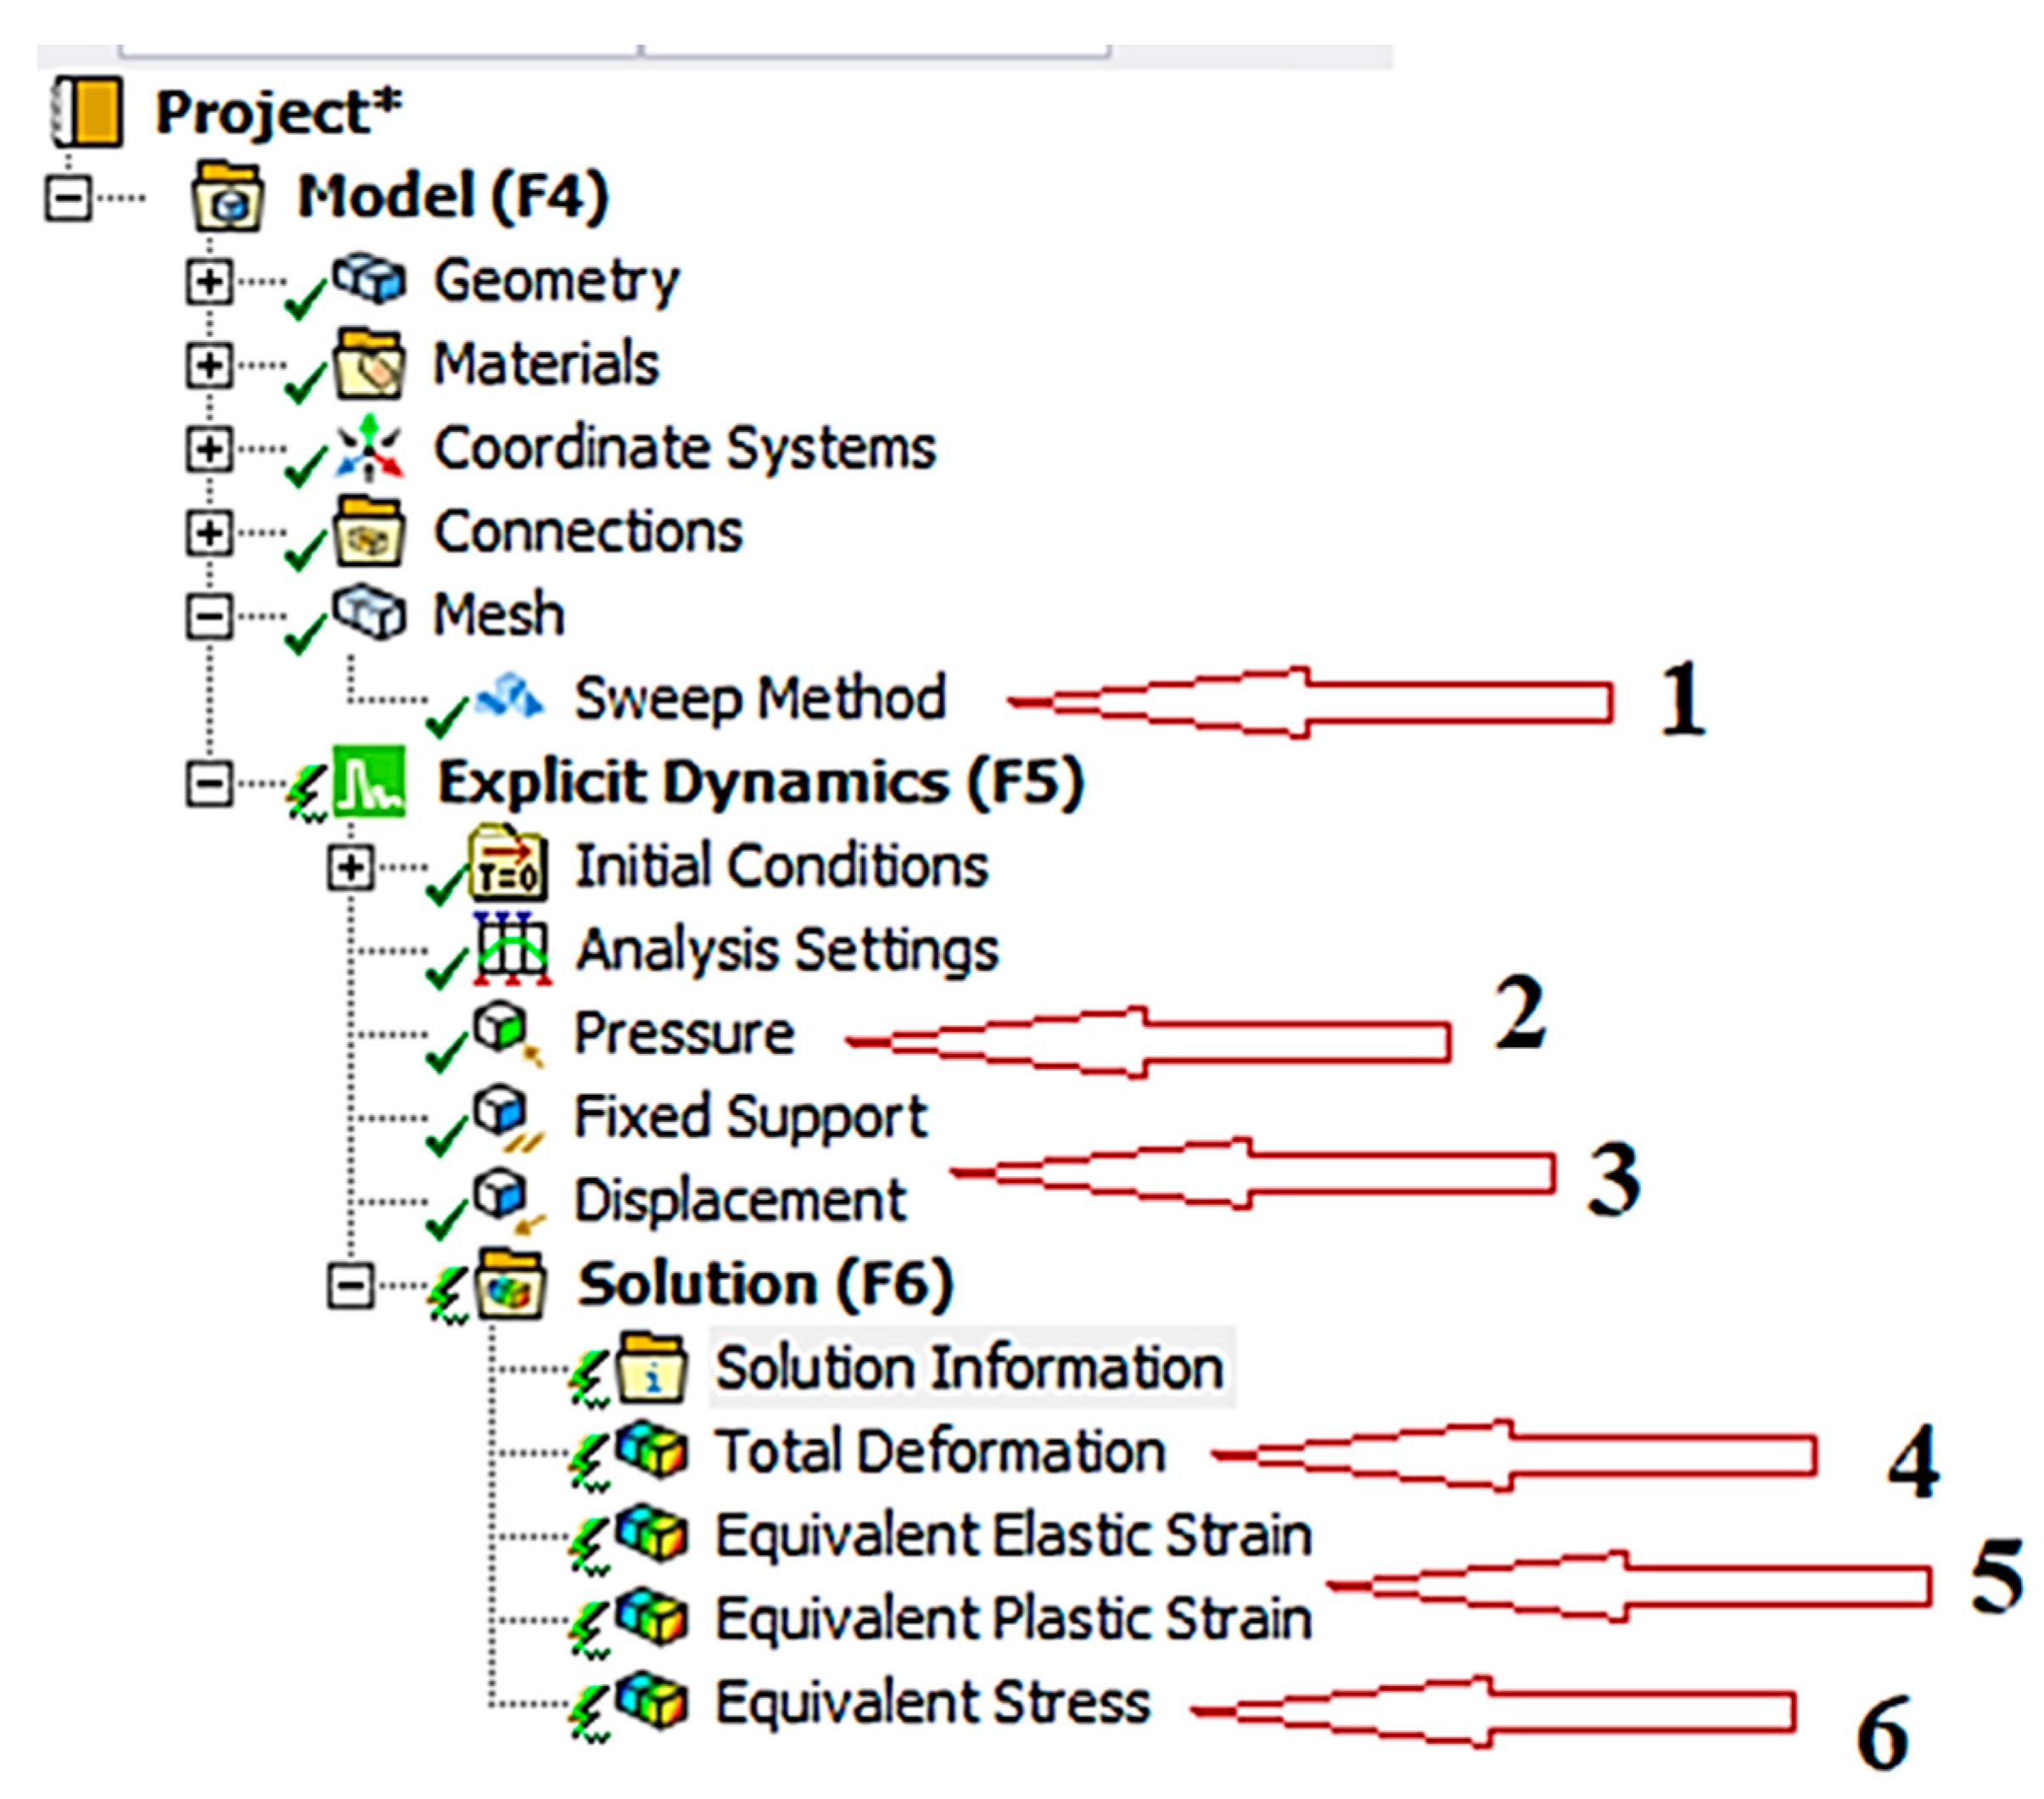
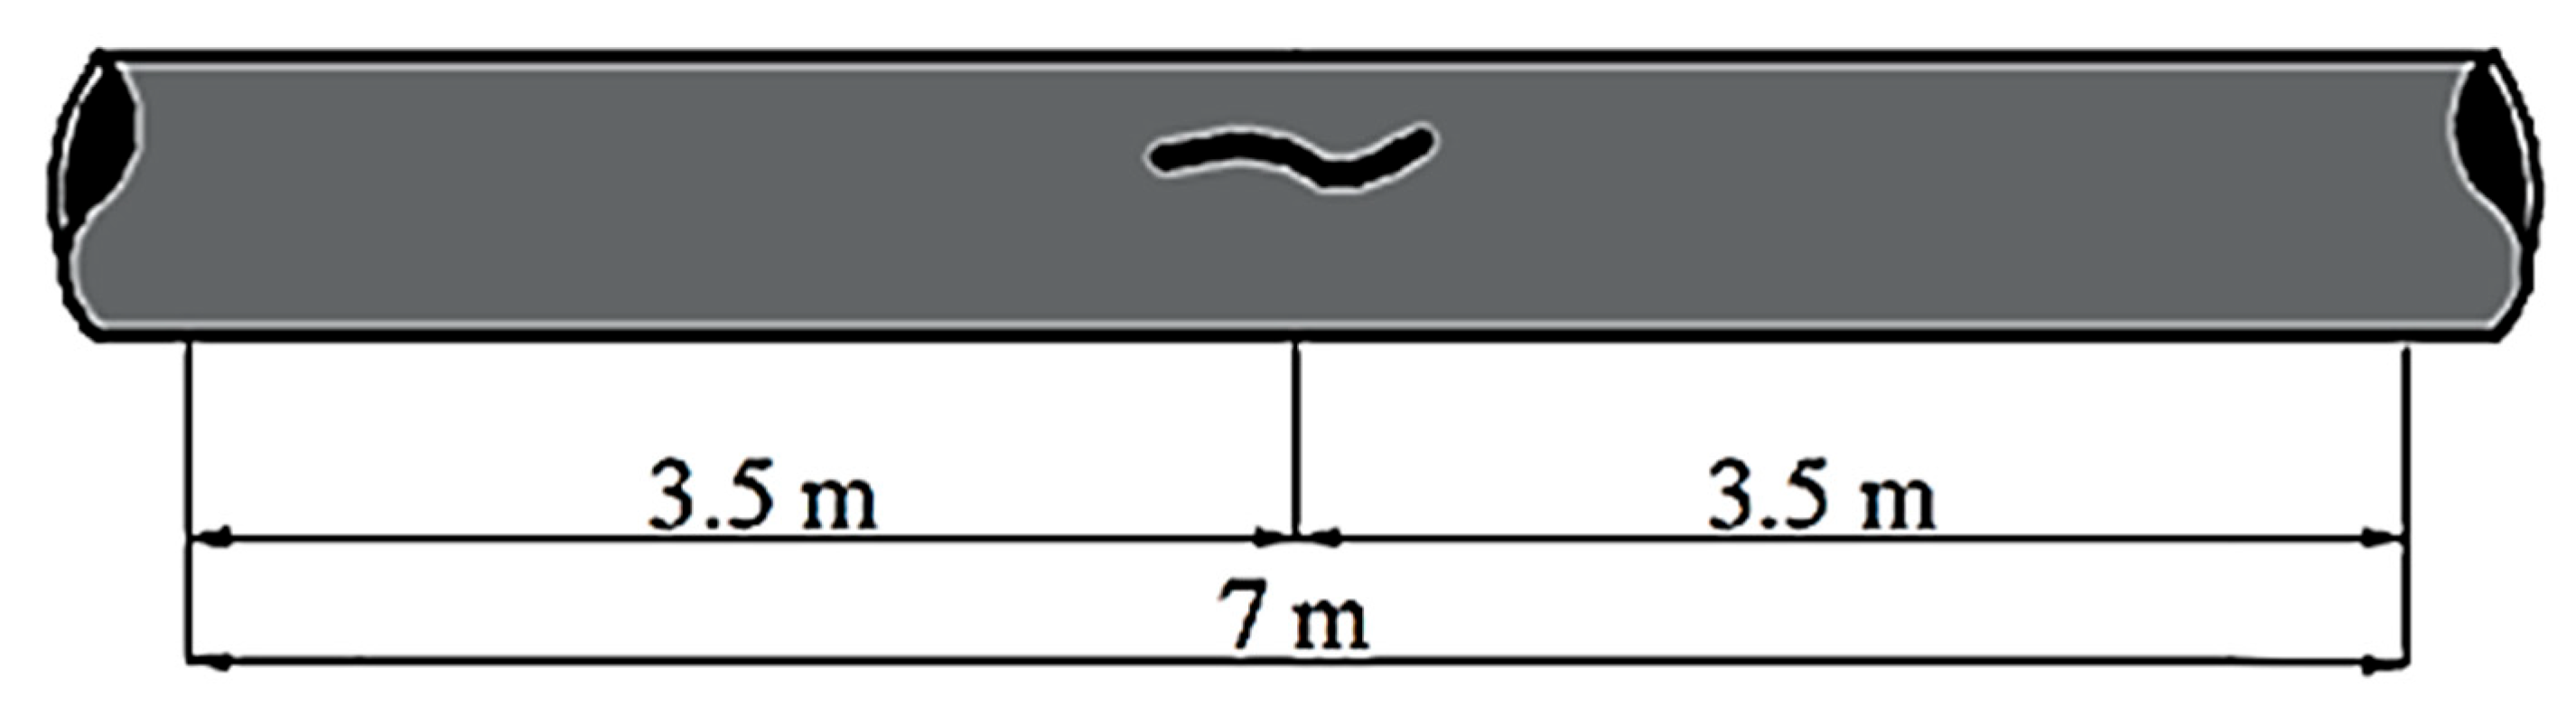
2.1. Calculation Model of the Stress–Strain State and Fracture of a Steel Gas Pipeline Section with an Incipient Crack-like Defect

A section of an aboveground main steel gas pipeline with an incipient crack-like defect between two supports was considered (Figure 1). Support A implemented the conditions of rigid pipeline embedment, while support B was a longitudinal-moving support. It was also assumed that the distance between the supports was lTp = 36.0 m. The incipient crack-like defect was located in the central part of section No. 2. It is directed along the pipe perpendicular to the axial section. The crack-like defect has the shape of a cutout on the outer pipe surface with a length of 200 mm, a width of 1 mm, and a depth equal to 8 mm. In this case, the supports did not influence the process of crack development.
The geometrical parameters of the pipeline were those of the natural gas pipeline “Beineu–Bozoy–Shymkent” in the Republic of Kazakhstan, including its underground and aboveground parts [59]. The pipe diameter was dTp = 1047 mm, while the thickness of the pipe wall was hTp = 15.9 mm.
The gas pipeline was made of X70 steel and produced based on the elastoplastic material’s behavior. The physical and mechanical characteristics of the steel material were used according to the standard [66]: density ρ = 7810 kg/m3; elastic modulus E = 2.06 GPa; yield strength σ T = 505 MPa; and ultimate strength σ B = 570 MPa. Research was carried out for a temperature of +22 °C. According to these data, the stress–strain state of the gas pipeline was investigated by considering the elastic-plastic properties of the steel material. The state equation for the elastic state of the material takes the form σ e q = E · ε e q for 0 σ e q σ T , where σ e q and ε e q are von Mises equivalent stress and strains respectively. If σ T σ e q σ B , the model plastic behavior of the steel is taken into consideration. The plastic behavior of the steel was particularly described by the Bilinear Isotropic Hardening (BIH) model [67]. The state equation for the BIH–plastic state of the material instead takes the form σ e q = σ T + H ε e q σ T / E , where H = d σ e q / d ε e q is the hardening modulus. When the strain rate exceeded the values of 10−2 s−1, the plastic behavior of the steel, described by the Cowper Symonds Strengh (CSS) model, was assumed [67]. The use of this model allowed us to consider the dependence of the mechanical characteristics of the X70 steel on the strain rate. The state equation for the CSS–plastic state of the material takes the form: σ e q = A + B ε e q p l n · 1 + D 1 · ε e q p l / t 1 / q , where A is the yield stress at zero plastic strain; B is the strain hardening coefficient; ε e q p l is the plastic strain; n is the strain hardening exponent; ε e q p l / t is the plastic strain rate; whilst D, q are the strain rate hardening coefficients [66,67]. Material failure was modeled based on the Maximum Stress Criterion (von Mises Criterion). When equivalent stresses are higher than the ultimate stress σ e q > σ T , local destruction of the pipeline material occurs.
The operating pressure P1 is 7.5 MPa, while the maximum pressure P2 is 9.8 MPa. The main issue was solved using dynamic formulations. In short, the decreasing internal pressure along a pipeline with a crack was modeled either as exponential damping P t = P e t θ , where the value of the damping coefficient θ was determined for each type of gas from in situ or computational experiments, or using the tabular form of the experimental data. The calculations were performed using the Explicit Dynamics module of ANSYS-19.2/Explicit Dynamics [68]. The schematic diagram of the calculation module of this work is summarized as follows in Figure 2.
When building the finite-element cylindrical shell model, the convergence of the solution was controlled. According to the corresponding results, the finite-element mesh was generated with the value of the parameter “Element Size”, which was equal to 0.01. Moreover, the number of cylindrical shell finite elements along the pipeline thickness was forcibly set by using the option “Sweep Method” (Pointer 1 in Figure 2). As a result of the finite-element simulation, a uniform mesh was generated and shown in Figure 3.
The dynamic pressure (Pointer 2, Figure 2) was set by using the tabular form. Specifically, the pressure corresponded to: (1) the operating pressure P1 = 7.5 MPa; and (2) the maximum pressure P2 = 9.8 MPa. Its time of action and rate of attenuation were determined from the experimental data of the pressure variation along a pipeline with a crack, according to Nordhagen et al. [44], where the pressure-time dependence along a pipeline with methane was utilized as an example. The boundary conditions (Index 3, Figure 2) were instead set as rigid fixed supports for the pipeline section No. 1, while they were constrained on non-longitudinal displacements for the pipeline section No. 2 (Figure 1). The results of the numerical calculations were utilized to determine the displacements over time (Index 4, Figure 2), the elastic and plastic strains over time (Index 5, Figure 2), and the equivalent stresses over time (Index 6, Figure 2).

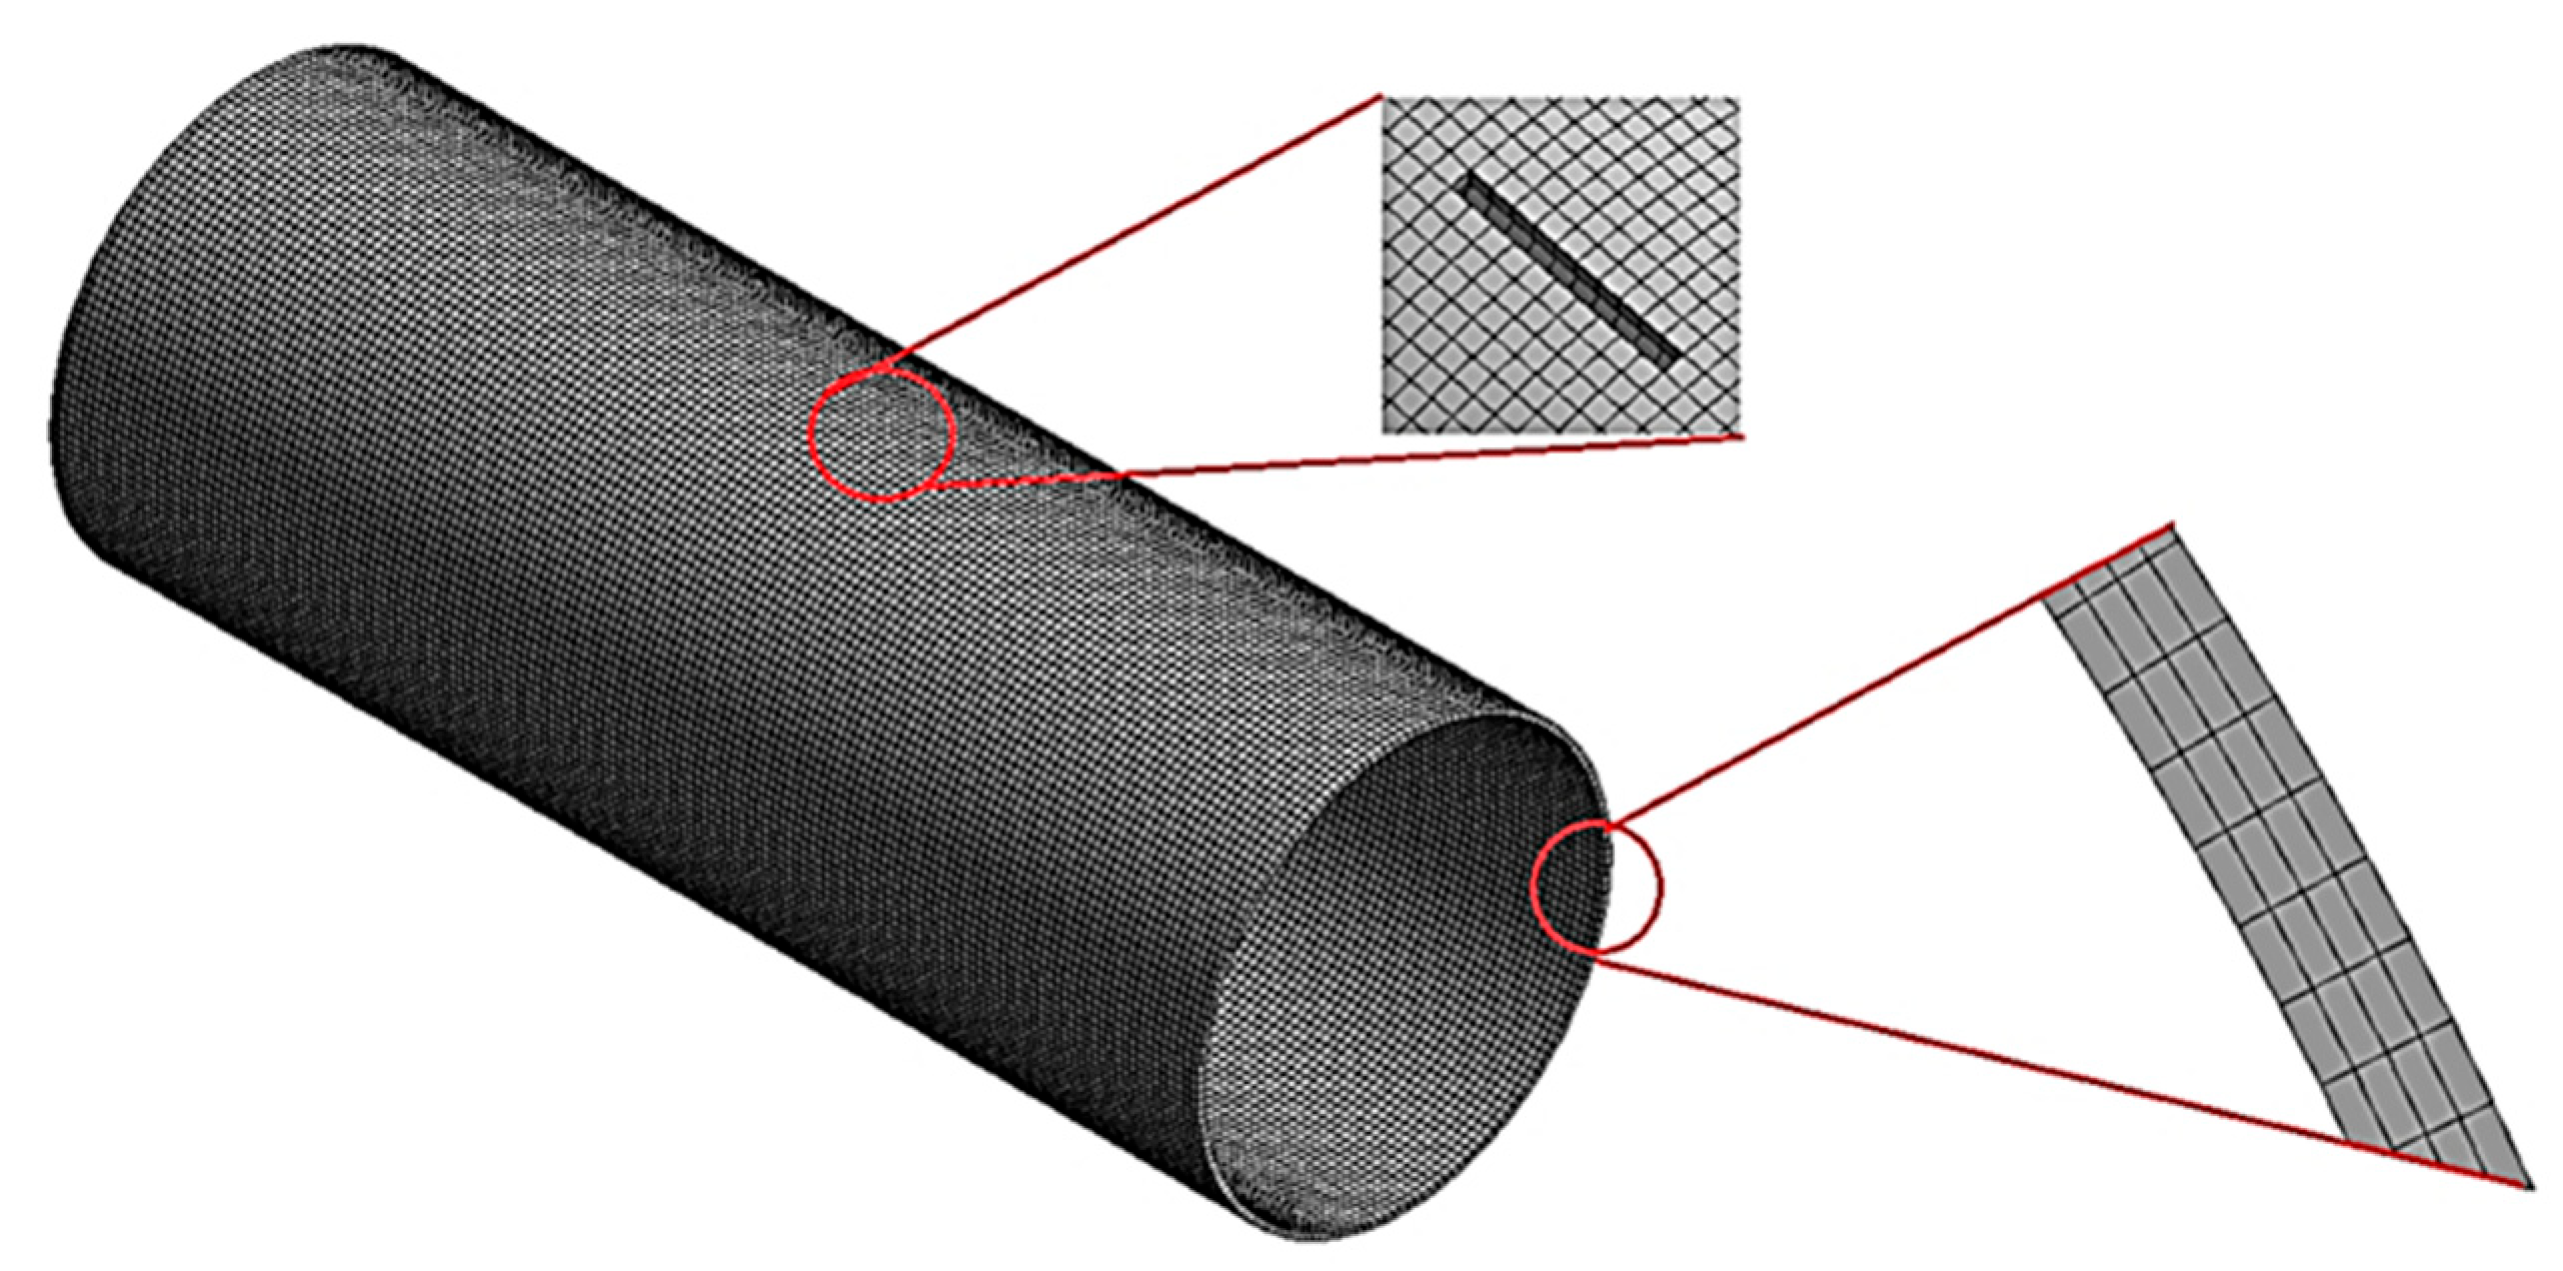
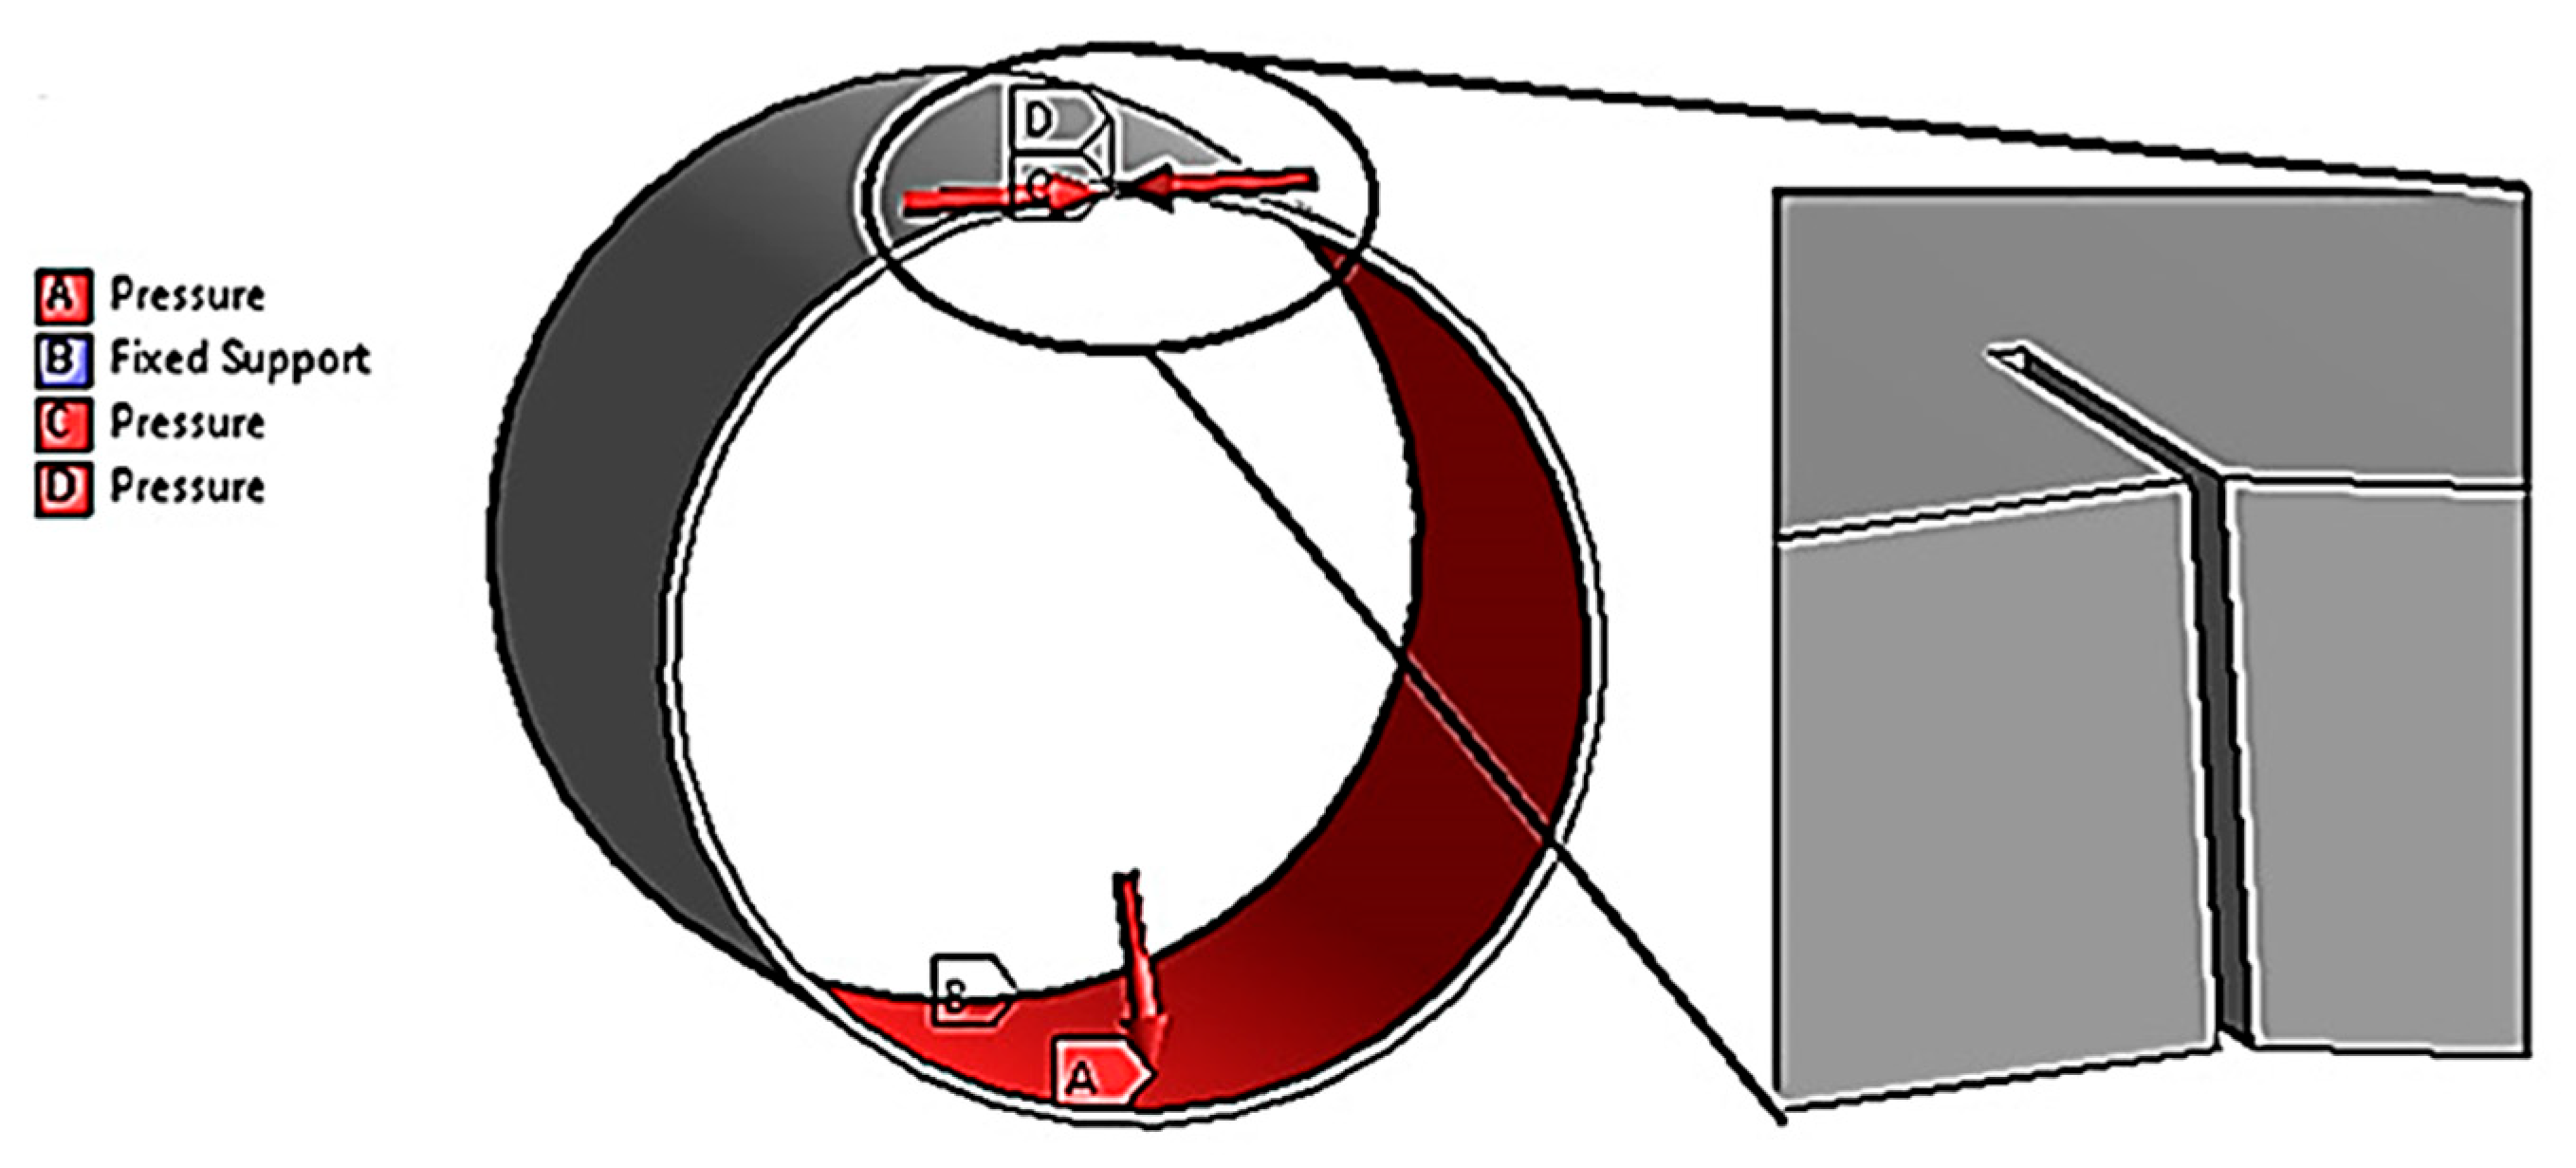
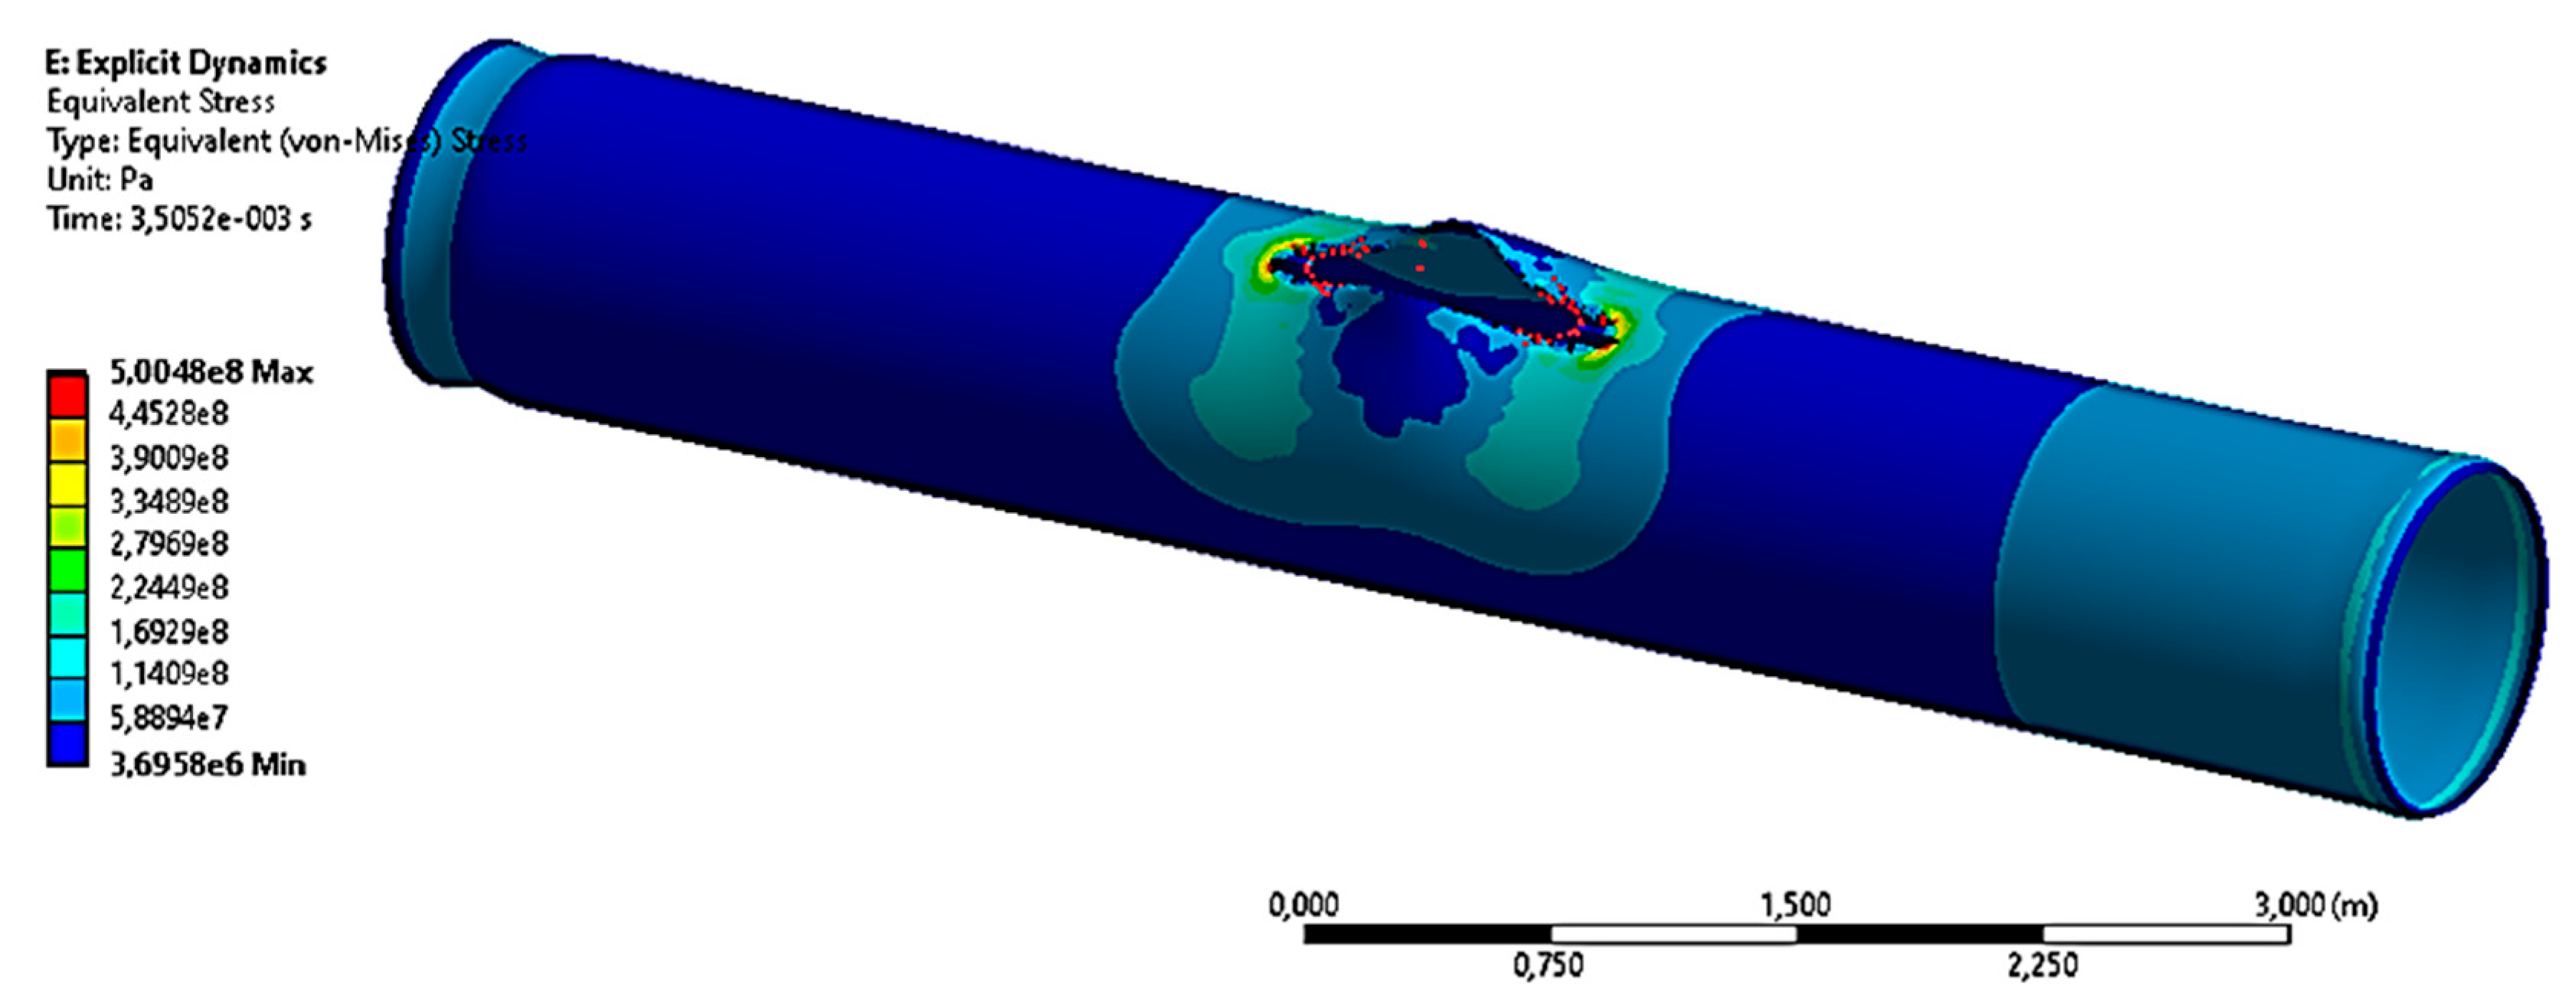
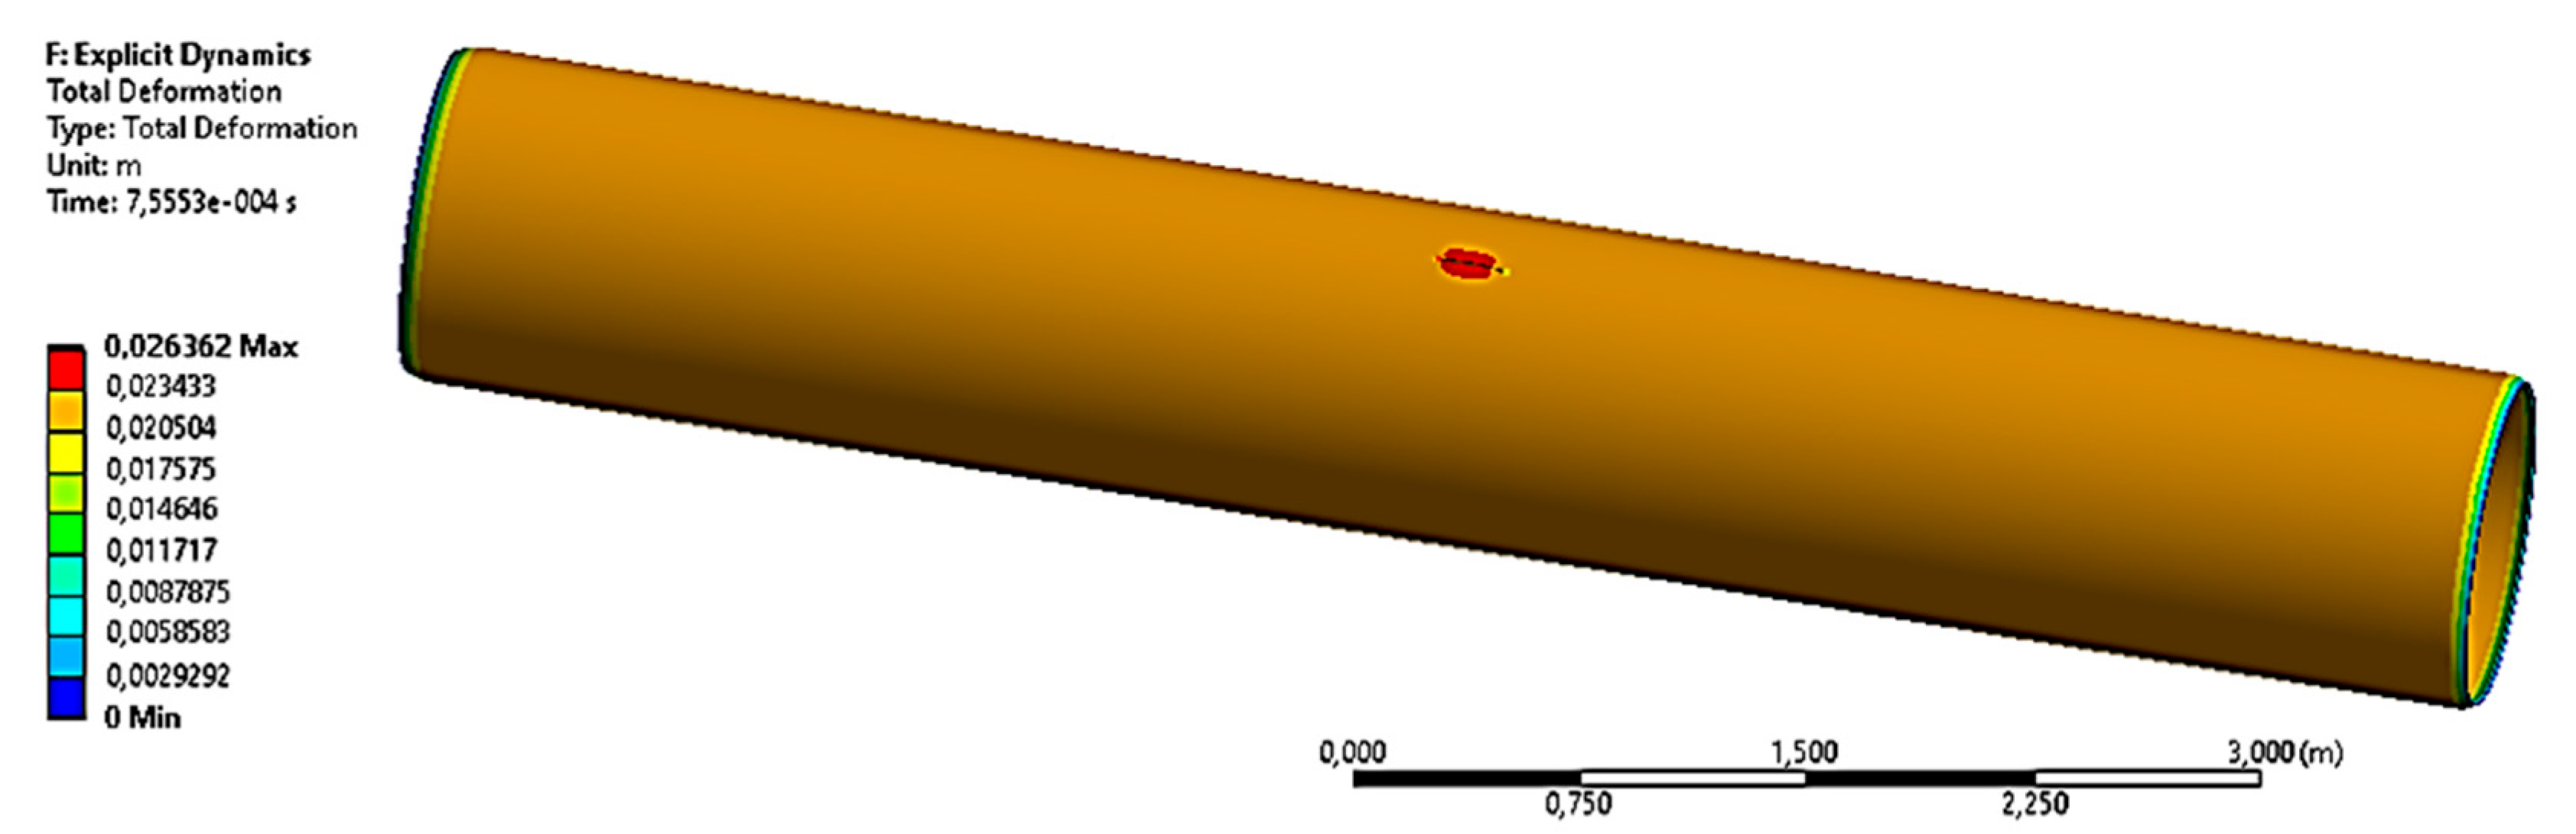
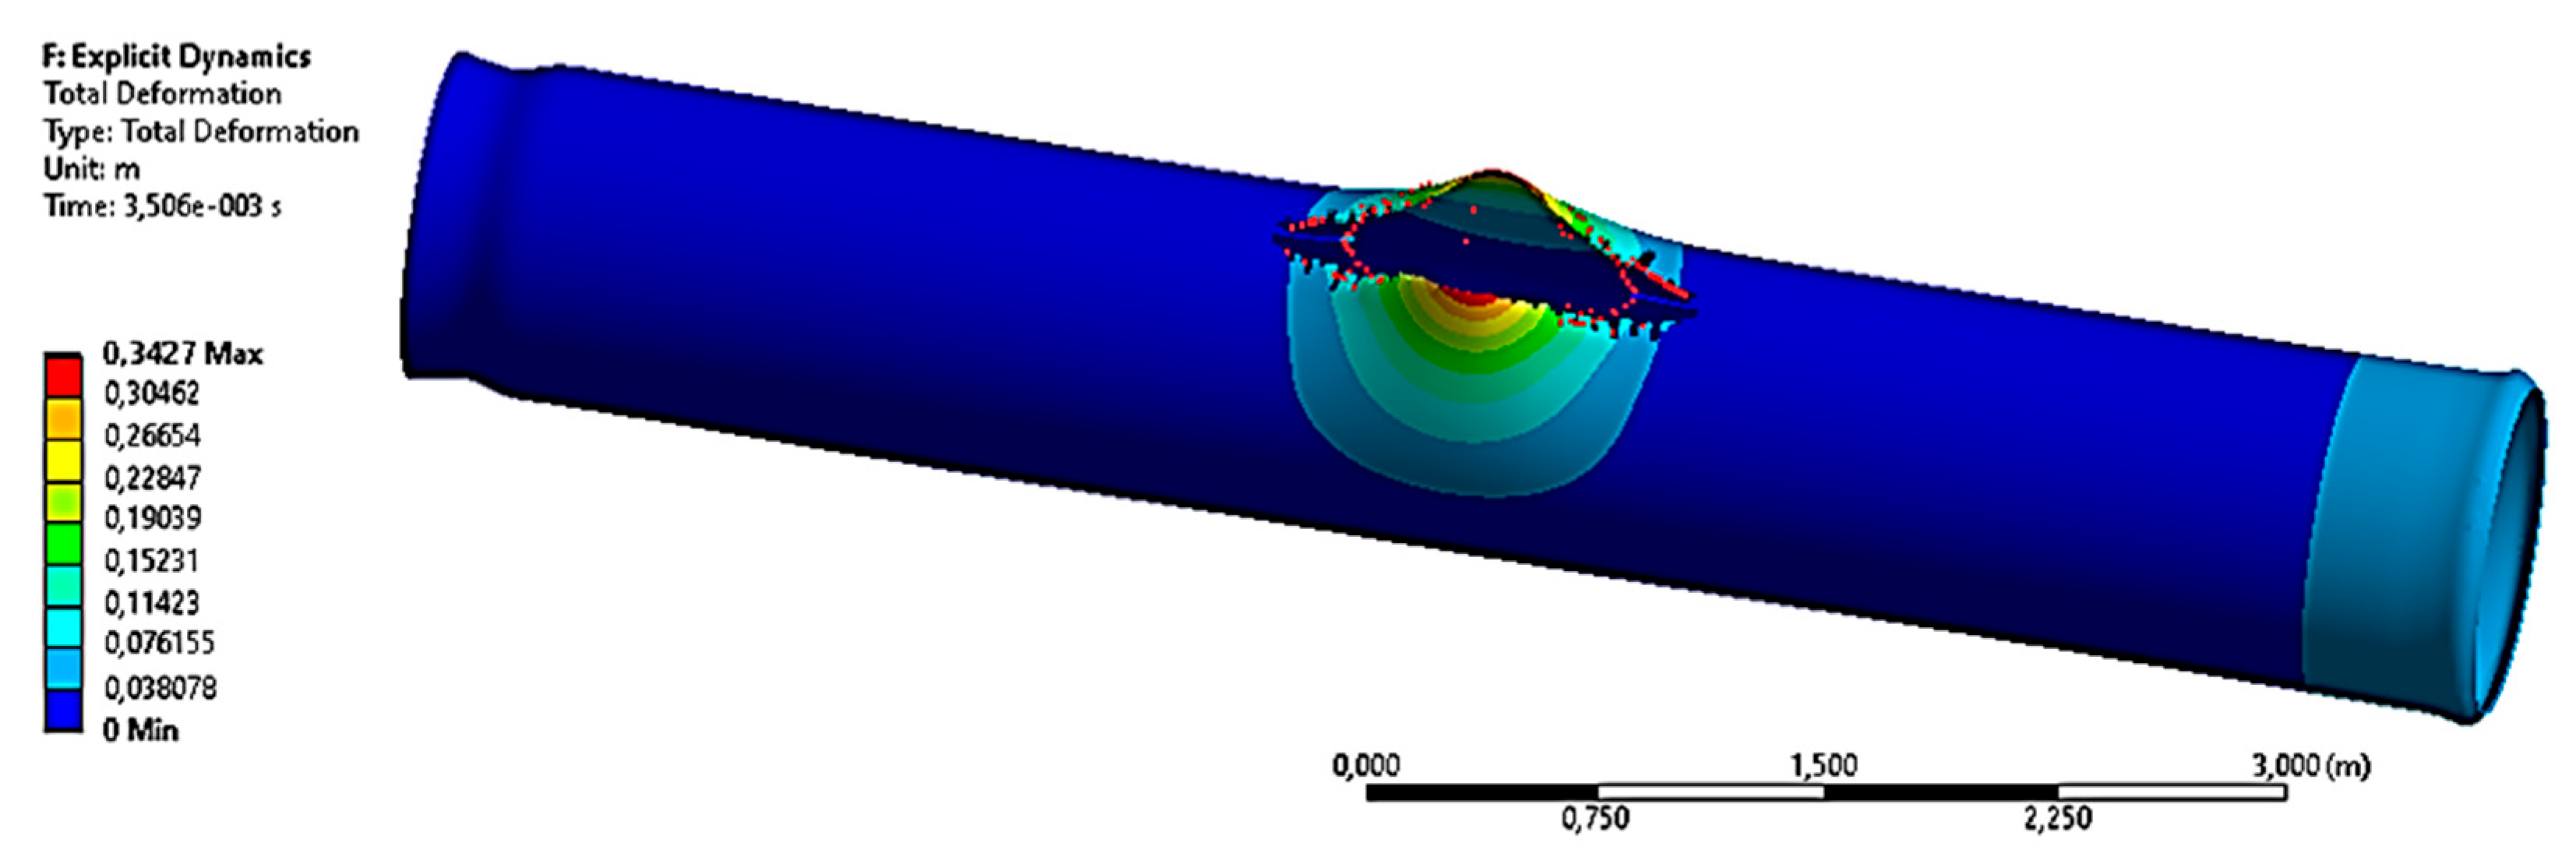
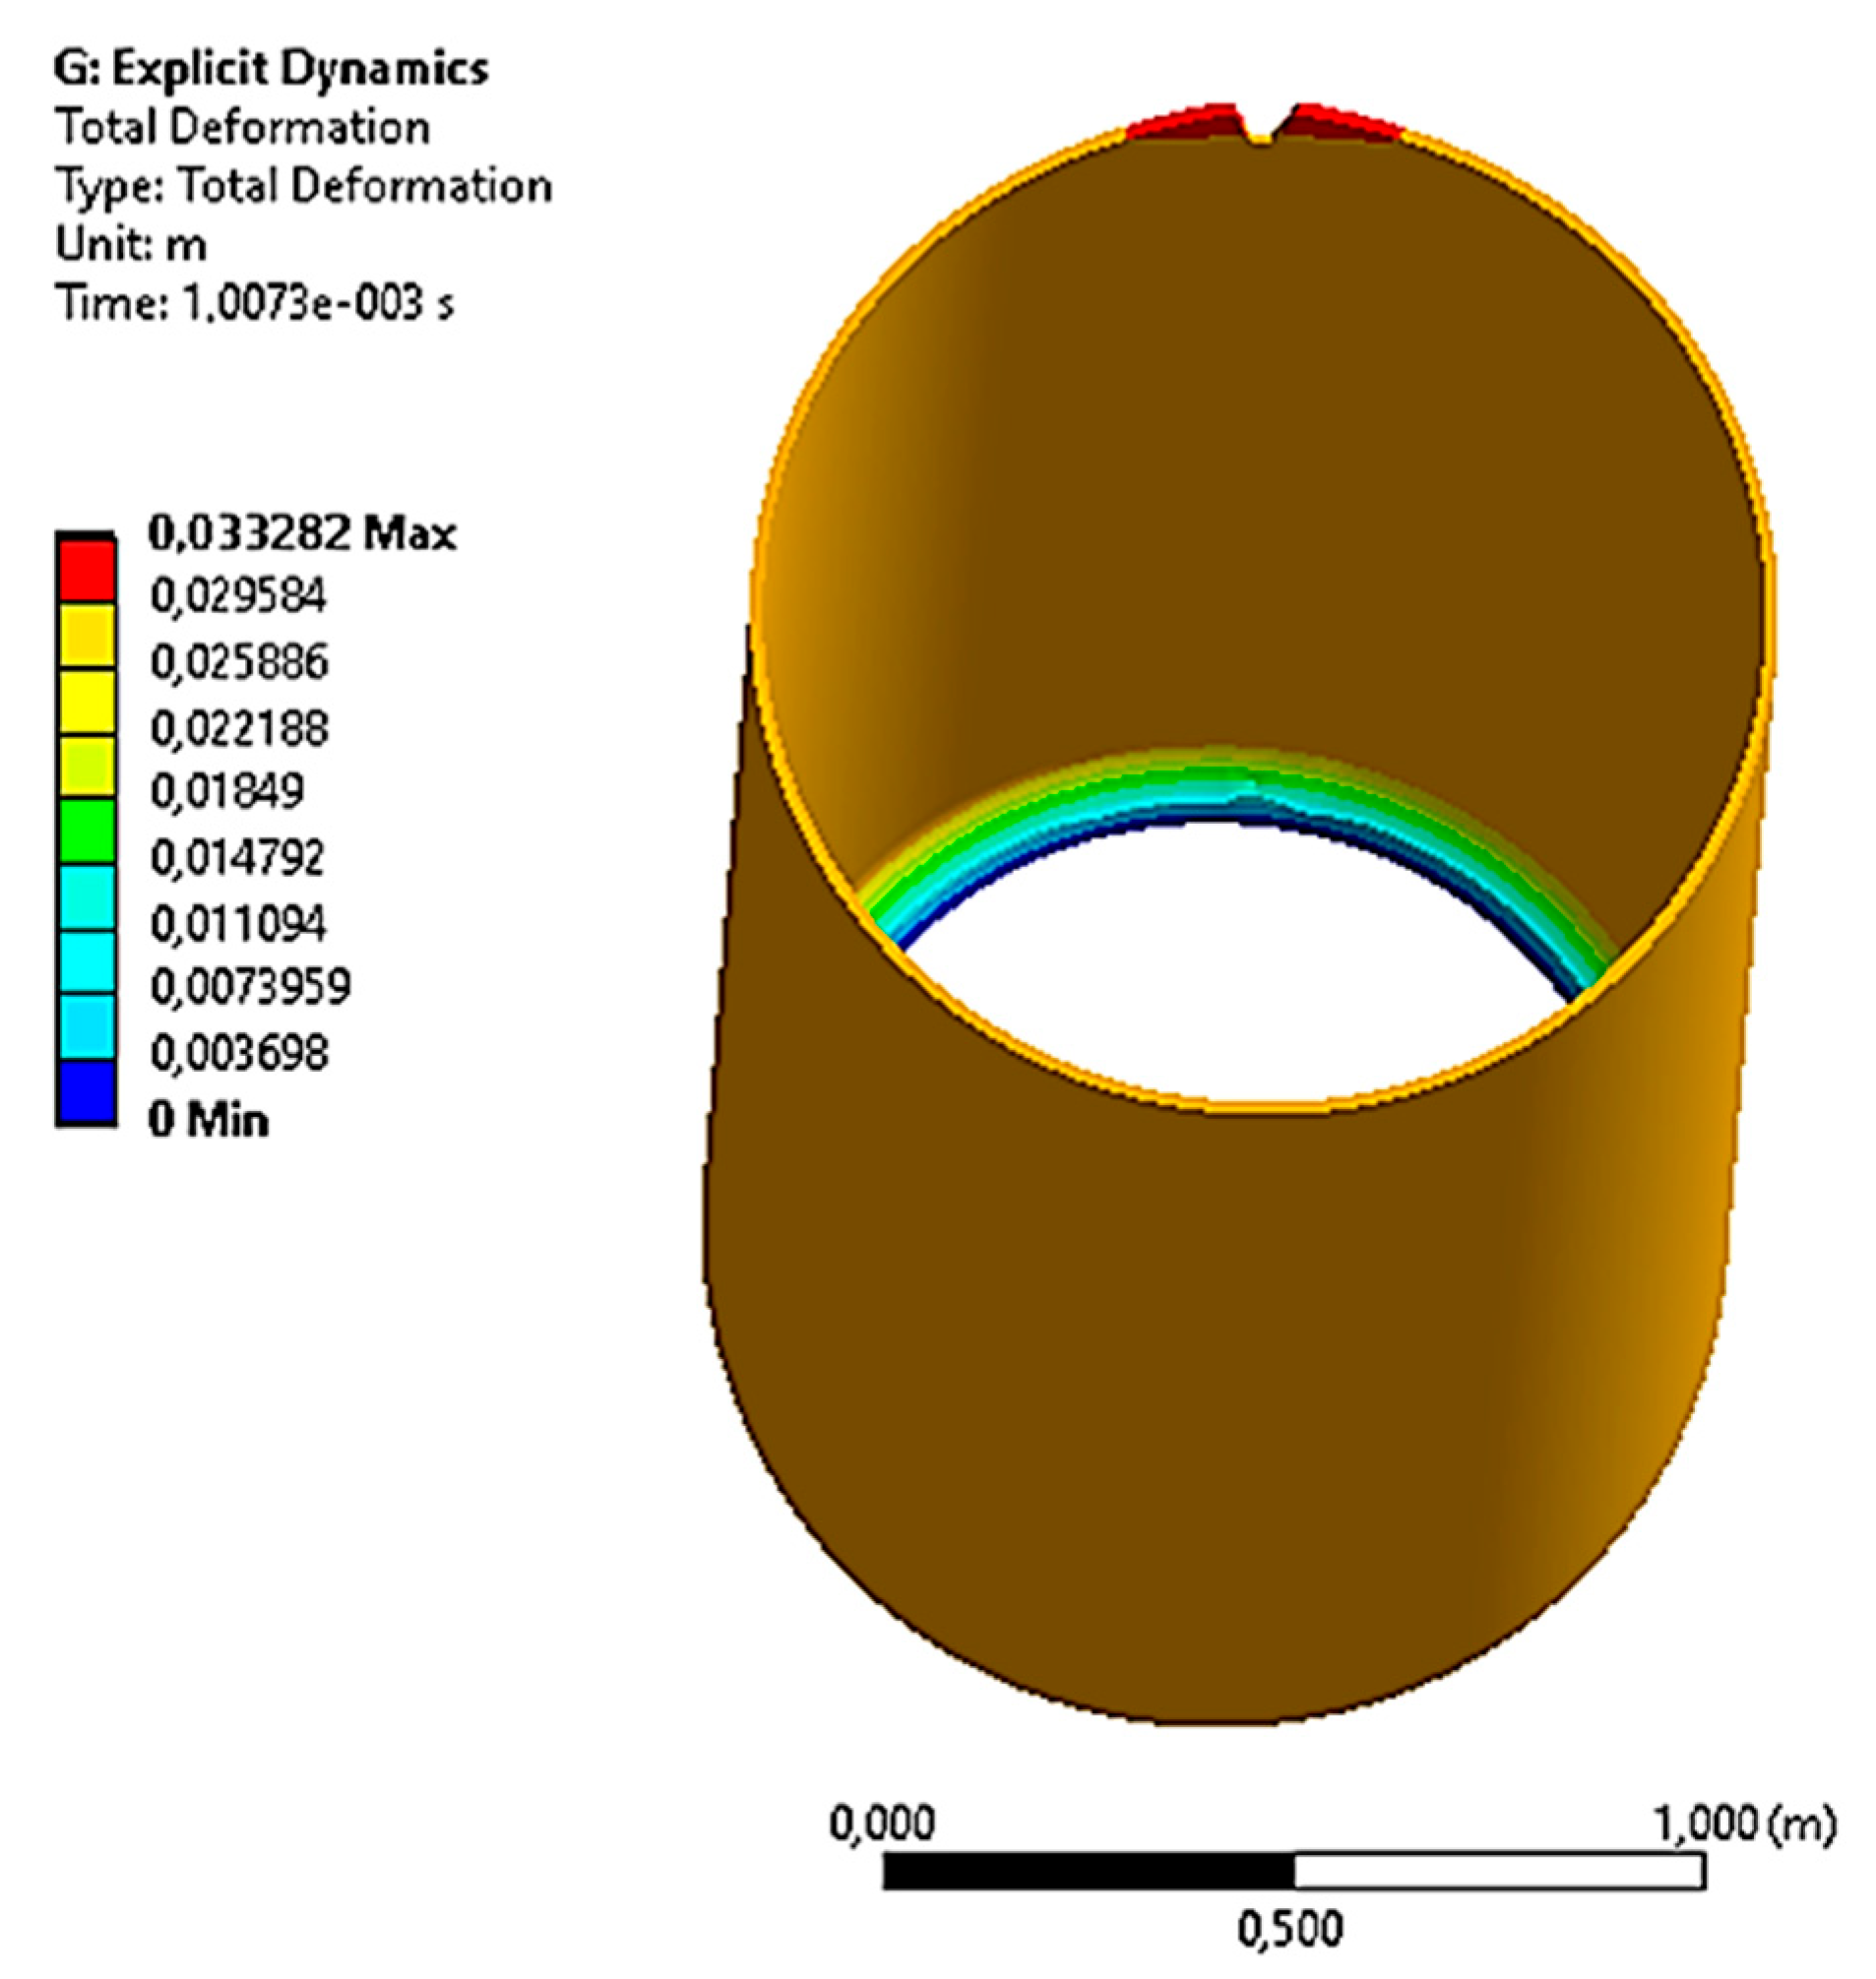
2.2. Calculation Model of the Stress–Strain State and Fracture of a Steel Gas Pipeline in the Crack-like Defect Tip Area

For a more accurate analysis of the crack development in its tip area, it was reasonable to use a refined finite-element model that, in addition to the internal pressure along the pipeline, also considered the dynamic pressure on the walls of the through-crack (Figure 4). This made it possible to specify the crack length along the longitudinal direction and estimate the size of the crack opening, as well as to predict the time of the fracture process.
The finite-element model of the stress–strain state and fracture of the gas pipeline in the crack tip area was built on the basis of the previous one of the stress–strain state and fracture of the pipe section with an incipient crack. A part of the geometrical model, including half of the crack, was adopted. The boundary conditions were not imposed on the cracked pipe ends. It was also assumed that the crack was through-cracked and that the pressure acting on its walls was similar to the internal pressure along the pipeline (Figure 4). The cylindrical shell finite-element model in this numerical case had the same dimensions as the basic one, and its convergence was checked by the standard mesh densification method (Figure 3).

3. Results and Discussion

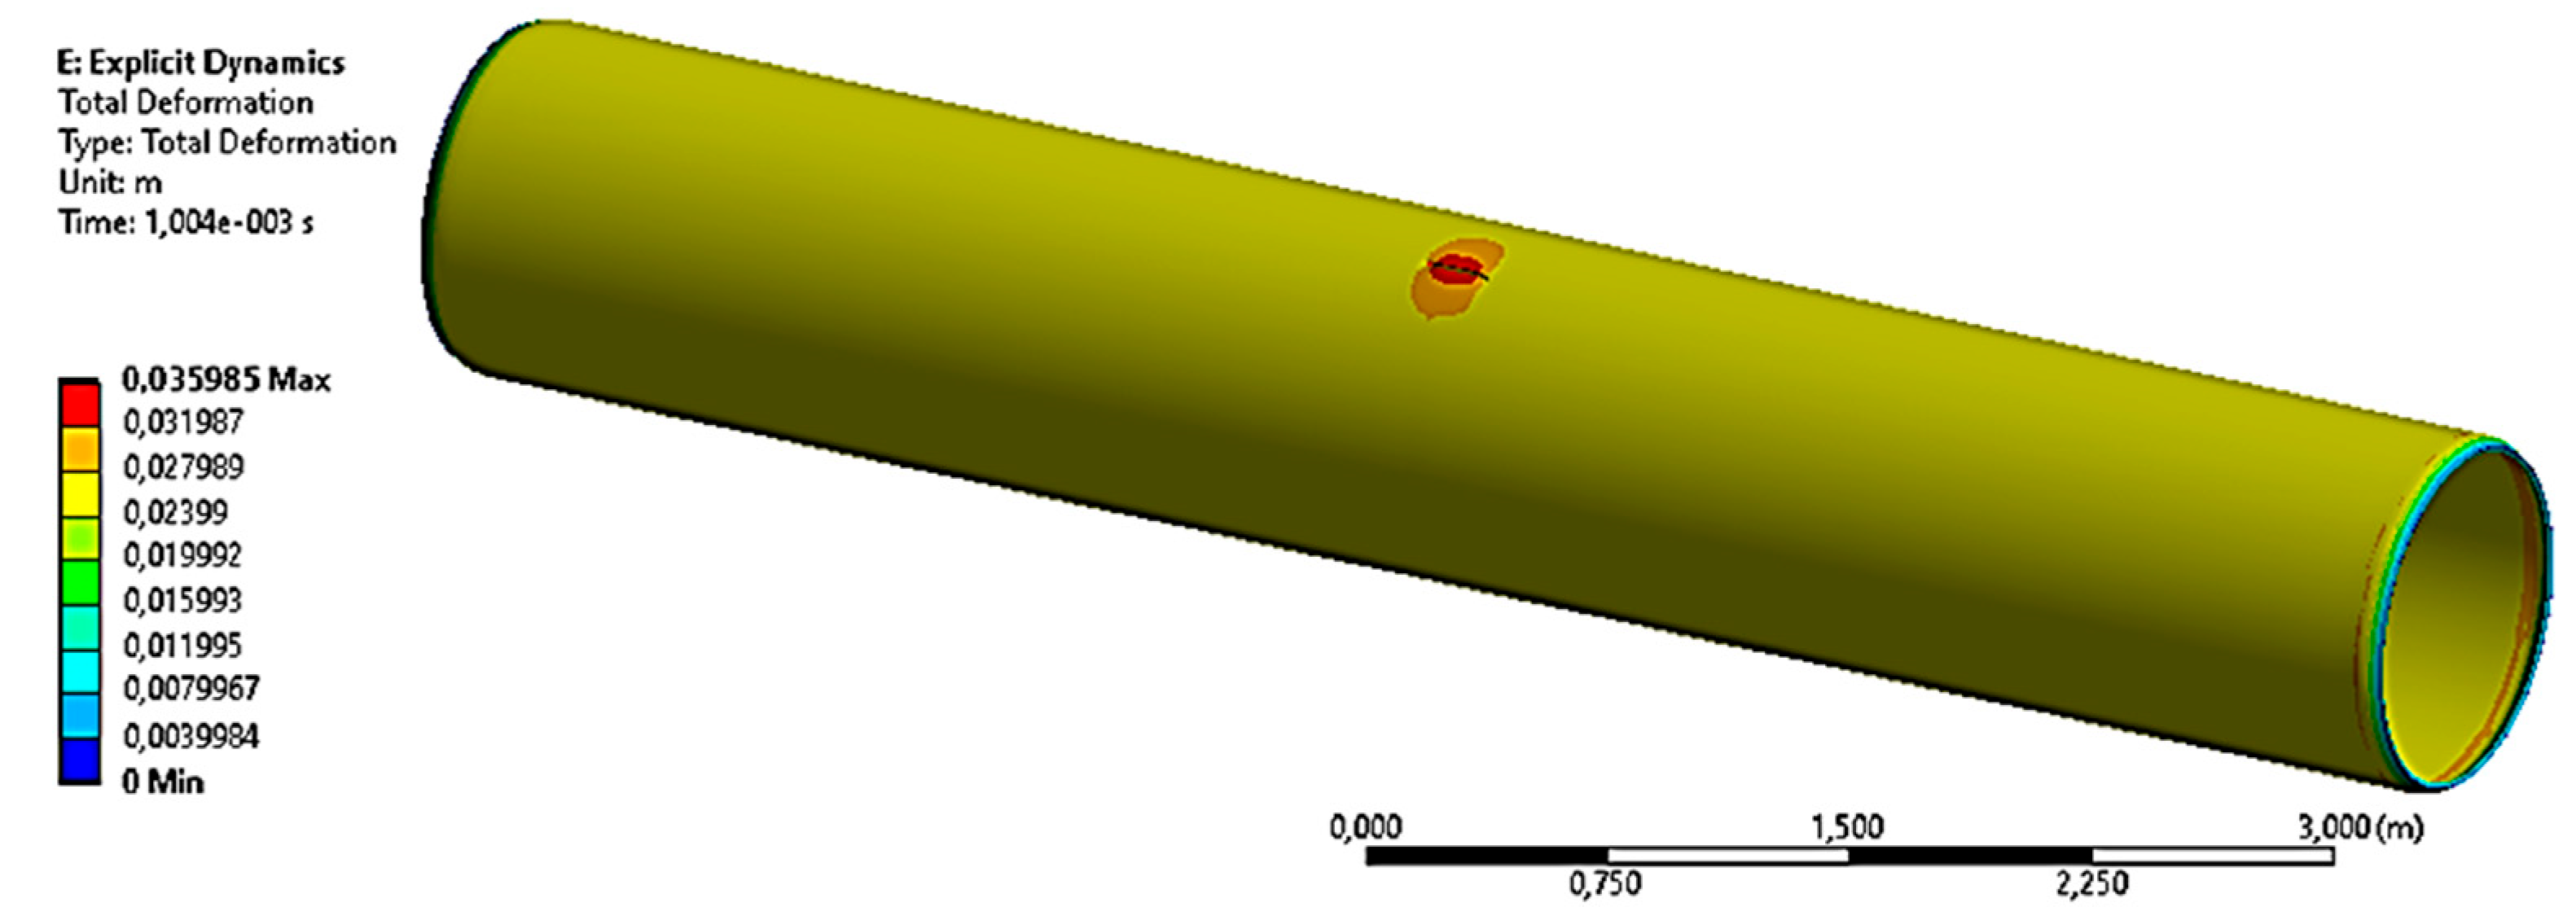
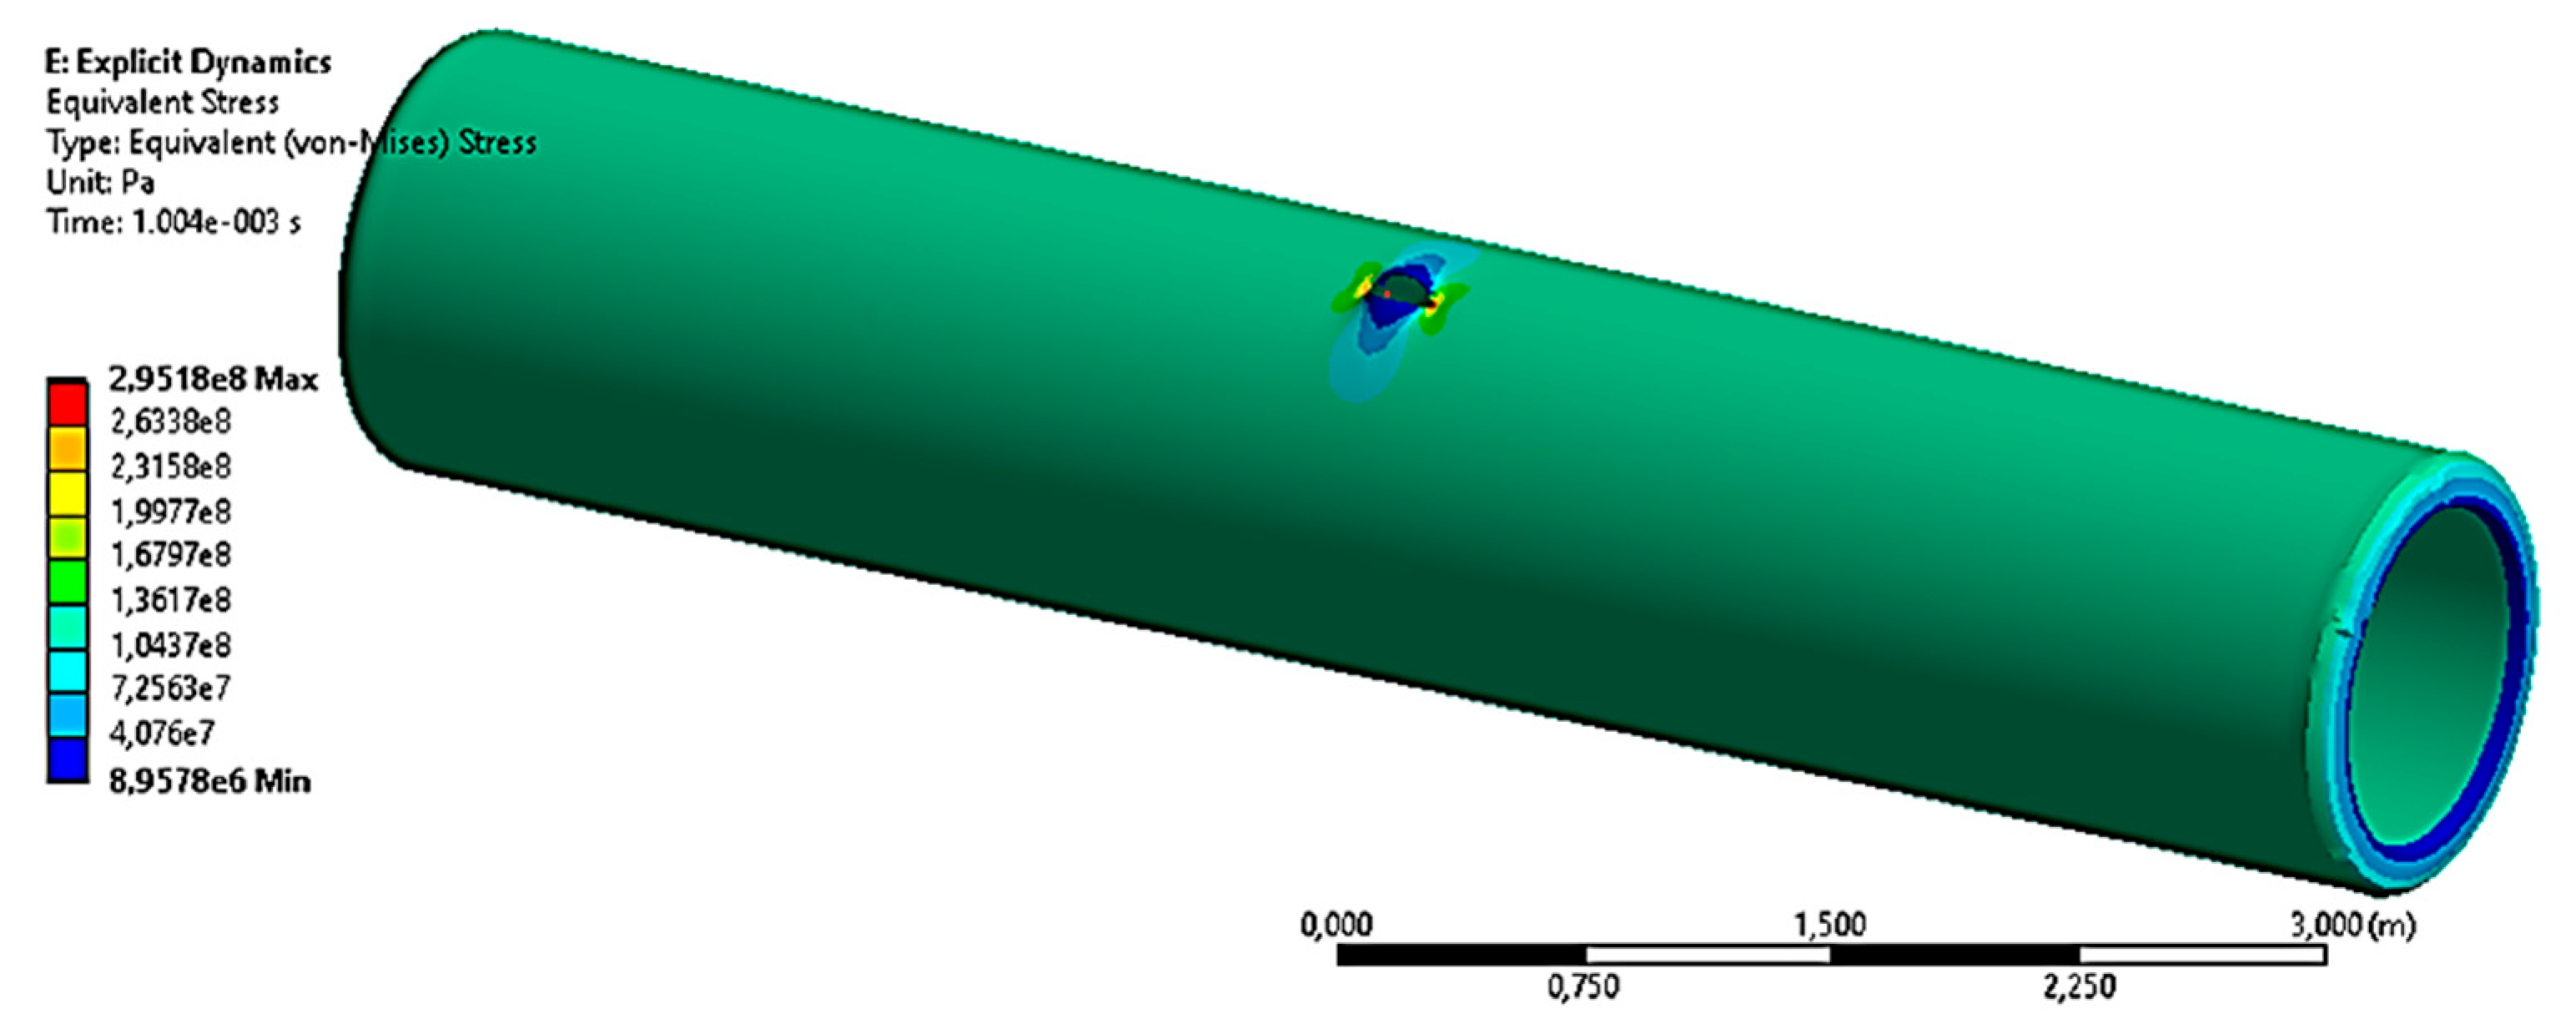
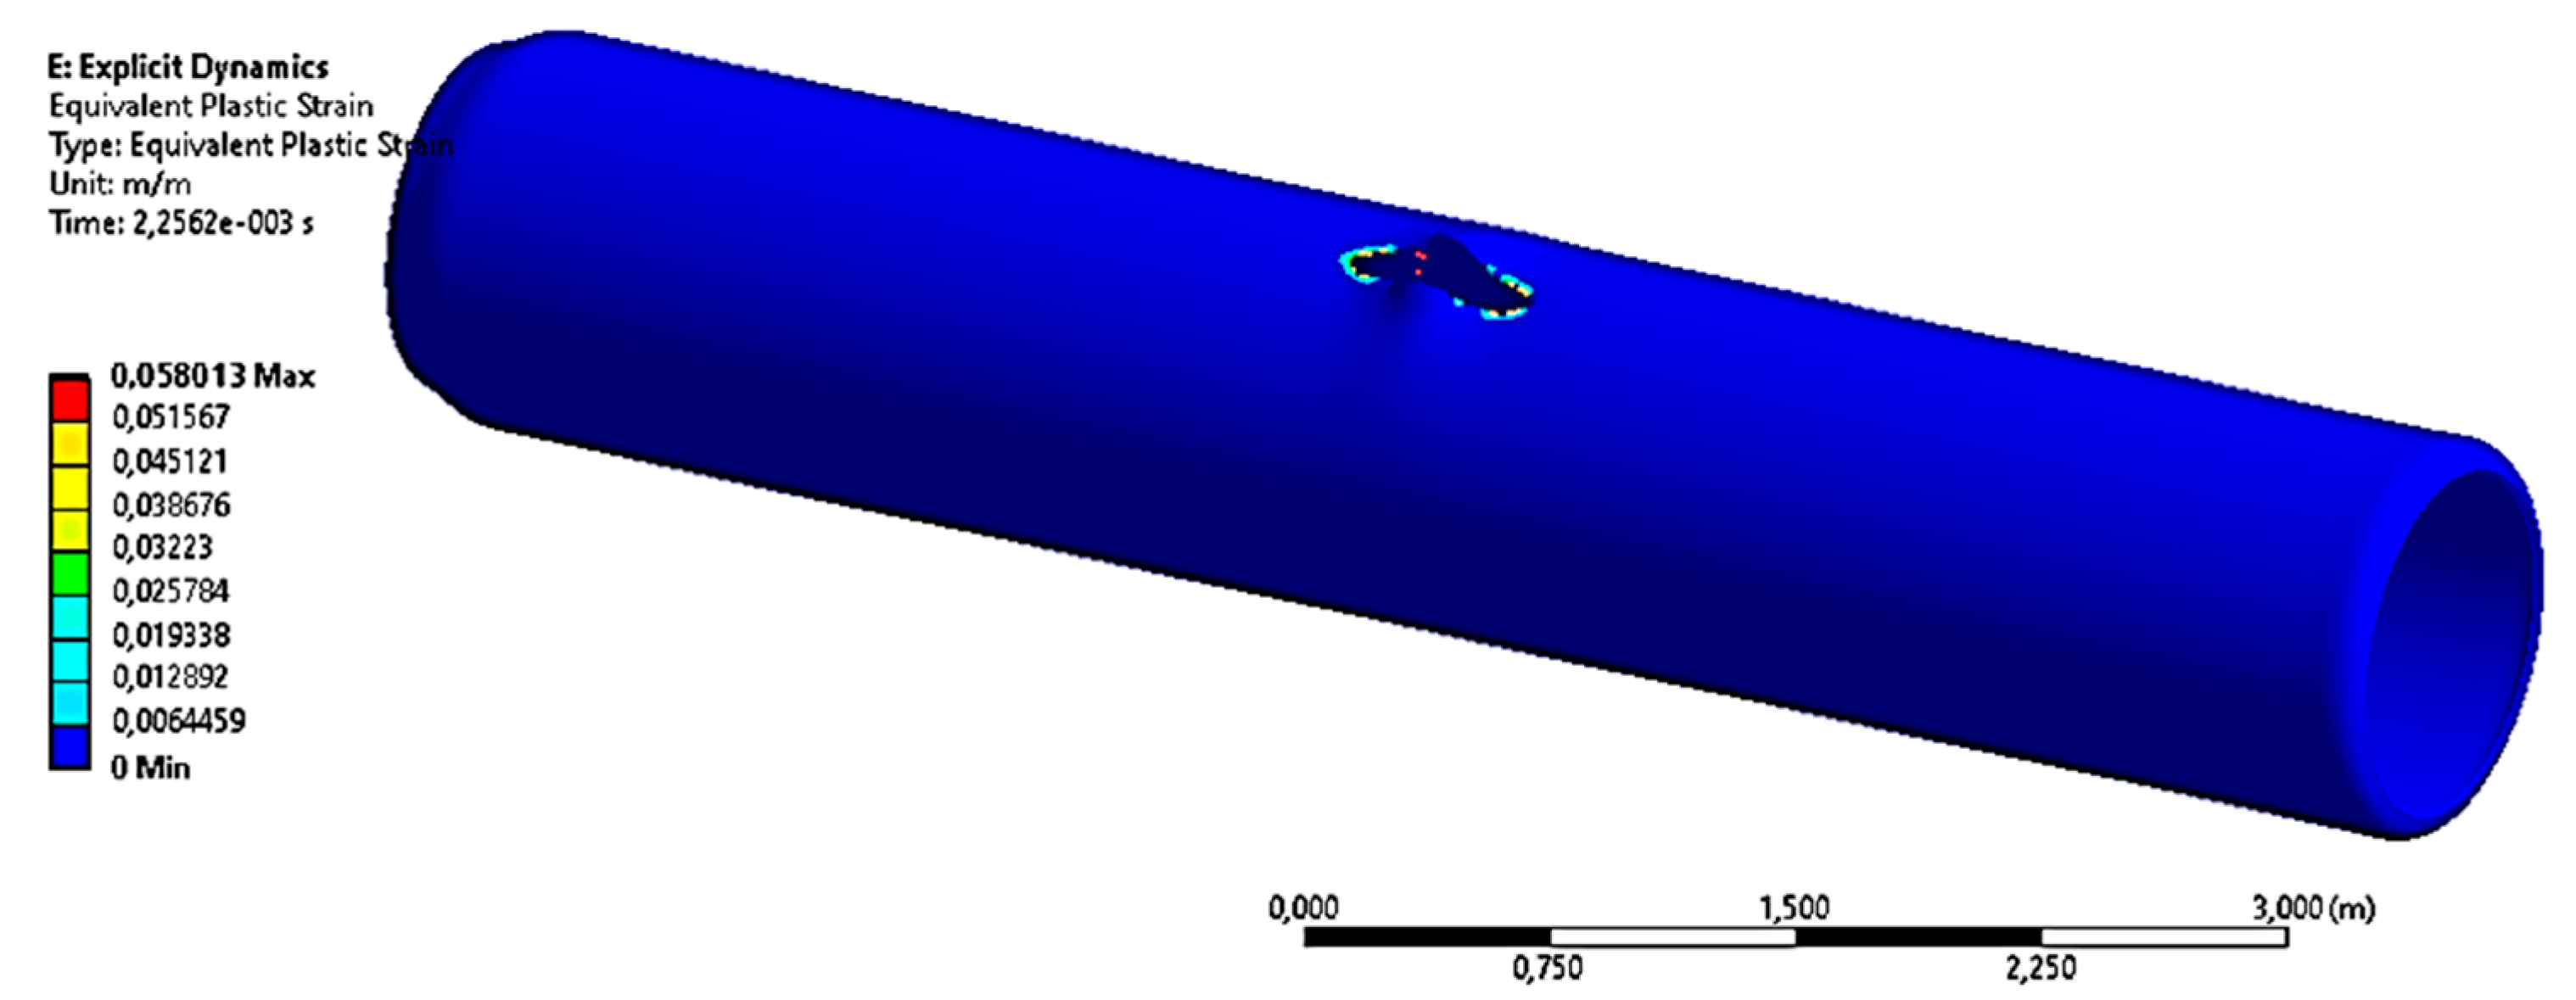
3.1. Results on the Stress–Strain State and Fracture of a Steel Gas Pipeline Section with an Incipient Crack-like Defect

The dynamics of the strain and fracture of a thin-walled pipeline section with a crack of 200 mm in length, 1.0 mm in width, and 0.5 hTp = 8.0 mm in depth was considered. For a better visualization of the numerical simulation results, the length of the pipeline was chosen to be 7.0 m (Figure 5). This length was sufficient to ensure that the edge effects did not affect the results of the stress–strain state and the fracture modeling in the damaged area.

3.1.1. The Case with the Operating Pressure P1 = 7.5 MPa

The finite-element modeling of the strain of the thin-walled pipeline section without a crack at working pressure showed that the pipeline structure deformed in the elastic area.
Figure 6 shows the displacements at the beginning of the growth of the longitudinal crack, i.e., at the time t = 1 ms. Within this time, the crack circumferentially expanded under the action of the internal pressure. At the same time, the crack deepened to the full thickness of the pipeline. Besides, from the time t = 1 ms, plastic strains began to develop at the crack tips, and the crack started to grow along the pipeline.
Figure 7 shows the equivalent stresses at time t = 1.0 ms. The variation of the stress state in the crack area was locally characterized.
Considering the passage of time, the crack grew up along the longitudinal direction. Within the time t = 2.25 ms, the stresses at the crack tips reached their maximum value (Figure 8).
Plastic strains developed at the crack tips. The remaining part of the pipeline deformed in the elastic area. Figure 9 instead shows the plastic strains at time t = 2.25 ms. The localization of the plastic strains in the crack tip areas was clearly observed. With the passage of time, the qualitative picture of the localization of the plastic strains in the crack tip area did not change.
The maximum stresses at the crack tips were held from the time t = 2.25 ms up to the time t = 3.5 ms. During all of this period, the crack grew up along the longitudinal direction. Figure 10 shows the equivalent stresses at time t = 3.5 ms. Within the time t = 3.75 ms, the growth of the crack along the longitudinal direction stopped. Figure 11 shows the displacements at the final period of the crack growing, i.e., at the time t = 3.75 ms. According to these numerical results, within the time t = 3.75 ms, the crack grew up along the pipeline from 0.2 up to 1.12 m.

3.1.2. The Case with the Maximum Pressure P2 = 9.8 MPa

The increment in internal pressure brought an increase in stresses along the pipeline and, consequently, a decrease in the time of crack development. Figure 12 shows the displacements at t = 0.75 ms, i.e., at the time of the initiation of the growth of the longitudinal crack. The stop of the growth of the longitudinal crack was conversely observed at time t = 3.5 ms (Figure 13). Together, the process of the crack growing along the longitudinal direction at the maximum pressure qualitatively slightly differed from the process of the crack growing at the working pressure. According to the finite-element results, the crack grew from 0.2 up to 1.18 m within the time t = 3.5 ms.

3.2. Results on the Stress–Strain State and Destruction of the Gas Pipeline in the Area of the Tip of the Crack-like Defect

The development of a through-crack in the area of its tip under the action of dynamic loading was considered [44]. The dynamic pressure, equal to P1max = 7.5 MPa, was applied as shown in Figure 4. An open crack with a length of 100 mm and a wall spacing of 1.0 mm was considered. Figure 14, Figure 15 and Figure 16 show the displacements along the pipeline at the time periods t = 1 ms, t = 2.25 ms, and t = 3.5 ms respectively. The analysis of the results showed that, within the time t = 1.0 ms, the size of the crack maintained its length of 100 mm. At the same time, the wall spacing increased and reached the value of 23 mm at the free edge. Further, within the time t = 2.25 ms, the wall spacing at the free edge increased by a factor equal to 2, while it increased by a factor equal to 3 within the time t = 3.5 ms. After that, the opening of the crack stopped.
Figure 17, Figure 18 and Figure 19 show the plastic strains along the pipeline at the time periods t = 1.0 ms, t = 2.25 ms, and t = 3.5 ms respectively. The results show that, up to the time t = 1.0 ms, any plastic deformation did not develop in the crack tip area. This was consistent with the fact that no crack elongation was observed before this time. Within the time t = 2.25 ms, plastic strains were directly concentrated in the crack tip area. The growth of the crack occurred along the pipeline. Moreover, within the time t = 3.5 ms, the plastic strains were concentrated along the lateral surface of the crack; thus, their growth stopped. The growth of the crack at its tip was noticed from the time t = 1.0 ms up to that equal to t = 3.5 ms, and from 100 mm until 580 mm in length. This was 3.4% higher than in the numerical calculation without taking the pressure on the crack-side walls into account.
Figure 20, Figure 21 and Figure 22 show the equivalent stresses in the pipeline at the time periods t = 1.0 ms, t = 2.25 ms, and t = 3.5 ms respectively. From the beginning of the numerical calculation until the time t = 3.5 ms, the maximum stresses were concentrated at the crack tip, while the minimum stresses were concentrated at the free edges of the crack. Considering the passage of time, the stresses in the pipeline decreased to a minimum. At this point, the growth of the crack stopped. Similar investigations of the crack growth in the area of its tip at the maximum pressure showed that, assuming the pressure on the edges of the crack, this fact led to a higher length of 3.6%. Together, the qualitative picture of the process of deformation and fracture of the pipeline in the area of the crack tip was preserved.
The aforementioned work presented one part of the authors’ research. On the basis of finite-element simulations performed by ANSYS-19.2 [68], the study of the fracture of steel gas pipelines under the influence of internal pressure on the propagation of an incipient crack in their tip area was implemented on the existing gas pipeline “Beineu–Bozoy–Shymkent” [59]. A cylindrical shell finite-element model was initially created (Figure 1, Figure 3 and Figure 4), and a step-by-step modeling technique was developed by the software package (Figure 2). Furthermore, the mechanical parameters of the steel material of the full-scale gas pipeline were determined [59], in which a qualitative finite-element model was similarly created (Figure 1, Figure 3 and Figure 4), and a stepwise methodology of modeling within the software package was developed (Figure 2). Besides, the mechanical characteristics of the material of the natural gas were achieved (Section 2.1).
Regarding the propagation of the incipient crack, it was established that, with an internal working pressure of 7.5 MPa (Section 3.1.1) at the beginning of the crack growth with a time indicator t = 1 ms, the crack expanded (displacement) in the circumferential direction by 0.036 m (Figure 6). From the time t = 2.25 ms up to t = 3.5 ms, the crack started to grow up along the longitudinal direction, while the crack growth due to the decompression of the structure stopped within the time t = 3.75 ms (Figure 9 and Figure 11). According to these findings, the crack on the gas pipeline increased by 5.6 times, i.e., from 0.2 m up to 1.12 m in the longitudinal direction. The value of the equivalent stress at time t = 1.0 ms was equal to 295 MPa (Figure 7). Considering the passage of time from t = 2.25 ms up to t = 3.5 ms, the equivalent stresses increased up to 453 MPa (Figure 8 and Figure 10). Besides, at the time t = 3.75 ms, the growth of the equivalent stresses stopped due to the gas decompression. Consequently, within the time t = 3.5 ms, the equivalent stresses increased by 1.53 times. The results corresponding to the maximum pressure of 9.8 MPa (Section 3.1.2) showed that the increment of the internal pressure led to an increase in stresses in the pipeline and, accordingly, a decrease in the time of crack development. Thus, the crack expansion (displacement) up to 0.026 m already started at the time t = 0.75 ms (Figure 1), while the stop of the growth of the longitudinal crack was observed at the time t = 3.5 ms with a displacement of 0.342 m (Figure 13). Based on the finite-element simulation results, it was found that, within the time t = 3.5 ms, the crack grew up 5.9 times, from 0.2 m up to 1.18 m, which, in turn, was an increment of 0.3 compared to the working pressure. The analysis of the equivalent stresses showed the same characteristic phenomenon at a working pressure of 7.5 MPa.
The aforementioned outcomes of the stress–strain state and destruction of the pipeline in the crack tip area under working pressure conditions (7.5 MPa) showed that, when analyzing the displacements in the form of crack extension in the annular direction as a function of time (t = 1.0 ms, t = 2.25 ms, and t = 3.5 ms), there is an increment of 23, 46, and 69 mm respectively, after which the crack opening stops (Figure 14, Figure 15 and Figure 16). The plastic strains in the form of crack elongation along the longitudinal direction from t = 1.0 ms, t = 2.25 ms, and t = 3.5 ms showed an increment of 5.8 times (Figure 17, Figure 18 and Figure 19). The analysis of the equivalent stresses at equal values of time demonstrated that, from the beginning of the calculation and up to t = 3.5 ms, the maximum stresses were concentrated at the crack tip, while the minimum ones were gathered at its free edges. Within the time t = 3.5 ms, the equivalent stresses conversely increased twice (Figure 20, Figure 21 and Figure 22) and after that, the growth of the crack stopped due to the gas decompression. The findings regarding the crack growth in the area of its tip at the maximum pressure (9.8 MPa) instead showed that, assuming the pressure on the edges of the crack, this led to a length higher than 3.6%. Together, the qualitative state of the deformation and fracture of the pipeline in the area of the crack tip did not change. It can also be noted that the influence of the temperature on the crack development was not taken into account and will be further investigated. For future investigations, a method for the localization of longitudinal fractures in steel gas pipelines with the application of prestressing will also be developed [59,60,61,62,63,64]. This methodology could be applied by national, international, and private companies engaged in natural gas transportation to the issue of gas pipelines strengthening without stopping their working operations.

4. Conclusions

In this work, studies were carried out on the dynamic deformation and fracture of thin-walled sections of steel gas pipelines with an external crack-like defect under the action of internal decreasing pressure. The research was performed on the basis of finite-element simulations using a cylindrical shell model executed by ANSYS-19.2 on the example of the thin-walled section of the gas pipeline “Beineu–Bozoy–Shymkent” in the Republic of Kazakhstan. The corresponding results showed that the operating pressure increment from the working to the critical one has a significant effect on crack propagation. Consequently, at the stage of modeling the displacements in conditions of working pressure, it was established that, within the time t = 1.0 ms, the crack expanded in the circumferential direction for 0.036 m. Further displacements occurred in the longitudinal direction, and the crack increased by 5.6 times. The maximum equivalent stresses were reached at time t = 3.5 ms, and with a value equal to 453 MPa. They increased 1.53 times with respect to their initial value. Within the time t = 3.75 ms, the growth of the equivalent stresses stopped due to gas decompression. At maximum pressure, similar results were qualitatively obtained. At that, the increment of the pressure from the operating (7.5 MPa) to the critical one (9.8 MPa) led to an increment of the crack length in the longitudinal direction by 0.3 times. The results of the stress–strain state and gas pipeline fracture in the tip zone at the operating pressure demonstrated that the distance between the crack walls reached 23 mm at the free edge within the time t = 1.0 ms. Conversely, within the times t = 2.25 ms and t = 3.5 ms, there were increments of two and three times respectively. The crack elongation in the longitudinal direction over time was instead equal to 5.8 times. In this case, within the time t = 3.5 ms, the equivalent stresses increased twice and, after that, the crack growth stopped due to gas decompression. Considerations on the crack growth in its tip area at the maximum pressure also showed that additional evaluations on the crack edge pressure resulted in an increment of 3.6% of the crack length value. The results were obtained for a temperature equal to +22 °C. The aforementioned developed models can be used for research on the dynamic deformation and fracture of steel gas pipelines subjected to temperatures ranging from −40 °C up to +50 °C.

Author Contributions

Conceptualization, N.Z., B.U. and U.I.; methodology, N.Z., U.I., M.B. and M.C.; investigation, N.Z.; data curation, N.Z., U.S., K.A. and U.I.; writing—original draft preparation, N.Z., U.I., M.C. and K.A.; writing—review and editing, N.Z. and U.I.; supervision, N.Z., M.B., A.U. and U.S.; project administration, N.Z., A.U., B.U. and M.C.; funding acquisition, N.Z. All authors have read and agreed to the published version of the manuscript.

Funding

This work was funded by the Science Committee of the Ministry of Science and Higher Education of the Republic of Kazakhstan (Grant No. AP19680589).

Institutional Review Board Statement

Not applicable.

Informed Consent Statement

Not applicable.

Data Availability Statement

Data is contained within the article.

Acknowledgments

The authors would like to thank the A. Pidhornyi Institute of Mechanical Engineering Problems of the National Academy of Sciences of Ukraine and the National Science and Technology Council (NSTC) of Taiwan for providing advisory assistance to this work.

Conflicts of Interest

The authors declare that they have no known competing financial interests or personal relationships that could have appeared to influence the work reported in this article.

References

  1. Junsang, P.; Jaturanonda, C.; Wuttipornpun, T.; Watcharejyothin, M. Liquefied Natural Gas Logistics Management Through Optimal Road-Rail Intermodal Logistics Planning Considering Community Safety: A Case Study in Thailand. Int. J. Knowl. Syst. Sci. 2023, 14, 1–25. [Google Scholar] [CrossRef]
  2. Peshkov, R.; Varkentin, V.; Ismagilov, D.; Mikhailov, E. Study of Strength Properties of the Designed Tank for Marine Transportation of Liquefied Natural Gas in the Arctic Conditions. Transp. Res. Procedia 2023, 68, 819–824. [Google Scholar] [CrossRef]
  3. Paul, W.; Frittelli, J. Rail Transportation of Liquefied Natural Gas: Safety and Regulation. 2020, p. 25. Available online: https://sgp.fas.org/crs/misc/R46414.pdf (accessed on 9 January 2024).
  4. Zhu, L.; Tang, Y.; Cao, S.; Jiang, J.; Wu, C.; Zhao, K. Enhanced anti-microbial corrosion of nano-CuO-loaded Ni coatings on pipeline steels in simulation environment of natural gas transportation pipeline. Ceram. Int. 2023, 49, 5543–5549. [Google Scholar] [CrossRef]
  5. Zhangabay, N.; Ibraimova, U.; Suleimenov, U.; Moldagaliyev, A.; Buganova, S.; Jumabayev, A.; Kolesnikov, A.; Tursunkululy, T.; Zhiyenkulkyzy, D.; Khalelova, A.; et al. Factors affecting extended avalanche destructions on long-distance gas pipe lines: Review. Case Stud. Constr. Mater. 2023, 19, e02376. [Google Scholar] [CrossRef]
  6. Annual Report of JSC Intergas Central Asia for 2019—Nur Sultan. 2020, p. 78. Available online: https://intergas.kz/ru/reports/88 (accessed on 4 December 2023).
  7. 11th Report of the European Gas Pipeline Incident Data Group (Period 1970—2019) December 2020. Available online: https://www.egig.eu/reports (accessed on 4 December 2023).
  8. UKOPA Pipeline Product Loss Incidents and Faults Report (1962–2020). Report Reference: 2020. Available online: https://www.ukopa.co.uk/published-documents/ukopa-reports/ (accessed on 4 December 2023).
  9. PHMSA. Pipelines and Hazardous Materials Safety Administration. Pipeline Incident 20 Year Trends. Available online: https://www.phmsa.dot.gov/data-and-statistics/pipeline/pipeline-incident-20-year-trends (accessed on 4 December 2023).
  10. Bonopera, M.; Chang, K.-C.; Lin, T.-K.; Tullini, N. Influence of prestressing on the behavior of uncracked concrete beams with a parabolic bonded tendon. Struct. Eng. Mech. 2021, 77, 1–17. [Google Scholar] [CrossRef]
  11. Bonopera, M.; Chang, K.-C.; Chen, C.-C.; Sung, Y.-C.; Tullini, N. Prestress force effect on fundamental frequency and de-flection shape of PCI beams. Struct. Eng. Mech. 2018, 3, 255–265. [Google Scholar] [CrossRef]
  12. Thongchom, C.; Jearsiripongkul, T.; Refahati, N.; Roudgar Saffari, P.; Roodgar Saffari, P.; Sirimontree, S.; Keawsawasvong, S. Sound Transmission Loss of a Honeycomb Sandwich Cylindrical Shell with Functionally Graded Porous Layers. Building 2022, 12, 151. [Google Scholar] [CrossRef]
  13. Kou, S.; Zhang, X.; Li, W.; Song, C. Dynamic Response Parameter Analysis of Steel Frame Joints under Blast Loading. Buildings 2022, 12, 433. [Google Scholar] [CrossRef]
  14. Wang, J.; Kusunoki, K. Study on the Flexural Strength of Interior Thick Wall-Thick Slab Joints Subjected to Lateral Force Using Finite-Element Analysis. Buildings 2022, 12, 535. [Google Scholar] [CrossRef]
  15. In the West Kazakhstan Region, a Worker Was Killed as a Result of a Gas Pipeline Rupture. Available online: https://www.kt.kz/rus/incidents/v_zko_v_rezuljtate_razriva_gazoprovoda_pogib_rabochij_1153537406.html (accessed on 1 December 2023).
  16. The Associated Press, Gas Line Explodes in Nigeria, Killing at Least 260, The New York Times. 2006. Available online: https://www.nytimes.com/2006/12/27/world/africa/27nigeria.html (accessed on 2 December 2023).
  17. Sewers Explode in Guadalajara, Mexico, Killing Hundreds, History. 2009. Available online: https://www.history.com/this-day-in-history/sewers-explode-in-guadalajara (accessed on 4 December 2023).
  18. Lagos Pipeline Blast Kills Scores, BBC News. 2006. Available online: http://news.bbc.co.uk/2/hi/africa/6209845.stm (accessed on 4 December 2023).
  19. Zardasti, L.; Yahaya, N.; Valipour, A.; Rashid, A.S.A.; Noor, N.M. Review on the identification of reputation loss indicators in an onshore pipeline explosion event. J. Loss Prev. Process Ind. 2017, 48, 71–86. [Google Scholar] [CrossRef]
  20. Natural Gas Explosion Kills Nearly 300 at Texas School, History. 2009. Available online: https://www.history.com/this-day-in-history/natural-gas-explosion-kills-schoolchildren-in-texas (accessed on 4 December 2023).
  21. Burned to Death in Kenya Pipeline Fire, The Telegraph. 2011. Available online: https://www.telegraph.co.uk/news/worldnews/africaandindianocean/kenya/ (accessed on 3 December 2023).
  22. Taiwan Gas Blasts in Kaohsiung Kill at Least 25, BBC News. 2014. Available online: https://www.bbc.com/news/world-asia-28594693 (accessed on 1 December 2023).
  23. SP RK EN 1993-4-3-2007-2011. Design of Steel Structures. Ch.4-3 Pipelines. Available online: https://online.zakon.kz/Document/?doc_id=34586480 (accessed on 1 December 2023).
  24. Sanitary Rules of the Republic of Kazakhstan EN 1998-4:2006/2012. Seismic Design. Part 4. Bunkers, Reservoirs and Pipelines. 2012. Available online: https://online.zakon.kz/Document/?doc_id=37105813&doc_id2=37807474#activate_doc=2&pos=1;-0.0999908447265625&pos2=3;-100.09999084472656 (accessed on 1 December 2023).
  25. API (American Petroleum Institute). API Specification 5L, 46th ed.; API: Washington DC, USA, 2018; Available online: https://buy-pipe.com/home/structure/item_214/955b42b7590d39be6f4d268afcd0a015.pdf (accessed on 4 December 2023).
  26. Eurocode 8: Design of Structures for Earthquake Resistance. Part 4: Silos, Tanks, and Pipelines. 2006. Available online: https://www.phd.eng.br/wp-content/uploads/2014/12/en.1998.4.2006.pdf (accessed on 4 December 2023).
  27. Eurocode 3: Design of Steel Structures. Part 4: Silos, Tanks, and Pipelines. 2005. Available online: https://www.phd.eng.br/wp-content/uploads/2015/12/en.1993.1.8.2005-1.pdf (accessed on 4 December 2023).
  28. ANSI/ASVE B 31G; Manual for Determining the Remaining Strength of Corroded Pipelines. ASME: New York, NY, USA, 1984. Available online: https://law.resource.org/pub/us/cfr/ibr/002/asme.b31g.1991.pdf (accessed on 3 December 2023).
  29. ANSI/ASVE B31.8-73 Gas Transmission and Distribution, Piping Systems. Available online: https://law.resource.org/pub/us/cfr/ibr/002/asme.b31.8.2003.pdf (accessed on 3 December 2023).
  30. Construction Regulations 284.1325800.2016. Field Pipelines for Oil and Gas. 2016. Available online: https://files.stroyinf.ru/Data2/1/4293742/4293742910.pdf (accessed on 3 December 2023).
  31. Leis, B.N.; Zhu, X.-K.; Forte, T.P.; Clark, E.B. Modeling Running Fracture in Pipelines—Past, Present, and Plausible Future Directions. 2015, pp. 1–7. Available online: https://www.researchgate.net/publication/237235879_Modeling_running_fracture_in_pipelines_-_Past_present_and_plausible_future_directions (accessed on 5 December 2023).
  32. Sugie, E.; Matsuoka, M.; Akiyama, T.; Mimura, H.; Kawaguchi, Y. A Study of Shear Crack Propagation in Gas-Pressurized Pipelines. J. Press. Vessel. Technol. 1982, 104, 338–343. [Google Scholar] [CrossRef]
  33. Sugie, E.; Kaji, H.; Taira, T.; Ohashi, M.; Sumitomo, Y. Shear Fracture Arrestability of Controlled Rolled Steel X70 Line Pipe by Full-Scale Burst Test. J. Energy Resour. Technol. 1984, 106, 55–62. [Google Scholar] [CrossRef]
  34. O’Donoghue, P.E.; Green, S.T.; Kanninen, M.F.; Bowles, P.K. The development of a fluid/structure interaction model for flawed fluid containment boundaries with applications to gas transmission and distribution piping. Comput. Struct. 1991, 38, 501–513. [Google Scholar] [CrossRef]
  35. O’Donoghue, P.E.; Kanninen, M.F.; Leung, C.P.; Demofonti, G.; Venzi, S. The development and validation of a dynamic fracture propagation model for gas transmission pipelines. Int. J. Press. Vessel. Pip. 1997, 70, 11–25. [Google Scholar] [CrossRef]
  36. Melenk, J.M.; Babuska, I. The Partition of Unity Finite Element Method: Basic Theory and Applications, Computer methods in Applied mechanics and Engineering. Comput. Methods Appl. Mech. Eng. 1996, 139, 289–314. [Google Scholar] [CrossRef]
  37. Moes, N.; Dolbow, J.; Belytschko, T. A finite element method for crack growth without remeshing. Int. J. Numer. Methods Eng. 1999, 46, 131–150. [Google Scholar] [CrossRef]
  38. Yang, X.B.; Zhuang, Z.; You, X.C.; Feng, Y.R.; Huo, C.Y.; Zhuang, C.J. Dynamic fracture study by an experiment/simulation method for rich gas transmission X80 steel pipelines. Eng. Fract. Mech. 2008, 75, 5018–5028. [Google Scholar] [CrossRef]
  39. Zhuang, Z.; O’Donoghue, P.E. The recent development of analysis methodology for rapid crack propagation and arrest in gas pipelines. Int. J. Fract. 2000, 101, 269–290. [Google Scholar] [CrossRef]
  40. Makino, H.; Sugie, T.; Watanabe, H.; Kubo, T.; Shiwaku, T.; Endo, S.; Inoue, T.; Kawaguchi, Y.; Matsumoto, Y.; Machida, S. Natural Gas Decompression Behavior in High Pressure Pipelines. ISIJ Int. 2001, 4, 389–395. [Google Scholar] [CrossRef]
  41. Dama, E.; Karamanos, S.A.; Gresnigt, A.M. Failure of Locally Buckled Pipelines. J. Press. Vessel. Technol. 2007, 129, 272–279. [Google Scholar] [CrossRef]
  42. Panda, S.K.; Sreenivasan, N.; Kuntz, M.L.; Zhou, Y. Numerical Simulations and Experimental Results of Tensile Test Behavior of Laser Butt Welded DP980 Steels. J. Eng. Mater. Technol. 2008, 130, 041003. [Google Scholar] [CrossRef]
  43. Nordhagen, H.O.; Kragset, S.; Berstad, T.; Morin, A.; Dørum, S.T. A new coupled fluid–structure modeling methodology for running ductile fracture. Comput. Struct. 2012, 94, 13–21. [Google Scholar] [CrossRef]
  44. Yan, Z.; Zhang, S.; Zhou, W. Model Error Assessment of Burst Capacity Models for Energy Pipelines Containing Surface Cracks. Int. J. Press. Vessel. Pip. 2014, 120, 80–93. Available online: https://www.academia.edu/29425274/Model_error_assessment_of_burst_capacity_models_for_energy_pipelines_containing_surface_cracks (accessed on 8 January 2024). [CrossRef]
  45. Zhu, X.K. Review of fracture control technology for gas transmission pipelines. In Proceedings of the 10th International Pipeline Conference, Calgary, AB, Canada, 29 September–3 October 2014; p. V003T07A004. [Google Scholar] [CrossRef]
  46. Di Biagio, M.; Demofonti, G.; Mannucci, G.; Iob, F.; Spinelli, C.M.; Schmidt, T. Development of a reliable model for evaluating the ductile fracture propagation resistance for high grade steel pipelines. In Proceedings of the 2012 9th International Pipeline Conference, Calgary, AB, Canada, 24–28 September 2012; pp. 24–28. [Google Scholar] [CrossRef]
  47. Fengping, Y.; Chunyong, H.; Jinheng, L.; He, L.I.; Yang, L.I. Crack Propagation and Arrest Simulation of X90 Gas Pipe. Int. J. Press. Vessel. Pip. 2017, 149, 120–131. [Google Scholar] [CrossRef]
  48. Ben, M.; Pluvinage, G.; Capelle, J.; Azari, Z. Modelling Crack Propagation and Arrest in Gas Pipes Using CTOA Criterion. In Fracture at all Scales; Springer: Cham, Switzerland, 2016; pp. 171–194. [Google Scholar]
  49. Zhang, X.; Lin, M.; Okodi, A.; Tan, L.; Leung, J.Y.; Adeeb, S. Numerical Analysis of API 5 L X42 and X52 Vintage Pipes With Cracks in Corrosion Defects Using Extended Finite Element Method. J. Press. Vessel. Technol. 2021, 143, 061302. [Google Scholar] [CrossRef]
  50. Shtremel, M.A.; Arabei, A.B.; Glebov, A.G.; Abakumov, A.I.; Esiev, T.S.; Pyshmintsev, I.Y. Dynamics of Extended Pipeline Failure. Metally 2020, 5, 1191–1198. [Google Scholar] [CrossRef]
  51. Zhangabay, N.; Sapargaliyeva, B.; Suleimenov, U.; Abshenov, K.; Utelbayeva, A.; Kolesnikov, A.; Baibolov, K.; Fediuk, R.; Arinova, D.; Duissenbekov, B.; et al. Analysis of stress—Strain state for a cylindrical tank wall defected zone. Materials 2022, 15, 5732. [Google Scholar] [CrossRef]
  52. Kaputkin, D.E.; Arabey, A.B. Two types of the crack arrest during full-scale pneumatic testing of main gas pipelines. Lett. Mater. 2021, 11, 239–243. [Google Scholar] [CrossRef]
  53. Zelmati, D.; Ghelloudj, O.; Amirat, A. Reliability estimation of pressurized API 5L X70 pipeline steel under longitudinal elliptical corrosion defect. Int. J. Adv. Manuf. Technol. 2016, 90, 2777–2783. [Google Scholar] [CrossRef]
  54. Dao, U.; Sajid, Z.; Khan, F.; Zhang, Y.; Tran, T. Modeling and analysis of internal corrosion induced failure of oil and gas pipelines. Reliab. Eng. Syst. Saf. 2023, 234, 109170. [Google Scholar] [CrossRef]
  55. Soomro, A.A.; Mokhtar, A.A.; Kurnia, J.C.; Lashari, N.; Sarwar, U.; Jameel, S.M.; Inayat, M.; Oladosu, T.L. A review on Bayesian modeling approach to quantify failure risk assessment of oil and gas pipelines due to corrosion. Int. J. Press. Vessel. Pip. 2022, 200, 104841. [Google Scholar] [CrossRef]
  56. Sliem, M.H.; Fayyad, E.; Abdullah, A.; Younan, N.; Al-Qahtani, N.; Nabhan, F.F.; Ramesh, A.; Laycock, N.; Ryan, M.; Maqbool, M.; et al. Monitoring of under deposit corrosion for the oil and gas industry: A review. J. Pet. Sci. Eng. 2021, 204, 108752. [Google Scholar] [CrossRef]
  57. Biezma, M.V.; Andrés, M.A.; Agudo, D.; Briz, E. Most fatal oil & gas pipeline accidents through history: A lessons learned approach. Eng. Fail. Anal. 2020, 110, 104446. [Google Scholar] [CrossRef]
  58. Available online: https://bsgp.kz (accessed on 7 December 2023).
  59. Zhangabay, N.; Suleimenov, U.; Utelbayeva, A.; Buganova, S. Experimental research of the stress-strain state of prestressed cylindrical shells taking into account temperature effects. Case Stud. Constr. Mater. 2022, 18, e01776. [Google Scholar] [CrossRef]
  60. Tursunkululy, T.; Zhangabay, N.; Avramov, K.; Chernobryvko, M.; Suleimenov, U.; Utelbayeva, A.; Duissenbekov, B.; Aikozov, Y.; Dauitbek, B.; Abdimanat, Z. Strength analysis of prestressed vertical cylindrical steel oil tanks under operational and dynamic loads. East.-Eur. J. Enterp. Technol. 2022, 2, 14–21. [Google Scholar] [CrossRef]
  61. Tursunkululy, T.; Zhangabay, N.; Avramov, K.; Chernobryvko, M.; Suleimenov, U.; Utelbayeva, A. Influence of the parameters of the pre-stressed winding on the oscillations of vertical cylindrical steel oil tanks. East.-Eur. J. Enterp. Technol. 2022, 5, 6–13. [Google Scholar] [CrossRef]
  62. Tursunkululy, T.; Zhangabay, N.; Suleimenov, U.; Abshenov, K.; Chernobryvko, M.; Utelbayeva, A. Analysis of strength and eigenfrequencies of a steel vertical cylindrical tank without liquid, reinforced by a plain composite thread. Case Stud. Constr. Mater. 2023, 18, e02019. [Google Scholar] [CrossRef]
  63. Tursunkululy, T.; Zhangabay, N.; Avramov, K.; Chernobryvko, M.; Kambarov, M.; Abildabekov, A.; Narikov, K.; Azatkulov, O. Oscillation frequencies of the reinforced wall of a steel vertical cylindrical tank for petroleum products depending on winding pre-tension. East.-Eur. J. Enterp. Technol. 2023, 3, 14–25. [Google Scholar] [CrossRef]
  64. Ibraimova, U.; Zhangabay, N.; Tursunkululy, T.; Rakhimov, M.; Dossybekov, S.; Kolesnikov, A.; Karshyga, G.; Tengebayev, N.; Zhirenbayeva, N.; Liseitsev, Y. Development of method for calculation of pre-strained steel cylindrical sheaths in view of the winding angle, pitch and thickness. Case Stud. Constr. Mater. 2023, 19, e02233. [Google Scholar] [CrossRef]
  65. Available online: https://zonakz.net/2021/03/12/iznos-kazaxstanskix-gazoprovodov-sostavlyaet-bolee-70/ (accessed on 7 December 2023).
  66. State Standard 14959-2016. Metal Products Made of Spring-Spring Non-Alloy and Alloy Steel. Technical Conditions. 2016, p. 32. Available online: https://files.stroyinf.ru/Data2/1/4293747/4293747278.pdf (accessed on 6 December 2023).
  67. Hallquist, J.O.; LS-DYNA Theory Manual. Livermore Software Technology Corporation (LSTC), Livermore, CA, 94551. 2006, p. 680. Available online: https://www.academia.edu/23076592/LS_DYNA_Theory_Manual_LIVERMORE_SOFTWARE_TECHNOLOGY_CORPORATION_LSTC (accessed on 6 December 2023).
  68. Available online: https://www.ansys.com/en-gb/news-center/press-releases/09-18-18-ansys-19-2-delivers-faster-problem-solving-capabilities-across-entire-portfolio (accessed on 7 December 2023).
Figure 1. Steel gas pipeline model: (a) a general view and (b) a diagram of the pipe section with a crack-like defect between the supports.
Applsci 14 01790 g001
Figure 2. Schematic diagram of the calculation module.
Applsci 14 01790 g002
Figure 3. The cylindrical shell finite-element model of the central part of the thin-walled steel gas pipeline section.
Applsci 14 01790 g003
Figure 4. Scheme of loading of the thin-walled pipe section in the crack-like defect tip area.
Applsci 14 01790 g004
Figure 5. Schematic diagram of the gas pipeline (Figure 1) for the finite-element simulation with a length of 7.0 m.
Applsci 14 01790 g005
Figure 6. Displacements at the moment of initiation of the longitudinal crack-like defect growth.
Applsci 14 01790 g006
Figure 7. Equivalent stresses at the moment of initiation of the longitudinal crack-like defect growth.
Applsci 14 01790 g007
Figure 8. Equivalent stresses at the time t = 2.25 ms.
Applsci 14 01790 g008
Figure 9. Plastic strains at the time t = 2.25 ms.
Applsci 14 01790 g009
Figure 10. Equivalent stresses at time t = 3.5 ms.
Applsci 14 01790 g010
Figure 11. Displacements at the moment of stopping the growth of the longitudinal crack-like defect.
Applsci 14 01790 g011
Figure 12. Displacements at the moment of initiation of the growth of the longitudinal crack-like defect at the maximum pressure.
Applsci 14 01790 g012
Figure 13. Displacements at the moment of stopping the growth of the longitudinal crack-like defect at the maximum pressure.
Applsci 14 01790 g013
Figure 14. Displacements at time t = 1.0 ms.
Applsci 14 01790 g014
Figure 15. Displacements at time t = 2.25 ms.
Applsci 14 01790 g015
Figure 16. Displacements at time t = 3.5 ms.
Applsci 14 01790 g016
Figure 17. Plastic strains at time t = 1.0 ms.
Applsci 14 01790 g017
Figure 18. Plastic strains at time t = 2.25 ms.
Applsci 14 01790 g018
Figure 19. Plastic strains at time t = 3.5 ms.
Applsci 14 01790 g019
Figure 20. Equivalent stresses at time t = 1.0 ms.
Applsci 14 01790 g020
Figure 21. Equivalent stresses at time t = 2.25 ms.
Applsci 14 01790 g021
Figure 22. Equivalent stresses at time t = 3.5 ms.
Applsci 14 01790 g022
Disclaimer/Publisher’s Note: The statements, opinions and data contained in all publications are solely those of the individual author(s) and contributor(s) and not of MDPI and/or the editor(s). MDPI and/or the editor(s) disclaim responsibility for any injury to people or property resulting from any ideas, methods, instructions or products referred to in the content.

