Abstract
A two-fluid, phase transition-based multiphase flow model is employed to simulate the dynamics of phase transition between liquid and vapor phases during shock wave and rarefaction wave propagation in underwater explosions. The aim is to understand the influence of a rigid wall on the cavitation evolution process and the cavitation collapse load, considering various charge quantities and water depths. The evolution of crucial physical qualities, such as the density, pressure, and the cavitation domain, within the flow field are analyzed and summarized. The presence of a rigid wall is found to significantly impact the cavitation evolution process in underwater explosions. It affects the shape, size, and dynamics of the cavitation domain, as well as the interaction between the explosion and the surrounding fluid. Specifically, the reflected wave on the wall influences the cavitation collapse load, leading to notable differences in the collapse time and collapse pressure compared to free-field conditions. Under different operating conditions, the size and position of the cavitation domain exhibit distinct changes. The proximity of the rigid wall results in unique patterns of cavitation domain evolution, which in turn lead to variations in the pressure distribution and the emergence of new cavitation regions. The findings of this study provide valuable insights into the behavior of cavitation and atomization induced by underwater explosions near the free surface. The understanding gained from these investigations can contribute to the development of effective safety measures and protective strategies in marine and underwater engineering applications. By accurately predicting and mitigating the effects of cavitation, it is possible to enhance the design and operation of underwater structures, ensuring their integrity and minimizing the potential risks associated with underwater explosions.
1. Introduction
The occurrence of cavitation during underwater explosions is an important phenomenon. The formation of cavitation domains significantly influences the propagation of underwater explosion loads and the resulting loads on structures. Furthermore, the shock loads generated by cavitation collapse can lead to a reloading effect on the surrounding structures, making the analysis and prediction of the impact responses of structures during underwater explosions more complex. Cavitation during underwater explosions is a phenomenon accompanied by the formation of cavities. Unlike common hydrodynamic cavitation, cavitation in underwater explosions is primarily caused by an intense rarefaction wave action, and the collapse of cavitation can cause damage to underwater structures and equipment [,,]. Currently, the evolution mechanism of cavitation in underwater explosions, especially its development and collapse mechanisms, as well as the characteristics of cavitation collapse loads, lack clear understanding. There is also a lack of widely accepted models for cavitation collapse loads, which to some extent hinders the improvement of the naval vessel blast resistance design and operational efficiency. Since the 1940s, the importance of cavitation effects on ship damage has been recognized. Foreign research institutions and scholars have conducted a series of studies on cavitation phenomena during underwater explosions, yielding a wealth of research outcomes that have laid a solid foundation for subsequent in-depth investigations. However, the understanding of cavitation evolution and collapse mechanisms as well as the characteristics of cavitation collapse loads remain unclear, demanding further research efforts in order to enhance the effectiveness of the naval vessel blast resistance design and utilization [,,,].
Early simulation methods for cavitation in underwater explosions were initially limited by the state of development in computational fluid dynamics and computational resources. The primary focus centered on the cavitation finite element (CAFE) method (Felippa and Deruntz) [,,]. These researchers utilized Newton’s cavitation method based on the CAFE to investigate the impact of fluid cavitation on the structural response. While the CAFE method demonstrated stability in predicting cavitation in underwater explosions, its computational requirements were excessive for three-dimensional models. To overcome these limitations, Sprague proposed the cavitating acoustic spectral element (CASE) method to enhance the computational efficiency of cavitation [,]. Subsequently, both the CAFE and CASE methods have been integrated into commercial software codes [,]. However, the theoretical assumptions of the acoustic finite element approach impose constraints, limiting its applicability to qualitatively analyze cavitation under weak shock wave conditions in the far field of underwater explosions. Its primary advantage lies in rapidly predicting the initiation time and approximate range of cavitation, but it cannot accurately forecast the evolutionary process and internal characteristics of the cavitation domain [,,,]. In contrast, interface tracking methods assume the existence of a distinct interface between the liquid and vapor phases of water and employ an iterative procedure to capture this interface [,]. The qualitative analysis of cavitation under weak shock wave conditions in far-field underwater explosions primarily focuses on predicting the initiation time and approximate range of cavitation, without accurately forecasting the evolution process and internal characteristics. This analysis method is typically based on the theoretical assumptions of the acoustic finite element theory, which postulates the existence of a distinct interface between the liquid and vapor phases and employs an iterative process to capture this interface. This method can be used to study cavitation phenomena under weak shock wave conditions, but due to the limitations of the theoretical assumptions, it cannot provide precise information about the internal details and evolutionary behavior of cavitation. This qualitative analysis approach is mainly used to quickly assess the initiation time and approximate range of cavitation, providing researchers with initial insights into cavitation phenomena. For more accurate predictions of the evolution process and internal characteristics of cavitation, more sophisticated numerical simulation methods such as interface tracking and multiphase flow methods are typically employed. These methods consider more physical processes and interactions to provide more detailed and accurate cavitation analysis results. However, these methods are computationally intensive and require more powerful computing resources and longer computation times. In summary, the qualitative analysis of cavitation under weak shock wave conditions in far-field underwater explosions mainly relies on the theoretical assumptions of the acoustic finite element theory, with a focus on predicting the initiation time and approximate range of cavitation to gain a preliminary understanding of cavitation phenomena. To obtain more accurate and detailed cavitation analysis results, more complex numerical simulation methods, as well as greater computational resources and time, are required.
In recent years, compressible, multiphase fluid methodologies have gained significant attention in the field of cavitation research. These approaches consider the fluid within the cavitation domain as a homogeneous mixture existing in a saturated state [,,,,,]. In these methodologies, both the liquid and vapor phases are treated as compressible fluids, and the phase transition between them plays a crucial role in cavitation generation and evolution. The interactions among water, explosion bubbles, cavitation, and air are nonlinear and robust, exerting a significant influence on shock wave propagation and bubble pulsation [,,]. It is important to note that the cavitation domain induced by underwater explosions near a free surface encompasses a substantial water area and requires appropriate treatment. Accurately simulating the extremely low pressures within the cavitation zone necessitates coupling with a cavitation model. In the context of compressible fluids, two primary approaches are commonly used for cavitation simulation: the one-fluid and two-fluid methods. Several well-developed models have been proposed to simulate cavitation using one-fluid approaches, such as the cut-off mode and Schmidt model [,,]. The isentropic one-fluid model considers the fluid as a mixture consisting of isentropic vapor and liquid phases []. To improve the original Schmidt model’s applicability in unsteady transient cavitation flow, a modified Schmidt model was introduced [,]. Furthermore, a novel isentropic cavitation model based on a reduced five-equation system was proposed specifically for investigating underwater explosion cavitation []. However, one significant drawback of one-fluid models is their inability to accurately capture the vapor–liquid two-phase transition during cavitation generation. To address this limitation, two-fluid models have emerged in the past decade. Pelanti and Shyue developed a multiphase model based on a six-equation system that efficiently handles interfaces, cavitation, and evaporation waves [,]. Another approach utilizes a four-equation system with a phase transition model to ensure thermodynamic equilibrium between the liquid and vapor phases [,]. This four-equation model with phase transitions has been successfully applied to study cavitation evolution in underwater explosions, effectively capturing the physical characteristics of the flow field within the cavitation domain [,]. Additionally, Zhang proposed an alternative phase transition model based on a five-equation system, which incorporates temperature and chemical relaxation with a monotonic mixture speed of sound [].
These advanced modeling approaches provide improved capabilities for simulating cavitation phenomena and capturing the complex dynamics of the vapor–liquid transition. They offer valuable insights into the evolution and behavior of cavitation in various scenarios, including underwater explosion cavitation. Our research team has undertaken an extensive exploration of cavitation phenomena induced by underwater explosions, yielding significant and novel discoveries [,]. In this paper, our primary focus centers on investigating the influence of a rigid wall on the cavitation dynamics induced by underwater explosions near the free surface. Specifically, we delve into the evolution of shock waves, explosion bubbles, and the intricate nature of cavitation. We utilized a phase transition model to investigate the cavitation process generated by three different charge masses under varying water depths. By the culmination of this article, we present a comprehensive analysis of the numerical results, reaching several noteworthy conclusions.
2. Numerical Method
The compressible nature of the multiphase flow involving explosive gas, air, liquid, and vapor water in underwater explosions near a free surface is well captured by considering these as compressible fluids. The utilization of a 4-equation model effectively portrays the dynamic behavior of these diverse, multiphase fluids throughout their motion process [] as follows:
where , , , ρ is the fluid density, and are velocity components of the -axis, respectively, is the pressure, is the total energy per unit mass, and is the mass fraction for the k-th species in the mixture fluid. The equation of state for each phase fluid is described by the Noble–Abel stiffened-gas (NASG) EOS [].
The 4-equation system (1) does not take into account the mass transfer between the liquid water and its vapor phase. In other words, the liquid water and its vapor phase in the mixture solved by Equation (1) are out of thermodynamic equilibrium. During the phase transition process, the mixture specific volume υ = 1/ρ and internal energy e do not vary under the assumptions of constant pressure and velocity. The mass fractions for the liquid and its vapor phase remain constant, although the pressure and temperature vary and reach their equilibrium values (p*, T*) so that the phase transition model will change to compute the equilibrium state (p*, T*, Yk=1,2) from the state (υ, e, p, T, Yk). Therefore, under the assumption of mechanical and thermal equilibriums, the mixture fluid satisfies [,] the following:
This system contains four unknown variables with four equations, which can be solved using the Newton iterative method. Therefore, the phase transition model ensures that the final equilibrium state (p*, T*) is saturated at each step. The numerical method of the multiphase compressible fluid model in this study has been previously validated in various cases involving phase transition in underwater explosion applications [,].
The control system (1) and (2) can be solved using a simple fractional step method that consists of the homogeneous hyperbolic step (step 1) and is followed by a relaxation step (step 2). In step 1, Equation (1) is solved using the MUSCL–Hancock method, using van Lee’s slope limiter and HLLC approximate Riemann solver. After the preliminary solution of the flow is provided, Equation (2) is solved using the Newton iterative method to obtain the final equilibrium solution after phase transition in step 2.
3. Results and Discussions
3.1. Testing and Verification
A shock wave tube case is tested with a different number of cells to verify the convergence properties of the phase transition model. This example has been provided by Chiapolino et al. (2017) [] using 100 cells. A two-phase mixture with initial mass fractions set to Y1 = 0.1 (liquid), Y2 = 0.2 (vapor), and Y3 = 0.7 (air) is considered in the shock tube, with an initial pressure ratio of 2 in a 1 m length tube. The initial condition is
Figure 1 displays the density, pressure, velocity, and vapor mass fraction distribution at time t = 1 ms. The dashed lines represent the initial conditions. The short-dashed lines represent the solutions without phase transition (no P-T), and the thick lines represent the present relaxation algorithm (P-T) with different cells. Due to the consideration of the phase transition in water, the transition from liquid phase to vapor phase occurs near the right shock wave front, resulting in an increase in the mass fraction of the gas phase and a decrease in the mass fraction of the liquid phase. As a result of the phase transition, the shock wave speed and temperature on the right side decreased. The current numerical results show good agreement with Chiapolino’s results.
Figure 1.
Numerical results for shock tube test with a two-phase mixture made of liquid water, vapor water, and air. The dashed lines represent the initial conditions. The short-dashed lines represent the solutions without phase transition (no P-T), and the thick lines represent the phase relaxation algorithm (P-T).
3.2. Effect of Rigid Wall on Small-Charge Underwater Explosion near Free Surface
In order to analyze the role of phase transition in the formation of cavitation and atomization during underwater explosions near the free surface, a two-dimensional axisymmetric model was employed to simulate an explosion generated by a 5.2 g equivalent of trinitrotoluene (TNT) at depths of 0.13 m and 80 m. To investigate the influence of a rigid wall on cavitation evolution, two simulation cases were designed, as depicted in Figure 2 and Figure 3. It should be noted that the rigid boundary conditions of two-dimensional axisymmetric models are equivalent to the wall conditions of rigid cylinders in a three-dimensional space.

Figure 2.
Schematic of underwater explosion near a free surface without a rigid wall (a) and mesh strategy of the fluid domain (b). Every 1 in 10 lines is plotted in the right figure.
Figure 3.
Schematic of underwater explosion near a free surface with a rigid wall (a) and mesh strategy of the fluid domain (b). Every 1 in 10 lines is plotted in the right figure.
Figure 2 illustrates the simulation setup without a rigid wall and showcases the mesh strategy employed. A non-uniform mesh scheme was utilized to enhance the computational efficiency, with the computational domain extending from (0, 7) m to (−7, 2) m. The initial radius of the charge, denoted as R0, was set to 0.009 m. The computational domain included a uniform zone (with a mesh size of Δx = Δy = R0/10) measuring 40R0 × 80R0, which facilitated the modeling of the motion of the explosion bubble. The symmetric axis (y-axis) was assigned an impenetrable boundary condition, while non-reflecting boundary conditions were applied to the surrounding boundaries. Figure 3 presents the simulation setup with a rigid wall and outlines the corresponding mesh strategy. In this case, a rigid wall was positioned at the right boundary. The initial conditions for both simulation cases were considered as follows:
By employing these simulation setups, the study aimed to investigate the effects of phase transition and the presence of a rigid wall on the formation and evolution of cavitation and atomization during underwater explosions. The chosen depth variations allowed for the examination of different scenarios and the assessment of the impact of water depth on the observed phenomena. These simulations enable a comprehensive understanding of the complex dynamics involved in underwater explosion-induced cavitation and contribute to the development of strategies for blast mitigation and the design of protective measures in marine and underwater engineering.
Figure 4 and Figure 5 illustrate the density, pressure, and cavitation domain characteristics during an underwater explosion near the free surface, with and without a rigid wall, at different time intervals. It is evident that the cavitation domain shapes in both cases are identical before 0.5 ms. This occurs because the compression wave reflected on the wall has not yet reached the cavitation zone, as depicted by the pressure contours in Figure 5. At t = 0.5 ms, the reflected compression wave reaches the surface of the cavitation domain, resulting in minimal differences between the cavitation domains in the two cases. As the reflected compression wave propagates from the rigid wall, the cavitation domain becomes smaller compared to the case without a rigid wall.
Figure 4.
Numerical results of density (top), pressure (middle), and cavitation domain (bottom) under the condition of an underwater explosion near the free surface without a rigid wall at t = 0.167, 0.333, 0.5, 0.666, 1.0, 4.17, 6.17, and 8.17 ms (from left to right). The red area represents the cavitation domain in the bottom contour plots.
Figure 5.
Numerical results of density (top), pressure (middle), and cavitation domain (bottom) under the condition of an underwater explosion near the free surface with a rigid wall at t = 0.167, 0.333, 0.5, 0.666, 1.0, 4.17, 6.17, and 8.17 ms (from left to right). The red area represents the cavitation domain in the bottom contour plots.
Figure 6 presents a comparison of the total volume variation in the cavitation domain with and without a rigid wall over time. It is evident that in an underwater explosion environment near the free surface, the growth and collapse processes of the cavitation domain are constrained by the presence of the rigid wall. This is because, while the explosion shock wave propagates to the water surface and reflects as a rarefaction wave, it also reflects as a new compression wave on the rigid wall. This compression wave continues to propagate towards the cavitation domain, causing its expansion and accelerating the collapse of cavitation.
Figure 6.
Comparison of the volume evolvement in cavitation domain under two cases.
Figure 7 displays the pressure–time history curves at underwater measurement points located at depths of 0.13 m and 0.4 m from the axis of symmetry, respectively, under the aforementioned two conditions. In the left picture of Figure 7, it can be observed that cavitation collapses earlier in the presence of a rigid wall, with the collapse pressure significantly higher than that without a rigid wall. The maximum cavitation pressure increases from 0.98 MPa to 3.7 MPa. The right figure in Figure 7 demonstrates that the reflected shock wave reaches the measurement point at t = 0.4 ms due to its distance of 0.5 m from the wall. Additionally, the existence of the rigid wall causes cavitation to collapse at an earlier stage.
Figure 7.
Pressure–time history curve of the measurement points at distances of 0.2 m (a) and 0.4 m (b) from the symmetry axis, at a depth of 0.13 m from the free surface.
Overall, these findings highlight the influence of a rigid wall on the cavitation phenomenon during underwater explosions near the free surface. The presence of the wall affects the cavitation domain size, collapse timing, and collapse pressure, emphasizing the importance of considering such factors in underwater explosion scenarios.
3.3. Effect of Rigid Wall on Medium-Charge Underwater Explosion near Free Surface
The formation of cavitation during underwater explosions near the free surface is a complex phenomenon influenced by multiple factors, including the water depth and charge size. Understanding these factors is crucial for predicting and mitigating the potential effects of underwater explosions. When considering the charge size, it becomes evident that a larger charge generates a stronger shock wave. The increased amount of explosive material leads to a higher energy release upon detonation, resulting in a more intense initial compression wave. This amplified shock wave propagates through the water, interacting with the surrounding medium and causing the formation of cavitation bubbles. On the other hand, the water depth plays a significant role in the propagation of the shock wave and its impact on cavitation formation. As the water depth increases, the shock wave’s strength diminishes as it travels towards the free surface. This attenuation occurs due to the energy dissipation and dispersion experienced by the shock wave as it interacts with the water column. Consequently, the intensity of cavitation near the free surface is somewhat mitigated compared to shallower depths.
The interplay between the charge size and water depth creates an interesting dynamic in cavitation formation. While a larger charge generates a stronger shock wave, which would typically lead to more significant cavitation effects, the greater water depth weakens the shock wave’s propagation towards the free surface. These counteractive effects result in a complex cavitation pattern that varies depending on the specific conditions of the underwater explosion. To delve deeper into the influence of charge size on cavitation, a simulation was conducted. Specifically, a 60 g TNT explosion at a depth of 1 m underwater was studied. By analyzing the evolution of cavitation in this scenario, we aimed to gain insights into the relationship between the charge size and cavitation dynamics near the free surface. Furthermore, we examined the impact of a rigid wall on the cavitation evolution process. By comparing scenarios with and without a rigid wall, we sought to understand how the presence of a boundary surface affects the cavitation characteristics. Important features, such as the cavitation duration, total volume, and collapse pressure, were scrutinized to assess the influence of the rigid wall on the cavitation behavior.
The computational models for the two operating conditions are illustrated in Figure 8 and Figure 9, respectively. The initial conditions, including the state parameters of the explosive gas, water, and air, remain the same as described previously.
Figure 8.
Schematic of underwater explosion near a free surface without a rigid wall (a) and mesh strategy of the fluid domain (b). Every 1 in 10 lines is plotted in the right figure.
Figure 9.
Schematic of underwater explosion near a free surface with a rigid wall (a) and mesh strategy of the fluid domain (b). Every 1 in 10 lines is plotted in the right figure.
Figure 10 illustrates the evolution of the flow field density, pressure, and cavitation domain during the process of cavitation generation near the free surface in the absence of a rigid wall (i.e., a free-field environment) at eight typical moments. Similarly, Figure 11 shows the evolution of the flow field density, pressure, and cavitation domain at the same eight typical moments with the presence of a rigid wall. Comparing Figure 10 and Figure 11 reveals that due to the presence of the rigid wall, the shock wave reflects and generates new compression waves at the wall. Prior to t = 2 ms, the two operating conditions are relatively similar. However, at t = 2.6 ms, the cavitation domain temporarily disappears in the case with the rigid wall, only to reappear near the water surface at t = 3 ms and 4 ms, which is a new phenomenon not observed in the other operating condition. These effects are primarily caused by the reflection of waves at the wall.

Figure 10.
Numerical results of density (top), pressure (middle), and cavitation domain (bottom) under the condition of an underwater explosion near the free surface without a rigid wall at t = 0.8, 1.2, 1.6, 2.0, 2.6, 3.0, 4.0, and 6.0 ms (from left to right). The red area represents the cavitation domain in the bottom contour plots.
Figure 11.
Numerical results of density (top), pressure (middle), and cavitation domain (bottom) under the condition of an underwater explosion near the free surface with a rigid wall at t = 0.8, 1.2, 1.6, 2.0, 2.6, 3.0, 4.0, and 6.0 ms (from left to right). The red area represents the cavitation domain in the bottom contour plots.
Figure 12 presents the evolution of the cavitation volume over time for the two operating conditions. It can be observed that the presence of a rigid wall leads to two occurrences of cavitation in the flow field. Compared to the condition without a rigid wall, the complete collapse of the first cavitation event is accelerated from 2.86 ms to 2.56 ms. Although the volume of the second cavitation event is smaller, its duration is longer. Figure 13 displays the pressure–time curves at measurement points located at distances of 0.5 m and 1.0 m from the symmetry axis, at a water depth of 0.2 m. From Figure 13, it is evident that the presence of a rigid wall has a significant impact on the collapse pressure of cavitation induced by a moderate charge size underwater. Not only does the rigid wall cause cavitation to collapse earlier, but it also significantly increases the collapse pressure. These findings highlight the influence of a rigid wall on the dynamics of cavitation during underwater explosions. The presence of the wall alters the cavitation evolution, resulting in an earlier collapse and increased collapse pressure. These insights contribute to a better understanding of the intricate interactions between the charge size, water depth, and rigid boundaries in underwater explosion-induced cavitation phenomena.

Figure 12.
Comparison of the volume evolvement in cavitation domain under two cases.
Figure 13.
Pressure–time history curve of the measurement point at distances of 0.5 m (a) and 1.0 m (b) from the symmetry axis, at a depth of 0.2 m from the free surface.
The findings of this section contribute to our understanding of the complex interplay between the charge size, water depth, and the presence of boundaries in underwater explosion-induced cavitation near the free surface. Such knowledge is invaluable for various applications, ranging from underwater blast mitigation strategies to the design and safety considerations of marine structures and vehicles operating in explosive environments. Continued research in this field is crucial for advancing our understanding and developing effective measures to mitigate the potentially destructive effects of underwater explosions.
3.4. Effect of Rigid Wall on Large-Charge Underwater Explosion near Free Surface
To further investigate the impact of the charge size and the presence of a rigid wall on cavitation evolution, we conducted simulations of explosions involving a large quantity of explosive in deeper water. Specifically, we selected a TNT charge weighing 100 kg and detonated it at a depth of 2 m underwater. Figure 14 and Figure 15 depict the distribution of the free-field environment and the calculation model area under the influence of a rigid wall, respectively.
Figure 14.
Schematic of underwater explosion near a free surface without a rigid wall (a) and mesh strategy of the fluid domain (b). Every 1 in 10 lines is plotted in the right figure.
Figure 15.
Schematic of underwater explosion near a free surface with a rigid wall (a) and mesh strategy of the fluid domain (b). Every 1 in 10 lines is plotted in the right figure.
In Figure 14, except for the left boundary, which is assigned a symmetrical boundary condition, all other boundaries are set as non-reflective boundary conditions. This configuration allows for the accurate representation of the explosion dynamics and the resulting cavitation evolution in an unrestricted environment. Figure 15, on the other hand, incorporates the presence of a rigid wall. In this case, the left boundary is a symmetrical boundary, the right boundary represents the rigid wall condition, and the upper and lower boundaries are the non-reflective boundary conditions. This setup allows for the examination of the interaction between the explosion, cavitation, and the rigid wall.
The initial fluid state of the explosive gas, water, and air within the calculation domain remains consistent with the conditions described earlier. These simulations provide valuable insights into the behavior of cavitation under the influence of larger explosive charges and the presence of rigid boundaries, contributing to a deeper understanding of underwater explosion-induced cavitation phenomena. Such knowledge can inform the development of safety measures and protective strategies in various marine and underwater engineering applications.
Figure 16 and Figure 17 depict the evolution of the flow field density, pressure, and cavitation domain under two different operating conditions. The selected flow field size and position are identical in both cases. Prior to t = 14 ms, it can be observed that the cavitation domain is similar under the two operating conditions. However, at t = 14 ms, the reflected wave from the solid wall boundary is fully reflected into the cavitation domain. From this point onwards, due to the propagation of reflected waves within the cavitation domain, the boundary of the cavitation domain with the wall appears smoother and more rounded compared to the sharper boundary shape observed in the free-field condition. At t = 26 ms and 30 ms, a noteworthy observation is the emergence of a new cavitation region beneath the explosion bubble in the case with the wall. Additionally, the cavitation domain above the bubble is larger compared to the free-field condition. At t = 36 ms, the cavitation domain vanishes under both operating conditions, yet there is a noticeable difference in the pressure distribution within the flow field. In the case of a free-field explosion, a high-pressure zone emerges in the area above the bubble. Conversely, in the case with a rigid wall, high-pressure zones appear on both sides below the bubble. This discrepancy arises primarily from the contrasting effects of the reflected wave on the wall and the cavitation collapse load.

Figure 16.
Numerical results of density (top), pressure (middle), and cavitation domain (bottom) under the condition of an underwater explosion near the free surface without a rigid wall at t = 0.8, 1.2, 1.6, 2.0, 2.6, 3.0, 4.0, and 6.0 ms (from left to right). The red area represents the cavitation domain in the bottom contour plots.
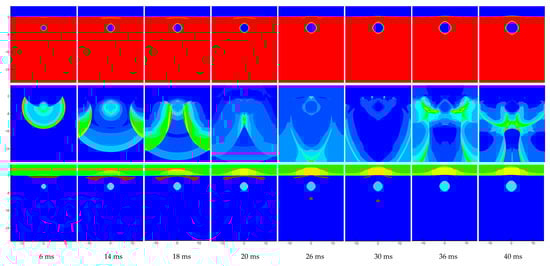
Figure 17.
Numerical results of density (top), pressure (middle), and cavitation domain (bottom) under the condition of an underwater explosion near the free surface with a rigid wall at t = 6, 14, 18, 20, 26, 30, 36, and 40 ms (from left to right). The red area represents the cavitation domain in the bottom contour plots.
Figure 18 illustrates the evolution of the cavitation domain volume over time under the aforementioned operating conditions. It is evident that the presence of a rigid wall results in the compression of cavitation before it reaches its maximum volume, as observed in the free-field environment. Consequently, the cavitation volume experiences a sharp decrease and remains at a smaller volume for an extended period, without completely disappearing. Figure 19 presents the pressure–time history curves recorded at two measurement points: one located 2 m underwater and the other at horizontal distances of 4 m and 8 m from the axis of symmetry. The impact of the solid wall boundary becomes apparent in the significant differences observed in the collapse time and collapse pressure of the cavitation domain. Due to the presence of the rigid wall, the collapse time of cavitation is advanced from t = 34 ms to t = 32 ms, and the peak pressure of cavitation collapse at 4 m increases from 1.24 MPa to 3.14 MPa. The change in the collapse time for the cavity at 8 m is similar to that at 4 m, but the peak pressure of cavitation collapse decreases from 2.66 MPa to 0.96 MPa. The decrease in the peak pressure at 8 m can be attributed to the fact that this position is not within the cavitation region, and the influence of the cavitation collapse is diminished.
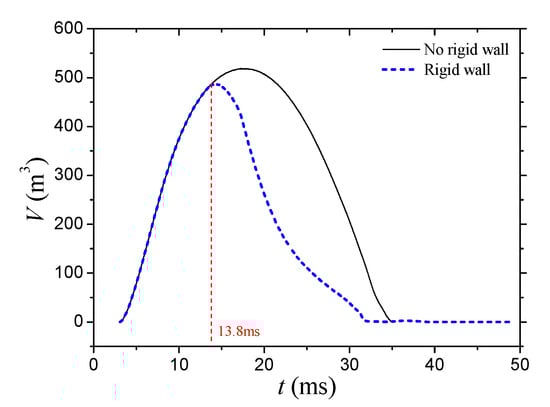
Figure 18.
Comparison of the volume evolvement in cavitation domain under two cases.
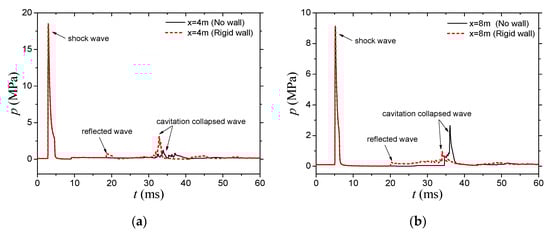
Figure 19.
Pressure–time history curve of the measurement point at distances of 4 m (a) and 8 m (b) from the symmetry axis, at a depth of 2.0 m from the free surface.
4. Conclusions
This paper explores the characteristics of cavitation and atomization induced by underwater explosions near the free surface using a multiphase flow model based on the two-fluid phase transition approach. The numerical method employed in this study allows for the modeling of phase transitions between the liquid and vapor phases during the propagation of shock waves and rarefaction waves in underwater explosions. The influence of a rigid wall on the cavitation evolution process and the cavitation collapse load is investigated under different conditions, including variations in the charge quantity and water depth. The study also examines the evolution of important physical qualities such as the density, pressure, and cavitation domain within the flow field. By analyzing the computational phenomena and summarizing the results, several conclusions can be drawn:
- (1)
- The presence of a rigid wall significantly affects the cavitation evolution process in underwater explosions. It influences the shape, size, and dynamics of the cavitation domain, as well as the interaction between the explosion and the surrounding fluid.
- (2)
- The cavitation collapse load is influenced by the existence of a rigid wall. The collapse time and collapse pressure of the cavitation domain are significantly different compared to the free-field condition. These differences arise from the interaction between the reflected wave on the wall and the cavitation collapse load.
- (3)
- The size and position of the cavitation domain undergo notable changes under different operating conditions. The proximity of the rigid wall leads to distinct patterns in the cavitation domain evolution, resulting in variations in the pressure distribution and the emergence of new cavitation regions.
By investigating these phenomena and analyzing the computational results, this study provides valuable insights into the behavior of cavitation and atomization induced by underwater explosions near the free surface. The findings contribute to a deeper understanding of the complex dynamics involved, aiding in the development of safety measures and protective strategies in marine and underwater engineering applications. It is important to note that several conclusions presented in this paper are qualitative in nature and derived from two-dimensional models. Although the cases presented demonstrate numerous merits and the model itself is time consuming and reliable, there is still room for further improvement. Future research endeavors will focus on incorporating three-dimensional models, fluid–structure interactions, adaptive mesh refinement, and detonation reactions to enhance the accuracy and comprehensiveness of the findings.
Author Contributions
Conceptualization, J.Y., X.Z. and Y.X.; methodology, J.Y., Y.Z. and L.Z.; software, J.Y. and Y.Z.; validation, J.C. and Y.X.; formal analysis, J.C.; investigation, Y.Z.; resources, J.Y. and Y.X.; data curation, L.Z.; writing—original draft preparation, J.Y.; writing—review and editing, X.Z.; visualization, J.C.; supervision, X.Z.; project administration, J.Y. and X.Z. All authors were involved in the preparation of the manuscript. All authors have read and agreed to the published version of the manuscript.
Funding
This research received no external funding.
Institutional Review Board Statement
Not applicable.
Informed Consent Statement
Not applicable.
Data Availability Statement
The data that support the finding of this study are available from the corresponding author upon reasonable request.
Conflicts of Interest
The authors declare no conflict of interest.
References
- Kedrinskii, V.K. Hydrodynamics of Explosion-Experiments and Models; Springer: Berlin/Heidelberg, Germany, 2005; p. 223. [Google Scholar]
- Chen, Y.; Heister, S.D. A numerical treatment for attached cavitation. J. Fluid Eng. 1994, 116, 613. [Google Scholar] [CrossRef]
- Rachid, F.; Felipe, B. A thermodynamically consistent model for cavitating flows of compressible fluids. Int. J. Nonlin Mech. 2003, 38, 1007. [Google Scholar] [CrossRef]
- Nikita, P.V.; Alexander, A.S. Multiphase phenomena in underwater explosion. Exp. Therm. Fluid Sci. 2015, 60, 367. [Google Scholar]
- Xie, W.F.; Liu, T.G.; Khoo, B.C. Application of a one-fluid model for large scale homogeneous unsteady cavitation: The modified Schmidt model. Comput. Fluids 2006, 35, 1177. [Google Scholar] [CrossRef]
- Phan, T.H.; Nguyen, V.T.; Park, W.G. Numerical study on strong nonlinear interactions between spark- generated underwater explosion bubbles and a free surface. Int. J. Heat Tran. 2020, 163, 120506. [Google Scholar] [CrossRef]
- Yu, J.; Liu, G.Z.; Wang, J.; Wang, H.K. An effective method for modeling the load of bubble jet in underwater explosion near the wall. Ocean Eng. 2021, 220, 108408. [Google Scholar] [CrossRef]
- Felippa, C.A.; DeRuntz, J.A. Finite element analysis of shock-induced hull cavitation. Comput. Methods Appl. Mech. Eng. 1984, 44, 297. [Google Scholar] [CrossRef]
- Sprague, M.A.; Geers, T.L. A spectral-element method for modeling cavitation in transient fluid-structure interaction. J. Comput. Phys. 2003, 184, 149. [Google Scholar] [CrossRef]
- Sprague, M.A. Advanced Computational Techniques for the Analysis of 3-D Fluid-Structure Interaction with Cavitation. Ph.D. Thesis, University of Colorado at Boulder, Boulder, CO, USA, 2002. [Google Scholar]
- Stefan, S.; Austen, A. Fluid structure Interaction-preliminary assessment of LS-DYNA/USA acoustic shock methods. In Proceedings of the 80th Shock and Vibration Symposium, San Diego, CA, USA, 25–29 October 2009. [Google Scholar]
- Ranlet, D.; Daddazio, R.; Weidlinger, A. A submerged shock response problem suitable for use as a benchmark. In Proceedings of the 67th Shock and Vibration Symposium, Arlington, VA, USA, 18–22 November 1996. [Google Scholar]
- Yu, J.; Liu, J.H.; Wang, H.K.; Wang, J.; Zhang, L.P.; Liu, G.Z. Numerical simulation of underwater explosion cavitation characteristics based on phase transition model in compressible multicomponent fluids. Ocean. Eng. 2021, 240, 109934. [Google Scholar] [CrossRef]
- Yu, J.; Liu, J.H.; Wang, H.K.; Wang, J.; Zhou, Z.T.; Mao, H.B. Application of two-phase transition model in underwater explosion cavitation based on compressible multiphase flows. AIP. Advs. 2022, 12, 025209. [Google Scholar] [CrossRef]
- Shukla, R.K.; Pantano, C.; Freund, J.B. An interface capturing method for the simulation of multi-phase compressible flows. J. Comput. Phys. 2010, 229, 7411–7439. [Google Scholar] [CrossRef]
- Wang, G.H.; Zhang, S.R.; Yu, M.; Li, H.B.; Kong, Y. Investigation of the shock wave propagation characteristics and cavitation effects of underwater explosion near boundaries. Appl. Ocean. Res. 2014, 16, 40. [Google Scholar] [CrossRef]
- Deshpande, M.; Feng, J.; Merkle, C.L. Cavity flow predictions based on the Euler equations. J. Fluid. Eng. 1994, 116, 36. [Google Scholar] [CrossRef]
- Deshpande, M.; Feng, J.; Merkle, C.L. Numerical modeling of the thermodynamic effects of cavitation. J. Fluid. Eng. 1997, 119, 420. [Google Scholar] [CrossRef]
- Daramizadeh, A.; Ansari, M.R. Numerical simulation of underwater explosion near air-water free surface using a five-equation reduced model. Ocean. Eng. 2015, 110, 25. [Google Scholar] [CrossRef]
- Qin, J.R.; Yu, S.J.; Lai, M.C. Direct calculations of cavitating flows in fuel delivery pipe by the space-time CE/SE method. SAE Trans. 1999, 108, 1720. [Google Scholar]
- Aanhold, J.E.; Meijer, G.J.; Lemmen, P.P.M. Underwater shock response analysis on a floating vessel. Shock Vib. 1998, 5, 53. [Google Scholar] [CrossRef]
- Schmidt, D.P.; Rutland, C.J.; Corradini, M.L. A fully compressible, two-dimensional model of small, high speed, cavitating nozzles. Atomiz Sprays. 1999, 9, 255. [Google Scholar] [CrossRef]
- Rungsiyaphornrata, S.; Klaseboerb, E.; Khoo, B.C.; Yeo, K.S. The merging of two gaseous bubbles with an application to underwater explosions. Comput. Fluid 2003, 32, 1049. [Google Scholar] [CrossRef]
- Liu, T.G.; Khoo, B.C.; Xie, W.F. Isentropic one-fluid modelling of unsteady cavitating flow. J. Comp. Phys. 2004, 201, 80. [Google Scholar] [CrossRef]
- Zhang, A.M.; Li, S.M.; Cui, P.; Li, S.; Liu, Y.L. A unified theory for bubble dynamics. Phys. Fluids 2023, 35, 033323. [Google Scholar] [CrossRef]
- Pelanti, M.; Shyue, K.M. A mixture-energy-consistent six-equation two-phase numerical model for fluid with interfaces, cavitation and evaporation waves. J. Comput. Phys. 2014, 259, 331. [Google Scholar] [CrossRef]
- Pelanti, M.; Shyue, K.M. A numerical model for multiphase liquid-vapor-gas flows with interfaces and cavitation. Int. J. Multiphase. Flow. 2019, 113, 208. [Google Scholar] [CrossRef]
- Chiapolino, A.; Boivin, P.; Saurel, R. A simple phase transition relaxation solver for liquid–vapor flows. Int. J. Numer. Methods Fluids 2016, 83, 583. [Google Scholar] [CrossRef]
- Chiapolino, A.; Boivin, P.; Saurel, R. A simple and fast phase transition relaxation solver for compressible multicomponent two-phase flows. Comput. Fluids 2017, 150, 31. [Google Scholar] [CrossRef]
- Zhang, J. A simple and effective five-equation two-phase numerical model for liquid-vapor phase transition in cavitating flows. Int. J. Multiph. Flow. 2021, 132, 103417. [Google Scholar] [CrossRef]
- Metayer, L.; Saurel, R. The Noble-Abel Stiffened-Gas equation of state. Phys. Fluids 2016, 28, 046102. [Google Scholar] [CrossRef]
Disclaimer/Publisher’s Note: The statements, opinions and data contained in all publications are solely those of the individual author(s) and contributor(s) and not of MDPI and/or the editor(s). MDPI and/or the editor(s) disclaim responsibility for any injury to people or property resulting from any ideas, methods, instructions or products referred to in the content. |
© 2024 by the authors. Licensee MDPI, Basel, Switzerland. This article is an open access article distributed under the terms and conditions of the Creative Commons Attribution (CC BY) license (https://creativecommons.org/licenses/by/4.0/).