Article

Associations and Within-Group Differences in Physical Characteristics and Golf Performance Data in High-Level Amateur Players

1
London Sport Institute, Middlesex University, London NW4 1RL, UK
2
Medical and Scientific Department, The R&A, St. Andrews KY16 9JD, UK
3
European Tour Health and Performance Institute, European Tour Group, Virginia Water GU25 4LS, UK
4
Cambridge Centre for Sport & Exercise Sciences, Anglia Ruskin University, Cambridge CB1 1PT, UK
*
Author to whom correspondence should be addressed.
Appl. Sci. 2024, 14(5), 1854; https://doi.org/10.3390/app14051854
Submission received: 2 February 2024 / Revised: 19 February 2024 / Accepted: 22 February 2024 / Published: 23 February 2024
(This article belongs to the Special Issue Sports Biomechanics and Sports Technology)

Abstract

:
The aim of the present study was to assess the relationship between a comprehensive physical testing battery and golf performance, as quantified through a variety of previously determined usable metrics from launch monitor data. Twenty-six high-level, amateur golfers undertook a series of physical assessments, including anthropometry measurements, isometric mid-thigh pull (IMTP), isometric bench press, countermovement jump (CMJ), seated medicine ball throws for distance, and seated thoracic rotation tests. In addition, golf shot data were recorded in an indoor biomechanics laboratory, with a driver and 6-iron to quantify clubhead speed (CHS), ball speed, carry distance, and smash factor. Pearson’s r associative analyses showed that the strongest relationships with the golf shot data were with the isometric bench press for the upper body (r values up to 0.76) and countermovement jump for the lower body (r values up to 0.82). In addition, the median split analysis of the physical performance data revealed that players who were able to exhibit greater maximal and explosive strength capabilities in the IMTP, isometric bench press, and CMJ assessments had a significantly greater CHS (g range = 1.09–1.28; p < 0.05), ball speed (g range = 1.18–1.41; p < 0.05), carry distance (g range = 1.06–1.53; p < 0.05), and smash factor (g range = 0.81–1.17; p < 0.05). These data underscore the importance of superior physical capacity for golfers, especially for maximal force production in both the lower and upper body, as well as explosive force production for the lower body.

1. Introduction

To be successful in golf, the ability to get the ball in the hole in as few shots as possible is the critical determinant of performance [1]. However, as the game has evolved, so have the number of methods to measure and monitor performance. For example, handicap index (which provides golfers with a shot allowance relative to their skill level) for recreational golf and “gross” score (no adjustment on the final scoring) for professional and high-level amateur competitions are the most commonly used and understood [2]. However, another approach to performance monitoring (especially at the elite level) is strokes gained, which, in short, provides a metric for the number of strokes gained or lost, relative to the rest of the playing field [1]. The research suggests that, in general, an increase of 20 yards equates to 0.75 strokes saved per round in PGA Tour players [2]. Collectively, gross scoring and strokes gained can be used to understand a golfer’s performance at a functional level, but they fail to highlight the more nuanced contribution of specific shot-related data. Consequently, launch monitor systems are now commonly used at the elite amateur and professional levels, and provide instantaneous feedback on a variety of shot-related metrics, such as clubhead speed (CHS), ball speed, carry distance, and more [3]. Although distance and dispersion (accuracy) are metrics that provide outcome measures for any given shot, independently, these metrics provide no context to how each shot is achieved. Therefore, launch monitors are useful in providing instantaneous data relating to the “launch characteristics” and “impact factors”, which are able to help explain the outcome of a shot [3]. This has resulted in several studies investigating the associations between shot-related metrics and strength, explosive strength, and mobility or flexibility [4,5,6,7].
The previous literature detailing the necessary physical capacities for golfers has suggested that strength and power (in both the lower and upper body) and mobility are the most important to develop and test [8,9]. Specifically, previous studies have reported significant moderate associations between CHS and one repetition maximum squat (r = 0.54, p < 0.05) [10] and peak force during an isometric mid-thigh pull (IMTP) (r = 0.48, p < 0.05) [11]. Also, associations with upper body strength have been investigated with slightly weaker findings reported. For example, studies have shown significant moderate associations between CHS and one repetition maximum bench press (r = 0.50, p < 0.05) [12] and lead hand grip strength (r = 0.32, non-significant) [13]. In terms of lower body power, previous studies have reported significant associations with CHS including countermovement (CMJ) positive impulse (r = 0.70–0.79, p < 0.05) [4,11] and peak power (r = 0.61, p < 0.05) [10]. From an upper body power perspective, field-based testing has shown significant associations between CHS and rotational medicine ball throws (r = 0.62 and 0.56 for males and females, respectively, p < 0.05) [5] and ball speed and ballistic bench press peak power (r = 0.66, p < 0.05) [14]. Collectively then, it appears that moderate to large positive associations are evident between measures of lower and upper body strength and power and important golf performance measures such as CHS and ball speed. Despite this useful information, the majority of research has focused on outcome measures when it comes to physical characteristics (e.g., peak force, peak power, distance thrown, etc.). With the associations between these measures and CHS or ball speed rarely reported as being >0.7, a large amount of variance in physical capacity remains unaccounted for, justifying the need for a more comprehensive physical testing battery in golf.
An additional physical characteristic which has a deep-routed history of perceived importance for golfers is flexibility. In support of this, a survey by Wells and Langdown [15] reported “flexibility and stretching” to be the most common training modality employed by highly skilled golfers during the in-season period. The separation between the hips and thoracic spine is of importance to golfers, as this may contribute to large spikes in vertical ground reaction force before the downswing is initiated [16]. Although studies have investigated the apparent associations between flexibility and measures of golf performance, there are question marks around the ecological validity of some of the assessments used. For example, one study assessed the association between CHS and the sit-and-reach test, reporting non-significant associations (r = −0.27, p > 0.05) [7]. However, when assessments that seemingly have greater relevance to the golf swing were investigated (e.g., seated thoracic rotation), stronger associations have been reported. For example, Brown et al. [17] reported significant associations between CHS and seated rotational flexibility (r = 0.52–0.71, p < 0.05). Consequently, more appropriate measures of mobility or flexibility should be considered for golfers to ensure what is being assessed is a better representation of the movement demands of the sport.
As a result of the aforementioned findings, the primary aim of this investigation was to assess the relationship between a comprehensive physical testing battery and golf performance, as quantified through a variety of previously determined usable metrics from launch monitor data [18].

2. Methods

2.1. Experimental Design

All testing was completed during a single session for each participant, with the session lasting approximately 90 min. Given the playing and training experience of the participants (detailed in the Section 2.2), all players were deemed to have sufficient familiarisation with our testing procedures, which was corroborated from the reliability data. The testing took place in an indoor biomechanics laboratory room and each participant was required to bring their own driver and 6-iron for testing. Golf performance testing took place before all physical assessments, to ensure that acute levels of fatigue did not impact the golf data being collected. In all physical assessments, 3 trials were conducted (including basic anthropometric measurements) and for golf data, 10 trials were conducted, with the average of all trials used in the subsequent data analyses. Before the physical assessments were completed, height (cm), body mass (kg), and wingspan (cm) were measured, with scales calibrated before use to ensure accurate measurements. The subjects self-reported their most up-to-date golf handicaps, which was corroborated either by their golf coaches during testing or via the England Golf smartphone app, where all players were registered. All testing was conducted by two members of the research team: one was the principal investigator (a PhD student who was educated to the postgraduate level) and the other was the chief supervisor of the student, who was an accredited strength and conditioning coach with the UK Strength and Conditioning Association and had completed their PhD.

2.2. Subjects

Twenty-two male and four female Category 2 (handicap ≤ 12) or better golfers (age: 19.12 ± 5.87; height: 177.01 ± 7.18; mass: 77.40 ± 12.54; wingspan: 182.87 ± 8.92; handicap 4.98 ± 4.29) were recruited to participate in this investigation. All participants were considered experienced players, having competed in club and, for some, national tournaments for a minimum of four years. Furthermore, each player was required to have a minimum of one year of resistance training experience. On average, the players completed 3–4 golf practice sessions per week and 1–2 strength and conditioning training sessions per week. Informed written consent was obtained from all subjects and their guardians when players were under the age of 18. Ethical approval was granted by the London Sport Institute’s Research And Ethics Committee at Middlesex University, London, UK (Application Number: 21759).

2.3. Procedures

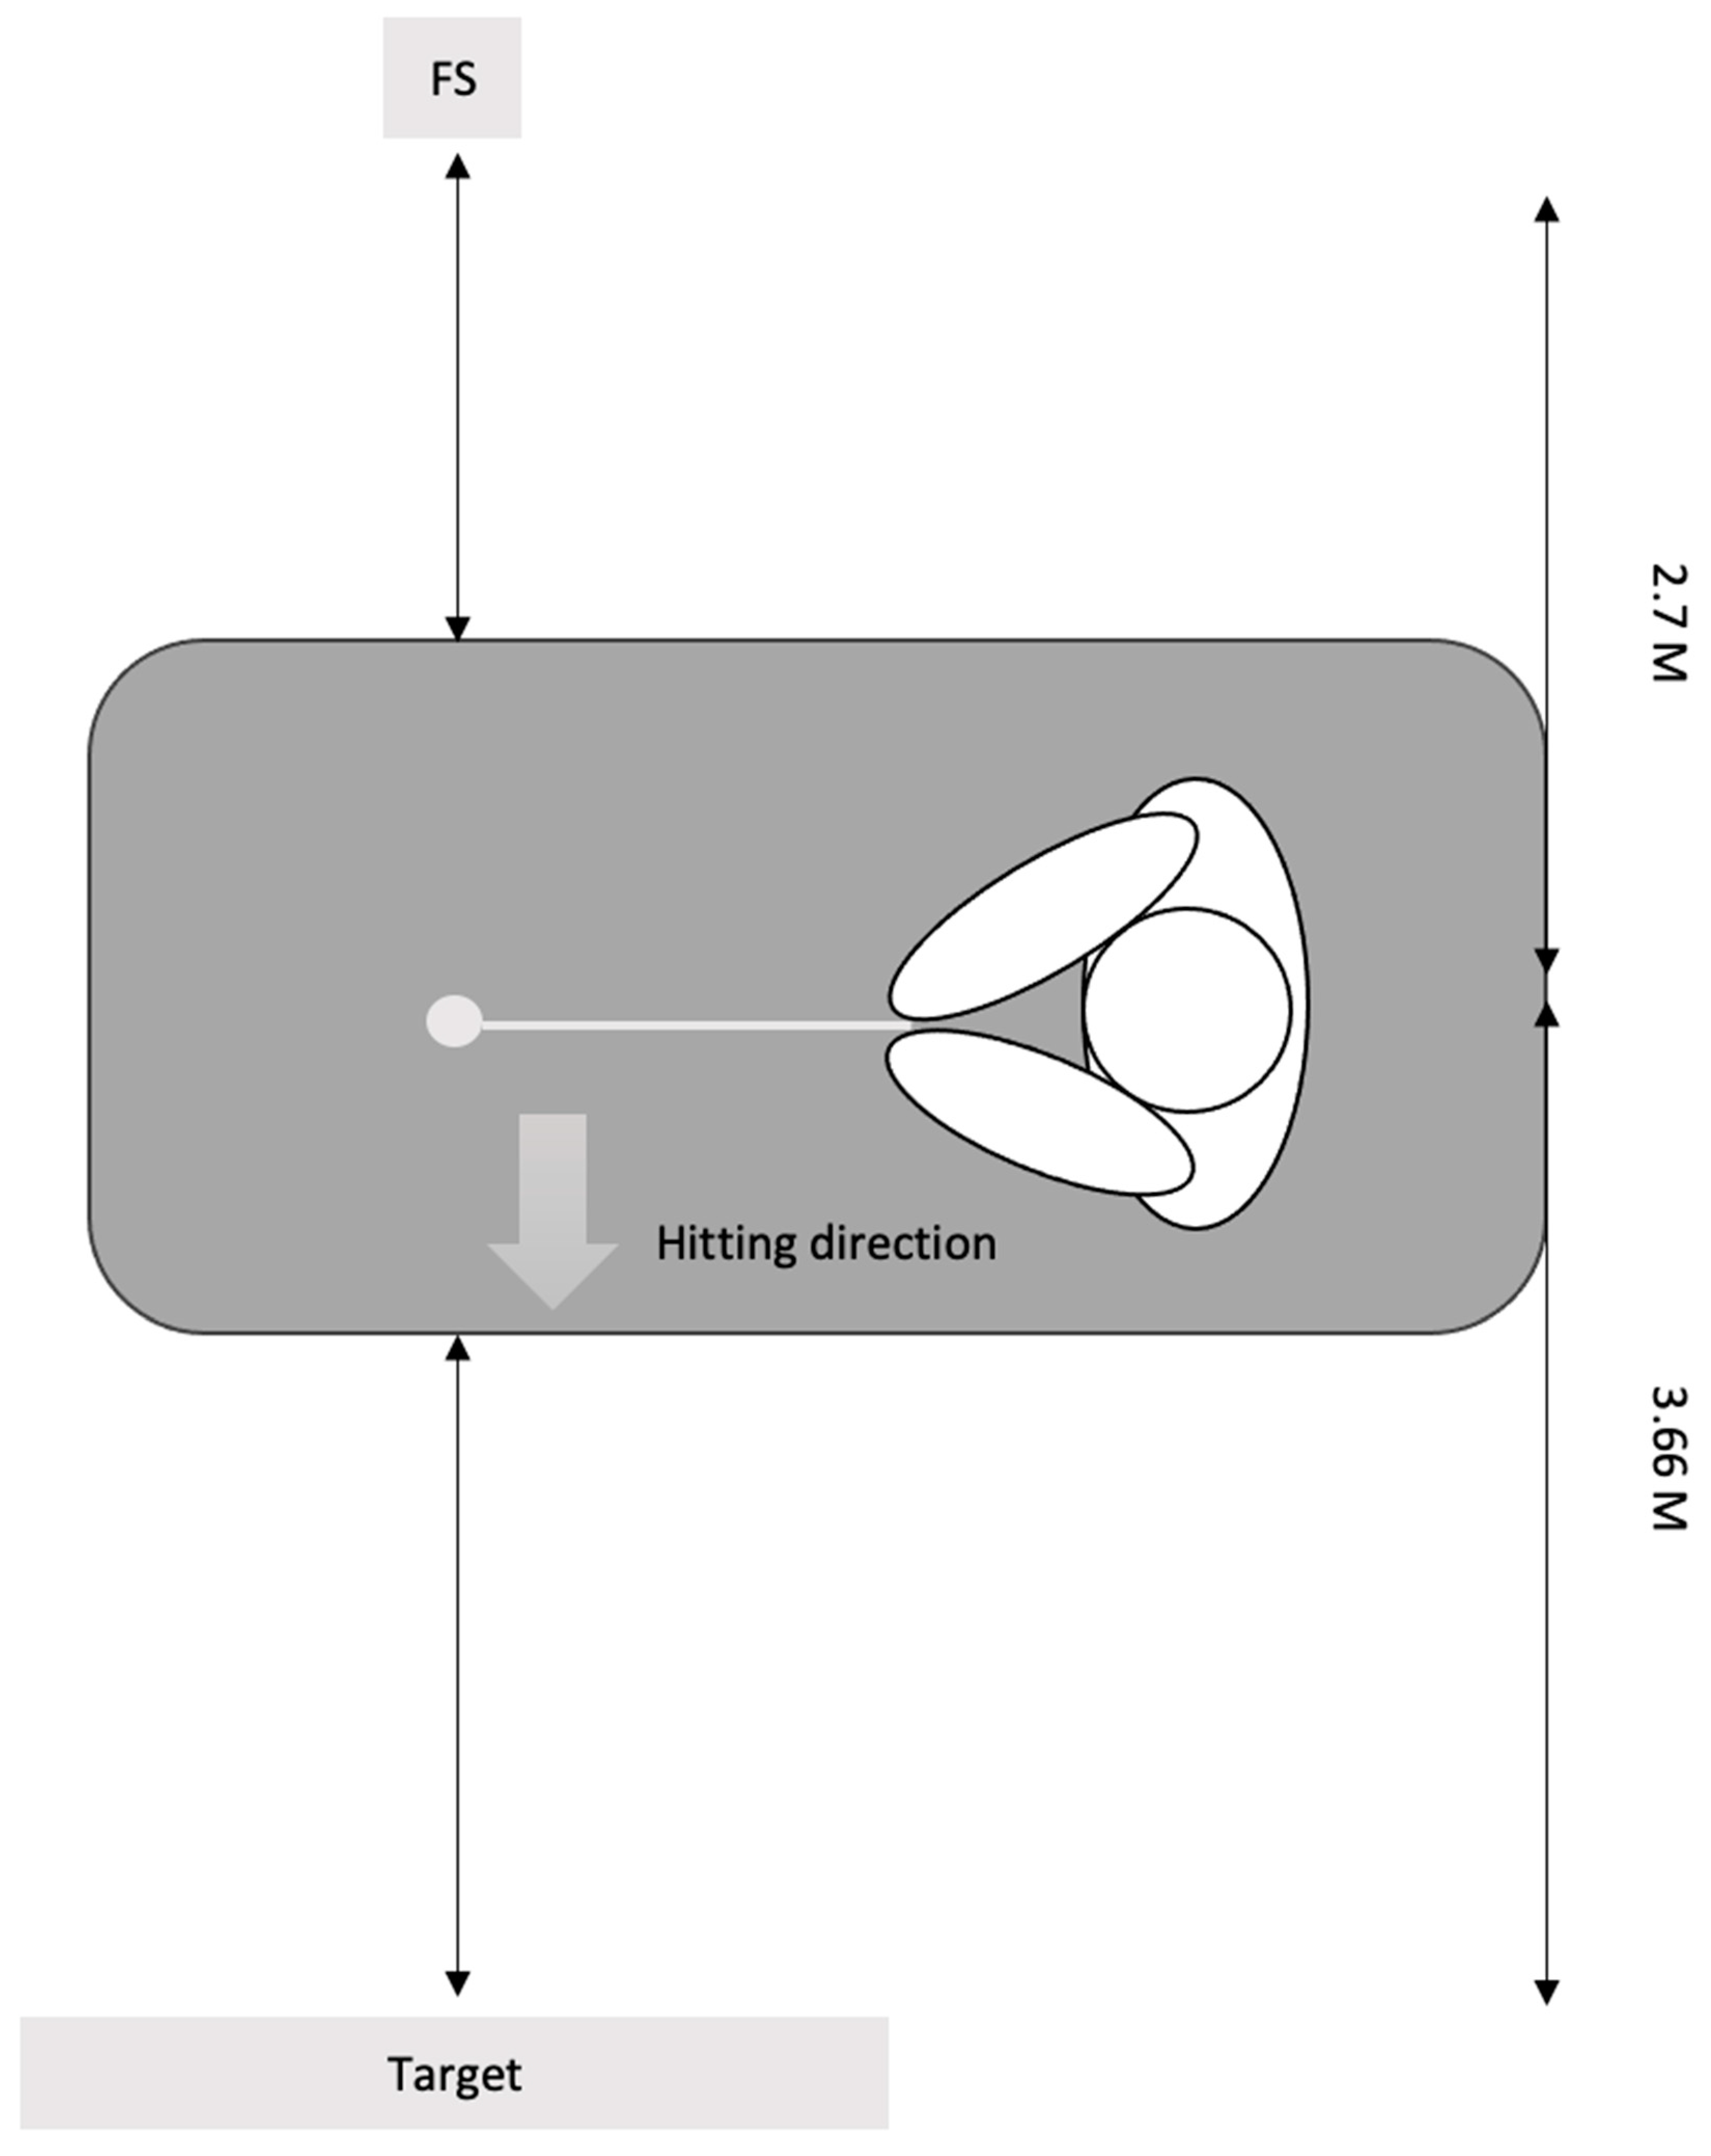
2.3.1. Equipment Set-Up

A schematic of the testing set-up for the Flightscope Mevo+ is provided in Figure 1, which is in accordance with the manufacturers’ guidelines. The Flightscope Mevo+ is a 3D Doppler tracking radar (EDH, Inc., Orlando, FL, USA) and the manufacturer advises a minimum distance of 2.13 m [19] between the golfer and the launch monitor device. Taking into consideration the size of the laboratory space, the launch monitor was set up at a distance of 2.7 m from the golfer.
Although somewhat anecdotal, and after speaking with participants directly, it was acknowledged that swinging a driver differs somewhat from swinging a 6-iron, and it is standard practice to progress in intensity during golf swing warm-ups. To ensure accurate data reflecting the golfer’s maximal capacity, all participants started with 6-iron shots before swinging their driver afterwards. Prior to data collection, the participants were given time to conduct their own desired golf-specific warm-up routine, relative to how they practice and compete [11]. Once golfers felt warmed up, they were allowed to perform warm-up shots with each club until they felt ready for testing. The golfers were instructed to perform each shot with the aim of achieving maximal distance. The participants were provided with 60 s of rest between swings and 3 min of rest between clubs. All shots that produced data on the Mevo+ were analysed, regardless of impact location or shot outcome, and the average of all 10 shots (for each club) was used for the subsequent data analyses. The specific shot metrics that were analysed are presented in Table 1, with an accompanying definition for each—all the metrics were recently validated against the gold standard Trackman launch monitor [18]. The golf ball was placed in the same tee spot for each shot to enable consistency with the distance between the netting (3.66 m) and the Mevo+ (2.7 m). The players used a rubber tee for shots with the 6-iron, but were given the option of three different rubber tee heights for the driver, with all recorded trials requiring the same tee height. When using a driver, trying multiple tee heights during practice attempts was allowed before deciding on one for the data collection. The golfers were instructed to aim for a “target” which lay in the centre of the 8-foot × 8-foot netting, which was also calibrated for the Mevo+ prior to the data collection. To gain the most accurate measurements, Titleist 160 Pro V1x Radar Capture Technology golf balls were used, which have been specifically built for indoor use with radar-based launch monitors, so that reflective markers are no longer required. The manufacturers of the FlightScope Mevo+ reported that this launch monitor, along with others, was used to validate the golf balls in previous indoor testing sessions [20].

2.3.2. Seated Thoracic Rotation

To measure thoracic rotation, the iPhone® compass application was used. This application has been reported as being a reliable (ICC = 0.87–0.98) and valid (r = 0.835) tool for measuring thoracic rotation when assessed against the current clinical gold standard, a universal goniometer (UG) [21]. The participants sat on the side of a training bench, facing away from the researcher conducting the assessment. To minimise variations in participant positioning, the participants were instructed to place their feet flat on the floor, knees and hips in 90° flexion, and to maintain a neutral spine position with natural lumbar lordosis. To minimise the contribution of movement in the hips, the participants were instructed to maintain alignment of their hips and knees, which was observed by a second examiner, whilst the first examiner maintained contact between the iPhone® and the participant’s thoracic spine. Finally, to minimise any unwanted movement in the upper limbs, the participants crossed their arms over their chest. The iPhone® was placed perpendicular to the vertical direction of the spine between the T1-T2 vertebrae of each participant. Then, the iPhone® was positioned so that the dial on the Compass app was reading 0° (magnetic north facing directly towards the participant). The iPhone® was held in place, making sure contact was kept between the participant’s back and the iPhone, whilst the participants were instructed to rotate as far as they could in the selected direction without compromising alignment in the lower body. The participants performed left and right rotations before a 30 s period of rest was given between trials.

2.3.3. Countermovement Jump

Dual Hawkins dynamic force platforms were used to assess CMJ. Before data collection, the force platforms underwent a calibration procedure according to the manufacturer’s guidelines, which included pressing down on each corner to ensure that the force plates were level and assessing whether they had finished booting, zeroing, and entered pairing mode [22]. The participants were provided with a detailed explanation and a demonstration of the correct execution of the CMJ technique. The participants were instructed to perform a countermovement to a self-selected depth, so that there was no unwanted effects on jump coordination strategies, and then instructed to jump as high as possible before a command of “3, 2, 1, jump” was given. The following metrics were utilised during the test: (i) jump height (using the impulse–momentum method), (ii) peak propulsive power (the peak instantaneous mechanical power applied to the system centre of mass during the propulsion phase), (iii) peak propulsive force (the peak instantaneous vertical ground reaction force applied to the system centre of mass during the propulsion phase), and (iv) net impulse (the net vertical impulse applied to the system centre of mass during the propulsion phase relative to the system mass) [23].

2.3.4. Seated Medicine Ball Throw

For this protocol, a medicine ball (approximately 10% of each participant’s mass), a bench, and a measuring tape were used. Three testers were utilised: (1) to monitor the technique of each trial, and (2) and (3) to observe where the medicine ball landed, which was agreed upon between the testers. Before testing, the bench was set up in an upright position and the measuring tape was securely positioned on the floor to accurately measure the distance thrown. The participants were instructed to sit on the bench in an upright positioned, with their backs supported and feet flat on the floor. For the throwing technique, the participants were instructed to hold the medicine ball at chest level. To complete the testing protocol, the participants were instructed to initiate a forceful extension of their elbows before releasing the medicine ball. Throughout testing, the participants were told to maintain contact between their back and the bench and to keep their feet on the floor; if contact was lost, a retrial was required. The participants were given three trials with a 90 s rest period between each trial.

2.3.5. Isometric Bench Press

A schematic of the testing set-up for the isometric bench press is provided in Figure 2, with the bench positioned on top of the force platform. A Kistler force platform was positioned directly underneath the bench, at the end where the head and upper body lay. The participants were then instructed to position themselves on the bench with their forearms positioned vertically, elbows at 90° flexion, and a comfortable hand-pressing positioning on the bar. The participants were instructed to keep their feet and lower back in contact with the floor and bench, respectively, throughout the testing. Finally, the participant’s hand, head, and foot positions were recorded via a photograph, enabling the same protocols to be conducted for each trial. Initial practice tests were given, with the first being at 50% of the perceived maximal effort, the second being at 75%, and the third at near maximal effort. For each isometric bench press, the subjects were given a five-second countdown and, subsequently, told to “press as hard and fast against the bar as possible”, with maximal isometric effort applied for five seconds as recommended in similar isometric tests [24]. In total, three attempts were given with three minutes of rest provided between each attempt [11]. The following metrics were utilised from this test: (i) peak force, (ii) force at 100 ms, (iii) force at 200 ms, and (iv) force at 300 ms, with body mass subtracted to create net values for all metrics.

2.3.6. Isometric Mid-Thigh Pull

All isometric testing was performed on a custom-built isometric rig, with dual Kistler force platform systems positioned for the participants to stand on. Before the testing commenced, a standardised explanation and demonstration were given. For optimal bar positioning, the bar was initially positioned at a height that allowed the participant to replicate the start of the second pull positioning during the clean [25]. Then, the bar height was adjusted to allow the athlete to obtain optimal knee (125–145°) and hip angles (140–150°), in line with previous recommendations [26,27]. The body position of the participant was required to be as follows: an upright torso, slight flexion in the knee, shoulder girdle retracted and depressed, shoulders above or slightly behind the vertical plane of the bar, feet roughly centred under the bar approximately hip width apart, knees underneath and in front of the bar, and thighs in contact with the bar, creating a similar position to that of the second pull of the clean [25]. Practice trials mirrored that of the isometric bench press protocol, with the first being at 50% of the perceived maximal effort, the second being at 75%, and the third at near maximal effort. Once submaximal efforts were completed, the participants were instructed to take up their testing positions and to pull on the bar as hard and fast as possible. A countdown of “5, 4, 3, 2, 1, pull” was provided, before a maximal effort five-second isometric pull by all participants, as recommended by Haff et al. [24]. Three trials were completed, with a three-minute rest given between each trial. Importantly, if a countermovement was observed in the force–time curve (determined during the participant rest period by a value that exceeded 5 standard deviations (SD) of body mass [28]) the trial was void and repeated. The following metrics were obtained from this test: (i) peak force, (ii) force at 100 ms, (iii) force at 200 ms, and (iv) force at 300 ms, with body mass subtracted to create net values for all metrics.

2.4. Statistical Analysis
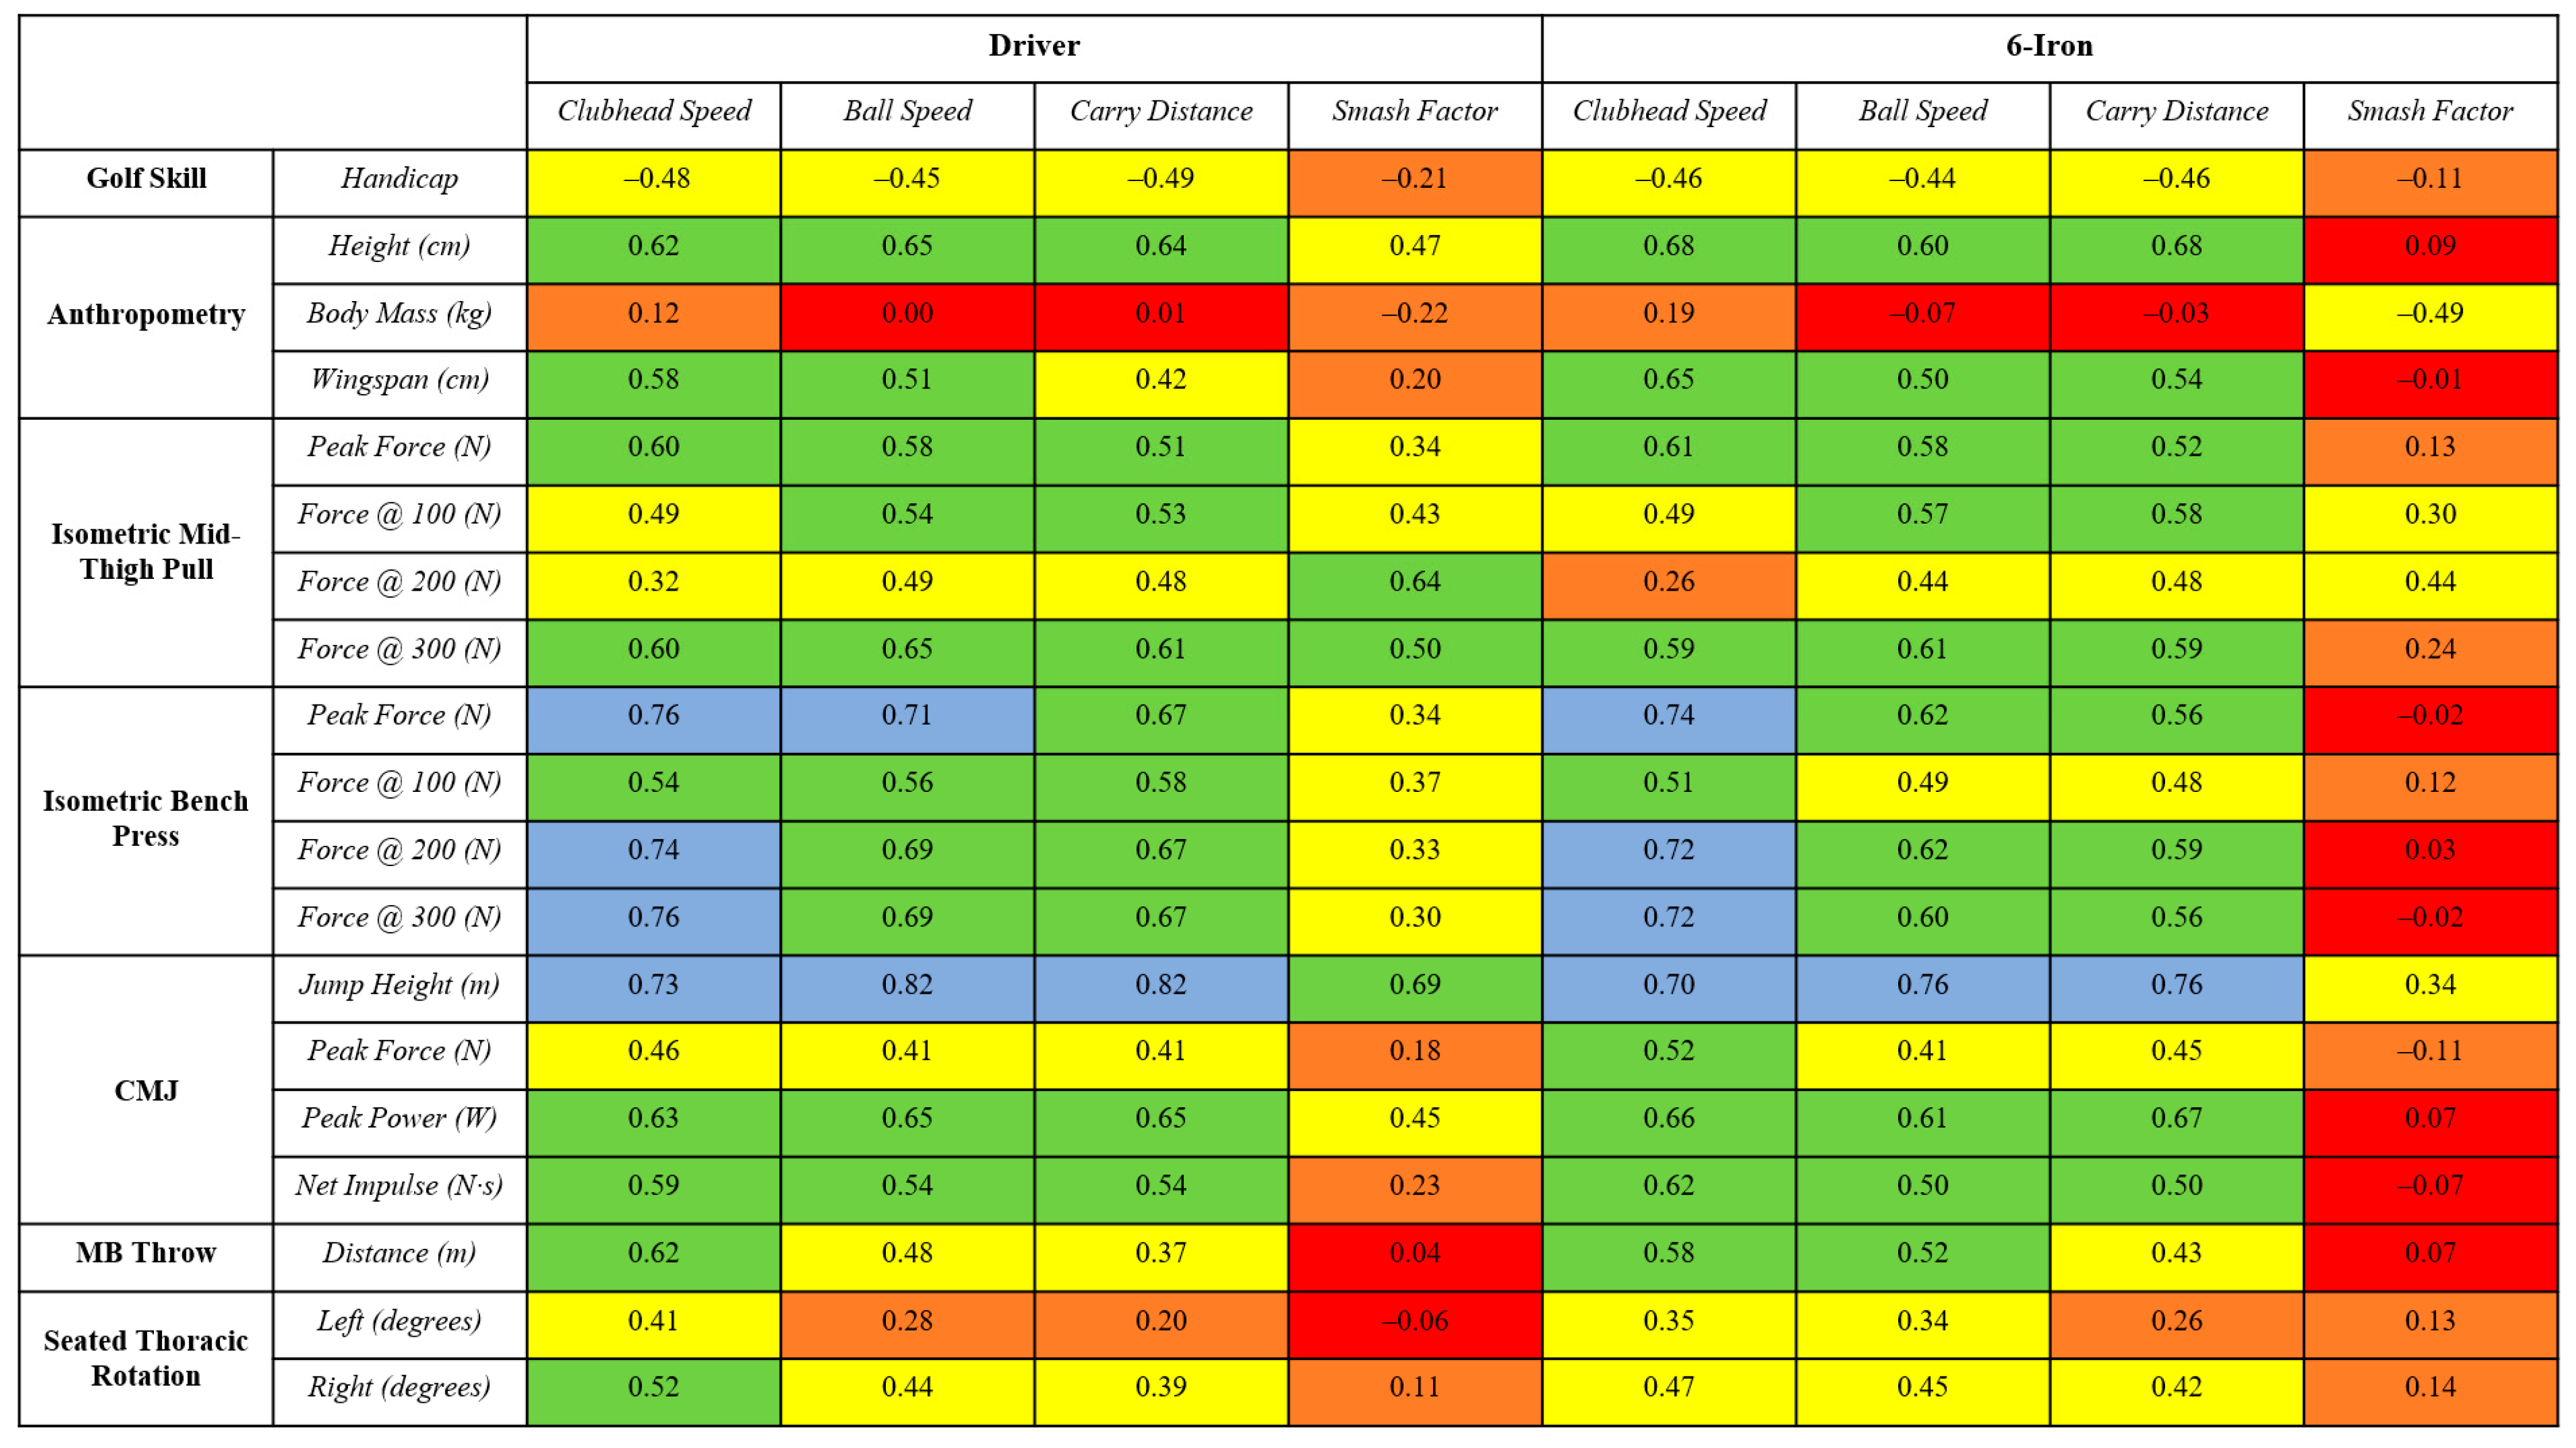
Initially, all the data were recorded as means and SD in Microsoft Excel. The normality of the data was confirmed using the Shapiro–Wilk test (p > 0.05). To assess the intra-session reliability of all tests, a two-way random intraclass correlation coefficient (ICC) with absolute agreement and 95% confidence intervals (CI), the coefficient of variation (CV%) with 95% CIs, and the standard error of the measurement was used. The interpretation of the ICC values was in accordance with previous research by Koo and Li [29], in which values of <0.5 = poor, 0.5–0.75 = moderate, 0.76–0.9 = good, and >0.9 = excellent. The CV values were considered to be acceptable if <10%, in accordance with the findings of Cormack et al. [30]. Specifically, the process was the same for all the data, but this involved utilising 3 trials for the fitness testing data and 10 trials for the golf shot data. Pearson’s r correlation analysis was utilised to assess the magnitude of associations between the golf performance metrics and physical assessment data. In line with prior research, correlations were categorised as follows: 0–0.09 = trivial, 0.1–0.29 = small, 0.3–0.49 = moderate, 0.5–0.69 = large, 0.7–0.89 = very large, and ≥0.9 = nearly perfect [31].
Finally, a median split analysis was performed creating higher (n = 13) and lower (n = 13) groups for (i) peak force in the IMTP, (ii) peak force in the isometric bench press, (iii) jump height in the CMJ, and (iv) distance in the medicine ball throw. Given that these splits were performed for each individual test, it should be acknowledged that the athletes in each group may be different, depending on the test in question. Following this, between-group differences were then assessed for golf shot data with a driver only. Given the volume of physical capacity metrics reported in the present study, these metrics were selected for the median split analysis because they exhibited the best reliability (Table 2), showed the strongest associations with the golf shot data in the present study (Figure 3), and are most commonly used in day-to-day practice in sport science. Due to the data being normally distributed, the differences between groups were assessed using paired sample t-tests, with statistical significance set at p < 0.05. Hedges’ g effect sizes (ES) with 95% CIs were also used to determine the magnitude of the differences between the groups. These were interpreted as follows: g < 0.35 = trivial; 0.35–0.80 = small; 0.81–1.50 = moderate; and >1.5 = large [32].

3. Results

The mean, SD, and intra-session reliability data for the shot metrics can be seen in Table 2. When using a driver, the ICC data showed that all metrics exhibited excellent reliability (≥0.94) and good reliability for smash factor (0.80). All the CV data were considered acceptable (≤3.54%). When using a 6-iron, the ICC data showed that the CHS and ball speed exhibited excellent reliability (≥0.90), carry distance exhibited good reliability (0.87), and smash factor had moderate reliability (0.65). All the CV data were considered acceptable (≤4.65%).
The mean, SD, and intra-session reliability data for the physical performance tests can be seen in Table 3. All the physical assessment data showed excellent ICC values, with the exception of force at 100 ms in both the IMTP and isometric bench press, which exhibited good ICC values of 0.85. When considering the CV data, force at 100 ms in both isometric tests was also considerably elevated (19.76–25.78%), thus exhibiting the greatest variance of all the metrics and tests. In addition, force at 200 ms was also marginally elevated (10.85%) during the IMTP, but all the other CV data were considered acceptable (≤7.69%).
Given the volume of correlations reported herein, a heatmap has been presented to showcase the associations between the golf shot metrics and physical performance data (Figure 3). For CHS, the correlations with anthropometry were deemed small to large (r = 0.12 to 0.68), small to large with IMTP variables (r = 0.26 to 0.61), large to very large with isometric bench press variables (r = 0.51 to 0.76), moderate to very large with CMJ variables (r = 0.46 to 0.73), large with medicine ball throw distance (r = 0.58 to 0.62), and moderate to large with thoracic spine rotation (r = 0.35 to 0.52). The correlations between ball speed and physical characteristics with anthropometry were deemed trivial to large (r = −0.07 to 0.65), moderate to large with IMTP variables (r = 0.44 to 0.65), moderate to very large with isometric bench press variables (r = 0.49 to 0.71), moderate to very large with CMJ variables (r = 0.41 to 0.82), moderate to large with medicine ball throw distance (r = 0.48 to 0.52), and small to moderate with thoracic spine rotation (r = 0.28 to 0.45). Carry distance presented correlations with anthropometry that were deemed trivial to large (r = −0.03 to 0.68), moderate to large with IMTP variables (r = 0.48 to 0.61), moderate to large with isometric bench press variables (r = 0.48 to 0.67), moderate to very large with CMJ variables (r = 0.41 to 0.82), moderate with medicine ball throw distance (r = 0.37 to 0.43), and small to moderate with thoracic spine rotation (r = 0.20 to 0.42). The correlations between smash factor and the physical characteristics with anthropometry were deemed trivial to moderate (r = −0.49 to 0.47), small to large with IMTP variables (r = 0.13 to 0.64), trivial to moderate with isometric bench press variables (r = −0.02 to 0.37), trivial to large with CMJ variables (r = −0.11 to 0.69), trivial with medicine ball throw distance (r = 0.04 to 0.07), and trivial to small with thoracic spine rotation (r = −0.06 to 0.14).
Figure 4, Figure 5, Figure 6 and Figure 7 show the median split analysis for peak force during the IMTP (Figure 4), peak force during the isometric bench press (Figure 5), jump height during the CMJ (Figure 6), and distance during the medicine ball throw assessment (Figure 7). Once these splits had been made, a comparison of the golf shot data was provided for CHS, ball speed, carry distance, and smash factor.
Figure 4 (IMTP peak force) shows significant differences between the groups for CHS (g = 1.09 [0.24, 1.88]; p < 0.05), ball speed (g = 1.18 [0.35, 2.02]; p < 0.05), and carry distance (g = 1.06 [0.24, 1.88]; p < 0.05), but not smash factor (g = 0.76 [−0.03, 1.57]; p > 0.05). Figure 5 (isometric bench press peak force) shows significant differences between the groups for all golf shot metrics: CHS (g = 1.14 [0.31, 1.97]; p < 0.05), ball speed (g = 1.41 [0.55, 2.26]; p < 0.05), carry distance (g = 1.23 [0.40, 2.07]; p < 0.05), and smash factor (g = 1.17 [0.34, 2.00]; p < 0.05). Similarly, Figure 6 (CMJ height) also showed significant between-group differences for all golf shot data: CHS (g = 1.28 [0.44, 2.12]; p < 0.05), ball speed (g = 1.34 [0.49, 2.19]; p < 0.05), carry distance (g = 1.53 [0.66, 2.40]; p < 0.05), and smash factor (g = 0.81 [0.01, 1.61]; p < 0.05). Finally, Figure 7 (medicine ball throw for distance) showed no significant between-group differences for any golf shot metric: CHS (g = 0.81 [0.01, 1.61]; p > 0.05), ball speed (g = 0.69 [−0.10, 1.48]; p > 0.05), carry distance (g = 0.48 [−0.30, 1.27]; p > 0.05), and smash factor (g = 0.20 [−0.57, 0.98]; p > 0.05).

4. Discussion

As emphasised in the introduction, while physical characteristics have the potential to account for golf performance, a comprehensive testing battery tailored for golfers has yet to be reported in prior research. The aim of this study was to assess the relationship between a comprehensive physical testing battery and golf performance. Firstly, the magnitude of correlations between physical assessments and driver or 6-iron performance was very similar. Second, the largest associations were seen from the isometric bench press in the upper body and CMJ height in the lower body. For the golf shot data, the smash factor (the ratio between ball speed and club speed) typically presented the smallest correlations with the physical characteristics. As a secondary aim, the median split analysis showed that when splitting the group by different physical capacity tests and metrics, the players with superior performance in the IMTP, isometric bench press and CMJ also exhibited a significantly superior CHS, ball speed, carry distance, and smash factor.

4.1. Anthropometry

In the current study, large associations were evident between wingspan, height, and shot metrics (apart from smash factor), emphasising their potential influence on golf performance. The similarity in these associations was evident, underscoring the expected link between these closely related anthropometric measures. These findings reinforce the importance of recognising the impact non-modifiable factors such as limb length on golf performance. For instance, golfers with longer limbs may leverage their ability to generate a longer and wider hand path. This is of great value since research has shown that golfers’ who are able to lengthen their hand path by 0.12 m should yield an increase in CHS of 2.7 mph [33]. Surprisingly, our study revealed trivial to small associations between body mass and golf performance, with some negative associations observed, in contrast to previous findings which have shown relationships ranging from 0.41–0.72 [5,34]. The discrepancy between our findings and the perceived importance of body mass in golf may be attributed to the age and, more exclusively, training experience of our participants. With a significant portion of youth golfers in our study, we presume they exhibited a lower training age than adults, making it plausible to suggest that greater body mass does not necessarily correspond to higher levels of muscle mass in this specific population.

4.2. Isometric Strength: Upper and Lower Body

Firstly, peak force at 100 ms in both the isometric bench press and IMTP surpassed the threshold for reliable measurements (25.78% and 19.76%, respectively), rendering these variables difficult to utilise as effective tools for monitoring physical characteristics. Moreover, when examining the remaining metrics, such as peak force, force at 200 ms, and force at 300 ms, we observed notably stronger correlations in the isometric bench press compared to the IMTP. Although somewhat anecdotal, we can explain these findings with a logical understanding of the golf swing. Firstly, the duration of the swing from address to impact is estimated to be around 0.9 s, with the downswing lasting approximately 0.3 s among professional players prior to ball impact [35]. It is important to recognise that because of the separation between the hips and thoracic spine, a shift in the centre of pressure towards the target occurs, before the downswing visibly starts. Consequently, the lower body is likely to have more time to produce force than the upper body—remembering that the upper body follows afterwards— because of the separation effect between the hips and thoracic spine. Therefore, the lower body muscles engage approximately 0.4–0.5 s prior to impact, a timeframe notably similar to that necessary for the maximal force production [36]. To the authors’ knowledge, official data on the duration of upper body muscle activity during the downswing and prior to impact is currently lacking. However, given our aforementioned explanation, it seems logical that this duration is shorter than that of the lower body. With this in mind, our results align with this explanation with the rapid force production data (force at 200 and 300 ms) exhibiting stronger associations during upper body isometric assessments compared to lower body isometric assessments. Furthermore, our results also show that the longer force–time data for the lower body (i.e., peak force and force at 300 ms) demonstrated the strongest associations with golf performance for the IMTP. These results align with prior research, which has shown that peak force exhibits the strongest correlations with CHS in comparison to additional IMTP variables (r = 0.48, p < 0.01) [11]. Collectively, these data provide supporting evidence that both maximal and rapid force production capabilities from multi-joint isometric strength assessments are useful proxy measures for golfers.

4.3. Explosive Strength: Upper and Lower Body

From the CMJ, jump height demonstrated the strongest associations, which is consistent with the existing literature that underscores the use of jump testing as a valuable tool for assessing ballistic force production in golfers [8]. Despite these strong associations, it is important to recognise that jump height may not be the most suitable metric for all golfers due to its inevitable link with body mass. While a greater body mass may contribute to increased swing speed, it may also have negative effect on jump height. Notwithstanding these considerations, our results may be explained by the predominance of youth athletes in our sample, suggesting that jump height could be more relevant for use in young golfers who may typically have reduced strength and conditioning training experience compared to professional or elite amateur players. Additionally, the remaining jump metrics, specifically net impulse and peak power, exhibited strong associations with golf metrics, consistent with previous field-based studies (net impulse: r = 0.69, p < 0.01; peak power: r = 0.66, p < 0.01) [4]. Given that peak power represents an instantaneous variable and does not capture the entirety of the CMJ prior to take-off, the calculation of net impulse appears to be the preferred jump metric [4].
The upper body medicine ball throw assessment demonstrated strong associations with CHS, which aligns with the limited timeframe for force generation in the upper body compared to the lower body during the golf swing. This again highlights the relevance of ballistic force production in the upper extremities. Importantly though, the associations between distance thrown and golf shot metrics was not as high as the rapid force production (force at 200 and 300 ms) associations from the isometric bench press. Thus, it seems logical to suggest that if practitioners have the capacity to undertake the isometric bench press as an assessment method, there is likely no need to also conduct medicine ball throws for distance. Rather, medicine ball throws may be used as a means of gathering some outcome measures-based data when no other options are available for the assessment of explosive strength in the upper body.

4.4. Mobility

A hotly debated topic in golf is the importance of mobility for golfers. Our findings show trivial to large relationships between golf performance and thoracic spine rotation. Previously, field-based assessments have included the sit-and-reach test [37,38] and found trivial relationships with CHS (r = −0.08 to 0.1) [39]. To develop a comprehensive testing battery, considering the ecological validity of an assessment method is imperative. Given the importance of separating the hips and thoracic spine in golf, an assessment that enables an isolated assessment of the upper body was considered important for this study. Therefore, a seated thoracic spine rotation assessment was chosen, which has been recently suggested [8]. Given the absence of strong associations, it appears reasonable to propose that mobility may have a more customised application for golfers compared to other physical characteristics, as it is likely influenced by a player’s preferred movement approach to the swing. Essentially, enhancements in mobility might positively impact golfers who require improvements by broadening their shot options (from increasing their affordances), whereas other players may require no improvements. In contrast, and considering our findings, it is challenging to envision any golfer who would not benefit from improved maximal and explosive force production capabilities.

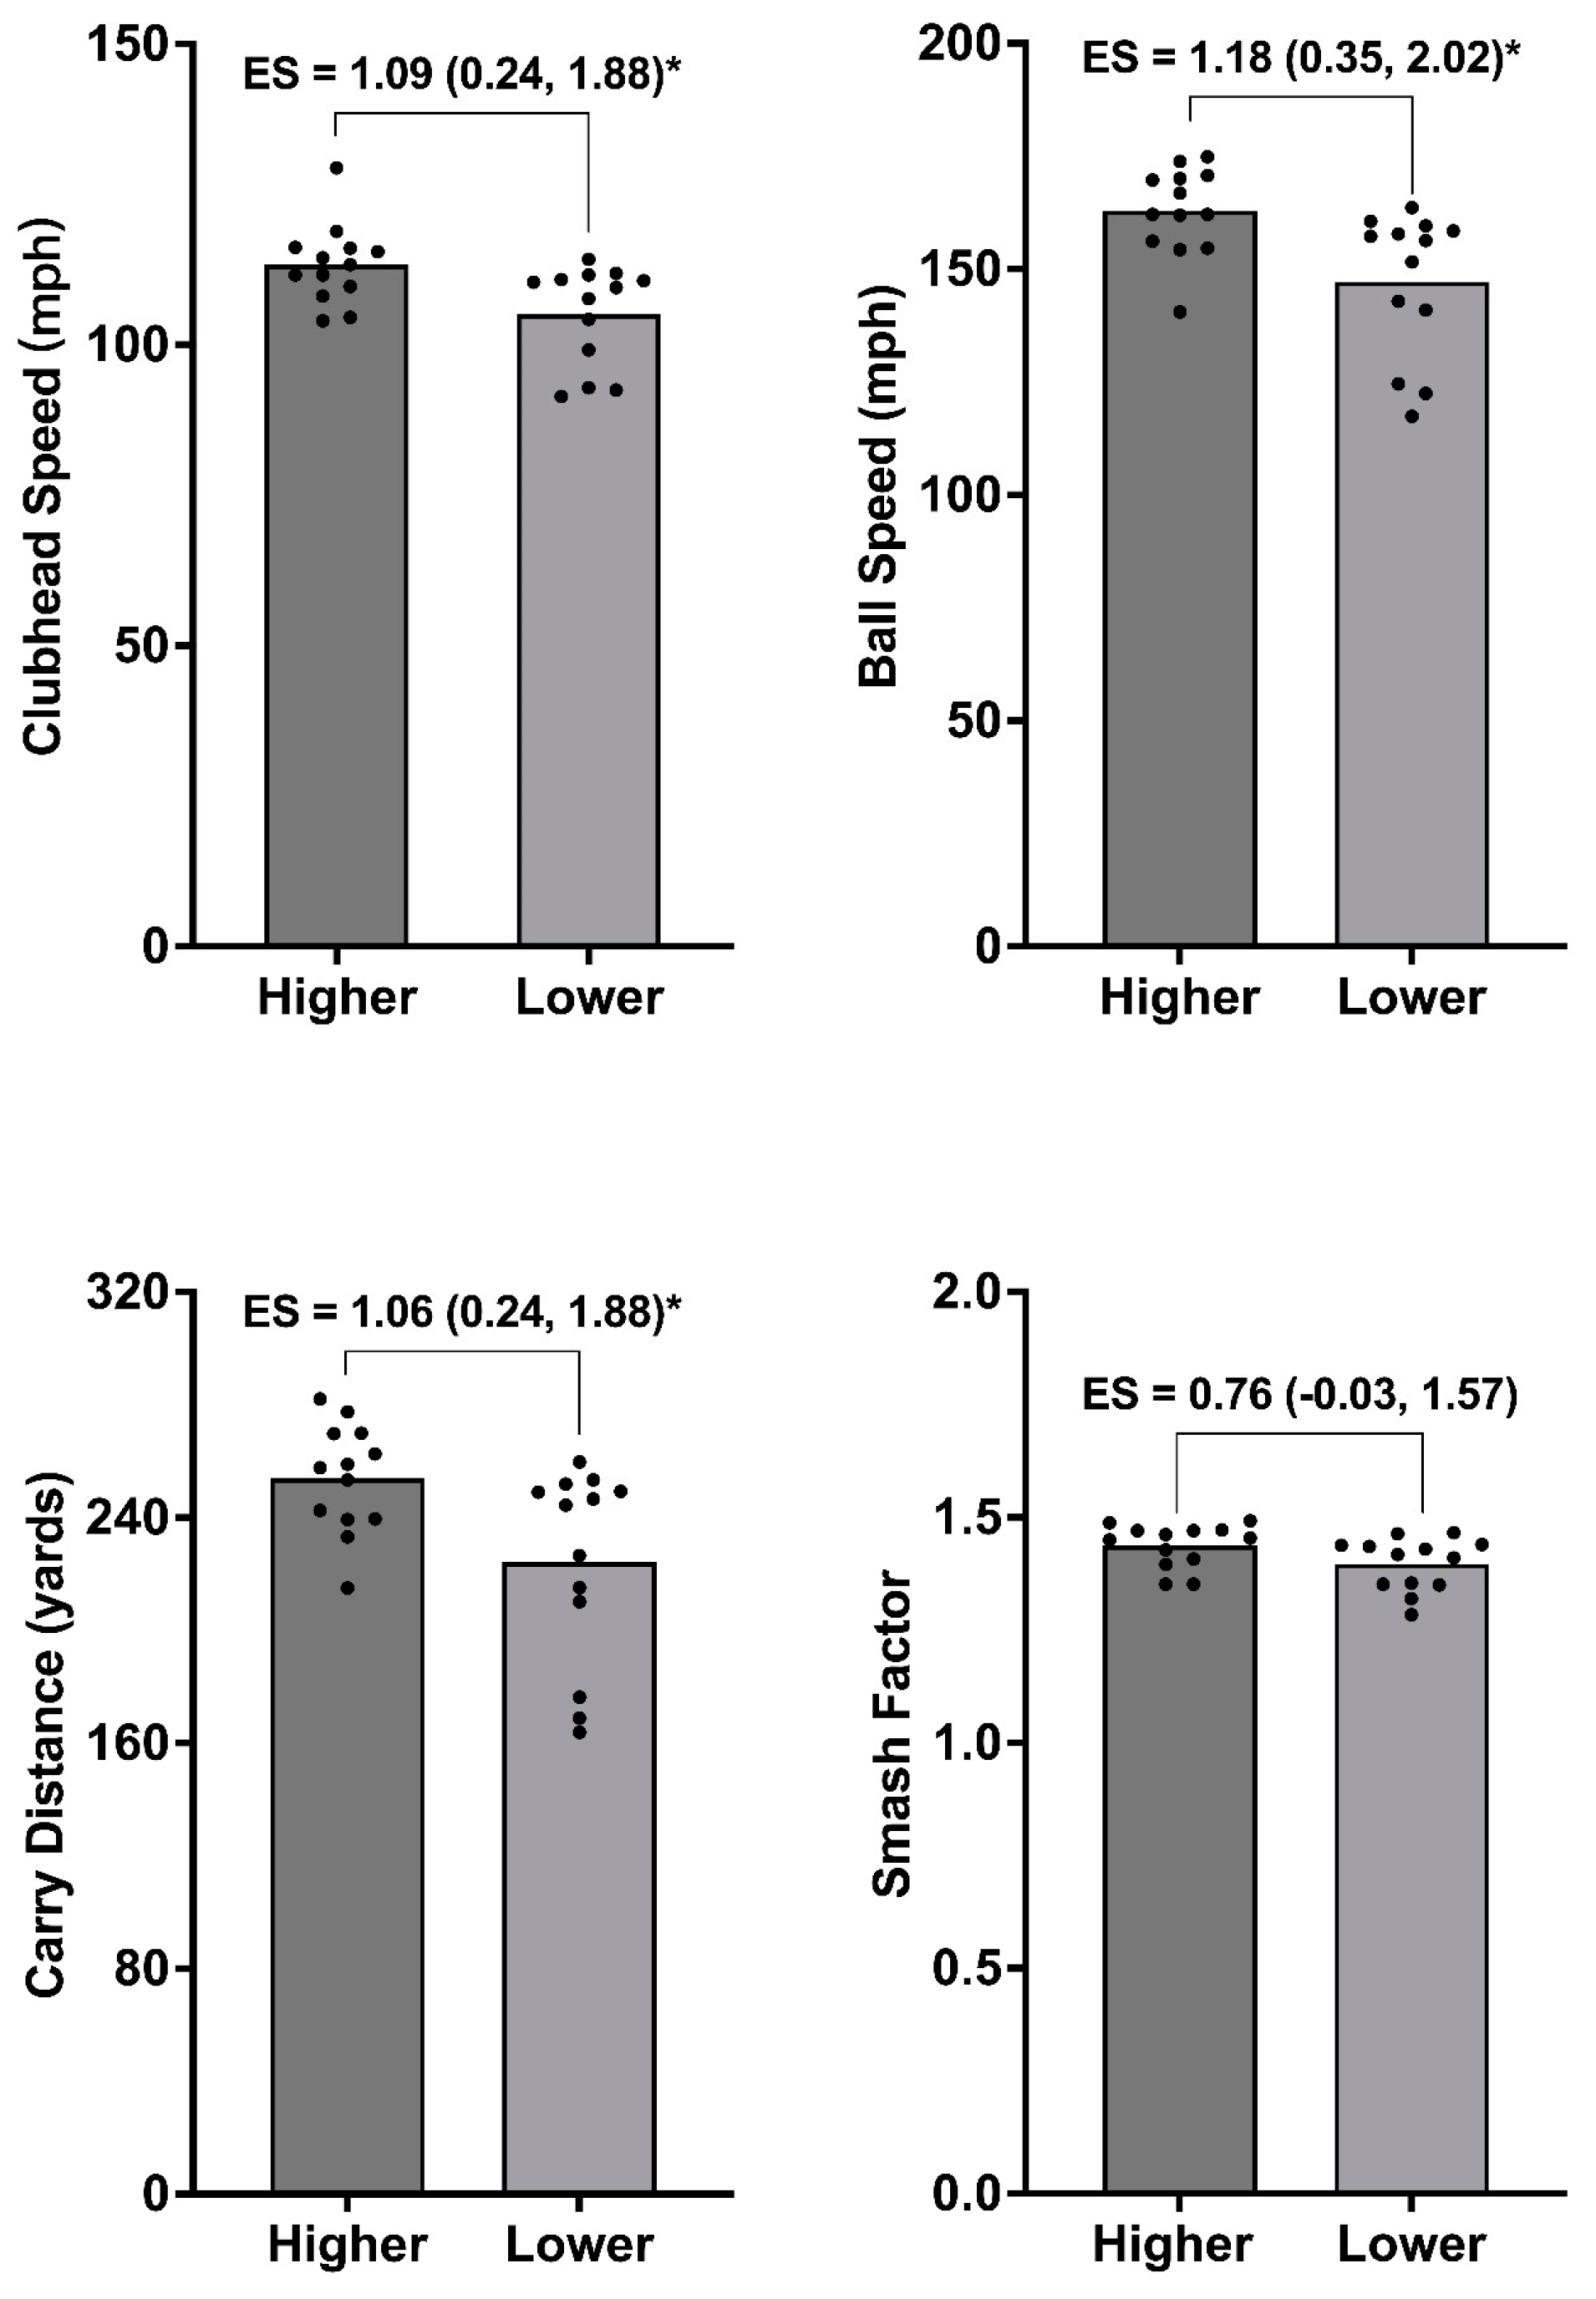
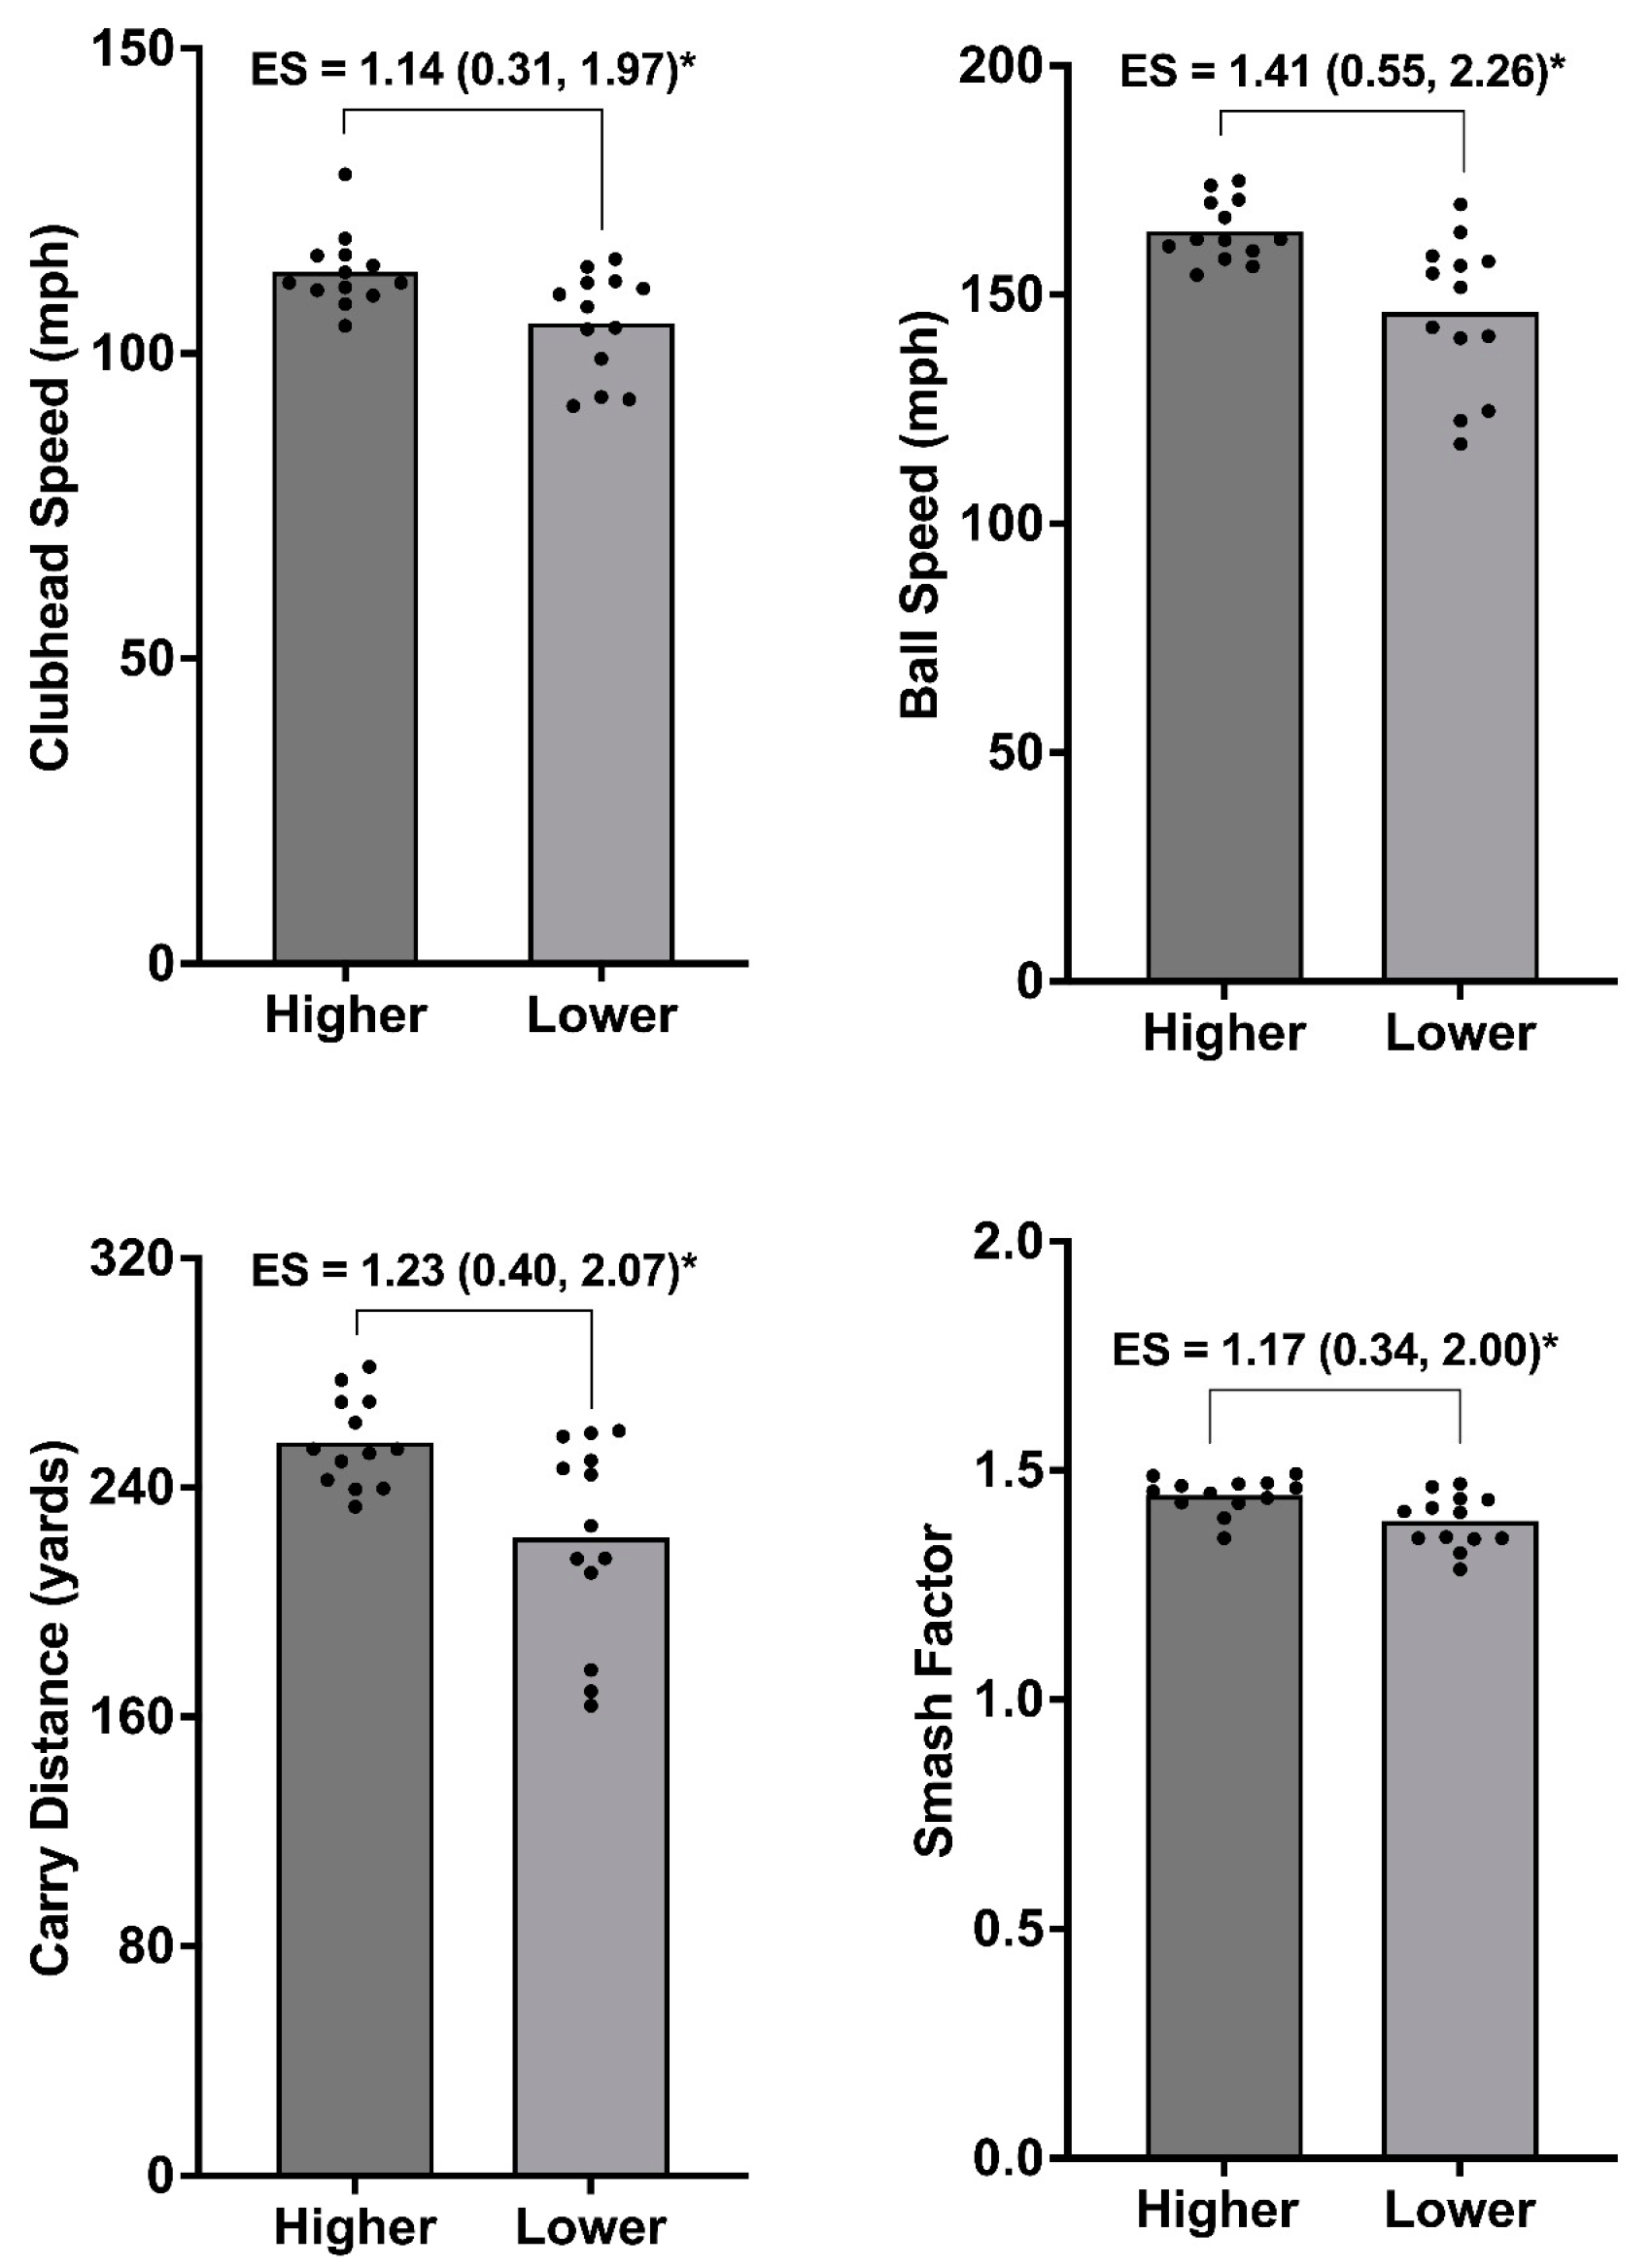
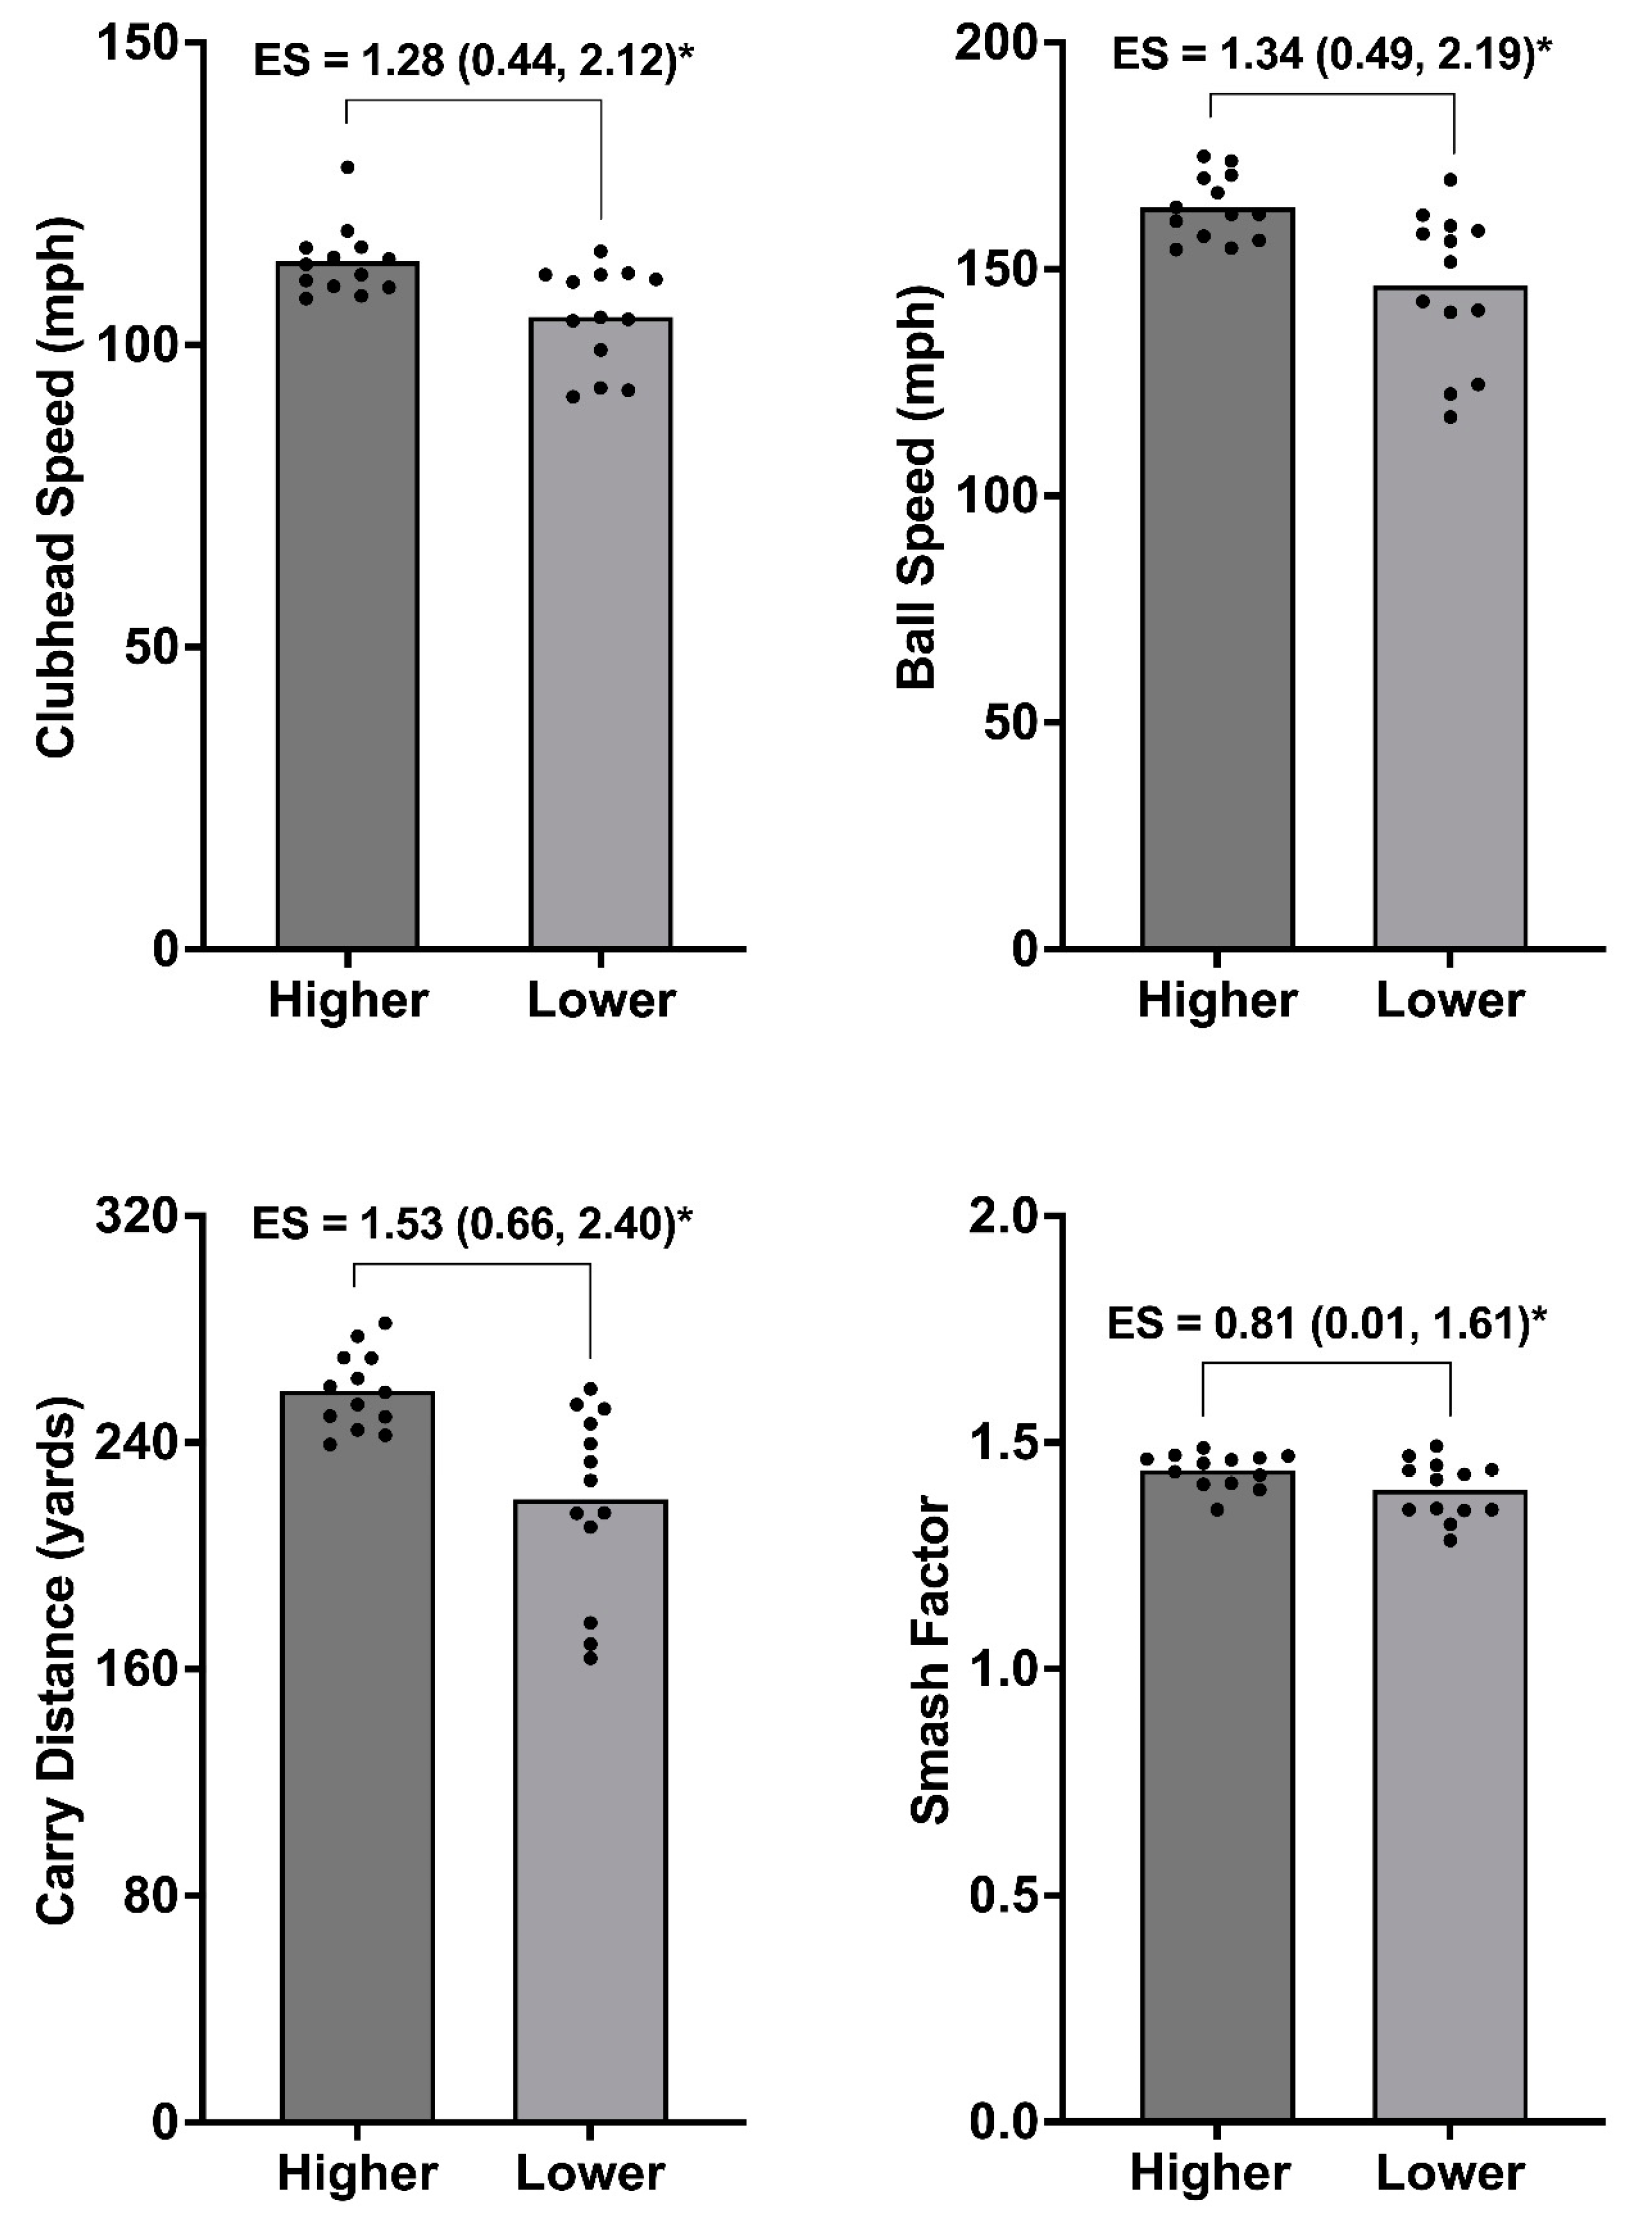
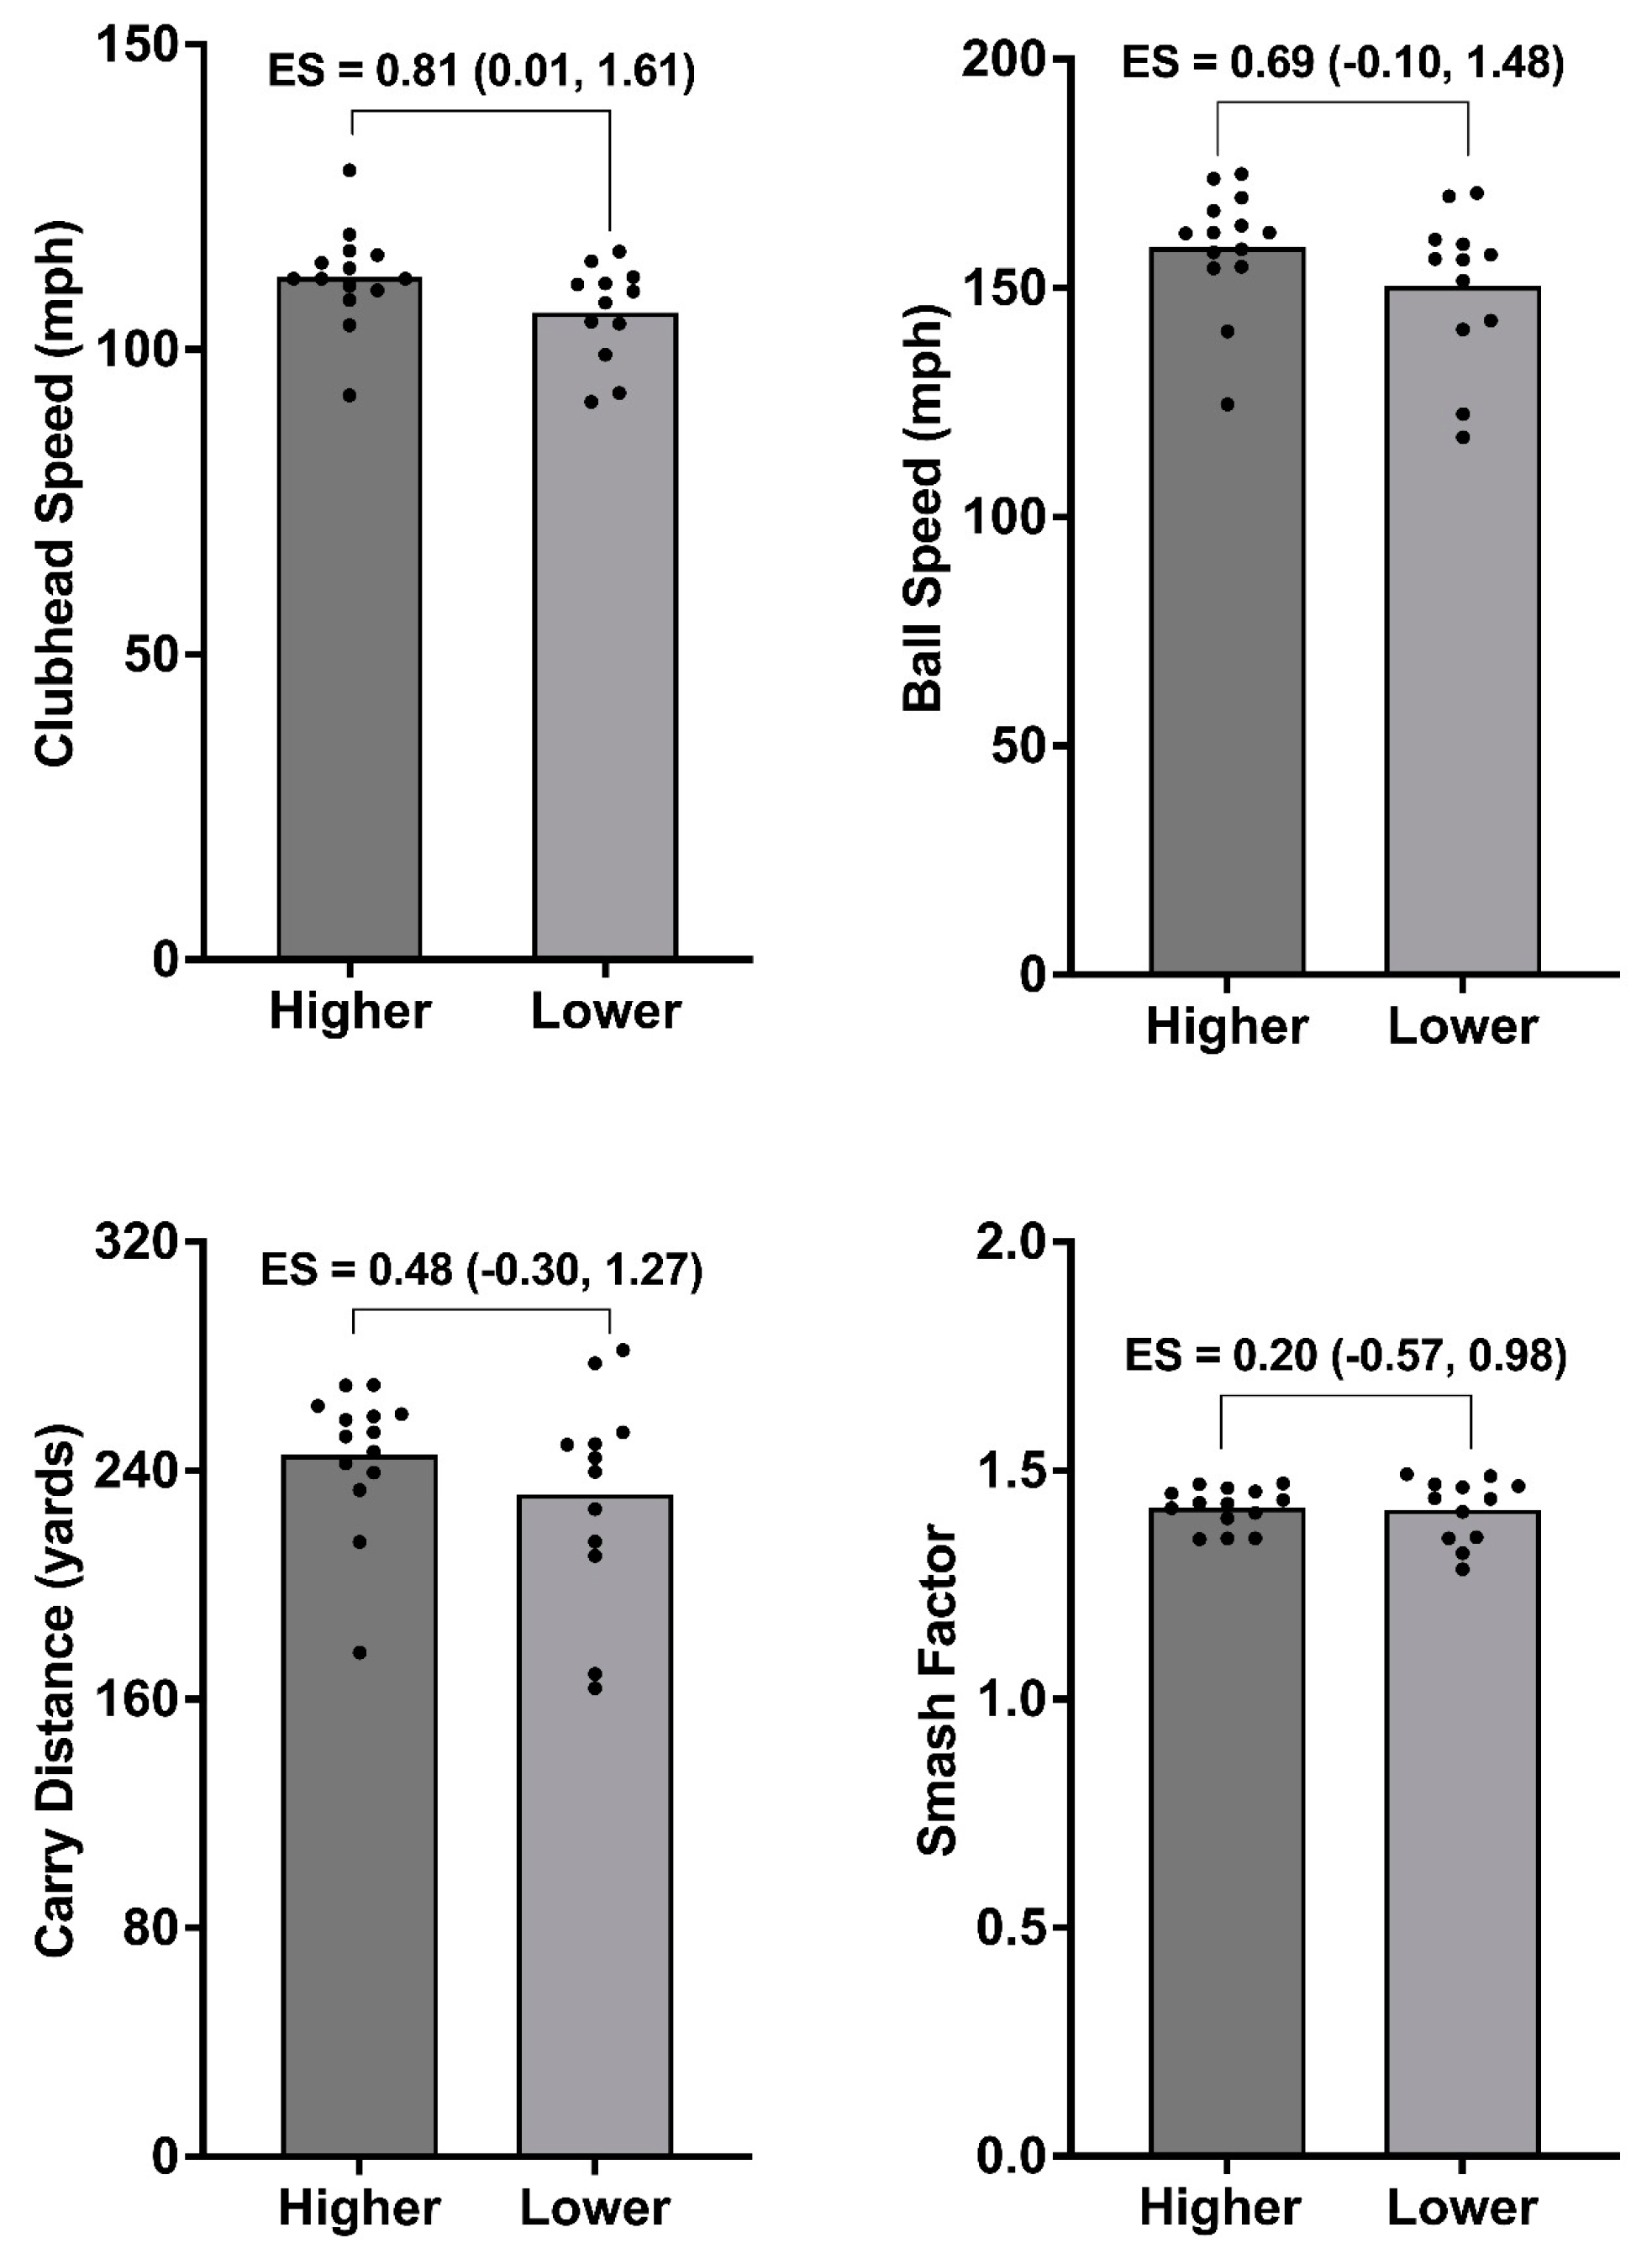
4.5. Median Split Analysis

When viewing Figure 4, Figure 5, Figure 6 and Figure 7, it is evident that meaningful between-group differences were present for all golf shot metrics, except one (smash factor in Figure 4), when the split was made for the IMTP, isometric bench press, and CMJ assessments. Simply put, these data support the high volume of large to very large associations seen in Figure 3, whereby players who demonstrate superior physical capacity in these assessments also demonstrate superior golf shot outcomes when using their driver. As such, these data underscore the importance of maximal and explosive force production in the lower body, and maximal force production in the upper body, which has been suggested in a number of previous golfing studies [4,8,11,39]. In contrast, no significant between-group differences were evident for any golfing metric when players were split via their medicine ball throw for distance results. However, the superior performing players on this test still always produced superior golfing data but not reaching the same level of statistical or practical significance as the other three physical performance assessments. Whilst challenging to fully explain, it seems plausible that when the only metric being measured is "distance thrown", which may simply be too crude of a global outcome measure to distinguish between player performance. In partial support of this narrative, the previous literature has shown that the metric of distance masks when an athlete is ready to return to play during hop testing in injured populations, whereas more strategy-based biomechanical data provides more meaningful and sensitive information [40].

4.6. Limitations

The findings of this study must be considered within the context of some limitations. Firstly, it is important to note that all golf testing was conducted in an indoor setting. Although every measure was taken to ensure that the data collection was as accurate as possible (e.g., only using already validated metrics for the Mevo+ launch monitor, use of Titleist radar capture technology golf balls), we were using radar technology to measure golf shot data, and this is best performed outdoors. Second, our study collected data over a single time point, which represents a snapshot of each player’s golf and physical characteristics, overlooking fluctuations or trends over time, which are likely to be more useful for practitioners. Finally, we were unable to control each player’s schedule; therefore, standardisation of potentially important factors such as the timing of testing and participants’ training schedule was not feasible. Consequently, this limitation may have introduced some additional variability in the data and future research should aim to control for this, where possible.

5. Conclusions

In summary, the present study developed a comprehensive physical testing battery for golfers and showed that the strongest associations with golf shot data was for maximal upper body force production and explosive lower body force production. This was reinforced from the median split analysis, which also highlighted the importance of maximal lower body force production as well. Therefore, not only do these assessments represent examples of good practice when undertaking physical performance testing for golfers, but our in-depth analysis also supports the development of lower and upper body strength and explosive strength for the lower body during a golfer’s physical training regime.

Author Contributions

Conceptualization, A.B., A.M., D.C., J.W., A.T. and C.B.; Methodology, A.B., J.W. and C.B.; Software, J.X.; Formal analysis, A.B., J.X. and C.B.; Investigation, A.B.; Data curation, A.B., J.X., S.B. and C.B.; Writing—original draft, A.B. and C.B.; Writing—review & editing, A.B., A.M., D.C., J.W., J.X., A.T., S.B. and C.B.; Supervision, C.B. All authors have read and agreed to the published version of the manuscript.

Funding

This research received no external funding.

Institutional Review Board Statement

Ethical approval was granted by the London Sport Institute research and ethics committee at Middlesex University, London, UK (Application Number: 21759, 5 August 2022).

Informed Consent Statement

Written informed consent was obtained from all subjects involved in the study.

Data Availability Statement

Data are contained within the article.

Conflicts of Interest

The authors declare no conflict of interest.

References

  1. Broadie, M. Assessing golfer performance on the PGA TOUR. Interfaces 2012, 42, 146–165. [Google Scholar] [CrossRef]
  2. Broadie, M. Every Shot Counts: Using the Revolutionary Strokes Gained Approach to Improve Your Golf Performance and Strategy; Avery: Brea, CA, USA, 2014. [Google Scholar]
  3. Brennan, A.; Ehlert, A.; Wells, J.; Broadie, M.; Coughlan, D.; Turner, A.; Bishop, C. Monitoring performance in golf: More than just clubhead speed. Strength Cond. J. 2022, 45, 631–641. [Google Scholar] [CrossRef]
  4. Wells, J.E.; Mitchell, A.C.; Charalambous, L.H.; Fletcher, I.M. Relationships between highly skilled golfers’ clubhead velocity and kinetic variables during a countermovement jump. Sports Biomech. 2022, 1–13. [Google Scholar] [CrossRef] [PubMed]
  5. Coughlan, D.; Taylor, M.J.; Jackson, J.; Ward, N.; Beardsley, C. Physical characteristics of youth elite golfers and their relationship with driver clubhead speed. J. Strength Cond. Res. 2020, 34, 212–217. [Google Scholar] [CrossRef] [PubMed]
  6. Read, P.J.; Lloyd, R.S.; Croix, M.D.; Oliver, J.L. Relationships between field-based measures of strength and power and golf club head speed. J. Strength Cond. Res. 2013, 27, 2708–2713. [Google Scholar] [CrossRef] [PubMed]
  7. Gordon, B.S.; Moir, G.L.; Davis, S.E.; Witmer, C.A.; Cummings, D.M. An investigation into the relationship of flexibility, power, and strength to club head speed in male golfers. J. Strength Cond. Res. 2009, 23, 1606–1610. [Google Scholar] [CrossRef] [PubMed]
  8. Bishop, C.; Brennan, A.; Ehlert, A.; Wells, J.; Brearley, S.; Coughlan, D. S&C for golf athletes: Biomechanics, common injuries, and physical requirements. Prof. Strength Cond. J. 2022, 63, 7–18. [Google Scholar]
  9. Read, P.J.; Lloyd, R.S. Strength and conditioning considerations for golf. Strength Cond. J. 2014, 36, 24–33. [Google Scholar] [CrossRef]
  10. Hellström, J. The relation between physical tests, measures, and clubhead speed in elite golfers. Int. J. Sports Sci. Coach. 2008, 3, 85–92. [Google Scholar] [CrossRef]
  11. Wells, J.E.; Mitchell, A.C.; Charalambous, L.H.; Fletcher, I.M. Relationships between highly skilled golfers’ clubhead velocity and force producing capabilities during vertical jumps and an isometric mid-thigh pull. J. Sports Sci. 2018, 36, 1847–1851. [Google Scholar] [CrossRef]
  12. Keogh, J.W.; Marnewick, M.C.; Maulder, P.S.; Nortje, J.P.; Hume, P.A.; Bradshaw, E.J. Are anthropometric, flexibility, muscular strength, and endurance variables related to clubhead velocity in low-and high-handicap golfers? J. Strength Cond. Res. 2009, 23, 1841–1850. [Google Scholar] [CrossRef]
  13. Sheehan, W.B.; Watsford, M.L.; Pickering Rodriguez, E.C. Examination of the neuromechanical factors contributing to golf swing performance. J. Sports Sci. 2019, 37, 458–466. [Google Scholar] [CrossRef]
  14. Sorbie, G.G.; Glen, J.; Richardson, A.K. Positive relationships between golf performance variables and upper body power capabilities. J. Strength Cond. Res. 2021, 35, 97–102. [Google Scholar] [CrossRef]
  15. Wells, J.E.; Langdown, B.L. Sports science for golf: A survey of high-skilled golfers’ “perceptions” and “practices”. J. Sports Sci. 2020, 38, 918–927. [Google Scholar] [CrossRef]
  16. Cheetham, P.J.; Martin, P.E.; Mottram, R.E.; St Laurent, B.F. The importance of stretching the “X-Factor” in the downswing of golf: The “X-Factor Stretch”. Optimising Perform. Golf 2001, 192–199. [Google Scholar]
  17. Brown, S.J.; Nevill, A.M.; Monk, S.A.; Otto, S.R.; Selbie, W.S.; Wallace, E.S. Determination of the swing technique characteristics and performance outcome relationship in golf driving for low handicap female golfers. J. Sports Sci. 2011, 29, 1483–1491. [Google Scholar] [CrossRef]
  18. Brennan, A.; Murray, A.; Coughlan, D.; Mountjoy, M.; Wells, J.; Ehlert, A.; Xu, J.; Broadie, M.; Turner, A.; Bishop, C. Validity and Reliability of the FlightScope Mevo+ Launch Monitor for Assessing Golf Performance. J. Strength Cond. Res. 2023, 10–519. [Google Scholar] [CrossRef]
  19. FlightScope Mevo+ Edition. FlightScope Mevo UK Store. 2023. Available online: https://flightscopemevo.co.uk/products/flightscope-mevo-plus-2023 (accessed on 18 June 2023).
  20. Pro V1x Radar Capture Technology (RCT)|Titleist. 2023. Available online: https://www.titleist.co.uk/en_GB/product/pro-v1x-rct/004PVXRCT.html (accessed on 18 June 2023).
  21. Furness, J.; Schram, B.; Cox, A.J.; Anderson, S.L.; Keogh, J. Reliability and concurrent validity of the iPhone® Compass application to measure thoracic rotation range of motion (ROM) in healthy participants. Peer J. 2018, 6, 4431. [Google Scholar] [CrossRef]
  22. Dynamics, H. User Manual. Available online: https://www.hawkindynamics.com/manual-getting-started (accessed on 20 November 2023).
  23. Berberet, D. Countermovement Jump Metrics 2019. Available online: https://www.hawkindynamics.com/blog/countermovement-jump-metrics-2019 (accessed on 20 November 2023).
  24. Haff, G.G.; Ruben, R.P.; Lider, J.; Twine, C.; Cormie, P. A comparison of methods for determining the rate of force development during isometric midthigh clean pulls. J. Strength Cond. Res. 2015, 29, 386–395. [Google Scholar] [CrossRef]
  25. Comfort, P.; Dos’ Santos, T.; Beckham, G.K.; Stone, M.H.; Guppy, S.N.; Haff, G.G. Standardization and methodological considerations for the isometric midthigh pull. Strength Cond. J. 2019, 41, 57–79. [Google Scholar] [CrossRef]
  26. Beckham, G.K.; Lamont, H.S.; Sato, K.; Ramsey, M.W.; Stone, M.H. Isometric strength of powerlifters in key positions of the conventional deadlift. J. Trainology 2012, 1, 32–35. [Google Scholar] [CrossRef]
  27. Beckham, G.K.; Sato, K.; Santana, H.A.; Mizuguchi, S.; Haff, G.G.; Stone, M.H. Effect of body position on force production during the isometric midthigh pull. J. Strength Cond. Res. 2018, 32, 48–56. [Google Scholar] [CrossRef]
  28. Owen, N.J.; Watkins, J.; Kilduff, L.P.; Bevan, H.R.; Bennett, M.A. Development of a criterion method to determine peak mechanical power output in a countermovement jump. J. Strength Cond. Res. 2014, 28, 1552–1558. [Google Scholar] [CrossRef]
  29. Koo, T.K.; Li, M.Y. A guideline of selecting and reporting intraclass correlation coefficients for reliability research. J. Chiropr. Med. 2016, 15, 155–163. [Google Scholar] [CrossRef]
  30. Cormack, S.J.; Newton, R.U.; McGuigan, M.R.; Doyle, T.L. Reliability of measures obtained during single and repeated countermovement jumps. Int. J. Sports Physiol. Perform. 2008, 3, 131–144. [Google Scholar] [CrossRef]
  31. Hopkins, W.; Marshall, S.; Batterham, A.; Hanin, J. Progressive statistics for studies in sports medicine and exercise science. Med. Sci. Sports Exerc. 2009, 41, 3. [Google Scholar] [CrossRef]
  32. Rhea, M.R. Determining the magnitude of treatment effects in strength training research through the use of the effect size. J. Strength Cond. Res. 2004, 18, 918–920. [Google Scholar]
  33. MacKenzie, S.; McCourt, M.; Champoux, L. How Amateur Golfers Deliver Energy to the Driver. Int. J. Golf Sci. 2020, 8, 1–21. [Google Scholar]
  34. Wells, G.D.; Elmi, M.; Thomas, S. Physiological correlates of golf performance. J. Strength Cond. Res. 2009, 23, 741–750. [Google Scholar] [CrossRef]
  35. Meister, D.W.; Ladd, A.L.; Butler, E.E.; Zhao, B.; Rogers, A.P.; Ray, C.J.; Rose, J. Rotational biomechanics of the elite golf swing: Benchmarks for amateurs. J. Appl. Biomech. 2011, 27, 242–251. [Google Scholar] [CrossRef]
  36. Häkkinen, K. Force production characteristics of leg extensor, trunk flexor and extensor muscles in male and female basketball players. J. Sports Med. Phys. Fit. 1991, 31, 325–331. [Google Scholar]
  37. Marshall, K.J.; Llewellyn, T.L. Effects of flexibility and balance on driving distance and club head speed in collegiate golfers. Int. J. Exerc. Sci. 2017, 10, 954–963. [Google Scholar]
  38. Loock, H.; Grace, J.; Semple, S. Association of selected physical fitness parameters with club head speed and carry distance in recreational golf players. Int. J. Sports Sci. Coach. 2013, 8, 769–777. [Google Scholar] [CrossRef]
  39. Ehlert, A. The correlations between physical attributes and golf clubhead speed: A systematic review with quantitative analyses. Eur. J. Sport Sci. 2021, 21, 1351–1363. [Google Scholar] [CrossRef]
  40. Kotsifaki, A.; Korakakis, V.; Whiteley, R.; Van Rossom, S.; Jonkers, I. Measuring only hop distance during single leg hop testing is insufficient to detect deficits in knee function after ACL reconstruction: A systematic review and meta-analysis. Br. J. Sports Med. 2019, 54, 139–153. [Google Scholar] [CrossRef]
Figure 1. Set up of indoor shot monitoring with the FlightScope (FS) Mevo+ launch monitor, which was aligned with the golf ball.
Applsci 14 01854 g001
Figure 2. Set-up of the isometric bench press assessment.
Applsci 14 01854 g002
Figure 3. A heatmap showing Pearson’s r correlations between physical assessments and golf shot data with a driver and 6-iron. Note 1: r = 0–0.09 = trivial (red), r = 0.10–0.29 = small (orange), r = 0.30–0.49 = moderate (yellow), r = 0.50–0.69 = large (green), r = 0.7–0.89 = very large (blue). Note 2: cm = centimetres, kg = kilograms, N = Newtons, m = metres, W = Watts, N·s = Newton seconds.
Applsci 14 01854 g003
Figure 4. Median split analysis showing higher (n = 13) vs. lower (n = 13) groups for peak force during the isometric mid-thigh pull and subsequent differences in golf shot data when using a driver. * indicates significant difference between groups (p < 0.05) as shown by Hedges g effect size (ES) data with 95% confidence intervals.
Applsci 14 01854 g004
Figure 5. Median split analysis showing higher (n = 13) vs. lower (n = 13) groups for peak force during the isometric bench press and subsequent differences in golf shot data when using a driver. * indicates significant difference between groups (p < 0.05) as shown by Hedges g effect size (ES) data with 95% confidence intervals.
Applsci 14 01854 g005
Figure 6. Median split analysis showing higher (n = 13) vs. lower (n = 13) groups for jump height during the countermovement jump and subsequent differences in golf shot data when using a driver. * indicates significant difference between groups (p < 0.05) as shown by Hedges g effect size (ES) data with 95% confidence intervals.
Applsci 14 01854 g006
Figure 7. Median split analysis showing higher (n = 13) vs. lower (n = 13) groups for distance during the medicine ball throw and subsequent differences in golf shot data when using a driver. Hedges g effect size (ES) data with 95% confidence intervals.
Applsci 14 01854 g007
Table 1. Common launch monitor metrics analysed from the Flightscope Mevo+ with accompanying definitions. Note: table has been modified from Brennan et al. [3].
ParameterUnit of MeasurementDescription of Parameter
Ball Speed Miles per hourThe speed of the golf ball’s centre of gravity immediately after separation from the club face
Clubhead Speed Miles per hourThe linear speed of the club head’s geometric centre just prior to first contact with the golf ball
Carry Distance YardsThe straight-line distance between where the ball started and where the trajectory crosses a point that is the same height as where the ball was hit
Smash FactorNo unitsThe ratio between ball speed and the club speed
Table 2. Mean ± standard deviation (SD) and reliability data for driver and 6-iron shot metrics.
VariablesDriver6-Iron
Mean ± SDICC (95% CIs)CV (95% CIs)SEMMean ± SDICC (95% CIs)CV (95% CIs)SEM
Clubhead Speed (mph)109.24 ± 8.430.99 (0.99, 1.00)0.64 (0.55, 0.77)0.8492.92 ± 7.120.99 (0.98, 0.99)0.75 (0.65, 0.90)0.71
Ball Speed (mph)155.06 ± 15.290.98 (0.96, 0.99)1.64 (1.42, 1.96)2.16122.01 ± 10.800.90 (0.82, 0.95)3.00 (2.58, 3.59)3.42
Carry Distance (yards)239.15 ± 31.330.94 (0.90, 0.97)3.54 (3.05, 4.24)7.67169.81 ± 19.640.87 (0.77, 0.93)4.65 (4.00, 5.58)7.08
Smash Factor1.42 ± 0.060.80 (0.61, 0.90)1.71 (2.06, 2.60)0.031.32 ± 0.060.65 (0.27, 0.83)2.84 (2.44, 3.40)0.04
ICC = intraclass correlation coefficient; CV = coefficient of variation; CI = confidence interval; SEM = standard error of the measurement; mph = miles per hour.
Table 3. Mean ± standard deviation (SD) and reliability data for physical assessments.
Physical Test MeasureMean ± SDICC (95% CIs)CV (95% CIs)SEM
Anthropometry
Height (cm)177.08 ± 7.181.00 (1.00, 1.00)0.20 (0.17, 0.24)0
Mass (kg)77.40 ± 12.541.00 (0.99, 1.00)0.96 (0.83, 1.15)0
Wingspan (cm) 182.87 ± 8.921.00 (0.99, 1.00)0.30 (0.26, 0.35)0
Isometric Mid-thigh Pull
Peak Force (N)1357.62 ± 318.540.99 (0.98, 0.99)2.53 (2.18, 3.03)31.85
Force at 100 ms (N)471.84 ± 185.020.85 (0.74, 0.92)19.76 (16.83, 24.03)71.66
Force at 200 ms (N)762.25 ± 255.580.92 (0.86, 0.96)10.85 (9.30, 13.10)72.29
Force at 300 ms (N)973.30 ± 235.000.94 (0.90, 0.97)6.02 (5.17, 7.23)57.56
Countermovement Jump
Jump Height (m)0.29 ± 0.070.99 (0.99, 1.00)2.33 (2.01, 2.79)<0.01
Peak Propulsive Power (W)3495.42 ± 827.970.99 (0.99, 1.00)1.98 (1.70, 2.37)82.80
Peak Propulsive Force (N)1706.17 ± 314.360.97 (0.95, 0.98)3.28 (2.82, 3.93)54.45
Net Impulse (N·s)180.58 ± 33.530.99 (0.99, 1.00)1.27 (1.09, 1.52)3.35
Isometric Bench Press
Peak Force (N)569.11 ± 200.250.98 (0.97, 0.99)5.30 (4.56, 6.36)28.32
Force at 100 ms (N)328.84 ± 158.000.85 (0.74, 0.92)25.78 (21.89, 31.52)61.19
Force at 200 ms (N)439.54 ± 156.240.97 (0.94, 0.98)7.69 (6.60, 9.26)27.06
Force at 300 ms (N)481.26 ± 172.020.97 (0.94, 0.98)7.66 (6.58, 9.22)29.79
Medicine Ball Throw
Distance (m)3.6 ± 0.670.97 (0.96, 0.99)3.00 (2.58, 3.59)0.12
Thoracic Spine Rotation
Right Direction (°)69.44 ± 4.110.99 (0.98, 0.99)0.66 (0.57, 0.79)0.41
Left Direction (°)66.01 ± 5.370.99 (0.99, 1.00)0.78 (0.67, 0.93)0.54
ICC = intraclass correlation coefficient; CV = coefficient of variation; CI = confidence interval; SEM = standard error of the measurement; ms = milliseconds; cm = centimetres; kg = kilograms; N = Newtons; m = metres; W = Watts; N·s = Newton seconds; ° = degrees.
Disclaimer/Publisher’s Note: The statements, opinions and data contained in all publications are solely those of the individual author(s) and contributor(s) and not of MDPI and/or the editor(s). MDPI and/or the editor(s) disclaim responsibility for any injury to people or property resulting from any ideas, methods, instructions or products referred to in the content.

