Abstract
Capturing internal flow experimentally presents significant challenges due to the asymmetric propagation and strong unsteadiness of a stall cell in the circumferential direction. In this study, a low-speed counter-rotating axial compressor test rig was designed based on a counter-rotating compressor to immobilize a stall cell and measure its internal flow characteristics. Determining an appropriate speed ratio that is capable of stabilizing the circumferential position of the stall cell in the counter-rotating compressor enabled visualization measurements to be conducted successfully. The preliminary results demonstrated the successful immobilization of the stall cell using an appropriate rotating speed ratio. Furthermore, the oil flow visualization measurements confirmed the presence of a distinct stall cell structure on the casing wall. This work represents an innovative approach towards immobilizing stall cells in axial compression systems.
1. Introduction
The design and stable operation of axial compressors at a given shaft speed are limited by stall cells, which have been extensively studied as the predominant flow instability phenomenon in compressor systems over the past four decades. Notably, Emmons et al. [1] were among the first to propose a propagation mechanism for stall cells. These cells typically create blockages that result in increased incidence ahead of the cell and decreased incidence behind it, thereby facilitating stall recovery in adjacent passages. Furthermore, subsequent researchers have conducted non-linear analyses of stall cell propagation [2,3]. Since then, most studies have focused on understanding and mitigating stall inception due to its practical relevance for industrial applications.
The stall cell was initially considered to be a stagnant region with a wake downstream. Day and Cumpsty [4] conducted the first comprehensive velocity measurement of rotating stall cells in axial compressors, revealing their highly active and three-dimensional nature with significant circumferential velocity. In their subsequent publication, Cumpsty and Greitzer [5] developed a model to correlate the propagation speed of the stall cell with pressure changes at its trailing edge. Das and Jiang [6] reported measurements from a three-stage axial flow compressor, while Mathioudakis and Breugelmans [7] presented 3D velocity vectors of a rotating stall cell for the first time. Saxer-Felici et al. [8] performed a 2D CFD simulation on post-stall behavior in compressors. Nurzia et al. [9] presented experimental results from a two-stage axial flow compressor, indicating that the axial dimension of the stall cell is significantly larger than its circumferential dimension, suggesting that measurements or computations should cover both far upstream and downstream regions for post-stall flow investigations. Choi et al. [10] presented results using both experimental and computational methods for an axial flow transonic fan. One useful piece of information from these results concerns the dimension of the cell. The cell extended upstream of the rotor by 4-5 axial chords based on the production of entropy. Gourdain et al. [11], through numerical simulations on an entire annulus of an axial flow compressor stage, demonstrated that while CFD tools are effective in predicting stall occurrence, they may not accurately capture detailed flow characteristics. Therefore, elaborate measurements are still necessary to fully understand the complex flow structures within a stall cell. Pardowitz et al. [12], using PIV techniques on an annular cascade configuration, detected stall-like flow structures propagating from the pressure side to the suction side of one blade; this finding further supports Emmons et al.’s explanation regarding stall cell propagation. Ji et al. [13] proposed a computational method for rotating stalls and surge transients in an axial compressor. Mario et al. [14] researched the physics of pre-stall propagating disturbances in axial compressors.
The measurement of flow within a rotating stall cell poses significant challenges due to its highly three-dimensional and unsteady nature. The primary source of unsteadiness in the cell is its rotation, while the secondary source is the passage of blades through the cell. Additional sources of unsteadiness may include large vortices and turbulent eddies, among others. Pacot et al. [15] employed the large eddy simulation (LES) to computationally investigate rotating stalls in a pump, revealing that blade-passing-induced fluctuations are considerably lower in the stalled region compared to the un-stalled region. This observation suggests that blades are not crucial within a stall cell.
Several test rigs have been documented in the literature for investigating the structure of a rotating stall flow [16,17,18,19,20,21]. While some of these rigs offer a suitable platform for experimental analysis of the flow field, most lack specific design considerations for rotating stall research, resulting in inadequate axial dimensions to encompass the entire range of stall cells. Moreover, due to the pronounced unsteadiness in the rotating stall flow field, a majority of experimental measurements heavily rely on high-frequency probes; however, their limited frequency response poses a constraint.
Using the stall cell as a benchmark, its major unsteadiness is effectively eliminated, while the secondary unsteadiness remains weak, as previously mentioned. In this relative coordinate frame, the rotor and stator rotate in opposite directions, resembling a counter-rotating-type compressor. The measurement techniques suitable for flow analysis, such as oil flow visualization, tuft flow visualization, and pneumatic multi-hole probes, can be employed to acquire detailed insight into the flow structure within the stall cell.
Keeping this in mind, a low-speed counter-rotating compressor test rig was designed and commissioned as an integral part of the present study. The primary objectives of this research encompass elucidating the employed design methodology for developing the compressor, determining crucial parameters such as pressure ratio, formulating a comprehensive design for both the compressor and test rig systems, initiating operational procedures to evaluate performance metrics, and conducting experimental investigations to characterize operational behavior under stall conditions. These findings will significantly contribute to future advancements by facilitating effective integration and utilization of circumferential distortion mesh technology for successful mitigation of stall cell formation while showcasing the preventive capabilities of this technology. This paper’s contributions are twofold: firstly, it presents the design, characterization, and commissioning of a novel compressor test rig, which is now available for immobilizing stall cells; secondly, it develops a processing method to obtain two-dimensional velocity vectors and limit streamlines of the flow field from images measured using oil flow visualization measurement techniques.
2. Materials and Methods
2.1. Design Method for the Compressor
The design dimensions of this test rig are based on a single-stage low-speed axial flow compressor test rig. This experimental setup exhibited typical stall characteristics during the state of instability. A schematic diagram depicting the fundamental structure is presented in Figure 1, while Table 1 provides detailed parameters specific to the compressor. The reference to the single-stage low-speed axial flow compressor primarily pertains to the form of the stall cell (full span with single stall cell) and its size range (circumferential and axial), which helps determine the positioning of measurement points for designing the new test rig.
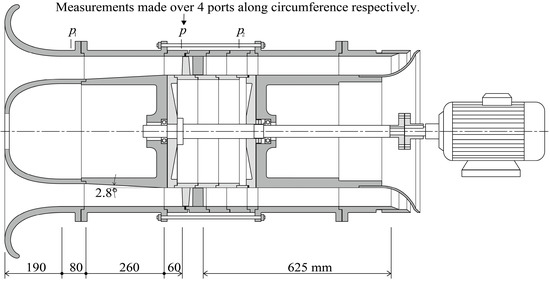
Figure 1.
Schematic layout of a low-speed axial compressor.

Table 1.
The main parameters of low-speed axial compressor.
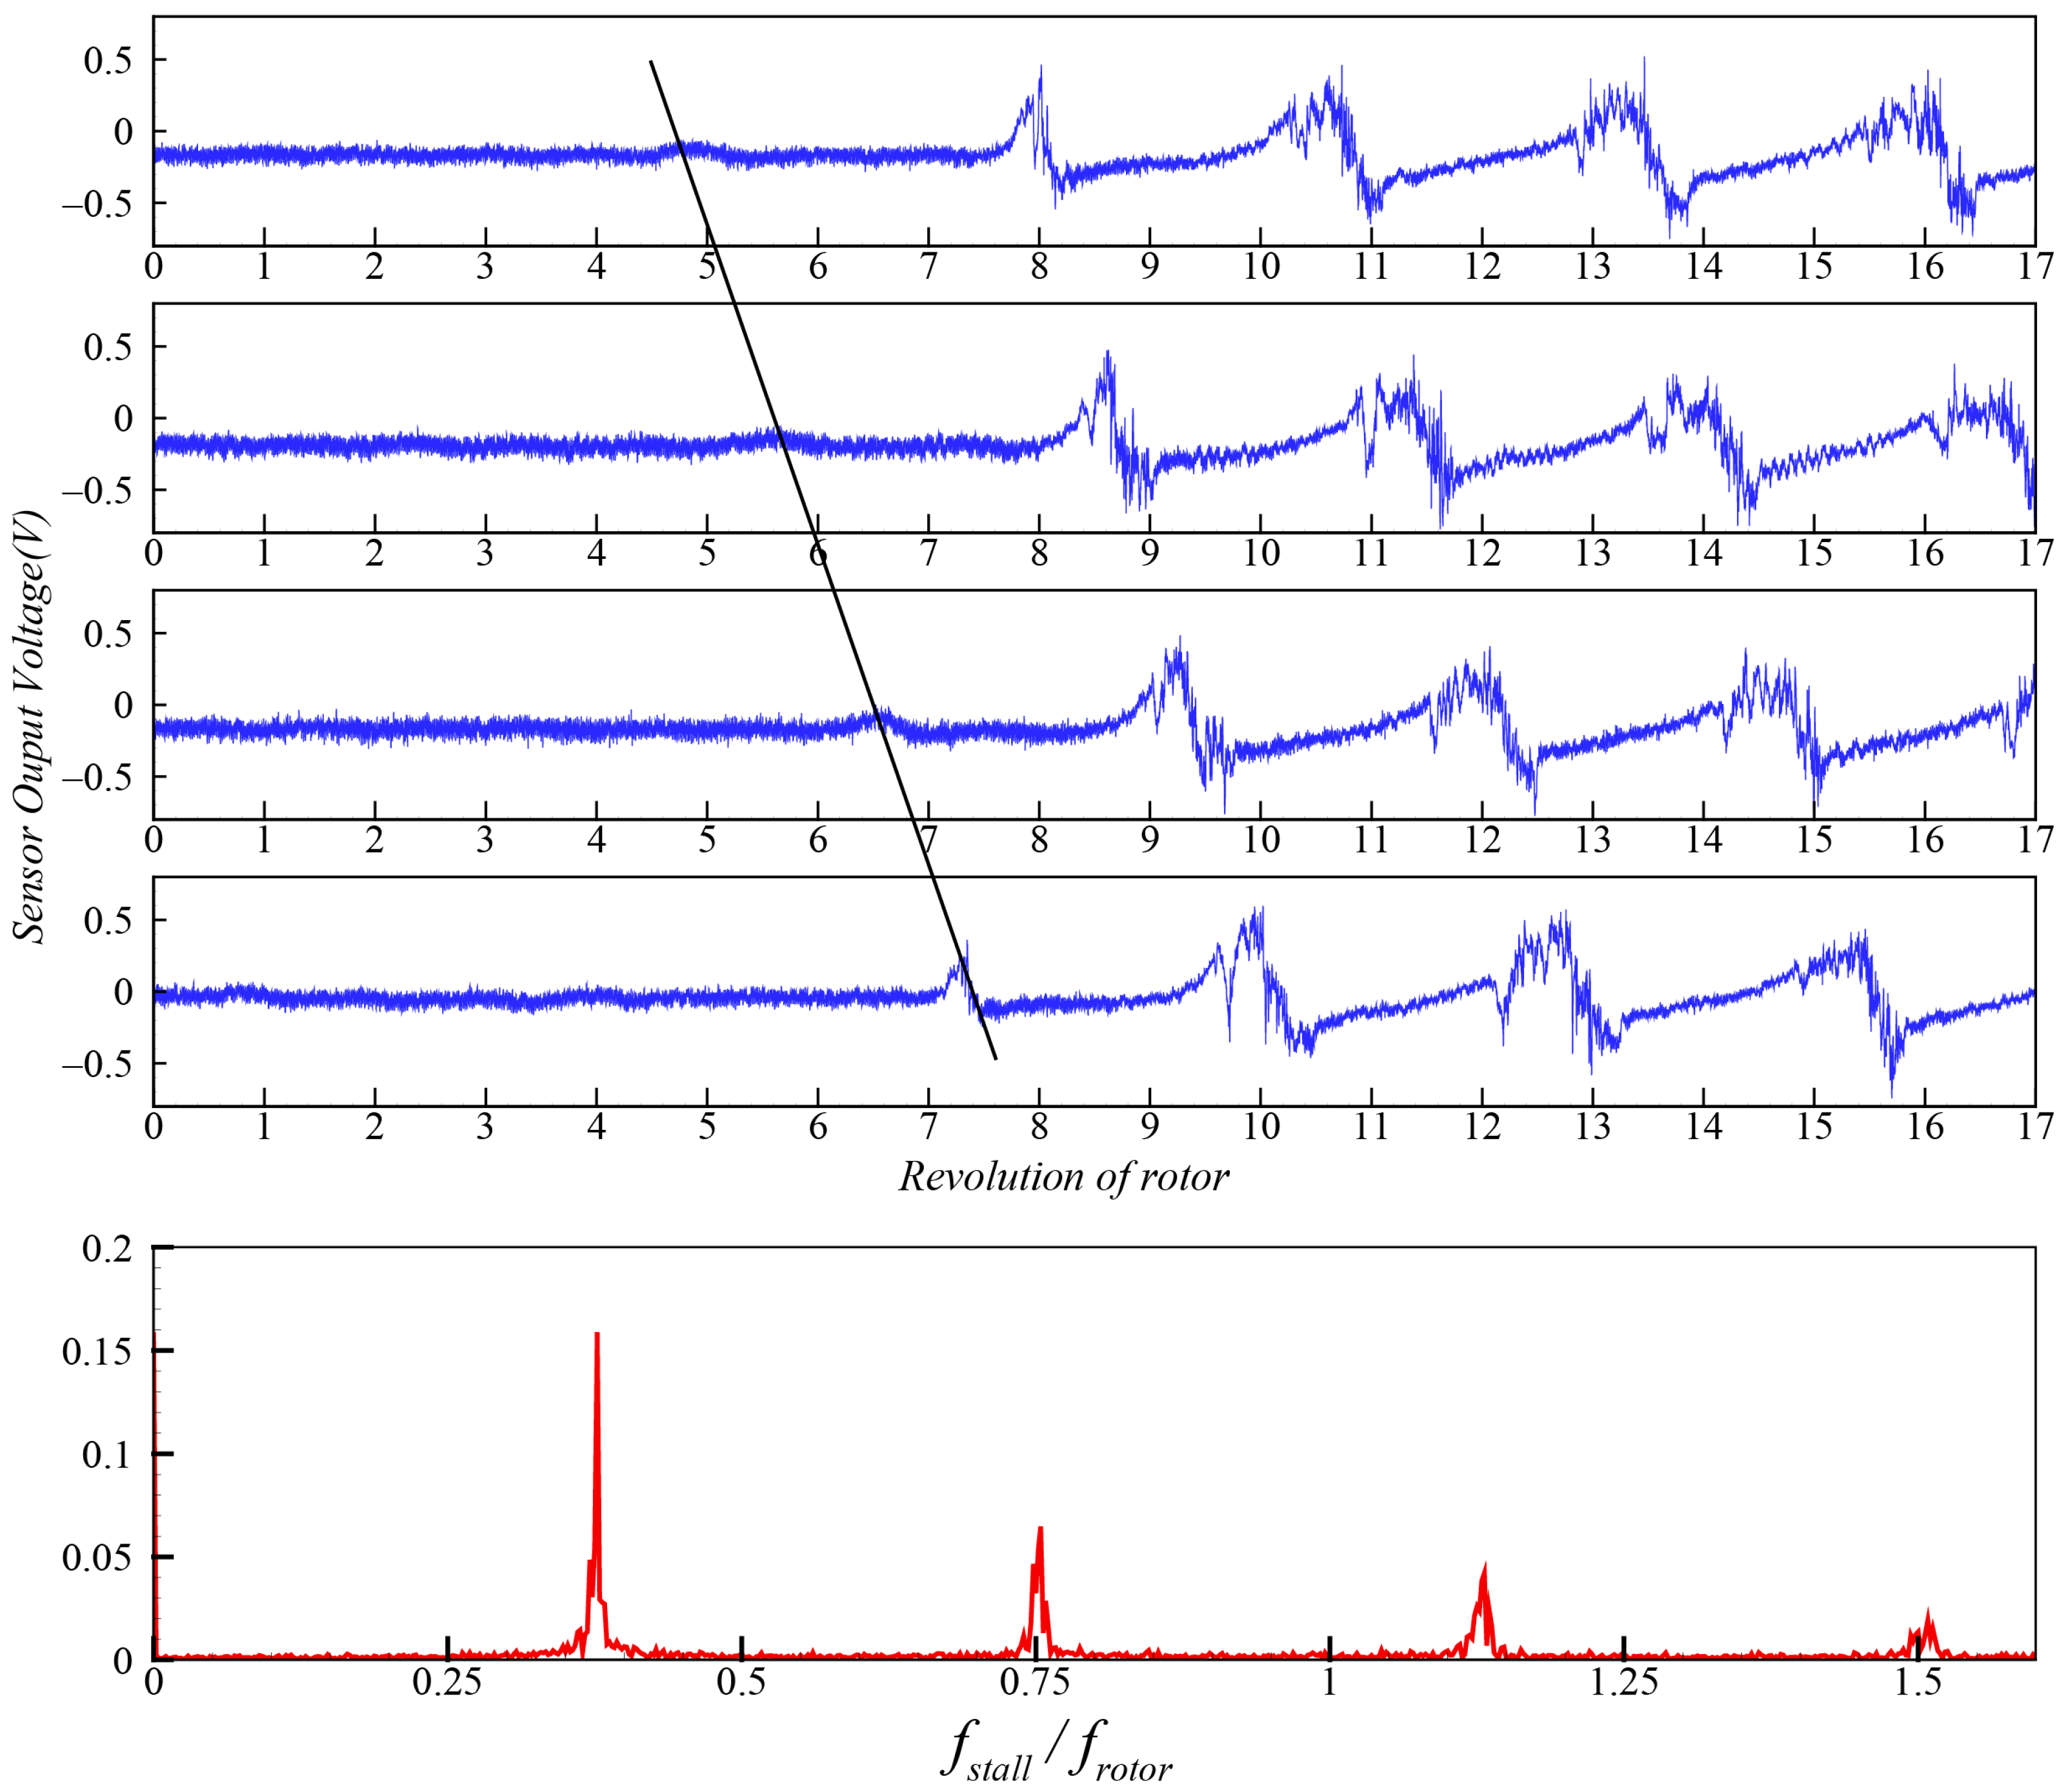
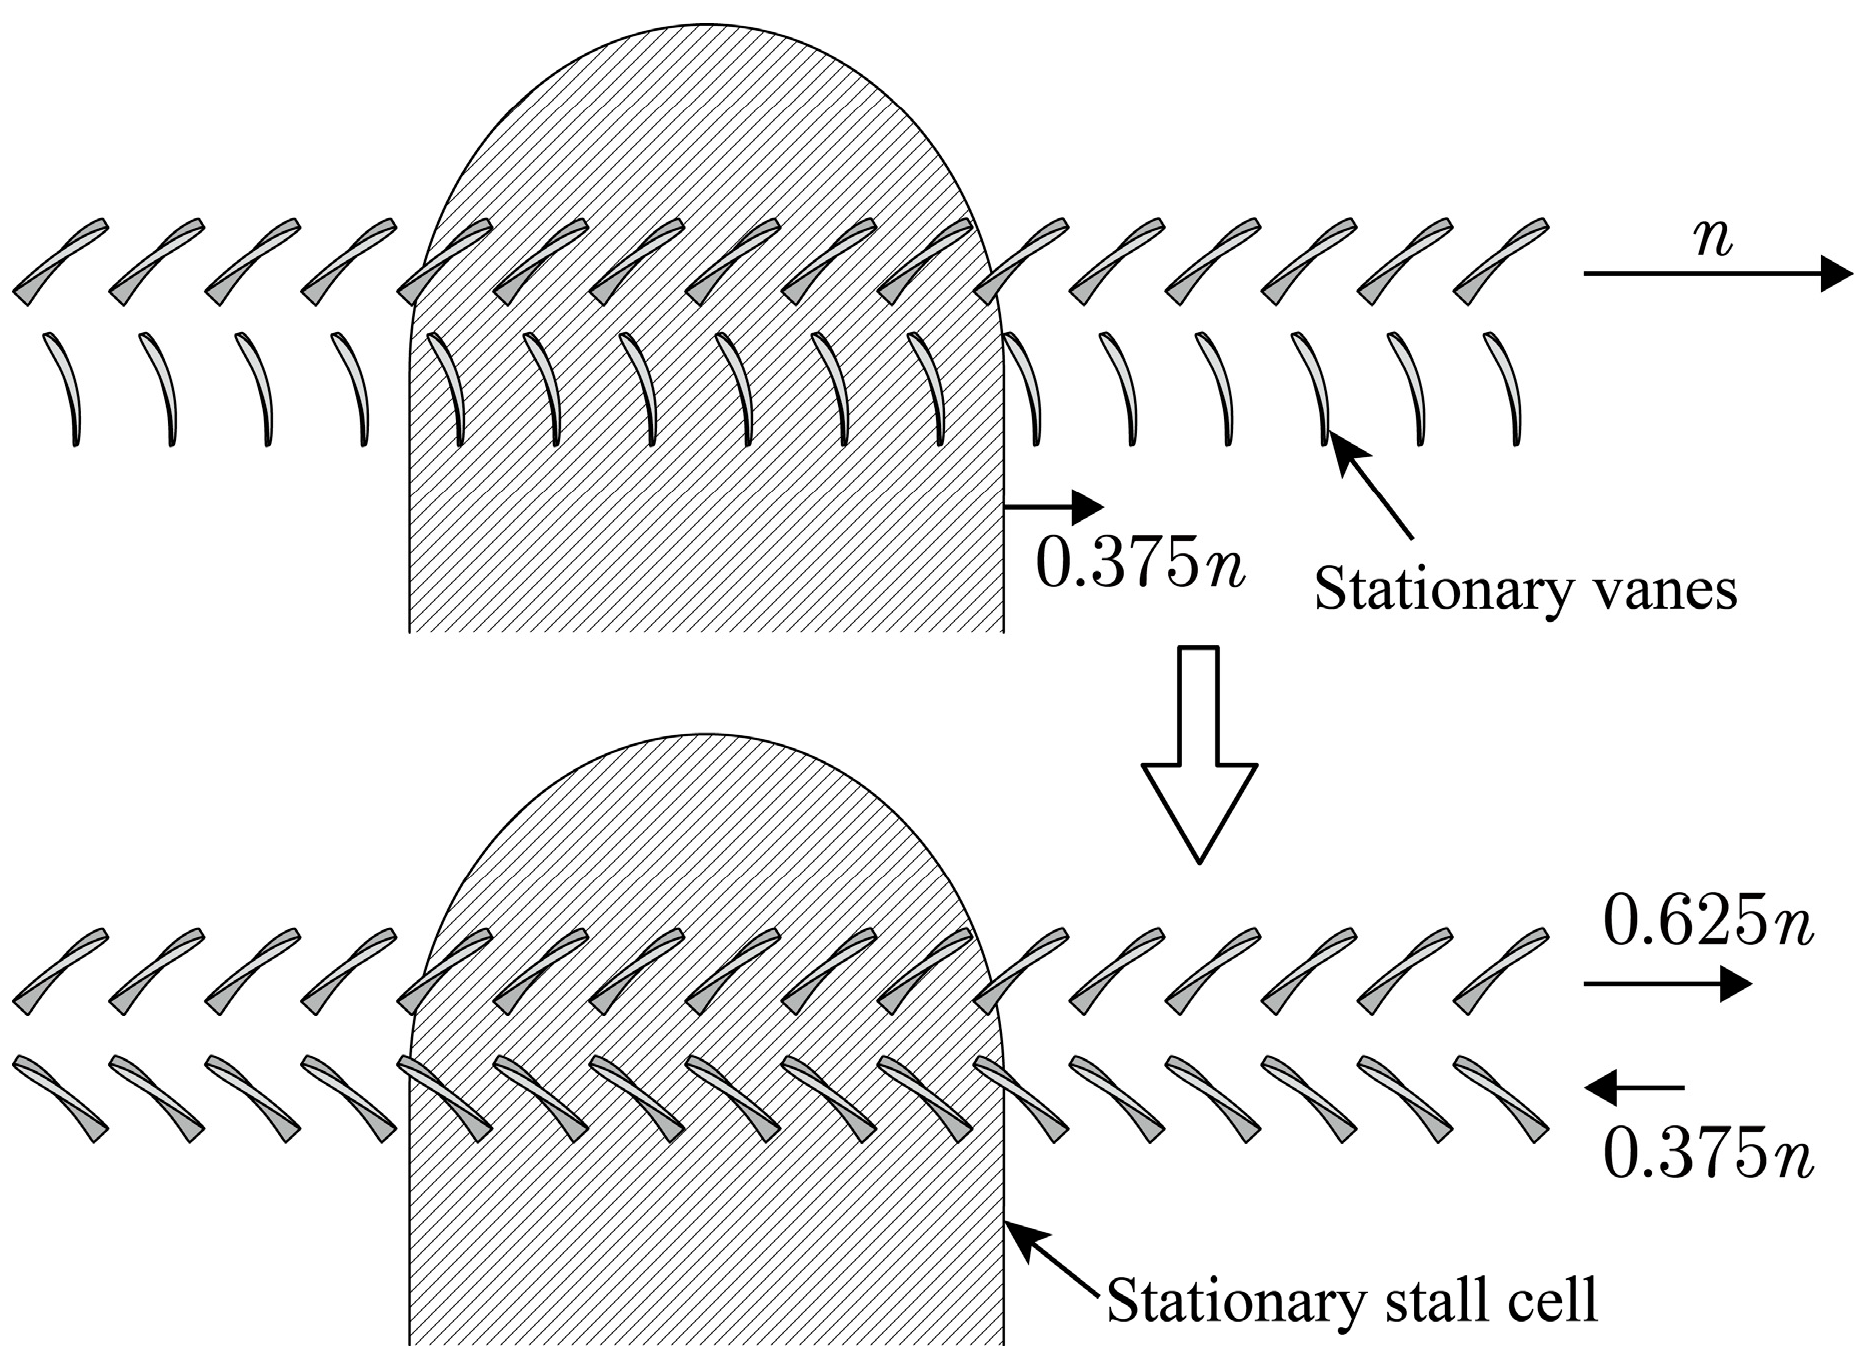
The static pressure signal on the compressor wall, collected by four sensors distributed uniformly around its circumference, exhibits temporal variations when the compressor enters the stall. Figure 2 illustrates that the pressure disturbances of these four sensors are also out of phase by a quarter period, indicating the presence of a single stall cell throughout the entire stall process in the compressor. As the flow decreases, there is a gradual increase in the amplitude of pressure disturbances. Furthermore, even after complete stalling occurs, the speed of this stall cluster remains at approximately 37.5% of the rotor speed.
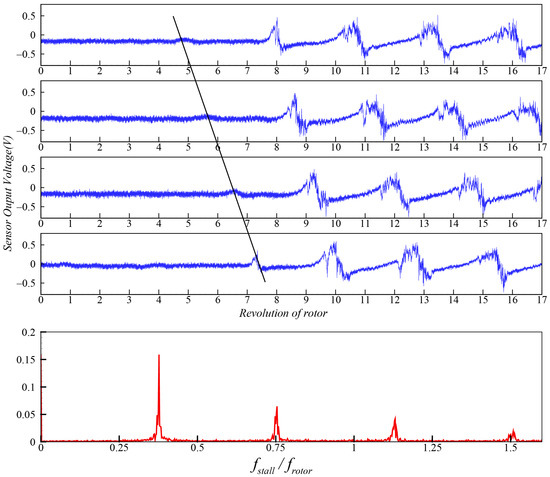
Figure 2.
Wall pressure signal on the leading edge of the first rotor during stall.
Based on the results depicted in Figure 2, with respect to the stall cell coordinate system, the rotor’s rotational speed is 62.5% (a reduction of 37.5%) while rotating in one direction, whereas the stator rotates at a speed of 37.5% but in the opposite direction. Consequently, for the proposed counter-rotating compressor, a rotational speed ratio of 62.5:37.5 or 5:3 is designed accordingly. As a result, the first rotor operates at a speed of 1500 r/min, and the second rotor at 900 r/min. The concept of transforming from a single-stage compressor to a counter-rotating compressor is illustrated in Figure 3.

Figure 3.
Design of a counter-rotating compressor for immobilization of stall cell.
However, the experiment revealed that the stall cell exhibited continuous rotation at this speed ratio. After conducting replicate tests, an optimal rotation speed ratio of 1.1 was determined for the two rotors, with the first row rotating at a speed of 1100r/min and the second row at 1000 r/min. A detailed account of the specific testing process will be provided in the section detailing compressor characteristics and stall cell immobilization.
2.2. Test Rig Description
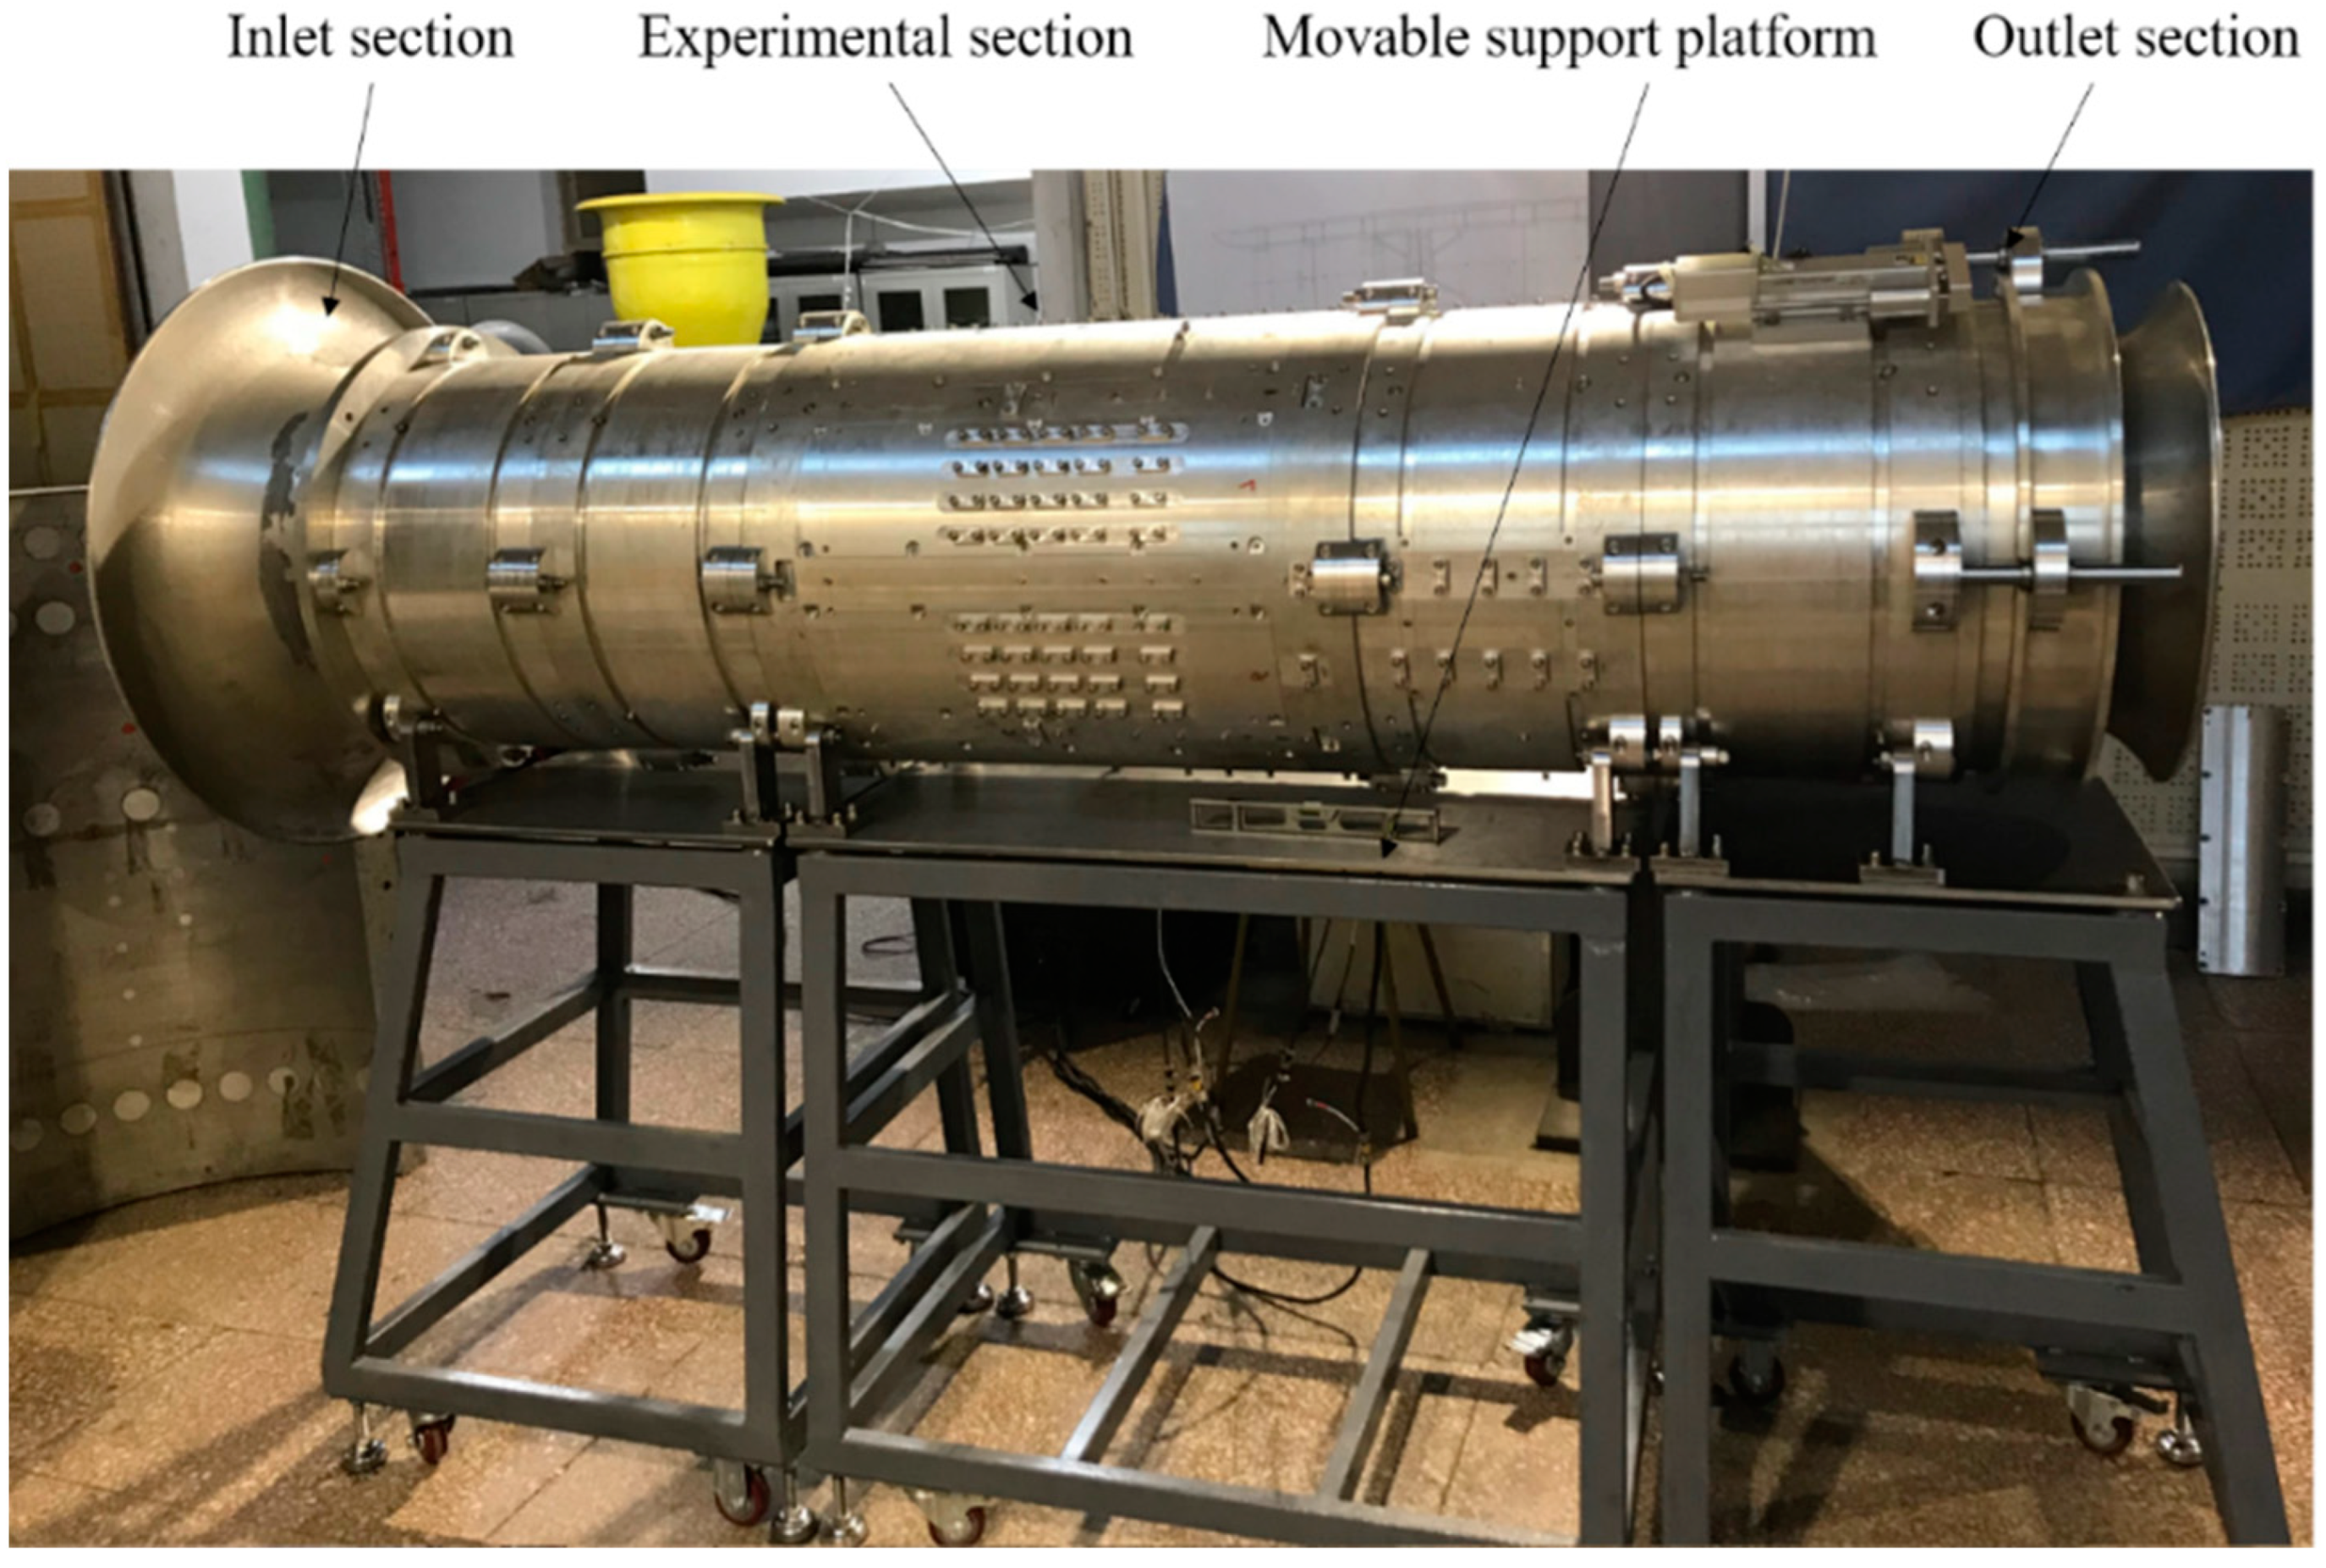
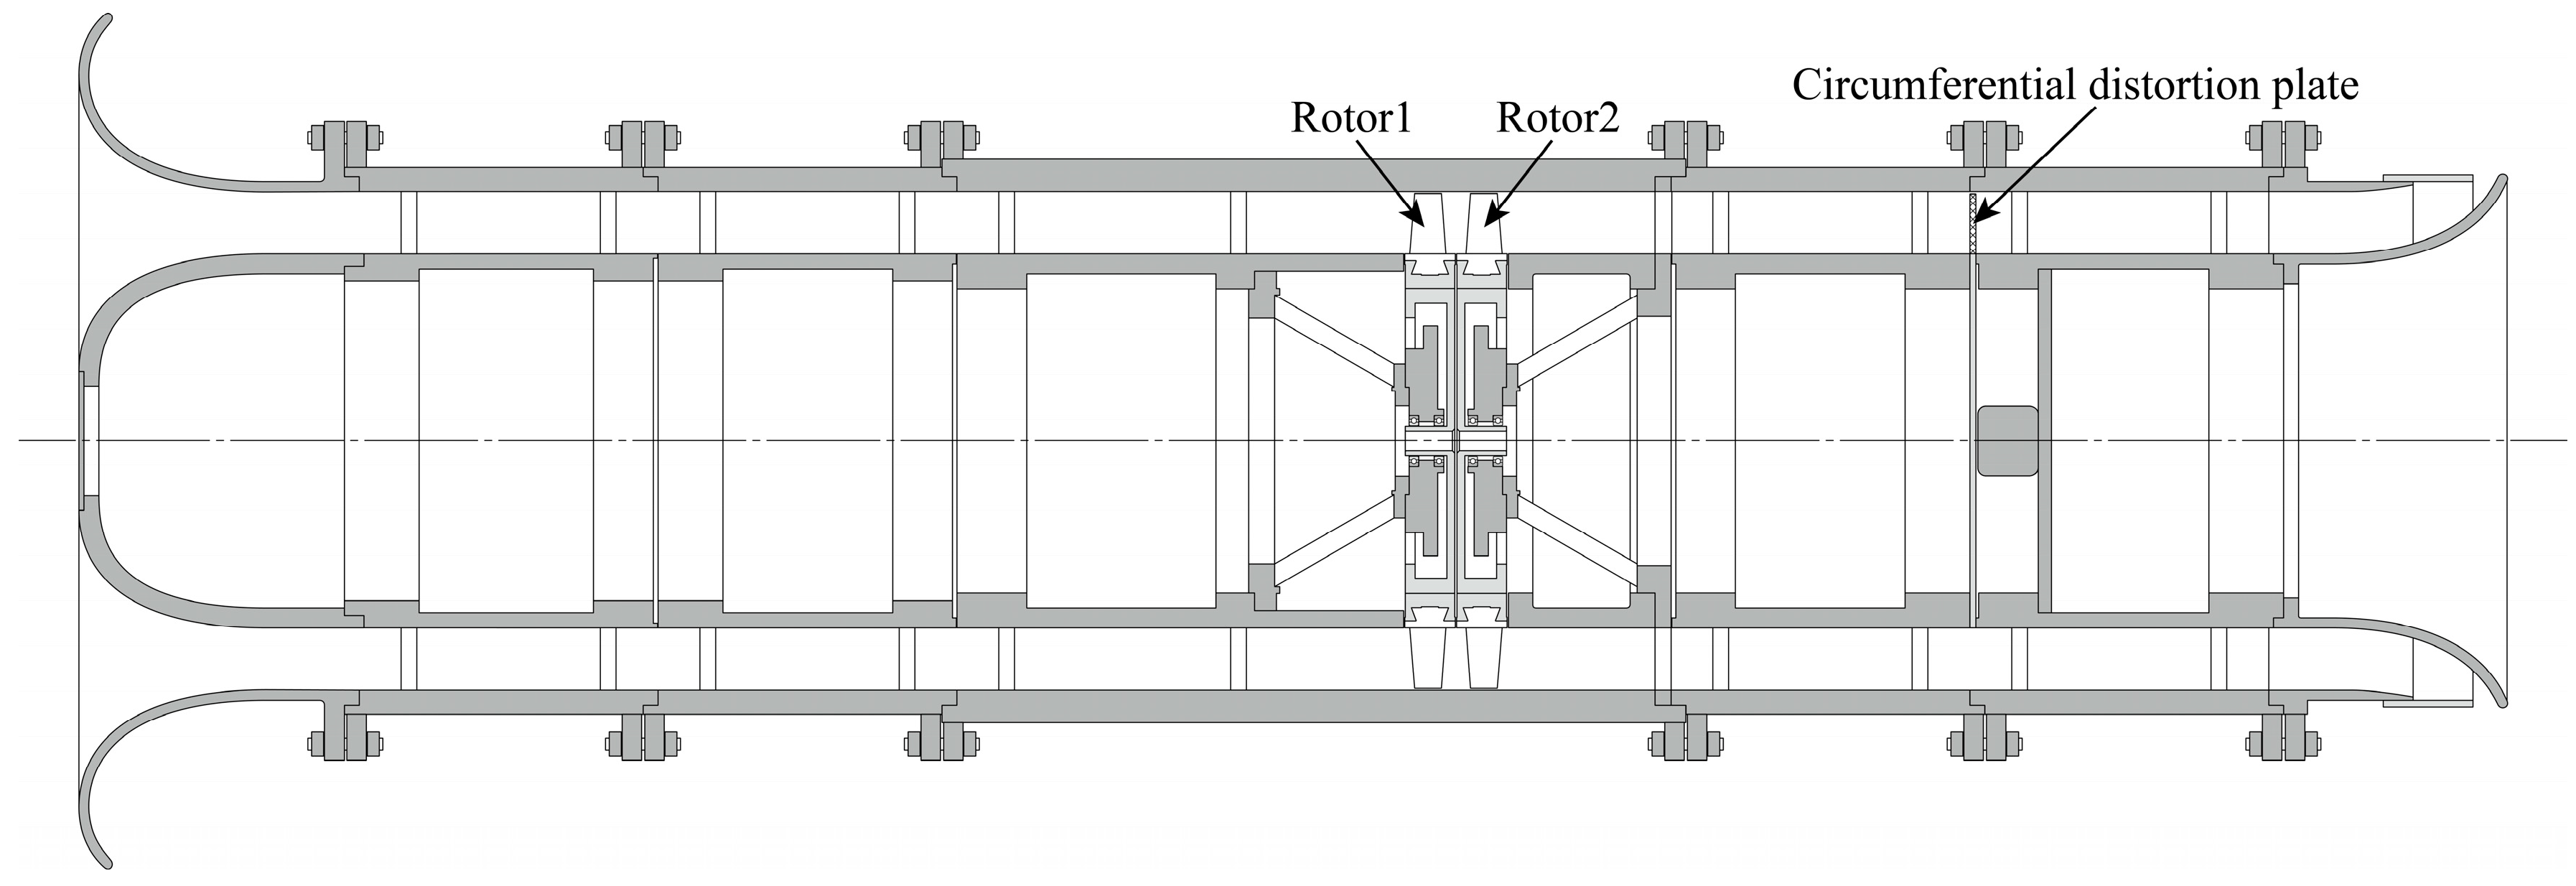
The physical representation and schematic layout of the low-speed counter-rotating axial flow compressor test rig are depicted in Figure 4 and Figure 5, respectively. Table 2 presents the key parameters of the low-speed counter-rotating axial flow compressor test rig. The outer diameter of the compressor is measured at 0.5 m, with a hub ratio of 0.75. Comprising two rows of counter-rotating rotor blades, the low-speed counter-rotating compressor test rig consists of a first row with 38 blades and a second row with 41 blades. In order to assess the primary characteristics of the stall cell, appropriate extensions were made to the axial dimensions of both the upstream and downstream regions of the test rig. Consequently, the total axial length of the test rig reached approximately 2.6 m. The distance from the bell mouth to the leading edge of the first row’s rotor blades is approximately double its outer diameter, while for the second-row rotor blades, the distance is also approximately double its outer diameter lengthwise from the trailing edge to the outlet.
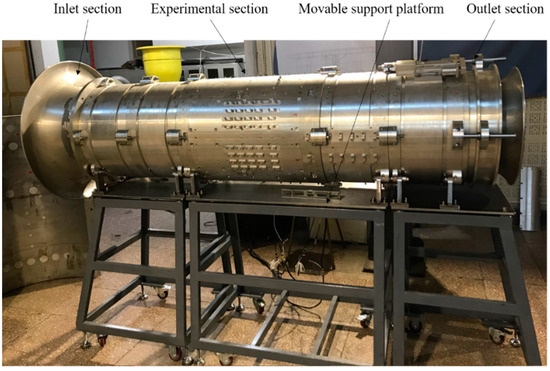
Figure 4.
The physical picture of the counter-rotating compressor.

Figure 5.
Schematic layout of the low-speed counter-rotating axial flow compressor test rig.
Table 2.
The main parameters of the compressor.
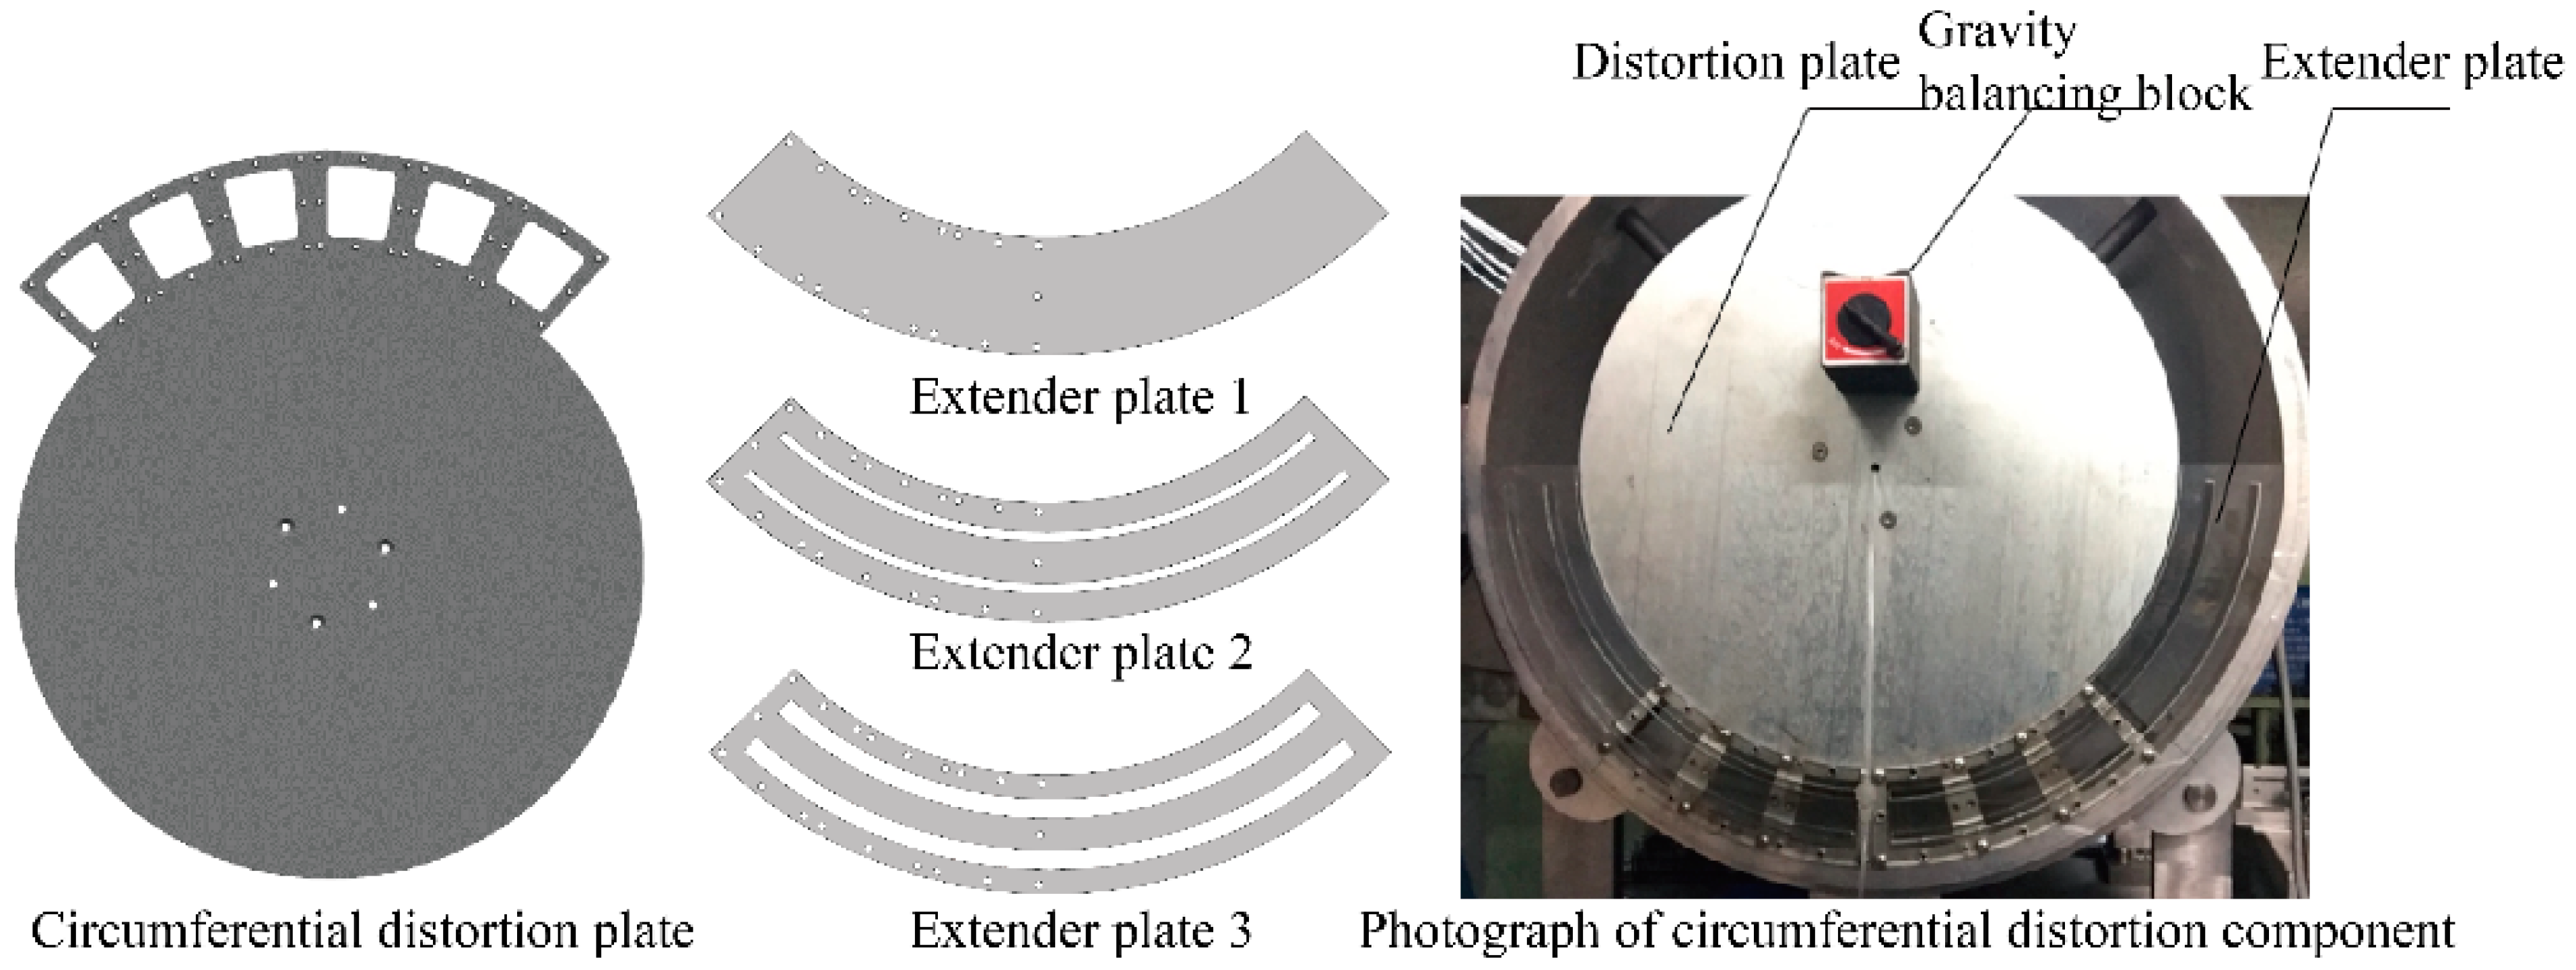
When a rotating stall is observed, one or more stall cells will be present in the flow field, resulting in an uneven flow field within the compressor as opposed to a circumferentially uniform flow field. Subsequently, a circumferential distortion adjustment plate is positioned downstream of the rotor for the adjustment of the position of the stall cell. The configuration and appearance of the circumferential adjustment plate are depicted in Figure 6, which comprises a main plate for circumferential adjustment along with two extension plates. The axial positioning of the circumferential distortion plate on the test rig can be seen in Figure 5. The original intention behind the design of the distortion plate was to create six holes in it, aiming to adjust the position of the stall cell by varying the size of the metal wire mesh installed on these holes. However, experiments revealed that this scheme was unfeasible due to the low sensitivity of the stall cell towards the distortion plate. Therefore, an extender plate concept was adopted with different shapes attached to the main plate. To evaluate its effectiveness, three types of extension plates were designed for experimentation, as illustrated in Figure 6. The results indicate that the No.2 extension plate yields optimal adjustments.
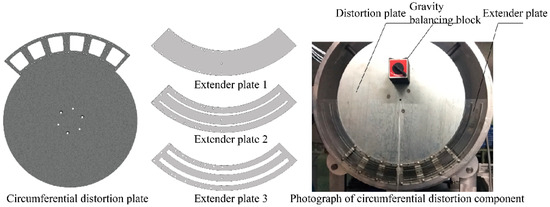
Figure 6.
Schematic diagram and photograph of circumferential adjustment plate.
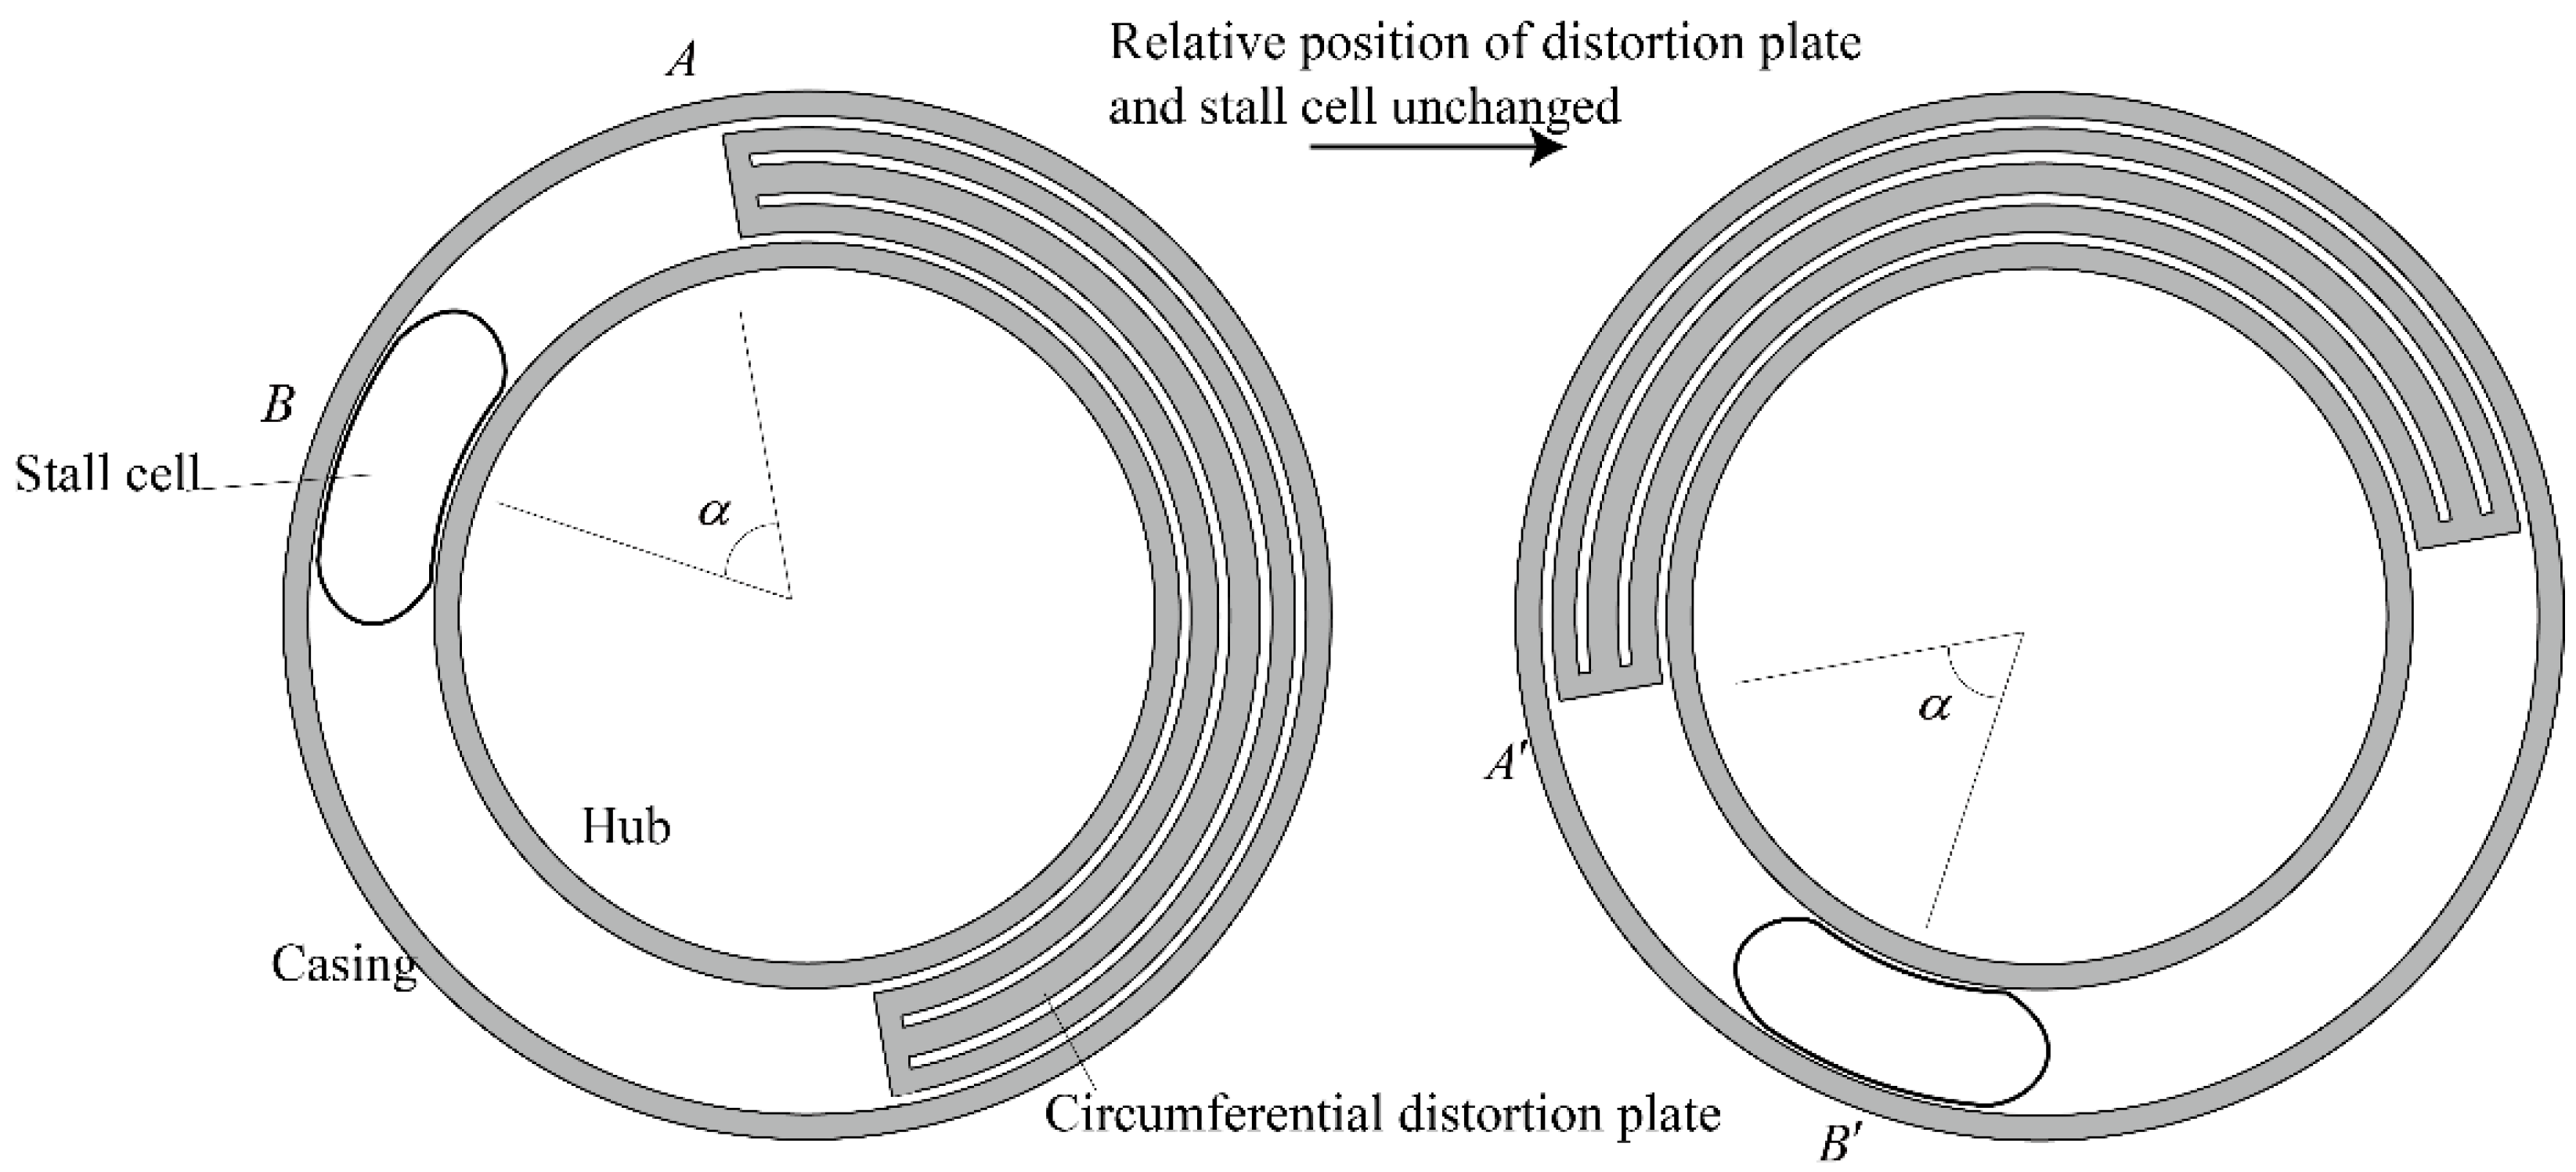
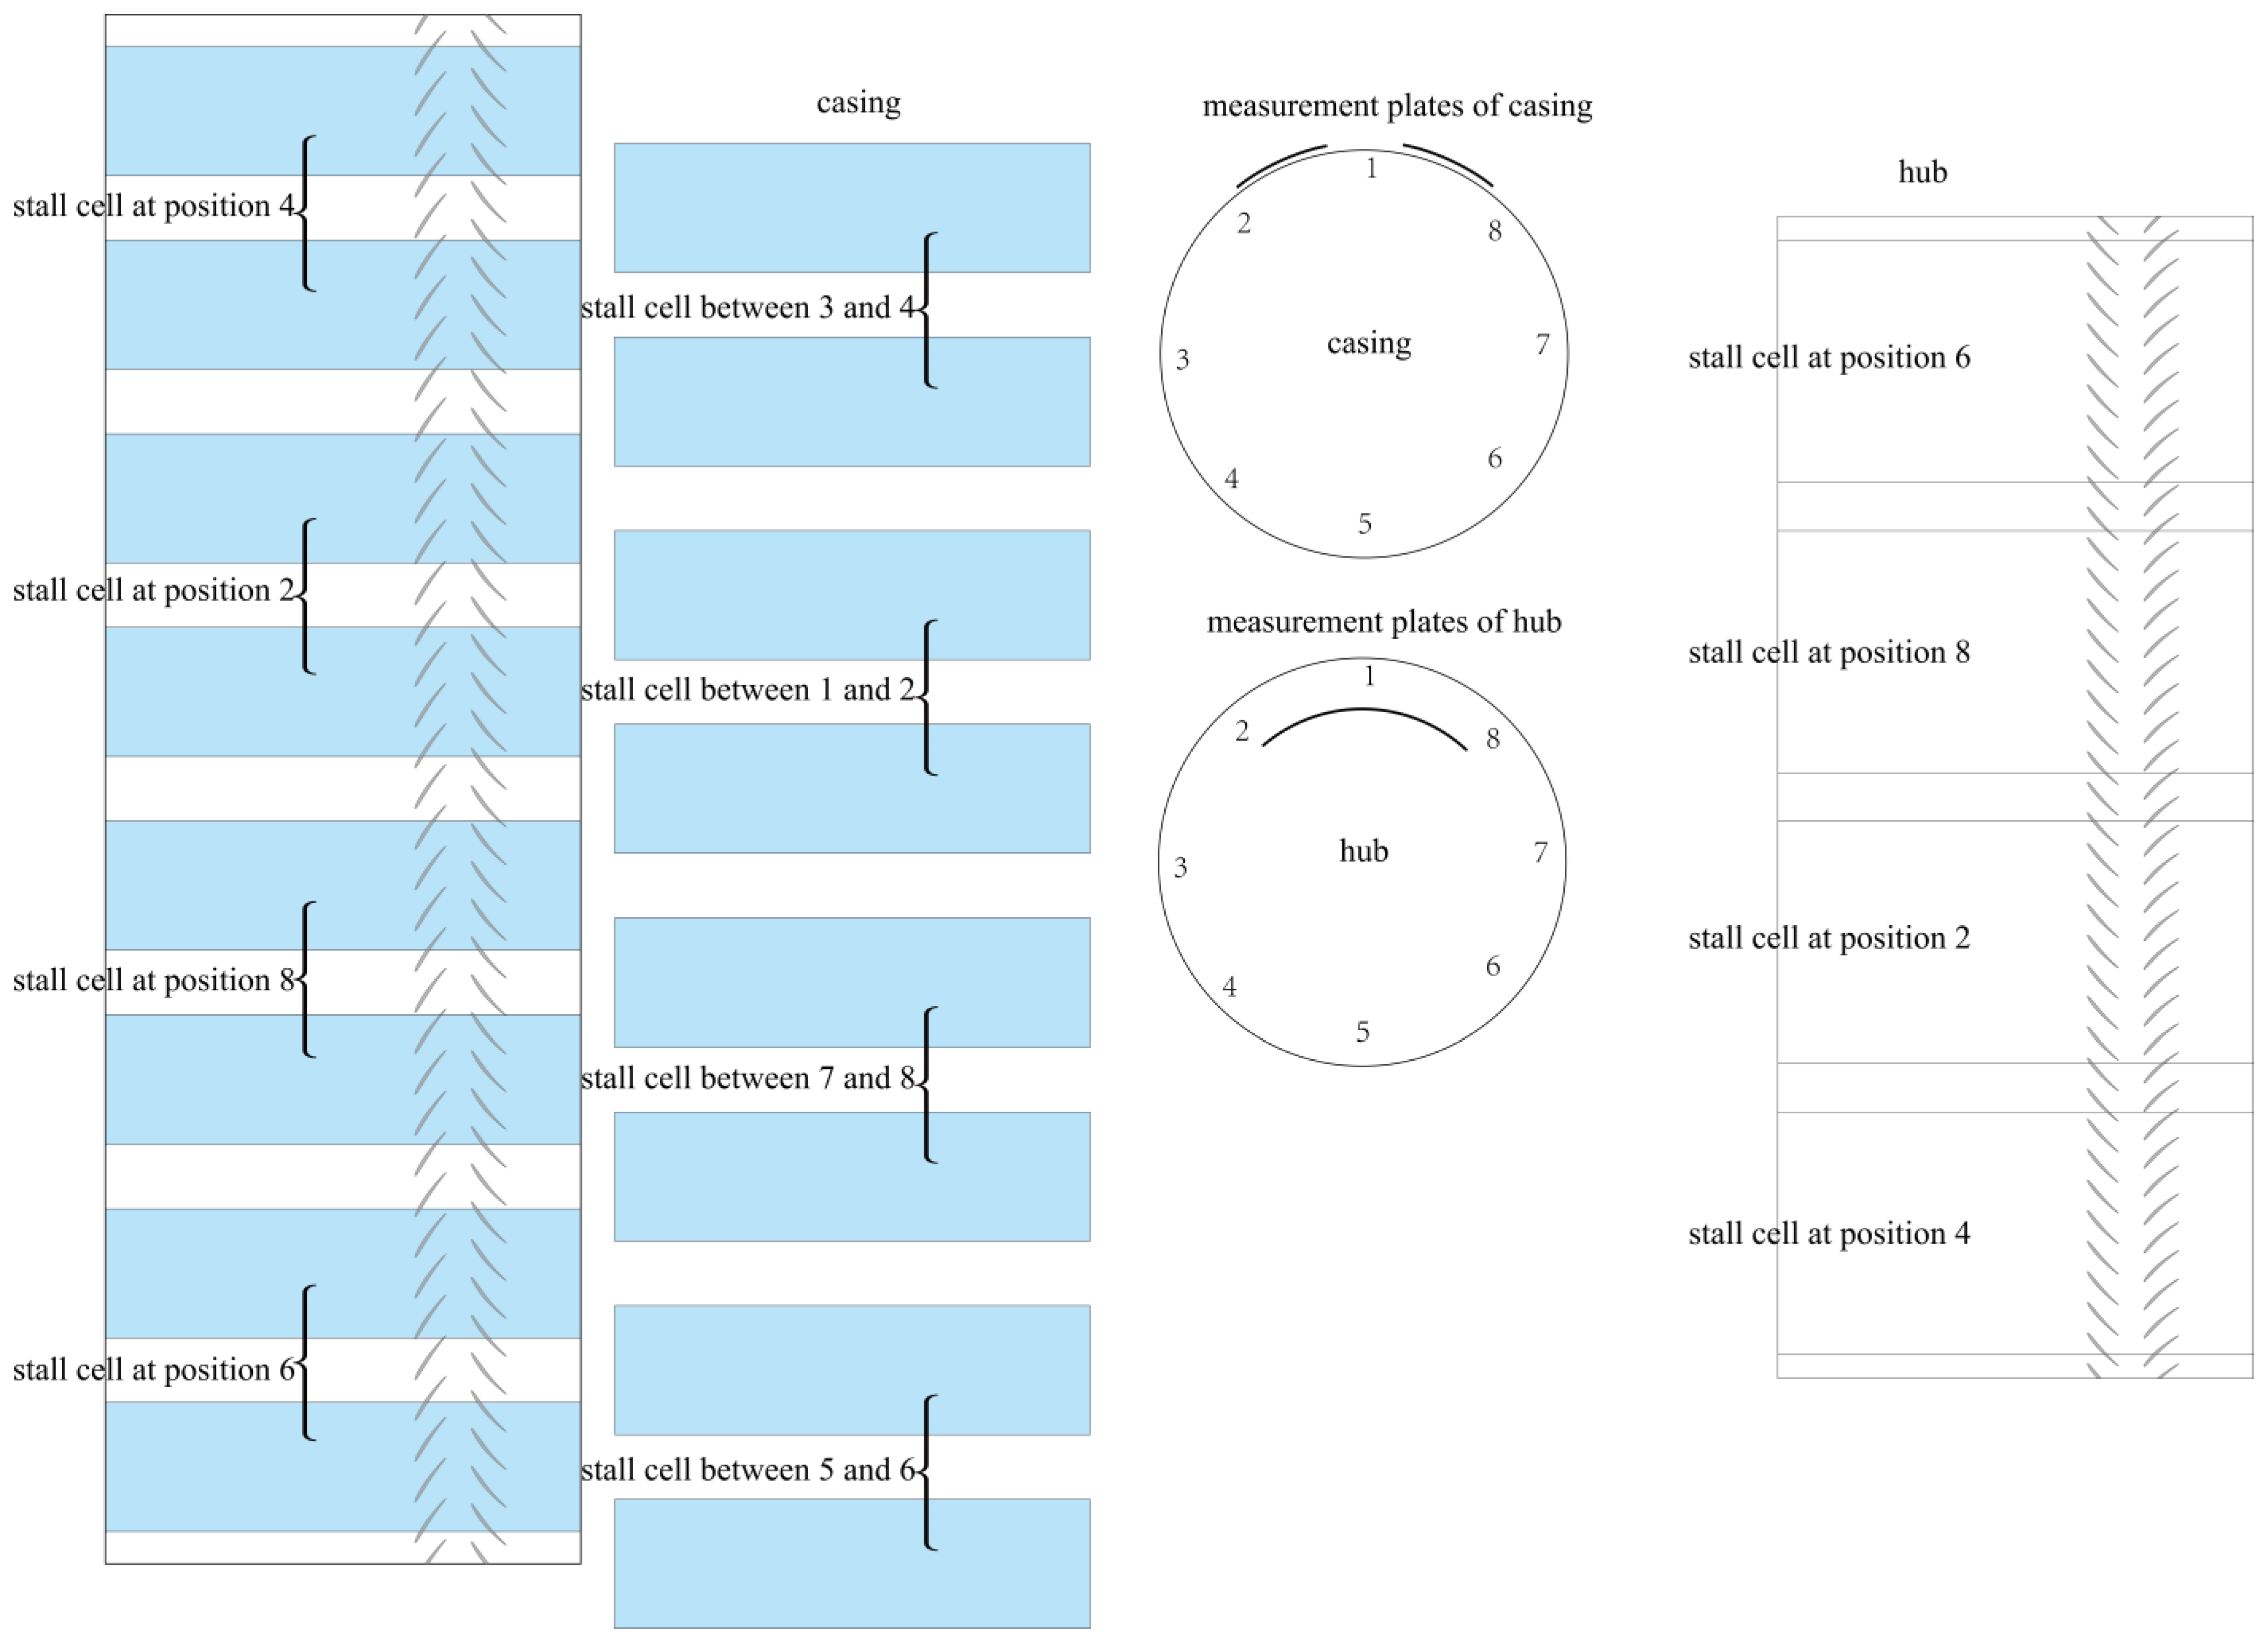
The circumferential distortion plate serves two primary functions: firstly, it ensures the stabilization of the stall cell at a specific circumferential position within the compressor stall flow field; secondly, it enables adjustment of both the circumferential position and phase of the stall cell. The relative position of the circumferential distortion plate and the stall cell is shown in Figure 7, which also demonstrates how circumferential distortion plates work. As the circumferential distortion plate rotates along its circumference, it functions like a “knob”, enabling the adjustment of the stall cell’s circumferential position. When the circumferential distortion plate is in position, the stall cell aligns with its position. Upon rotation of the circumferential distortion plate to position, the stall cell shifts to position. The relative phase and circumferential positions between the stall cell and the circumferential distortion plate remain essentially unchanged throughout this process. In the measurement, the stall cell is adjusted to the ideal position through the circumferential distortion plate, with the distortion plate and stall cell keeping static during the experiment. The IAI motor drives movement in the circumferential distortion plate with an angle adjustment accuracy of 0.1°, satisfying requirements for the precise regulation of the stall cell’s circumferential position.
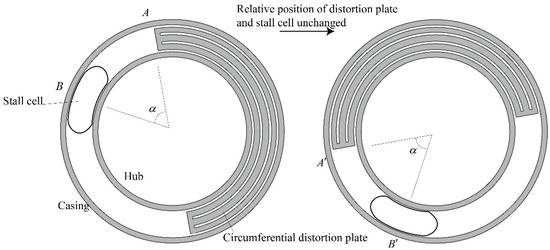
Figure 7.
Relative position of circumferential adjustment plate and stall cell.
The design speed of the first row of rotors in the low-speed counter-rotating compressor test rig is 1100 r/min, while the design speed of the second row of rotors is 1000 r/min. Both rows have equal chord lengths along their radial direction, measuring 54 mm each. To facilitate flow field measurement within rotor clearance, an intentionally enlarged axial clearance between both rows’ rotor blades was designed at approximately 46% relative to the blade chord length. Additionally, a tip clearance value for each rotor was set at 1.0 mm according to the design specifications. Following the C4 blade design principles, both rows’ rotor blades adopt a radial stacking configuration, with circular arcs forming their middle sections. Table 3 presents geometric angles for three span sections (blade angle relative to axial direction).
Table 3.
Blade angles of the blades.
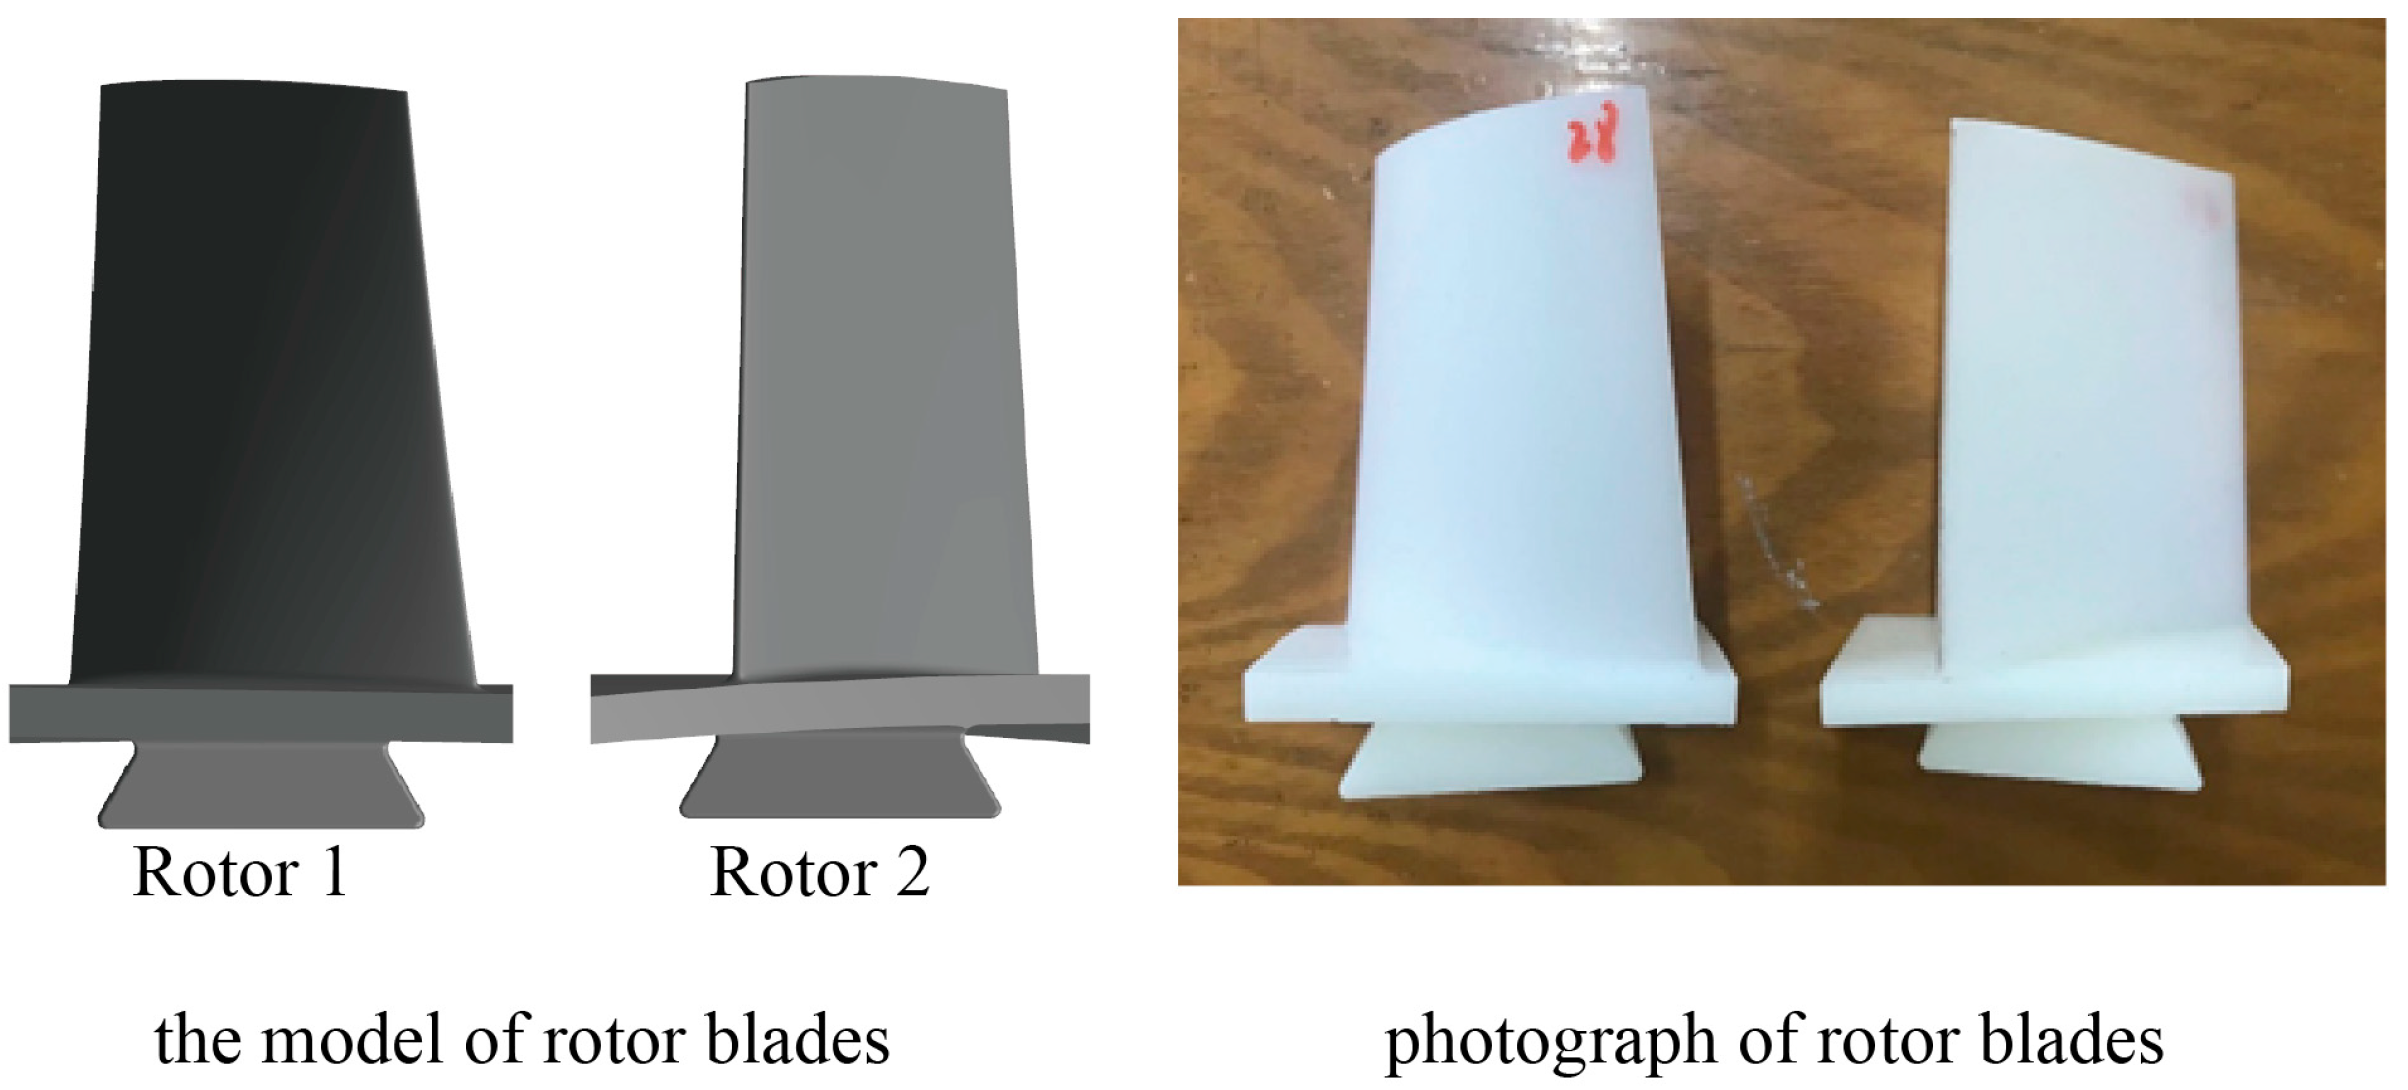
The approach of directly designing the blade with simple modeling was selected because the original purpose of building the experimental test rig was to measure the rotating stall flow fields. While the performance requirements for a typical compressor are not overly demanding, traditional modeling techniques already achieve good aerodynamic performance for conventional load compressors, such as the counter-rotating compressor. The blade design was carried out using commercial software Autoblade and examined using Fine of Numeca, while photosensitive resin was used to print the blades from a 3D printer. As shown in Figure 8, two rows of blades were installed on the hub of the two rotors with dovetail slots, which facilitates easy and quick redesign and replacement.
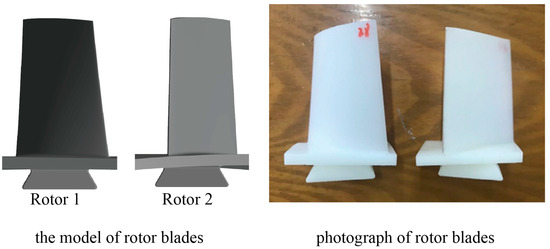
Figure 8.
The model and photograph of rotor blades.
The test rig is specifically designed for measuring the flow field of a rotating stall. In addition to immobilizing the stall cell, the test rig possesses the following characteristics: The two blade rows are driven by two specially designed wheel hub motors which have the same technical parameters, as shown in Figure 9a,b. The axial position of them is shown in Figure 5. The utilization of these motors enables a shafting-free design, which increases the internal space within the hub and enables measurements from its wall.
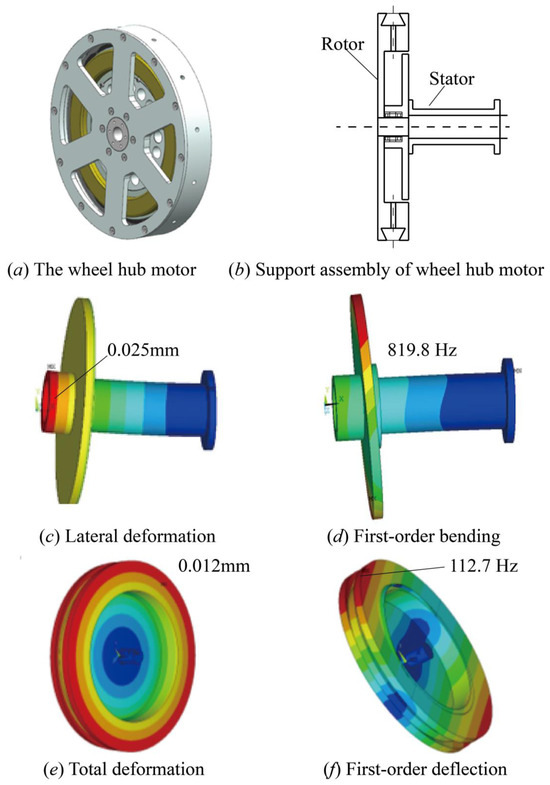
Figure 9.
Finite element analysis on rotor components of wheel hub motor.
Finite element analysis was conducted on the stiffness of support structures, vibration characteristics, and deformation tendencies of the entire rotor component (results depicted in Figure 9). Table 4 provides detailed calculation results from finite element analysis, revealing that the maximum speed frequency of the rotor stands at 33.3 Hz, which is significantly lower than any support mode frequency, indicating no risk of support vibration. Moreover, axial deformation is considerably smaller than the gap between the two rotors (0.5 mm), suggesting no risk of wheel rub on the rotor; similarly, given minimal radial deformation, there is no risk of radial blade scratching.
Table 4.
Calculation results of finite element analysis.
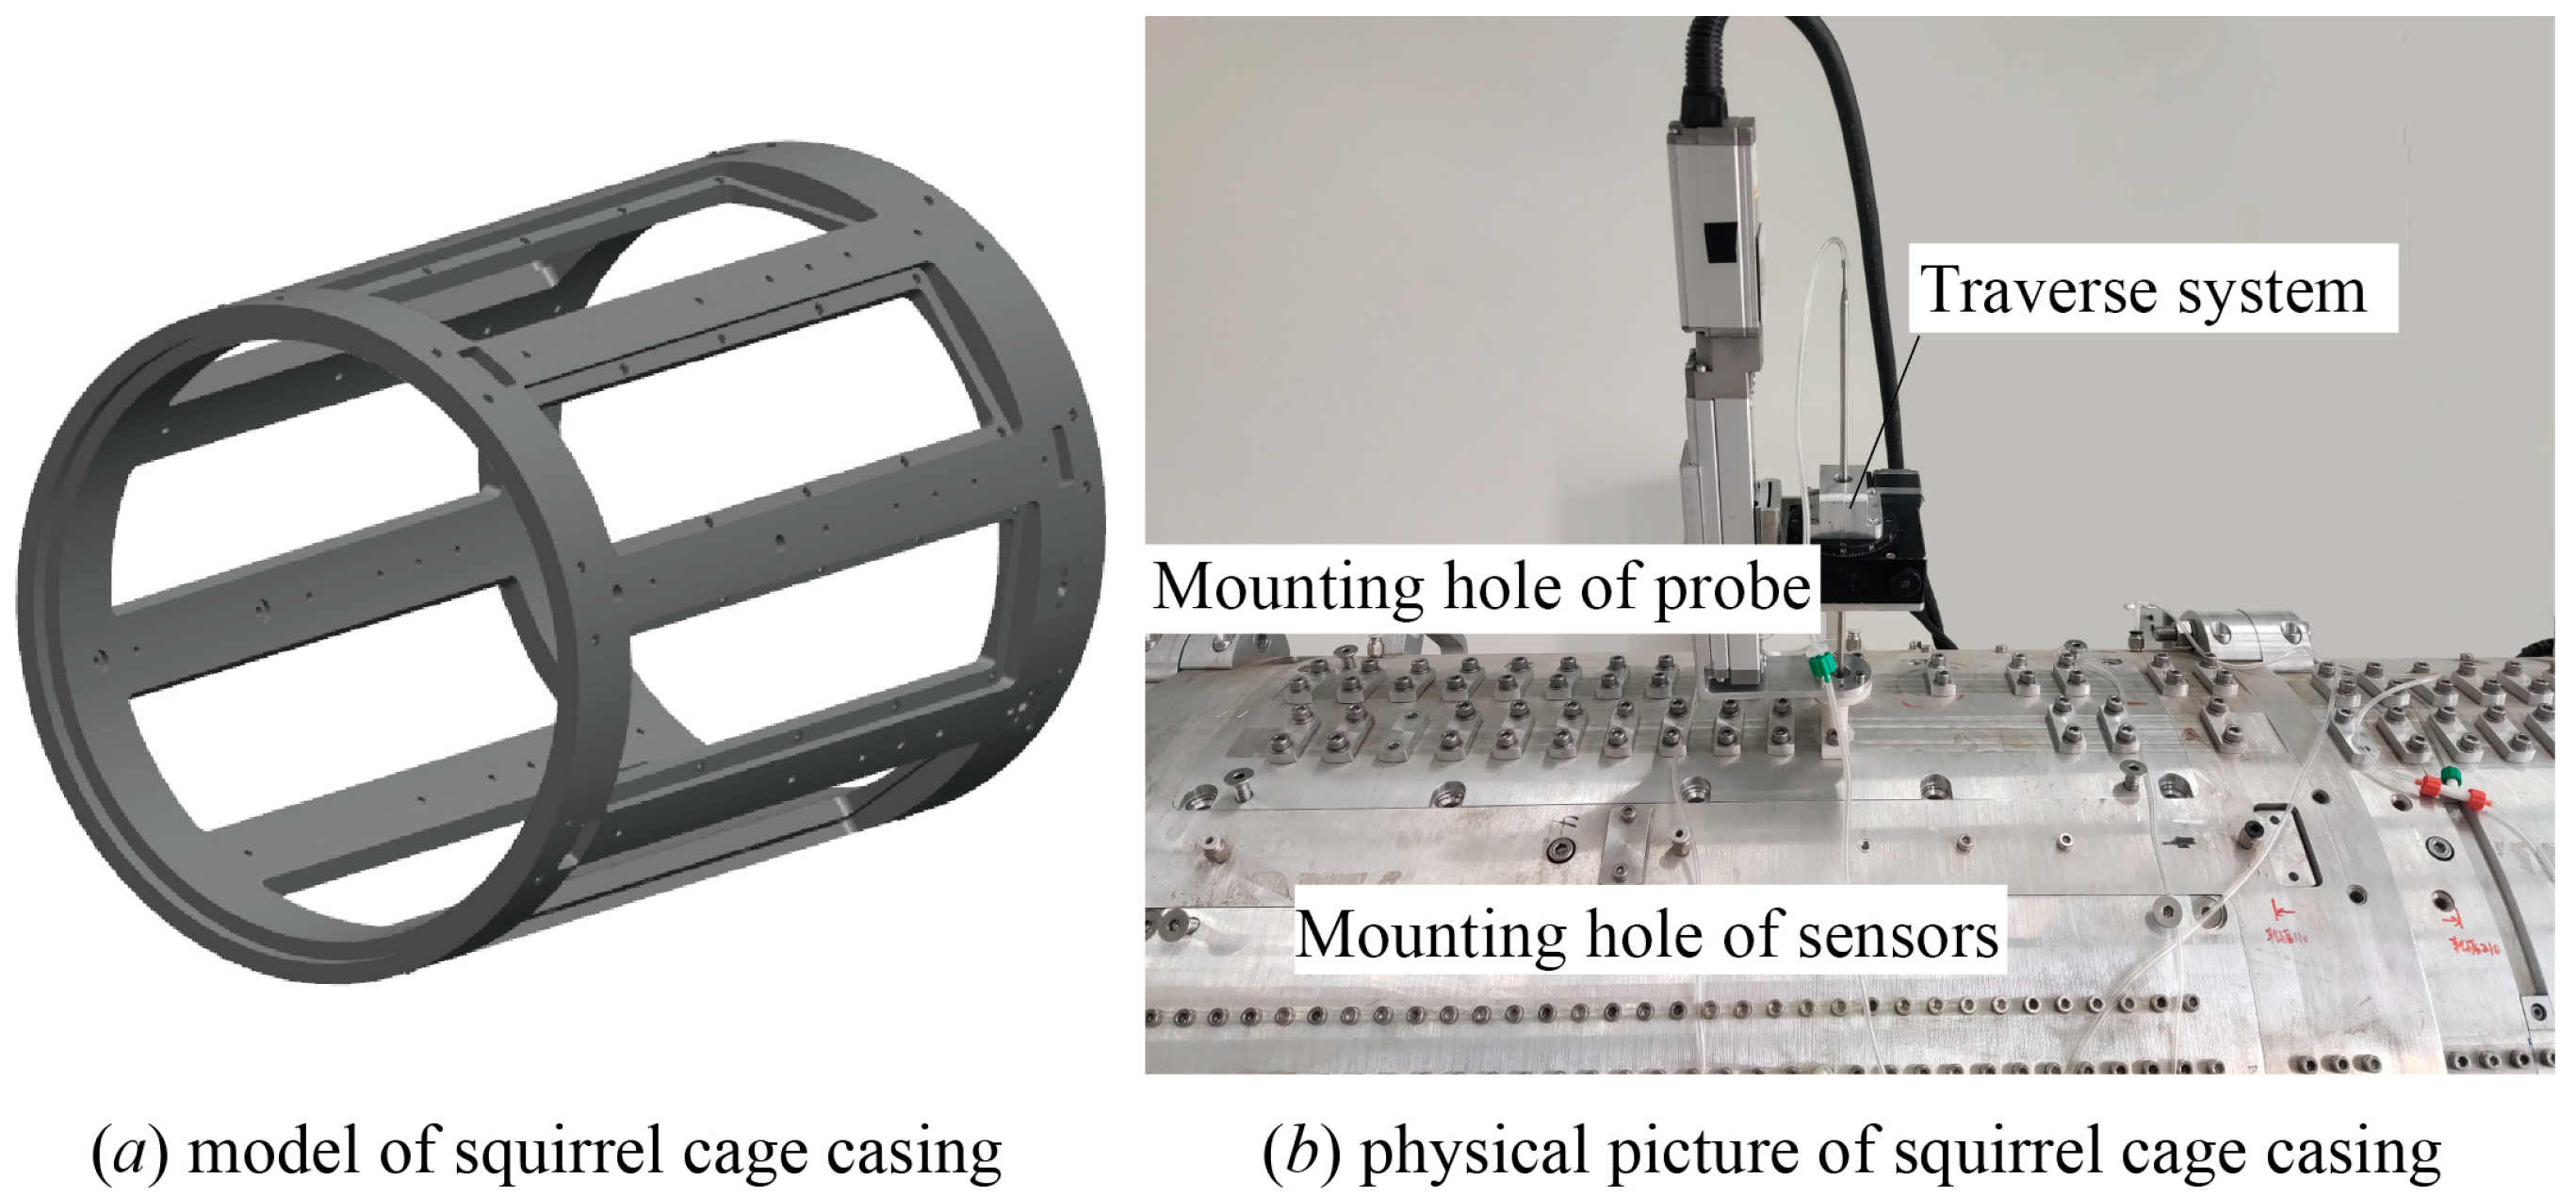
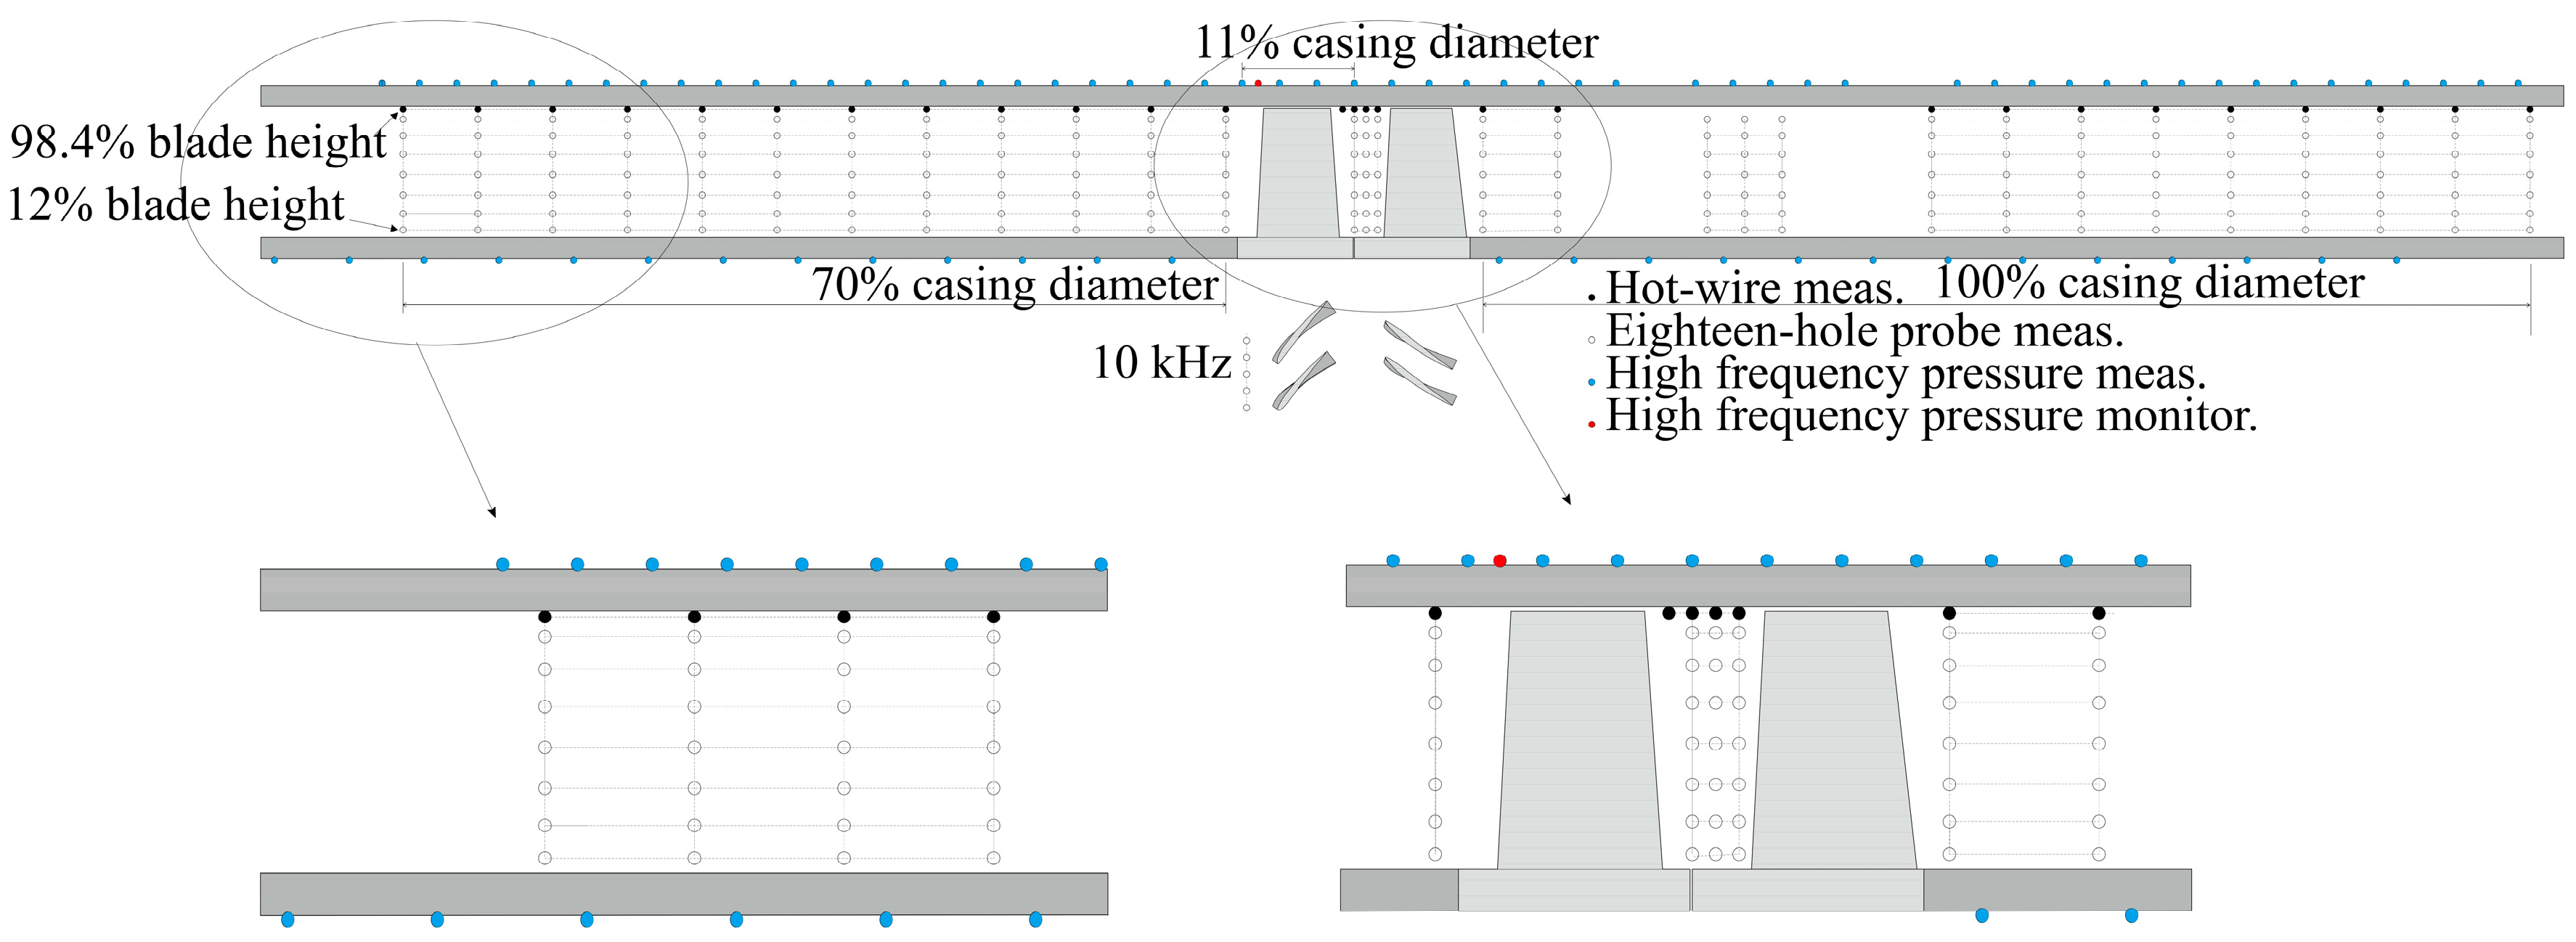
The test rig appropriately extends the axial dimension of the measurement section to capture comprehensive flow information of the stall cell, as illustrated in Figure 10, due to its substantial scale and significant influence on the upstream region of the rotor. The overall length of the entire measurement section amounts to 1046 mm. The measurement section was designed based on the squirrel cage type, with eight windows covered by measurement plates, facilitating various types of measurement techniques.
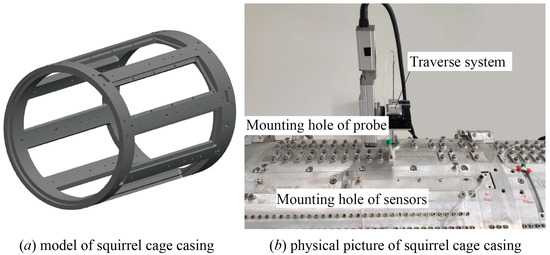
Figure 10.
Model and photograph of squirrel cage casing.
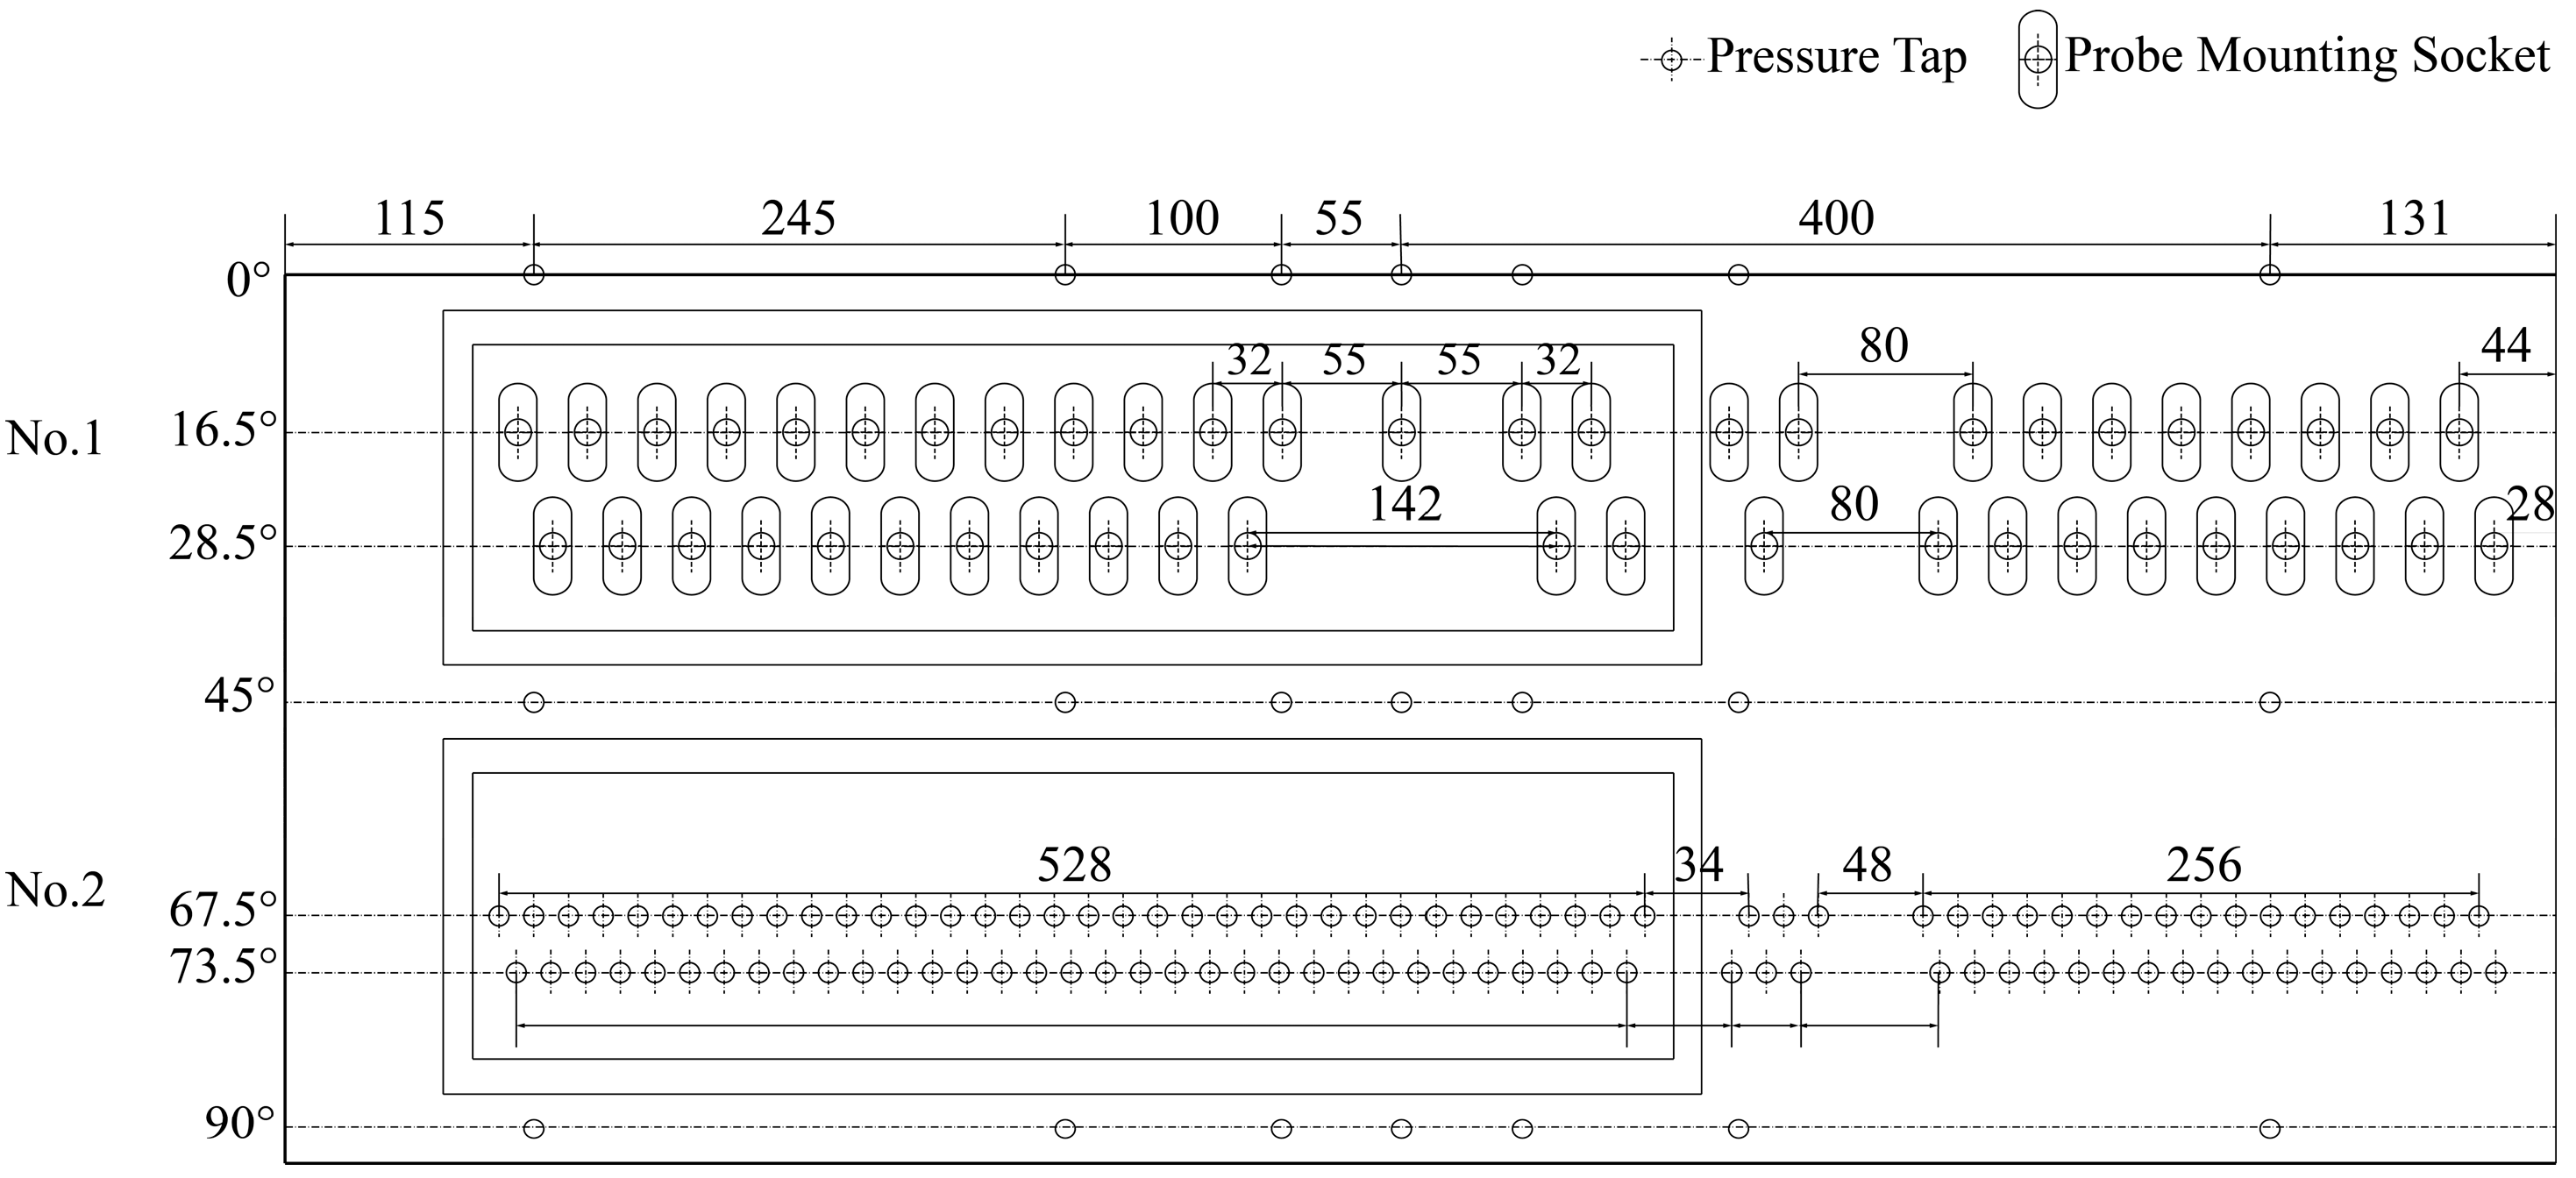
The window and casing in Figure 10 are equipped with static pressure holes and probe mounting holes, facilitating steady-state and dynamic wall pressure measurements, probe installation, and displacement, as well as visual measurement techniques such as oil flow visualization and PIV. Furthermore, the hole distribution diagram of the measuring casing is presented in Figure 11, while Figure 12 illustrates the radial distribution scheme for experimental measurements in preparation for further research.
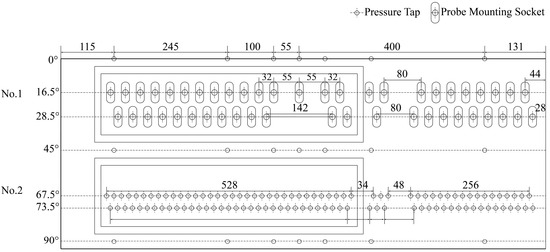
Figure 11.
The main hole distribution diagram of the measuring casing.
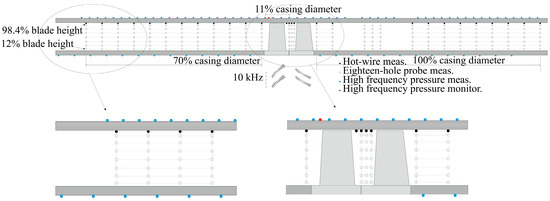
Figure 12.
The radial distribution scheme for experimental measurements.
3. Characteristics of the Compressor and Immobilization of the Stall Cell
3.1. Characteristics of the Compressor
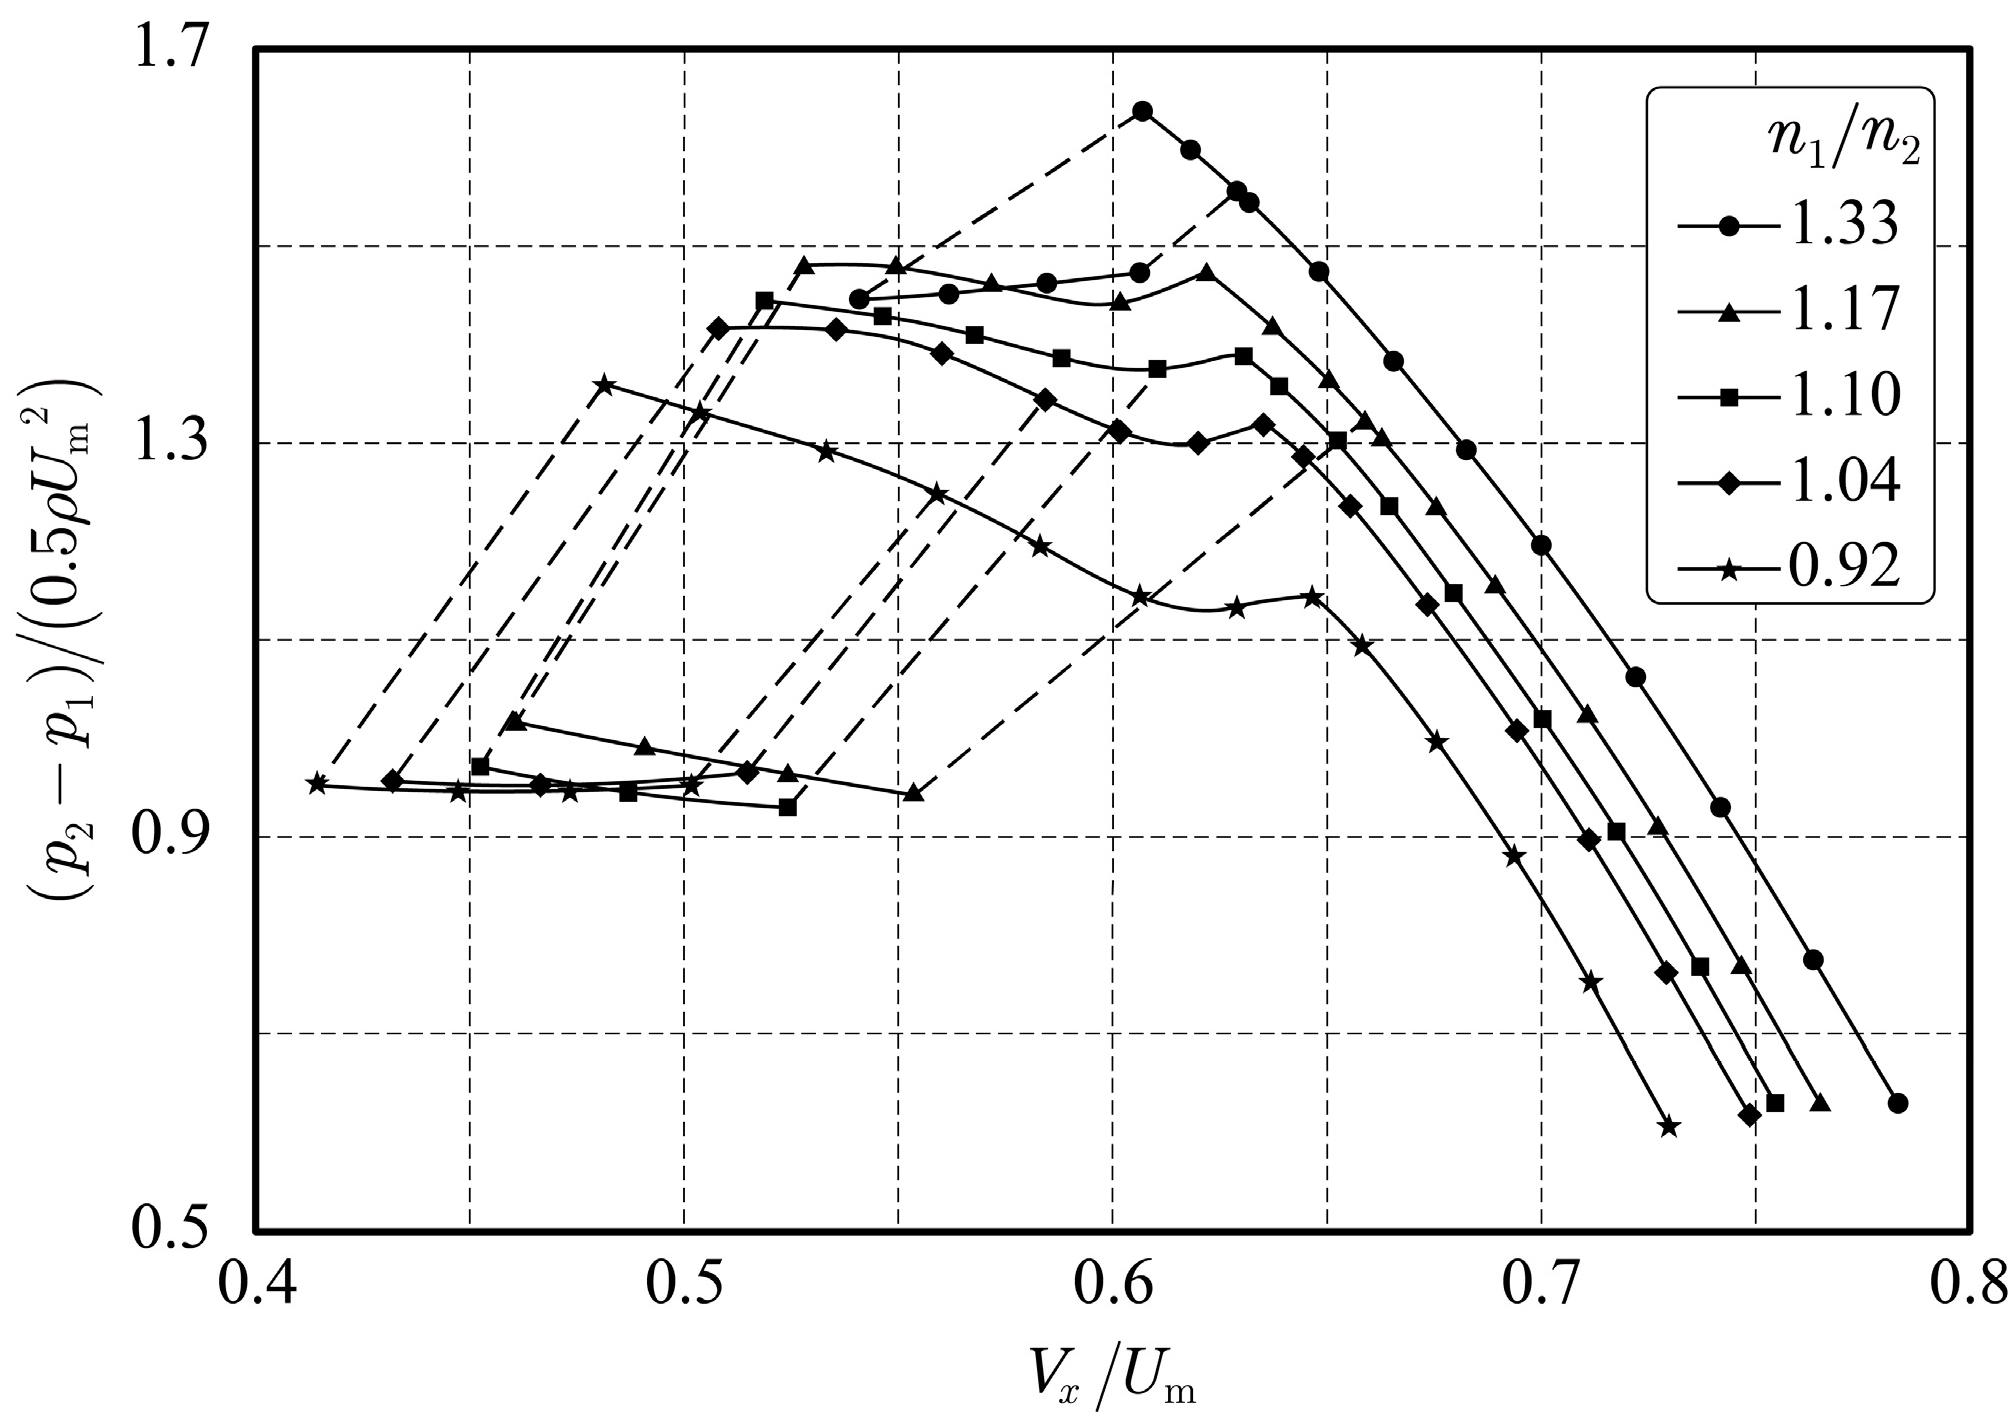
All the quantitative data were derived from pressure signals acquired by Rosemount Corporation’s Model 3051S pressure transducers. These transducers ensure a total error of ±0.025% at full scale, introducing an absolute error of ±3 Pa within their full pressure range of ±6.22 kPa. The compressor’s characteristics were measured at three nominal rotating speeds and various rotating speed ratios. The average speed of the two rotors was used as the nominal rotating speed and for nondimensionalizing the rotating speeds. Figure 13 illustrates the characteristic curves, with the flow coefficient on the abscissa and the pressure rise coefficient on the ordinate axis, encompassing both un-stalled and stalled states. Different types of stalls were observed for different rotating speed ratios: decreasing rotor speed ratio advanced stall onset, widened hysteresis ring, and reduced post-stall pressure rise coefficient. At a speed ratio of 1.33, an abrupt stall occurred with a high post-stall pressure rise but a small hysteresis ring. Below a speed ratio of 1.17, the secondary stall was characterized by a progressive first stall followed by an abrupt secondary stall with a small post-stall pressure rise and an increased hysteresis ring size. This paper primarily focuses on the deep stall status (as depicted in Figure 14). The stall cell in this study looked to be stationary at a speed ratio close to 5:3, but it was still rotating slowly, suggesting that other speed ratios had been tried.

Figure 13.
Characteristic curves of the compressor at different speed ratios.
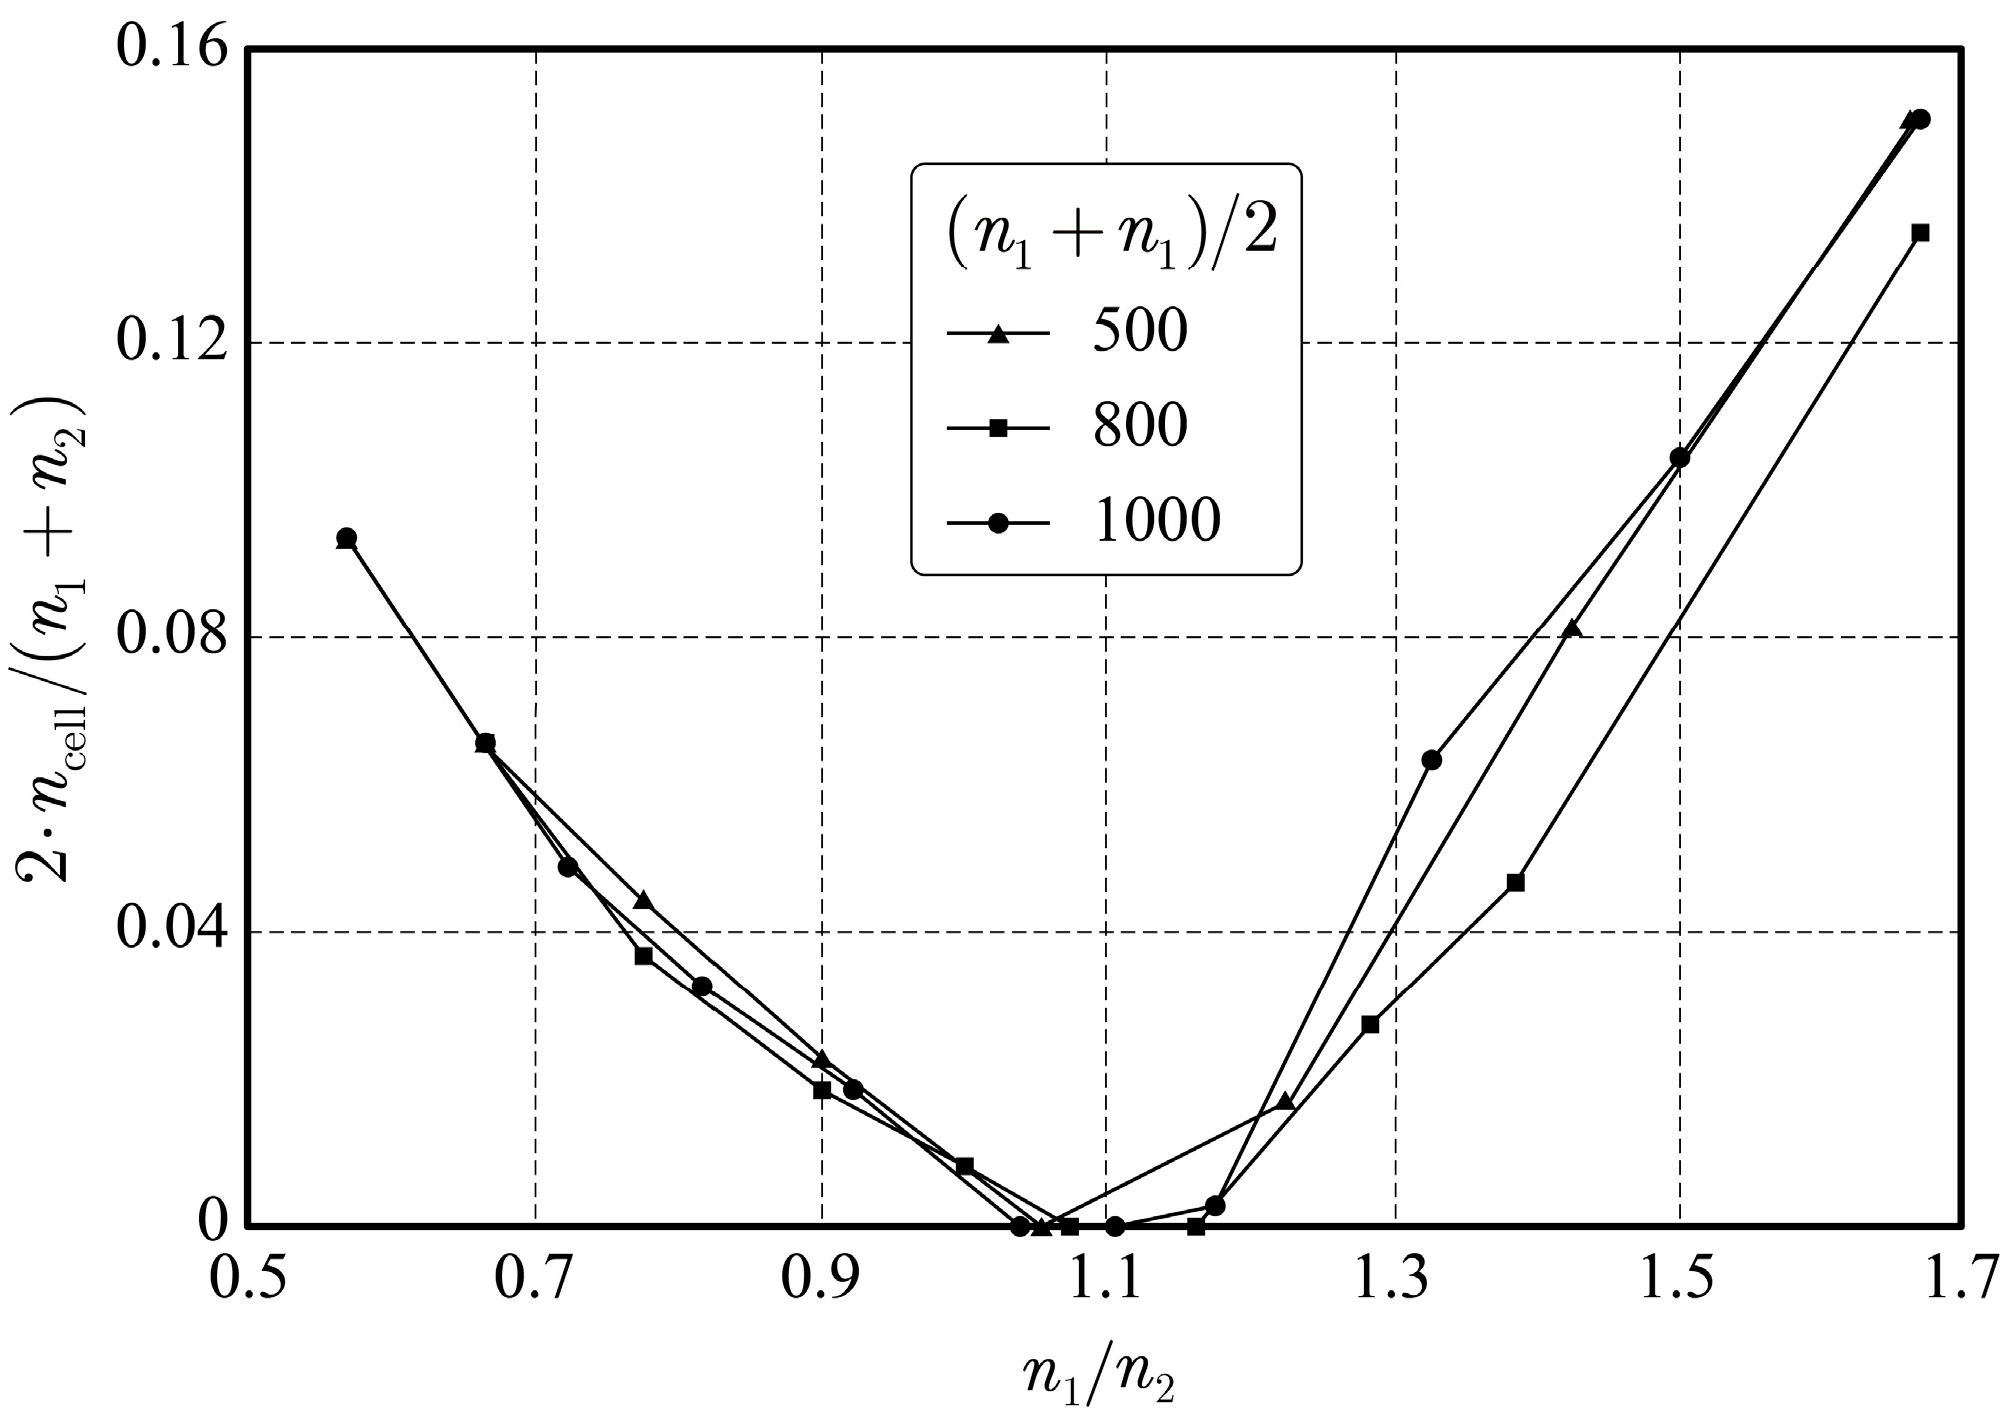
Figure 14.
Cell rotating speed versus rotating speed ratio of the two rotors.
A fast-response pressure transducer was installed at the front of the first rotor to detect the rotating speed of the stall cell. The transducer, manufactured by All Sensors Corporation, has a full scale of ±10 inch H2O (or 2.49 kPa) and a maximum error of ±0.5% at full scale. Figure 14 illustrates the variation in the cell rotating speed versus the rotating speed ratios, indicating that the stall cell was immobilized at a rotating speed ratio close to 1.1, which confirms our hypothesis that an appropriate speed ratio between two rows can keep it stationary. However, this value is inconsistent with its designed one (5:3 or 1.67), suggesting that its actual rotating speed ratio with respect to the first rotor is 47.6% rather than 37.5%. This observation indicates that the rotor and stator exert distinct influences on the rotation speed of the stall cell. Remarkably, the rotor exhibits a more pronounced impact on the stall cell’s rotation speed than the stator. Consequently, it becomes imperative to relatively augment the rear rotor’s speed in order to effectively “drag” the stall cell, which tends to rotate in closer synchronization with the front rotor.
3.2. Immobilization of the Stall Cell
Due to strong three-dimensional characteristics and unsteadiness in stall flow field analysis, quantitatively analyzing the relative influences on rotational speeds between rotors and stators while immobilizing cells in specific circumferential positions is challenging; therefore, obtaining a stall cell without a designated location under a specified rotation rate such as 5:3 is common practice for researchers seeking greater accuracy when designing second rotor blades based on revised specifications for both rotors’ respective speeds. A revised design of the second rotor blades was carried out with rotating speeds for the first and second rotors of 1100 r/min and 1000 r/min, respectively. Notably, for designing the second row of rotor blades, their shape was determined based on calculations involving velocity triangles after determining rotation speed.
After the second round of revised designs, the design speed of the two rows of rotors was adjusted, and the modified blades were installed and tested, successfully immobilizing the stall cell in a circumferential position. As a result, both designs effectively stabilize the stall cell when operating at comparable speed ratios. However, due to its closer proximity to the design value, the second design enables more precise functioning of the compressor resembling that of a typical compressor. It is worth noting that immobilization of the stall cell at a speed ratio of 1.2 was achieved, which did not exhibit any significant deviation from the original design speed ratio of 1.1. As depicted in Figure 15, no substantial disparities were observed in the characteristic curves of the compressor between the speed ratios of 1.1 and 1.2. Therefore, fine-tuning solely reduces the rotational velocity to zero for stall cells without altering their form or affecting the structural aspects within stalled flow fields; hence, further optimization designs were not pursued. As shown in Figure 15, the new test rig and compressor shown in Figure 1 present different characteristic curves [17] for the stable flow regime (mainly for the pressure coefficient). However, in this case, it is important to consider the region of unstable operation of the machine. Even if the two compressors operate in the same flow rate range and the onset into the stall is always sudden, the point of recovery from the stall is substantially different, and this indicates a different evolution of the stall cell in the two machines.
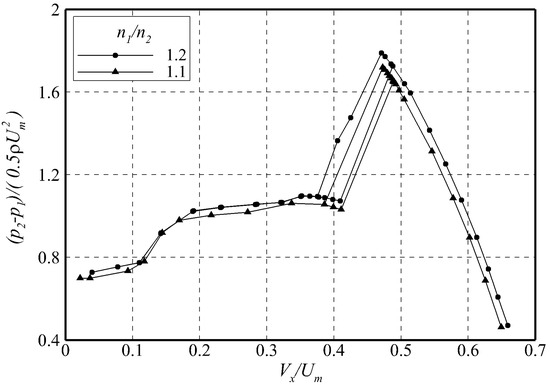
Figure 15.
Characteristic curves of the compressor at the speed ratio of 1.1 and 1.2.
To determine the location of the stationary stall cell, pressures were measured at eight evenly distributed pressure ports around the casing in front of the first rotor using Model 3051S pressure transducers. Figure 16 illustrates the distribution of these eight pressures along the circumference. It is known that higher pressure exists inside the stall cell towards the front of the rotor. The analysis revealed that the stall cell was situated at an approximately 40% circumferential scale from its starting point on the top-left side of the compressor’s circle. The circumferential position of this stall cell can be adjusted by implementing a distortion mesh at the compressor outlet (as depicted in Figure 6). Consequently, oil flow visualization technology and stationary probes mounted within the casing enable detailed measurements and the examination of flow structures within this stall cell.
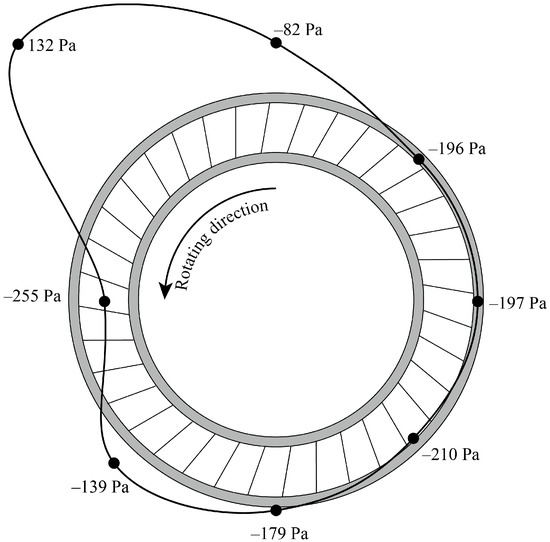
Figure 16.
Pressures of the eight pressure ports evenly distributed around the casing.
The implementation of counter-rotation does yield comparable speeds; nevertheless, there are discrepancies in flow conditions due to differing blade designs between the counter-rotating compressor and its prototype counterpart. However, prior research [7,9,15] has shown that blade-induced fluctuations are considerably milder than those observed within un-stalled regions of a stall cell. Moreover, based on the flow field analysis, it is clear that a significant vortex exists in both pressure pulsation and velocity distribution for the entire stall cell, while blade-induced small vortices are relatively insignificant. This implies a relatively lesser significance for blades operating within such stall areas. As a result, these disparities do not lead to substantial distinctions between stall cell structures in both compressors and can be effectively addressed.
4. Example Measurements of the Near-Wall Flow Field in the Stall Cell
As the circumferential position of the stall cell can be adjusted using a distortion mesh at the outlet of the compressor, the whole flow structure can be achieved using this partitioning idea. The compressor characteristics indicate that the pressure rise coefficient and flow coefficient of the stall flow field generated after installing the distortion plate are identical to those without installation, thus suggesting a preliminary inference that simulates an equivalent stall cell.
The oil flow visualization measurement technique was employed in this study to illustrate the near-wall flow field within the stall cell. The schematic diagram of the oil flow visualization measurement setup is presented in Figure 17. To minimize the influence of gravity, the measuring plane for oil flow visualization on the casing consisted of two plates positioned directly above it (as depicted in Figure 17). Additionally, matte wallpaper was applied to the corresponding hub wall to visualize the oil flow in the hub region. Following each measurement, adjustments were made to the circumferential position of the stall cell using a distortion mesh until all circumferential positions were covered.
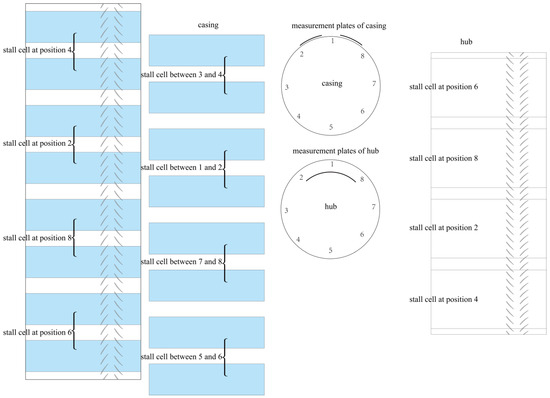
Figure 17.
The scheme of oil flow visualization measurement.
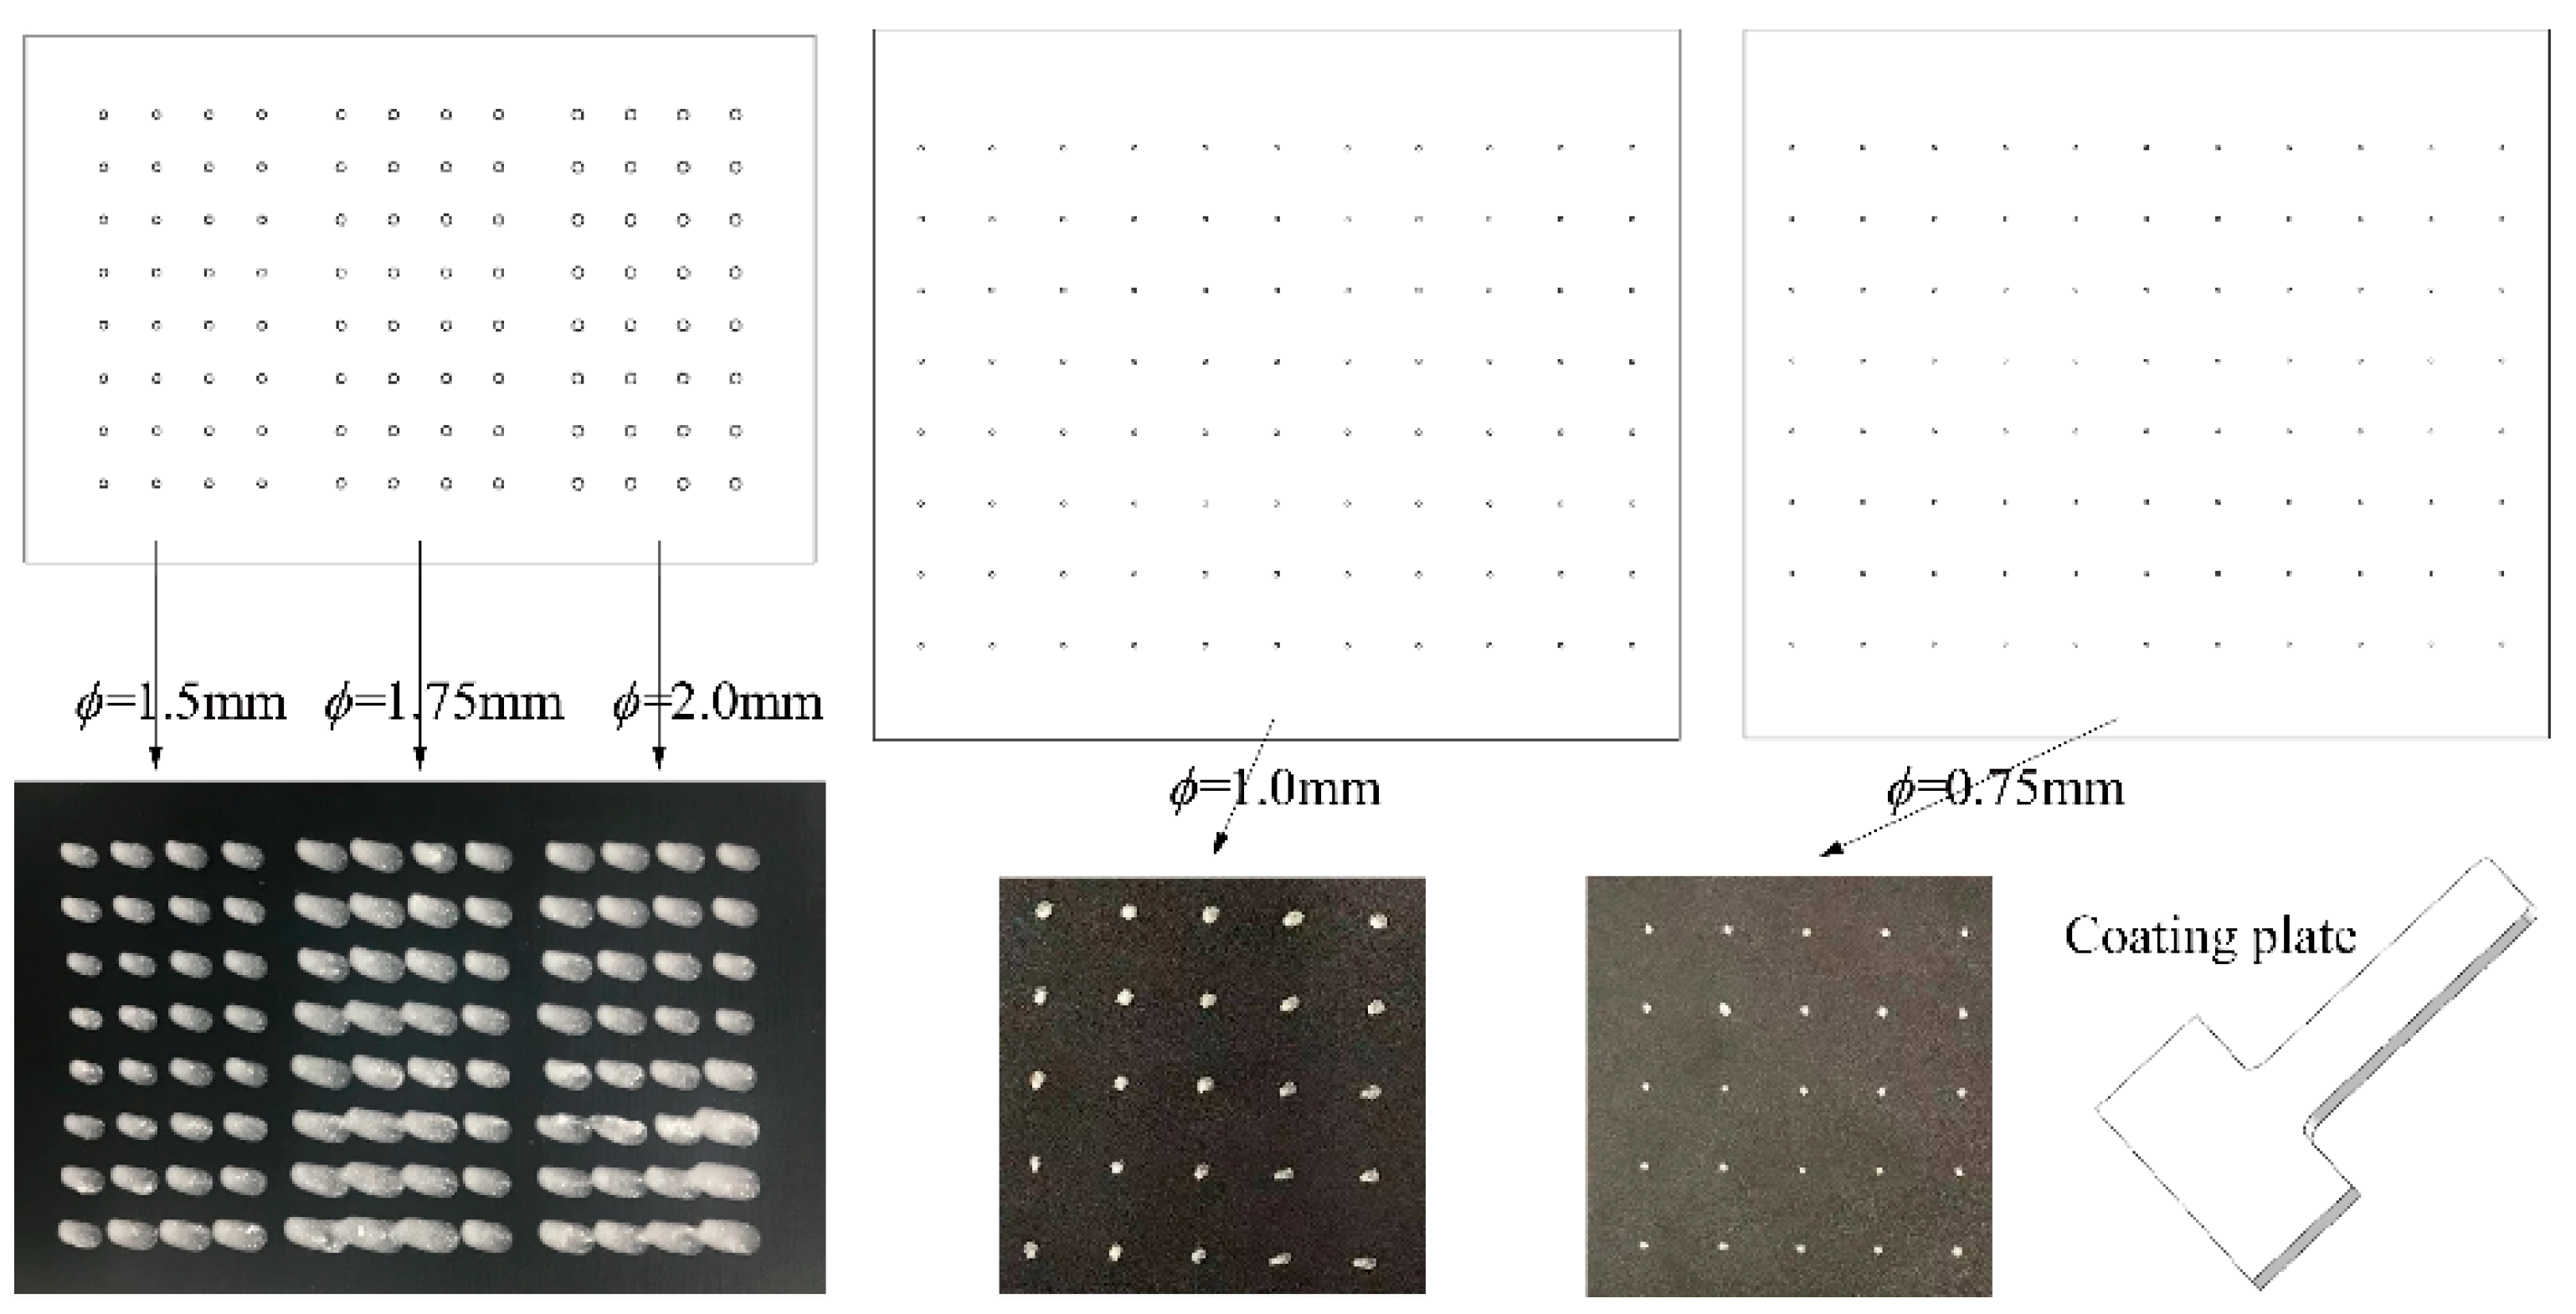
The oil flow coating formula ratio (volume ratio) is shown in Table 5, and the preparation of oil flow visualization is shown in Figure 18. The criterion for choosing the oil ratio is to achieve a ratio that prevents easy detachment of the oil flow coating by fluid and maintains sensitivity to slow airflow. The prepared coating was evenly applied on the inner wall of the casing; the interval of oil flow coating points was approximately 1.5 cm, and the oil flow coating points were approximately equal in size. Therefore, a set of oil flow coating plates was designed to achieve rapid coating of the casing. The design scheme and optimization process of the coating plate and scraper are shown in Figure 19. The coating plate was made of 1 mm thick plexiglass plates, and five kinds of apertures were designed. The experiment revealed that the coating plate with an aperture size of 1mm exhibited optimal efficacy.
Table 5.
Paint formulation of oil flow visualization.
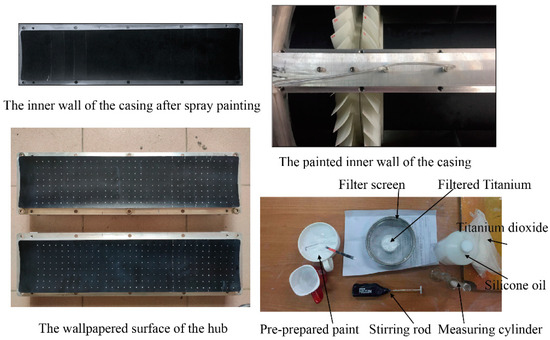
Figure 18.
The preparation of oil flow visualization.

Figure 19.
Design and optimization of oil flow coating plates.
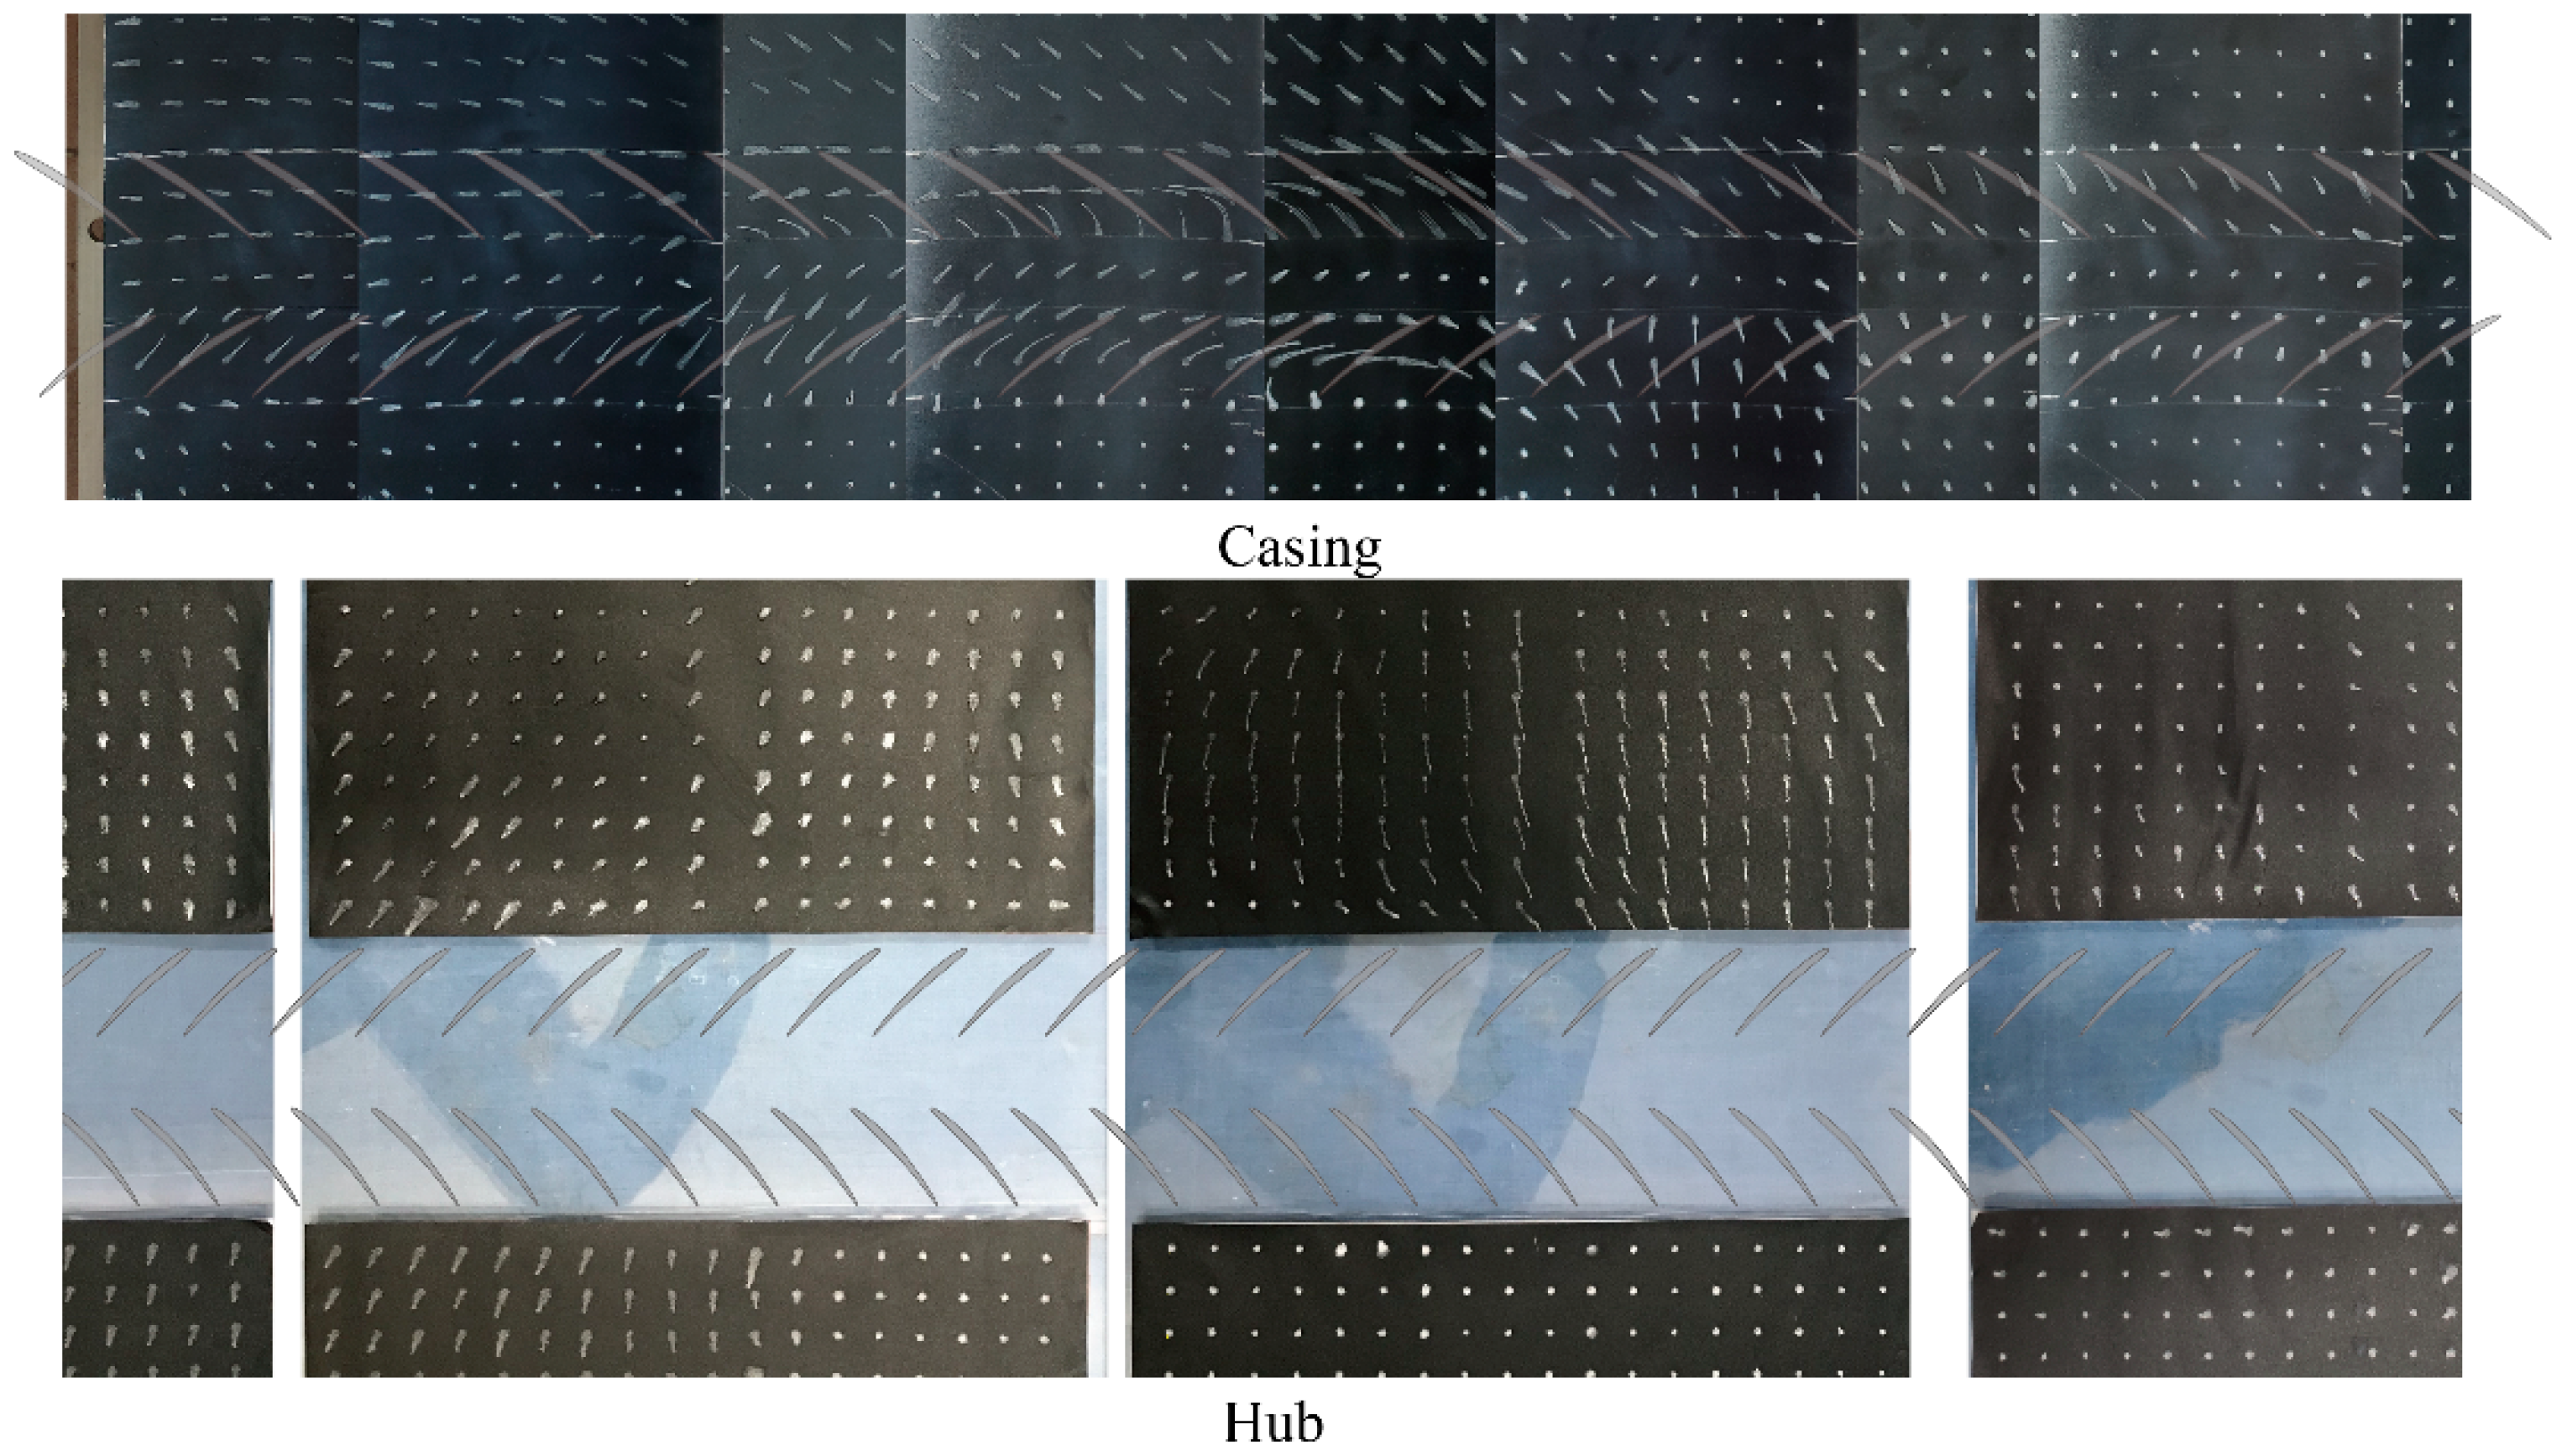
The measured image photos are stitched into a complete oil flow map, as shown in Figure 20. The test procedures for the oil flow visualization measurement of the hub are basically the same as those for the casing. The difference is that oil flow coating points are not painted on the inner wall of the measurement plates, but they are painted on the black matte self-adhesive wallpaper, which is then pasted onto the hub of the test rig. After the test, the wallpaper was removed, and a photo was taken, as shown in Figure 20.

Figure 20.
The measured image photos and complete oil flow map.
Since the measurement of oil flow visualization of the hub is carried out by the black matte self-adhesive wallpaper, it is not restricted by the circumferential size of the window or affected by the squirrel-cage structure casing beam, and a complete oil flow map can be obtained after four experiments.
In the traditional oil flow visualization measurement technique, obtaining a good-quality, complete image photo indicates the test’s success. Building upon this foundation, the present study conducted further research. In this paper, a processing method was developed to obtain the two-dimensional velocity vector and limit the streamline of the flow field from the image measured using the oil flow visualization measurement technique.
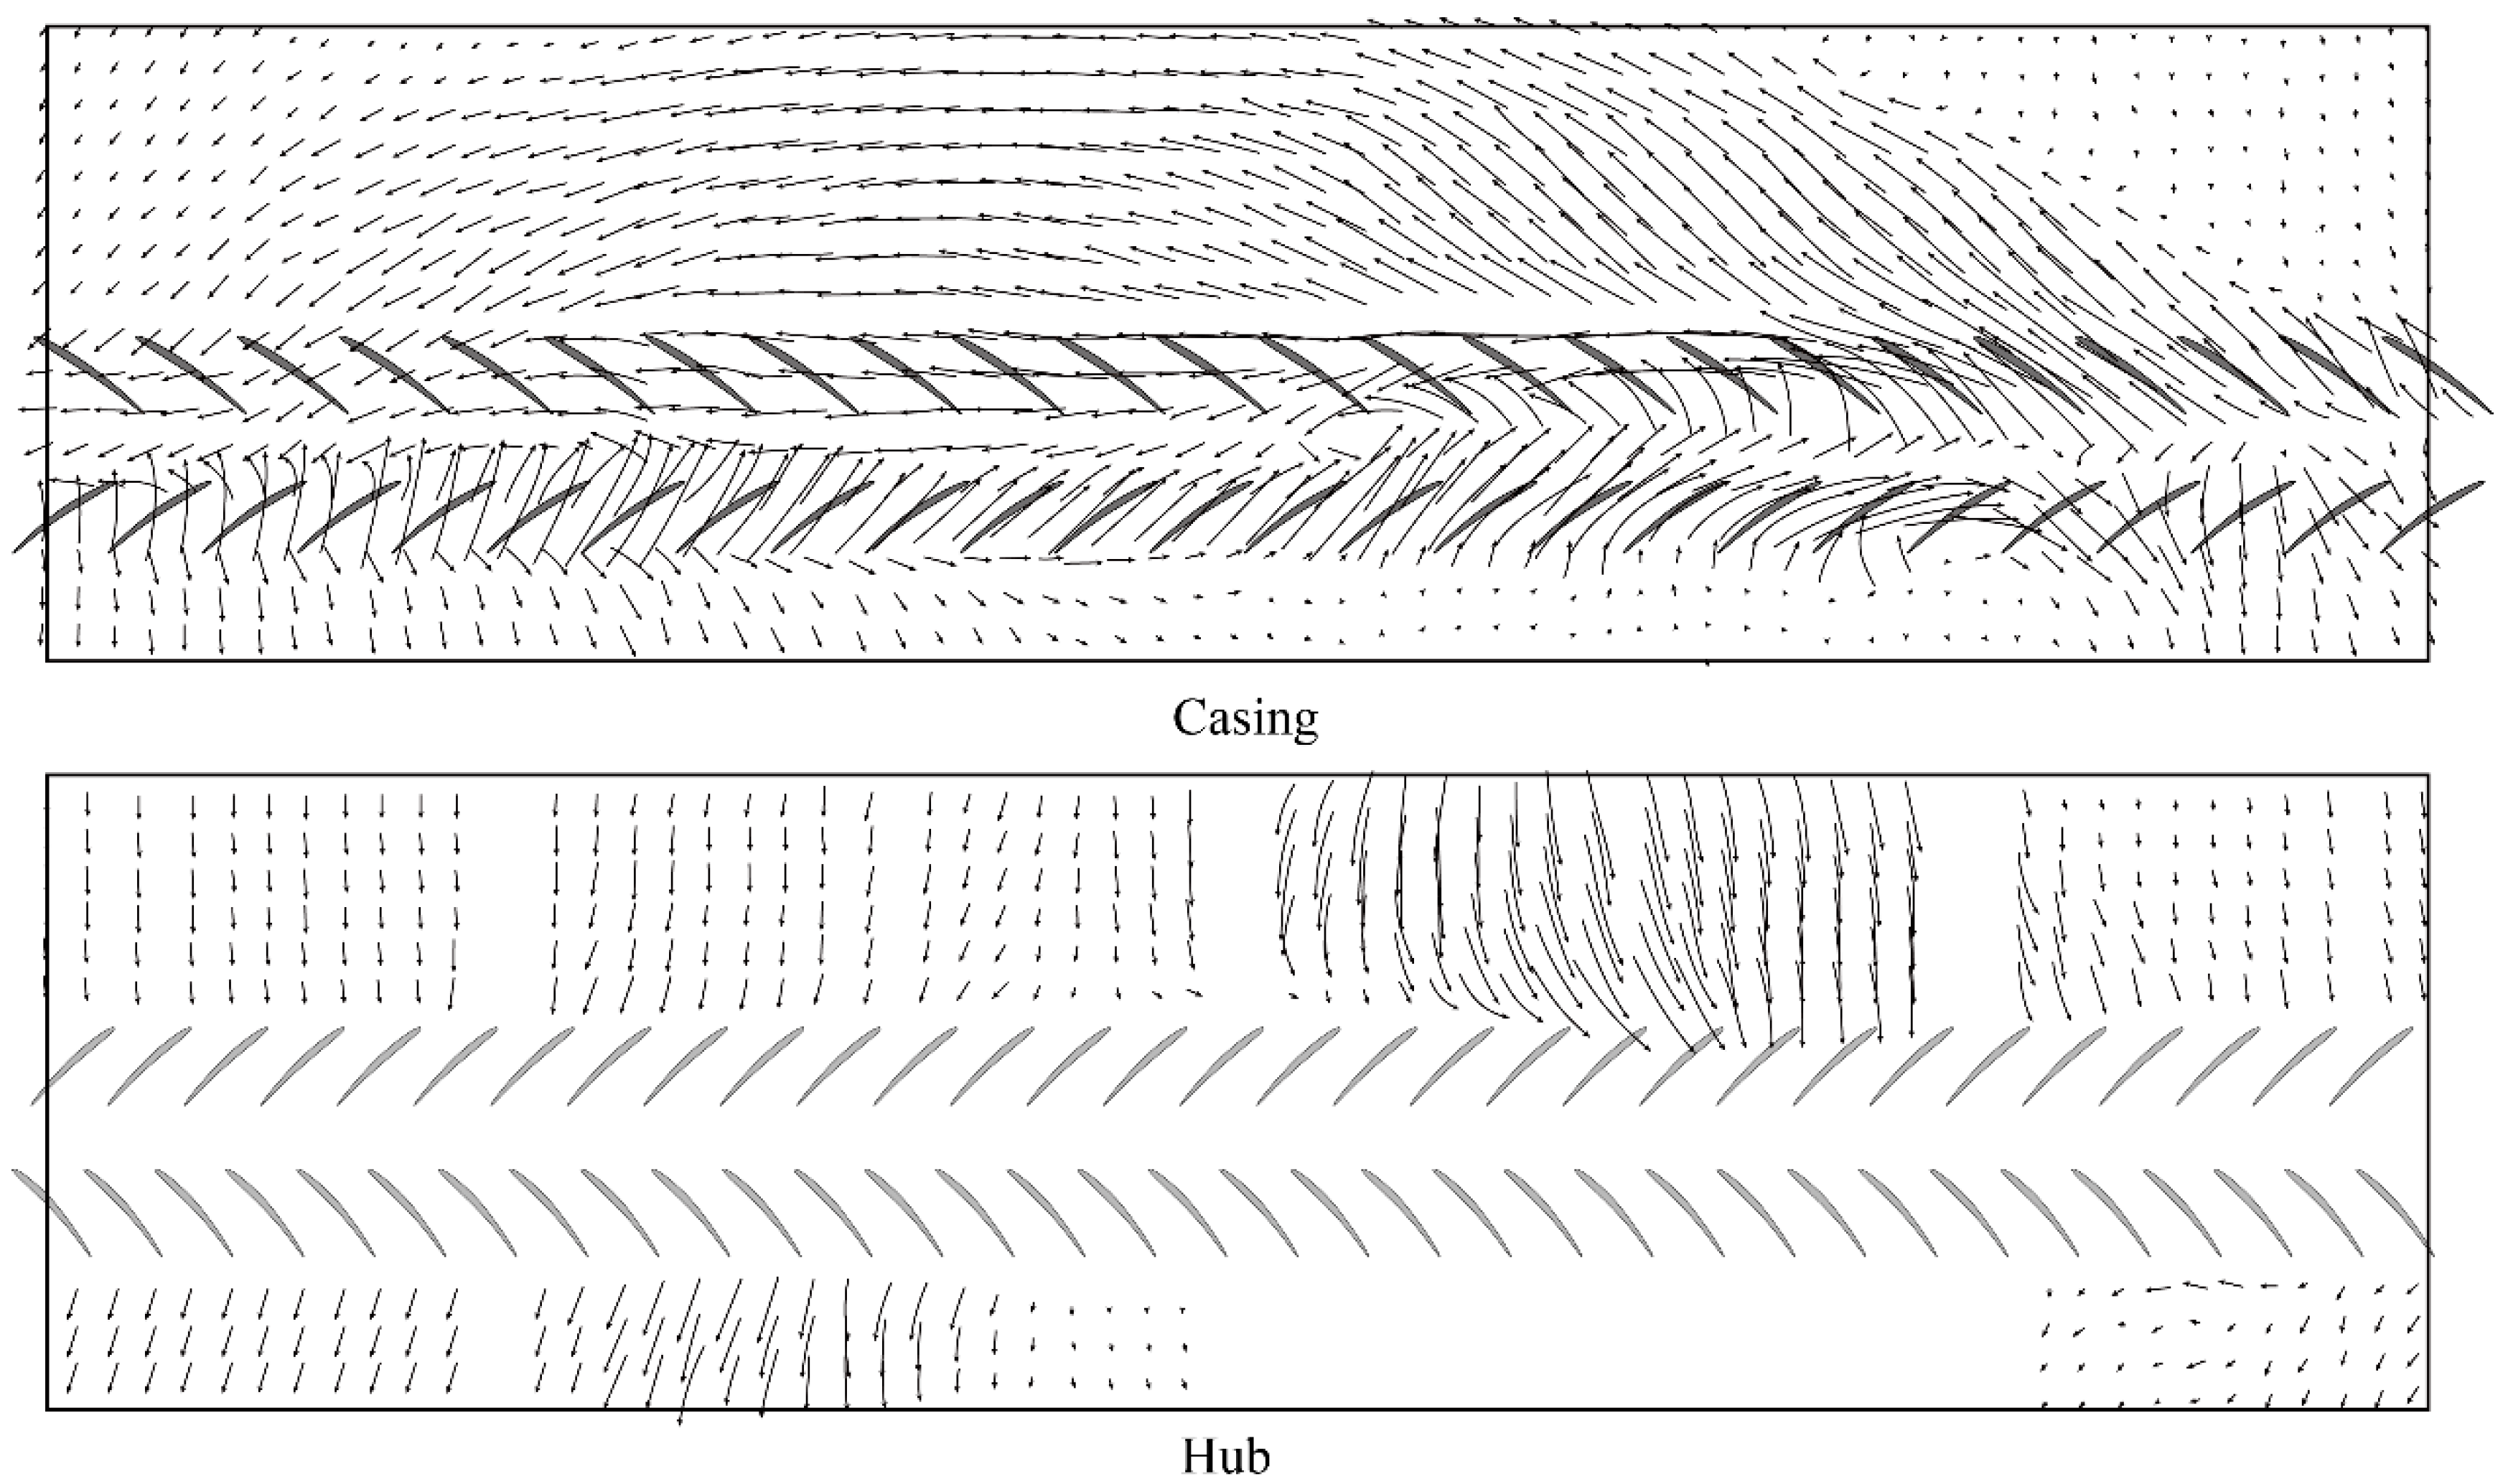
Firstly, the images obtained by step-by-step measurement were stitched into a complete oil flow map with images meticulously arranged and aligned in sequential order using drawing software. Then, the oil flow coating points were manually transcribed into vector line segments accompanied by arrows (wherein circles represent the starting point and sharp points indicate the end point of approximately drop-shaped measuring points). And then the velocity vectors of each oil flow coating point were obtained according to the oil flow map. Following this, the influence of gravity on the flow field was analyzed. If the influence was small, it could be ignored. If there was gravity influence, the velocity vector in the above figure was subtracted from the gravity vector to obtain the reconstructed two-dimensional velocity vector flow field, as shown in Figure 21.
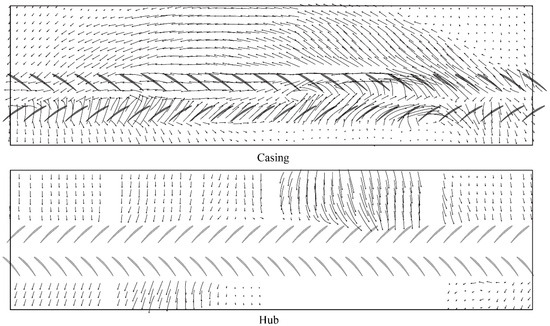
Figure 21.
The reconstructed two-dimensional velocity vector flow field.
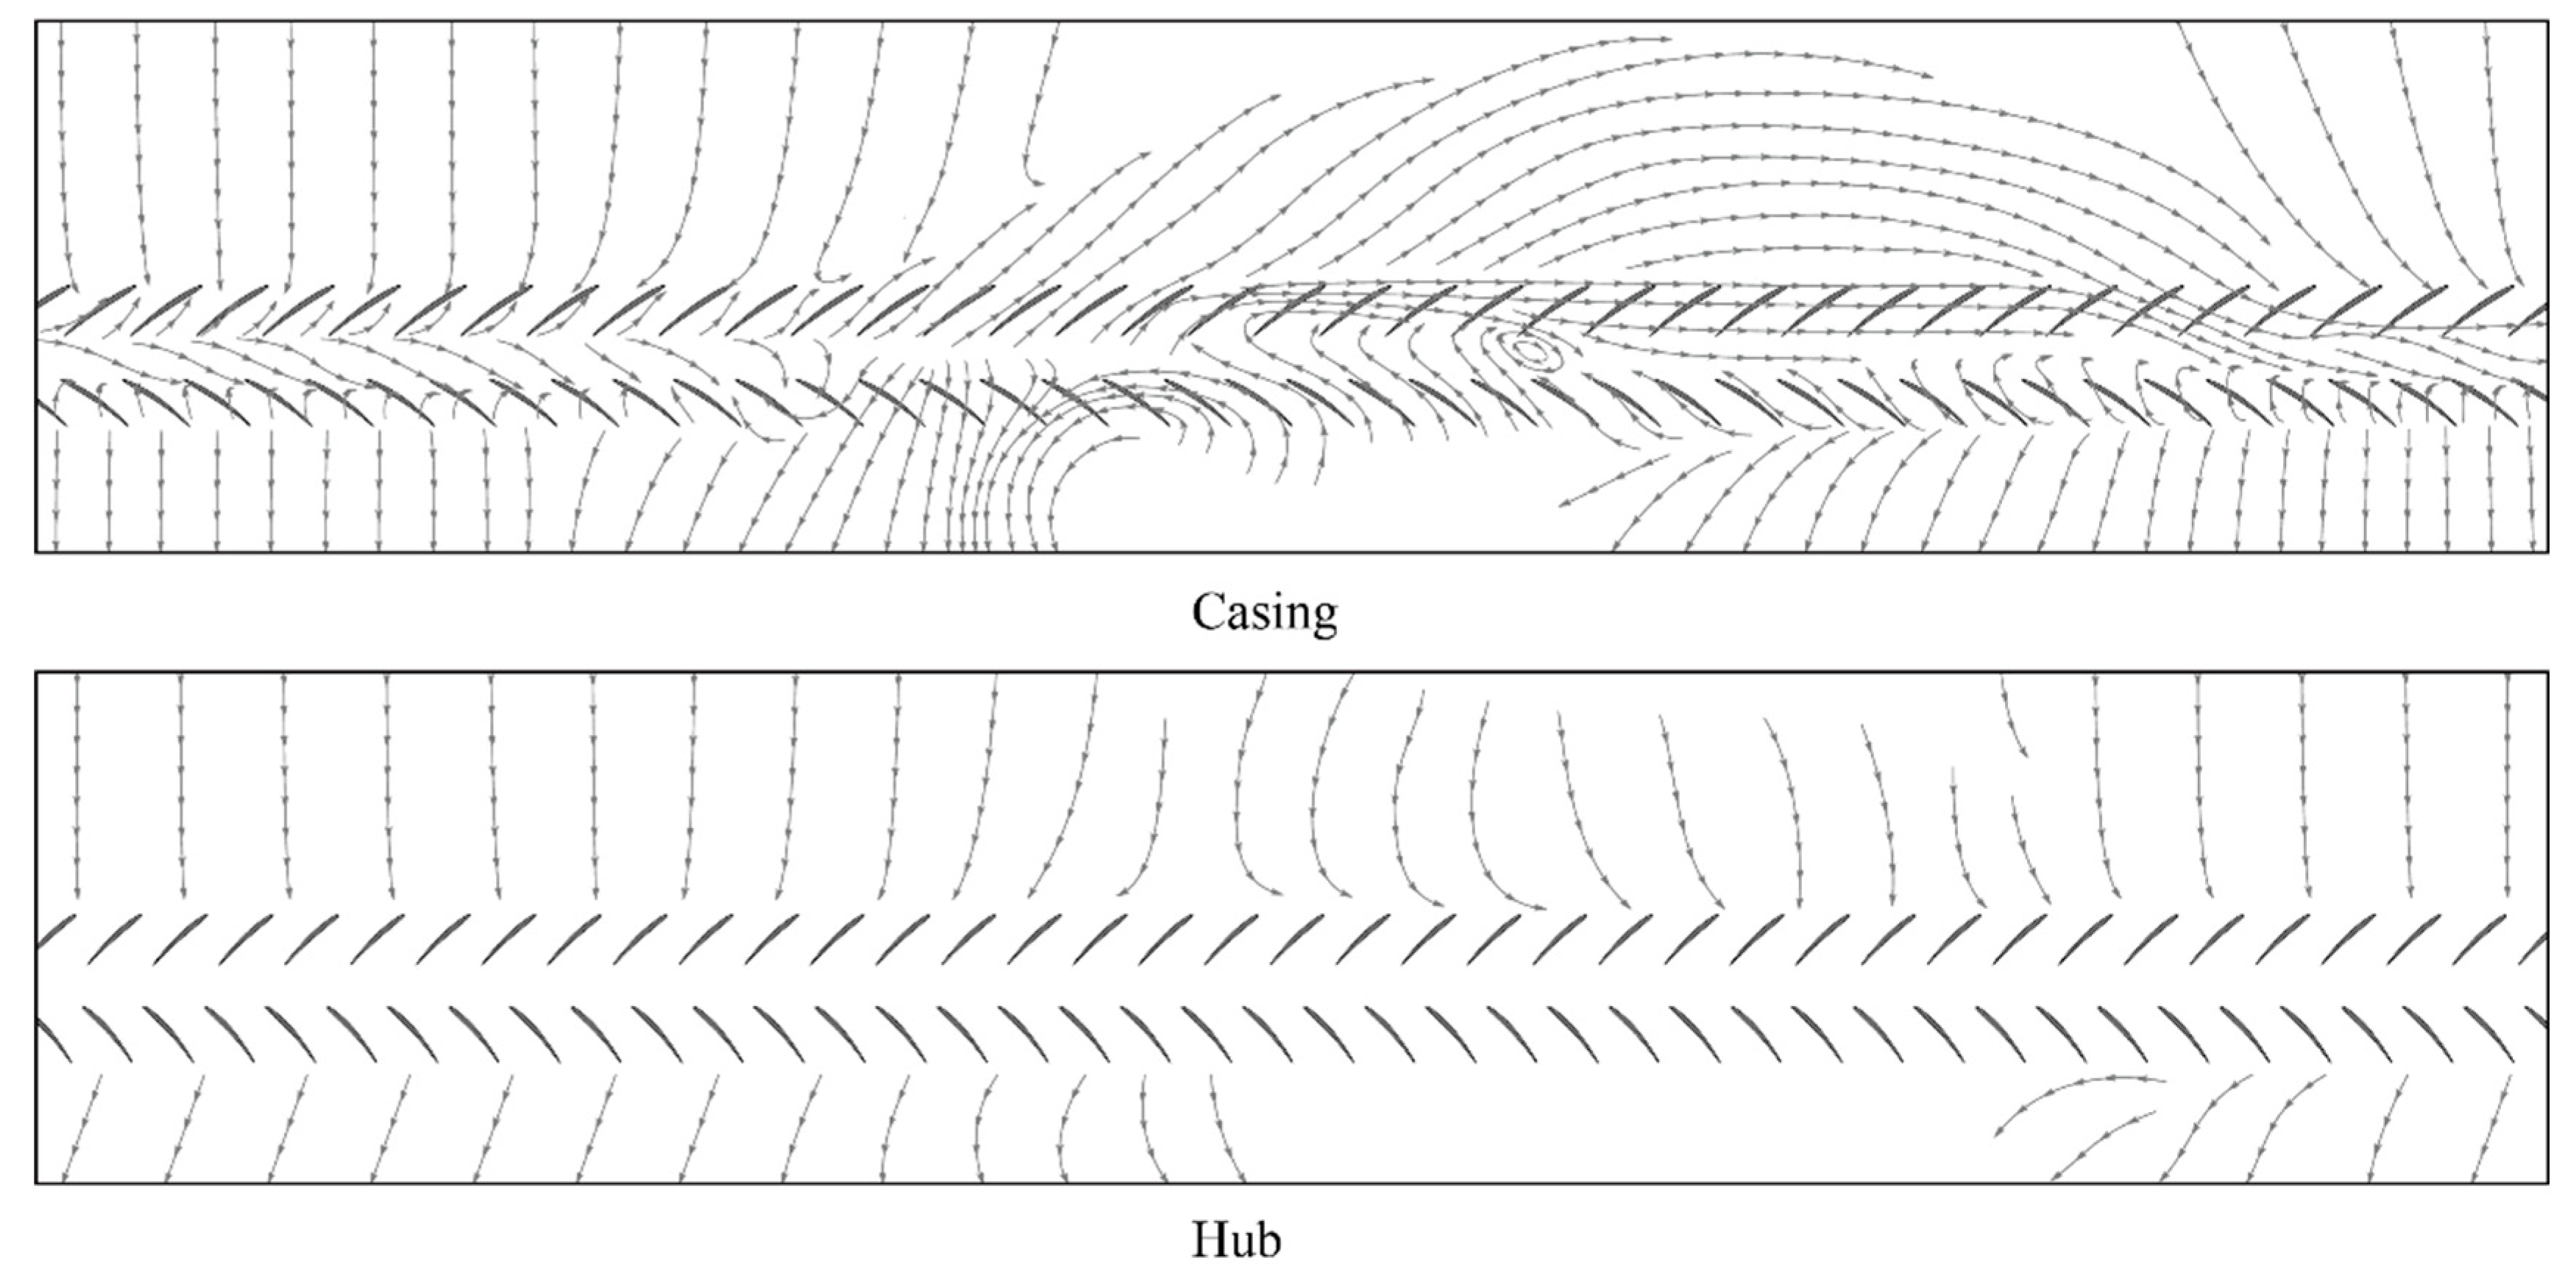
The two-dimensional velocity vector flow field obtained in the above figure can be used to draw the limit streamline, as shown in Figure 22. Because the velocity vector at some positions is too small to obtain an accurate streamline, it is estimated that this part of the fluid has a large radial flow, which needs to be verified in the subsequent flow field measurement. As shown in Figure 22, there is an obvious convergence edge and origin edge between the two rows of rotor blades in the flow field. Where the fluid comes from and where it goes must be studied in future experiments.
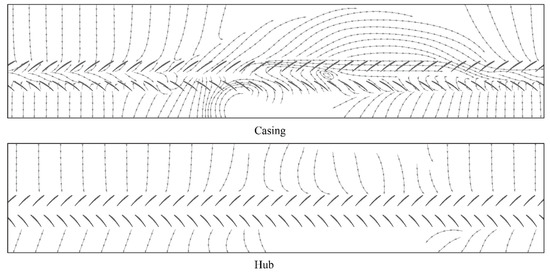
Figure 22.
The limit streamline of the casing rotating stall flow field.
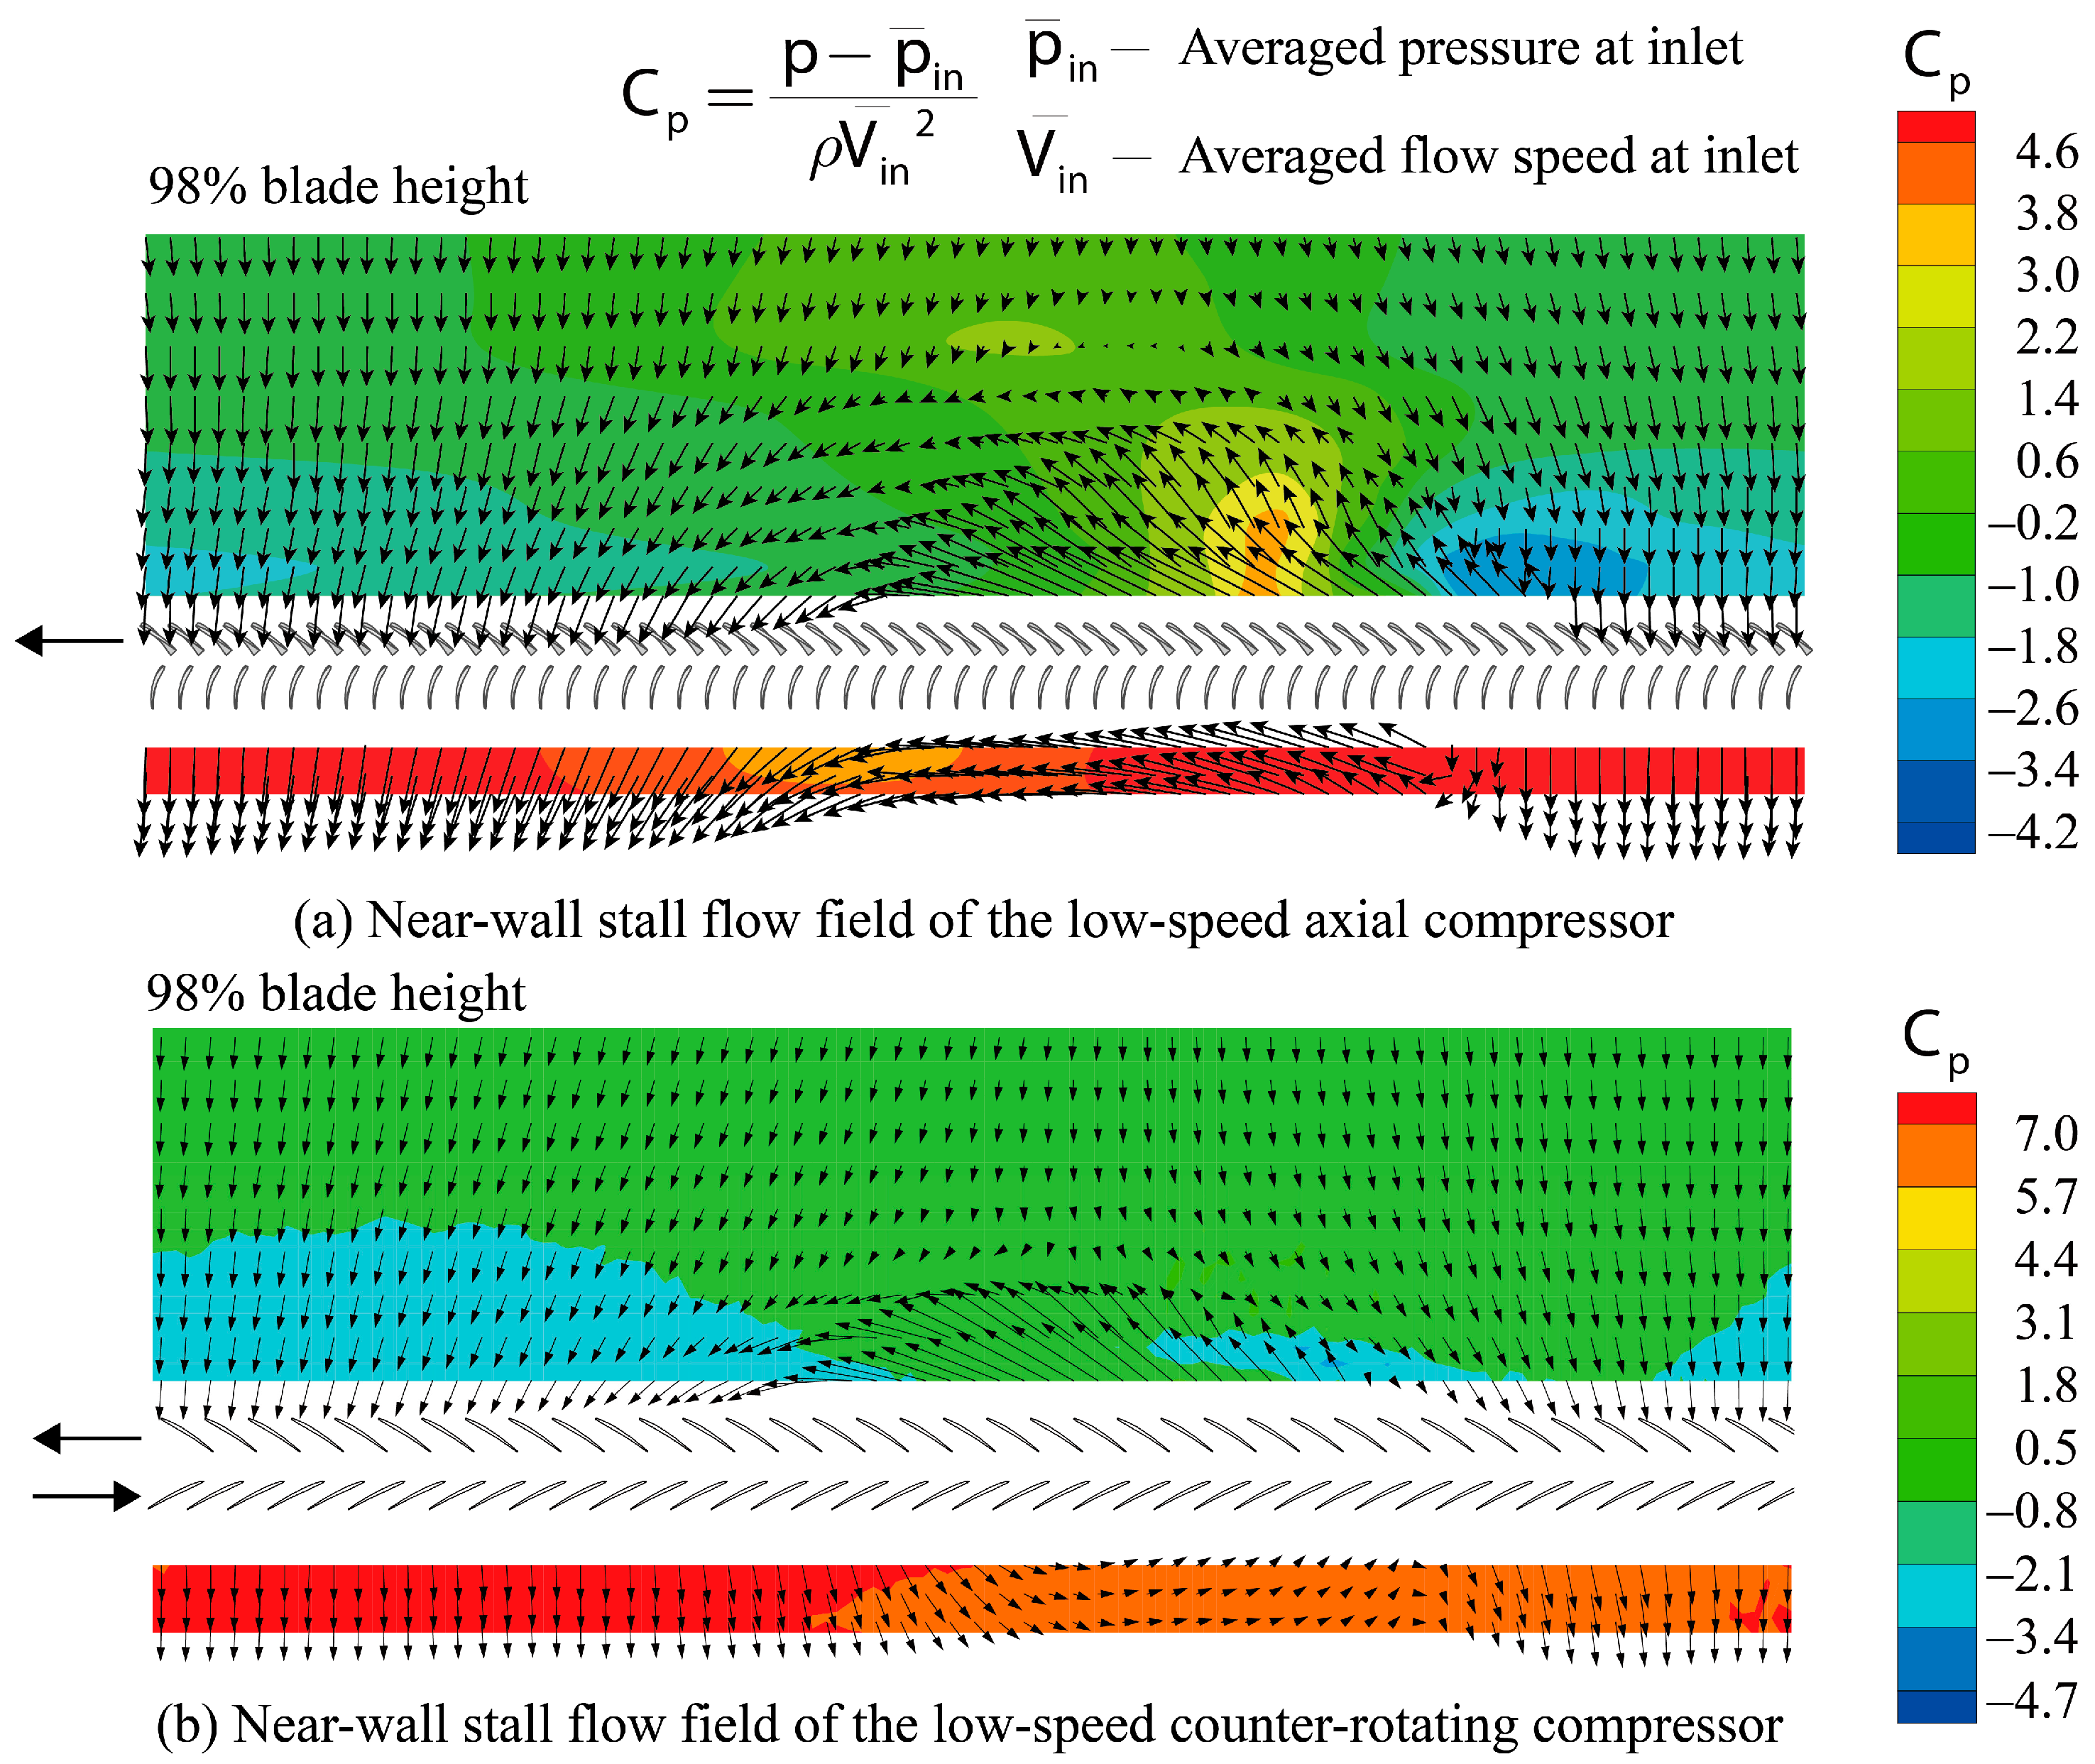
The experimental results indicate the presence of a distinct stall cell structure on the casing wall, while the hub wall exhibits only a certain deflection and gas backflow due to the inability to establish a streamline flow between blades. The circumferential extent of the stall leading edge area is greater than that of the stall trailing edge area, with vortex structures observed in the central region of stalling. Additionally, the airflow within non-stall regions displays varying degrees of migration. Near the stall leading edge area, there is gradual mixing with airflow from the leading edge region, resulting in a relatively indistinct boundary; conversely, near the stall trailing edge area and within this specific region itself, opposing velocity directions are observed along with a discernible shear layer separating them. Furthermore, high airflow velocities are noted at the trailing edge area compared to lower velocities within non-stall areas. Meanwhile, although the new configuration is different from the compressor stage, the experimental results indicate that in the new setup, it is possible to achieve an abrupt stall with a single cell of the part-span type whose extension and general configuration are similar to that which can occur in a compressor stage [17], as shown in Figure 23. However, this does not exclude specific differences in the flow field between the two cases (see, for example, the different downstream backflow structures for the two configurations).
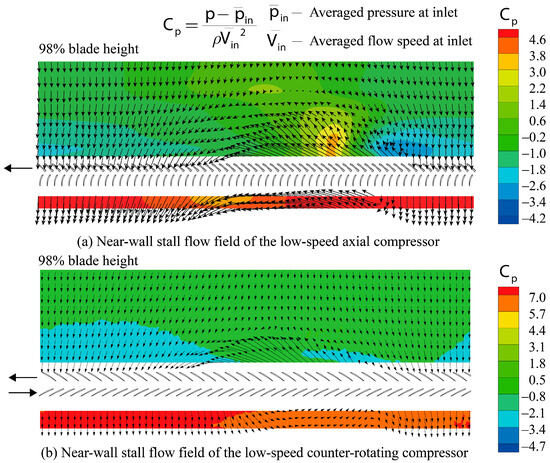
Figure 23.
The near-wall stall flow field of the two compressors.
The stall pressure signal in the near-wall region of the test rig was measured using seven fast-response wall pressure transducers. The transducer, manufactured by All Sensors Corporation, has a full scale of ±10 inch H2O (or 2.49 kPa) and a maximum error of ±0.5% at full scale. The axial position of the measurement points is shown in Figure 12; the experiment was conducted through individual measurements due to the limited number of sensors and the extensive range of measurements. The pressure contour diagram of the casing wall in the stall state of the compressor is depicted in Figure 24; the colors correspond to the magnitude of the pressure coefficient, which is defined as follows:
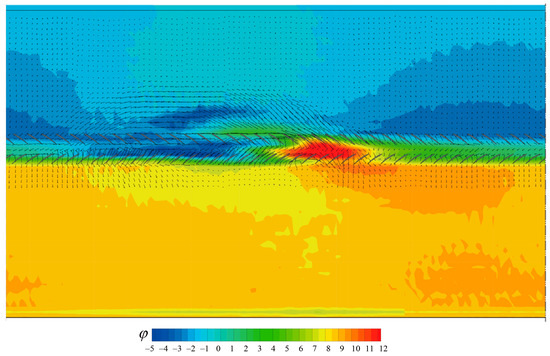
Figure 24.
The pressure contour diagram of the casing rotating stall flow field.
It can be observed that the circumferential pressure distribution of the fluid after stall is non-uniform, extending to 100% upstream and downstream. Even with the measurements taken, it fails to fully capture its extent, highlighting the significant influence of the stall cell on both upstream and downstream flow fields. Furthermore, a distinct low-pressure region is evident at the center of the hub wall’s stall cell, followed by a high-pressure area downstream.
5. Conclusions
To facilitate flow measurement within a stall cell, a low-speed counter-rotating compressor test rig was meticulously designed, fabricated, and subjected to rigorous testing. Specifically, the findings have substantiated the following:
1. The initial results validate our assertion that immobilizing the stall cell at a specific circumferential position can be achieved by employing an appropriate rotating speed ratio. The identified location of the stall cell is situated in the top-left quadrant, encompassing approximately 40% of the entire circumference. Moreover, precise adjustment of its circumferential position can be accomplished through the utilization of a circumferential distortion plate positioned near the compressor outlet.
2. In order to gain comprehensive insights into the near-wall flow structure within the stall cell, oil flow visualization measurements and dynamic wall pressure measurements were conducted. The experimental results demonstrated the presence of a distinct stall cell structure on the casing wall, while the hub wall exhibited only a certain deflection and gas backflow due to the inability to establish streamline flow between the blades. The circumferential extent of the stall leading edge area is greater than that of the stall trailing edge area, with vortex structures observed in the central region of stalling.
3. Dynamic wall pressure sensors were employed for measuring stall pressure signals in close proximity to test rig walls. Notably, it is evident from these observations that post-stall fluid exhibits non-uniform circumferential pressure distribution extending up to 100% upstream and downstream.
Author Contributions
Writing—original draft preparation, Q.Z.; writing—review and editing, G.A. All authors have read and agreed to the published version of the manuscript.
Funding
This research received no external funding.
Institutional Review Board Statement
Not applicable.
Informed Consent Statement
Not applicable.
Data Availability Statement
The data presented in this study are available on request from the corresponding author. The data are not publicly available due to privacy.
Conflicts of Interest
The authors declare no conflicts of interest.
Nomenclature
The nomenclature of the parameters involved in this article is as follows, in order of appearance:
| ρ | Air density |
| p0 | Atmosphere pressure (total pressure at inlet) |
| p1 | Wall static pressure at the outlet of the bellmouth |
| p2 | Wall static pressure at the outlet of the stator |
| Vx | Flow axial speed in front of the rotor |
| Um | Blade circumferential speed at mid-height |
| n1 | Rotating speed of the first rotor |
| n2 | Rotating speed of the second rotor |
| ϕ | Pressure coefficient in the flow field |
References
- Emmons, H.W.; Pearson, C.E.; Grant, H.P. Compressor Surge and Stall Propagation. Trans. Am. Soc. Mech. Eng. 1955, 77, 455–467. [Google Scholar] [CrossRef]
- Fabri, J.; Siestrunck, R. Rotating stall in axial flow compressors. J. Aeronaut. Sci. 1957, 24, 805–812. [Google Scholar] [CrossRef]
- Stenning, A.H.; Kriebel, A. Stall propagation in a cascade of airfoils. Trans. Am. Soc. Mech. Eng. 1958, 80, 777–789. [Google Scholar] [CrossRef]
- Day, I.J.; Cumpsty, N.A. The Measurement and Interpretation of Flow within Rotating Stall Cells in Axial Compressors. J. Mech. Eng. Sci. 1978, 20, 101–114. [Google Scholar] [CrossRef]
- Cumpsty, N.A.; Greitzer, E.M. A Simple Model for Compressor Stall Cell Propagation. J. Eng. Power 1982, 104, 170–176. [Google Scholar] [CrossRef]
- Das, D.; Jiang, H. An experimental study of rotating stall in a multistage axial-flow compressor. J. Eng. Gas Turbines 1984, 106, 542–551. [Google Scholar] [CrossRef]
- Mathioudakis, K.; Breugelmans, F. Three-dimensional flow in deep rotating stall cells of an axial compressor. J. Propuls. Power 1988, 4, 263–269. [Google Scholar] [CrossRef]
- Saxer-Felici, H.; Saxer, A.; Inderbitzin, A.; Gyarmathy, G. Prediction and measurement of rotating stall cells in an axial compressor. J. Turbomach. 1999, 121, 365–375. [Google Scholar] [CrossRef]
- Nurzia, F.; Palomba, C.; Puddu, P. Some considerations about the rotating cell structure. Int. J. Rotating Mach. 2009, 2009, 709754. [Google Scholar] [CrossRef]
- Choi, M.; Smith, N.H.; Vahdati, M. Validation of numerical simulation for rotating stall in a transonic fan. J. Turbomach. 2013, 135, 021004. [Google Scholar] [CrossRef]
- Gourdain, N.; Burguburu, S.; Leboeuf, F.; Michon, G.J. Simulation of rotating stall in a whole stage of an axial compressor. Comput. Fluids 2010, 39, 1644–1655. [Google Scholar] [CrossRef]
- Pardowitz, B.; Tapken, U.; Sorge, R.; Thamsen, P.U.; Enghardt, L. Rotating instability in an annular cascade: Detailed analysis of the instationary flow phenomena. J. Turbomach. 2014, 136, 061017. [Google Scholar] [CrossRef]
- Ji, J.; Hu, J.; Ma, S.; Xu, R. A Computational Method of Rotating Stall and Surge Transients in Axial Compressor. Energies 2022, 15, 5246. [Google Scholar] [CrossRef]
- Eck, M.; Geist, S.; Peitsch, D. Physics of Prestall Propagating Disturbances in Axial Compressors and Their Potential as a Stall Warning Indicator. Appl. Sci. 2017, 7, 285. [Google Scholar] [CrossRef]
- Pacot, O.; Kato, C.; Guo, Y.; Yamade, Y.; Avellan, F. Large eddy simulation of the rotating stall in a pump-turbine operated in pumping mode at a part-load condition. J. Fluids Eng. 2016, 138, 111102. [Google Scholar] [CrossRef]
- Fike, M.; Bombek, G.; Hriberšek, M.; Hribernik, A. Visualisation of rotating stall in an axial flow fan. Exp. Therm. Fluid Sci. 2014, 53, 269–276. [Google Scholar] [CrossRef]
- Zhang, Q.; Wang, H. Flow Pattern of Rotating Stall Cell in Axial Compressor. J. Propuls. Power 2022, 38, 282–293. [Google Scholar] [CrossRef]
- Valensi, J. Experimental investigation of the rotating stall in a single-stage axial compressor. J. Aerosp. Sci. 1958, 25, 1–10. [Google Scholar] [CrossRef]
- Poensgen, C.; Gallus, H. Rotating stall in a single stage axial flow compressor. J. Turbomach. 1996, 118, 189–196. [Google Scholar] [CrossRef]
- Xu, R.; Hu, J.; Wang, X.; Jiang, C.; Ji, J. Experimental Investigation of Rotating Instability in an Axial Compressor with a Steady Swirl Distortion Inlet. Energies 2021, 14, 8057. [Google Scholar] [CrossRef]
- Chen, X.; Koppe, B.; Lange, M.; Chu, W.; Mailach, R. Rotating Instabilities in a Low-Speed Single Compressor Rotor Row with Varying Blade Tip Clearance. Energies 2021, 14, 8369. [Google Scholar] [CrossRef]


Disclaimer/Publisher’s Note: The statements, opinions and data contained in all publications are solely those of the individual author(s) and contributor(s) and not of MDPI and/or the editor(s). MDPI and/or the editor(s) disclaim responsibility for any injury to people or property resulting from any ideas, methods, instructions or products referred to in the content. |
© 2024 by the authors. Licensee MDPI, Basel, Switzerland. This article is an open access article distributed under the terms and conditions of the Creative Commons Attribution (CC BY) license (https://creativecommons.org/licenses/by/4.0/).