Article

Progression of Sprint Interval Training Set Performance and Physiological Responses during a Six-Week Training Period

by
Gavriil G. Arsoniadis
1,* and
Argyris G. Toubekis
1,2
1
Division of Aquatic Sports, School of Physical Education and Sports Science, National and Kapodistrian University of Athens, 17237 Athens, Greece
2
Sports Performance Laboratory, School of Physical Education and Sports Science, National and Kapodistrian University of Athens, 17237 Athens, Greece
*
Author to whom correspondence should be addressed.
Appl. Sci. 2024, 14(5), 2097; https://doi.org/10.3390/app14052097
Submission received: 26 January 2024 / Revised: 27 February 2024 / Accepted: 28 February 2024 / Published: 2 March 2024

Abstract

:
The aim of this study was to examine the progression and the effect of sprint interval training (SIT) on swimmers’ performance and physiological responses during and after a 6-week period. Eight swimmers (age: 16.7 ± 4.2 years) performed maximum efforts for (a) 200 and 400 m front crawl for the determination of critical speed (CS), (b) four 50 m repetitions (4 × 50 m) and a 100 m test before (Pre) and after (Post) the 6-week training period. SIT was applied three times per week including two sets of 4 × 50 m sprints starting every 2 min. Pre and Post swimming time (T), blood lactate (BL), heart rate (HR), and rate of perceived exertion (RPE) were evaluated. CS increased by 4.4 ± 5.2% (p = 0.01) after 6 weeks. The Pre vs. Post values of T in 4 × 50 and 100 m and BL were unchanged (T: d = 0.05, 0.09, p = 0.14, 0.47, respectively; BL: d = 0.12, p = 0.42), while HR was decreased (d = 0.24, p = 0.04). The progression of T in 4 × 50 m training sprints was unchanged (p = 0.25) while BL increased in weeks 3 (9.4 ± 5.9%) and 5 (13.9 ± 7.8%) compared to week 1 (p = 0.01). SIT improved the swimmers’ aerobic endurance. The lactate response progressively increased despite similar SIT performance during the 6-week period.

1. Introduction

Competitive swimmers compete in various swimming distances that last from 20 s (50 m) to 15 min (1500 m), and energy demands are covered by both aerobic and anaerobic metabolic systems with varying percentages of contribution [1]. Consequently, swimmers apply endurance training sets within the moderate, heavy, and very heavy exercise intensity domains [2,3,4] or sprint interval training (SIT) sets with maximum effort called “all out” to improve both metabolic systems [5,6,7].
Applying SIT may consist of four to twelve bouts of 10 to 30 s duration with various recovery intervals [8,9]. It is suggested that SIT is effective in improving swimmers’ performance in competitive distances of 50 to 400 m [10,11,12]. Then, coaches may include SIT during the specific or competitive preparation periods aiming to improve performance in short-duration races [10,11,12,13,14]. However, SIT is a strong stimulus, and the physiological response of its systematic application should be examined to evaluate training adaptations and performance. There is no information concerning the progression in performance and physiological variables (i.e., blood lactate, heart rate) during and after a period of training in a specifically designed SIT set. Such data will help coaches to decide on appropriate periodization within a mesocycle.
Moreover, swimmers’ performance optimization may occur as they increase anaerobic power, buffering capacity [10,11], maximum oxygen uptake, and blood lactate concentration [14,15] alongside aerobic indices such as speed corresponding to 4, 5, and 10 mmol/L after a period of two to eight weeks of training [12]. The various physiological effects of SIT are underlined by central and peripheral adaptations that enable increases in both aerobic [16,17] and anaerobic performance [18]. SIT may increase the activity of both aerobic and anaerobic enzymes and improve performance [18,19]. However, there is limited information concerning the progression of adaptations occurring within a 6-week SIT that may rely on aerobic and anaerobic adjustments. Such changes may be detected using critical speed as an index of aerobic endurance and blood lactate concentration as an index of glycolytic metabolism, respectively.
To our knowledge, there is no study including swimmers that examines the effect of SIT on performance and the progression of physiological parameters during a 6-week training period. The aim of the current study was to examine the effect of SIT on performance and physiological responses (a) during and (b) after a 6-week SIT period. We hypothesized that SIT will improve performance and will progressively increase physiological responses during the 6-week training period.

2. Materials and Methods

2.1. Participants

Eight national-level competitive swimmers (4 males and 4 females) participated in this study with their characteristics presented in Table 1. The participants’ inclusion criteria were (i) 5 years of competitive experience, (ii) participation in six swimming sessions per week, (iii) free from injury, and (iv) free from medication during the training period. After a thorough explanation of the study procedures, all swimmers or their legal guardians signed a consent form accepting their participation in the study. The local institutional review board approved the experimental protocol (approved number: 1111), which was in accordance with the Helsinki declaration.

2.2. Study Design

A one-group repeated-measures design was utilized using Pre-training and Post-training measurements. The week before (Pre) and the week after (Post) the end of the 6-week training period, all swimmers participated in three testing sessions, including (i) 200 m and 400 m front crawl tests with maximum effort to evaluate the critical speed, (ii) four repetitions of 50 m front crawl sprints, and (iii) a 100 m front crawl test with maximum effort (Figure 1). During the 6-week period, all swimmers performed an SIT session three times per week. Measurements were conducted during the swimmers’ specific preparation period from March to April. All tests as well as training sessions, were completed at the same time of the day (17:00 to 19:00 p.m.) and were applied in a 50 m outdoor swimming pool with a constant water temperature of 27 °C. Ambient temperature during training and testing ranged between 20 and 25 °C. The SIT during the 6-week period and the testing procedures before and after this period were carried out by experienced experimenters and certified professional swimming coaches.

2.3. Anthropometric Measurements

Prior to performance testing procedures, swimmers’ body mass and body height (Seca) were evaluated. Body mass index and body fat percentage were calculated according to Jackson and Pollock [19].

2.4. Testing Procedures

During three consecutive days 24 h apart, swimmers participated in four swimming performance tests (Figure 1). Prior to each testing procedure, swimmers performed an 800 m standardized warm-up (400 m slow front crawl swimming, 4 × 50 m front crawl drills, and 4 × 50 m front crawl swims with progressively increasing speed). On day 1, swimmers performed a 200 m and 400 m front crawl applying maximum effort. The recovery period between 200 and 400 m was 30 min including 5 to 10 min of active recovery. From the two timed distances (200, 400 m), the linear relationship of time vs. distance was drawn and the critical speed was determined as the slope of the regression line [20]. On day 2, swimmers completed four 50 m front crawl sprints (4 × 50 m) using a push-off start every 2 min. The mean performance time was used for the statistical analysis. Fingertip blood samples were collected after the 4 × 50 m test and analyzed for lactate concentration (BL, Lactate Scout+, SensLab GmbH, Leipzig, Germany). Heart rate (HR, s610i, Polar Electro, Finland) was recorded immediately after each 50 m sprint, and the mean heart rate was used for the statistical analysis. Swimmers indicated their rating of perceived exertion (RPE) immediately after each 50 m sprint using a 10-point scale [21]. The mean RPE was used for the statistical analysis. On day 3, swimmers performed a 100 m performance test applying maximum effort. The swimming time during all performance tests was recorded by two experienced timekeepers (HS-80 TW-1EF, CASIO, Tokyo, Japan). All testing procedures were applied prior to and immediately after the 6-week training period.

2.5. Training Period

During the 6-week training period, three times per week, swimmers performed an SIT consisting of two sets of 4 × 50 m repetitions, the first one using front crawl and the second one using their preferred swimming stroke. All efforts were performed with maximum effort and started from within the water with a push-off start every 2 min. A five-minute passive resting interval was allowed between the two sets. The daily training volume during SIT days was 3000 m and swimming training during the 3 rest days ranged from 3200 to 5000 m (Table 2). The performance time of the first 4 × 50 m front crawl set in each SIT was recorded by experienced timekeepers and the mean time was used for the statistical analysis. Fingertip blood samples were collected after the third intervention day after the first set of 4 × 50 m in weeks 1, 3, and 5 to measure lactate concentration (Figure 1). Moreover, HR and RPE were recorded during all intervention days in all weeks (Figure 1). The mean HR and RPE from each training set in each training week were used for the statistical analysis.

2.6. Determination of Training Load, Volume of Training, and Training Zones

The internal training load of daily swimming training was estimated by calculating the session rating of perceived exertion (session-RPE) using a 10-point Borg scale [22]. Swimmers’ training volume was registered by one experienced experimenter in a specific Excel file throughout the 6-week training period. Training zones were adjusted according to critical speed in three training zones: (i) zone 1 (corresponding to 95–97% of critical speed), (ii) zone 2 (corresponding to 99–101% of critical speed), and (iii) zone 3 (corresponding to 104–107% of critical speed (Table 2) [20].

2.7. Determination of Decrement Score

During the 4 × 50 m set in Pre and Post testing sessions and in the first front crawl training set of each training session, the decrement score (DS) was calculated through the difference between the mean performance time (MT) and the best performance time (BT) in the 4 × 50 m test (Equation (1)) [23].
D S = ( M T B T ) / B T × 100

2.8. Statistical Analysis

A Kolmogorov–Smirnov test was used to examine the normal distribution of the data. Mauchly’s test was used to test for sphericity and Greenhouse–Geisser was used when the assumption of sphericity was not met. A t-test for paired samples was used to compare the critical speed, performance time from 4 × 50 m and 100 m, blood lactate concentration, heart rate, and rate of perceived exertion before (Pre) and after (Post) training period testing procedures. Cohen’s d using the pooled SD as a denominator [24] was used for the calculation of effect size. The effect size categorization according to Cohen’s d was (a) 0.20 (small), (b) between 0.20 and 0.80 (medium), and (c) greater than 0.80 (large) [24]. The 95% confidence limits were also calculated for the mean differences between Pre and Post values. One-way analysis of variance in one factor (time points of measurement) was used to examine the measured variables during the 6-week training period. To estimate the size of the main effects and interactions, the partial eta-squared (η2) values from the analysis of variance were used. A post hoc analysis of statistical power was also calculated using G-Power 3.1.9.2 software. The partial eta-squared and effect size for the sample size in the present study (N = 8) resulted in a power of analysis corresponding to 0.6 [25]. Pearson correlation was used to examine relationships between Δ mean values of performance time, blood lactate concentration, and heart rate. Data are presented as mean ± SD. Statistical significance was set at p < 0.05.

3. Results

3.1. Anthropometric Characteristics

After a 6-week period of SIT, body mass, body height, and body mass index were maintained (Table 3), whereas body fat decreased by 0.9 ± 0.8% (Table 3).

3.2. Training Load

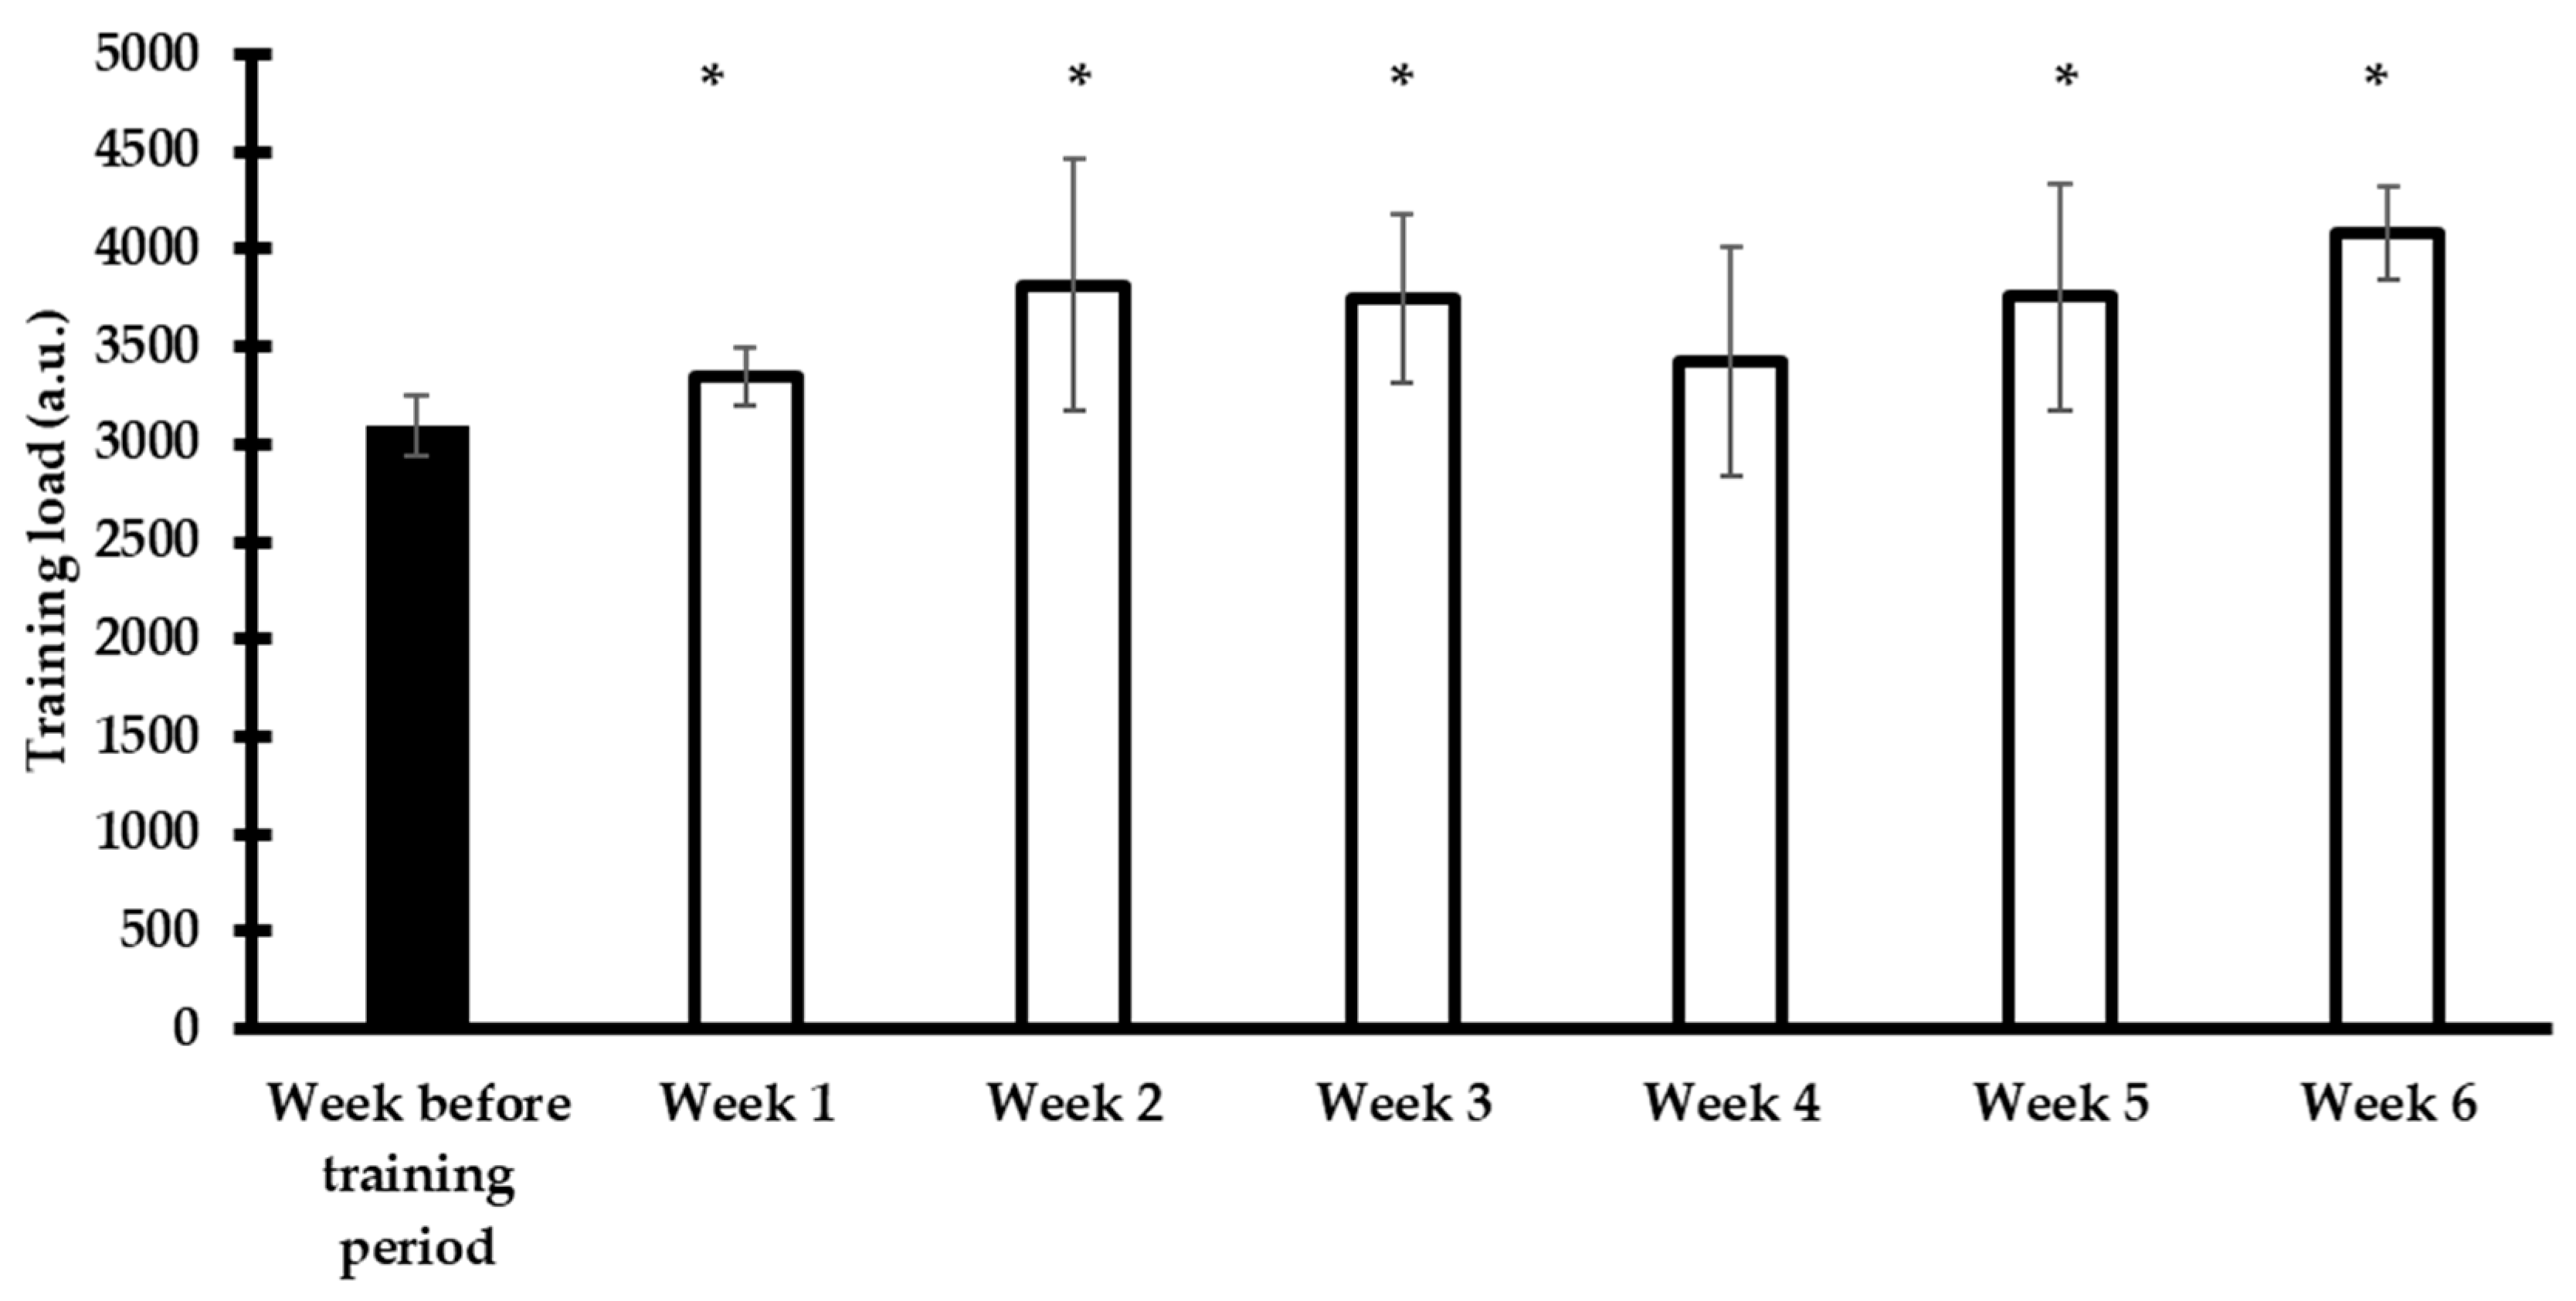
Training load was increased by 7.4 ± 2.1, 23.8 ± 23.6, 21.10 ± 13.5, 21.5 ± 19.8, and 24.1 ± 4.4% in weeks 1, 2, 3, 5, and 6, respectively, compared to the load before the beginning of the training intervention (3095 ± 157 arbitrary units, Figure 2). However, there was no difference in week 4 of training compared to the week before the swimming training period (Figure 2).

3.3. Critical Speed

Following the training period, critical speed was increased by 4.4 ± 5.2% (Pre: 1.154 ± 0.09 vs. Post: 1.204 ± 0.09 m·s−1; mean difference: 0.05 ± 0.06, 95% confidence limits, 0.09 to 0.01 m·s−1, d = 0.26, p = 0.01).

3.4. Swimming Performance

3.4.1. Pre- vs. Post-Training Period Performance Time

Mean performance time in 4 × 50 m and 100 m front crawl tests was unchanged following the 6-week SIT period (Figure 3). Moreover, the decrement score (DS) remained unaltered during 4 × 50 m (Pre: 3.0 ± 1.5 vs. Post: 2.0 ± 1.8%; mean difference: −1.0 ± 2.7, 95% confidence limits, −2.9 to 0.9%, d = 0.15, p = 0.32).

3.4.2. Progression of Swimming Performance Time during the Training Period

The mean performance time of the 4 × 50 m front crawl training set recorded during each training session remained unaltered throughout the 6-week training period (F(5,35) = 1.44, η2 = 0.17, p = 0.23, Figure 4). In addition, DS remained similar during the 6-week training period (F(5,35) = 1.36, η2 = 0.16, p = 0.25, Figure 4).

3.5. Physiological Variables

3.5.1. Pre vs. Post Training Blood Lactate Concentration and Heart Rate

Following the 6-week SIT period, blood lactate concentration (BL) was unchanged but heart rate (HR) was decreased following the 4 × 50 m testing session (Table 4).

3.5.2. Progression of Blood Lactate Concentration and Heart Rate during the Training Period

During the 6-week training period, BL following the 4 × 50 m front crawl training set was increased in weeks 3 and 5 compared to week 1 (F(2,14) = 23.42, η2 = 0.77, p = 0.00, Figure 5). Additionally, HR increased from week 2 to week 6 compared to week 1 (F(5,35) = 11.44, η2 = 0.62, p = 0.00, Figure 5).

3.6. Rating of Perceived Exertion

3.6.1. Pre- vs. Post-Training Rating of Perceived Exertion

Following the 6-week training period, swimmers’ mean RPE was unchanged during the 4 × 50 m testing session (Pre: 7.4 ± 1.3 vs. Post: 7.4 ± 0.9; mean difference: 0.05 ± 1.72, 95% confidence limits, −1.15 to 1.24, d = 0.01, p = 0.94).

3.6.2. Progression of the Rating of Perceived Exertion during the Training Period

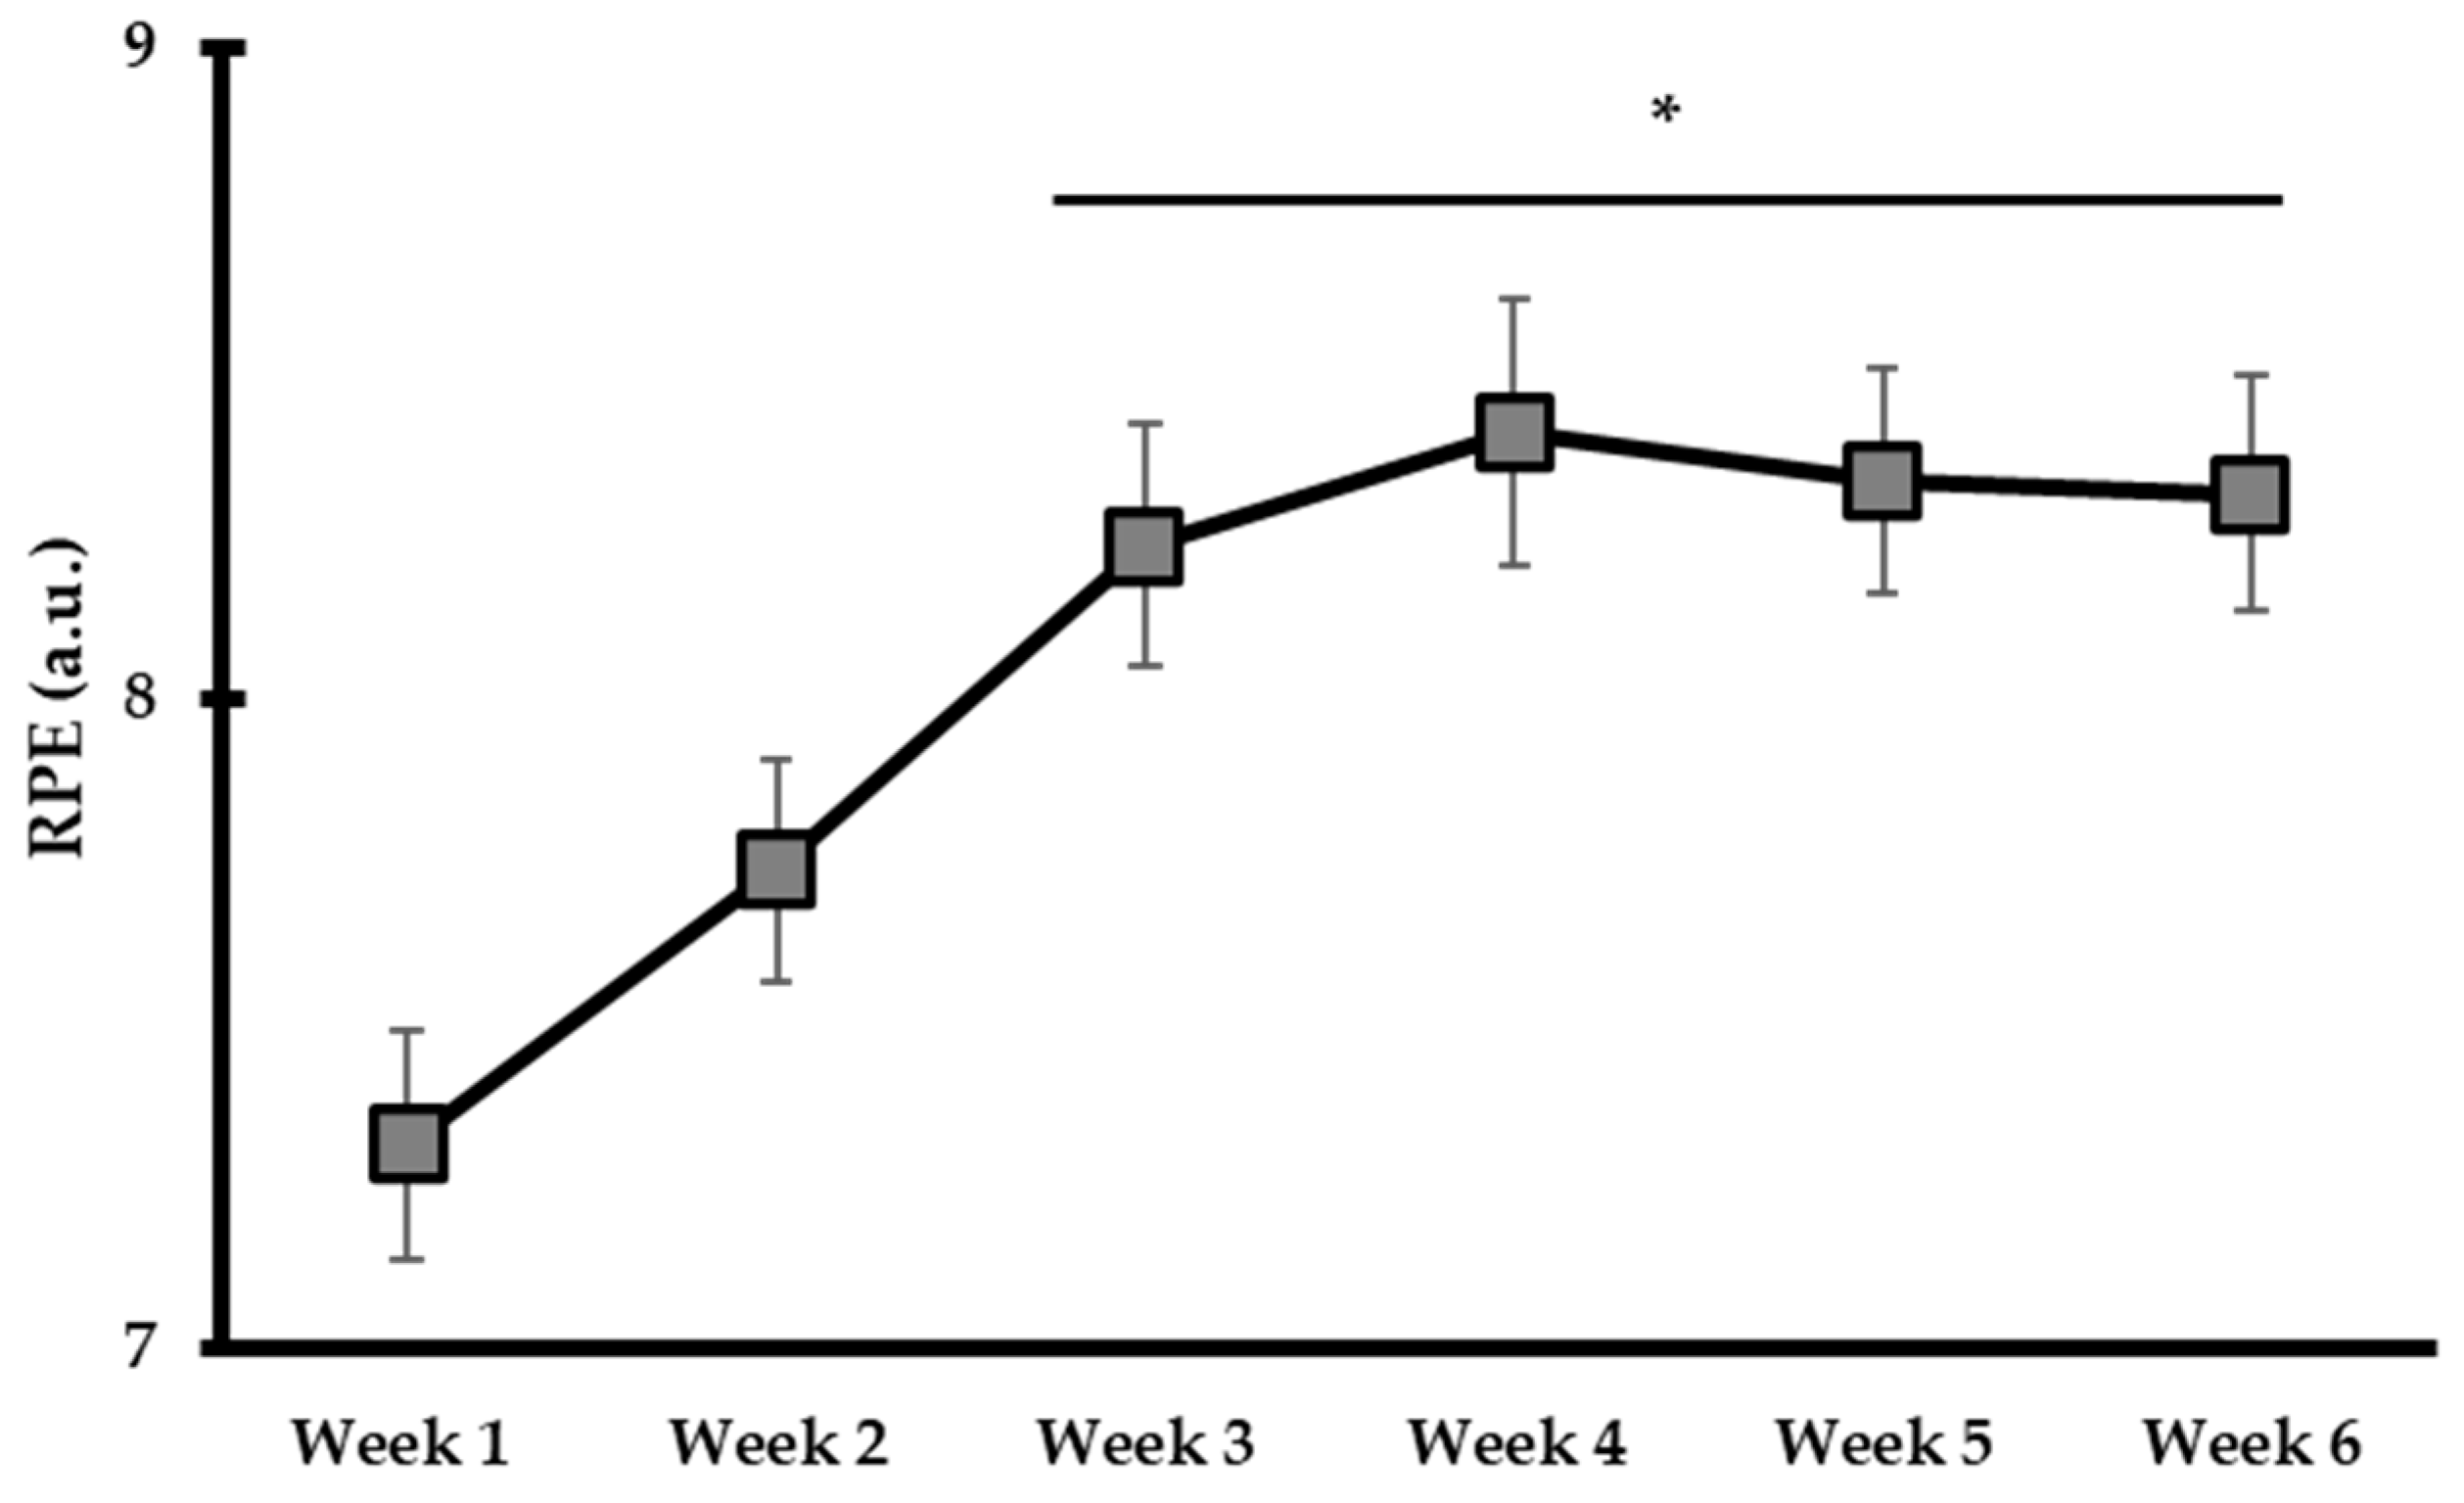
During the 6-week SIT period, the mean RPE following the 4 × 50 m front crawl training set was increased in weeks 3, 4, 5, and 6 compared to weeks 1 and 2 (Figure 6).

3.7. Correlations

Δ values of mean performance time of the 4 × 50 m testing session applied Pre and Post the 6-week training period were negatively correlated with Δ BL at the same time points (r = −0.89, p = 0.00, Figure 7). However, there was no significant correlation between Δ HR and Δ mean performance time (r = 0.62, p = 0.15, Figure 7).

4. Discussion

The aim of the current study was to examine the progression of physiological responses and performance in a SIT set and the effect of SIT on swimming performance after a 6-week training period. It is worth noting that swimmers’ critical speed improved after the 6-week SIT period. Comparison of Pre vs. Post values indicated that performance time in the 4 × 50 m and 100 m tests as well as blood lactate concentration remained unchanged following the 6-week SIT period. Moreover, despite the fact that blood lactate in the 4 × 50 m testing session did not change in Post- vs. Pre-training measurements, it progressively increased in the 4 × 50 m front crawl training set applied in week 3 and week 5 compared to week 1. The performance time of the 4 × 50 m front crawl training set was unchanged throughout the 6-week training period.
Increased critical speed (4.4 ± 5.2%) was observed after the 6-week SIT period. This finding is in agreement with the respective findings reported for aerobic indices in water polo players after 8 weeks of repeated sprint interval training [12]. It is possible that swimmers’ aerobic endurance improvement can be attributed to an increase in oxidative enzyme activity [26,27], muscle buffering capacity [16], and ionic regulation [16]. However, BL was similar in Pre vs. Post testing after the 4 × 50 m testing session. The increased CS concomitant with the similar BL and HR may indicate that SIT led to the swimmer’s aerobic endurance improvement after the 6-week period. Moreover, Spencer et al. [28] observed that the energy supply of SIT requires adenosine triphosphate resynthesis from all energy systems. Therefore, a wide range of metabolic, aerobic, and anaerobic adaptations (see Figure 5) can be expected to result from such training [29]. Such changes are probably connected to the training load [30]. In the current study, we recorded 7–21% increments in training load during the 6-week SIT period. It is possible that the 18 SIT sessions applied during the 6-week period led to improved aerobic endurance faster than previous works [31,32], as reflected by the improvement in critical speed.

4.1. Comparisons of Performance and Physiological Variables before and after the Training Period

Irrespective of swimmers’ aerobic endurance improvement in the present study, performance time in 4 × 50 m and 100 m remained unchanged in Post- compared to Pre-testing procedures. This finding comes in contrast to the improved performance reported in previous studies [10,12,14,33,34]. It is possible that swimmers were more training-loaded in the Post-testing procedures due to the increased training load in week 6 compared to the training load that was recorded in the week before the beginning of the training period (see Figure 2).
However, a negative relationship was noticed between swimming time for the 4 × 50 m test and blood lactate concentration. This finding indicates that some of the swimmers who managed to swim faster in the 4 × 50 m Post-training testing session presented increased blood lactate concentration (Figure 7) despite the mean value being unchanged. It is likely that improved aerobic endurance, as indicated by the increased CS, allows better lactate removal. It is likely that swimmers were able to complete the high-intensity efforts during the 4 × 50 m front crawl test, increasing glycolytic contribution but without increasing fatigue. The latter may be confirmed by the similar DS observed Post-training compared to Pre-training and the similar perception of effort. Consequently, this connection of performance with higher blood lactate concentration may indicate a possible improvement in anaerobic metabolism [29]. Moreover, the similar RPE and heart rate values may indicate that swimmers managed to be more economical during the 4 × 50 m test after the 6-week training period. This occurred despite the imposed higher training load of the last week of training. It is possible that some physiological adaptations may occur after the 6-week training period, but more SIT sessions or a longer period of training (more than 6 weeks) may be required for performance or physiological changes.

4.2. Progression of Performance and Physiological Parameters during the Training Sessions

The performance time of the 4 × 50 m front crawl sprints during the 6-week period was not changed. This contrasts with studies that reported athletes’ performance improved after 2- [33] and 4-week SIT periods [34] in sports other than swimming. Healthy non-athletes participated in previous studies rather than the well-trained swimmers in the present study [34] and sprint duration may be a critical factor affecting the final outcome (i.e., 4 × 30 s with 4 min rest or 8 × 15 s with 2 min rest) [33]. Swimming studies highlighted performance improvements after 7- to 14-week periods [10,12,35]. However, swimmers performed different training protocols with the characteristics of ultra-short race pace (i.e., eight repetitions × 20 s) or high-intensity interval training (i.e., four repetitions × 4 min) [12,14,35] compared to the current study (four repetitions× 50 m starting every 2 min). Moreover, swimmers applied 2 × 4 × 50 m training sets three times per week. Despite the fact that this type of training is related to swimmers’ performance improvement in short-distance events [6,7,10], we found no performance improvement in the current study in the 4 × 50 m front crawl training set or in the 100 m test.
Despite the unaltered performance time in 4 × 50 m, this type of SIT (2 × 4 × 50 m) may be suitable for swimmers’ physiological adjustments. Specifically, swimmers managed to increase blood lactate concentration after week 3 and week 5 compared to week 1. This finding is in accordance with that reported in other studies [12,32]. Increments in swimmers’ blood lactate after 4 × 50 m may indicate a higher energy contribution from anaerobic metabolism [35]. It is likely that SIT leads to physiological adjustments related to anaerobic metabolism and possible increments in the activity of anaerobic enzymes such as phosphocreatine and lactate dehydrogenase [16,26,27,34].
However, there are some limitations in the current study that need to be mentioned. Swimmers performed the main training set (2 × 4 × 50 m) during the 6-week training competing in pairs, while in Pre and Post testing, the 4 × 50 m performance was evaluated for each swimmer separately. Therefore, a comparison of the variables recorded during the training set with those obtained Pre and Post the 6-week period is not appropriate. Moreover, both male and female swimmers participated in the current study and no control group was included. The sample size of the present study was moderate, which may reduce the statistical power and increase the margin of error [36]. As such, a higher sample size, a more homogenous group of participants, and a longer period of training may be required to induce changes in swimmers’ performance. Finally, we have only tested BL to examine possible changes in anaerobic metabolism; however, any contribution from phosphocreatine was not possible to examine. In addition, future studies may focus on the evolution of physiological changes by comparing different testing protocols.

5. Conclusions

The main findings of the present study indicate that swimmers’ critical speed increased while performance in 4 × 50 m and 100 m tests and blood lactate concentration remained unchanged after a 6-week SIT period. Moreover, swimmers managed to increase their blood lactate concentration during the 6-week SIT period without any difference in their performance time in the 4 × 50 m test. Our findings suggest that a 6-week SIT period may lead to improvements in swimmers’ aerobic and anaerobic ability.

Author Contributions

Conceptualization, G.G.A. and A.G.T.; methodology, G.G.A. and A.G.T.; software, G.G.A.; validation, A.G.T.; formal analysis, G.G.A.; investigation, G.G.A. and A.G.T.; resources, A.G.T.; data curation, G.G.A.; writing—original draft preparation, G.G.A. and A.G.T.; writing—review and editing, A.G.T.; visualization, G.G.A.; supervision, A.G.T.; project administration, A.G.T. All authors have read and agreed to the published version of the manuscript.

Funding

This research received no external funding.

Institutional Review Board Statement

The local institutional review board approved the experimental protocol (approved number: 04/11/2019, 1111), which conformed to the Helsinki Declaration.

Informed Consent Statement

Written informed consent has been obtained from the participants.

Data Availability Statement

The raw data supporting the conclusions of this article will be made available by the authors on request.

Acknowledgments

The authors would like to thank the swimmers for their participation in the study.

Conflicts of Interest

The authors declare no conflicts of interest, financial or otherwise.

References

  1. Trappe, S.W. Metabolic demands for swimming. In Biomechanics and Medicine in Swimming VII; Troup, J.P., Hollander, A.P., Strasse, D., Eds.; E & FN Spon: London, UK, 1996; pp. 127–134. [Google Scholar]
  2. Arsoniadis, G.G.; Nikitakis, I.S.; Botonis, P.G.; Malliaros, I.; Toubekis, A.G. Validating physiological and biomechanical parameters during intermittent swimming at speed corresponding to lactate concentration of 4 mmol·L−1. Sports 2020, 8, 23. [Google Scholar] [CrossRef]
  3. Pelarigo, G.J.; Greco, C.C.; Deanadai, B.S.; Fernandes, R.J.; Vilas-Boas, J.P.; Pendergast, D.R. Do 5% changes around maximal lactate steady state lead to swimming biophysical modifications? Hum. Mov. Sci. 2016, 49, 258–266. [Google Scholar] [CrossRef]
  4. Pelarigo, G.J.; Machado, L.; Fernandes, R.J.; Greco, C.C.; Vilas-Boas, J.P. Oxygen uptake kinetics and energy system’s contribution around maximal lactate steady state swimming intensity. PLoS ONE 2017, 12, e0167263. [Google Scholar] [CrossRef]
  5. Cuenca-Fernández, F.; Boullosa, D.; Ruiz-Navarro, J.J.; Gay, A.; Morales-Ortíz, E.; López-Contreras, G.; Arellano, R. Lower fatigue and faster recovery of ultra-short race pace swimming training sessions. Res. Sports Med. 2023, 31, 21–34. [Google Scholar] [CrossRef]
  6. Kabasakalis, A.; Nikolaidis, S.; Tsalis, G.; Mougios, V. Response of blood biomarkers to sprint interval swimming. Int. J. Sports Physiol. Perf. 2020, 15, 1442–1447. [Google Scholar] [CrossRef]
  7. Papadimitriou, K.; Kabasakalis, A.; Papadopoulos, A.; Mavridis, G.; Tsalis, G. Comparison of Ultra-Short Race Pace and High-Intensity Interval Training in Age Group Competitive Swimmers. Sports 2023, 11, 186. [Google Scholar] [CrossRef]
  8. Sloth, M.; Sloth, D.; Overgaard, K.; Dalgas, U. Effects of sprint interval training on VO2max and aerobic exercise performance: A systematic review and meta-analysis. Scand. J. Med. Sci. Sports 2013, 23, 341–352. [Google Scholar] [CrossRef] [PubMed]
  9. Schoenmakers, P.P.J.M.; Hettinga, F.J.; Reed, K.E. The moderating role of recovery durations in high-intensity interval-training protocols. Int. J. Sports Physiol. Perf. 2019, 14, 859–867. [Google Scholar] [CrossRef] [PubMed]
  10. Nugent, F.J.; Comyns, T.M.; Burrows, E.; Warrington, G.D. Effects of low volume, high-intensity training on performance in competitive swimmers: A systematic review. J. Strength Cond. Res. 2017, 31, 837–847. [Google Scholar] [CrossRef] [PubMed]
  11. Pla, R.; Le Meur, Y.; Aubry, A.; Toussaint, J.F.; Hellard, P. Effects of a 6-week period of polarized or threshold training on performance and fatigue in elite swimmers. Int. J. Sports Physiol. Perf. 2019, 14, 183–189. [Google Scholar] [CrossRef] [PubMed]
  12. Botonis, P.G.; Toubekis, A.G.; Terzis, G.D.; Geladas, N.D.; Platanou, T.I. Effects of Concurrent Strength and High-Intensity Interval Training on Fitness and Match Performance in Water-Polo Players. J. Hum. Kinet. 2019, 67, 175–184. [Google Scholar] [CrossRef]
  13. Pollock, S.; Gaoua, N.; Johnston, M.J.; Cooke, K.; Girard, O.; Mileva, K.N. Training regimes and recovery monitoring practices of elite British swimmers. J. Sports Sci. Med. 2019, 18, 577. [Google Scholar]
  14. Benítez-Flores, S.; Medeiros, A.R.; Voltarelli, F.A.; Iglesias-Soler, E.; Doma, K.; Simões, H.G.; Rosa, T.S.; Boullosa, D.A. Combined effects of very short “all out” efforts during sprint and resistance training on physical and physiological adaptations after 2 weeks of training. Eur. J. Appl. 2019, 119, 1337–1351. [Google Scholar] [CrossRef] [PubMed]
  15. Edge, J.; Bishop, D.; Goodman, C.; Dawson, B. Effects of High- and Moderate-Intensity Training on Metabolism and Repeated Sprints. Med. Sci. Sports Exerc. 2005, 37, 1975–1982. [Google Scholar] [CrossRef] [PubMed]
  16. Gibala, M.J.; Little, J.P.; Van Essen, M.; Wilkin, G.P.; Burgomaster, K.A.; Safdar, A.; Raha, S.; Tarnopolsky, M.A. Short-term sprint interval versus traditional endurance training: Similar initial adaptations in human skeletal muscle and exercise performance. J. Physiol. 2006, 575, 901–911. [Google Scholar] [CrossRef] [PubMed]
  17. Burgomaster, K.A.; Howarth, K.R.; Phillips, S.M.; Rakobowchuk, M.; MacDonald, M.J.; McGee, S.L.; Gibala, M.J. Similar metabolic adaptations during exercise after low volume sprint interval and traditional endurance training in humans. J. Physiol. 2008, 586, 151–160. [Google Scholar] [CrossRef]
  18. Zelt, J.G.; Hankinson, P.B.; Foster, W.S.; Williams, C.B.; Reynolds, J.; Garneys, E.; Tschakovsky, M.E.; Gurd, B.J. Reducing the volume of sprint interval training does not diminish maximal and submaximal performance gains in healthy men. Eur. J. Appl. Physiol. 2014, 114, 2427–2436. [Google Scholar] [CrossRef]
  19. Jackson, A.S.; Pollock, M.L. Generalized equations for predicting body density of men. Br. J. Nutr. 1978, 40, 497–504. [Google Scholar] [CrossRef]
  20. Toubekis, A.G.; Tokmakidis, S.P. Metabolic responses at various intensities relative to critical swimming velocity. J. Strength Cond. Res. 2013, 27, 1731–1741. [Google Scholar] [CrossRef]
  21. Borg, G.A.V. Psychophysical bases of perceived exertion. Med. Sci. Sports Exerc. 1982, 14, 377–381. [Google Scholar] [CrossRef]
  22. Wallace, L.K.; Slattery, K.M.; Coutts, A.J. The ecological validity and application of the session-RPE method for quantifying training loads in swimming. J. Strength Cond. Res. 2009, 23, 33–38. [Google Scholar] [CrossRef]
  23. Oliver, J.L. Is a fatigue index a worthwhile measure of repeated sprint ability? J. Sci. Med. Sport 2009, 12, 20–23. [Google Scholar] [CrossRef]
  24. Cohen, J. Statistical Power Analysis for the Behavioral Sciences, 2nd ed.; Routledge: London, UK, 1988. [Google Scholar]
  25. Faul, F.; Erdfelder, E.; Lang, A.G.; Buchner, A. G*Power 3: A flexible statistical power analysis program for the social, behavioral, and biomedical sciences. Behav. Res. Methods 2007, 39, 175–191. [Google Scholar] [CrossRef]
  26. Gibala, M.J.; McGee, S.L. Metabolic adaptations to short-term high-intensity interval training: A little pain for a lot of gain? Exerc. Sport Sci. Rev. 2008, 36, 58–63. [Google Scholar] [CrossRef]
  27. Burgomaster, K.A.; Hughes, S.C.; Heigenhauser, G.J.; Bradwell, S.N.; Gibala, M.J. Six sessions of sprint interval training increases muscle oxidative potential and cycle endurance capacity in humans. J. Appl. Physiol. 2005, 98, 1985–1990. [Google Scholar] [CrossRef]
  28. Spencer, M.; Bishop, D.; Dawson, B.; Goodman, C. Physiological and metabolic responses of repeated-sprint activities: Specific to field-based team sports. Sports Med. 2005, 35, 1025–1044. [Google Scholar] [CrossRef]
  29. Dawson, B.; Fitzsimons, M.; Green, S.; Goodman, C.; Carey, M.; Cole, K. Changes in performance, muscle metabolites, enzymes and fibre types after short sprint training. Eur. J. Appl. Physiol. Occup. Physiol. 1998, 78, 163–169. [Google Scholar] [CrossRef] [PubMed]
  30. Toubekis, A.G.; Drosou, E.; Gourgoulis, V.; Thomaidis, S.; Douda, H.; Tokmakidis, S.P. Competitive performance, training load and physiological responses during tapering in young swimmers. J. Hum. Kinet. 2013, 38, 125. [Google Scholar] [CrossRef] [PubMed]
  31. Bielec, G.; Makar, P.; Kujach, P.; Laskowski, R. Biomechanical and physiological effects of two-week sprint interval training in collegiate swimmers. Sci. Sports 2016, 31, e189–e192. [Google Scholar] [CrossRef]
  32. Dalamitros, A.A.; Zafeiridis, A.S.; Toubekis, A.G.; Tsalis, G.A.; Pelarigo, J.G.; Manou, V.; Kellis, S. Effects of short interval and long interval swimming protocols on performance, aerobic adaptations, and technical parameters: A training study. J. Strength Cond. Res. 2016, 30, 2871–2879. [Google Scholar] [CrossRef] [PubMed]
  33. McKie, G.L.; Islam, H.; Townsend, L.K.; Robertson-Wilson, J.; Eys, M.; Hazell, T.J. Modified sprint interval training protocols: Physiological and psychological responses to 4 weeks of training. Appl. Physiol. Nutr. Metab. 2018, 43, 595–601. [Google Scholar] [CrossRef] [PubMed]
  34. Nascimento, P.C.D.; Lucas, R.D.D.; Pupo, J.D.; Arins, F.B.; Castagna, C.; Guglielmo, L.G.A. Effects of four weeks of repeated sprint training on physiological indices in futsal players. Rev. Bras. Cineantrop. Des. Hum. 2015, 17, 91–103. [Google Scholar] [CrossRef]
  35. Costill, D.L.; Thomas, R.; Robergs, R.A.; Pascoe, D.; Lambert, C.; Barr, S.; Fink, W.J. Adaptations to swimming training: Influence of training volume. Med. Sci. Sports Exerc. 1991, 23, 371–377. [Google Scholar] [CrossRef]
  36. Suresh, K.P.; Chandrashekara, S. Sample size estimation and power analysis for clinical research studies. J. Hum. Reprod. Sci. 2012, 5, 7–13. [Google Scholar] [CrossRef] [PubMed]
Figure 1. Experimental design of the study.
Applsci 14 02097 g001
Figure 2. Training load calculated using the session rating of the perceived exertion method. The filled bar represents the weekly training load before the beginning of the sprint swimming training period, and open bars represent the weekly training load during the 6-week sprint swimming training period. * p < 0.05 compared to the week before the training period.
Applsci 14 02097 g002
Figure 3. Performance time recorded before (Pre) and after (Post) the sprint swimming training period. Panel (a): mean performance time recorded during the 4 × 50 m front crawl; panel (b): performance time recorded during the 100 m front crawl.
Applsci 14 02097 g003
Figure 4. Mean 4 × 50 m performance time recorded in the first set, panel (a) and decrement score (DS), panel (b), progression during the 6-week sprint swimming training period.
Applsci 14 02097 g004
Figure 5. Physiological variables following the 4 × 50 m front crawl training set during the 6-week sprint swimming training period. Panel (a): blood lactate concentration (BL); panel (b): heart rate (HR). * p < 0.05, all weeks compared to week 1.
Applsci 14 02097 g005
Figure 6. Evolution of the mean rating of perceived exertion (RPE) following the 4 × 50 m front crawl training set during the 6-week sprint swimming training period. * p < 0.05, weeks 3 to 6 compared to weeks 1 to 2.
Applsci 14 02097 g006
Figure 7. Correlations for Δ values of mean 4 × 50 m performance time and blood lactate concentration (BL), panel (a), and heart rate (HR), panel (b).
Applsci 14 02097 g007
Table 1. Anthropometrics and performance characteristics of the participants.
VariablesOverall (n = 8)
Age (years)16.7 ± 4.2
Body mass (kg)59.8 ± 12.2
Body height (cm)168.5 ± 12.1
Body mass index (kg/m2)17.3 ± 3.8
Body fat (%)17.6 ± 2.2
100 m front crawl performance time (s)67.3 ± 7.7
WA points (100 m front crawl)411.8 ± 104.9
Competitive training experience (years)7.6 ± 1.7
WA: World Aquatics.
Table 2. Training characteristics during the 6-week training period.
Training Characteristics Intervention Training Days Other Training Days
Warm-up 1000 m 1200 m
Intervention set 2 sets × 4 repetitions of 50 m (front crawl and preferred stroke, starting every 2 min with 5 min passive recovery between sets)-
Other training sets zone 1: 1000 mzone 1: 800–1000 m
zone 2: 600–1000 m
zone 3: 600–1000 m
Technique 800 m800–1000 m
Overall training volume3000 m3400–5200 m
Zone 1 corresponds to 95–97% of critical speed, zone 2 corresponds to 99–101% of critical speed, and zone 3 corresponds to 104–107% of critical speed.
Table 3. Anthropometric characteristics measured before (Pre) and after (Post) 6 weeks of sprint swimming training.
VariablesPrePostMean Difference; 95% CLEffect Size, dp
Body mass (kg)60.2 ± 12.559.9 ± 11.90.4 ± 2.6; −2.2 to 1.50.030.69
Body height (cm)168.5 ± 12.0169.3 ± 12.4−0.9 ± 1.5; −0.1 to 1.90.070.13
Body mass index (kg/m2) 20.9 ± 2.220.7 ± 1.80.2 ± 0.6; −0.1 to 1.90.120.34
Body fat (%)17.6 ± 2.216.6 ± 3.4 *0.9 ± 0.8; −1.5 to −0.40.280.00
95% CL: 95% confidence limits, * p < 0.05, Pre vs. Post values.
Table 4. Physiological variables measured before (Pre) and after (Post) the 6-week sprint swimming training period in the 4 × 50 m test.
VariablesPrePostMean Difference; 95% CLEffect Size, dp
BL (mmol/L)9.0 ± 2.37.8 ± 2.5−1.2 ± 4.1; −4.1 to 1.60.120.42
HR (b/min)179 ± 6175 ± 3 *−4 ± 5; −8 to 10.240.04
BL: blood lactate concentration, HR: heart rate, 95% CL: 95% confidence limits, * p < 0.05, Pre vs. Post values.
Disclaimer/Publisher’s Note: The statements, opinions and data contained in all publications are solely those of the individual author(s) and contributor(s) and not of MDPI and/or the editor(s). MDPI and/or the editor(s) disclaim responsibility for any injury to people or property resulting from any ideas, methods, instructions or products referred to in the content.