
Physical and Finite Element Models for Determining the Capacity and Failure Mechanism of Helical Piles Placed in Weak Soil


Abstract
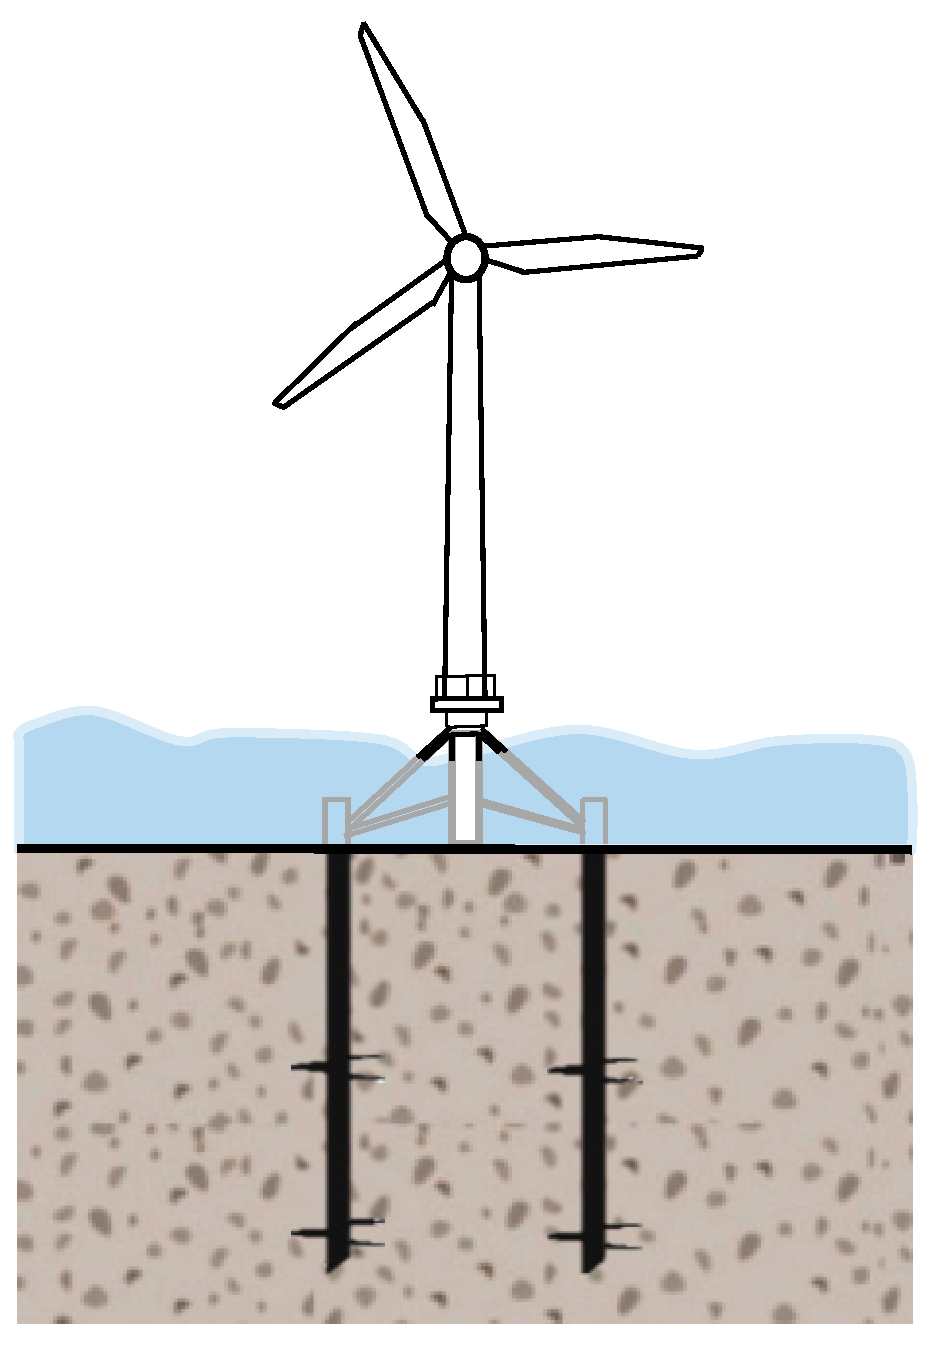
1. Introduction
2. Materials and Methods
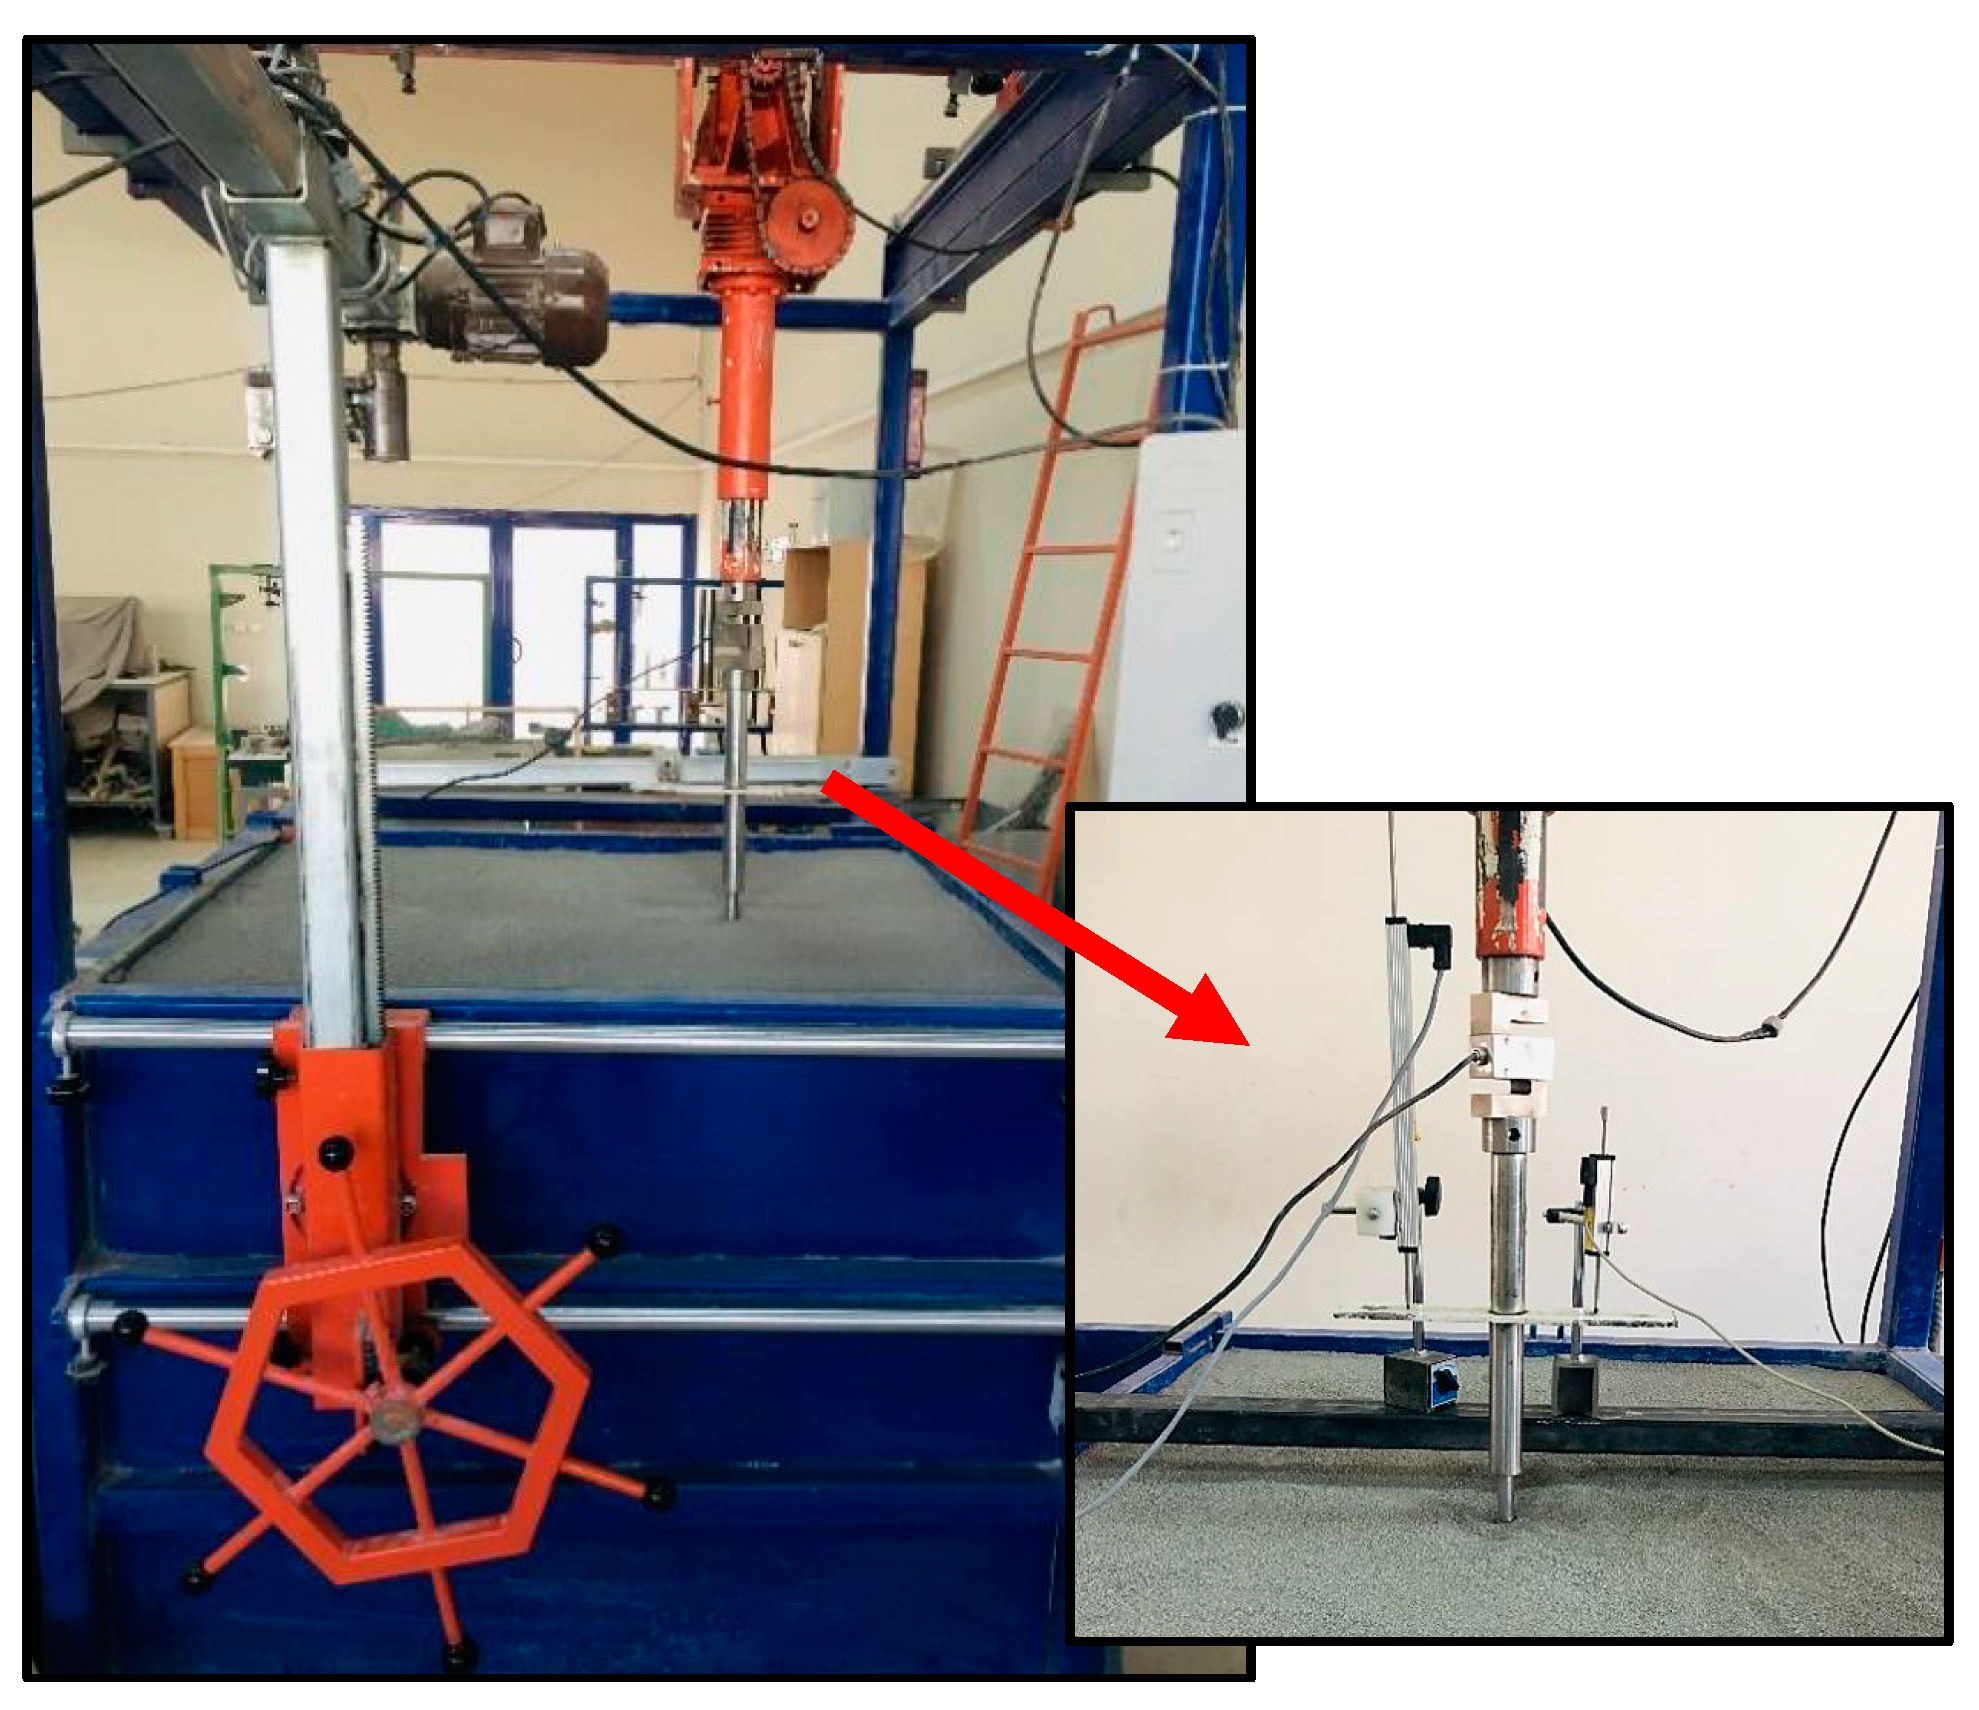
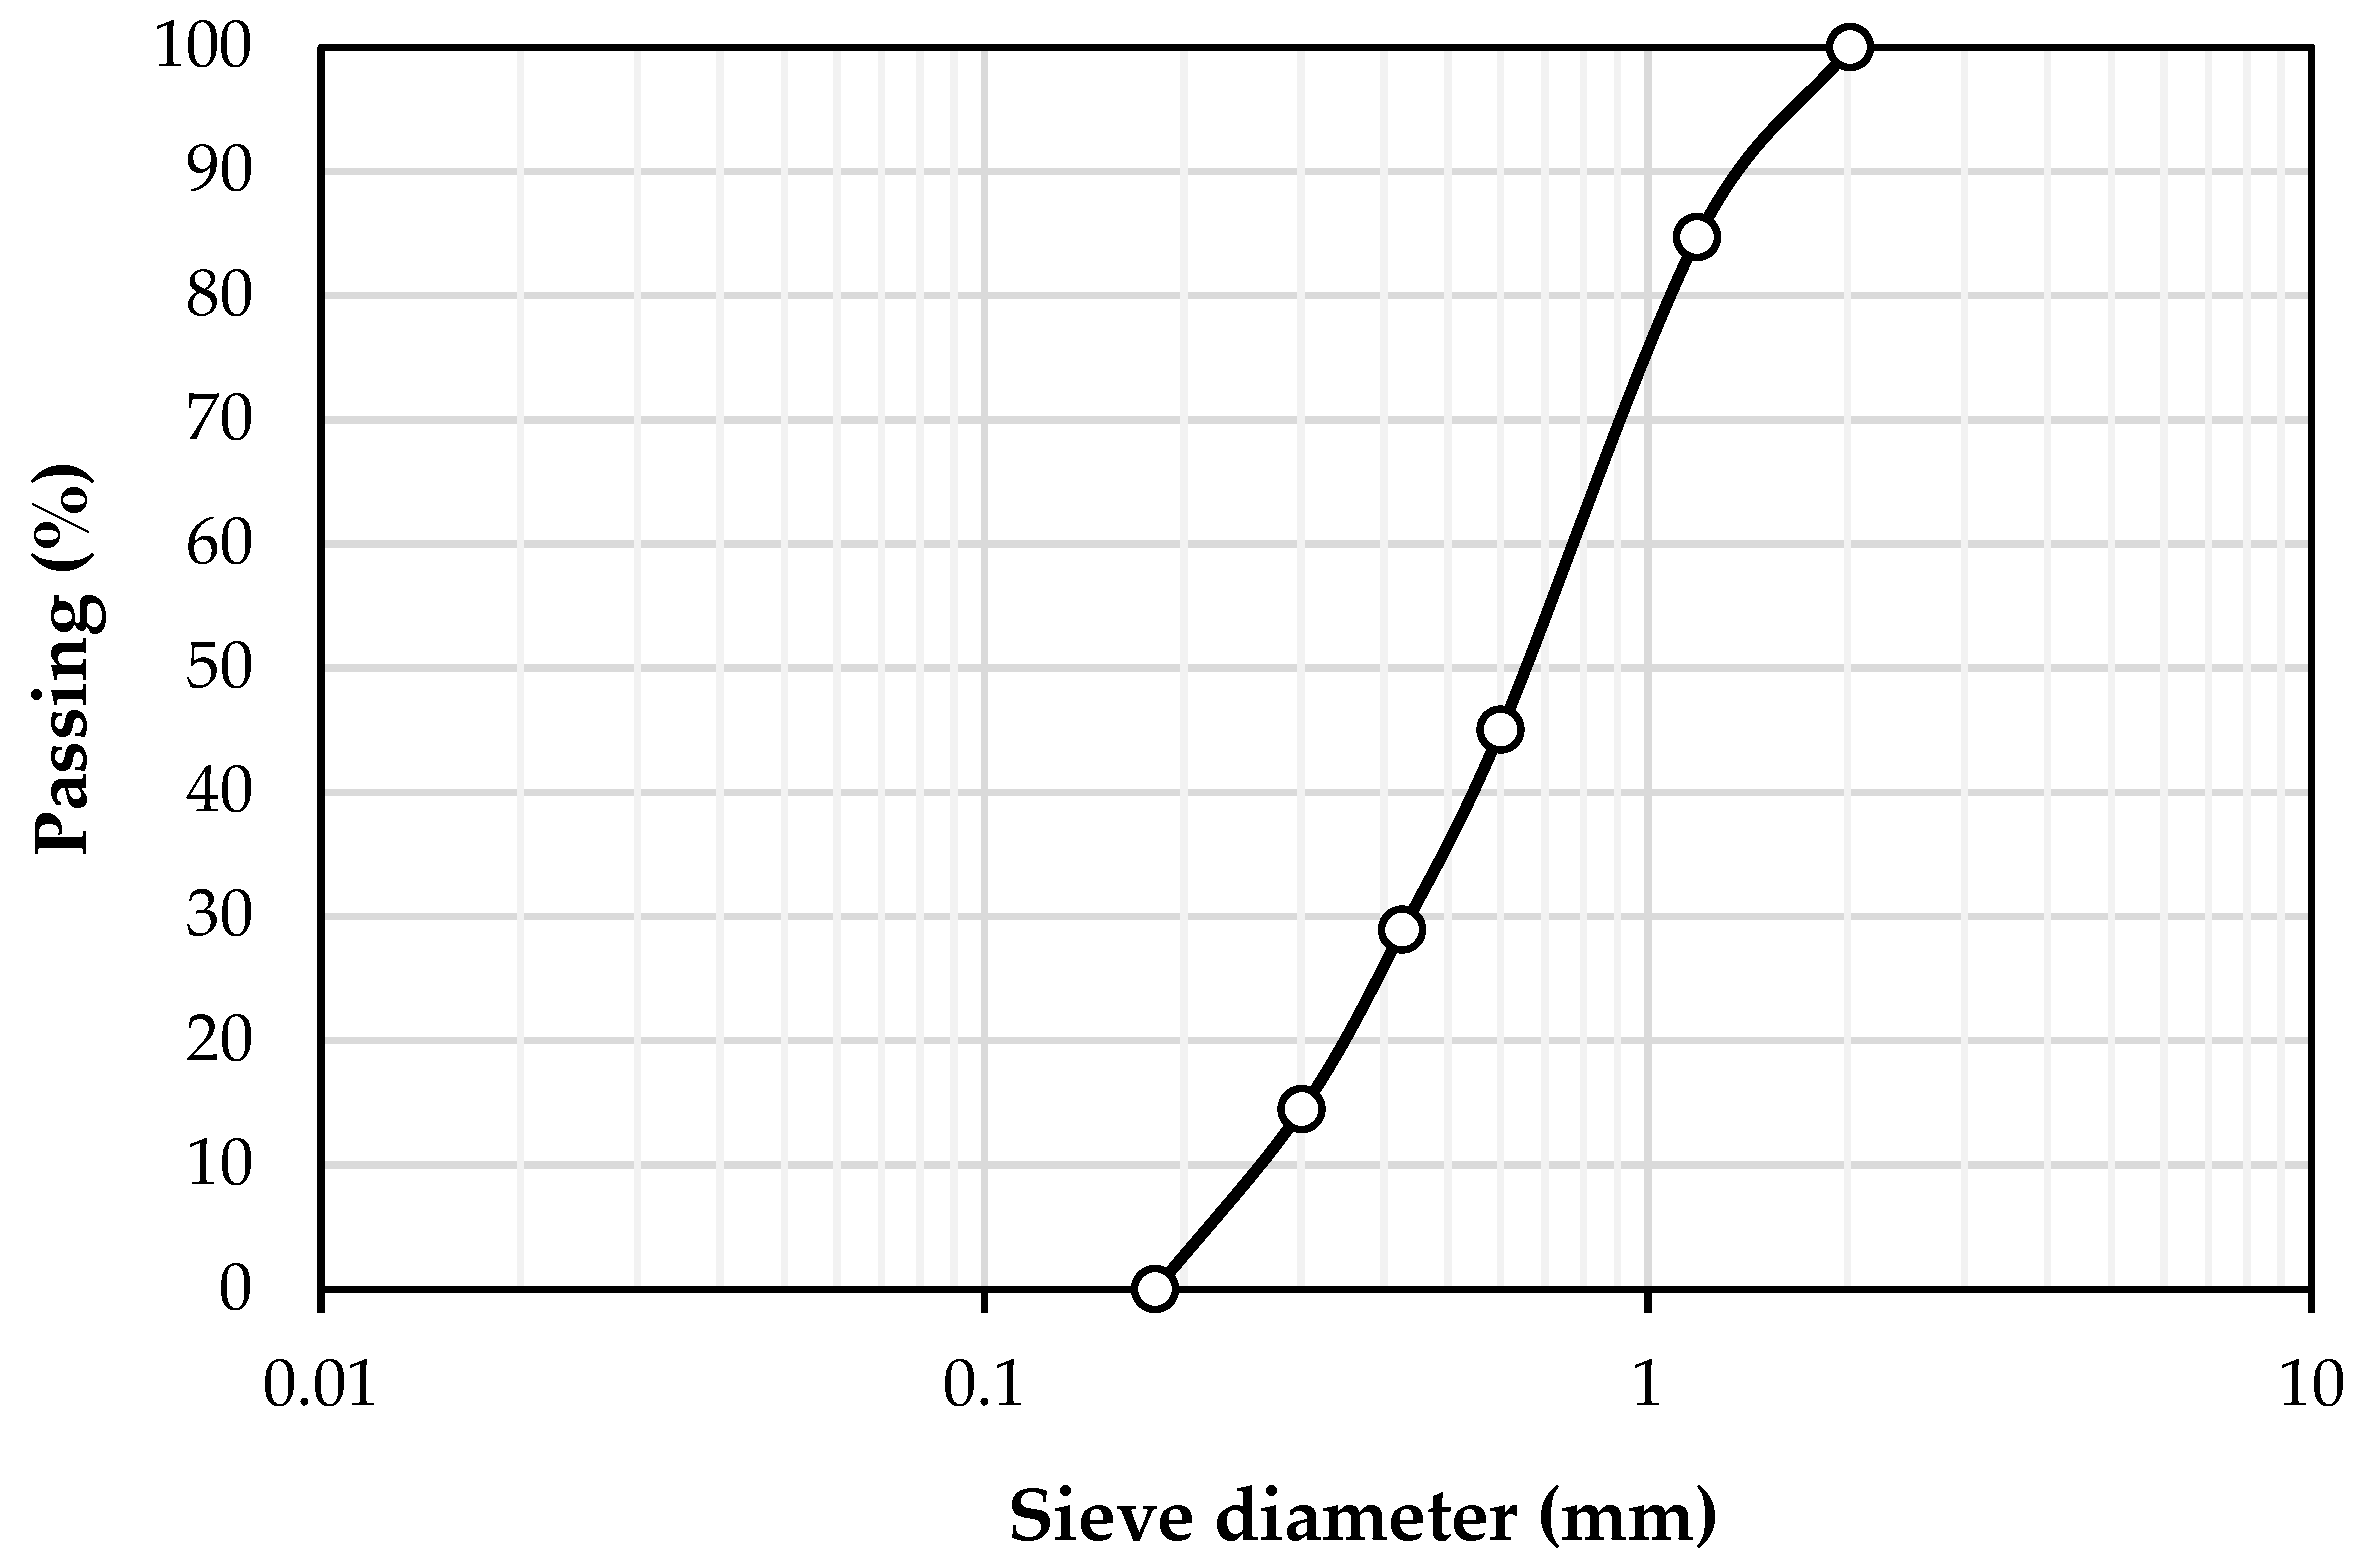
2.1. Physical Model Test
2.2. Finite Element Model
3. Findings and Discussion
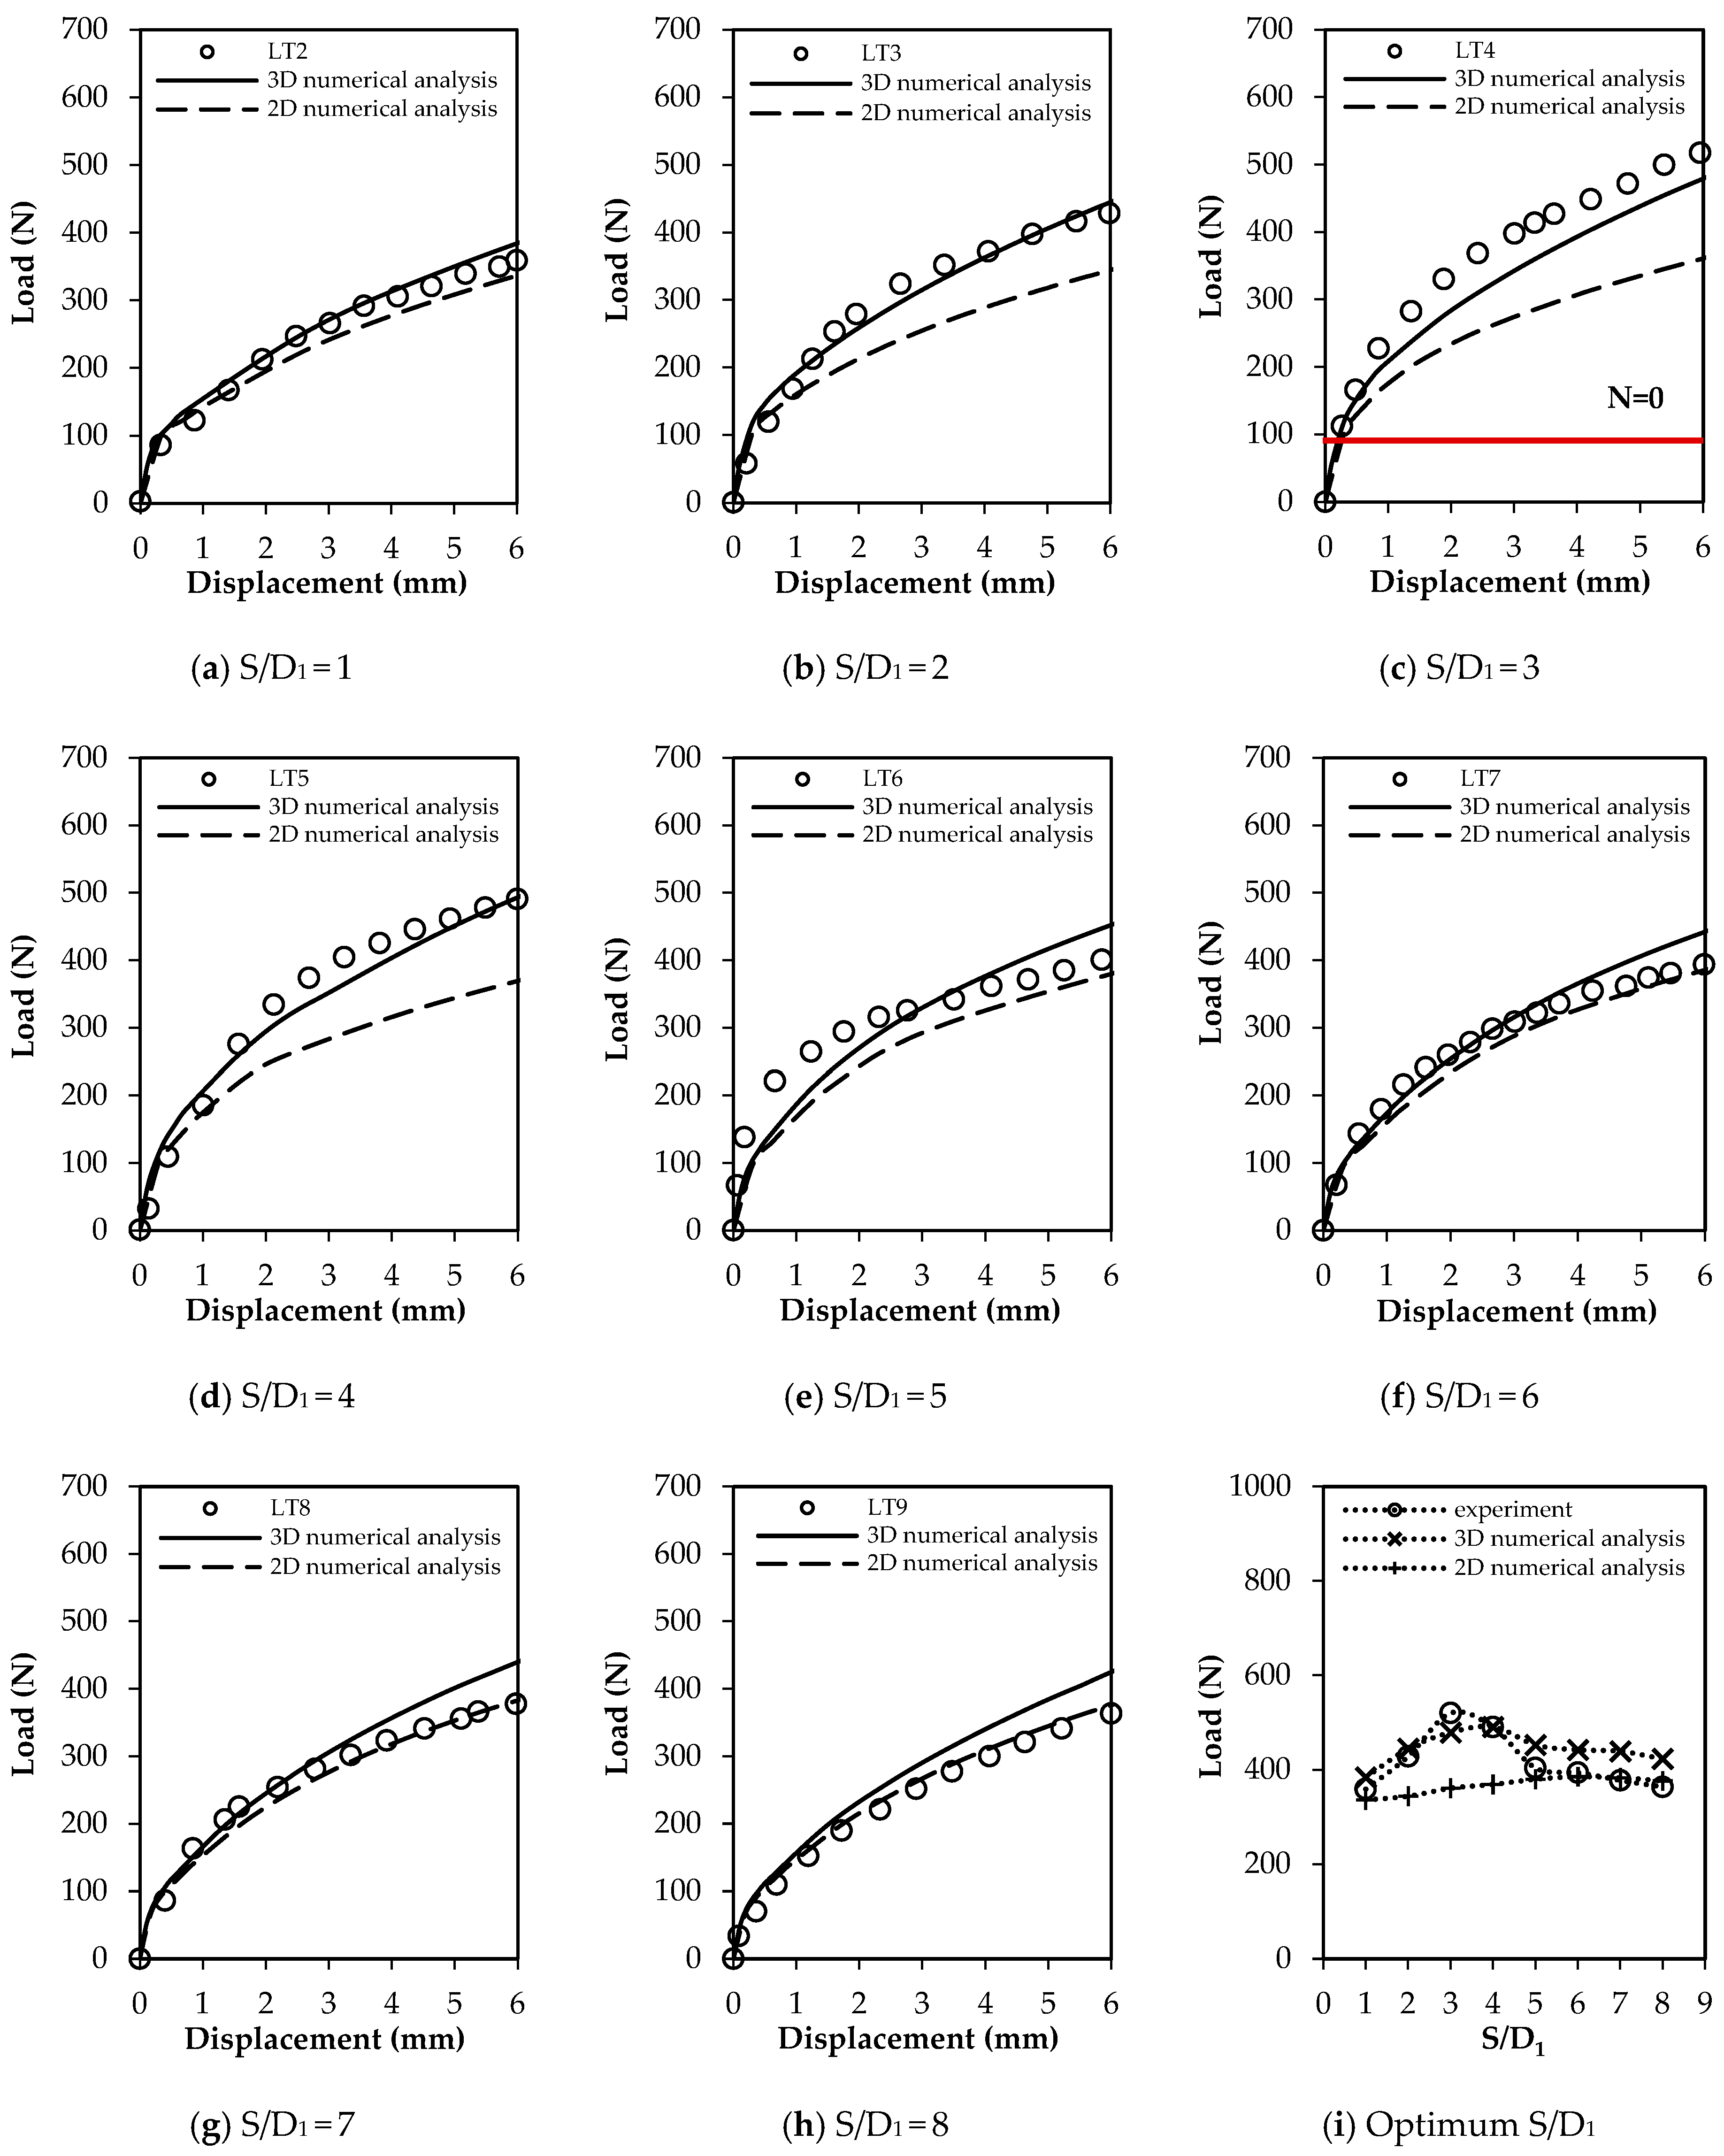
3.1. The Effect of the Distance between Helixes
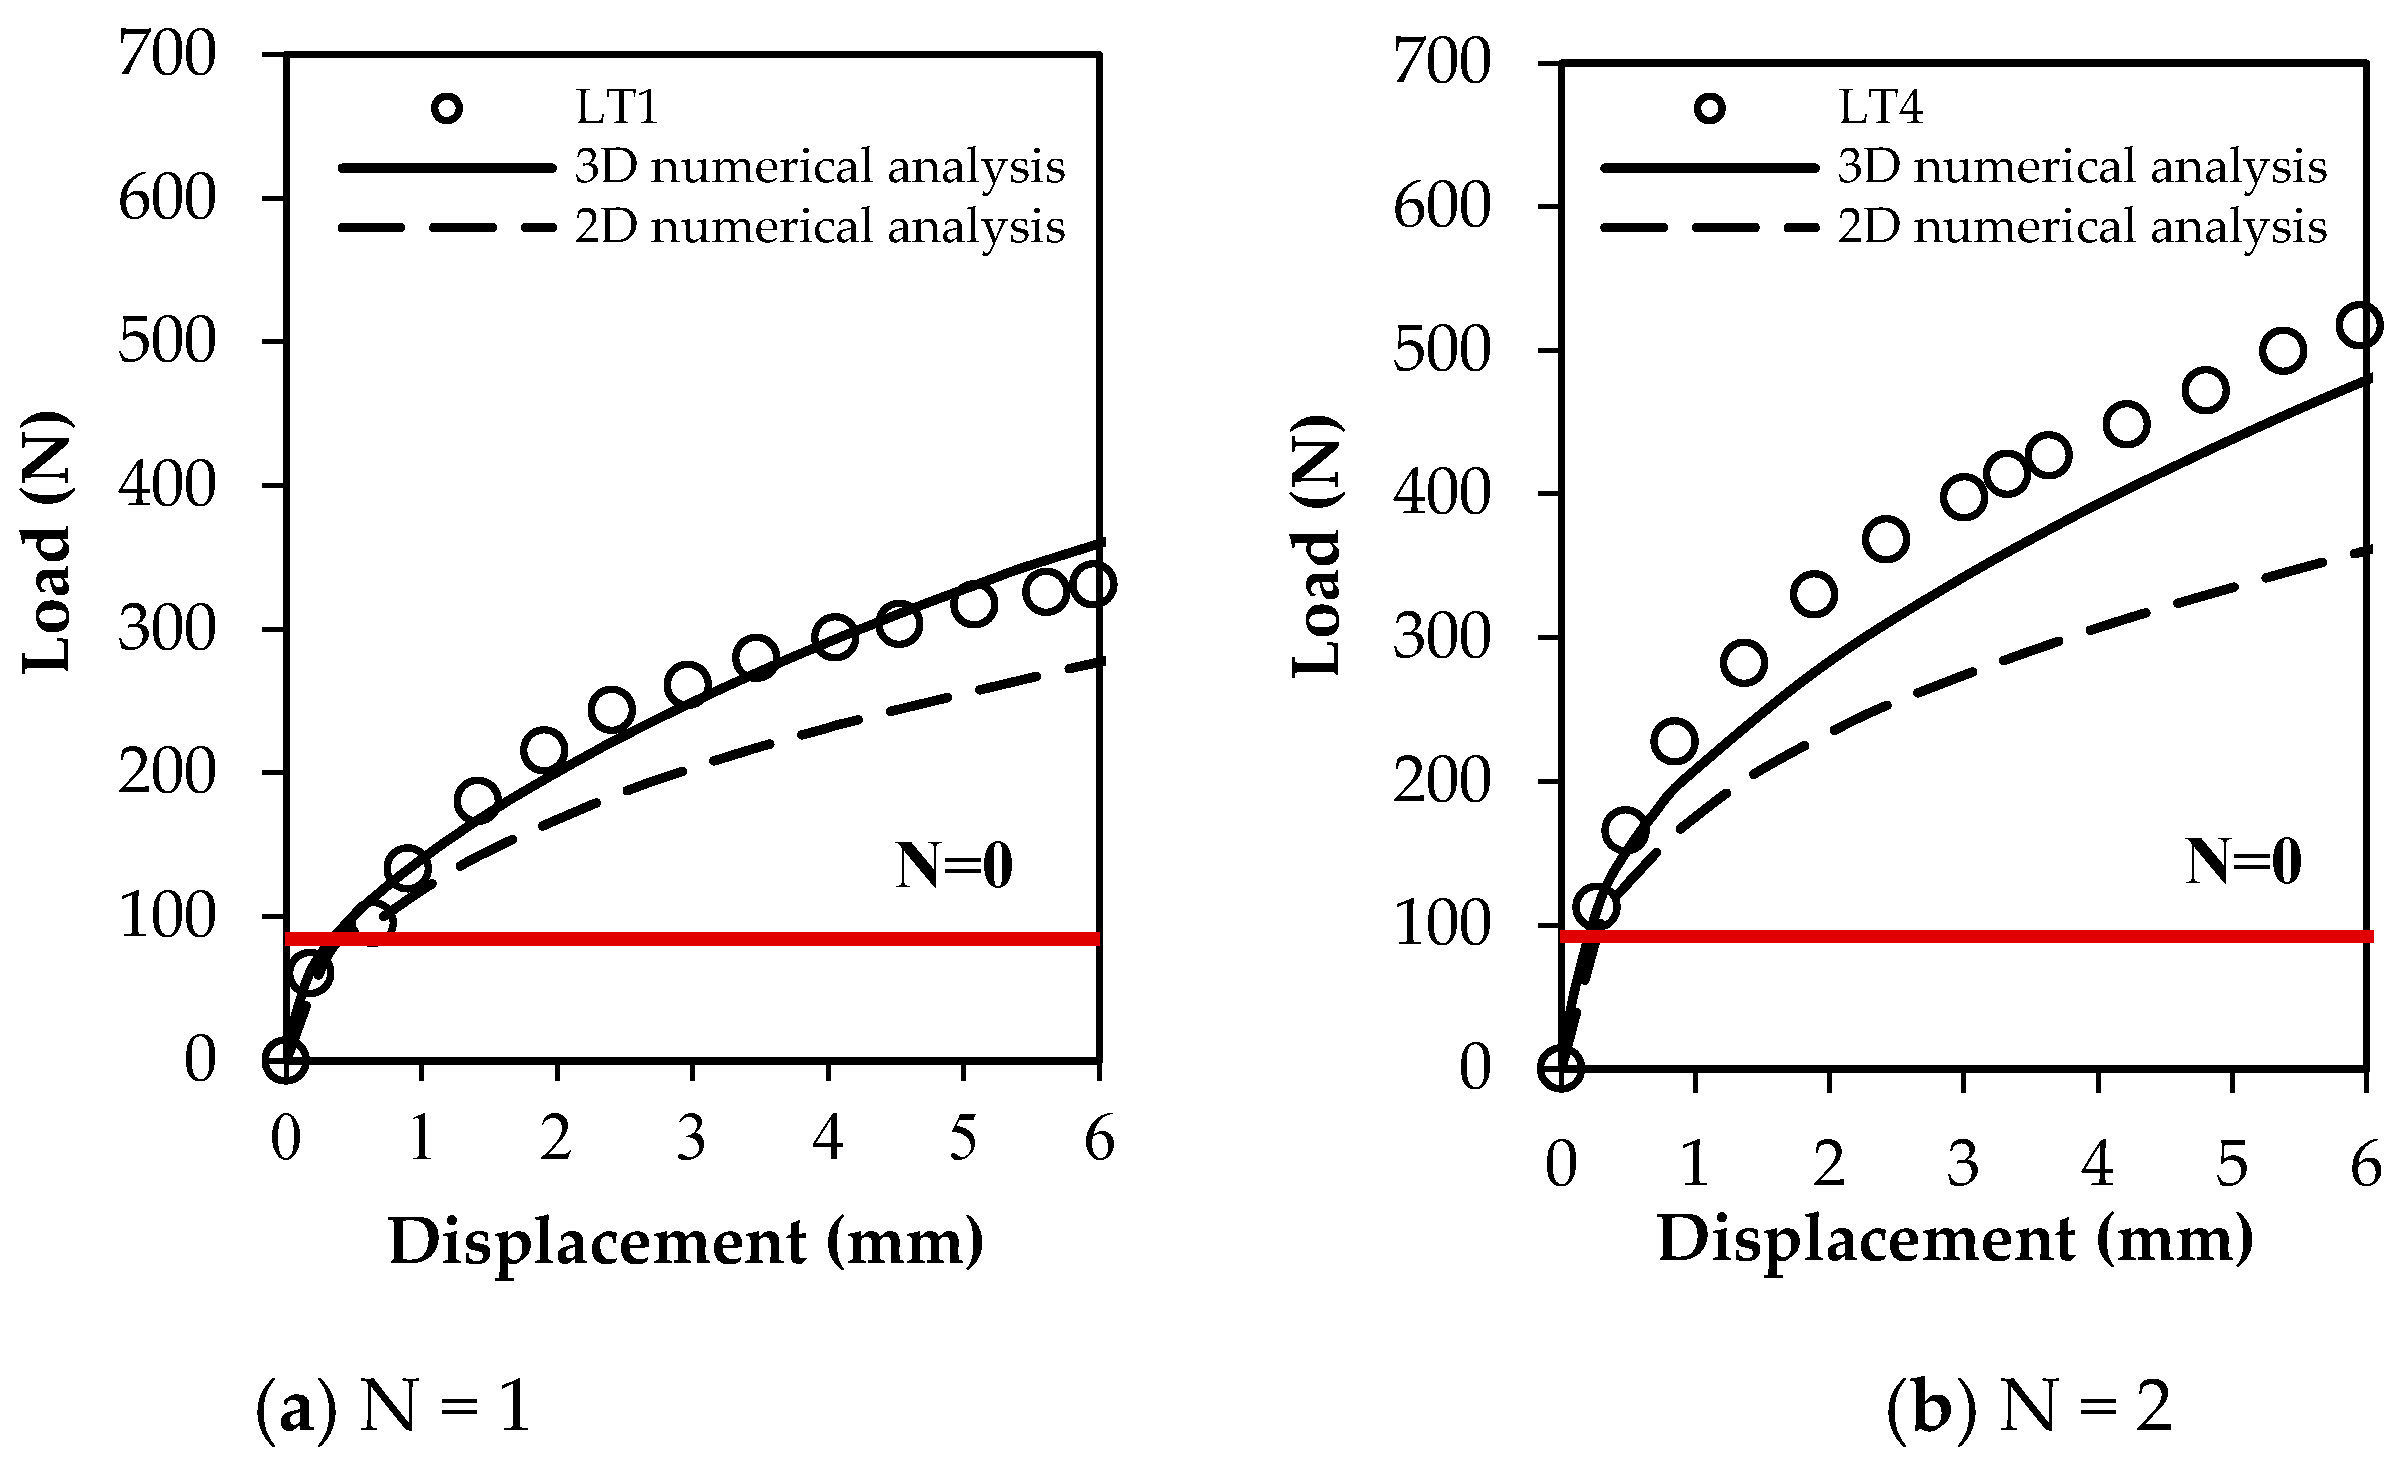
3.2. The Effect of the Number of Helixes
3.3. The Effect of the Upper Helix Diameter
4. Conclusions
- The Hardening Soil model employed successfully demonstrates the behavior of the helical pile placed in weak soil.
- The 3D finite element model is quite successful in replicating the behavior of helical piles but the 2D finite element model remains slightly less successful in reflecting the physical model test results.
- The distance between helixes is quite an important parameter, and the helical pile capacity increases as the distance between helixes increases until the S/D1 = 3–4.
- In the case of multiple helical piles, the buried depth of the upper helix should be selected as a value greater than 5D2.
- The displacement intensity in the cylindrical failure mechanism is more pronounced at S/D1 = 1. Also, at S/D1 = 3, the most intense zone is still around the helix, and this intensity around the helixes is preserved at all increasing spacing ratios. The interaction between the helixes decreases and the failure mechanism reaches the soil surface along with the spacing ratio of S/D1 = 4.
- The capacity of the helical pile increases with the increase in the number of helixes. At N = 2, the displacement intensity decreases significantly and drops by almost half compared to N = 1.
- With the increase in the diameter of the upper helix, the capacity of helical piles increases significantly.
- As the upper helix diameter increases, the increase in capacity is reflected in the failure mechanism as a decrease in displacement intensity. The increase in helix diameter causes a change in the failure mechanism behavior. As a result of this, the cylindrical formation changes to an hourglass appearance.
Funding
Institutional Review Board Statement
Informed Consent Statement
Data Availability Statement
Acknowledgments
Conflicts of Interest
References
- Lutenegger, A.J. Historical development of iron screw-pile foundations: 1836–1900. Int. J. Hist. Eng. Technol. 2011, 81, 108–128. [Google Scholar] [CrossRef]
- Tsuha, C.H.C.; Aoki, N.; Rault, G.; Thorel, L.; Garnier, J. Evaluation of the efficiencies of helical anchor plates in sand by centrifuge model tests. Can. Geotech. J. 2012, 49, 1102–1114. [Google Scholar] [CrossRef]
- Nazir, R.; Chuan, H.S.; Niroumand, H.; Kassim, K.A. Performance of single vertical helical anchor embedded in dry sand. Measurement 2013, 49, 42–51. [Google Scholar] [CrossRef]
- Sakr, M.A.; Nazir, A.K.; Azzam, W.R.; Sallam, A.F. Behavior of grouted single screw piles under inclined tensile loads in sand. Electron. J. Geotech. Eng. 2016, 21, 571–591. [Google Scholar]
- Cortes Garcia, L.D. Assessment of Helical Anchors Bearing Capacity for Offshore Aquaculture Applications. Master’s Thesis, University of Maine, Orono, ME, USA, 2019. [Google Scholar]
- Conte, E.; Pugliese, L.; Troncone, A.; Vena, M. A simple approach for evaluating the bearing capacity of piles subjected to inclined loads. Int. J. Geomech. 2021, 21, 04021224. [Google Scholar] [CrossRef]
- Li, Z.; Zhao, J.; Liu, T.; Guan, C.; Liu, Y.; Zhu, W.; Liu, L. Capacity change of piles in loess under cyclic axial tension or compression load. Int. J. Geomech. 2023, 23, 04023182. [Google Scholar] [CrossRef]
- Han, M.; Jia, J.; Li, Z.; Zhu, Z.; Tu, B.; Liu, L. Improved analytical method for stabilizing piles in loess slope considering nonlinear pile-soil interactions. Int. J. Geomech. 2024, 24, 04024002. [Google Scholar] [CrossRef]
- Spagnoli, G.; Gavin, K.; Brangan, C.; Bauer, S. In situ and laboratory tests in dense sand investigating the helix-to-shaft ratio of helical piles as a novel offshore foundation system. In Frontiers in Offshore Geotechnics III, 1st ed.; Meyer, V., Ed.; CRC Press/Balkema: Leiden, The Netherlands, 2015; Volume 1, pp. 643–648. [Google Scholar]
- Pavan Kumar, P.V.; Patra, S.; Haldar, S. Behaviour of screw pile under axial compressive and lateral loading in sand for offshore energy foundations. In Advances in Offshore Geotechnics: Proceedings of ISOG2019, 1st ed.; Haldar, S., Patra, S., Ghanekar, R.K., Eds.; Springer: Singapore, 2020; Volume 92, pp. 393–403. [Google Scholar]
- Livneh, B.; El Naggar, M.H. Axial testing and numerical modeling of square shaft helical piles under compressive and tensile loading. Can. Geotech. J. 2008, 45, 1142–1155. [Google Scholar] [CrossRef]
- Demir, A.; Ok, B. Uplift response of multi-plate helical anchors in cohesive soil. Geomech. Eng. 2015, 8, 615–630. [Google Scholar] [CrossRef]
- Harnish, J.L. Helical Pile Installation Torque and Capacity Correlations. Master’s Thesis, Western University, London, ON, Canada, 2015. [Google Scholar]
- Mohajerani, A.; Bosnjak, D.; Bromwich, D. Analysis and design methods of screw piles: A review. Soils Found. 2016, 56, 115–128. [Google Scholar] [CrossRef]
- Rawat, S.; Gupta, A.K. Numerical modelling of pullout of helical soil nail. J. Rock Mech. Geotech. Eng. 2017, 9, 648–658. [Google Scholar] [CrossRef]
- Khaleel, O.B. Pull-out Capacity of Double-Helix Screw Pile in Organic Soil. Master’s Thesis, Gaziantep University, Gaziantep, Türkiye, 2018. [Google Scholar]
- Vignesh, V.; Muthukumar, M. Experimental and numerical study of group effect on the behavior of helical piles in soft clays under uplift and lateral loading. Ocean. Eng. 2023, 268, 113500. [Google Scholar] [CrossRef]
- Huang, Y.; Mu, L.; Wang, P. Three-dimensional finite element analysis for uplifting independent helix plate anchor in uniform clay. Ocean. Eng. 2023, 285, 115455. [Google Scholar] [CrossRef]
- Venkatesan, V.; Mayakrishnan, M. Behavior of mono helical pile foundation in clays under combined uplift and lateral loading conditions. Appl. Sci. 2022, 12, 6827. [Google Scholar] [CrossRef]
- Sprince, A.; Pakrastinsh, L. Helical Pile Behaviour and Load Transfer Mechanism in Different Soils. In Proceedings of the 10th International Conference Modern Building Materials, Structures and Techniques, Vilnius, Lithuania, 19–21 May 2010. [Google Scholar]
- Elsherbiny, Z.H.; El Naggar, M.H. Axial compressive capacity of helical piles from field tests and numerical study. Can. Geotech. J. 2013, 50, 1191–1203. [Google Scholar] [CrossRef]
- Salhi, L.; Nait-Rabah, O.; Deyrat, C.; Roos, C. Numerical modeling of single helical pile behavior under compressive loading in sand. Electron. J. Geotech. Eng. 2013, 18, 4319–4338. [Google Scholar]
- Gavin, K.; Doherty, P.; Tolooiyan, A. Field investigation of the axial resistance of helical piles in dense sand. Can. Geotech. J. 2014, 51, 1343–1354. [Google Scholar] [CrossRef]
- Polishchuk, A.I.; Maksimov, F.A. Numerical Analysis of Helical Pile-Soil Interaction under Compressive Loads. IOP Conf. Ser. Mater. Sci. Eng. 2017, 262, 012099. [Google Scholar] [CrossRef]
- Bak, H.M.; Halabian, A.M.; Hashemolhosseini, H.; Rowshanzamir, M. Axial response and material efficiency of tapered helical piles. J. Rock Mech. Geotech. Eng. 2021, 13, 176–187. [Google Scholar] [CrossRef]
- Nowkandeh, M.J.; Choobbasti, A.J. Numerical study of single helical piles and helical pile groups under compressive loading in cohesive and cohesionless soils. Bull. Eng. Geol. Environ. 2021, 80, 4001–4023. [Google Scholar] [CrossRef]
- Shao, K.; Su, Q.; Liu, J.; Liu, K.; Xiong, Z.; Wang, T. Optimization of inter-helix spacing for helical piles in sand. J. Rock Mech. Geotech. Eng. 2022, 14, 936–952. [Google Scholar] [CrossRef]
- Zhuang, X.; Zong, Z.; Huang, Y.; Wang, C.; Lin, X. Parametric study on analyzing the effect of soil-cement strength on the uplifting behavior of HSCM piles installed in marine soft clay. Appl. Sci. 2023, 13, 330. [Google Scholar] [CrossRef]
- Narasimha Rao, S.; Prasad, Y.V.S.N.; Shetty, D. The behaviour of model screw piles in cohesive soils. Soils Found. 1991, 31, 35–50. [Google Scholar]
- Perko, H.A. Helical Piles: A Practical Guide to Design and Installation, 1st ed.; John Wiley & Sons: Hoboken, NJ, USA, 2009; pp. 1–528. [Google Scholar]
- Ha, T.S.; Moon, H.R.; Moon, H.M. An Analysis of Correlation between Predicted and Measured Bearing Capacity in Rotary (Helical) Pile Method. In Proceedings of the KGS Fall National Conference, Seoul, Republic of Korea, 17 October 2013. [Google Scholar]
- Ding, H.; Wang, L.; Zhang, P.; Liang, Y.; Tian, Y.; Qi, X. The recycling torque of a single-plate helical pile for offshore wind turbines in dense sand. Appl. Sci. 2019, 9, 4105. [Google Scholar] [CrossRef]
- Asakereh, A.; Ghazavi, M.; Moghaddas Tafreshi, S.N. Cyclic response of footing on geogrid-reinforced sand with void. Soils Found. 2013, 53, 363–374. [Google Scholar] [CrossRef]
- ASTM D2487-11; Standard Practice for Classification of Soils for Engineering Purposes (Unified Soil Classification System). ASTM International: West Conshohocken, PA, USA, 2011.
- ASTM D4253-16; Standard Test Methods for Maximum Index Density and Unit Weight of Soils Using a Vibratory Table. ASTM International: West Conshohocken, PA, USA, 2016.
- ASTM D4254-16; Standard Test Methods for Minimum Index Density and Unit Weight of Soils and Calculation of Relative Density. ASTM International: West Conshohocken, PA, USA, 2016.
- PLAXIS 2D, PLAXIS 2D Version 2023.2; Plaxis-Bentley Systems: Delft, The Netherlands, 2023.
- PLAXIS 3D, PLAXIS 3D Version 2023.2; Plaxis-Bentley Systems: Delft, The Netherlands, 2023.
- Zhang, W.; Gu, X.; Ou, Q. Bearing capacity and failure mechanism of strip footings lying on slopes subjected to various rainfall patterns and intensities. Geol. J. 2023; in press. [Google Scholar] [CrossRef]
- Zhang, W.; Li, Y.; Goh, A.T.C.; Zhang, R. Numerical study of the performance of jet grout piles for braced excavations in soft clay. Comput. Geotech. 2020, 124, 103631. [Google Scholar] [CrossRef]
- Emirler, B.; Tolun, M.; Yildiz, A. Investigation on determining uplift capacity and failure mechanism of the pile groups in sand. Ocean. Eng. 2020, 218, 108145. [Google Scholar] [CrossRef]
- Schanz, T. Zur Modellierung des Mechanischen Verhaltens von Reibungsmaterialien. Master’s Thesis, Institut für Geotechnik-Universität Stuttgart, Stuttgart, Germany, 1998. (In German). [Google Scholar]
- Çelik, S. Comparison of Mohr-Coulomb and Hardening Soil models’ numerical estimation of ground surface settlement caused by tunneling. Iğdır Univ. J. Inst. Sci. Technol. 2017, 7, 95–102. [Google Scholar] [CrossRef]
- Lv, Y.; Liu, H.; Ng, C.W.W.; Ding, X.; Gunawan, A. Three-dimensional numerical analysis of the stress transfer mechanism of XCC piled raft foundation. Comput. Geotech. 2014, 55, 365–377. [Google Scholar] [CrossRef]
- SOLIDWORKS; SOLIDWORKS 2016; Dassault Systèmes: Waltham, MA, USA, 2015.
- Liu, W.; Liang, J.; Xu, T. Tunnelling-induced ground deformation subjected to the behavior of tail grouting materials. Tunn. Undergr. Space Technol. 2023, 140, 105253. [Google Scholar] [CrossRef]
- Hubbell Power Systems. Technical Design Manual Edition 3: Bulletin 01-0605; Hubbell Power Systems, Inc.: Centralia, MO, USA, 2014. [Google Scholar]
- AC358; Acceptance Criteria for Helical Foundation Systems and Devices. ICC Evaluation Service: Brea, CA, USA, 2007.
- Mitsch, M.P.; Clemence, S.P. Uplift capacity of helix anchors in sand. In Uplift Behavior of Anchor Foundations in Soil: Proceedings of a Session Held in Conjunction with the ASCE Convention, 1st ed.; Clemence, S.P., Ed.; ASCE: New York, NY, USA, 1985; pp. 26–47. [Google Scholar]
- Ghaly, A.; Hanna, A.; Hanna, M. Uplift behavior of screw anchors in sand. I: Dry sand. J. Geotech. Eng. 1991, 117, 773–793. [Google Scholar] [CrossRef]
- Narasimha Rao, S.; Prasad, Y.V.S.N.; Veeresh, C. Behaviour of embedded model screw anchors in soft clays. Géotechnique 1993, 43, 605–614. [Google Scholar]


| Test No. | Lower Helix Diameter D1 (mm) | Upper Helix Diameter D2 (mm) | Number of Helixes N | S/D1 |  |
| LT0 | Straight pile (only shaft) | - | - | ||
| LT1 | 60 | - | 1 | - | |
| LT2 | 60 | 60 | 2 | 1 | |
| LT3 | 2 | ||||
| LT4 | 3 * | ||||
| LT5 | 4 | ||||
| LT6 | 5 | ||||
| LT7 | 6 | ||||
| LT8 | 7 | ||||
| LT9 | 8 | ||||
| LT10 | 60 | 80 | |||
| LT11 | 100 | 2 | 3 | ||
| LT12 | 120 | ||||
| Parameters | Values |
| Effective grain size, D10 (mm) | 0.26 |
| D30 (mm) | 0.44 |
| D60 (mm) | 0.78 |
| Coefficient of uniformity, Cu | 2.97 |
| Coefficient of curvature, Cc | 0.96 |
| Soil class (USCS) | SP |
| Parameters | Values |
|---|---|
| Soil | |
| Material model | Hardening Soil |
| Drainage type | Drained |
| Unit weight above phreatic level, γunsat (kN/m3) | 15.2 |
| Unit weight below phreatic level, γsat (kN/m3) | 18.0 |
| (kN/m2) | 9000 |
| (kN/m2) | 9000 |
| (kN/m2) | 27,000 |
| Power, m | 0.68 |
| Poisson’s ratio, v | 0.3 |
| Friction angle, ϕ (°) | 30 |
| Dilatancy angle, Ψ (°) | 0 |
| Failure ratio, Rf | 0.99 |
| Strength reduction factor, Rinter | 0.4 |
| Pile | |
| Thickness, d (mm) | 2.5 |
| Unit weight, γ (kN/m3) | 77 |
| Young’s modulus, E (kN/m2) | 2.1 × 10⁸ |
| Poisson’s ratio, v | 0.3 |
Disclaimer/Publisher’s Note: The statements, opinions and data contained in all publications are solely those of the individual author(s) and contributor(s) and not of MDPI and/or the editor(s). MDPI and/or the editor(s) disclaim responsibility for any injury to people or property resulting from any ideas, methods, instructions or products referred to in the content. |
© 2024 by the author. Licensee MDPI, Basel, Switzerland. This article is an open access article distributed under the terms and conditions of the Creative Commons Attribution (CC BY) license (https://creativecommons.org/licenses/by/4.0/).
Share and Cite
Emirler, B. Physical and Finite Element Models for Determining the Capacity and Failure Mechanism of Helical Piles Placed in Weak Soil. Appl. Sci. 2024, 14, 2389. https://doi.org/10.3390/app14062389
Emirler B. Physical and Finite Element Models for Determining the Capacity and Failure Mechanism of Helical Piles Placed in Weak Soil. Applied Sciences. 2024; 14(6):2389. https://doi.org/10.3390/app14062389
Chicago/Turabian StyleEmirler, Buse. 2024. "Physical and Finite Element Models for Determining the Capacity and Failure Mechanism of Helical Piles Placed in Weak Soil" Applied Sciences 14, no. 6: 2389. https://doi.org/10.3390/app14062389
APA StyleEmirler, B. (2024). Physical and Finite Element Models for Determining the Capacity and Failure Mechanism of Helical Piles Placed in Weak Soil. Applied Sciences, 14(6), 2389. https://doi.org/10.3390/app14062389