


Numerical Simulation of Surface Subsidence and Fracture Evolution Caused by Pulang Copper Mine Mining


Abstract
1. Introduction
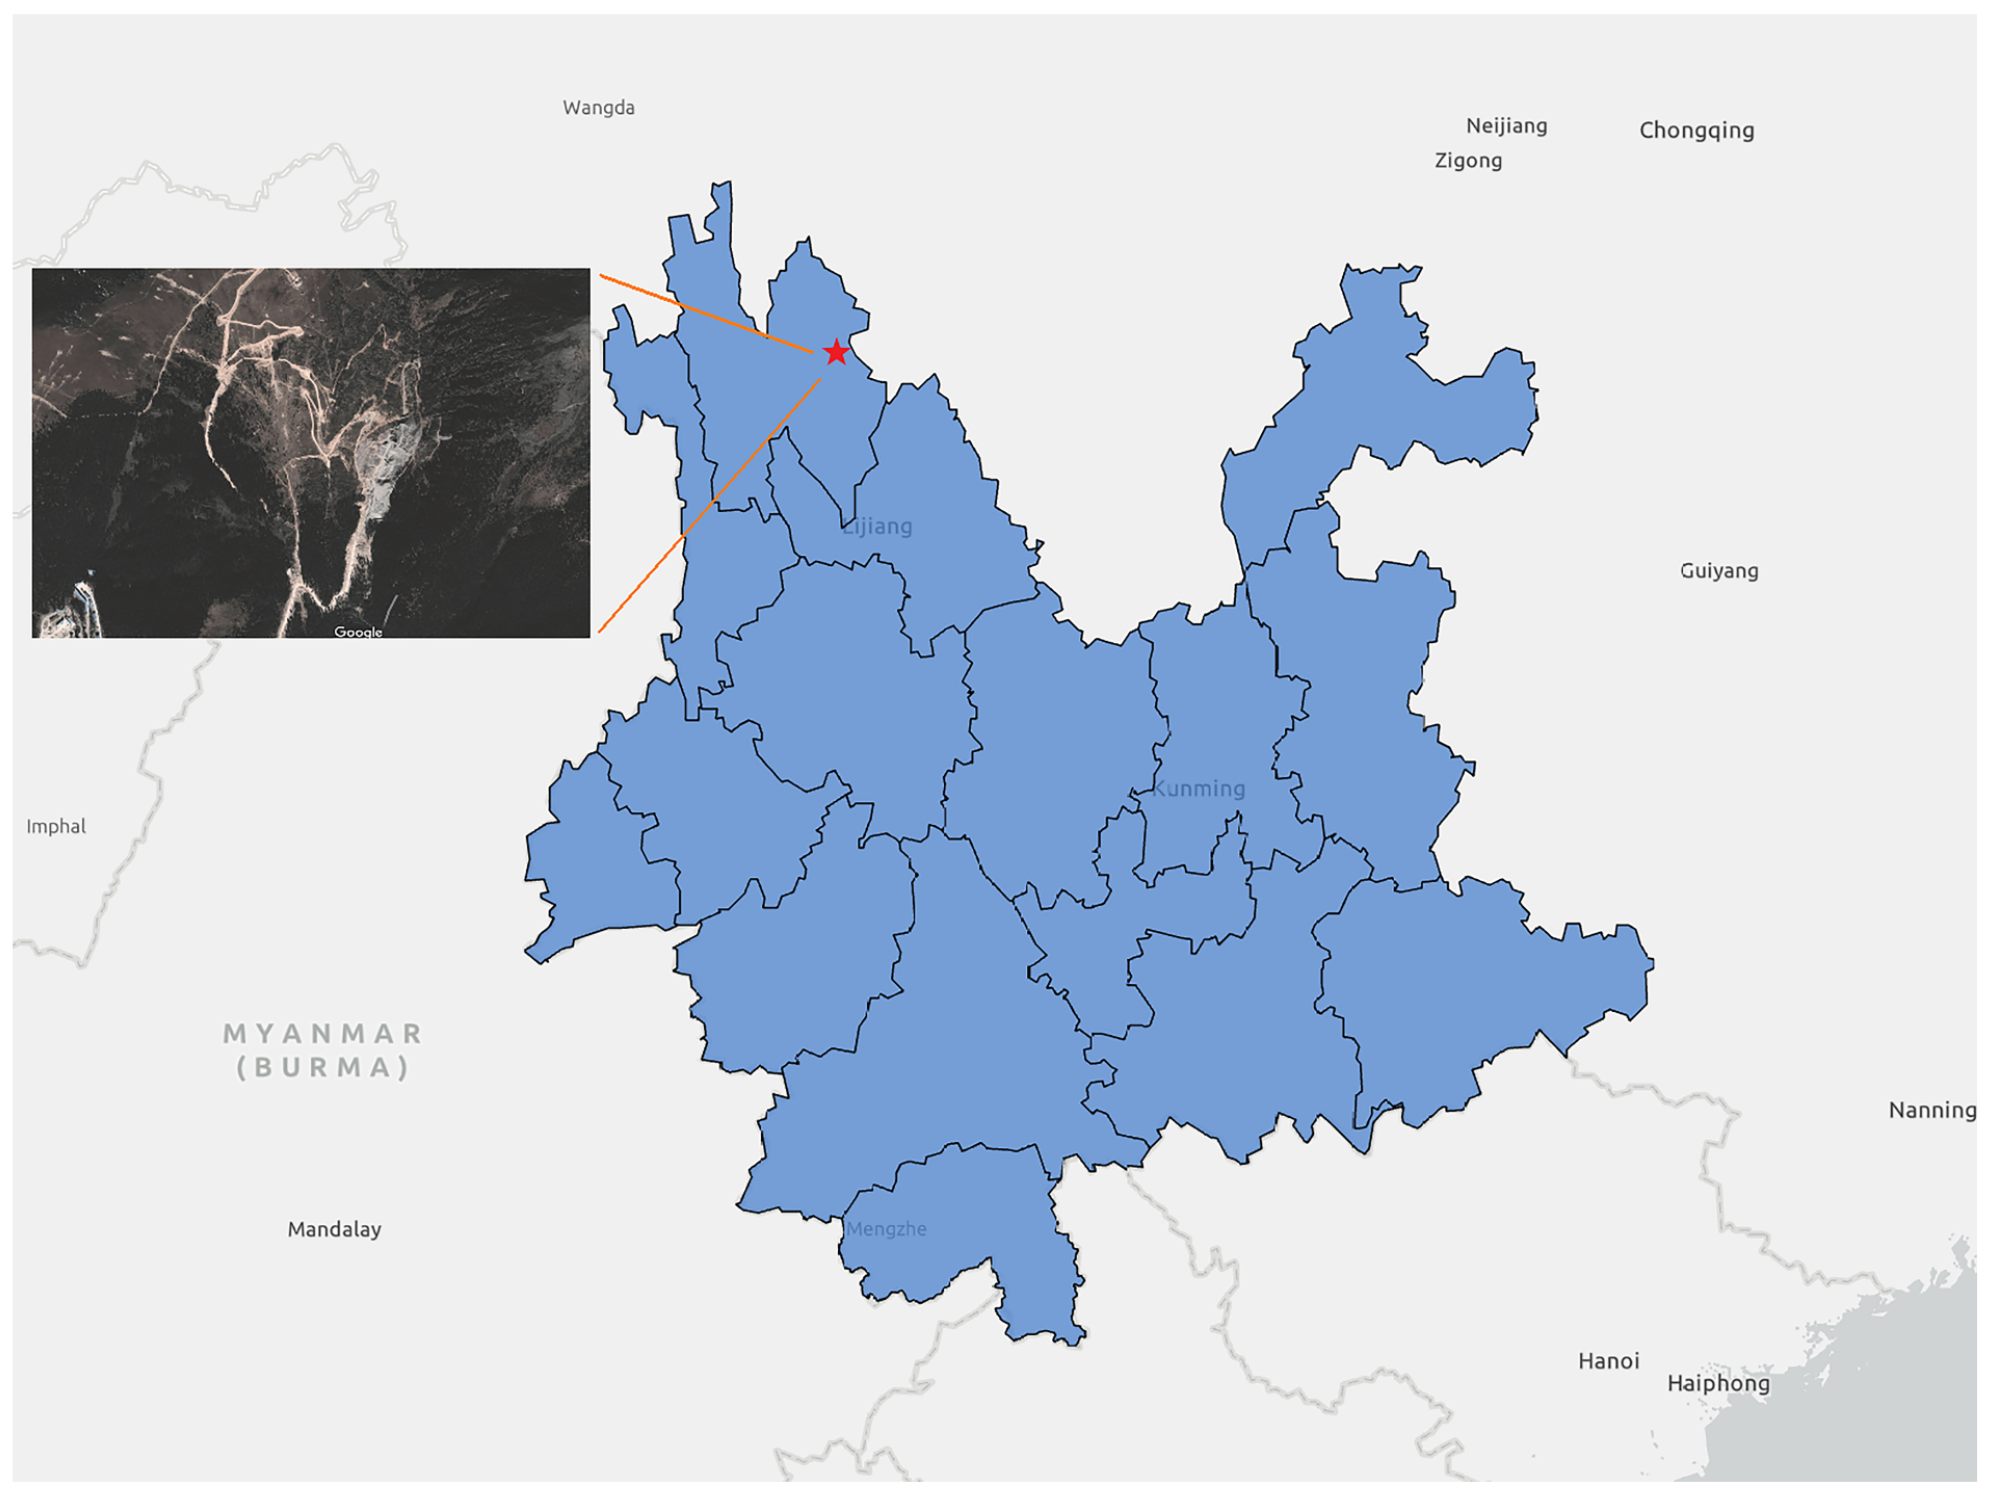
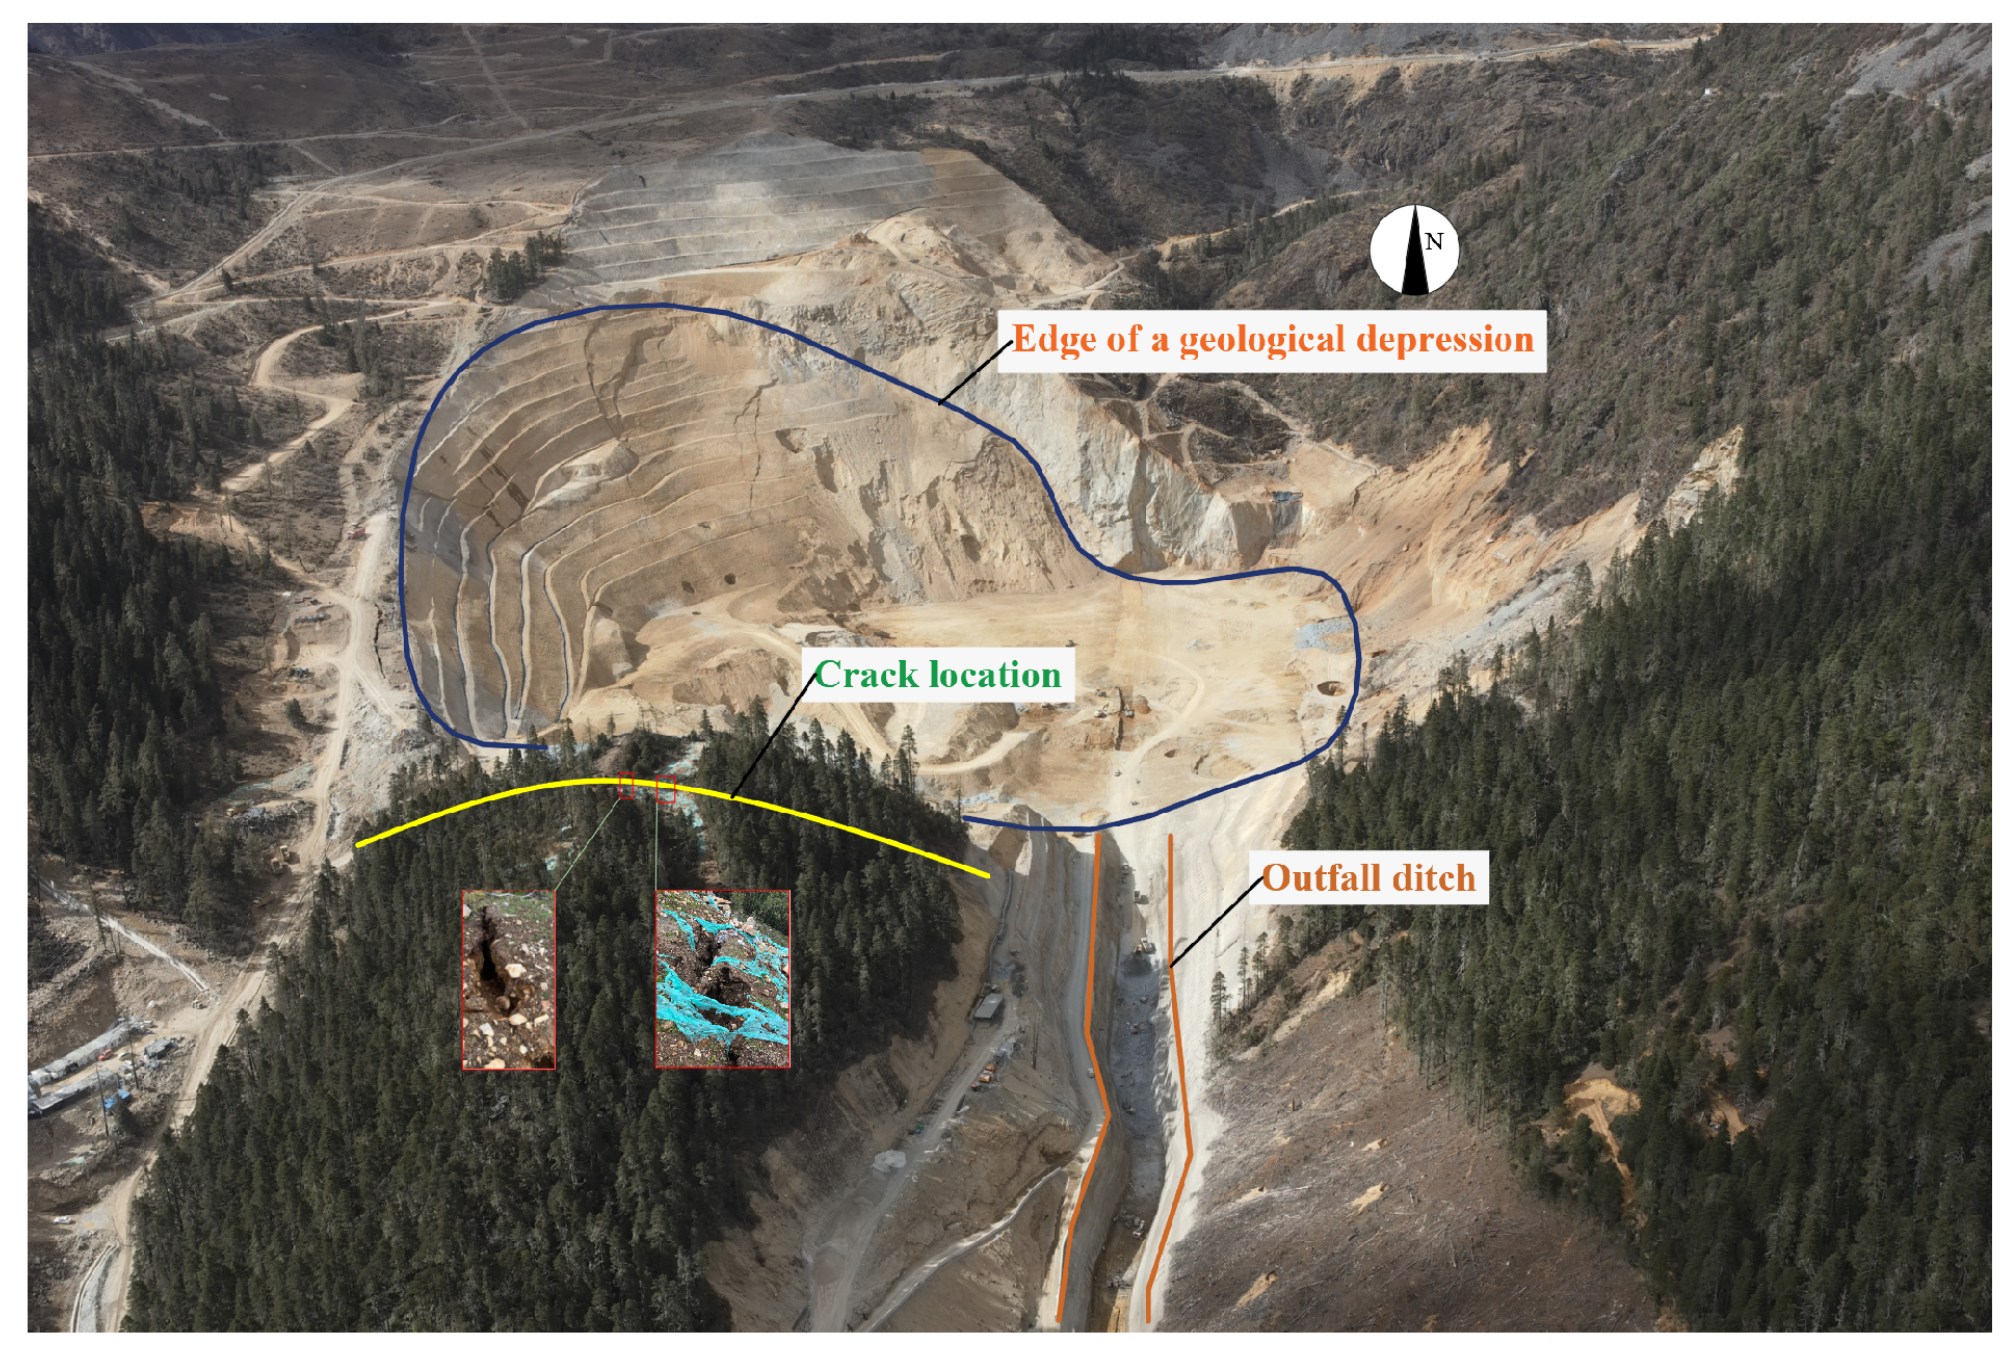
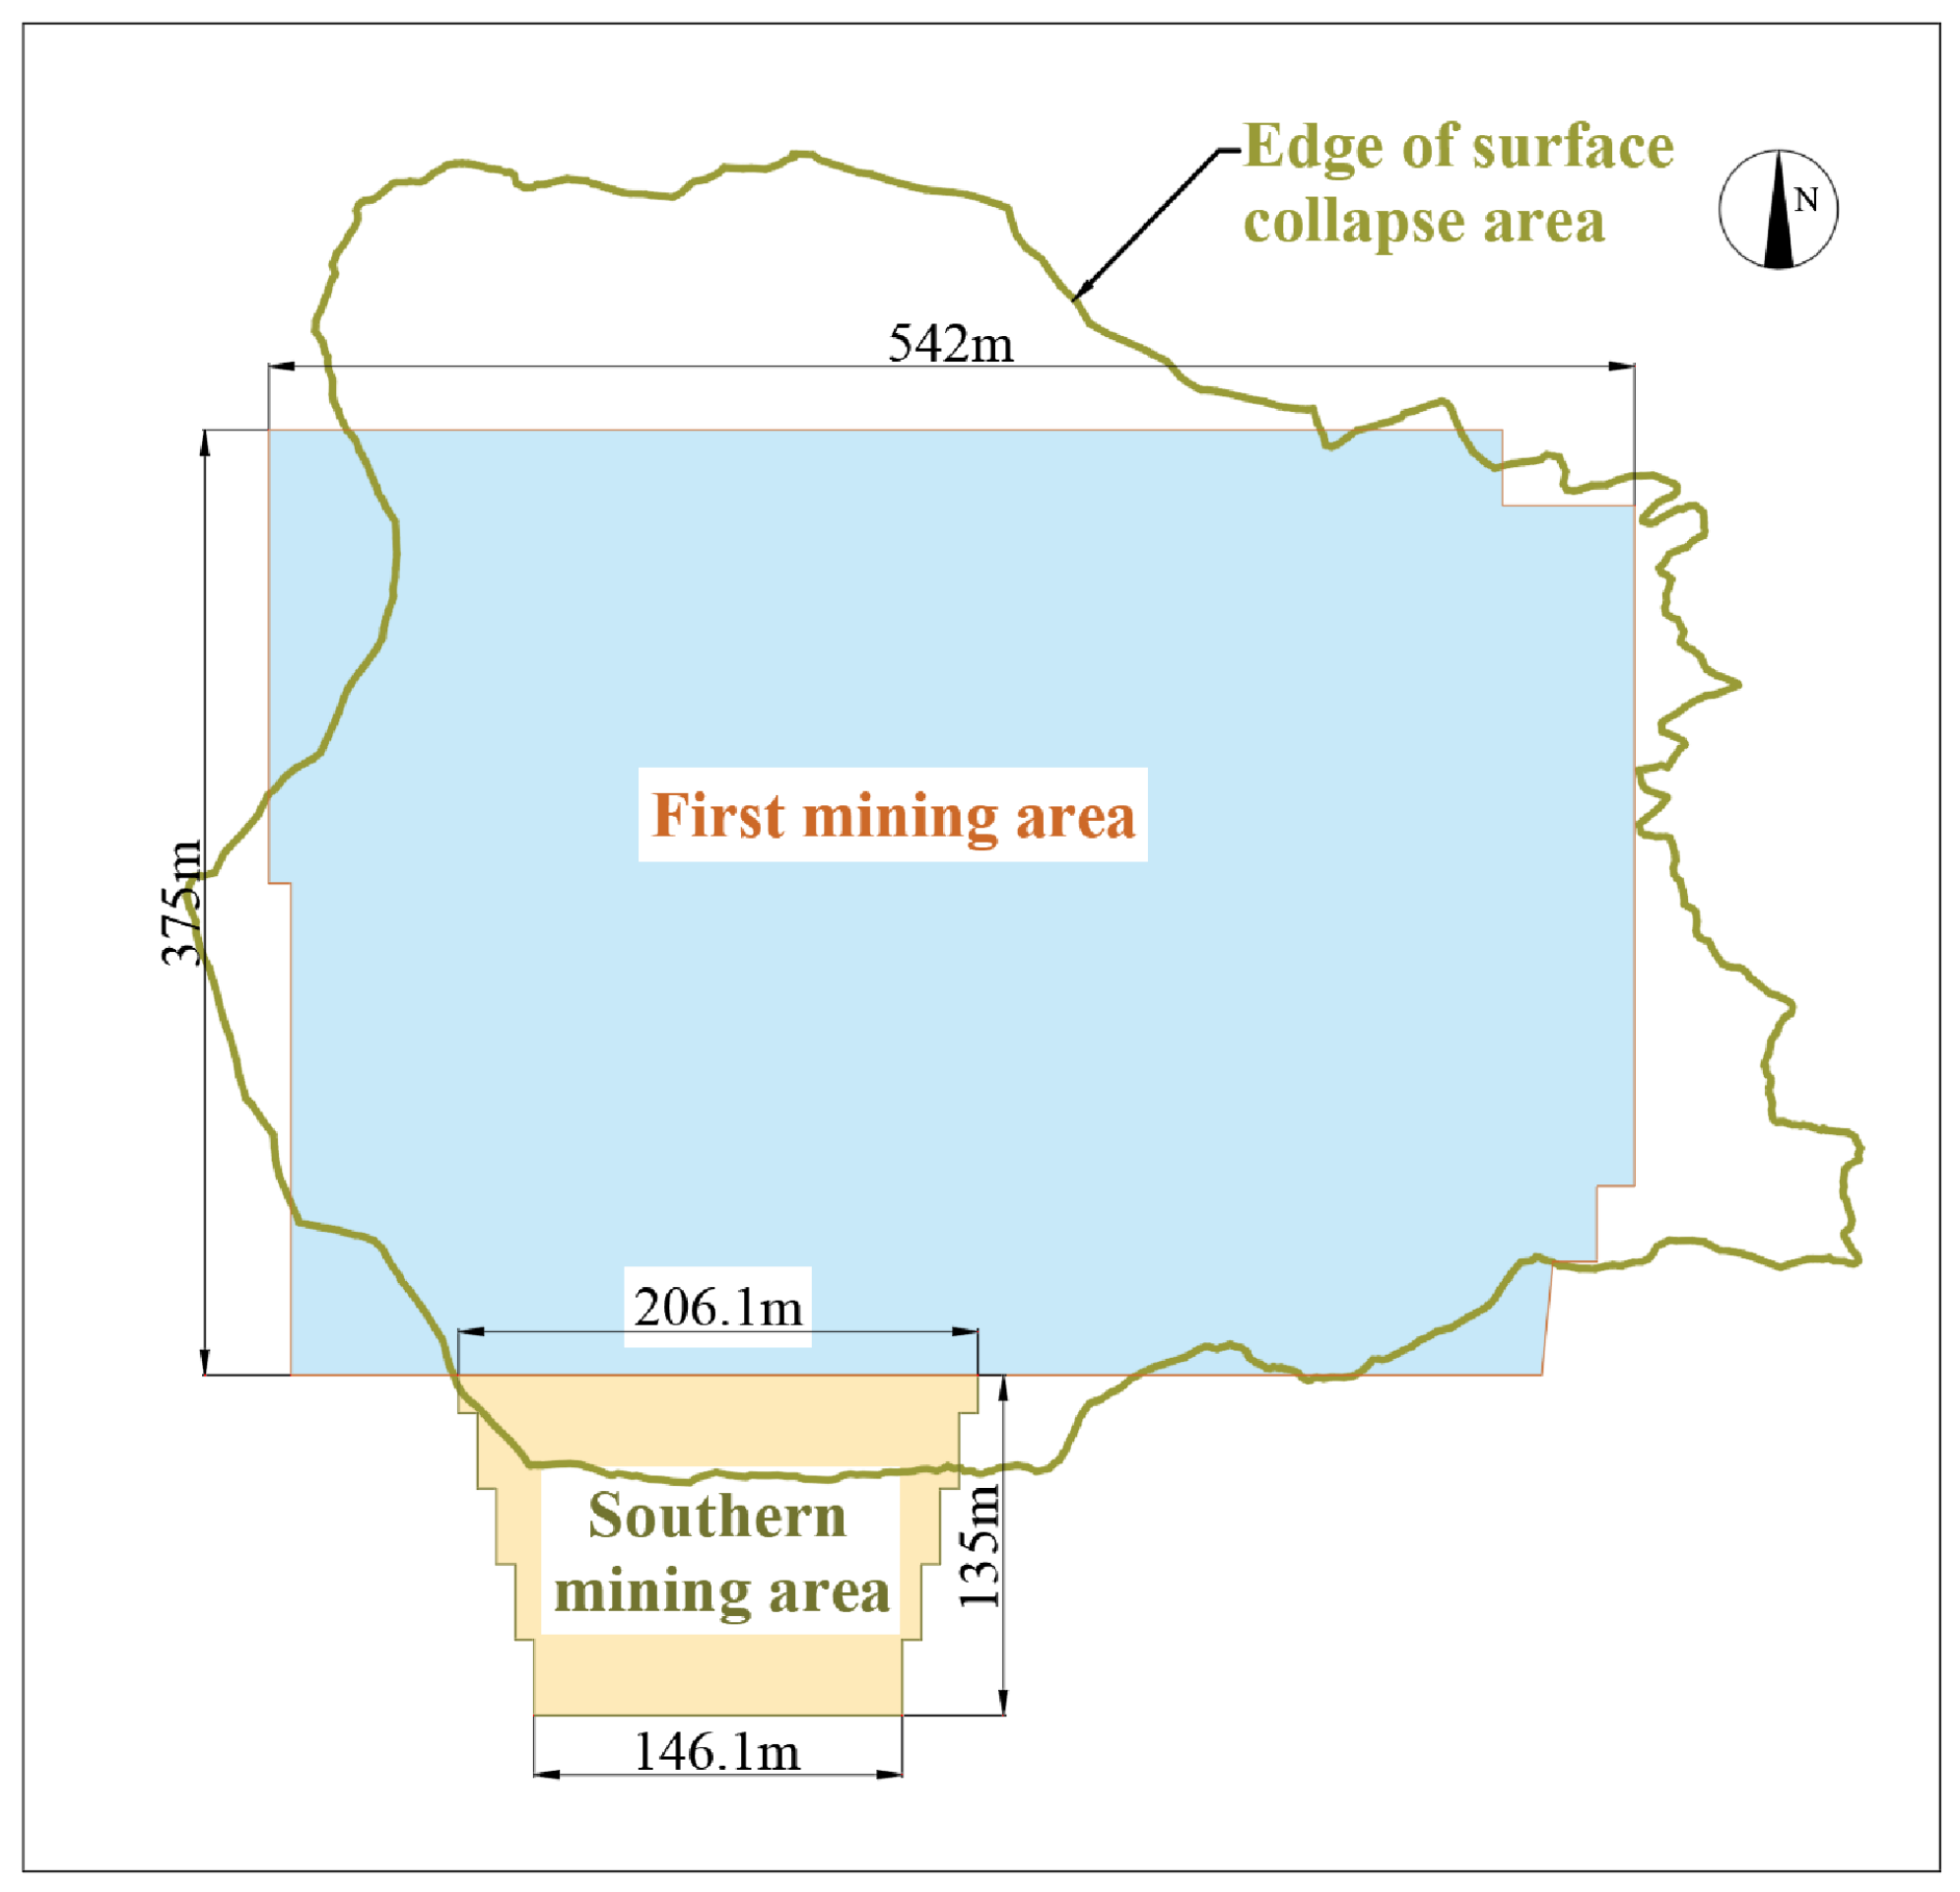
2. Project Overview
3. Numerical Simulation Study
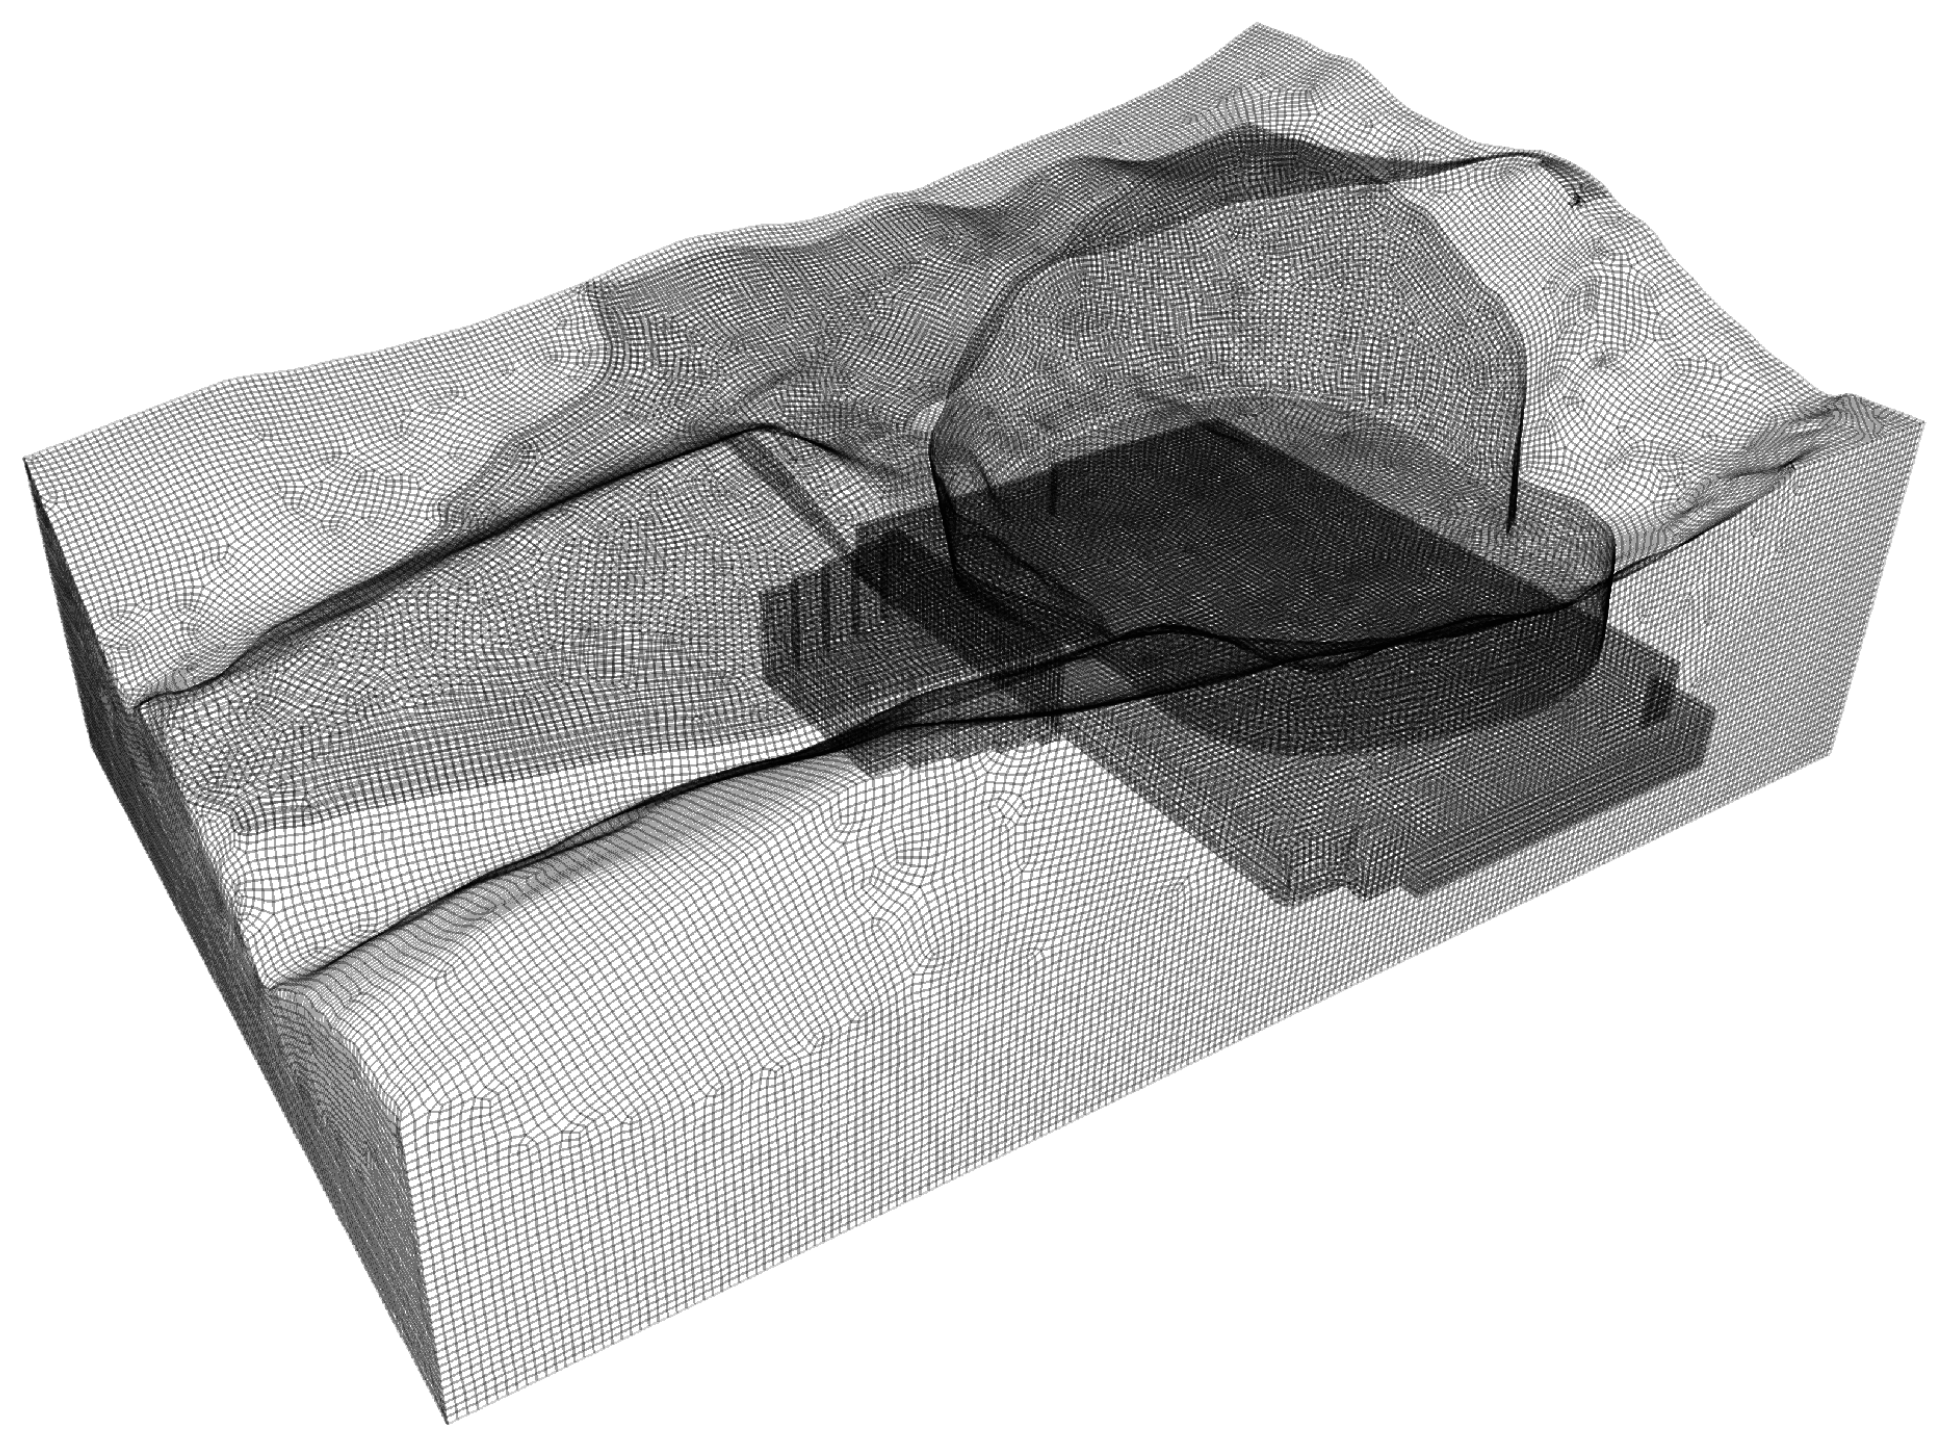
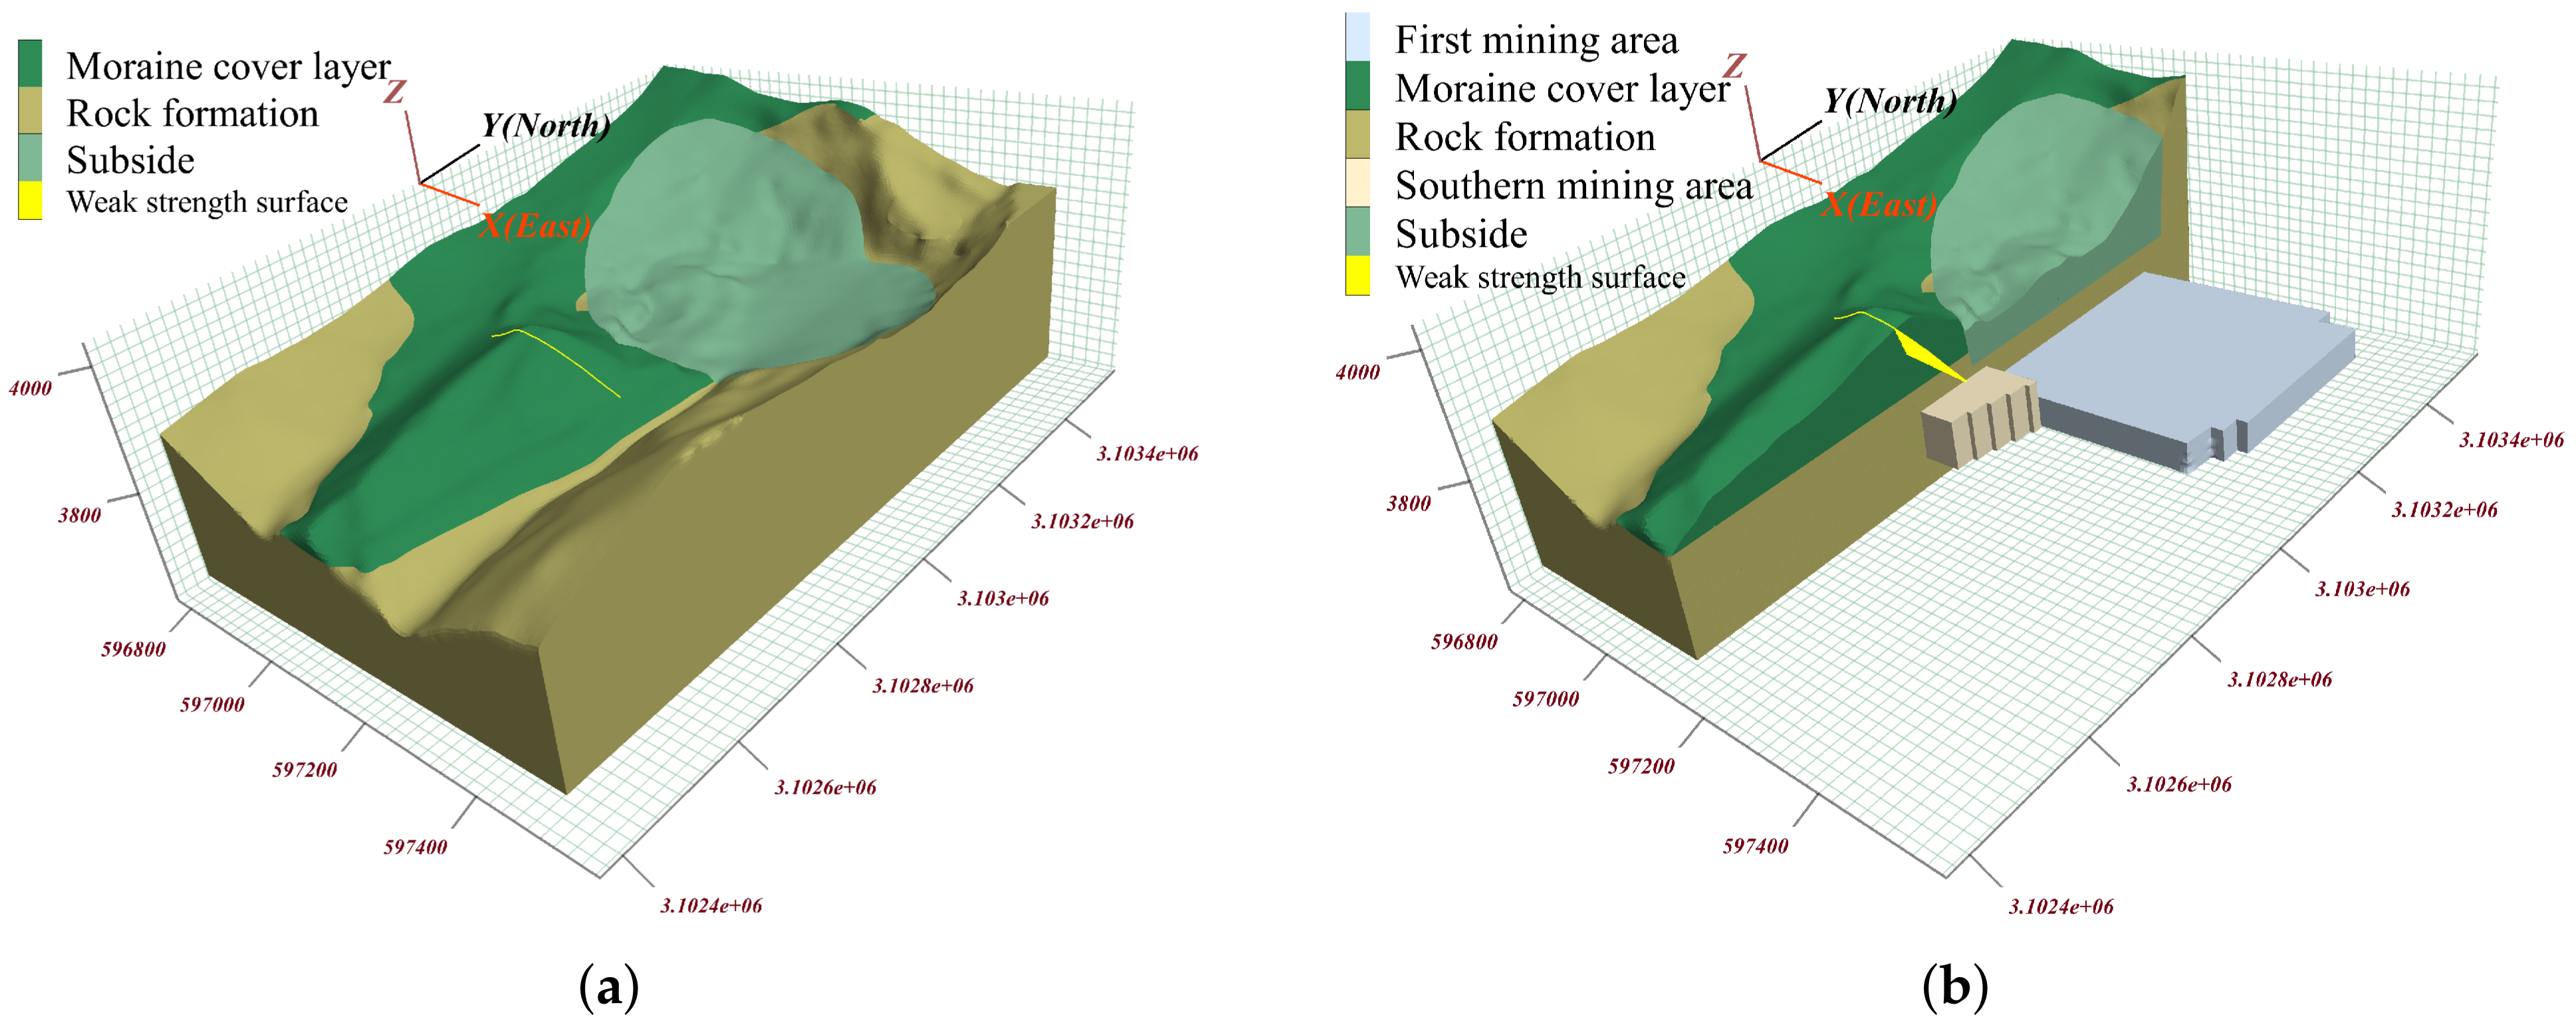
3.1. Establishment of Three-Dimensional Geological Model
3.2. Selection of Geomechanical Parameters
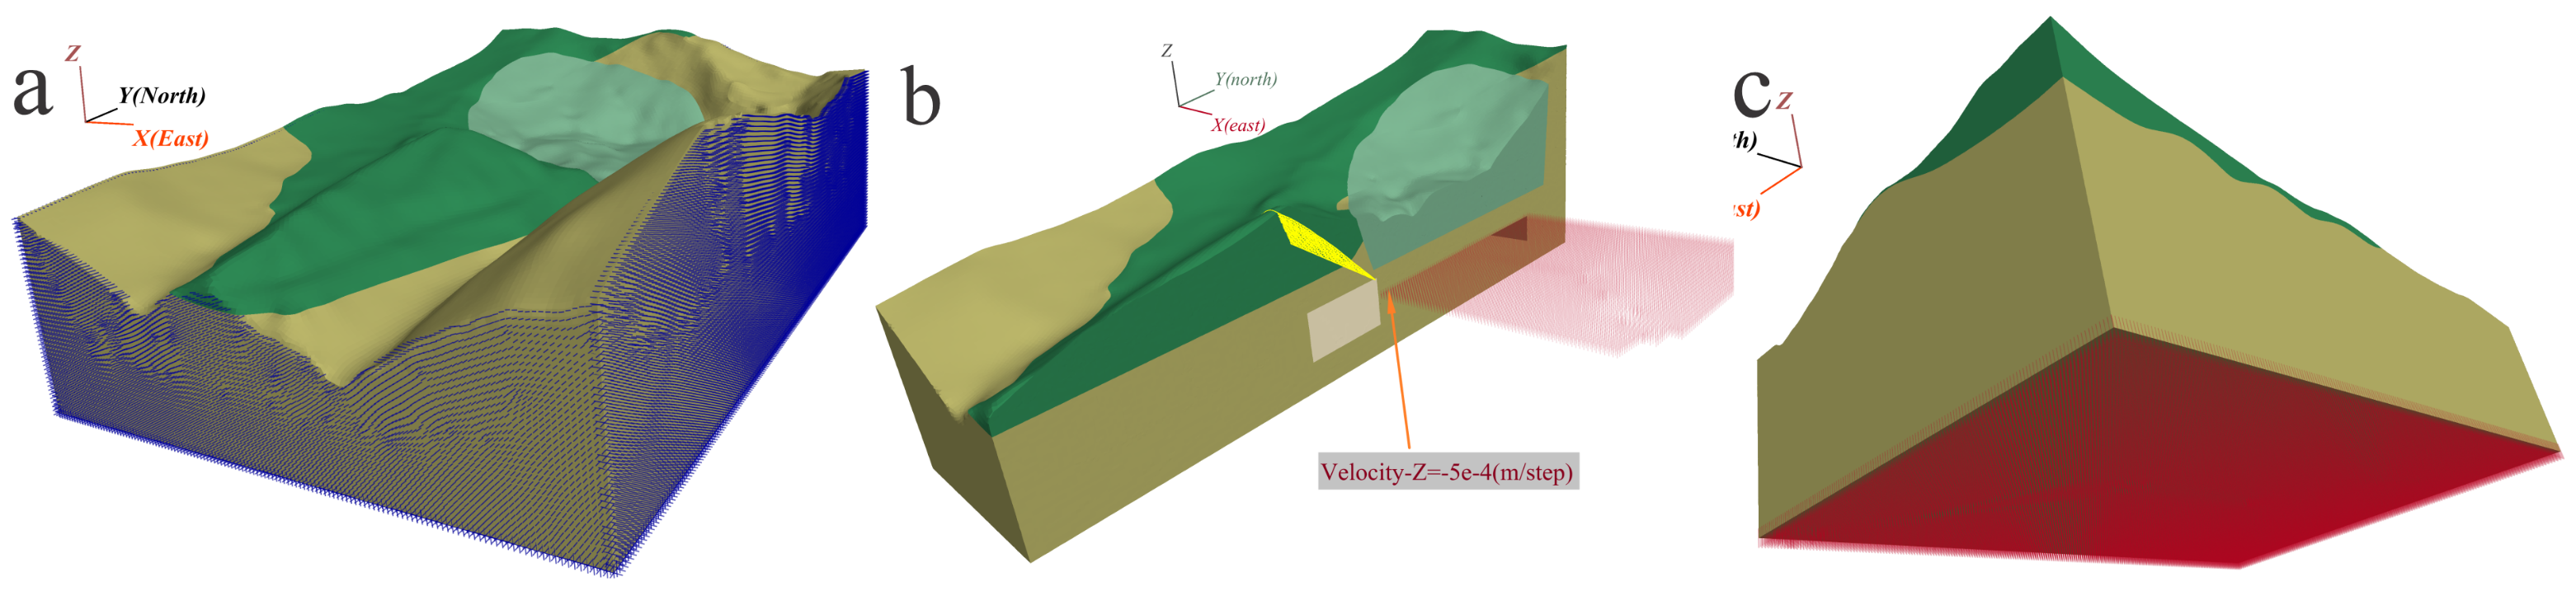
3.3. Boundary Conditions and Numerical Simulation Approach
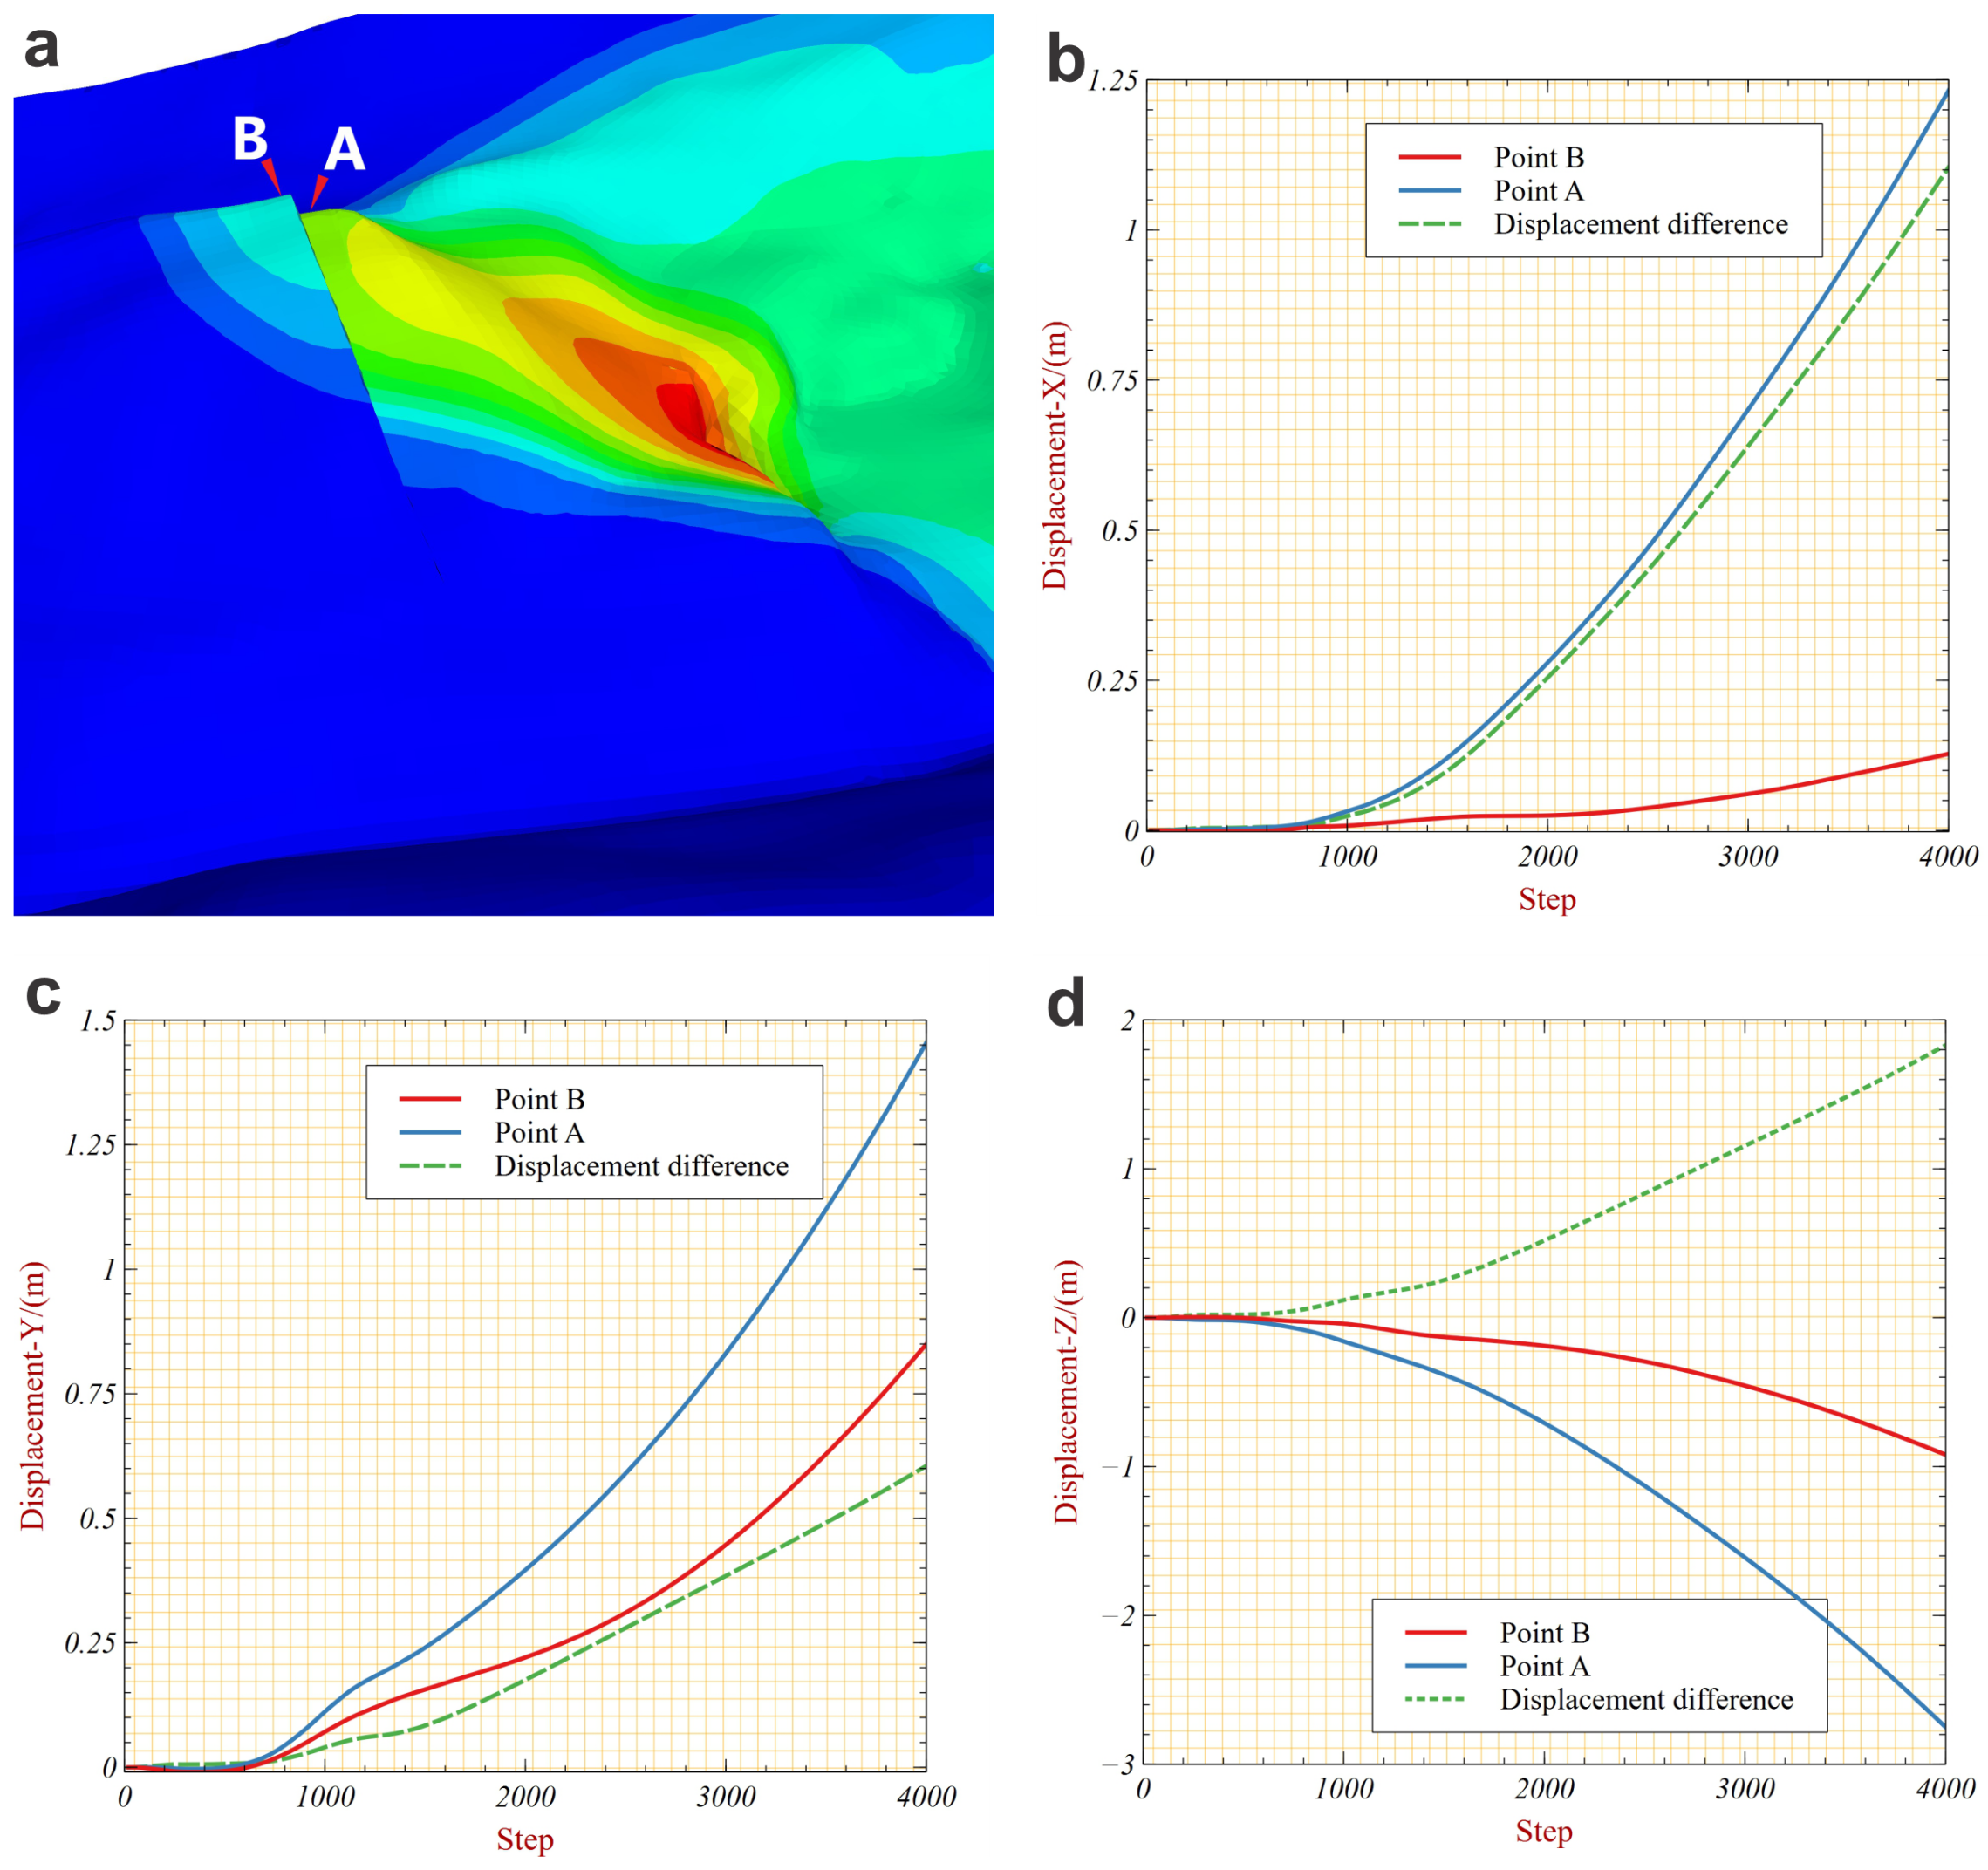
3.4. Analysis of Numerical Simulation Results
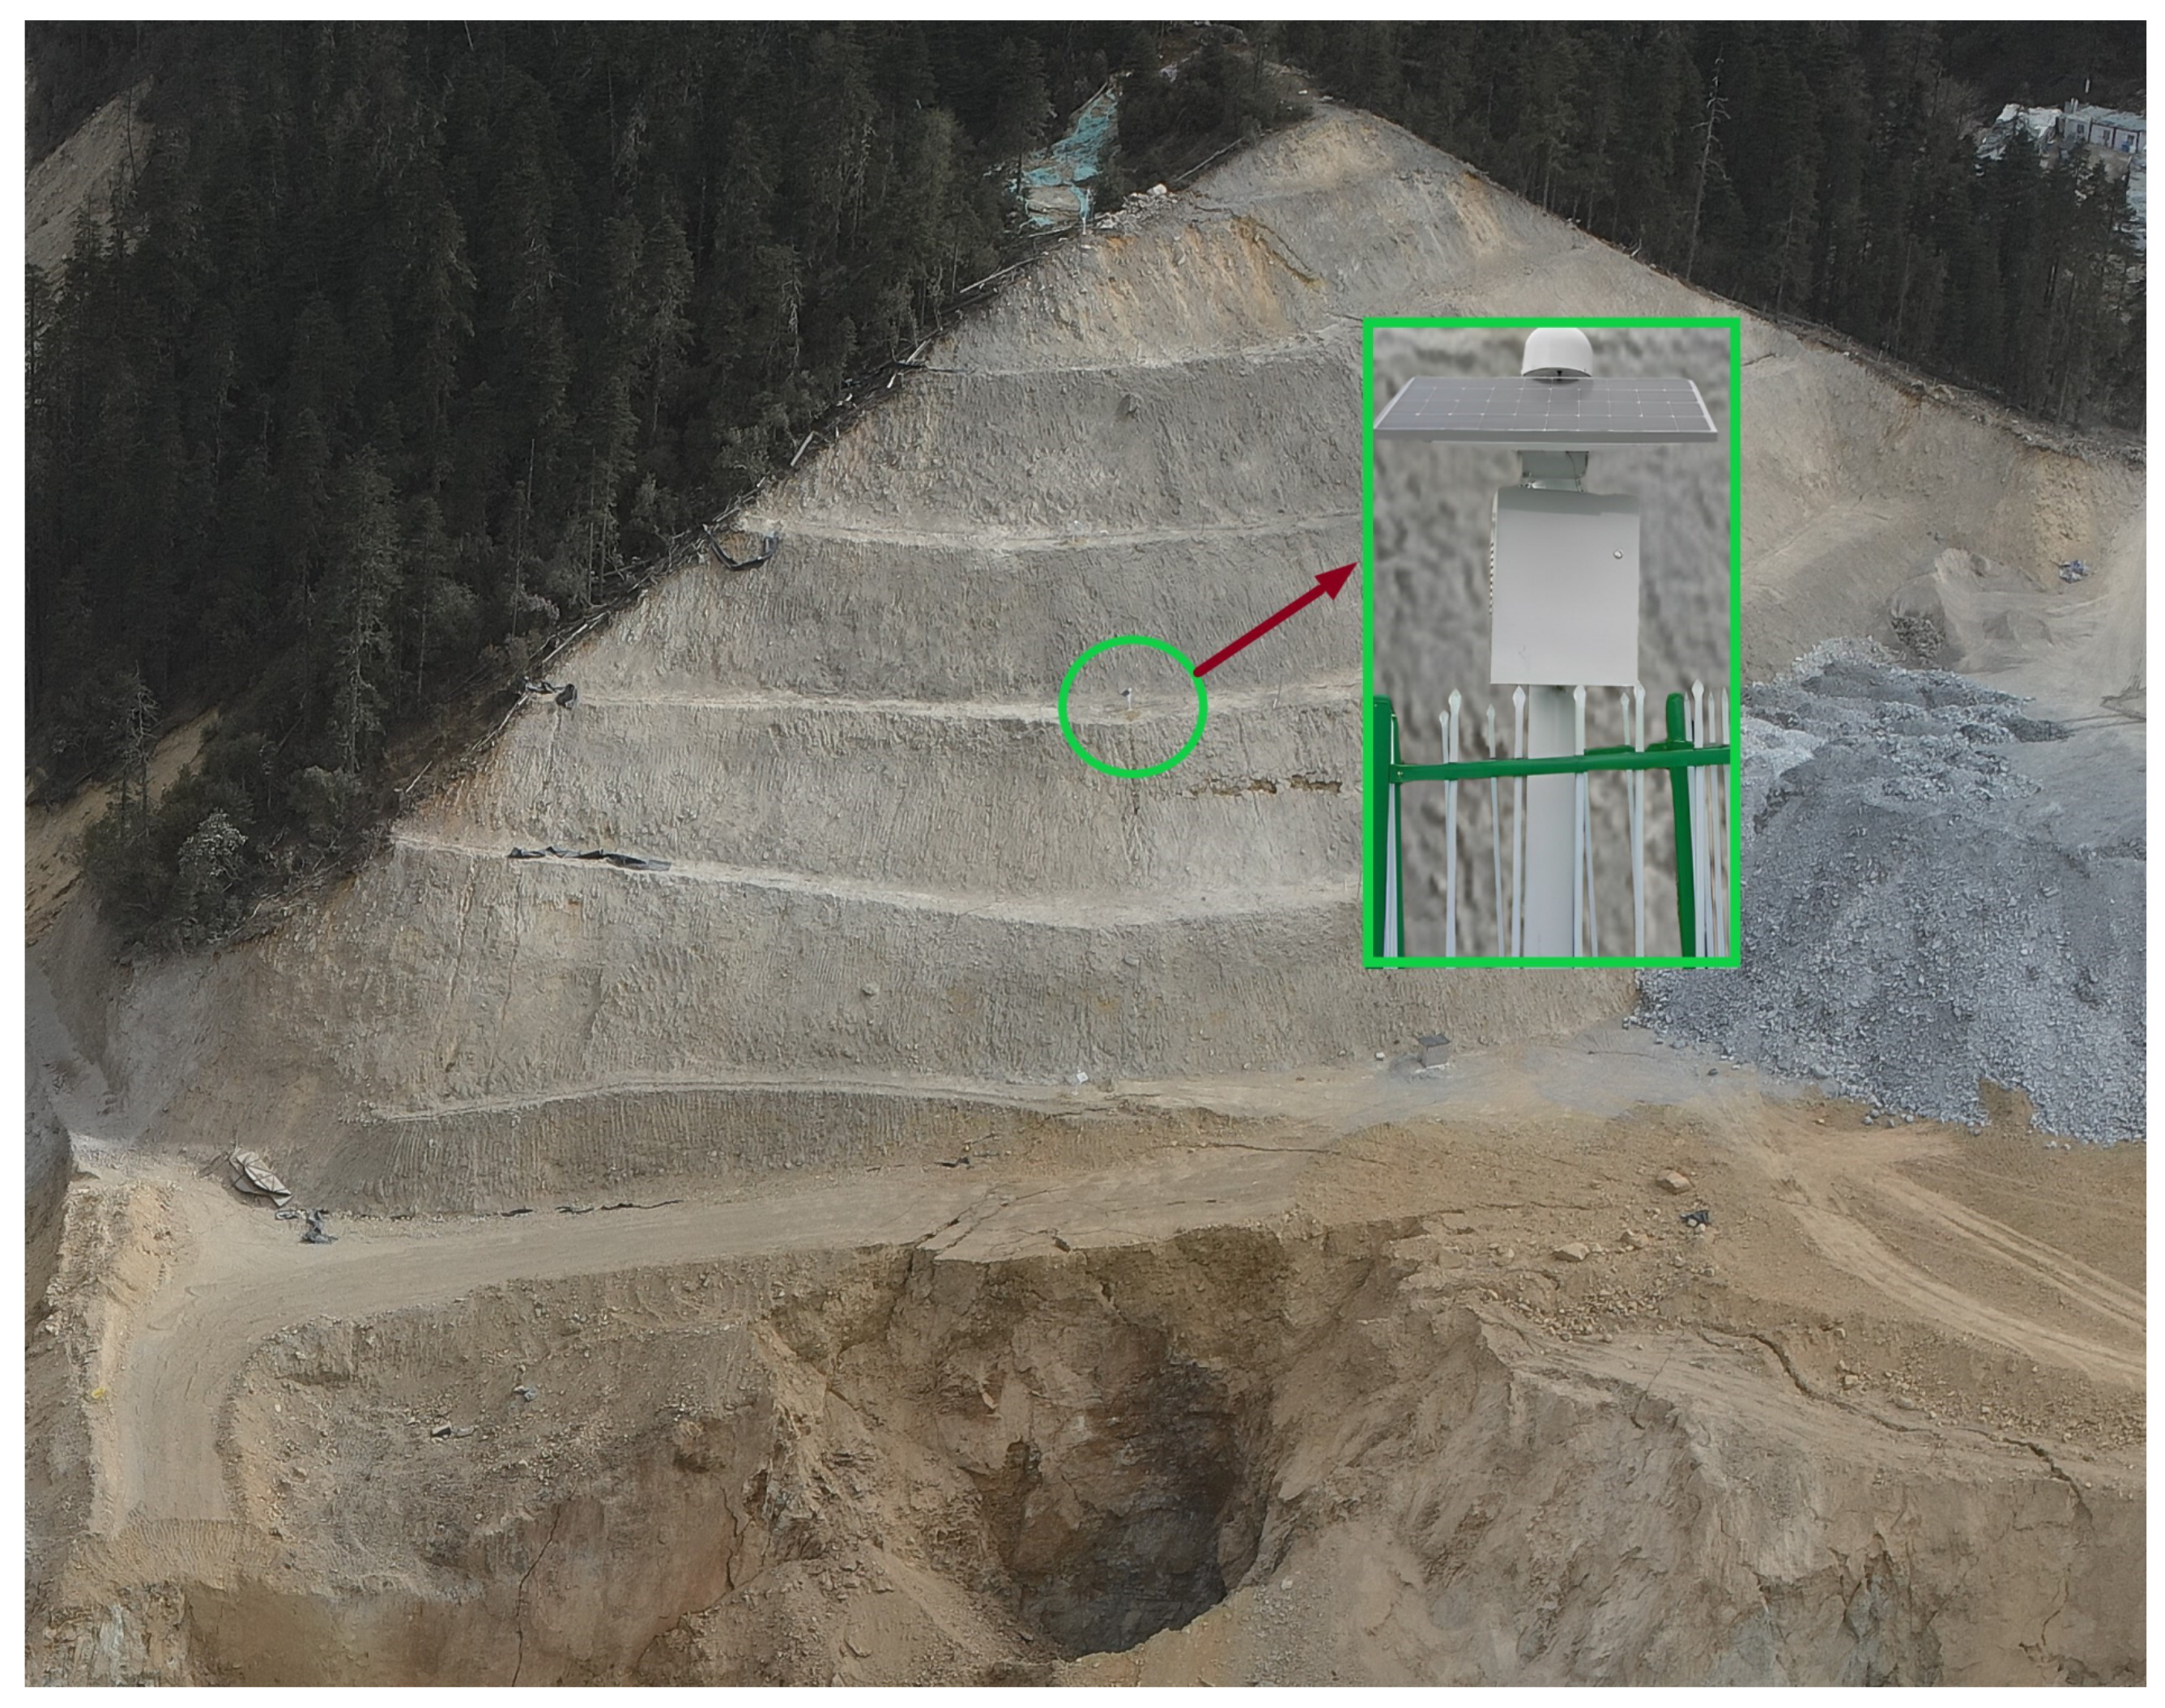
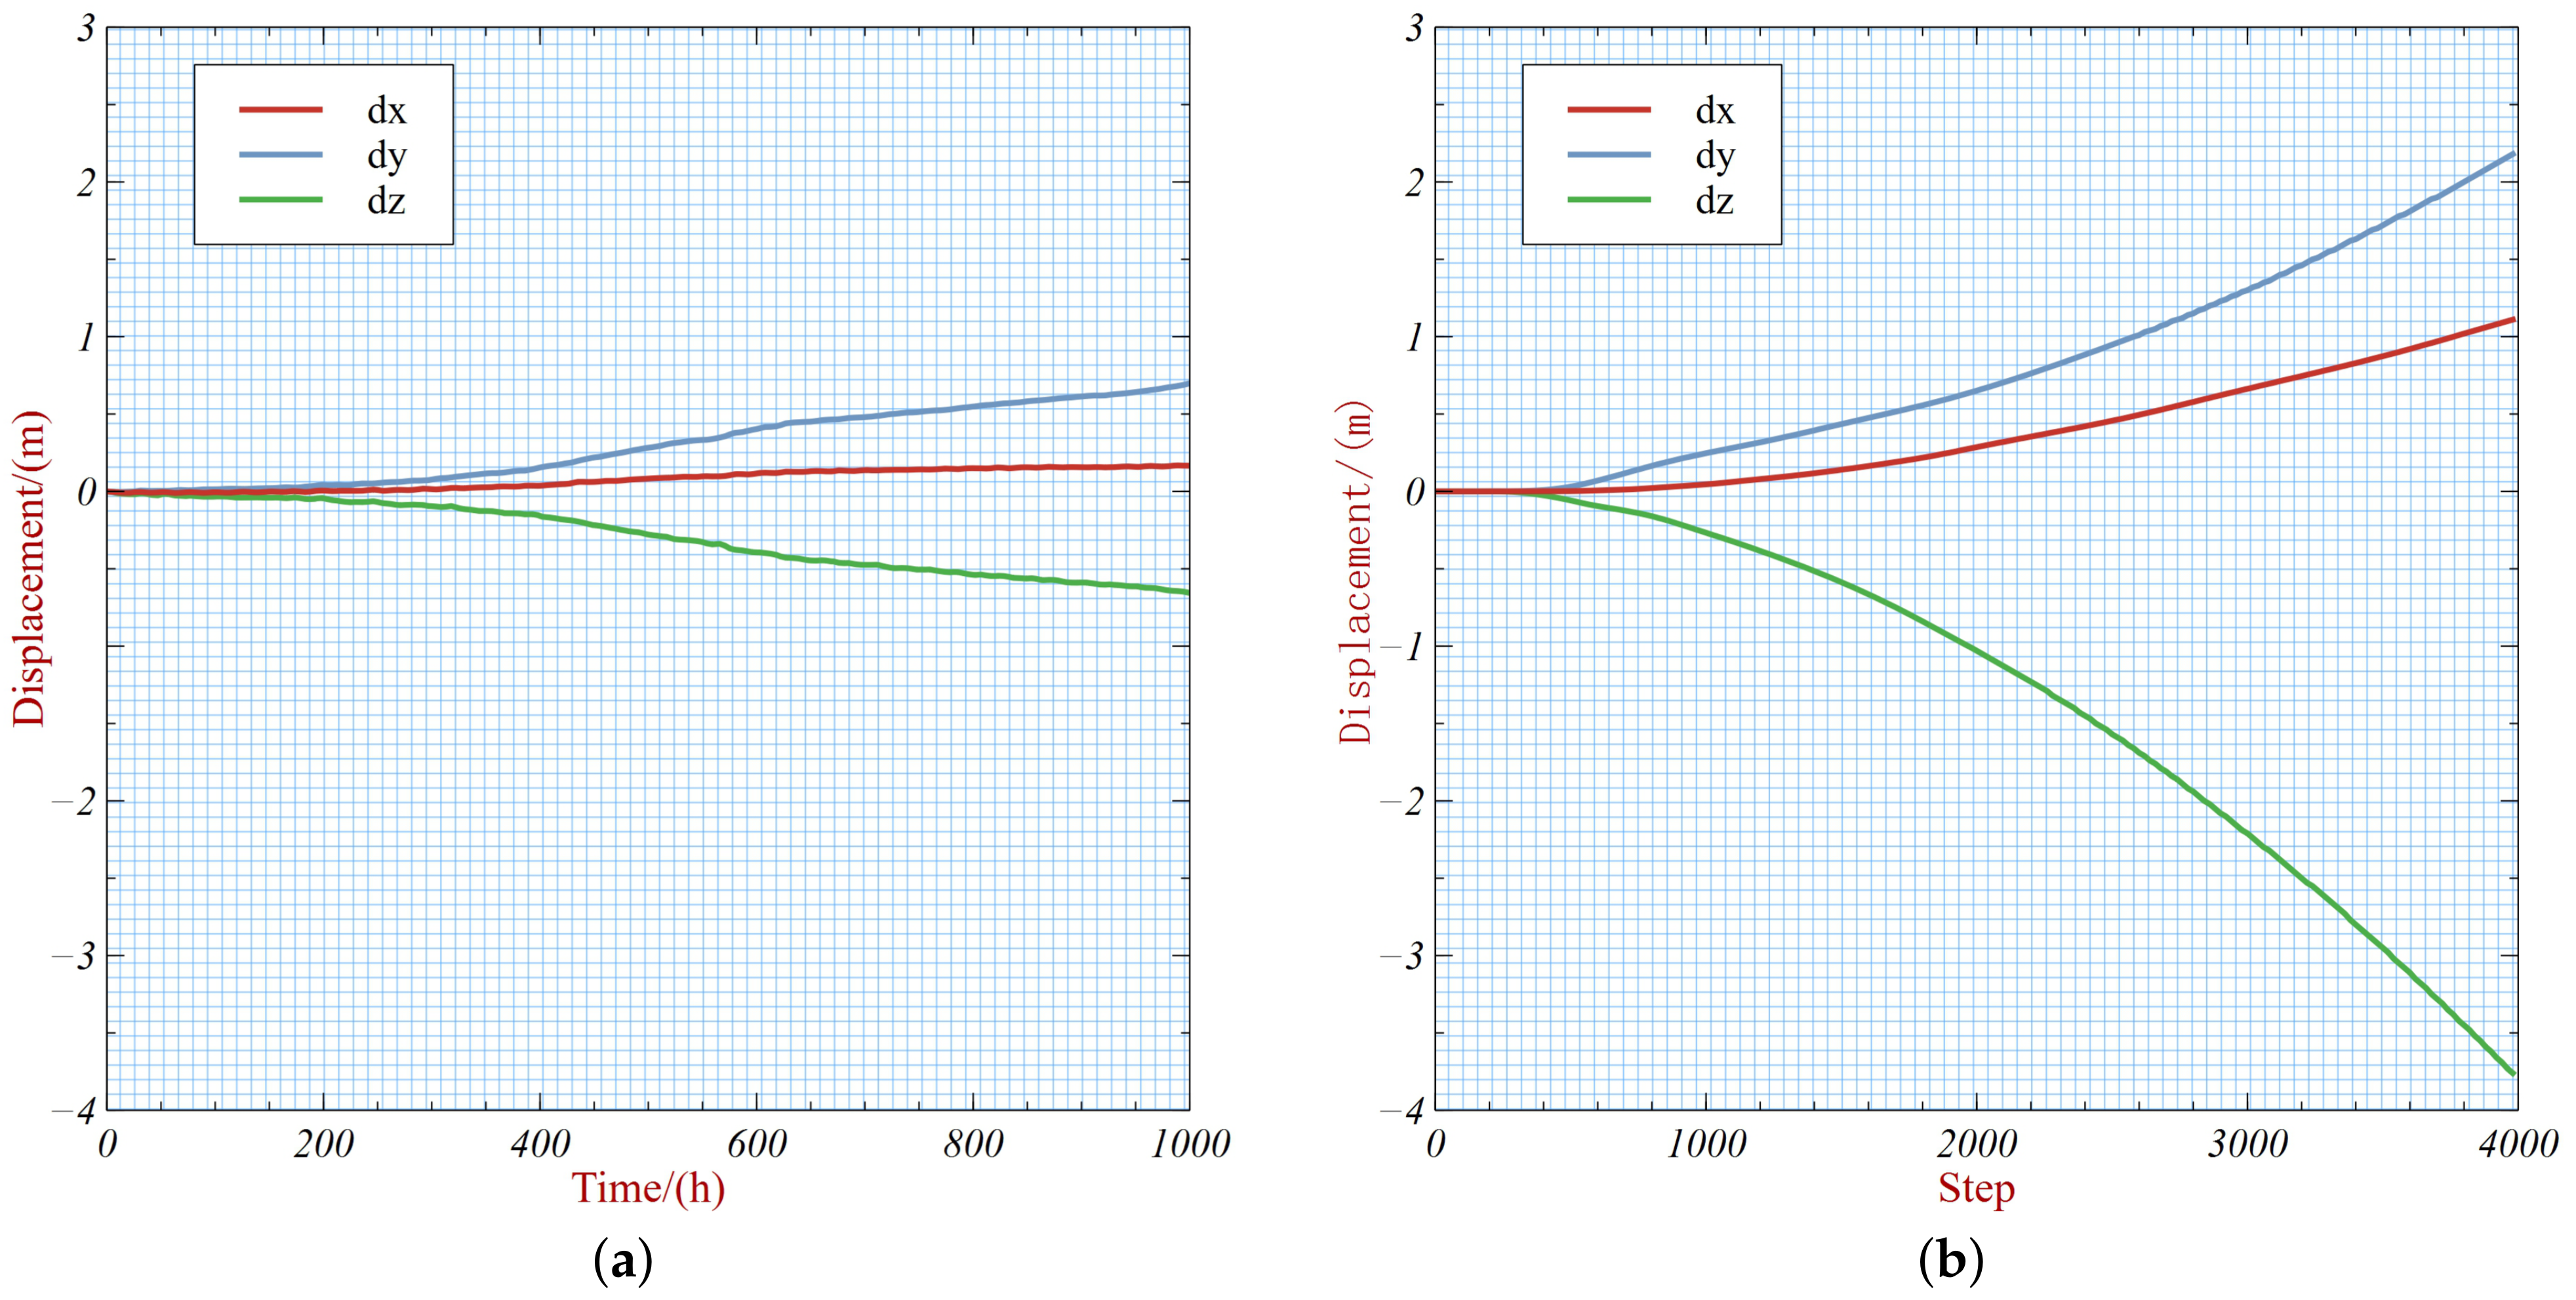
3.5. Comparison and Analysis of Numerical Simulation Results and Actual Monitoring Data
4. Discussion
5. Conclusions
- 1.
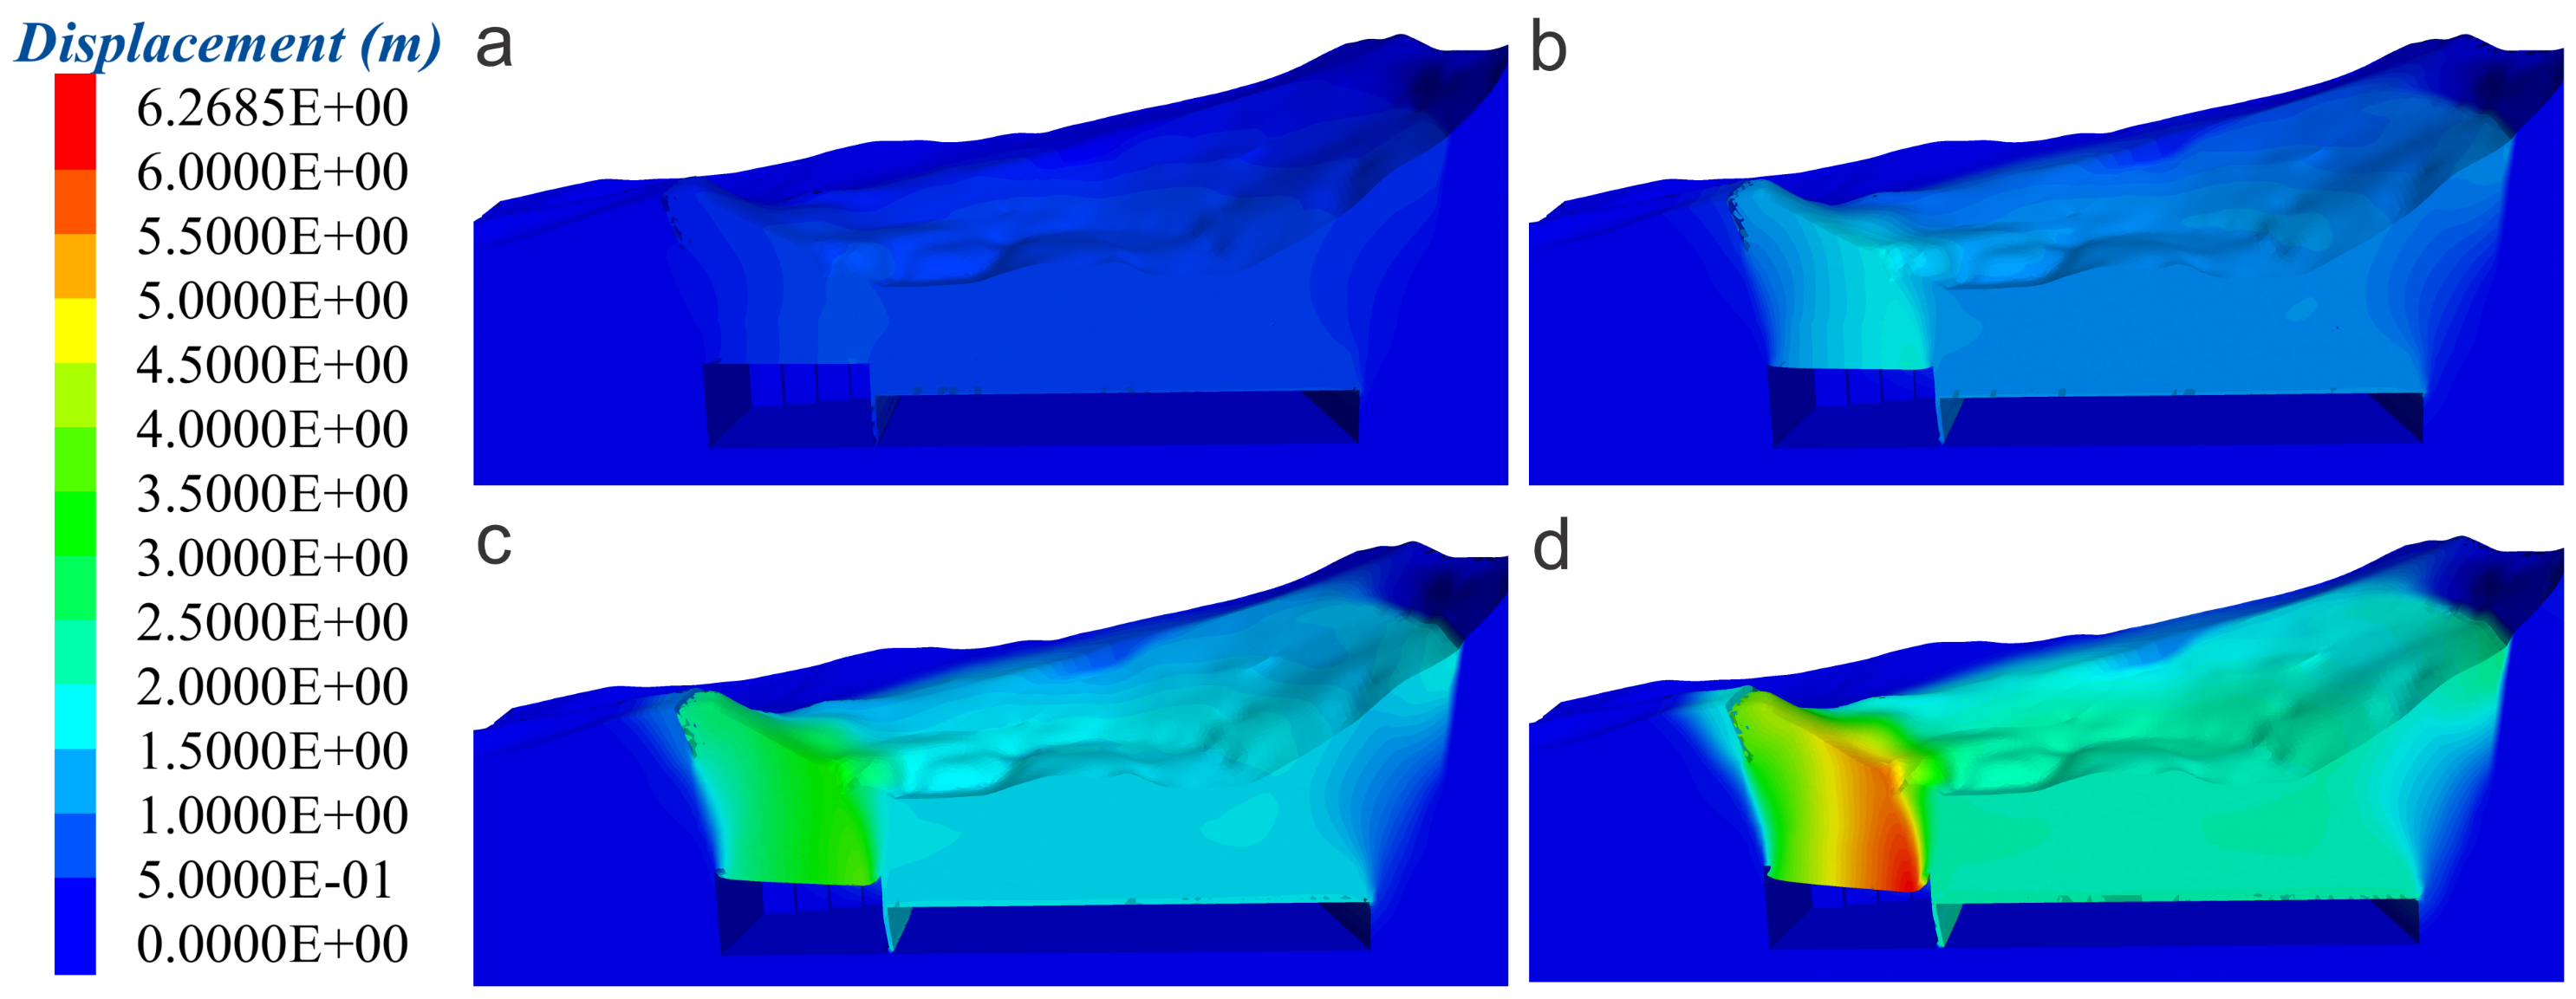
- The initiation of new mining activities in the southern part of the Prang Copper Mine’s first mining area resulted in ongoing subsidence of the upper surface. Due to the complex interactions between surface and subsurface structures, the surface displacements exhibit non-uniform patterns. The numerical simulation results indicate that, during this process, surface rock layers near the subsidence area experience initial displacements with the highest magnitudes. This phenomenon is closely related to the subsidence of the pre-existing collapse zone. As the subsidence continues, it gradually extends southward, eventually reaching the pre-existing structural weaknesses on the slope surface, forming fractures that evolve into more giant fissures. The simulation results after 4000 steps of this numerical model run show that the top gap width reaches 0.6 m with a vertical offset of 1.8 m;
- 2.
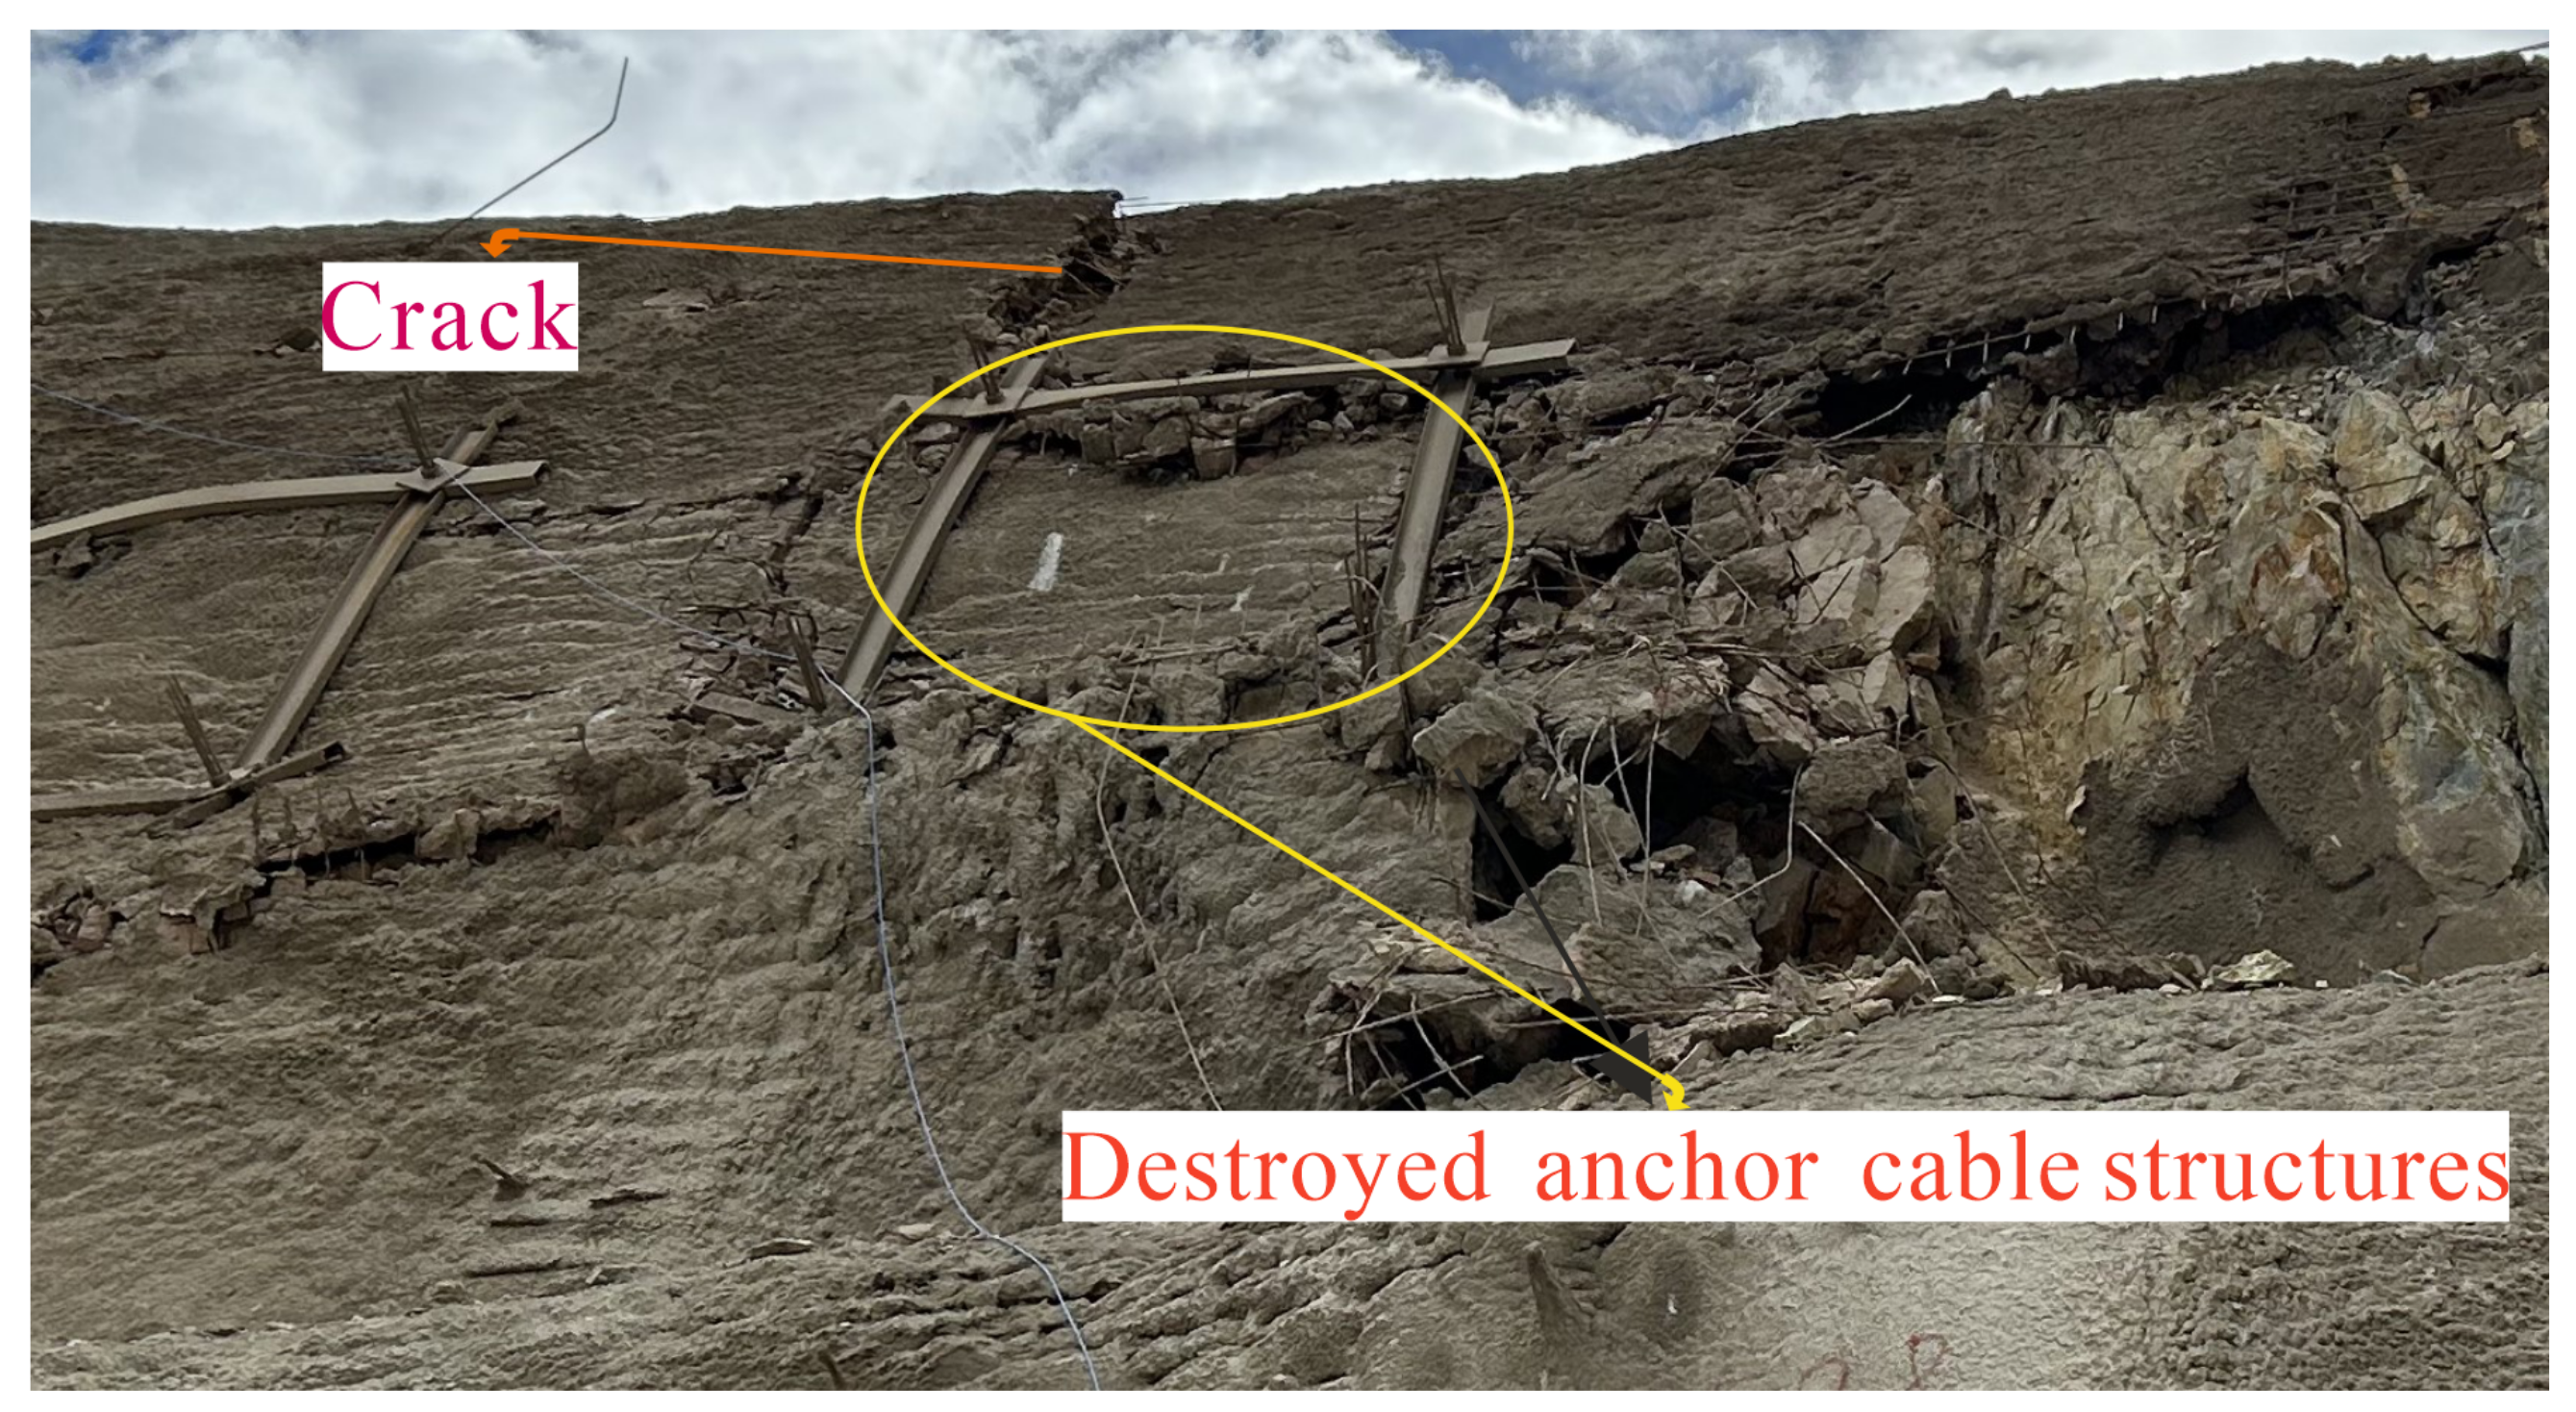
- As mining-induced subsidence progresses, the internal structural weaknesses within the rock and soil gradually evolve into fractures and subsequently expand into large fissures. In real-world engineering environments, apart from the effects of subsidence, rainfall may expedite the softening of the rock and soil, further facilitating the expansion of these fissures. If appropriate mitigation measures are not implemented, these fissures could potentially lead to slope sliding and toppling, compromising the stability of underground and surface structures;
- 3.
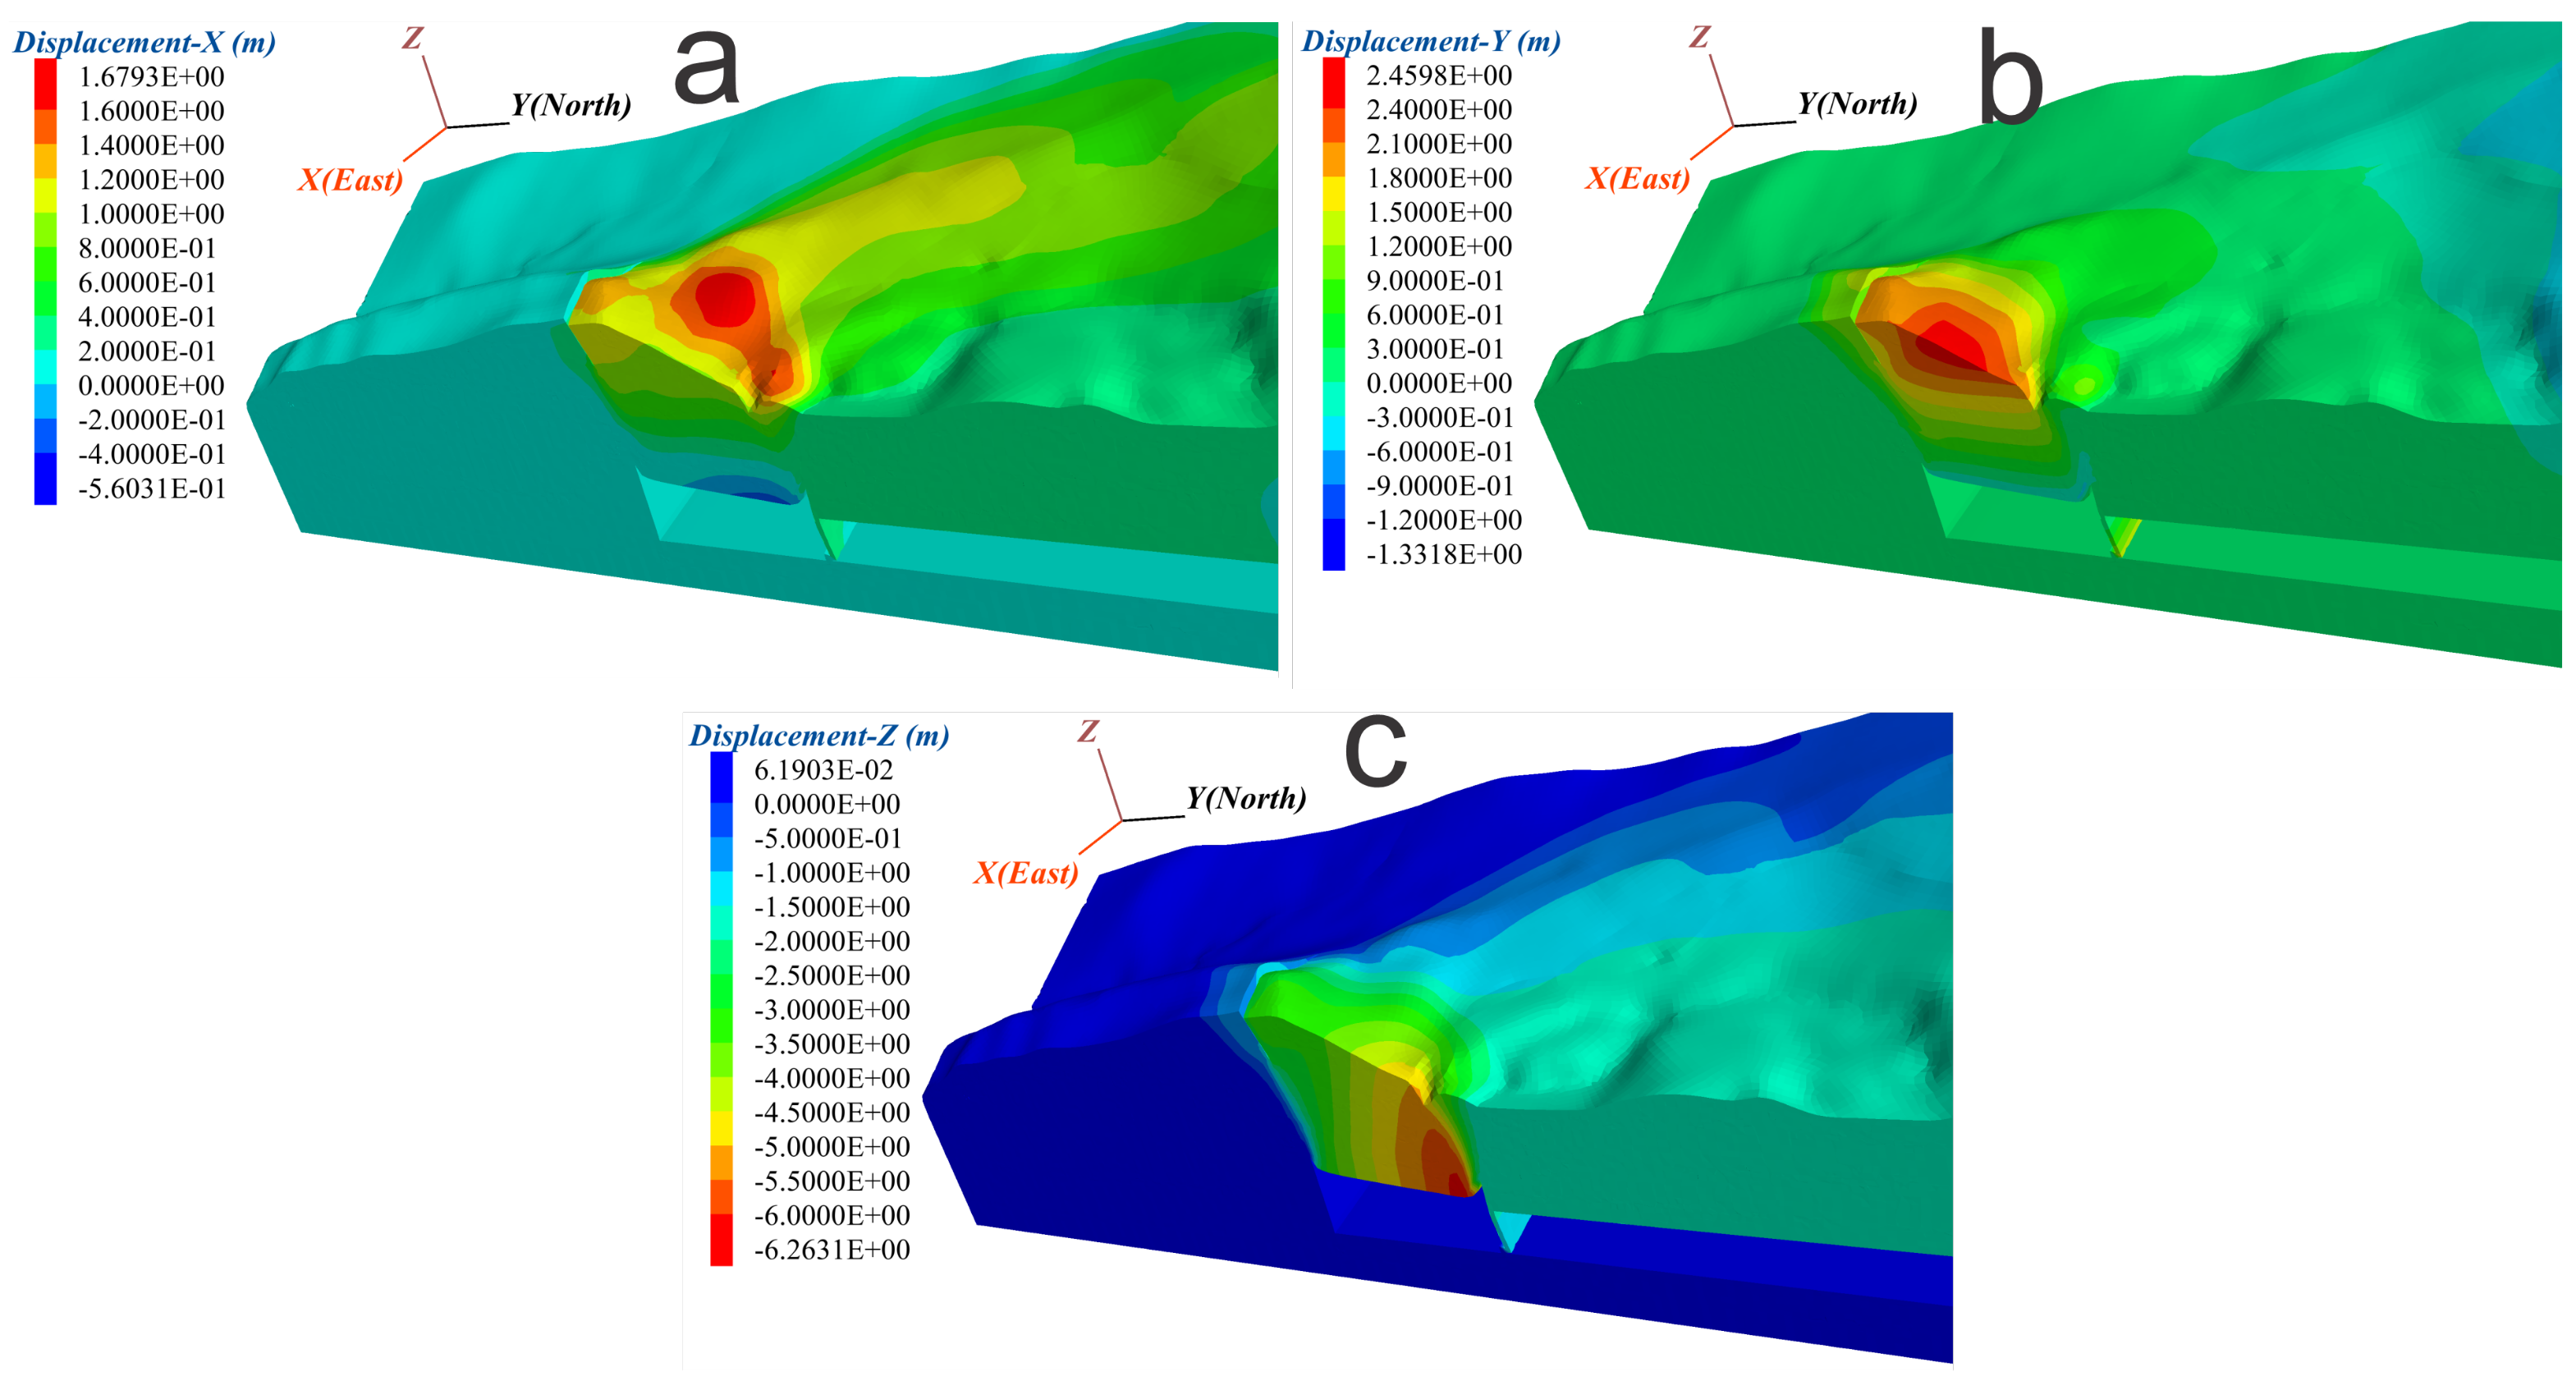
- We observed a similar trend between the simulated and actual displacement curves by comparing the numerical simulation results with data from actual monitoring points. Based on the results of the numerical simulation and 1000 h of monitoring results before the site inspection, the displacement of the monitoring point after 1500 h was predicted to be 0.884–1.35 m in the Y direction, 0.42–0.688 m in the X direction, and −1.45–2.3 m in the Z direction, while the actual monitoring of the site for 1500 h showed that dy was 1.44 m, dx was 0.20 m, and dz was 1.29 m. This shows that the numerical model has some reference value.
Author Contributions
Funding
Institutional Review Board Statement
Informed Consent Statement
Data Availability Statement
Conflicts of Interest
References
- Bazaluk, O.; Petlovanyi, M.; Lozynskyi, V.; Zubko, S.; Sai, K.; Saik, P. Sustainable Underground Iron Ore Mining in Ukraine with Backfilling Worked-Out Area. Sustainability 2021, 13, 834. [Google Scholar] [CrossRef]
- Lapshyn, O.; Khudyk, M. The tragicconsequences of the collapse of the earth’s surface within the mining allotment of Ordzhonikidze mine. E3s Web Conf. 2020, 166, 03003. [Google Scholar] [CrossRef]
- Xia, K.; Chen, C.; Liu, X.; Zheng, X.; Zhou, Y.; Song, X.; Yuan, J. Ground collapse and caving mechanisms in strata overlying sublevel caving mines: A case study. Bull. Eng. Geol. Environ. 2024, 83, 21. [Google Scholar] [CrossRef]
- Bruneau, G.; Hudyma, M.; Hadjigeorgiou, J.; Potvin, Y. Influence of faulting on a mine shaft-a case study: Part II-numerical modelling. Int. J. Rock Mech. Min. Sci. 2003, 40, 113–125. [Google Scholar] [CrossRef]
- Hoek, E. Progressive caving induced by mining an inclined orebody. Trans. Inst. Min. Metall. 1974, 83, A133–A139. [Google Scholar]
- Ren, W.; Guo, C.; Peng, Z.; Wang, Y. Model experimental research on deformation and subsidence characteristics of ground and wall rock due to mining under thick overlying terrane. Int. J. Rock Mech. Min. Sci. 2010, 47, 614–624. [Google Scholar] [CrossRef]
- Dai, H.; Lian, X.; Liu, J.; Liu, Y.; Zhou, Y.; Deng, W.; Cai, Y. Model study of deformation induced by fully mechanized caving below a thick loess layer. Int. J. Rock Mech. Min. Sci. 2010, 47, 1027–1033. [Google Scholar] [CrossRef]
- Xia, K.; Chen, C.; Deng, Y.; Xiao, G.; Zheng, Y.; Liu, X.; Fu, H.; Song, X.; Chen, L. In situ monitoring and analysis of the mining-induced deep ground movement in a metal mine. Int. J. Rock Mech. Min. Sci. 2018, 109, 32–51. [Google Scholar] [CrossRef]
- Zhao, H.; Ma, F.; Zhang, Y.; Guo, J. Monitoring and mechanisms of ground deformation and ground fissures induced by cut-and-fill mining in the Jinchuan Mine 2, China. Environ. Earth Sci. 2013, 68, 1903–1911. [Google Scholar] [CrossRef]
- Vyazmensky, A.; Stead, D.; Elmo, D.; Moss, A. Numerical analysis of block caving-induced instability in large open pit slopes: A finite element/discrete element approach. Rock Mech. Rock Eng. 2010, 43, 21–39. [Google Scholar] [CrossRef]
- Salmi, E.F.; Nazem, M.; Karakus, M. Numerical analysis of a large landslide induced by coal mining subsidence. Eng. Geol. 2017, 217, 141–152. [Google Scholar] [CrossRef]
- Laubscher, D. Block caving manual. In Report for the International Caving Study; JKMRC and Itasca Consulting Group: Brisbane, Australia, 2000. [Google Scholar]
- Woo, K.S.; Eberhardt, E.; Elmo, D.; Stead, D. Empirical investigation and characterization of surface subsidence related to block cave mining. Int. J. Rock Mech. Min. Sci. 2013, 61, 31–42. [Google Scholar] [CrossRef]
- Villegas, T.; Nordlund, E. Numerical analysis of the hangingwall failure at the Kiirunavaara mine. In Proceedings of the International Conference & Exhibition on Mass Mining, Luleå, Sweden, 9–11 June 2008; pp. 867–876. [Google Scholar] [CrossRef]
- Shi, Y.; Zhao, M.; Hao, J. Study on numerical models in predicting surface deformation caused by underground coal mining. Geotech. Geol. Eng. 2021, 39, 4457–4473. [Google Scholar] [CrossRef]
- Xu, N.; Kulatilake, P.H.S.W.; Tian, H. Surface subsidence prediction for the WUTONG mine using a 3-D finite difference method. Comput. Geotech. 2013, 48, 134–145. [Google Scholar] [CrossRef]
- Parmar, H.; Yarahmadi, B.A.; Najafi, M. Impact of ground surface subsidence due to underground mining on surface infrastructure: The case of the Anomaly No. 12 Sechahun, Iran. Environ. Earth Sci. 2019, 78, 409. [Google Scholar] [CrossRef]
- Zhao, X.; Yu, W.; Zhao, Y.; Fu, S. Numerical Estimation of Shaft Stability and Surface Deformation Induced by Underground Mining Transferred from Open-Pit Mining in Jinfeng Gold Mine. Minerals 2023, 13, 196. [Google Scholar] [CrossRef]
- Cheng, Q.; Shi, Y.; Zuo, L. Numerical simulation and analysis of surface and surrounding rock failure in deep high-dip coal seam mining. Geotech. Geol. Eng. 2019, 37, 4285–4299. [Google Scholar] [CrossRef]
- Wang, G.; Li, P.; Wu, Q.; Cui, X.; Tan, Z. Numerical simulation of mining-induced damage in adjacent tunnels based on FLAC3D. Adv. Civ. Eng. 2021, 2021, 9855067. [Google Scholar] [CrossRef]
- Huang, G.; Kulatilake, P.H.; Shreedharan, S.; Cai, S.; Song, H. 3D discontinuum numerical modeling of subsidence incorporating ore extraction and backfilling operations in an underground iron mine in China. Int. J. Min. Sci. Technol. 2017, 27, 191–201. [Google Scholar] [CrossRef]
- Xie, J. Stability Study of the Bottom Structure in Progressive Caving Induced by Mining an Inclined Ore Body. Master Thesis, Kunming University of Science and Technology, Kunming, China, 2017. [Google Scholar]
- Xie, W.B.; Chen, X.X.; Zheng, B.S. Research and Analysis on Numerical Simulation Subjects in Mining Engineering; China University of Mining and Technology Press: Xuzhou, China, 2005. (In Chinese) [Google Scholar]
- Kumar, R.; Choudhury, D.; Bhargava, K. Simulation of rock subjected to underground blast using FLAC3D. Jpn. Geotech. Soc. Spec. Publ. 2016, 2, 508–511. [Google Scholar] [CrossRef]
- Vyazmensky, A. Numerical Modelling of Surface Subsidence Associated with Block Cave Mining Using a Finite Element/Discrete Element Approach. Ph.D. Thesis, Fraser University, Burnaby, BC, Canada, 2008. [Google Scholar]
- Villegas Barba, T.F.; Nordlund, E. Numerical analyses of the hangingwall failure due to sublevel caving: Study case. Int. J. Min. Miner. Eng. 2013, 4, 201–223. [Google Scholar] [CrossRef]
- Helm, P.R.; Davie, C.T.; Glendinning, S. Numerical modeling of shallow abandoned mine working subsidence affecting transport infrastructure. Eng. Geol. 2013, 154, 6–19. [Google Scholar] [CrossRef]
- Hoek, E.; Marinos, P. A brief history of the development of the Hoek-Brown failure criterion. Soils Rocks 2007, 30, 85–92. [Google Scholar] [CrossRef]


| Rock Formation | Moraine Cover Layer | Subside | |
|---|---|---|---|
| 2760 | 2100 | 2100 | |
| E / | 4.5 | 0.46 | 0.40 |
| v | 0.25 | 0.11 | 0.1 |
| 0.88 | 0.056 | 0.051 | |
| 1.06 | 0.126 | 0.110 | |
| 27.8 | 34.9 | 32.1 |
| Interfacial | |
|---|---|
| Stiffness-shear / | 0.2 |
| Stiffness-normal / | 0.2 |
| 17 |
Disclaimer/Publisher’s Note: The statements, opinions and data contained in all publications are solely those of the individual author(s) and contributor(s) and not of MDPI and/or the editor(s). MDPI and/or the editor(s) disclaim responsibility for any injury to people or property resulting from any ideas, methods, instructions or products referred to in the content. |
© 2024 by the authors. Licensee MDPI, Basel, Switzerland. This article is an open access article distributed under the terms and conditions of the Creative Commons Attribution (CC BY) license (https://creativecommons.org/licenses/by/4.0/).
Share and Cite
Li, Z.; Hou, K.; Li, T.; Tang, J.; Lu, G. Numerical Simulation of Surface Subsidence and Fracture Evolution Caused by Pulang Copper Mine Mining. Appl. Sci. 2024, 14, 2416. https://doi.org/10.3390/app14062416
Li Z, Hou K, Li T, Tang J, Lu G. Numerical Simulation of Surface Subsidence and Fracture Evolution Caused by Pulang Copper Mine Mining. Applied Sciences. 2024; 14(6):2416. https://doi.org/10.3390/app14062416
Chicago/Turabian StyleLi, Zhengrong, Kepeng Hou, Tong Li, Jingtian Tang, and Guangyin Lu. 2024. "Numerical Simulation of Surface Subsidence and Fracture Evolution Caused by Pulang Copper Mine Mining" Applied Sciences 14, no. 6: 2416. https://doi.org/10.3390/app14062416
APA StyleLi, Z., Hou, K., Li, T., Tang, J., & Lu, G. (2024). Numerical Simulation of Surface Subsidence and Fracture Evolution Caused by Pulang Copper Mine Mining. Applied Sciences, 14(6), 2416. https://doi.org/10.3390/app14062416