Abstract
Gas hydrate has gradually become a new potential energy resource. However, some engineering and environmental problems related to the mechanical properties of gas hydrate-bearing sediments (GHBS) during gas recovery may occur. Many studies have been carried out on the basic mechanical properties of GHBS samples based on laboratory tests, but their evolution characteristics and suitable models require further research. Based on a series of data analyses of published laboratory experimental results on GHBS samples with different hydrate saturations under various confining pressures, the evolution characteristics of strength and dilation parameters were investigated. It was found that cohesion (c) increases quickly to a peak value and then decreases gradually to a residual value with an increasing plastic shear strain, and the samples with higher hydrate saturations have higher initial values, peak values, and residual values of cohesion (c). The internal friction angle () increases quickly with increasing plastic shear strain and then becomes stable at a residual value for all the samples with different hydrate saturations. The dilation angle () increases from negative to positive values with increasing plastic shear strain and then becomes stable at a residual value. These characteristics are likely to be related to the compaction occurring at the early stage of compression before expansion due to dilation. In this paper, a non-linearly fitted model is proposed considering the evolution of the mechanical parameters, and the verification tests show that the proposed model can simulate the stress–strain behaviors of the GHBS samples well. This model is also adopted in the stability analysis of submarine slopes containing hydrate reservoirs. The analytical approach is developed, accompanied by the strength reduction method.
1. Introduction
Gas hydrate is expected to become a promising potential energy resource around the world because it contains large amounts of natural gas [1,2,3,4,5]. In China, it is mainly distributed in ocean areas and partially in permafrost areas. It always occurs in silt, clayey silt, sand, or other unconsolidated sediments [2,3,4,5,6,7,8]. During the process of gas extraction, the strength of gas hydrate-bearing sediments (GHBSs) may decrease and the stress state may change in the reservoir [9,10], which may eventually lead to some engineering and environmental problems such as borehole instability, collapse of stratum, landslides, etc., threatening the safe gas recovery from the gas hydrate reservoirs [11,12,13,14].
Extensive research has been carried out on GHBS samples based on laboratory experiments [15,16,17,18,19,20]. Considering different factors, including hydrate saturations, sediment materials (sand types), confining pressures, etc., many studies have investigated the mechanical properties of GHBS specimens, such as deformation and damage characteristics, stress–strain behaviors, elastic properties (Young’s modulus and Poisson’s ratio), strength parameters (cohesion and internal friction angle), etc. [9,15,17,18,21]. These studies have provided basic knowledge for the safe recovery of gas in hydrate reservoirs.
Nevertheless, the strength parameters in these studies are always obtained based on the peak strength of the specimens under various confining pressures [19,22,23]. This is enough for building a strength criterion or a perfect elastoplastic constitutive model. However, the test results show that strain hardening and softening behaviors are very common for most GBHS samples [15,18,23,24]. The previous studies also demonstrate that the strength parameters should be mobilized instead of being constant during the process of plastic deformation and damage [25,26].
In order to describe the post-yielding behaviors of geomaterials, the evolution of strength parameters is introduced into the constitutive model. On the one hand, some studies assume that both cohesion and the internal friction angle decrease with increasing damage [27,28,29]. On the other hand, based on some experimental observations and analyses, some studies argue that cohesion will drop while the internal friction angle may increase during the yielding and damage process. Thereafter, the CWFS (Cohesion Weakening Friction Strengthening) model was proposed and applied in engineering modeling [30,31,32,33,34]. However, most of these studies were conducted on rock specimens. The evolution characteristics of the strength parameters of the GHBS samples should still be determined.
The dilation angle is also an important parameter to describe the stress–strain behaviors of geomaterials. Instead of using a constant value of the dilation angle, as in many studies [23,34,35], some studies have demonstrated that the dilation angle should also be mobilized during the damage process, and some mobilized models of dilation angle for rock have been proposed [36,37,38]. Nonetheless, the evolution characteristics of the dilation angle of GHBS samples still need to be studied. Pinkert et al. [39,40] gave some equations considering the evolution of the cohesion, internal friction angle, and dilation angle of GHBS samples, but it seems that these equations were introduced from previous studies on other geomaterials like sand or soil. The specific evolution characteristics still need to be researched based on experiments on GHBS samples with different hydrate saturations.
Based on the above-mentioned background and problems, this study will carry out a series of data analyses to investigate the evolution characteristics of the strength and dilation parameters of GHBS samples. Thereafter, this paper will propose a suitable model considering the evolutionary mechanical parameters and discuss an approach to applying this model in engineering. Section 2 will introduce the analytical method for studying the evolution characteristics of the strength and dilation parameters of gas hydrate-bearing sediments. Section 3 will provide a discussion of the evolution characteristics of strength parameters and mechanism and provide a mobilized model of the strength parameters. Section 4 will explore the evolution characteristics and mechanism of the dilation angle, as well as the mobilized model for the dilation angle. In Section 5, the proposed model will be verified by comparing the numerical modeling and laboratory testing results. In Section 6, the proposed model will be applied in a stability analysis on a submarine slope containing hydrate reservoirs, and its analytical approach will be discussed.
2. Analytical Method
The data for this study are the complete stress–strain curves at both the axial and lateral directions from the laboratory experimental results by Miyazaki et al. [15]. A series of drained triaxial compression experiments is reported on artificial GHBS samples, considering different hydrate saturations ( = 0%, 27~34%, and 41~45%) and effective confining pressures ( = 0.5, 1, 2, and 3 MPa). The skeletons of the samples were made from Toyoura sand with an average particle size of 0.230 mm. The axial strain rate was set as 0.1% min−1 during the experimental process. Please refer to [15] for more detailed information about the samples and experiments. The collected data from the stress–strain curves in [15] were combined with the analytical method, which will be introduced next in Section 2.1 and Section 2.2. This allowed for the evolution characteristics of strength and dilation parameters to be analyzed.
2.1. Analytical Method for the Strength Parameters of Gas Hydrate-Bearing Sediments
Mohr–Coulomb (M-C) strength criterion is always used to describe the strength property of gas hydrate-bearing sediments; therefore, cohesion (c) and the internal friction angle () are two important strength parameters [23,36]. As a widely accepted yielding parameter, plastic shear strain () [32,33,34,36] is adopted here to investigate the evolution of strength parameters during the yielding process. A common approach to calculating plastic shear strain is shown in the following equation [26,38]:
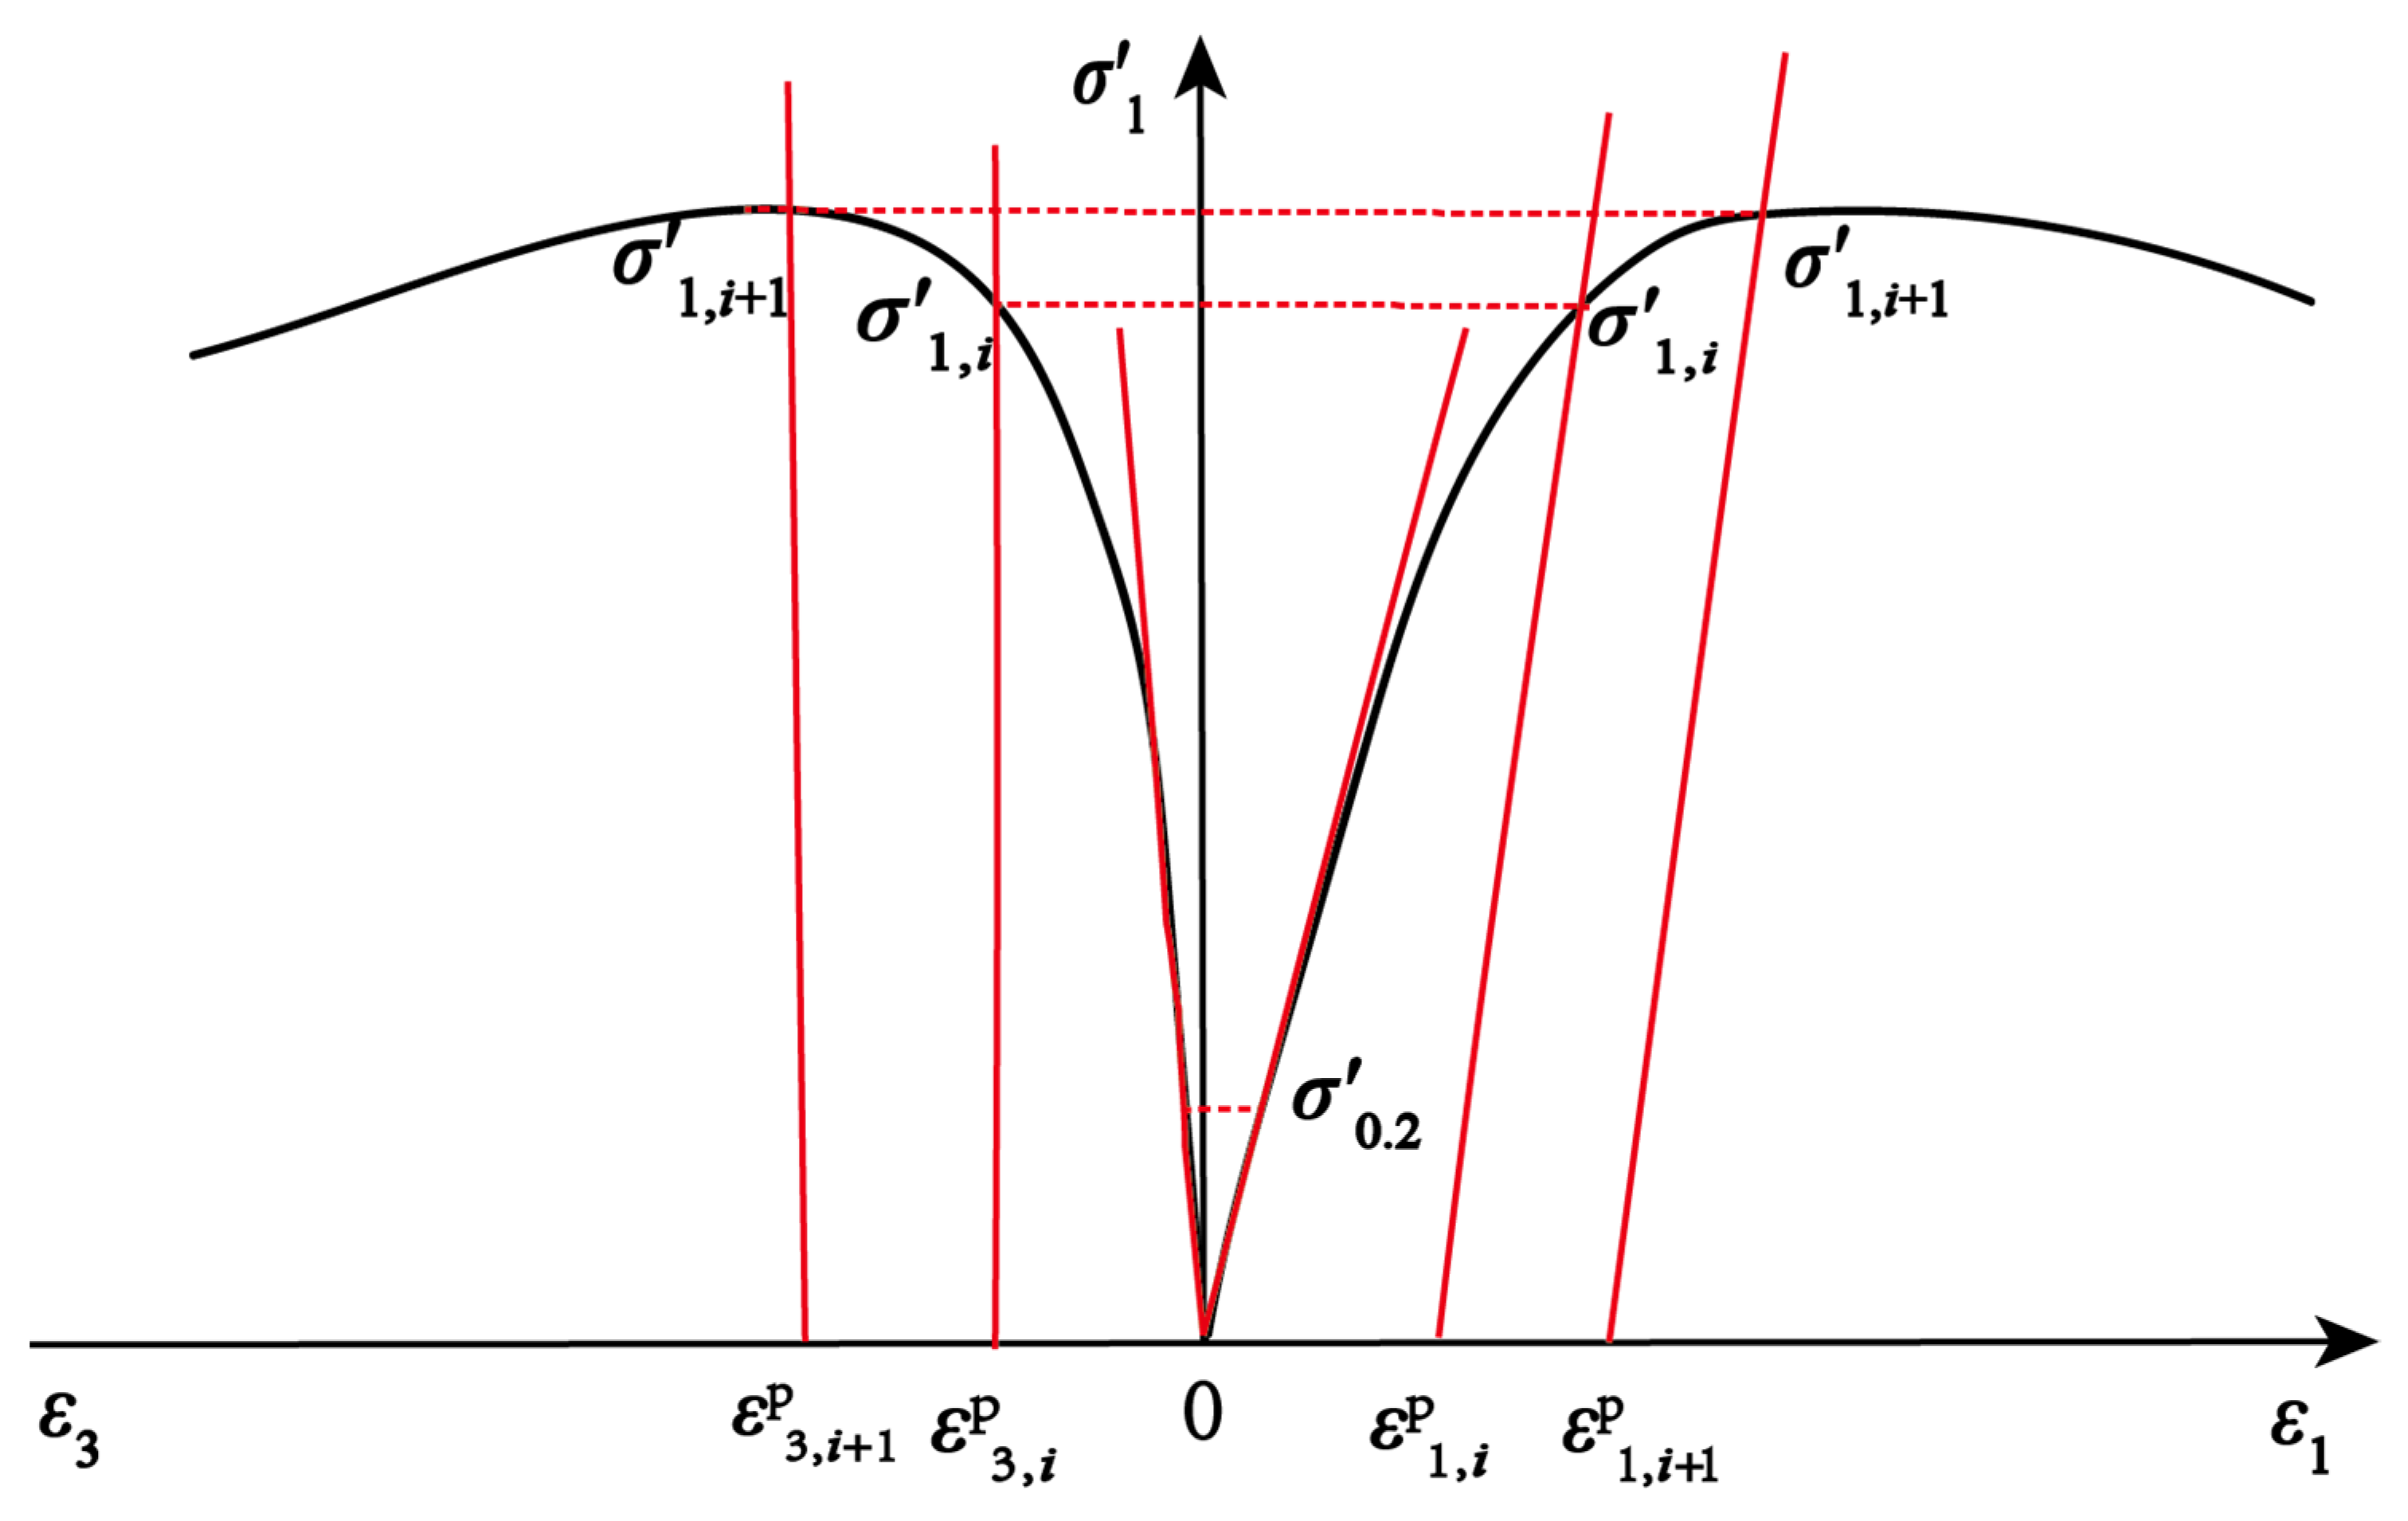
where and are the axial and lateral plastic strain measured in the triaxial compression experiments, respectively. By conducting cyclic loading–unloading tests, plastic strain can usually be obtained according to the irreversible strain in each cycle. However, there should be a lot of cycles for recording a detailed evolution process with increasing plastic strain, and it is not easy to carry out a series of tests with so many cycles. Hence, a simplified method is used extensively in many research studies by assuming a series of unloading stress–strain curves with a certain unloading modulus in every cycle [34,38,41,42]. It should be noted that the unloading modulus indicates the slope of the unloading stress–strain curve. In this way, at any post-yielding stress level, the irreversible plastic strain can be calculated. This method will be introduced in more detail in Figure 1 as follows:

Figure 1.
Sketch of the method for determining plastic strains at the corresponding stress levels.
- (1)
- Identifying the yielding stress. According to the stress–strain curve under triaxial compression, the elastic stage of GHBS samples is not as obvious as that of rock samples. In this study, the yielding stress is defined as the stress level at which the axial strain reaches 0.2% (i.e., , as shown in Figure 1). The period before this stress level is considered as the elastic stage, and the secant modulus based on is adopted to define the initial modulus.
- (2)
- Identifying the plastic strain for each cycle. For each stress level at the post-yielding stage, a line can be drawn with the tangent value equal to the unloading modulus, and the plastic axial strain can be obtained. In the research on rock samples, the unloading modulus is usually considered to be equal to the initial modulus [26,34,36,38]. Nevertheless, it is found that the unloading modulus is about 4~8 times the initial modulus for the GHBS samples [23]. So, the unloading modulus should be identified according to the tested properties of the GHBS samples. In a similar way, the lateral plastic strain can also be identified for each stress level .
For each stress level , the plastic shear strain can be calculated by based on Equation (1). Thereafter, a series of stress levels can be obtained with increasing plastic shear strain at different effective confining pressures . Based on the Mohr–Coulomb strength criterion, for each plastic shear strain , cohesion (c) and the internal friction angle () can be calculated by drawing Mohr circles or by linear fitting of and with the following equation:
Accordingly, the evolution characteristic of cohesion (c) and the internal friction angle () can be analyzed with the increasing plastic shear strain .
2.2. Analytical Method for the Dilation Parameter of Gas Hydrate-Bearing Sediments
The dilation angle is an important parameter for describing the dilation behavior of geomaterials, and it is always used in the plastic potential function defined as Equation (3) [43]:
where is the plastic potential function, and are the maximum and minimum principal stress, respectively, is the dilation angle, and const. means a constant value.
The dilation angle can be calculated according to Equation (4) [43]:
where and are the axial and volumetric plastic strain increments, respectively. It is well known that their values are related to the plastic shear strain , and they can also be obtained with the method introduced in Section 2.2. In this way, the evolution of the dilation angle can also be analyzed during the yielding process with increasing plastic shear strain .
3. Evolution Characteristics of the Strength Parameters of Gas Hydrate-Bearing Sediments
In order to calculate the values of strength parameters (c and ) during the yielding process with the method introduced in Section 2, the unloading modulus for the stress–strain curves should be identified first. By conducting a series of cyclic loading–unloading experiments on GHBS samples with Toyoura sand, Miyazaki et al. [23] found that the unloading modulus is not constant at different cycles; however, the change is not significant compared with the variation affected by hydrate saturation. Hence, the unloading modulus can be considered as a constant value at different plastic strains for the samples with the same hydrate saturation. Based on a linear fitting of the data of the unloading modulus reported in [23], the unloading modulus can be obtained as 1.2, 2.4, and 3.0 GPa for the samples with the hydrate saturations = 0%, 27~34%, and 41~45%, respectively. Nonetheless, the unloading–reloading curves for the lateral strain were not analyzed in reference [23]. In this study, we assume that the ratios between the unloading modulus and the initial modulus are the same for both the axial stress–axial strain and axial stress–lateral strain curves. Consequently, the unloading modulus for the axial stress–lateral strain curves can be calculated as −14.4, −20.3, and −30.1 GPa for the samples with the hydrate saturation = 0%, 27~34%, and 41~45%, respectively. Thereafter, plastic shear strain can be calculated at any stress level according to the method introduced in Section 2.
A series of strength parameters (c and ) can be obtained and plotted as the scattered data points in Figure 2 with the increasing plastic shear strain based on Equation (2). The evolution characteristics of strength parameters (c and ) can be concluded as follows:
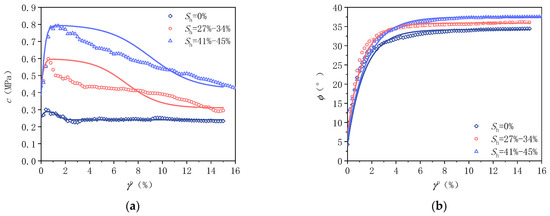
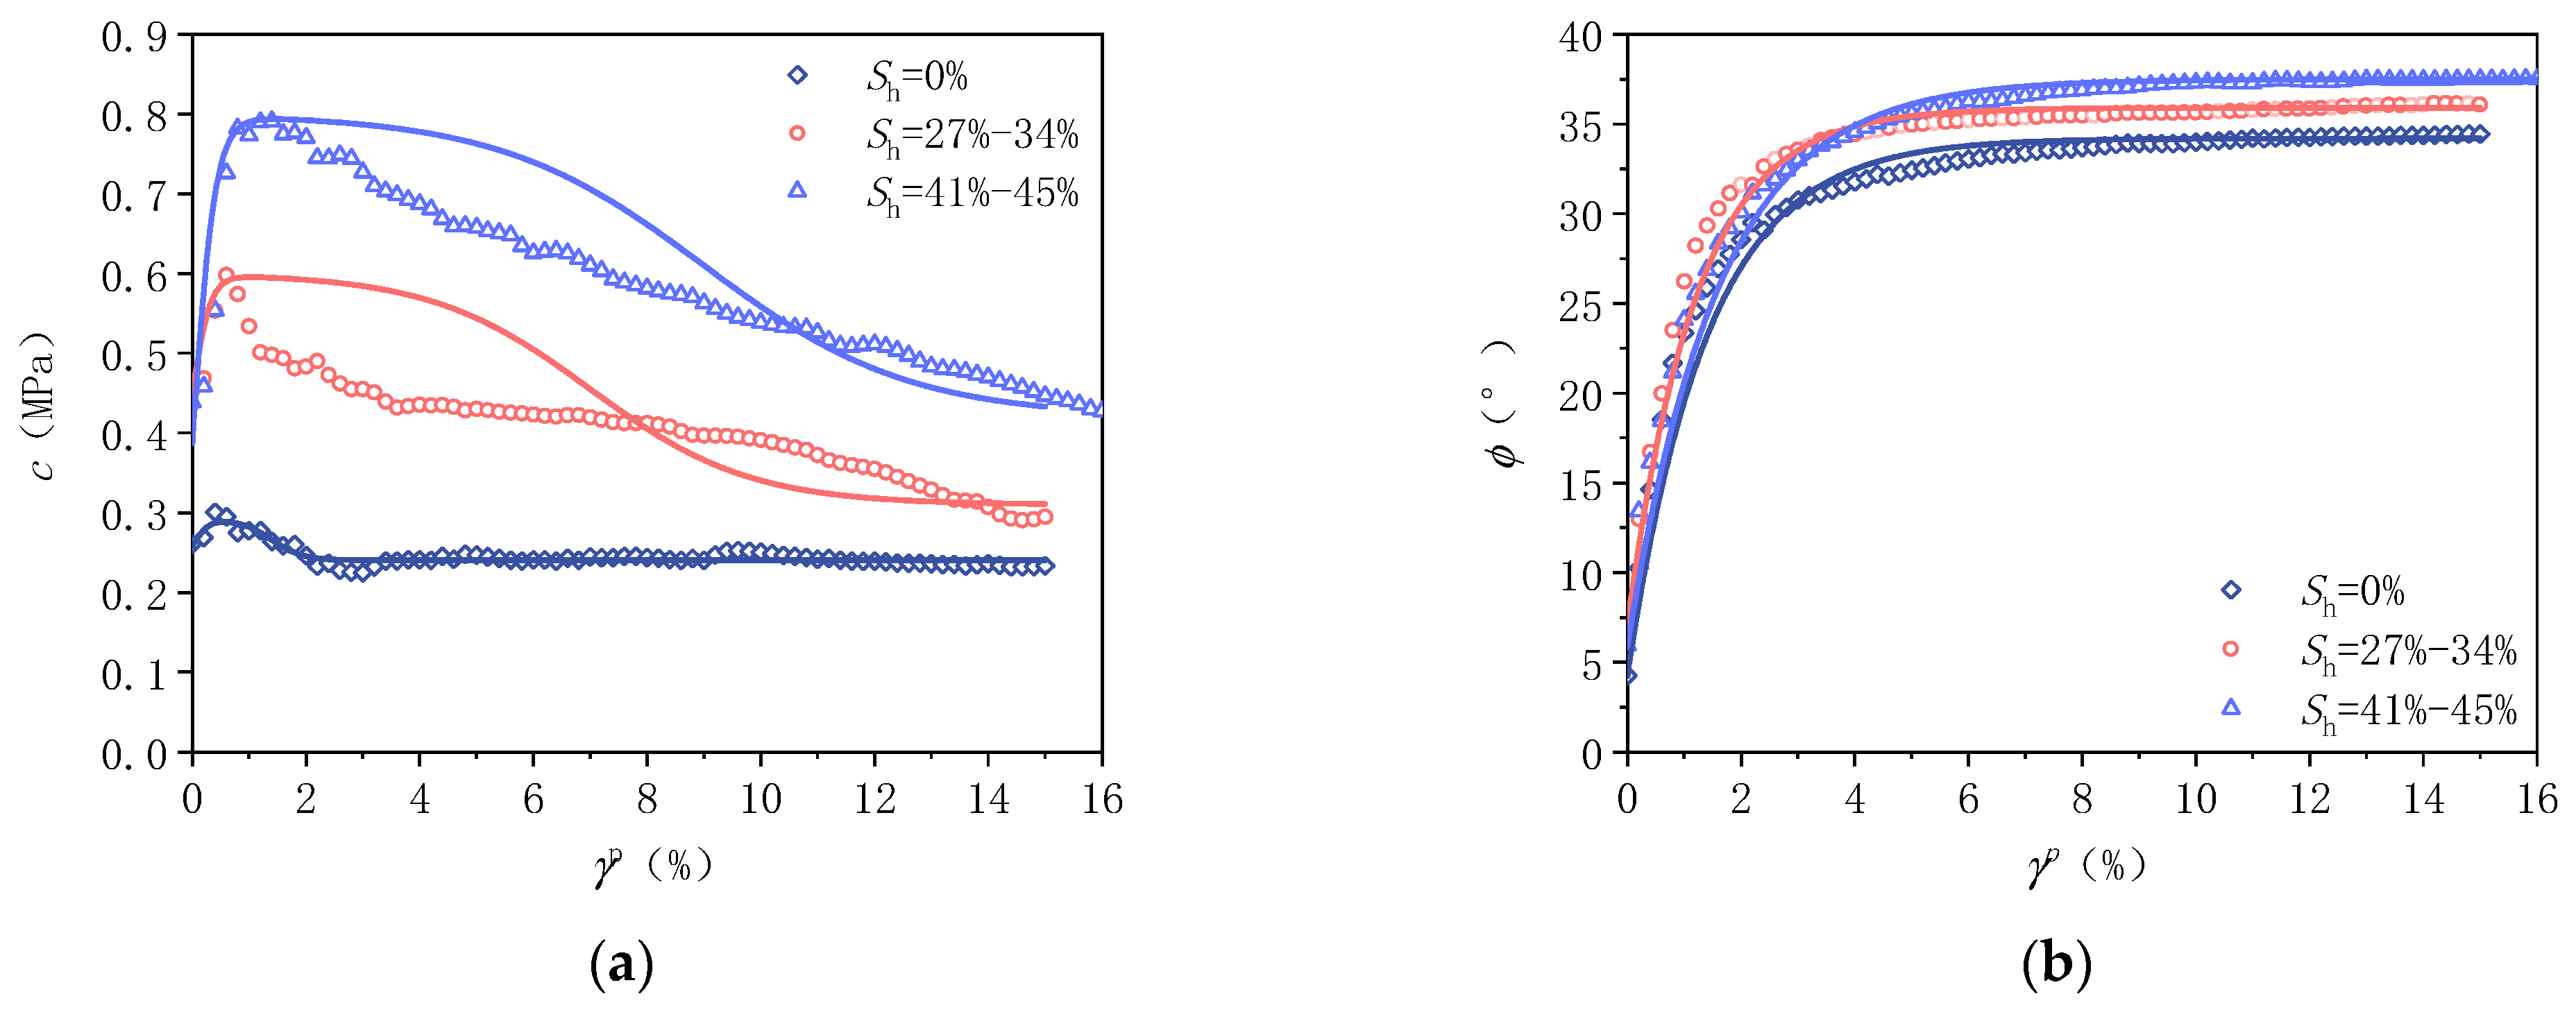
Figure 2.
Evolution of (a) cohesion c and (b) the internal friction angle (the scattered data points) and the non-linearly fitted curves of GHBS samples with different hydrate saturations. The analyses are based on the experimental data from [15] with permission.
- (1)
- It can be observed that cohesion (c) increases quickly to a peak value and then decreases gradually to a residual value for the samples with different hydrate saturations (Figure 2a). Comparatively, previous studies show that only a decrease in cohesion (c) occurs for the rock samples [25,27,29,30,31]. The increasing stage should correspond to the compaction of the particles in the GHBS samples at the early stage of compression. The compaction was reported in [15] by analyzing the volumetric strain, while this behavior is not obvious in most rock samples. As the loading continues, dilatant behavior starts to occur [15], and cohesion (c) begins to drop.
- (2)
- The samples with higher hydrate saturations have higher initial values, peak values, and residual values of cohesion (c) (Figure 2a). This is probably due to the cementation effect of hydrate between sand grains [15]. However, cohesion (c) drops more significantly after the peak value for the samples with higher hydrate saturations, and this phenomenon is probably the result of a more significant degradation of the cementation effect during the dilatant stage of the samples with higher hydrate saturations.
- (3)
- The internal friction angle () increases quickly with increasing plastic shear strain and then becomes stable at a residual value for all the samples with different hydrate saturations (Figure 2b). The increase in should be due to the enhanced friction effect between the particles led by the compaction of the specimens.
- (4)
- For the plastic shear strain between 0 and 4%, the values of are very close for the samples with various hydrate saturations. When the plastic shear strain is higher than 4%, the samples with higher hydrate saturations have higher internal friction angles () during the whole test process with increasing plastic shear strain (Figure 2b). This indicates that the existence of hydrate supplies more friction effect between the particles. Nevertheless, the improvement in is not very significant when the hydrate saturation grows from 0% to 41~45%.
According to the above-mentioned data analyses of the evolution characteristics of strength parameters, the evolution models of cohesion (c) and the internal friction angle () with plastic shear strain can be obtained by non-linear fitting of the data (Figure 2), and the fitted equations for c and are presented in Equations (5) and (6), respectively.
where ci and i are the initial values of cohesion and the internal friction angle (when = 0), respectively, and cr and r are their residual values. is the plastic shear strain value corresponding to the maximum cohesion cmax. and refer to the corresponding plastic shear strain values when cohesion and the internal friction angle reach their residual values cr and r, respectively. The above-mentioned physical meanings of these parameters can be illustrated clearly according to a series of sensitive analyses presented in Appendix A.
The fitted parameters are listed in Table 1 and Table 2. According to Figure 2, generally speaking, the data points can be fitted well with Equations (5) and (6). Although the fitting is not very precise for the data points of cohesion c when the hydrate saturation is higher, according to Figure 2a, Equation (5) can describe the general evolution characteristics of cohesion c, i.e., c goes up quickly to a peak value and then decreases to a residual value. Furthermore, Equation (5) has simple parameters with clear physical meanings, so it is more acceptable than a very complicated equation with too many parameters. In addition, the model verification, which will be introduced in Section 5, also shows the validation and applicability of these equations.

Table 1.
Fitted parameters for the evolution model of cohesion (c).
Table 2.
Fitted parameters for the evolution model of the internal friction angle ().
4. Evolution Characteristics of the Dilation Parameter of Gas Hydrate-Bearing Sediments
The data for this study are also from the laboratory experiment results by Miyazaki et al. [15]. The axial and lateral plastic strains are also obtained based on the method introduced in Section 2.2. Consequently, a series of dilation angles () can be calculated corresponding to different values of plastic shear strain. These data are plotted as scattered data points in Figure 3 for analyzing the evolution of the dilation angle for the GHBS samples with different hydrate saturations at various effective confining pressures. The main evolution characteristics can be observed as follows:

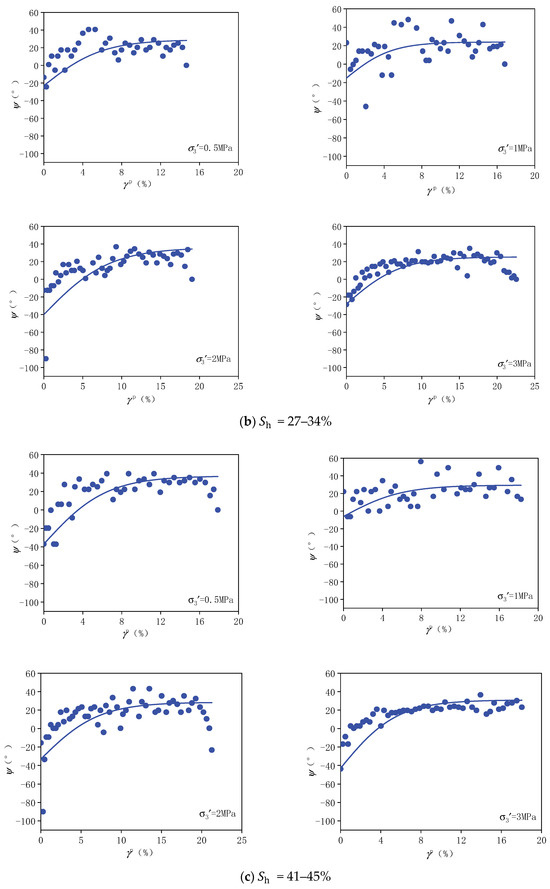
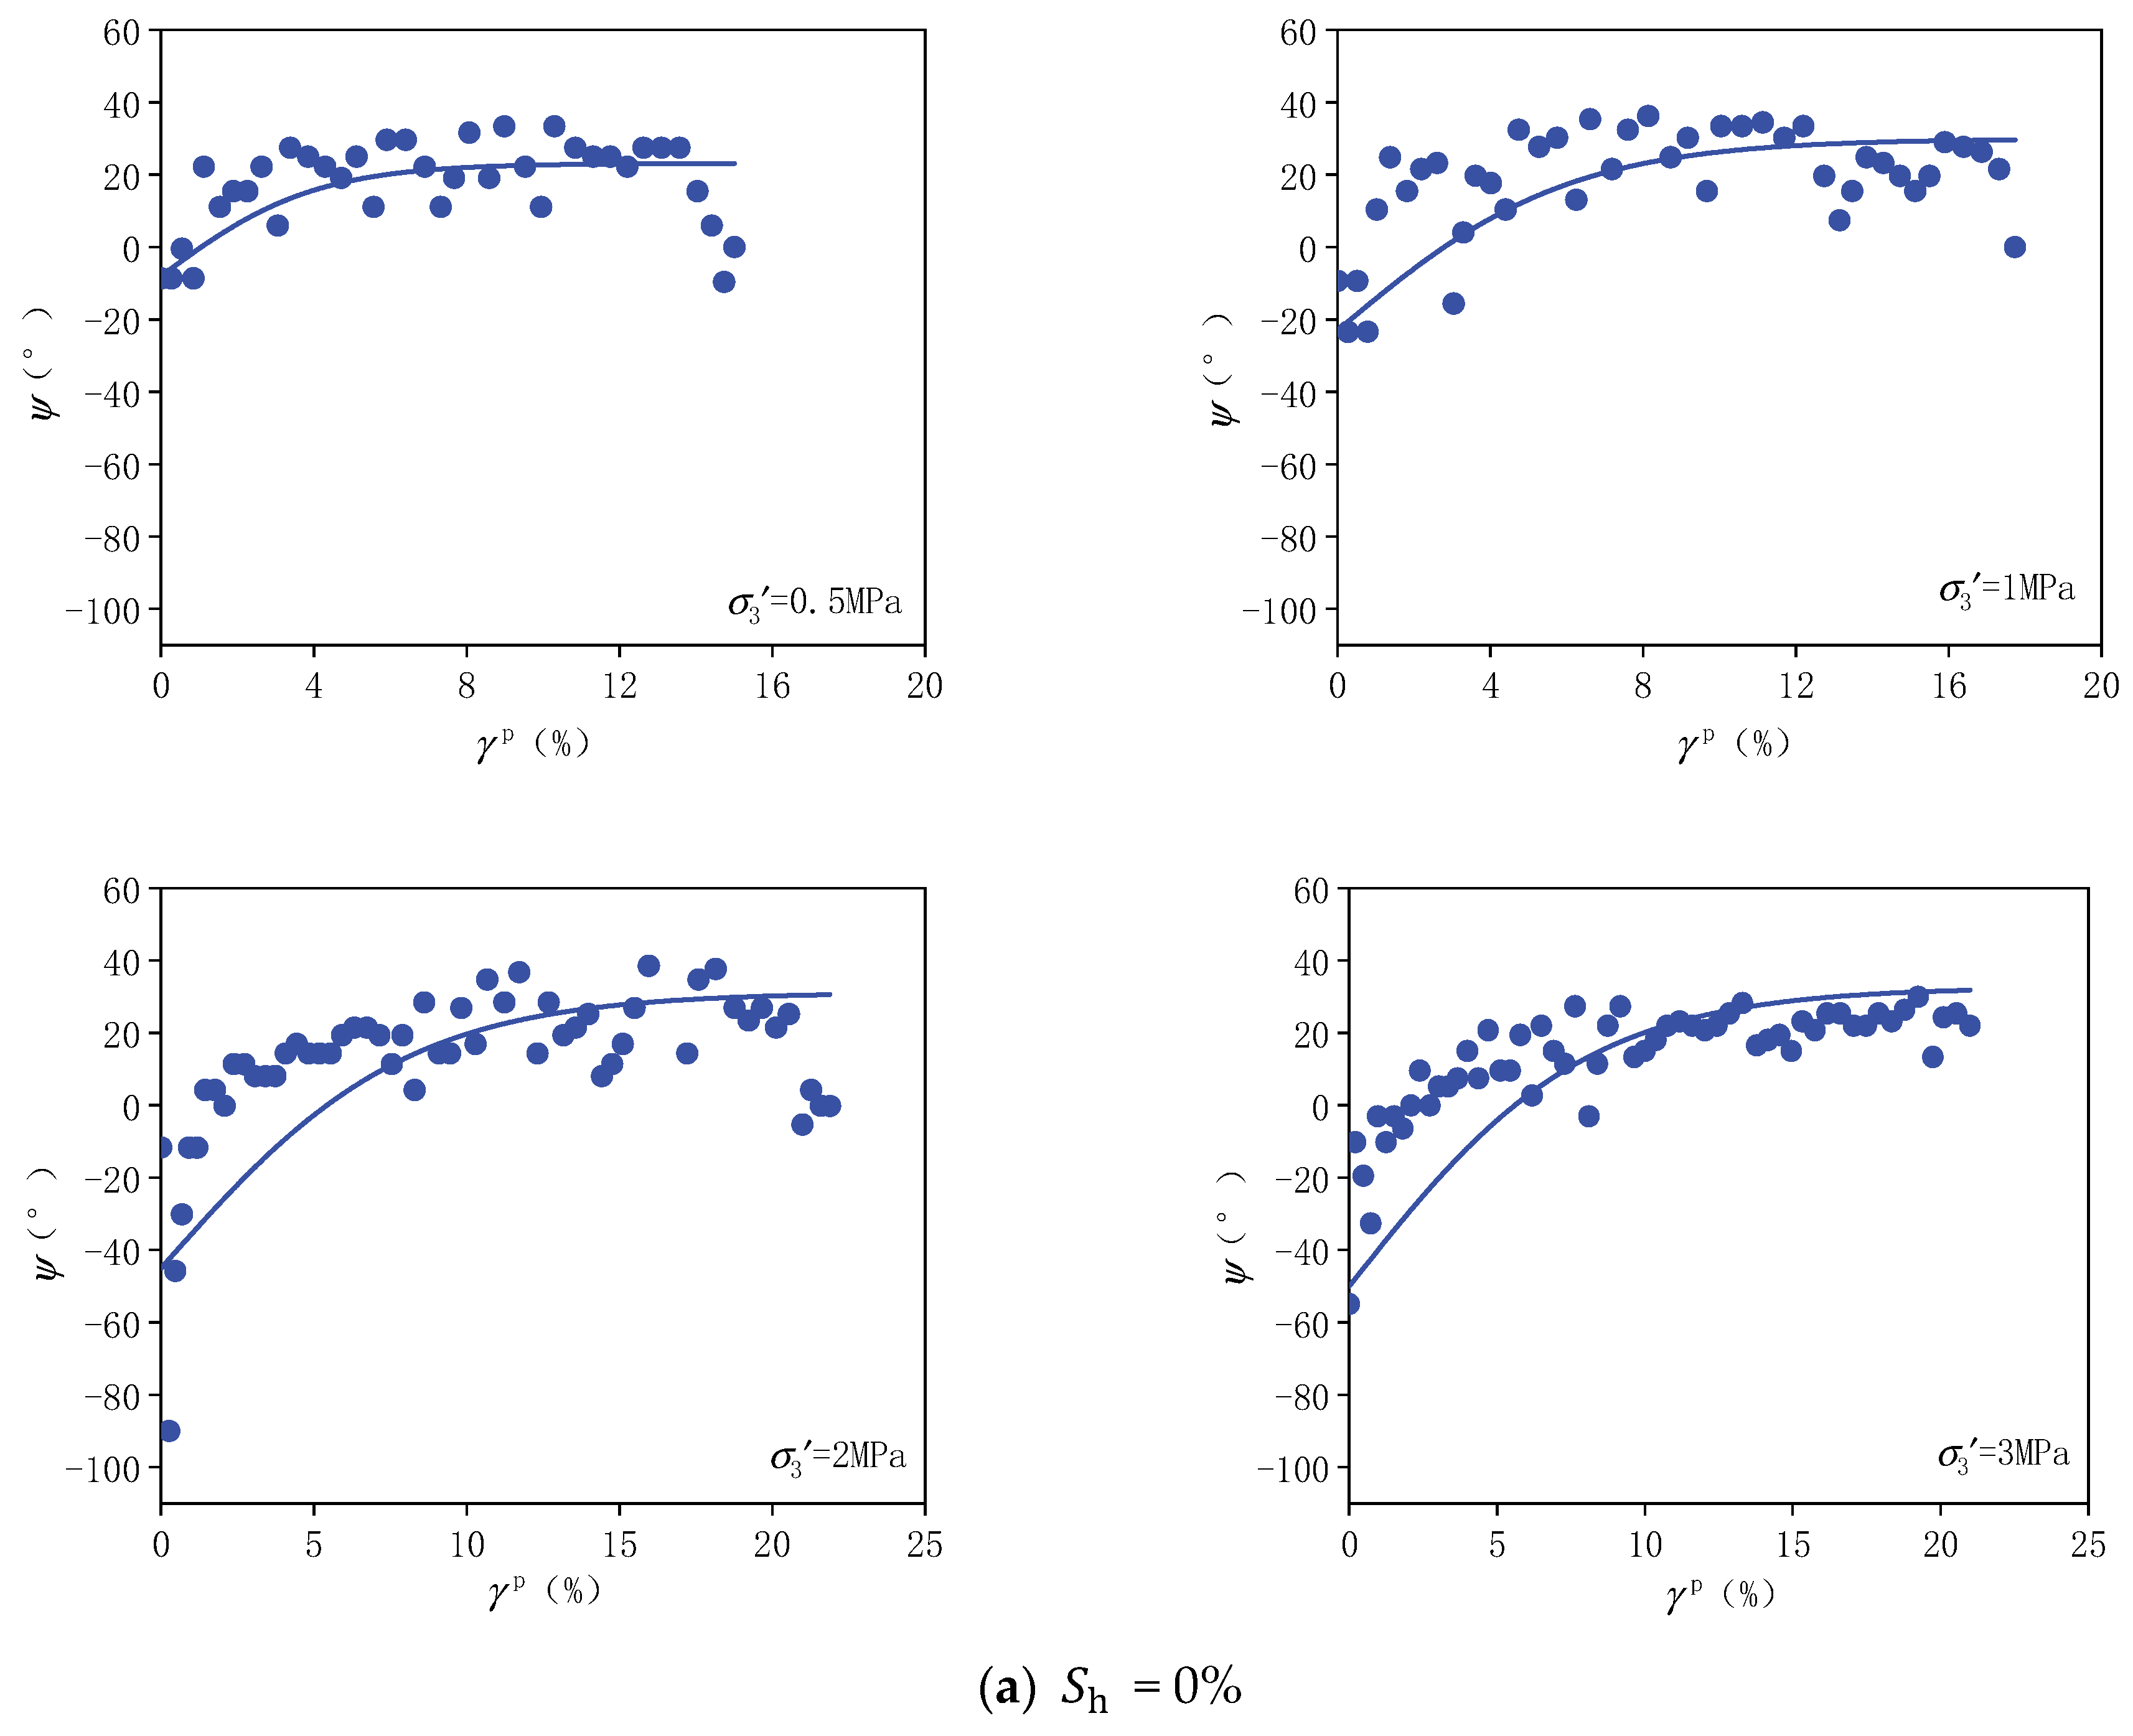
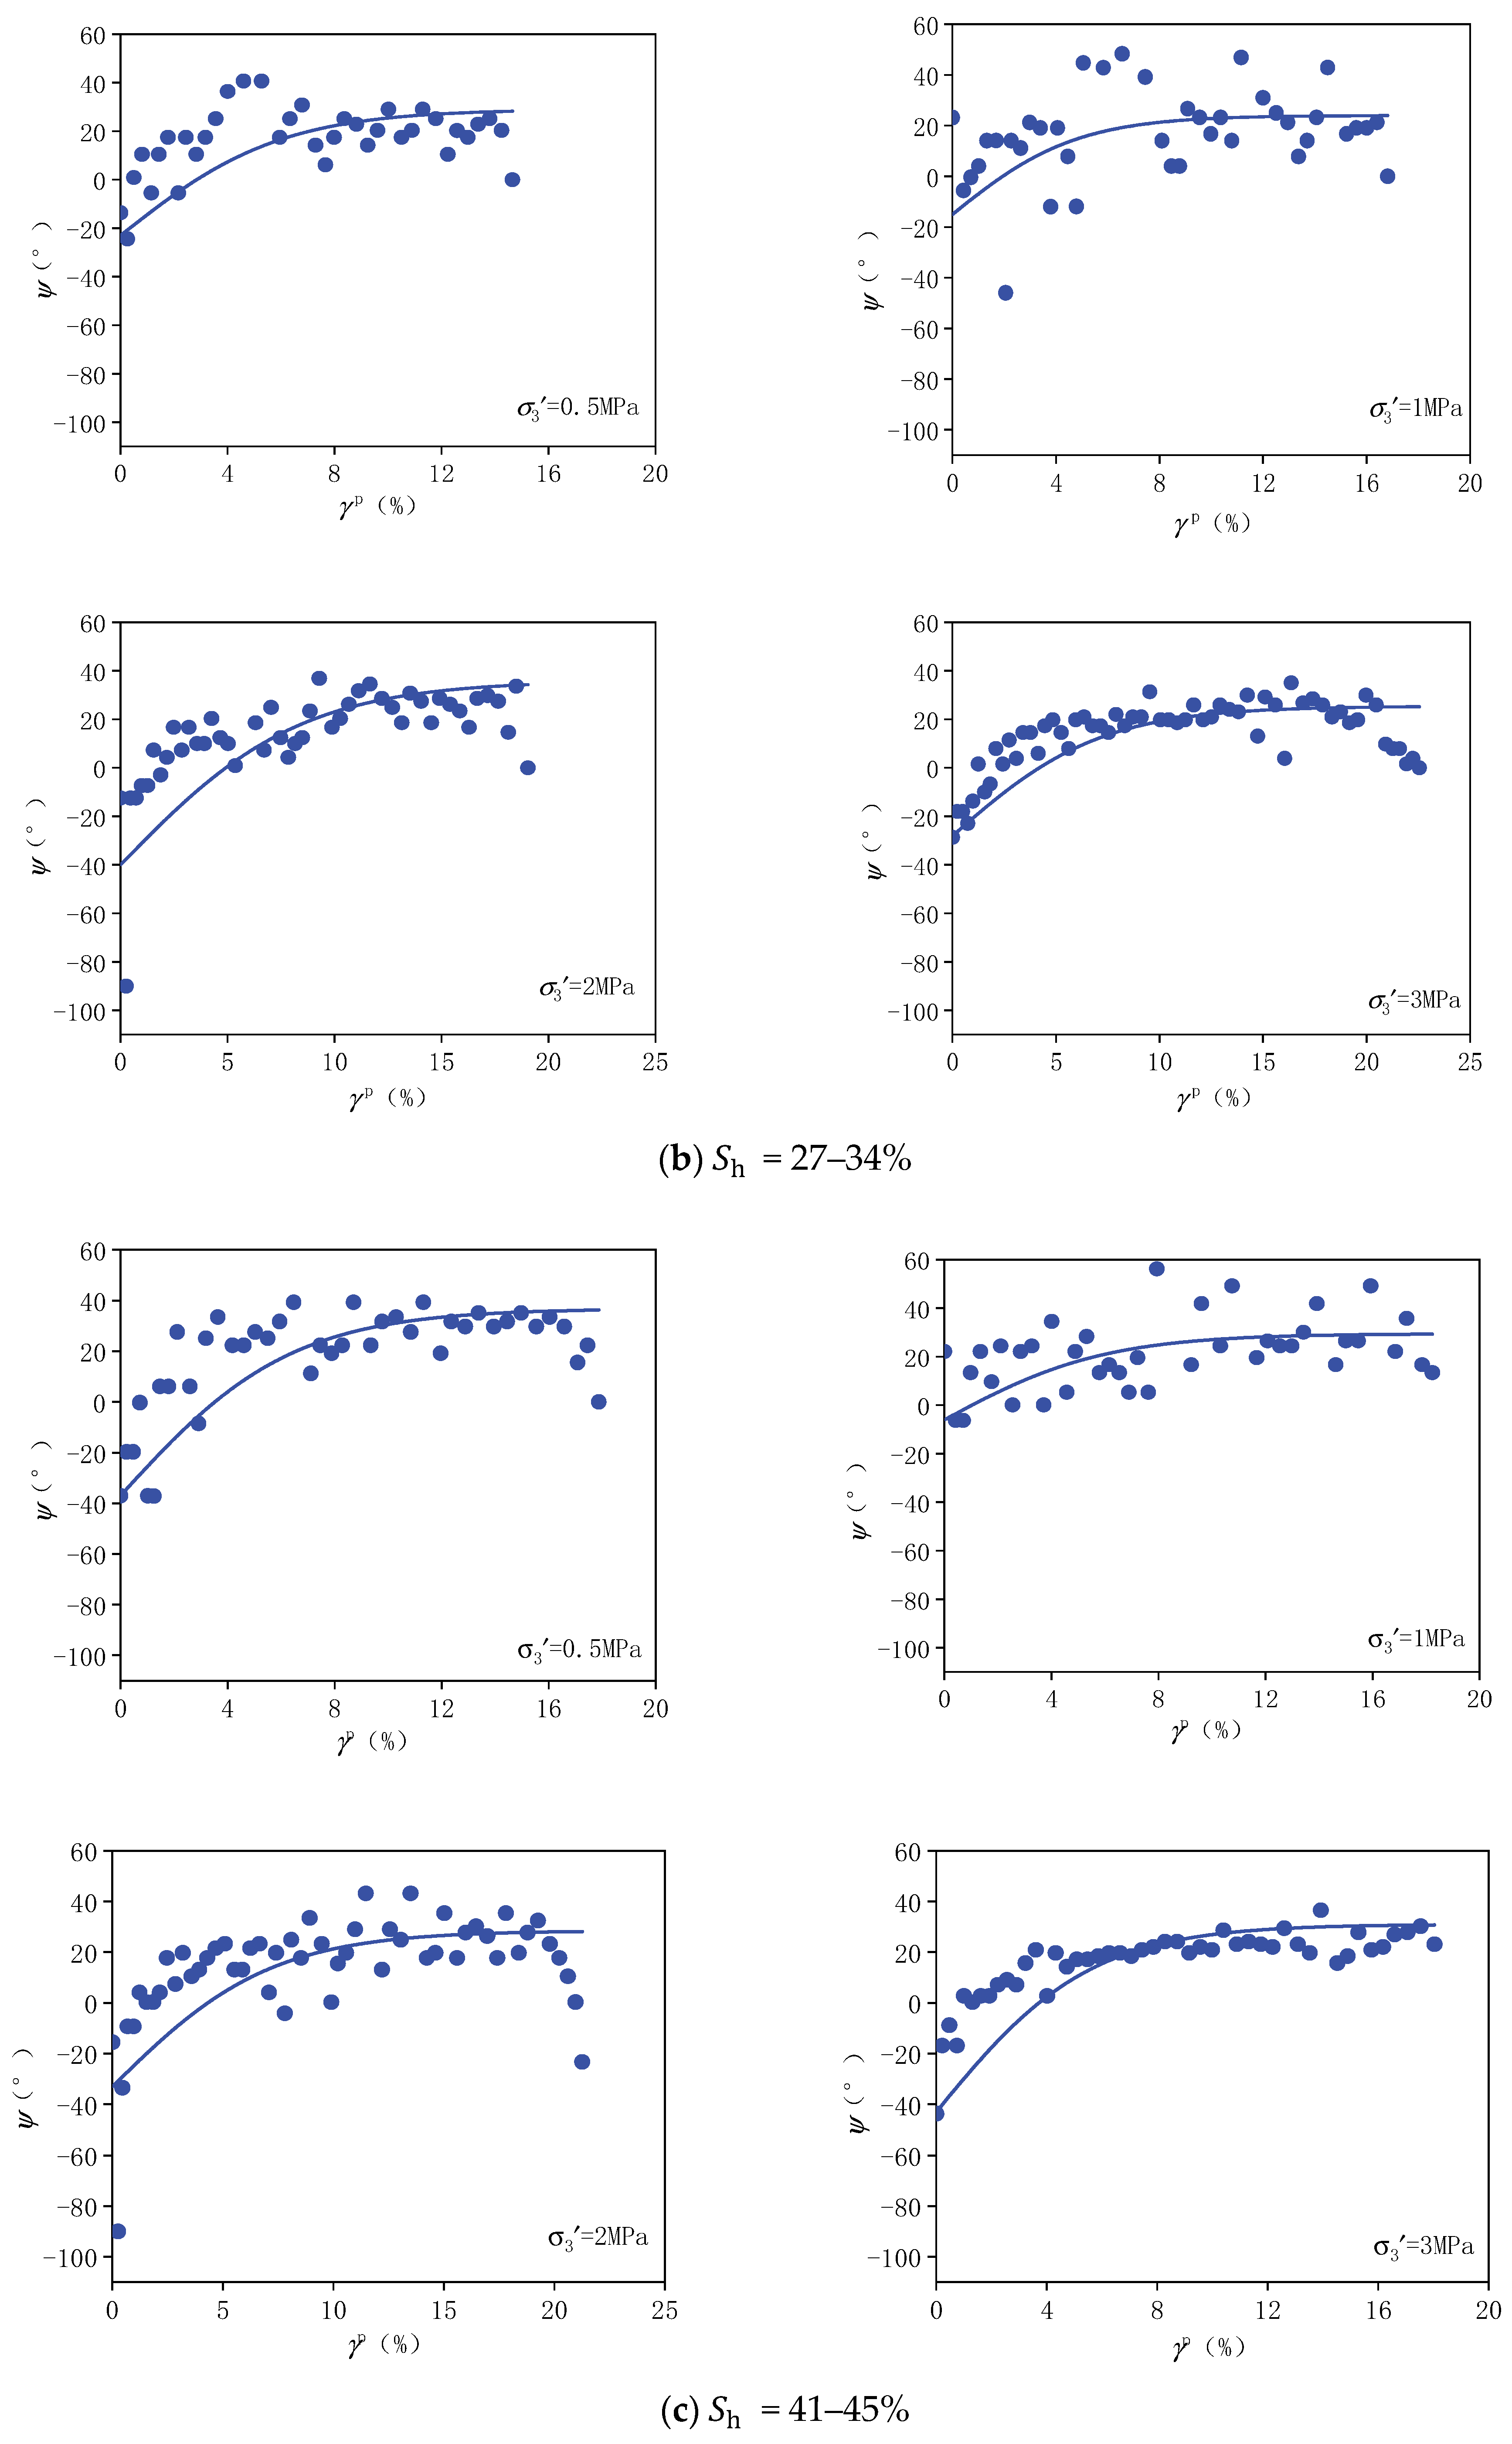
Figure 3.
Evolutionary dilation angle (the scattered data points) and the fitted curves of GHBS samples with different hydrate saturations ((a) = 0%, (b) = 27–34%, and (c) = 41–45%) under various confining pressures. The analyses are based on the experimental data from [15] with permission.
- (1)
- For all the samples with different hydrate saturations at various effective confining pressures, the dilation angle increases with increasing plastic shear strain and then becomes stable at a residual value. Specifically, it can be observed that the dilation angles are negative at the early stage and then grow to be positive gradually. The negative dilation angle indicates plastic contraction, while the positive value means an irreversible increase in volume [38]. Therefore, the evolution characteristics observed in the tests on the GHBS samples show a good agreement with the deformation behaviors reported in [15], i.e., compaction occurs at the early stage of compression before expansion happens due to dilation.
- (2)
- The samples with higher hydrate saturations show higher dilation angles (). This feature coincides well with the observation reported in [15] that samples with higher hydrate saturations show more obvious dilation behaviors because of a higher proportion of the solid component. However, this difference is not so significant when the effective confining pressure is higher ( = 2 and 3 MPa) because the effective confining pressure has a limitation effect on the dilation behavior.
Based on the data of the dilation angle, a mobilized model for the dilation angle of GHBS samples can be obtained by non-linear fitting. The fitted curves are presented in Figure 3. The fitted equation can be adopted to describe the evolution of the dilation angle as shown in Equation (7):
where refers to the initial value of the dilation angle, i.e., the value of the dilation angle when the plastic shear strain value is 0; is the residual value of dilation angle. refers to the value of the plastic shear strain corresponding to the residual value of the dilation angle. The above-mentioned physical meanings of these parameters are demonstrated in the sensitive analyses presented in Appendix B.
Table 3 shows the values of the fitted parameters in the evolution equation of the dilation angle.
Table 3.
Fitted parameters for the evolution model of the dilation angle.
According to Table 3, it can be seen that the parameters , , and are dependent on the hydrate saturation and effective confining pressure . The functions of , , and are dependent on and can be analyzed by fitting the data in Table 3. Taking the parameters as an example, the fitting procedure is introduced briefly as follows:
- (1)
- For each certain hydrate saturation , the relation between and the effective confining pressure is fitted first. Based on the data in Table 3, it is found that this relation generally follows a linear equation for the samples with different hydrate saturations , and this equation can be expressed as:
Table 4. Fitted values of parameters m and n for determining .
- (2)
- The hydrate saturation is incorporated in the fitting. According to Table 4, it can be found that both m and n can be defined as linear functions of the hydrate saturation as follows:
where , , and are fitting parameters, and their fitted values are presented in Table 5. It should be noted that the medium values of 30% and 43% are adopted to represent the saturation domains of 27–34% and 41–45% in Table 3 during the fitting process.
Table 5.
Fitted values of parameters , , , and for determining .
- (3)
- Substituting Equations (9) and (10) into Equation (8), we can obtain the function of dependent on hydrate saturation and effective confining pressure as:
- (1)
- According to Table 3, with the same fitting method, it can be found that the functions of and follow the same form as Equation (11); therefore, they can be expressed as a uniform equation, as shown in Equation (12):
where k can represent any of the above-mentioned parameters , and . , , and are the fitting parameters, and their fitted values are listed in Table 6. According to Figure 3, the data points can be fitted well. Although the fitting is not very precise because the data points of the dilation angle show very scattered characteristics with increasing plastic shear strain, according to Figure 3, the fitted curves can describe the general evolution behaviors of the dilation angle , i.e., goes up gradually to a residual value and then remains stable. The equations have simple parameters with clear physical meanings, so they are more acceptable than very complicated equations with too many parameters. In addition, the model verification, which will be introduced in Section 5, also shows the validation and applicability of these equations.
Table 6.
Fitted values of parameters , , , and for determining , , and .
5. Model Verification
In order to verify the reliability of the evolution model established in this paper, the proposed model is implanted in a series of numerical studies, and the tested stress–strain curves on the GHBS samples with different hydrate saturations under various effective confining pressures in [15] are used for a comparison with the corresponding results obtained in the numerical simulations.
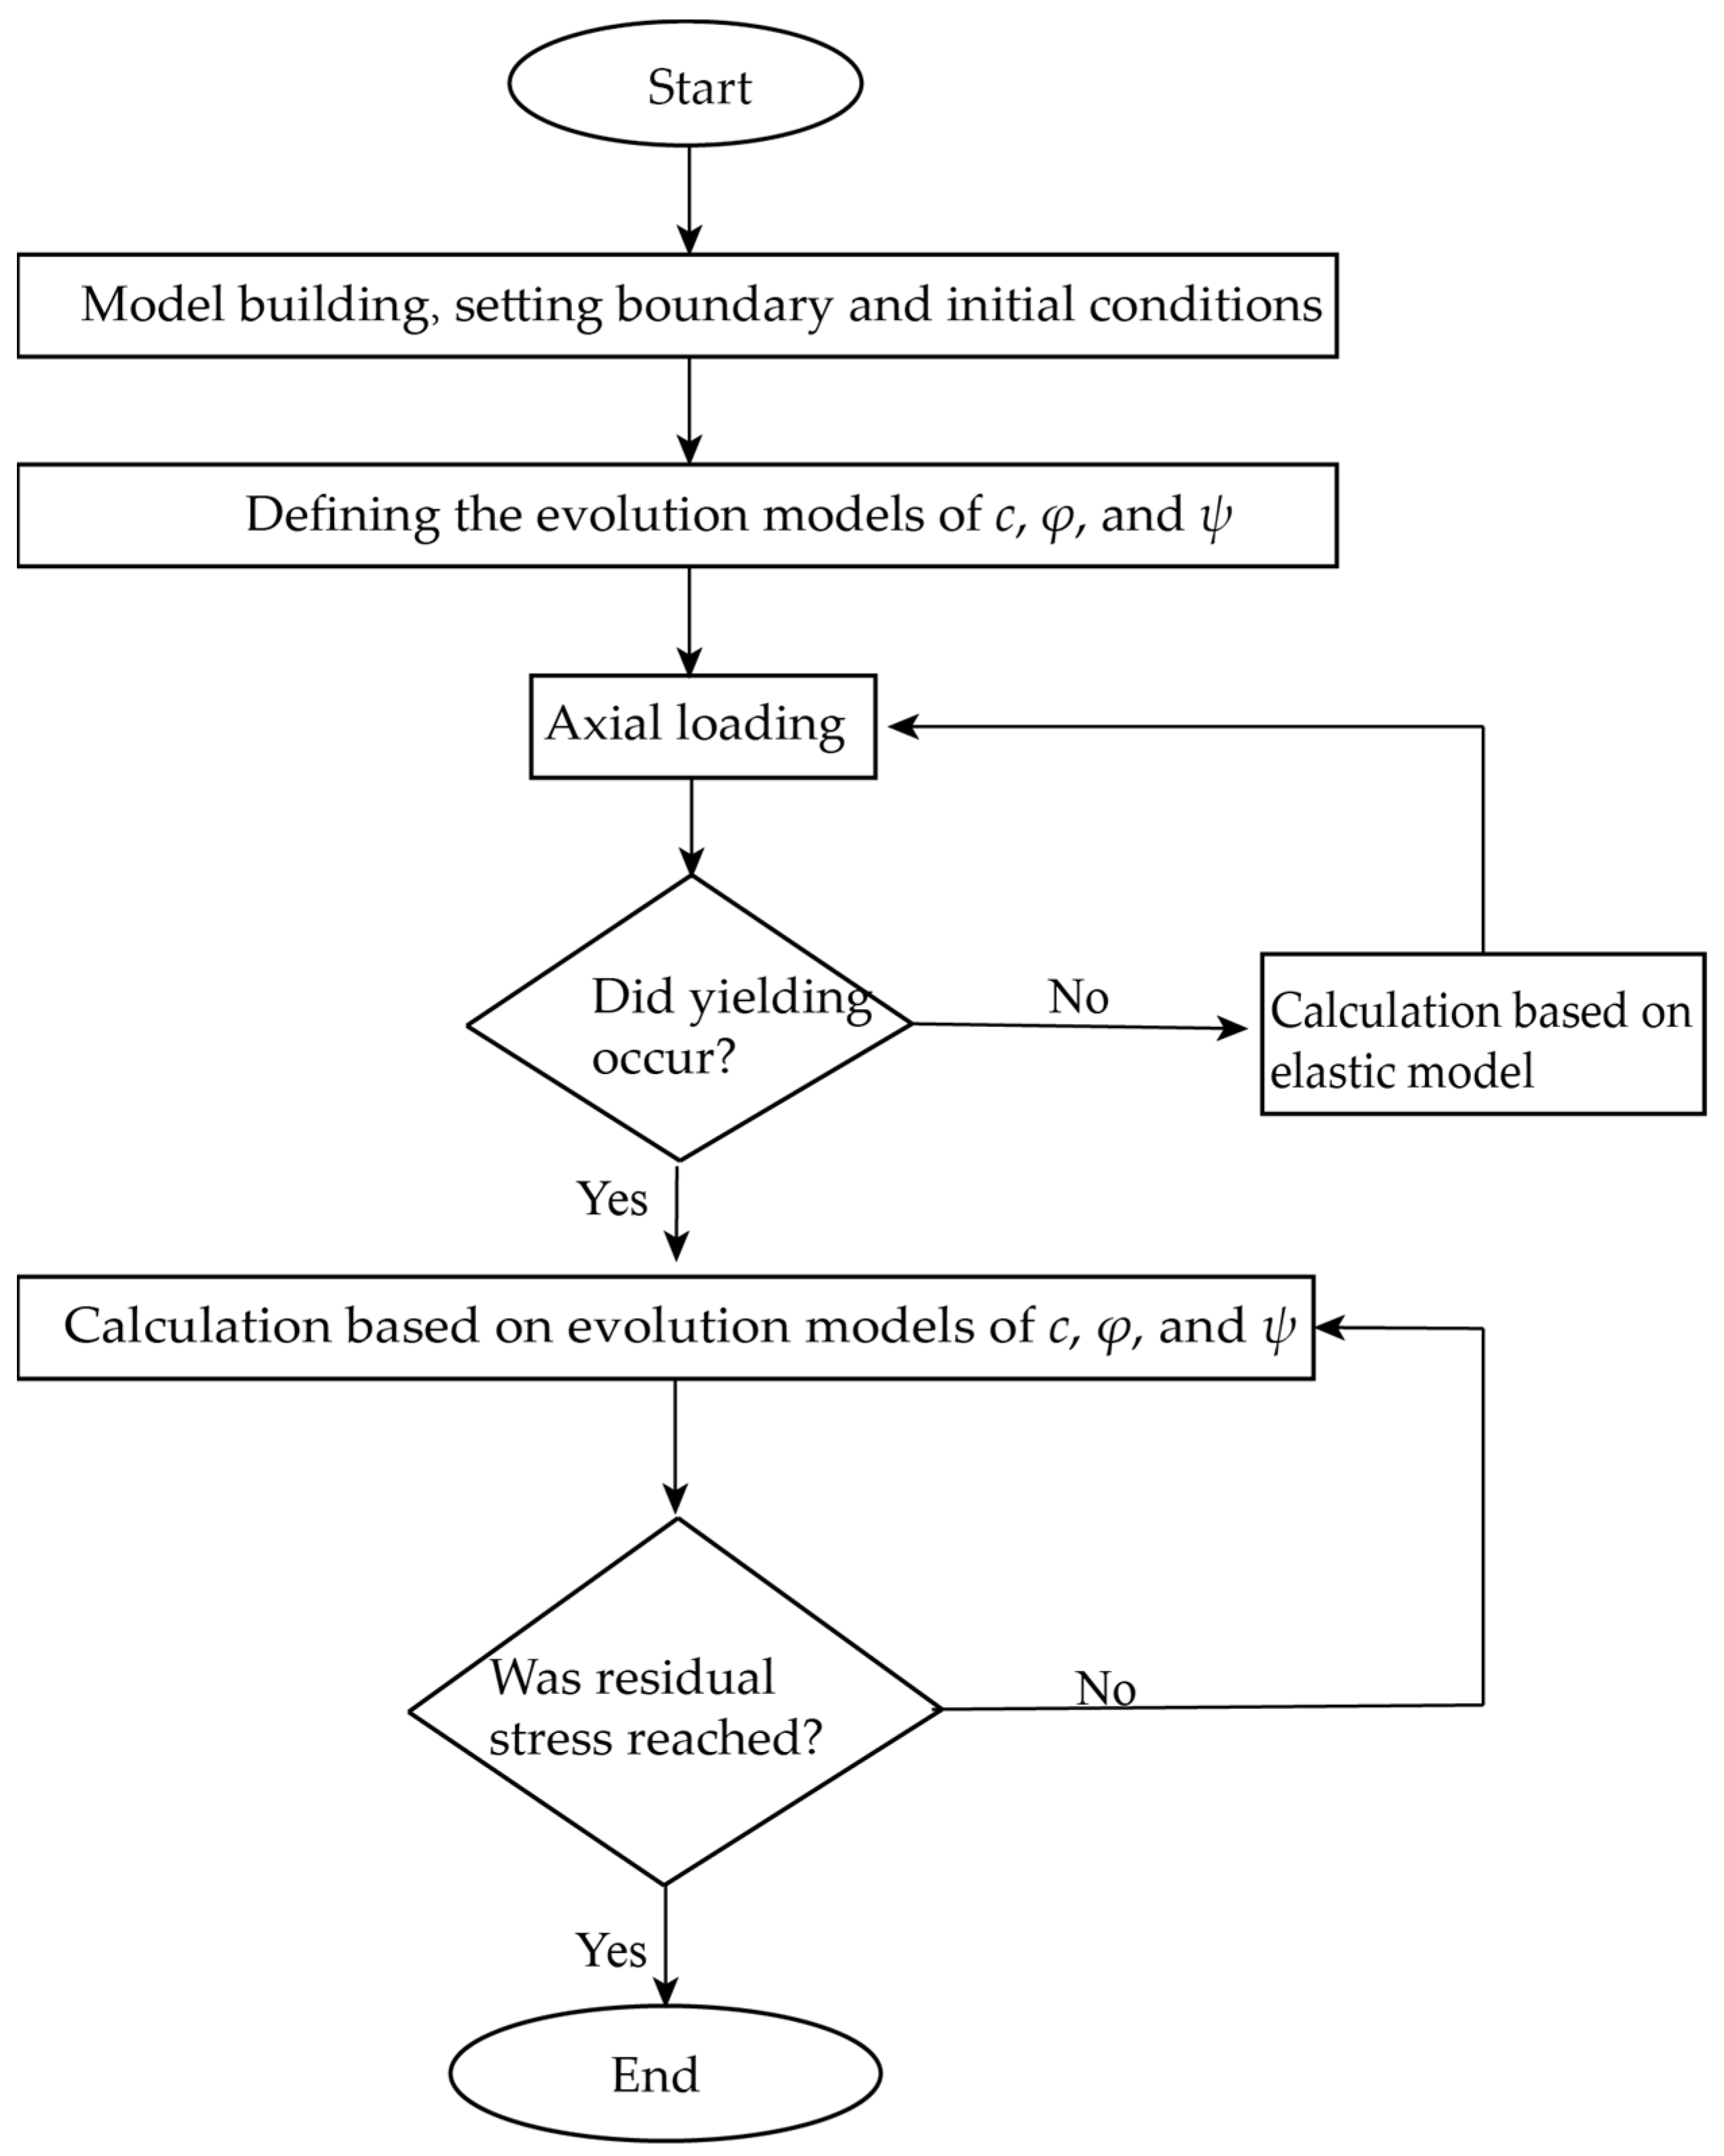
FLAC3D software [44] developed based on the finite difference method is adopted in this numerical study. FLAC3D can be applied to solve complex problems in mechanics, especially for the mechanical responses of geomaterials. Large strain analysis can be considered in the models. Both elastic and plastic constitutive models can be implanted in the modeling, and a user-defined constitutive model is also accepted in FLAC3D. Consequently, the evolution model of strength and dilation parameters can be programmed in the numerical model with FISH language. According to the experimental conditions reported in [15], numerical models of the GHBS samples are built and triaxial compression experiments are conducted under different effective confining pressures. Figure 4 presents the flowchart of the numerical modeling.

Figure 4.
Flowchart of numerical modeling and calculation.
A cylindrical model with 8000 meshes is generated to simulate the GHBS specimen with the size of 50 mm in diameter and 100 mm in length, as shown in Figure 5. The density values are presented in Table 7 based on [15]. The displacement boundary at the bottom of the model is fixed, and lateral stress is applied on the circumferential boundary around the model to simulate the effective confining pressure. The axial loading rate of −1.2 × 10⁻⁷ m/step is applied on the top boundary.
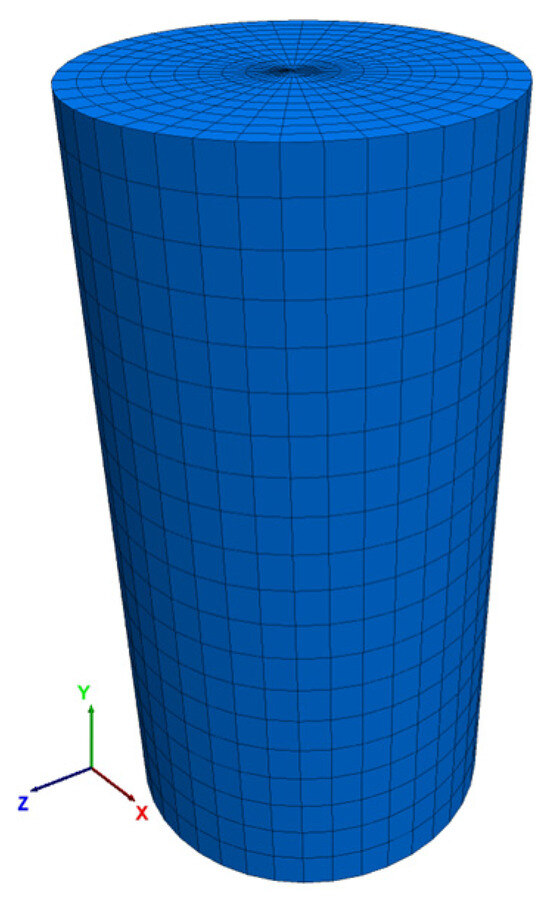
Figure 5.
FLAC3D model of a GHBS sample.
Table 7.
Basic parameters for the models with different hydrate saturations.
During the calculation, the Mohr–Coulomb criterion is adopted to identify whether the model is in the elastic or plastic state. The initial cohesion (ci) and initial internal friction angle (i) listed in Table 1 and Table 2 are used in the criterion for the yielding condition. If the model is still in the elastic stage, the model calculation follows the elastic law with the E and ν values presented in Table 7, as obtained from the testing results in [15]. If the model is in the yielding stage, the calculation begins to follow the plastic constitutive model with evolutionary strength and dilation parameters, as demonstrated in Section 3 and Section 4, respectively. The model parameters in Table 1, Table 2 and Table 3 are used in the numerical model with the corresponding hydrate saturation.
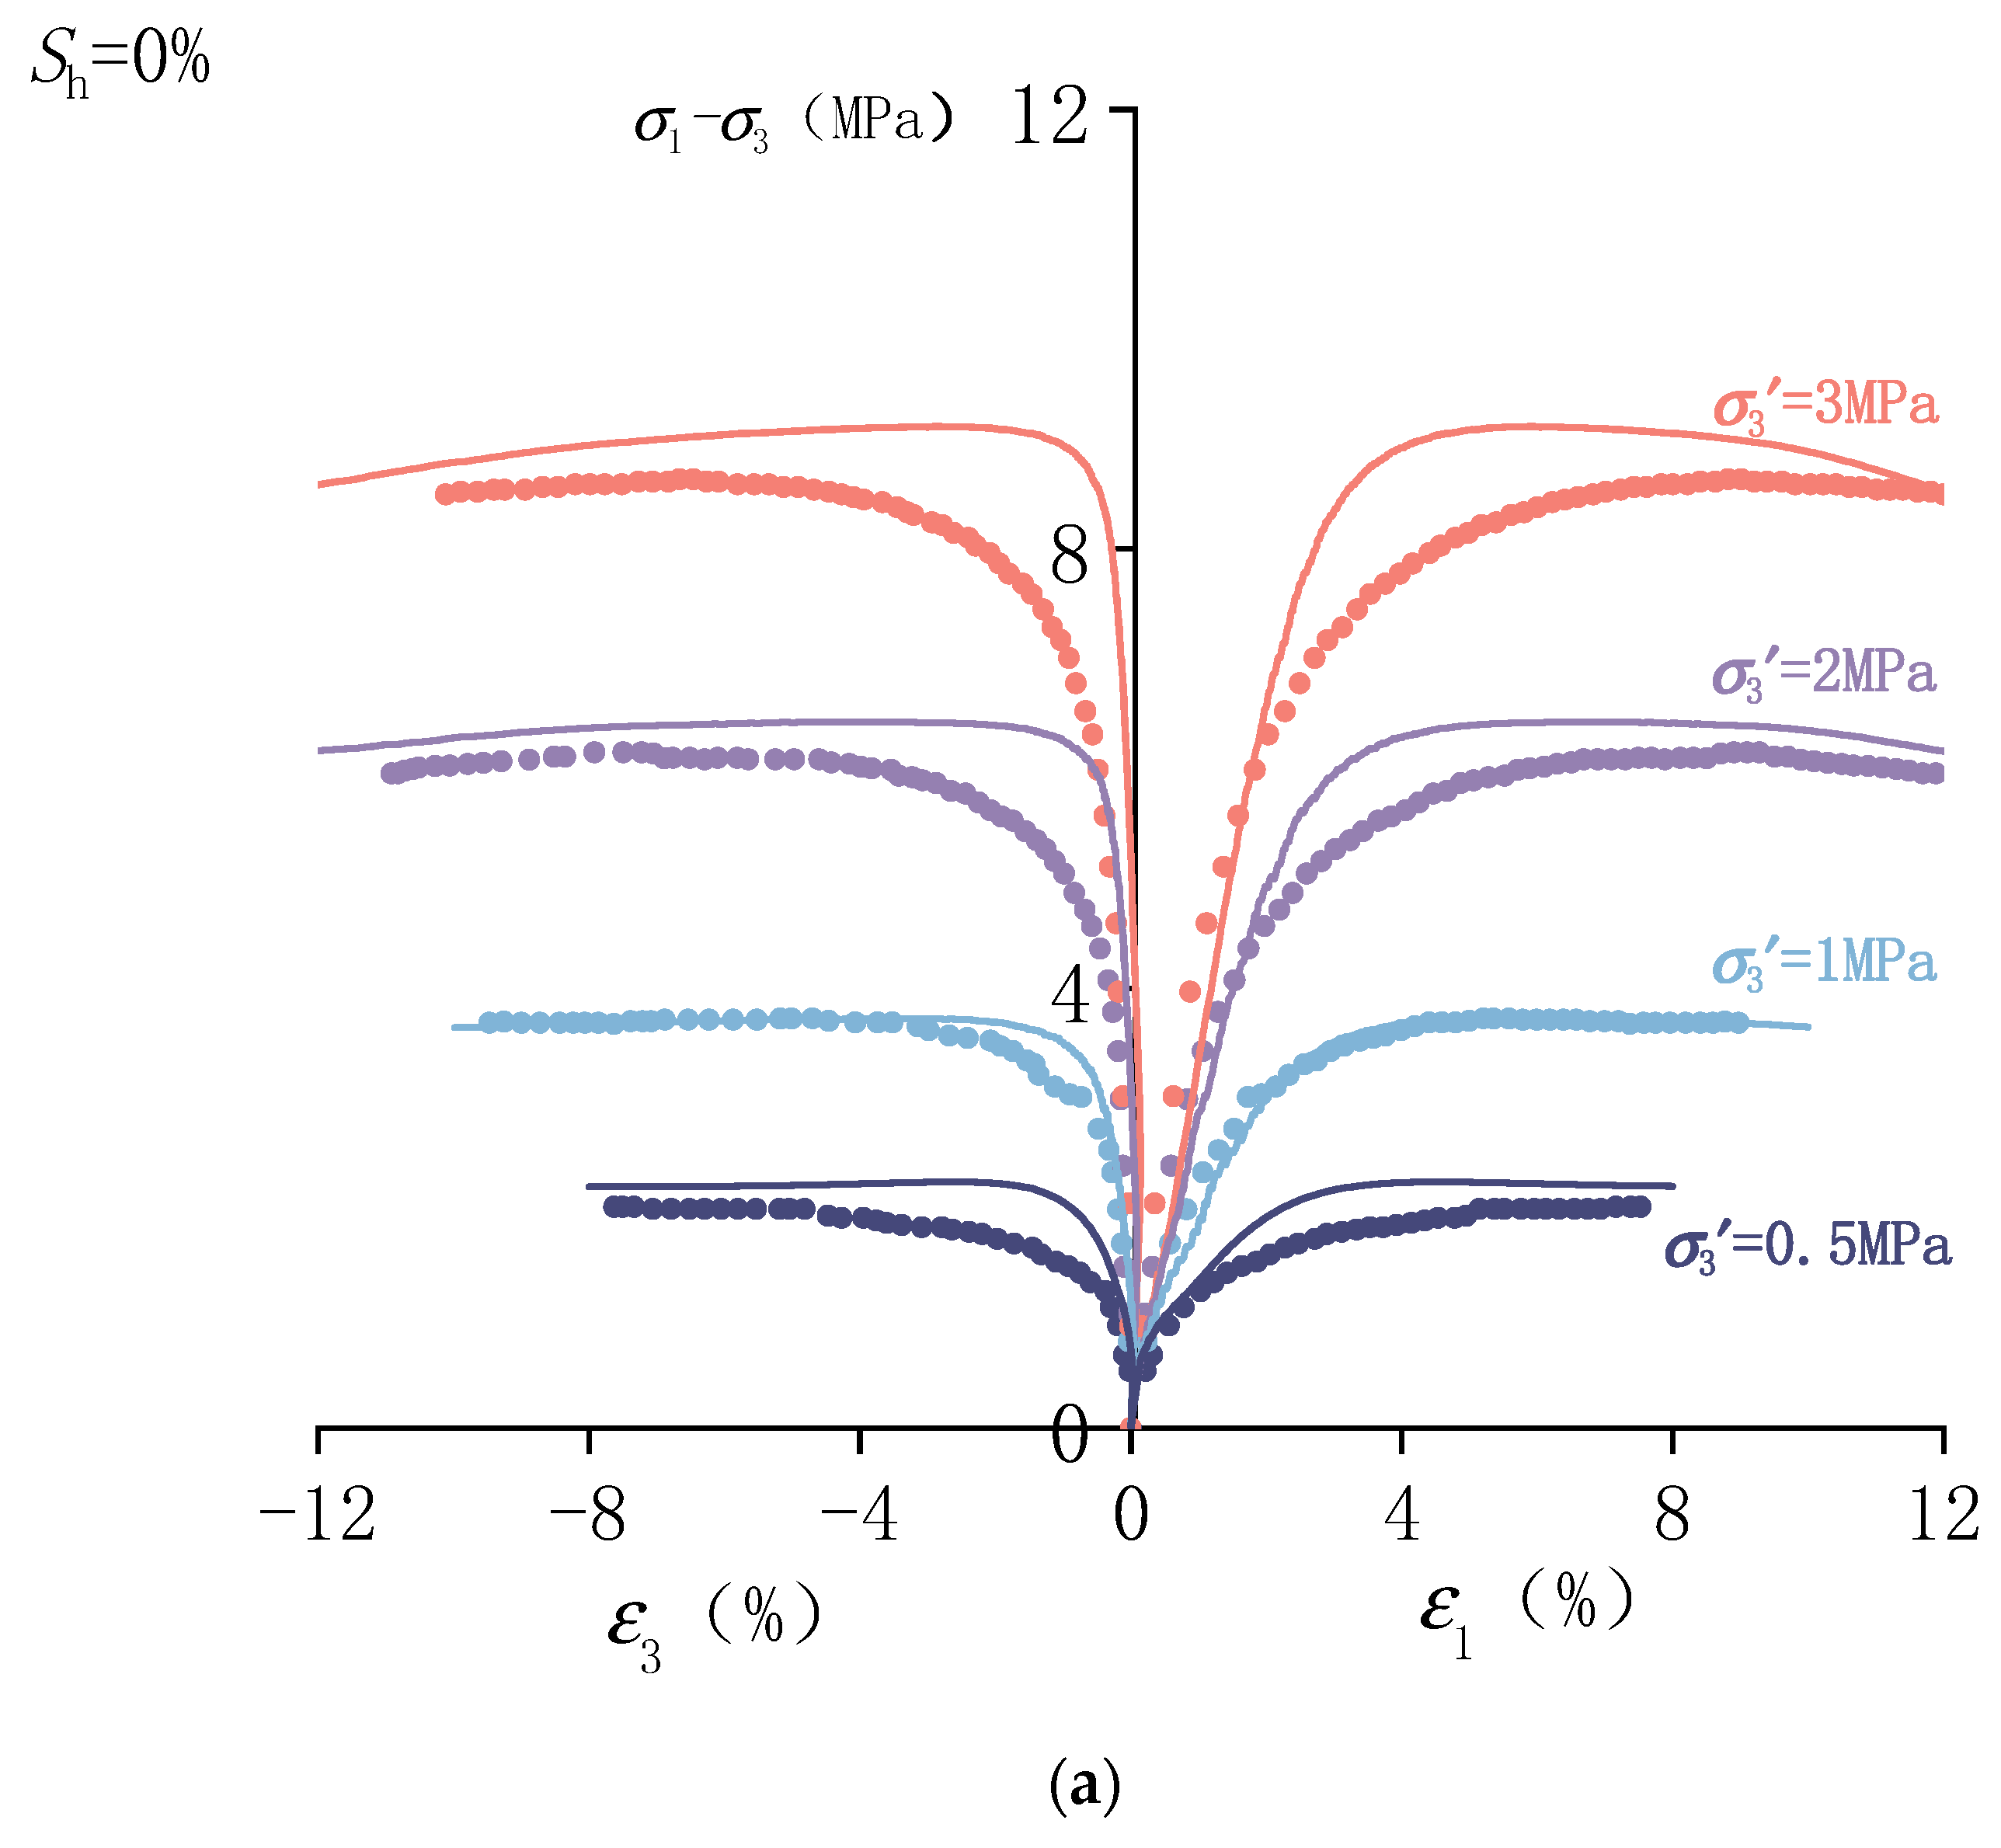
The stress–strain curves are recorded in each numerical modeling, and the curves are illustrated in Figure 6, compared with the stress–strain curves obtained in the laboratory experiments [15]. For every model with different hydrate saturations under various effective confining pressures, generally speaking, the stress–strain curves accord well with those obtained from the laboratory tests. Particularly, the strain hardening and softening behavior is simulated successfully with this model. These results exhibit the validation of the proposed model considering the evolution of strength and dilation parameters.

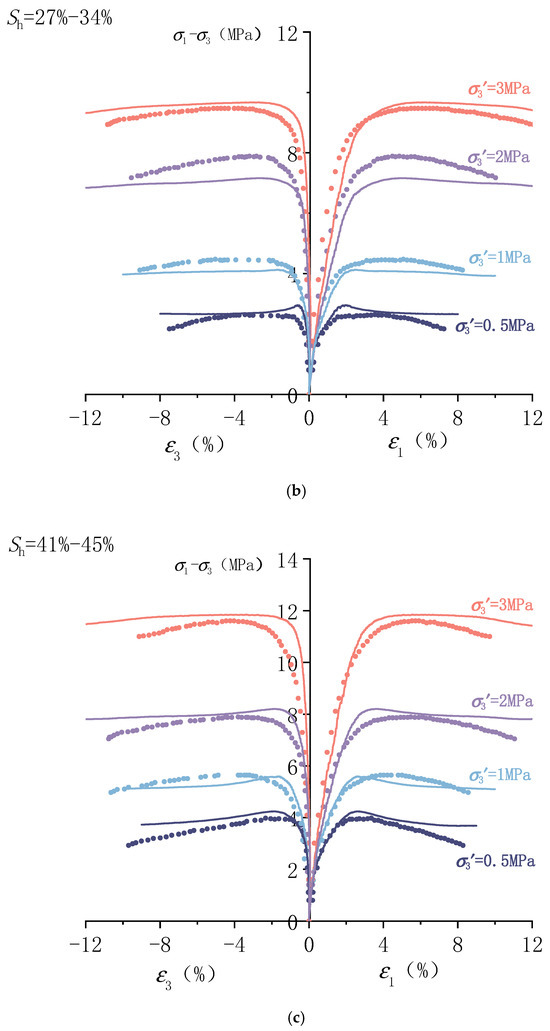
Figure 6.
The calculated stress–strain curves compared with the laboratory testing results (scattered data points from [15] with permission) for the GHBS samples with different hydrate saturations ((a) = 0%, (b) = 27–34%, and (c) = 41–45%) under various confining pressures.
It can be seen from the results that the evolution equations of cohesion, the internal friction angle, and the dilation angle proposed in this paper have parameters with clear physical meanings. The simulated curves can reflect the stress–strain curves of the GHBS samples with different hydrate saturations under various confining pressures well.
It should be noted that the mechanical properties of the GHBS samples from different areas or settings may be affected by some factors such as the hydrate morphology and pore pressure. However, these samples are all particulate geomaterials and they have generally similar stress–strain behaviors, according to an extensive overview of the published references [9,16,18,19,22], so the proposed model should be able to be applied to different GHBS samples. Even one or more new models may be found to be more suitable for different types of GHBS samples, and the method built in this study can be adopted for proposing these models. It will be an interesting topic in future research to analyze the influence of different factors like hydrate morphology and pore pressure with the method and model proposed in this study.
6. Slope Stability Analysis Considering the Evolution of Mechanical Parameters
After the verification of the model considering the evolution of strength and dilation parameters, this model can be applied in the stability analysis of a submarine slope containing gas hydrate-bearing sediments.
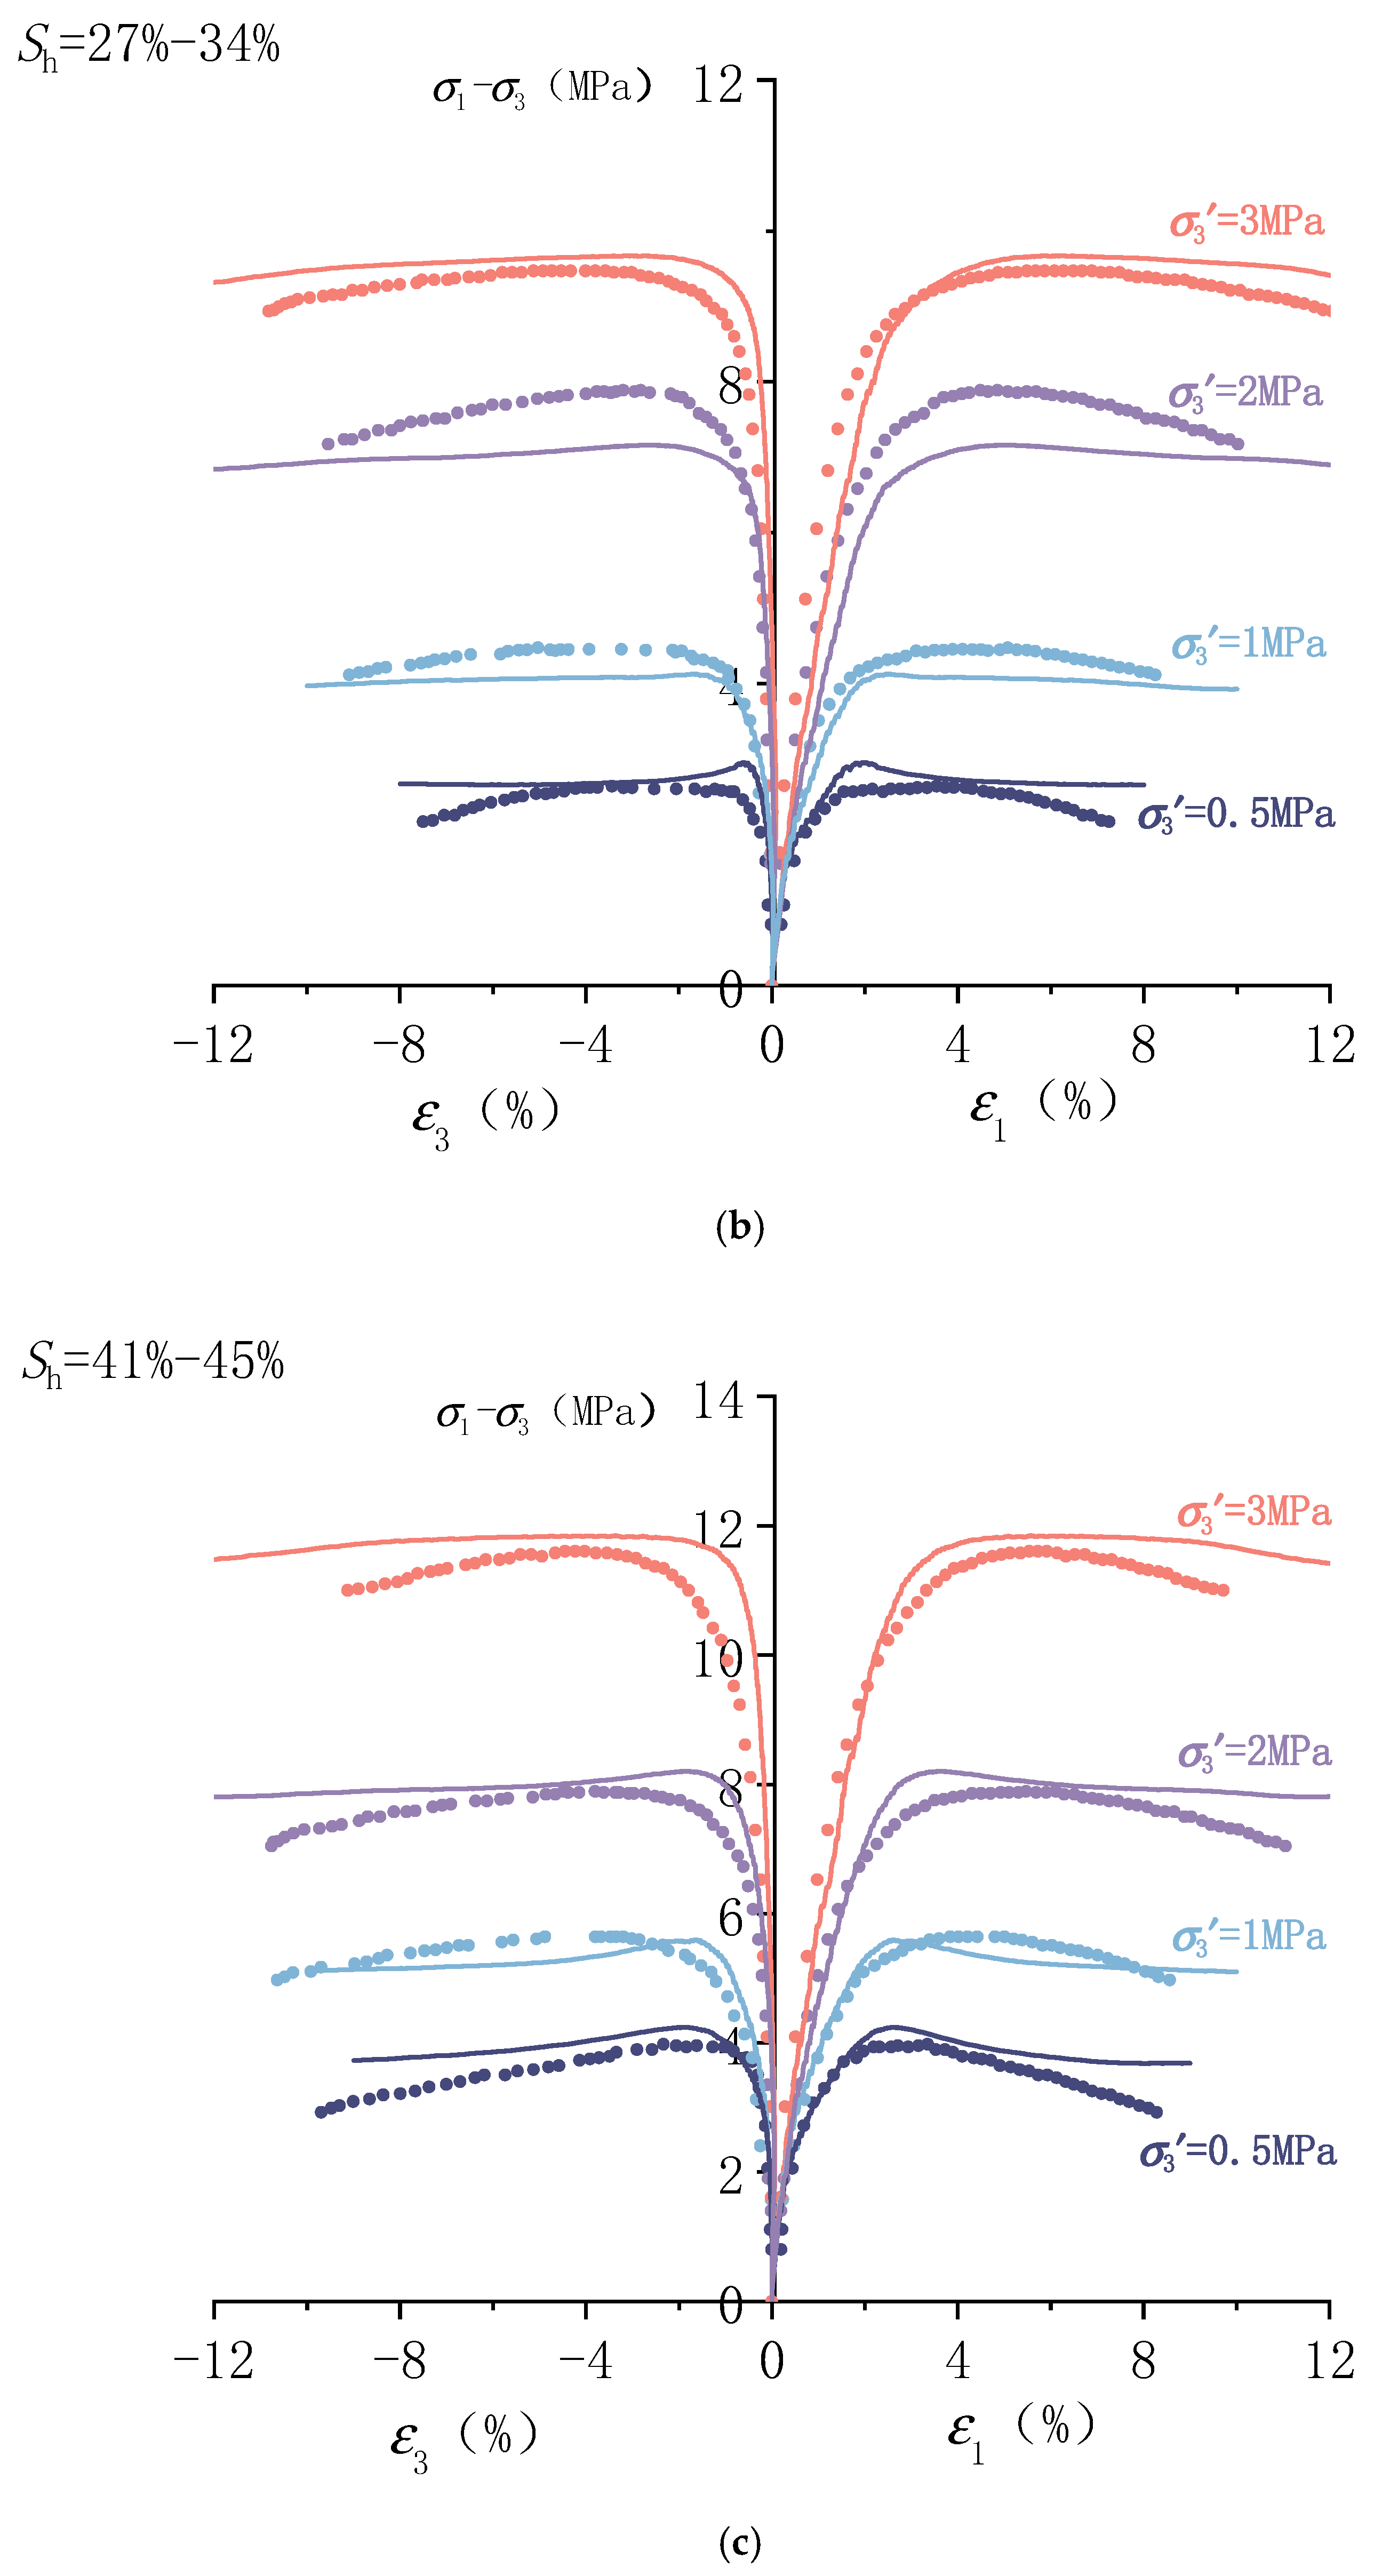
A submarine slope introduced in [45] is selected to build the geological model in this study. This slope is about 7°, and it is located below seawater at a depth of 1200 m. The slope model is built in FLAC3D software with a size of 1500 m in length, 100 m in width, and 1200 m in height, and it is discretized into 25,200 cell grids. The stratum has several layers including clay, a hydrate reservoir, mudstone, and sandstone successively from top to bottom, as shown in Figure 7.

Figure 7.
FLAC3D model of a submarine slope containing a hydrate reservoir.
The bottom boundary of the model is fixed. Every lateral boundary is fixed at the direction perpendicular to its surface. A seawater pressure of 1.2 MPa is applied on the top of this model.
Because the failure usually occurs in the layer of the hydrate reservoir, a perfect elastoplastic model is adopted in the other layers such as clay, mudstone, and sandstone layers, and the mechanical parameters use constant values, as presented in Table 8 according to [45]. As we do not have detailed data on the hydrate reservoir considering the evolution of strength and dilation parameters, the parameters of the GHBS samples obtained in Section 3 and Section 4 are used in this study. Therefore, this study actually just demonstrates the method for slope stability analyses with the proposed model considering the evolution of strength and dilation parameters.
Table 8.
Basic parameter values of the FLAC3D model for the submarine slope model [45].
The strength reduction method is adopted in this stability analysis. It should be noted that the strength reduction method is usually used based on the perfect elastoplastic model, and the strength parameters c and are reduced to obtain the safety factor. However, the constitutive model used in this study has evolutionary strength parameters c and . In this analysis, the initial strength parameters ci and i are reduced, as shown in Equation (13):
where is the reduction factor, and it is defined as the safety factor when the convergence cannot be reached in the calculation.
With this method, the safety factors of the slope with different hydrate saturations are calculated, as shown in Table 9.
Table 9.
The safety factors of the slope under each gas hydrate saturation.
With the decrease in gas hydrate saturation in the hydrate reservoir, the safety factor of the submarine slope gradually decreases. This model can well represent the changing trend in the safety factor with natural gas exploitation, i.e., slope stability gradually decreases with the exploitation of natural gas hydrate. It should be noted there are still some factors not considered in this model, such as the seepage of overlying seawater, the influence of gas and water during hydrate decomposition, etc., which need to be further studied. However, this case study provides a demonstration of the approach of applying the proposed evolution model in the engineering analysis.
7. Conclusions
Based on a series of data analyses, the evolution characteristics of the strength and dilation parameters of gas hydrate-bearing sediments are systematically studied, and a non-linearly fitted model is proposed considering the evolution of the mechanical parameters. This model is verified by comparing the numerical and laboratory testing results, and thereafter, it is introduced into the stability analysis of the slope. The main conclusions are as follows:
- (1)
- With increasing plastic shear strain, cohesion (c) increases quickly to a peak value and then decreases gradually to a residual value for the samples with different hydrate saturations. The samples with higher hydrate saturations have higher initial values, peak values, and residual values of cohesion (c). The internal friction angle () increases quickly with increasing plastic shear strain and then becomes stable at a residual value for all the samples with different hydrate saturations.
- (2)
- The dilation angle increases from negative to positive values with increasing plastic shear strain and then becomes stable at a residual value. This shows that compaction occurs at the early stage of compression before expansion happens due to dilation.
- (3)
- A non-linearly fitted model is proposed considering the evolution of the mechanical parameters. The parameters in this proposed model have clear physical meanings.
- (4)
- The proposed model can simulate the stress–strain behaviors of the GHBS samples well. This model can be applied to different GHBS samples. This model can also be adopted in the stability analysis on the submarine slopes containing hydrate reservoirs. The analytical approach is developed accompanied by the strength reduction method.
This study can be used for analyzing the stability of hydrate reservoirs. However, this research has not considered the process of hydrate decomposition. This will be studied further in future research.
Author Contributions
Conceptualization, C.C.; methodology, C.C.; software, J.Y. (Jincai Yu); validation, C.C. and J.Y. (Jincai Yu); formal analysis, C.C. and J.Y. (Jincai Yu); investigation, C.C., J.Y. (Jincai Yu), and J.Y. (Jintao Yang); resources, C.C. and J.Y. (Jincai Yu); data curation, J.Y. (Jincai Yu) and J.Y. (Jintao Yang); writing—original draft preparation, J.Y. (Jincai Yu); writing—review and editing, C.C.; supervision, C.C.; funding acquisition, C.C. All authors have read and agreed to the published version of the manuscript.
Funding
This research was funded by the National Natural Science Foundation of China (No. 51991362).
Institutional Review Board Statement
Not applicable.
Informed Consent Statement
Not applicable.
Data Availability Statement
The raw data supporting the conclusions of this article will be made available by the authors on request.
Acknowledgments
Y. Xie, G. Wang, L. He, and H. Zheng are appreciated here for their help in data processing.
Conflicts of Interest
The authors declare no conflicts of interest.
Appendix A
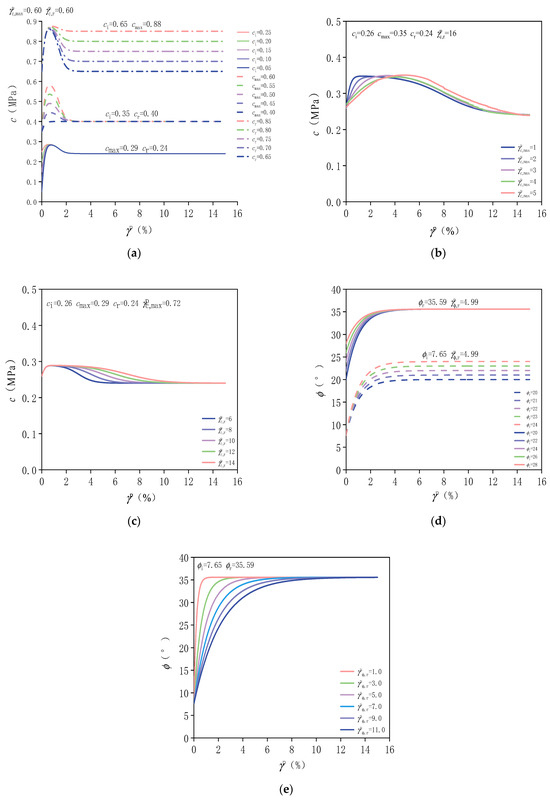
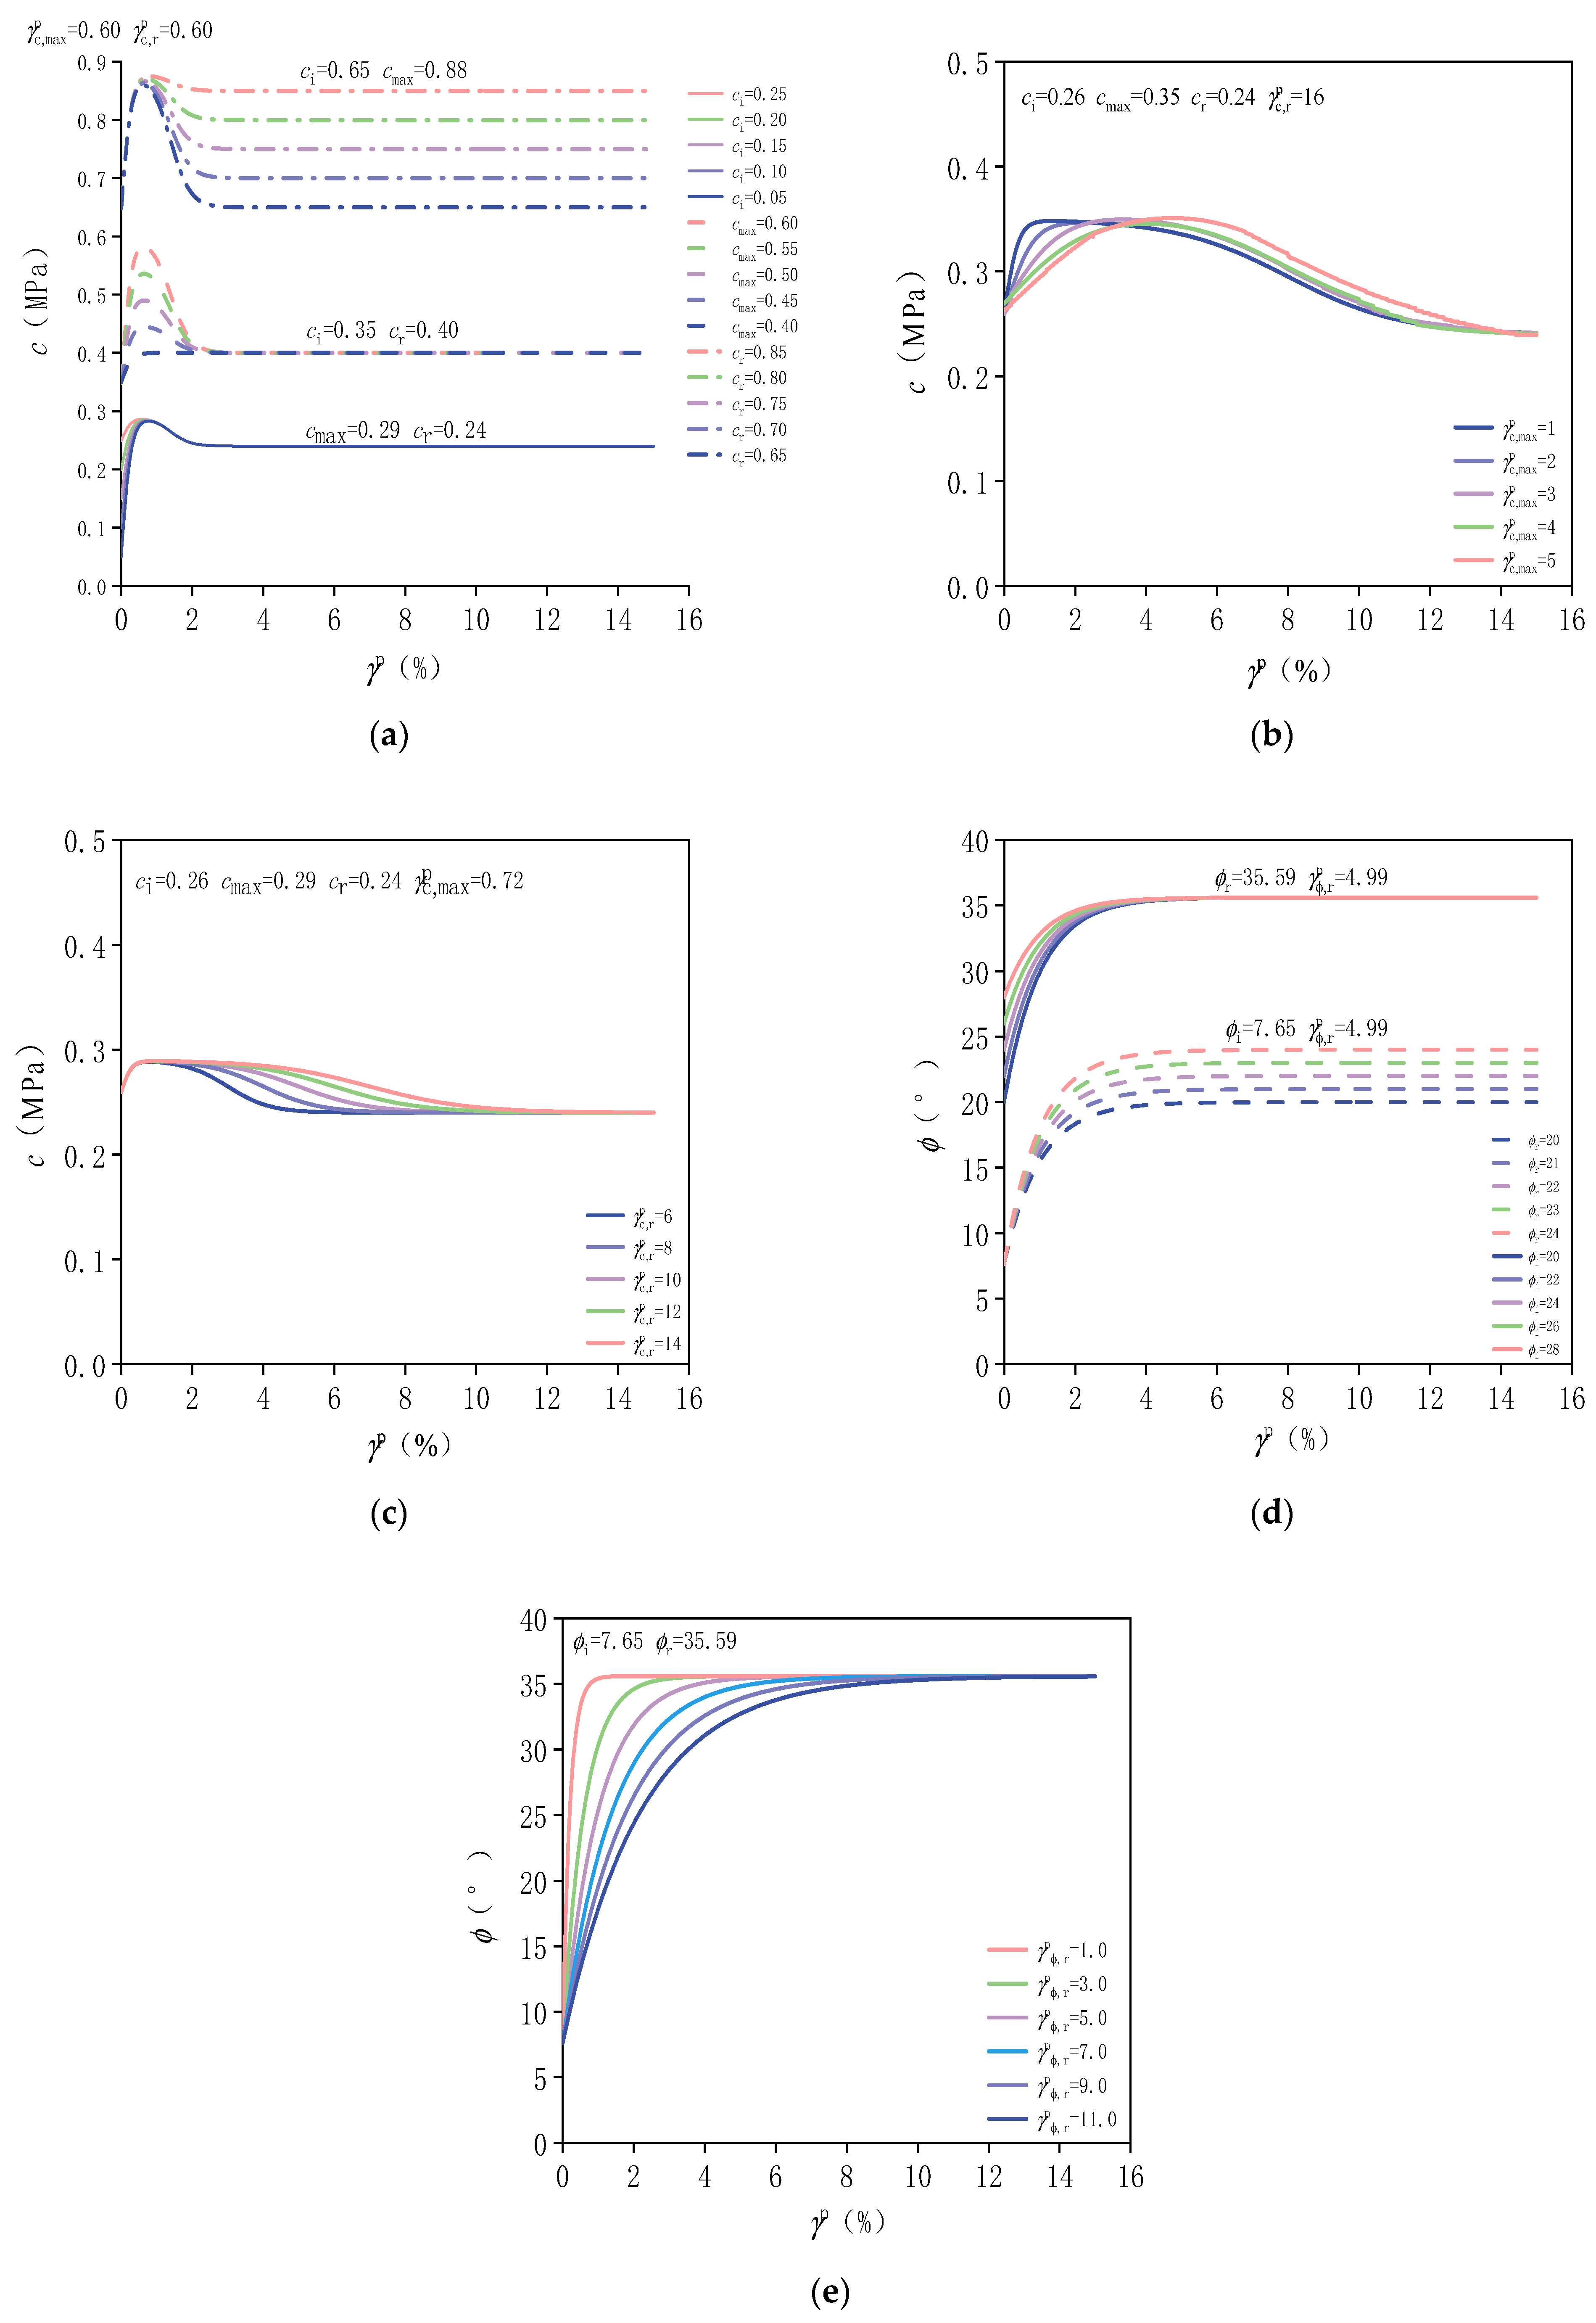
Figure A1.
Sensitivity analysis of the parameters: (a) ci, cmax, and cr, (b) , (c) , (d) i and r, and (e) .
Figure A1.
Sensitivity analysis of the parameters: (a) ci, cmax, and cr, (b) , (c) , (d) i and r, and (e) .
Appendix B
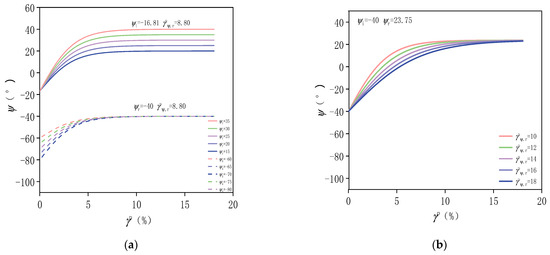
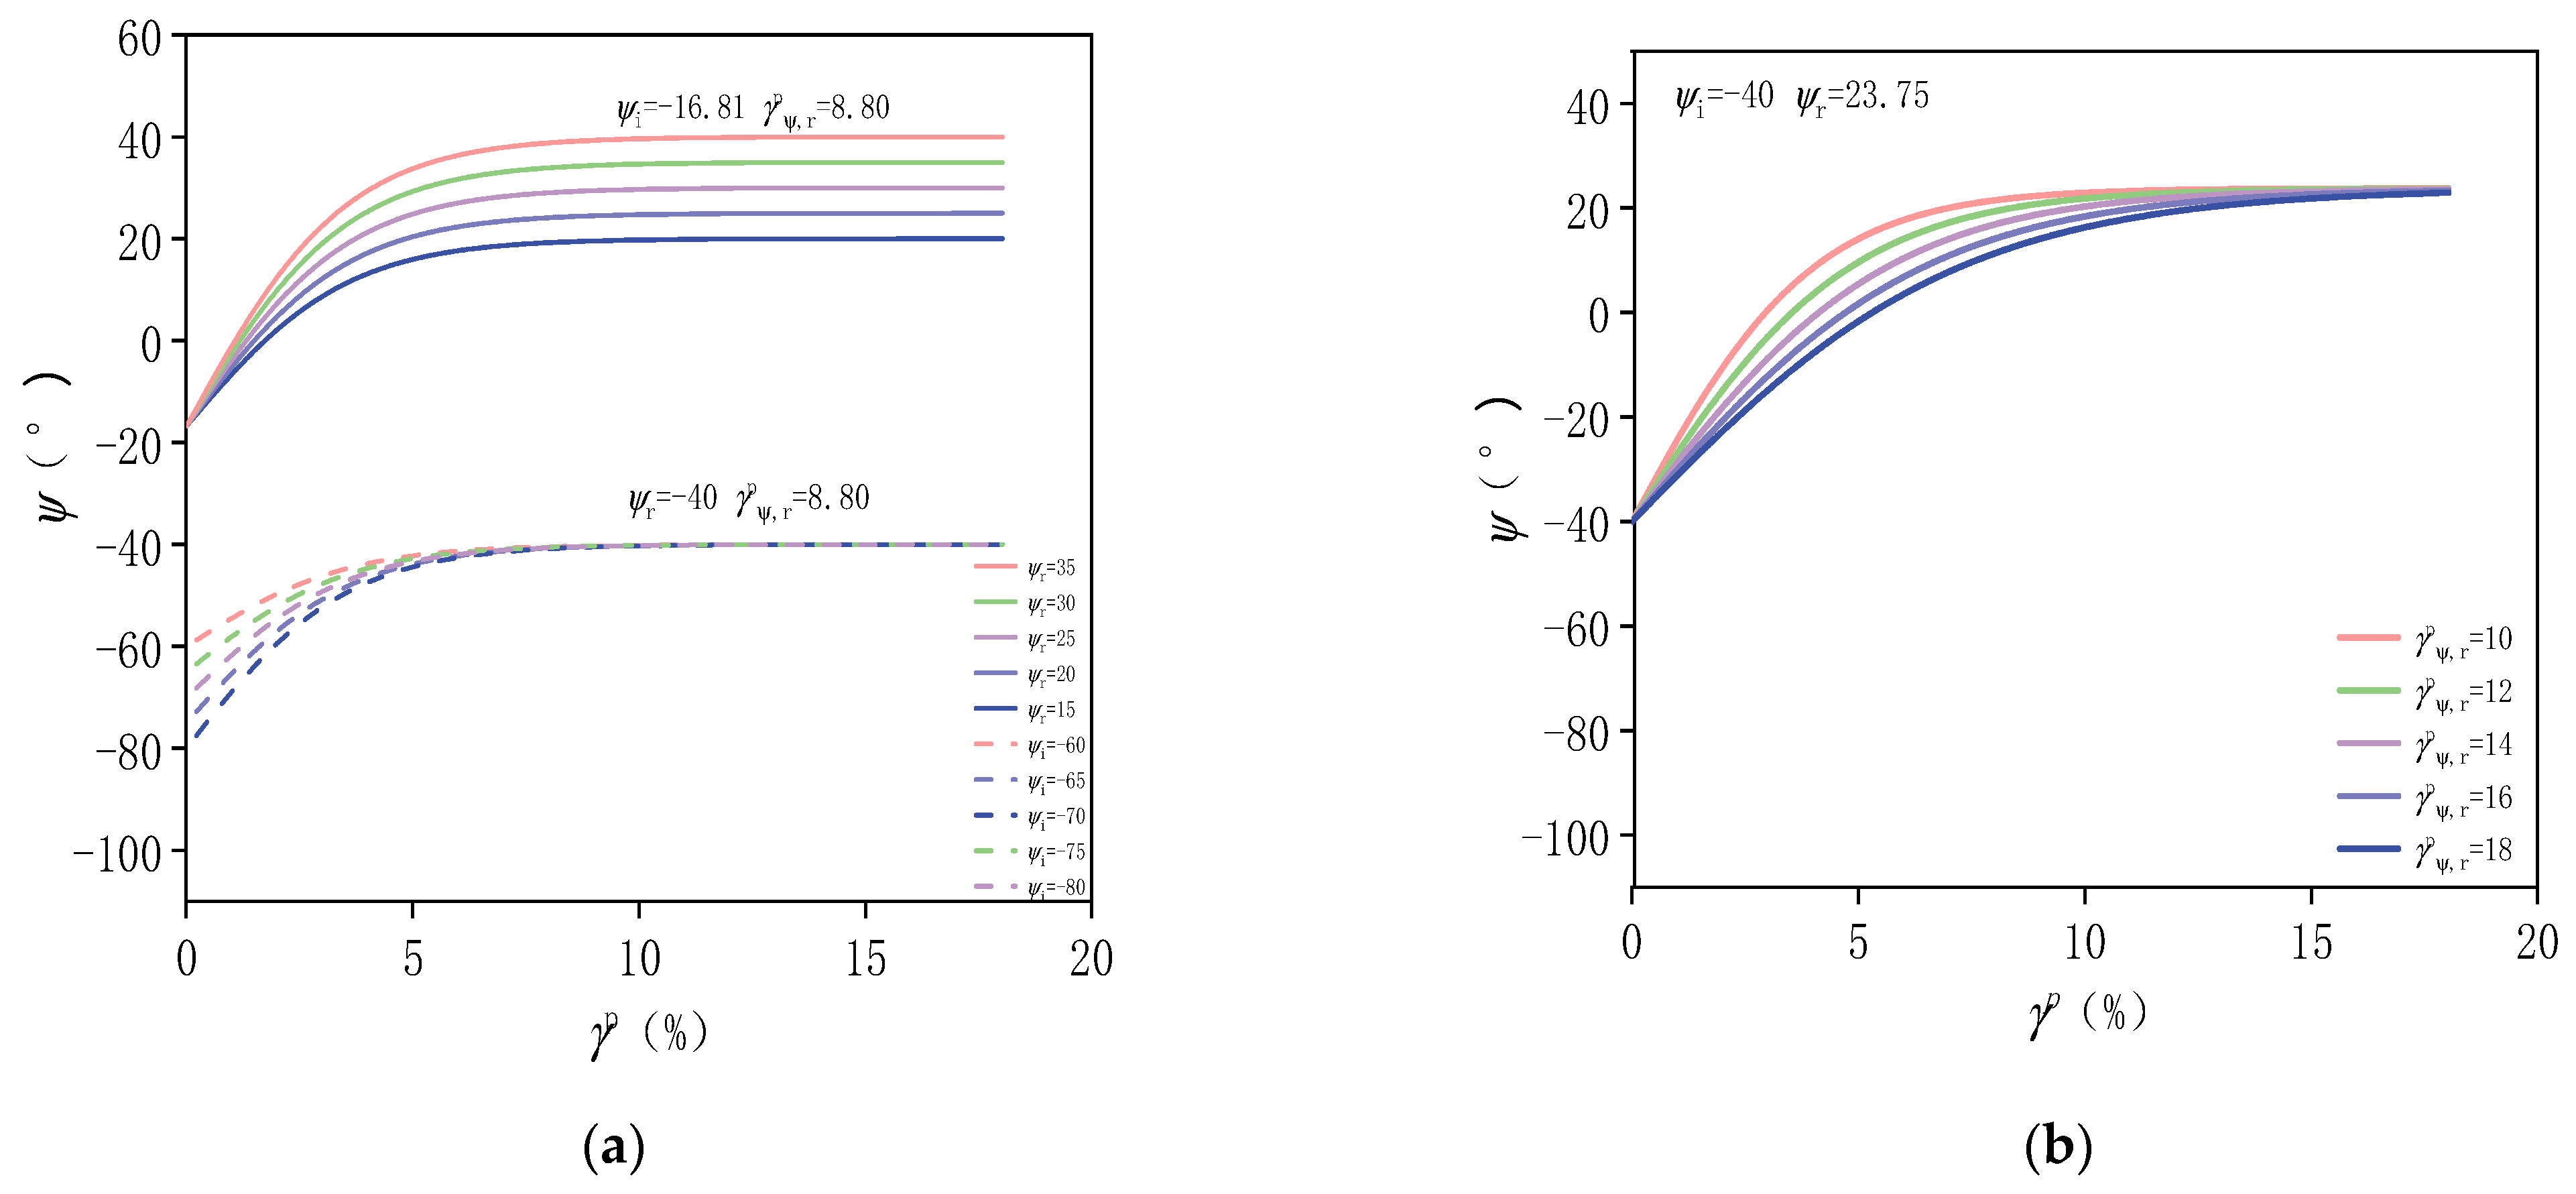
Figure A2.
Sensitivity analysis of the parameters: (a) and and (b) .
Figure A2.
Sensitivity analysis of the parameters: (a) and and (b) .
References
- Klauda, J.B.; Sandler, S.I. Global distribution of methane hydrate in ocean sediment. Energy Fuels 2005, 19, 459–470. [Google Scholar] [CrossRef]
- Sun, C.; Li, W.; Yang, X.; Li, F.; Yuan, Q.; Mu, L.; Chen, J.; Liu, B.; Chen, G. Progress in Research of Gas Hydrate. Chin. J. Chem. Eng. 2011, 19, 151–162. [Google Scholar] [CrossRef]
- Makogon, Y.F. Perspectives for the development of gas hydrate deposits. In Gas Hydrates and Permafrost: Proceedings of the 4th Canadian Permafrost Conference; National Research Council of Canada: Ottawa, ON, Canada, 1982; pp. 299–304. [Google Scholar]
- Makogon, Y.F.; Holditch, S.; Makogon, T.Y. Natural gas-hydrates—A potential energy source for the 21st Century. J. Pet. Sci. Eng. 2007, 56, 14–31. [Google Scholar] [CrossRef]
- Makogon, Y.F. Natural gas hydrates—A promising source of energy. J. Nat. Gas Sci. Eng. 2010, 2, 49–59. [Google Scholar] [CrossRef]
- Wei, J.; Fang, Y.; Lu, H.; Lu, H.; Lu, J.; Liang, J.; Yang, S. Distribution and characteristics of natural gas hydrates in the Shenhu Sea Area, South China Sea. Mar. Pet. Geol. 2018, 98, 622–628. [Google Scholar] [CrossRef]
- Lu, Z.; Zhu, Y.; Liu, H.; Zhang, Y.; Jin, C.; Huang, X.; Wang, P. Gas source for gas hydrate and its significance in the Qilian Mountain permafrost, Qinghai. Mar. Pet. Geol. 2013, 43, 341–348. [Google Scholar] [CrossRef]
- Fujii, T.; Saeki, T.; Kobayashi, T.; Inamori, T.; Hayashi, M.; Takano, O.; Takayama, T.; Kawasaki, T.; Nagakubo, S.; Nakamizu, M.; et al. Resource Assessment of Methane Hydrate in the Eastern Nankai Trough, Japan. In Proceedings of the Offshore Technology Conference, Houston, TX, USA, 5–8 May 2008. [Google Scholar]
- Wu, P.; Li, Y.; Sun, X.; Liu, W.; Song, Y. Mechanical Characteristics of Hydrate-Bearing Sediment: A Review. Energy Fuels 2021, 35, 1041–1057. [Google Scholar] [CrossRef]
- Chen, M.; Li, Y.; Zhang, Y.; Qi, M.; Wu, N. Recent advances in creep behaviors characterization for hydrate-bearing sediment. Renew. Sustain. Energy Rev. 2023, 183, 113434. [Google Scholar] [CrossRef]
- Zhang, M.; Niu, M.; Shen, S.; Dai, S.; Xu, Y. Review of natural gas hydrate dissociation effects on seabed stability. Nat. Hazards 2021, 107, 1035–1045. [Google Scholar] [CrossRef]
- Jiang, M.; Shen, Z.; Wu, D. CFD-DEM simulation of submarine landslide triggered by seismic loading in methane hydrate rich zone. Landslides 2018, 15, 2227–2241. [Google Scholar] [CrossRef]
- Li, Q.; Wu, J. Factors affecting the lower limit of the safe mud weight window for drilling operation in hydrate-bearing sediments in the Northern South China Sea. Geomech. Geophys. Geo-Energy Geo-Resour. 2022, 8, 82. [Google Scholar] [CrossRef]
- Uchida, S.; Klar, A.; Yamamoto, K. Sand production model in gas hydrate-bearing sediments. Int. J. Rock Mech. Min. Sci. 2016, 86, 303–316. [Google Scholar] [CrossRef]
- Miyazaki, K.; Masui, A.; Sakamoto, Y.; Aoki, K.; Tenma, N.; Yamaguchi, T. Triaxial compressive properties of artificial methane-hydrate-bearing sediment. J. Geophys. Res. Solid Earth 2011, 116, B06102. [Google Scholar] [CrossRef]
- Yan, C.; Cheng, Y.; Li, M.; Han, Z.; Zhang, H.; Li, Q.; Teng, F.; Ding, J. Mechanical experiments and constitutive model of natural gas hydrate reservoirs. Int. J. Hydrogen Energy 2017, 42, 19810–19818. [Google Scholar] [CrossRef]
- Du, H.; Chen, H.; Wang, Q.; Luo, Y.; Kong, F.; Shi, B. Mechanical behavior of reservoirs with heterogeneous hydrate distribution: Analysis from the thickness and angle of the hydrate-bearing layer. Eng. Geol. 2023, 327, 107359. [Google Scholar] [CrossRef]
- Kajiyama, S.; Wu, Y.; Hyodo, M.; Nakata, Y.; Nakashima, K.; Yoshimoto, N. Experimental investigation on the mechanical properties of methane hydrate-bearing sand formed with rounded particles. J. Nat. Gas Sci. Eng. 2017, 45, 96–107. [Google Scholar] [CrossRef]
- Liu, Z.; Dai, S.; Ning, F.; Peng, L.; Wei, H.; Wei, C. Strength Estimation for Hydrate-Bearing Sediments From Direct Shear Tests of Hydrate-Bearing Sand and Silt. Geophys. Res. Lett. 2018, 45, 715–723. [Google Scholar] [CrossRef]
- Bello-Palacios, A.; Fotland, P.; Almenningen, S.; Ersland, G. Effects of methane hydrates on two-phase relative permeability in sandstone: Numerical simulation of laboratory experiments. J. Pet. Sci. Eng. 2022, 208, 109606. [Google Scholar] [CrossRef]
- Han, Z.; Zhang, L.; Zhou, J.; Pan, Z.; Wang, S.; Li, R. Effect of Mineral Grain and Hydrate Layered Distribution Characteristics on the Mechanical Properties of Hydrate-Bearing Sediments. Energies 2023, 16, 7366. [Google Scholar] [CrossRef]
- Li, Y.; Cheng, Y.; Yan, C.; Wang, Z.; Song, L. Triaxial creep tests and the visco-elastic-plastic constitutive model of hydrate formations. Gas Sci. Eng. 2023, 115, 205006. [Google Scholar] [CrossRef]
- Miyazaki, K.; Masui, A.; Tenma, N.; Ogata, Y.; Aoki, K.; Yamaguchi, T.; Sakamoto, Y. Study on mechanical behavior for methane hydrate sediment based on constant strain-rate test and unloading-reloading test under triaxial compression. Int. J. Offshore Polar Eng. 2010, 20, 61–67. [Google Scholar]
- Li, Y.; Hu, W.; Tang, H.; Wu, P.; Liu, T.; You, Z.; Yu, T.; Song, Y. Mechanical properties of the interstratified hydrate-bearing sediment in permafrost zones. Energy 2023, 282, 128970. [Google Scholar] [CrossRef]
- Martin, C.; Chandler, N. The progressive fracture of Lac du Bonnet granite. Int. J. Rock Mech. Min. Sci. Geomech. Abstr. 1994, 31, 643–659. [Google Scholar] [CrossRef]
- Walton, G. Initial guidelines for the selection of input parameters for cohesion-weakening-friction-strengthening (CWFS) analysis of excavations in brittle rock. Tunn. Undergr. Space Technol. 2019, 84, 189–200. [Google Scholar] [CrossRef]
- Jianxin, H.; Shucai, L.; Shuchen, L.; Lei, W. Post-peak stress-strain relationship of rock mass based on hoek-brown strength criterion. Procedia Earth Planet. Sci. 2012, 5, 289–293. [Google Scholar] [CrossRef]
- Niandou, H.; Shao, J.; Henry, J.; Fourmaintraux, D. Laboratory investigation of the mechanical behaviour of Tournemire shale. Int. J. Rock Mech. Min. Sci. 1997, 34, 3–16. [Google Scholar] [CrossRef]
- Jaiswal, A.; Shrivastva, B. Numerical simulation of coal pillar strength. Int. J. Rock Mech. Min. Sci. 2009, 46, 779–788. [Google Scholar] [CrossRef]
- Hajiabdolmajid, V.; Kaiser, P.; Martin, C. Modelling brittle failure of rock. Int. J. Rock Mech. Min. Sci. 2002, 6, 731–741. [Google Scholar] [CrossRef]
- Hajiabdolmajid, V.; Kaiser, P.; Martin, C. Mobilised strength components in brittle failure of rock. Geotechnique 2003, 53, 327–336. [Google Scholar] [CrossRef]
- Guo, S.; Qi, S.; Zhan, Z.; Zheng, B. Plastic-strain-dependent strength model to simulate the cracking process of brittle rocks with an existing non-persistent joint. Eng. Geol. 2017, 231, 114–125. [Google Scholar] [CrossRef]
- Pourhosseini, O.; Shabanimashcool, M. Development of an elasto-plastic constitutive model for intact rocks. Int. J. Rock Mech. Min. Sci. 2014, 66, 1–12. [Google Scholar] [CrossRef]
- Walton, G.; Arzúa, J.; Alejano, L.; Diederichs, M. A laboratory-testing-based study on the strength, deformability, and dilatancy of carbonate rocks at low confinement. Rock Mech. Rock Eng. 2015, 48, 941–958. [Google Scholar] [CrossRef]
- Klar, A.; Soga, K.; Ng, M. Coupled deformation–flow analysis for methane hydrate extraction. Geotechnique 2010, 60, 765–776. [Google Scholar] [CrossRef]
- Alejano, L.; Alonso, E. Considerations of the dilatancy angle in rocks and rock masses. Int. J. Rock Mech. Min. Sci. 2005, 42, 481–507. [Google Scholar] [CrossRef]
- Zhang, C.H.; Zhao, Q.S.; Yu, Y.J. Dilation model of heterogeneous rock affected by confined pressure. Caikuang Yu Anquan Gongcheng Xuebao/J. Min. Saf. Eng. 2011, 28, 436–440. [Google Scholar]
- Zhao, X.; Cai, M. A mobilized dilation angle model for rocks. Int. J. Rock Mech. Min. Sci. 2010, 47, 368–384. [Google Scholar] [CrossRef]
- Pinkert, S.; Grozic, J.L. An analytical-experimental investigation of gas hydrate-bearing sediment properties. In Proceedings of the Canadian Geotechnical Conference and the 11th Joint CGS/IAHCNC Ground Water Conference, Montreal, QC, Canada, 29 September–3 October 2013. [Google Scholar]
- Pinkert, S.; Grozic, J.; Priest, J. Strain-softening model for hydrate-bearing sands. Int. J. Geomech. 2015, 15, 04015007. [Google Scholar] [CrossRef]
- Elliott, G.; Brown, E. Further development of a plasticity approach to yield in porous rock. Int. J. Rock Mech. Min. Sci. Geomech. Abstr. 1986, 23, 151–156. [Google Scholar] [CrossRef]
- Cheng, C.; Xu, N.; Zheng, B. Mobilized Mohr-Coulomb and Hoek-Brown strength parameters during failure of granite in Alxa area in China for high-Level radioactive waste disposal. Energies 2019, 12, 4237. [Google Scholar] [CrossRef]
- Vermeer, P.A.; De Borst, R. Non-associated plasticity for soils, concrete and rock. HERON 1984, 29, 1984. [Google Scholar]
- Itasca Consulting Group Inc. FLAC3D 5.0 Manual; ICG: Minneapolis, MN, USA, 2010; FLAC3D; Available online: https://www.itascacg.com/software/FLAC3D (accessed on 7 March 2024).
- Xu, M.K. Numerical Simulation of Geological Disasters of Submarine Landslides in the Shenhu Area of the South China Sea; Ocean University of China: Qingdao, China, 2019. (In Chinese) [Google Scholar]

Disclaimer/Publisher’s Note: The statements, opinions and data contained in all publications are solely those of the individual author(s) and contributor(s) and not of MDPI and/or the editor(s). MDPI and/or the editor(s) disclaim responsibility for any injury to people or property resulting from any ideas, methods, instructions or products referred to in the content. |
© 2024 by the authors. Licensee MDPI, Basel, Switzerland. This article is an open access article distributed under the terms and conditions of the Creative Commons Attribution (CC BY) license (https://creativecommons.org/licenses/by/4.0/).