Article

Assessment of the Baking Properties of Rye Flour Based on the Polysaccharide Content and Properties

by
Sylwia Stępniewska
1,*,
Grażyna Cacak-Pietrzak
2,
Anna Szafrańska
1,
Ewa Ostrowska-Ligęza
3,
Agnieszka Salamon
1 and
Hanna Kowalska
4,*
1
Department of Grain Processing and Bakery, Prof. Wacław Dąbrowski Institute of Agricultural and Food Biotechnology—State Research Institute, Rakowiecka 36 Street, 02-532 Warsaw, Poland
2
Department of Food Technology and Assessment, Division of Fruit, Vegetable and Cereal Technology, Institute of Food Sciences, Warsaw University of Life Sciences (WULS), Nowoursynowska 159C Street, 02-787 Warsaw, Poland
3
Department of Chemistry, Institute of Food Sciences, Warsaw University of Life Sciences (WULS), Nowoursynowska 159C Street, 02-776 Warsaw, Poland
4
Department of Food Engineering and Process Management, Institute of Food Sciences, Warsaw University of Life Sciences (WULS), Nowoursynowska 159C Street, 02-776 Warsaw, Poland
*
Authors to whom correspondence should be addressed.
Appl. Sci. 2024, 14(7), 2772; https://doi.org/10.3390/app14072772
Submission received: 29 February 2024 / Revised: 16 March 2024 / Accepted: 22 March 2024 / Published: 26 March 2024
(This article belongs to the Special Issue Advanced Food Processing Technologies and Food Quality)

Abstract

:
This study aimed to determine the baking quality of rye flour in terms of the content and properties of its polysaccharides, i.e., starch and pentosans. The study materials were low- and high-extract rye flours produced in industrial mills from the rye grain of two growing seasons (2019 and 2020). The results of the starch content, falling number, amylograph properties, DSC test, content of pentosans, swelling curve test, and laboratory baking test were determined. It was found that the type of flour had a greater impact on the baking quality of rye flour than the year of its production. Research has shown that the most frequently used parameters, such as the falling number and the maximum viscosity of starch paste, are not good indicators for assessing the baking value of currently produced rye flours. From the parameters used for evaluating the properties of the starch–amylolytic complex, the initial and onset temperatures for starch gelatinization were the best indicators for evaluating the baking quality of rye flour. This study revealed a significant correlation between the pentosan content (total, water soluble, and insoluble), swelling curve parameters and quality parameters of rye bread, such as the specific bread volume, bread crumb moisture, and bread crumb hardness. Assessment of the baking value of rye flour based only on the evaluated properties of the starch–amylolytic complex is currently not sufficient to determine the baking quality of rye flour and predict the quality of rye bread. This study on the baking quality of rye flour should be extended to include the assessment of the dough properties related to the pentosan content and the enzymes that degrade these components. It was shown that the properties of rye dough related to the content of pentosan can be characterized based on the swelling curve test as a method that, together with the initial and onset starch gelatinization temperatures, allows better assessment of the baking quality of the commercial rye flour and its suitability for the good-quality rye bread production.

1. Introduction

Rye (Secale L.) is a cereal used to produce bread, mainly in Northern and Central Europe [1]. The basic direction when using rye grain is grinding it into flour, the baking value of which is characterized based on the assessment of the functional properties of its main polysaccharides, i.e., starch and pentosans, and the activity of the enzymes that degrade the above ingredients [2]. Protein plays a smaller role in creating the structure of rye dough than in wheat dough. During the production of rye dough, a three-dimensional gluten network is not formed, which is primarily due to the high content of pentosans, which create dough with very high viscosity and absorb water faster than proteins [3,4,5].
Rye starch and the enzymes that hydrolyze it have an impact on the structure of the bread crumb at temperatures above 45 °C [1,2]. Unlike wheat starch, it gelatinizes at a lower temperature, i.e., 55–70 °C, making it more susceptible to the action of amylolytic enzymes [3]. In the grain and milling industry, the methods most often used to assess the baking value of rye flour are amylographic tests and the determination of the falling number. These methods are used to assess the properties of starch related to its ability to swell and gelatinize, and to its susceptibility to the action of amylolytic enzymes [1,6]. Rye flour suitable for baking is characterized by a falling number in the range of 125–200 s [7], a maximum amylographic viscosity in the range of 400–600 AU, and a final gelatinization temperature in the range of 65–68 °C [8]. Rye flour with too low activity of amylolytic enzymes produces bread with a low volume, with a dry and crumbly crumb, while rye flour with too high amylolytic activity produces flat bread, with a moist, often soggy crumb [1,6]. The rye starch properties related to the gelatinization process can be evaluated by the DSC test, which, together with the amylograph test and falling number, may provide a better way to determine the usefulness of rye flour for breadmaking [9].
Pentosans are the second component of rye flour, after starch, responsible for the baking value of rye flour. They are classified as non-starch polysaccharides and occur in plant cell walls as substances accompanying cellulose [10]. These compounds influence the properties of the dough during kneading, fermentation, and the first phase of baking [1]. Due to the solubility, they are classified as soluble and insoluble in water [11,12,13,14]. Low-extract rye flours, which are deprived of a significant amount of particles from the outer parts of the grain during milling, are characterized by a higher content of soluble pentosans and a lower content of insoluble pentosans compared to wholemeal flour [15,16]. Both pentosan fractions increase the water absorption of flour [17,18,19], but they influence the properties of dough and the quality characteristics of bread in different ways. Soluble pentosans, even at very low concentrations, can create viscous solutions [20], due to which they protect the carbon dioxide molecules formed in the dough against thermal damage [21] and slow down their release during baking [20], which has a positive impact on the bread volume and crumb hardness [22]. In the case of insoluble pentosans, Kühn and Grosch [23] showed that they increase the resistance of the dough to kneading and its stability, which, however, does not translate into the quality of the obtained bread. The method that allows the assessment of the properties of rye dough related to the content of pentosans and the activity of the enzymes that break down these compounds is the swelling curve test [24,25].
There is no research on the baking value of rye flour produced in industrial mills or the quality characteristics of the bread obtained from it. Currently, in industrial conditions, assessing the baking quality of rye flour based on such parameters as the falling number and amylograph peak viscosity is insufficient to predict its usefulness in breadmaking [25]. So, it is necessary to look for the parameters that will enable the characterization of the quality of rye flour more comprehensively.
The present study aimed to indicate which parameters are the most sufficient to predict the baking quality of rye bread made from flour obtained from currently cultivated rye grain, which is generally characterized by low α-amylase activity. Because articles published in recent years regarding rye flour lack information about the impact of the type of flour and its year of production, in our study, this assessment was conducted to determine which of the indicated factors has a greater impact on the baking quality of rye flour.

2. Materials and Methods

2.1. Materials

This study used samples of low-extract and high-extract rye flour obtained from industrial mills located in various regions of Poland. Based on the needs of rye flour producers regarding the impact of weather conditions on the quality of grain as a raw material for flour production, flour obtained from rye grain from two consecutive harvest years, i.e., 2019 and 2020, was used for testing. A total of twelve flour samples were tested each year, i.e., six samples of low- and six of high-extract rye flour.

2.2. Methods

2.2.1. Starch Content of Rye Flour Samples and Its Properties

Starch Content, Falling Number and Amylograph Properties

The starch content was evaluated by the Ewers polarimetric method using polarimeters (Optical Activity, Cambridgeshire, Ramsey, the United Kingdom) according to ISO 10520:1997 [26]. The falling number test was evaluated using a Falling Number 1500 device (Perten Instruments, Stockholm Sweden) according to ISO 3093:2009 [27] and the amylograph test was evaluated according to ISO 7973:1992 [28] using an Amylograph (Brabender, Duisburg, Germany).

Thermal Properties of Rye Flour Samples

The thermal properties of rye flour starch were measured by differential scanning calorimetry (DSC) using the TA Instrument Q200 differential scanning calorimeter (WatersTM TA Instruments, New Castle, DE, USA). The test was determined according to the methodology described by Stępniewska et al. [9]. The following parameters were estimated directly from the instrumental software: the onset (To), conclusion (Tc), and peak (Tp) temperatures and the gelatinization enthalpy, calculated per 1 g of flour.

2.2.2. Pentosan Content and Swelling Curve Parameter

The water soluble pentosan content (WSPC) and total pentosan content (TPC) were determined according to Hashimoto et al. [29]. The water insoluble pentosan content (WIPC) was obtained with the difference between the TPC and WSPC. The swelling curve test was performed according to Drews [30] using an Amylograph (Brabender, Duisburg, Germany). The test analyzed a suspension prepared from 364 mL of water, 46 mL of buffer with pH 5.0 (sodium phosphate buffer solution), and 120 g of flour (14% moisture in dry mass). This suspension was heated under constant stirring in the temperature range of 30 °C to 42 °C with a heating rate of 1.5 °C·min−1. Then, the slurry was held at 42 °C for the next 30 min. The viscosity detected from the swelling curve expressed in amylographic units (AU) referred to: the initial at 30 °C (V30), at 42 °C (V42), and after holding the suspension for 30 min at 42 °C (FV42). Based on the formula (logFV42 − logF42) × 1000, i.e., the difference in the logarithms of the viscosity drop at 42 °C, the activity of the pentosan-hydrolyzing enzymes in the first phase of baking was indirectly characterized.

2.2.3. Baking Procedure

Breads were obtained during laboratory baking trials. The dough of the tested rye flour samples was prepared using the direct method according to the recipe included in Table 1. The assumed yields of dough from a given type of flour were determined based on the average water absorption obtained for all the samples of a given type of flour produced in the 2019 and 2020 years. The rye dough ingredients were mixed in the Turbo-mix-6,5 mixer spiral (Hommel, Wülfrath, Germany) for 10 min at a low speed.
The rye dough was fermented for 60 min in a fermentation chamber. Next, the dough was divided into 350 g portions, manually formed, placed in the tins, and subjected to proofing in the fermentation cabinet at 35 °C and a relative humidity of 70–75% until the dough reached optimal size. The baking took place in an oven (Piccolo Wachtel Winkel, Pulsnitz, Germany). Immediately after placing the loaves in the oven, steam was used for approximately 10 s. The loaves were baked for 45 min at a temperature of 240 °C. Immediately after baking, the loaves were brushed with water, cooled, and packed in polyethylene bags as well as stored at room temperature for 24 h. Each sample of bread was evaluated by the following: specific bread volume, crumb hardness 24 and 72 h after baking, as well as crumb moisture 24 h after baking. All the analyses were evaluated according to the methodology described by Stępniewska et al. [9]. The result of the bread volume was converted to 100 g of bread, and the crumb hardness was expressed in Newtons (N). The crumb moisture content was expressed as a percentage, as the difference in the weight of the samples before and after drying concerning the initial weight.

2.2.4. Statistical Analysis

The two-factor analysis of variance (ANOVA) was performed to determine the influence of such factors as the type of flour and its year of production. The homogenous groups were determined by Tukey’s test. All the tests were performed with the significance levels of α = 0.05 and α = 0.01. The principal component analysis (PCA) was performed to determine to what extent the bread and flour samples differed and which study factor had the most significant influence on this. This test was performed on the average values of each flour and bread sample, which corresponded well with the analysis performed for all the replicates. The Pearson’s linear correlation coefficients (α = 0.05 and α = 0.01) between selected flour and bread parameters were calculated. Data were analyzed using the Statistica 13 PL program (StatSoft, Cracow, Poland).

3. Results

The results of the ANOVA analysis for all the quality parameters of the tested rye flour samples and obtained rye bread, taking into account the influence of the study factors, are presented in Table 2.

3.1. The Parameters Related to the Starch–Amylolytic Complex

3.1.1. Starch Content and Falling Number

The statistical analysis showed a significant impact of the type of flour and no influence of the year of production on the starch content of the tested rye flour samples (Table 2). The starch content was in the range of 52.2 to 68.7% d.m. (Table 3). In the early study by Stępniewska et al. [9], low-extract rye flours were characterized by a starch content in the range of 63.5% d.m. to 71.1% d.m. These studies revealed that low-extract rye flour samples were characterized by a statistically higher starch content (mean value 66.4% d.m.) compared to high-extract rye flour, which had an average starch content of 55.0%. This is due to the fact that starch only occurs in the endosperm of the rye grain [24]. Therefore, rye flours with a low extract, consisting mainly of crushed particles of this part of the grain, were characterized by a significantly higher starch content compared to rye flour with a high extract. However, the average starch content of the rye flour samples produced in 2019 and 2020 was at a similar level (61.0 and 60.4% d.m., respectively; Table 3).
The falling number (FN) was in the range of 200 to 324 s and was above the optimal range compared to flour intended to produce good-quality rye bread, e.g., in the range of 125 to 200 s [31]. In the study conducted by Michalska and Zieliński [31], rye flours obtained during laboratory milling of the rye grain of two population cultivars were characterized by a falling number in the range of 181 to 251 s. In our study, a slightly higher value of the FN characterized the low-extract rye flour samples (on average, 242 s) compared to the high-extract rye flours (on average, 224 s), but the differences were statistically insignificant (Table 2 and Table 3). There was also no significant effect of the flour’s year of production on the value of the FN.

3.1.2. Amylograph Properties

The results of the amylograph and DSC tests are presented in Table 3. The amylograph maximum peak viscosity (APV) ranged from 410 to 940 AU. It was found that only the type of flour had a statistically significant impact on the values of the above parameter. The low-extract rye flour samples were characterized by a significantly higher value of the APV (on average, of 579 AU) compared to high-extract rye flour (on average, of 478 AU). This indicates the significantly lower activity of amylolytic enzymes in low-extract rye flour than in the high-extract rye flour samples. This is due to the greater share of particles originating from the outer parts of the grain in high-extract rye flour, which were characterized by a higher content of amylolytic enzymes compared to particles originating from the endosperm [32]. Also, the study by Michalska et al. [7] showed that suspensions from rye flour samples with an extract of 70% were characterized by a significantly lower maximum peak viscosity than suspensions from flour with an extract above 90%. In our study, the impact of the year of flour production was not significant. Rye flour samples produced in 2019 and 2020 were characterized by a similar level of APV (average 510 and 547 AU, respectively).
The initial temperature of starch gelatinization (TI) was in the range of 50.5–58.0 °C. In the earlier study by Stępniewska [9], a low-extract rye flour samples with a low extract content were characterized by a TI coefficient in the range from 51.5 to 54.0. Our study revealed that only the type of flour had a significant impact on the analyzed parameter (Table 2). The low-extract rye flour samples were characterized by a significantly lower TI compared to high-extract rye flour (on average, 53.1 and 54.7 °C, respectively). The observed differences are probably connected to differences in the starch structure, e.g., granule size [33], the share of amylose and amylopectin [34], phosphorus content [35], the length of the amylopectin side chains [36], and differences in the molecular weight of starch [37]. Our study showed that the rye flour samples produced in the 2019 year were characterized by a TI of a similar level to the rye flour samples produced in the 2020 year (on average, 54.2 and 53.5 °C, respectively).
The final temperature of starch gelatinization (TF) ranged from 67.5 to 83.0 °C. Moreover, above 90% of the study rye flour samples were above the optimal parameters for rye flour, which are characterized by an optimal baking quality, i.e., 65–69 °C [38]. The low-extract rye flour samples were characterized by a higher TF (on average, 72.2 °C) compared to high-extract rye flour (on average, 70.0 °C). However, the differences were not statistically significant. Also, the effect of the flour’s rye year of production on the value of the TF was statistically insignificant.

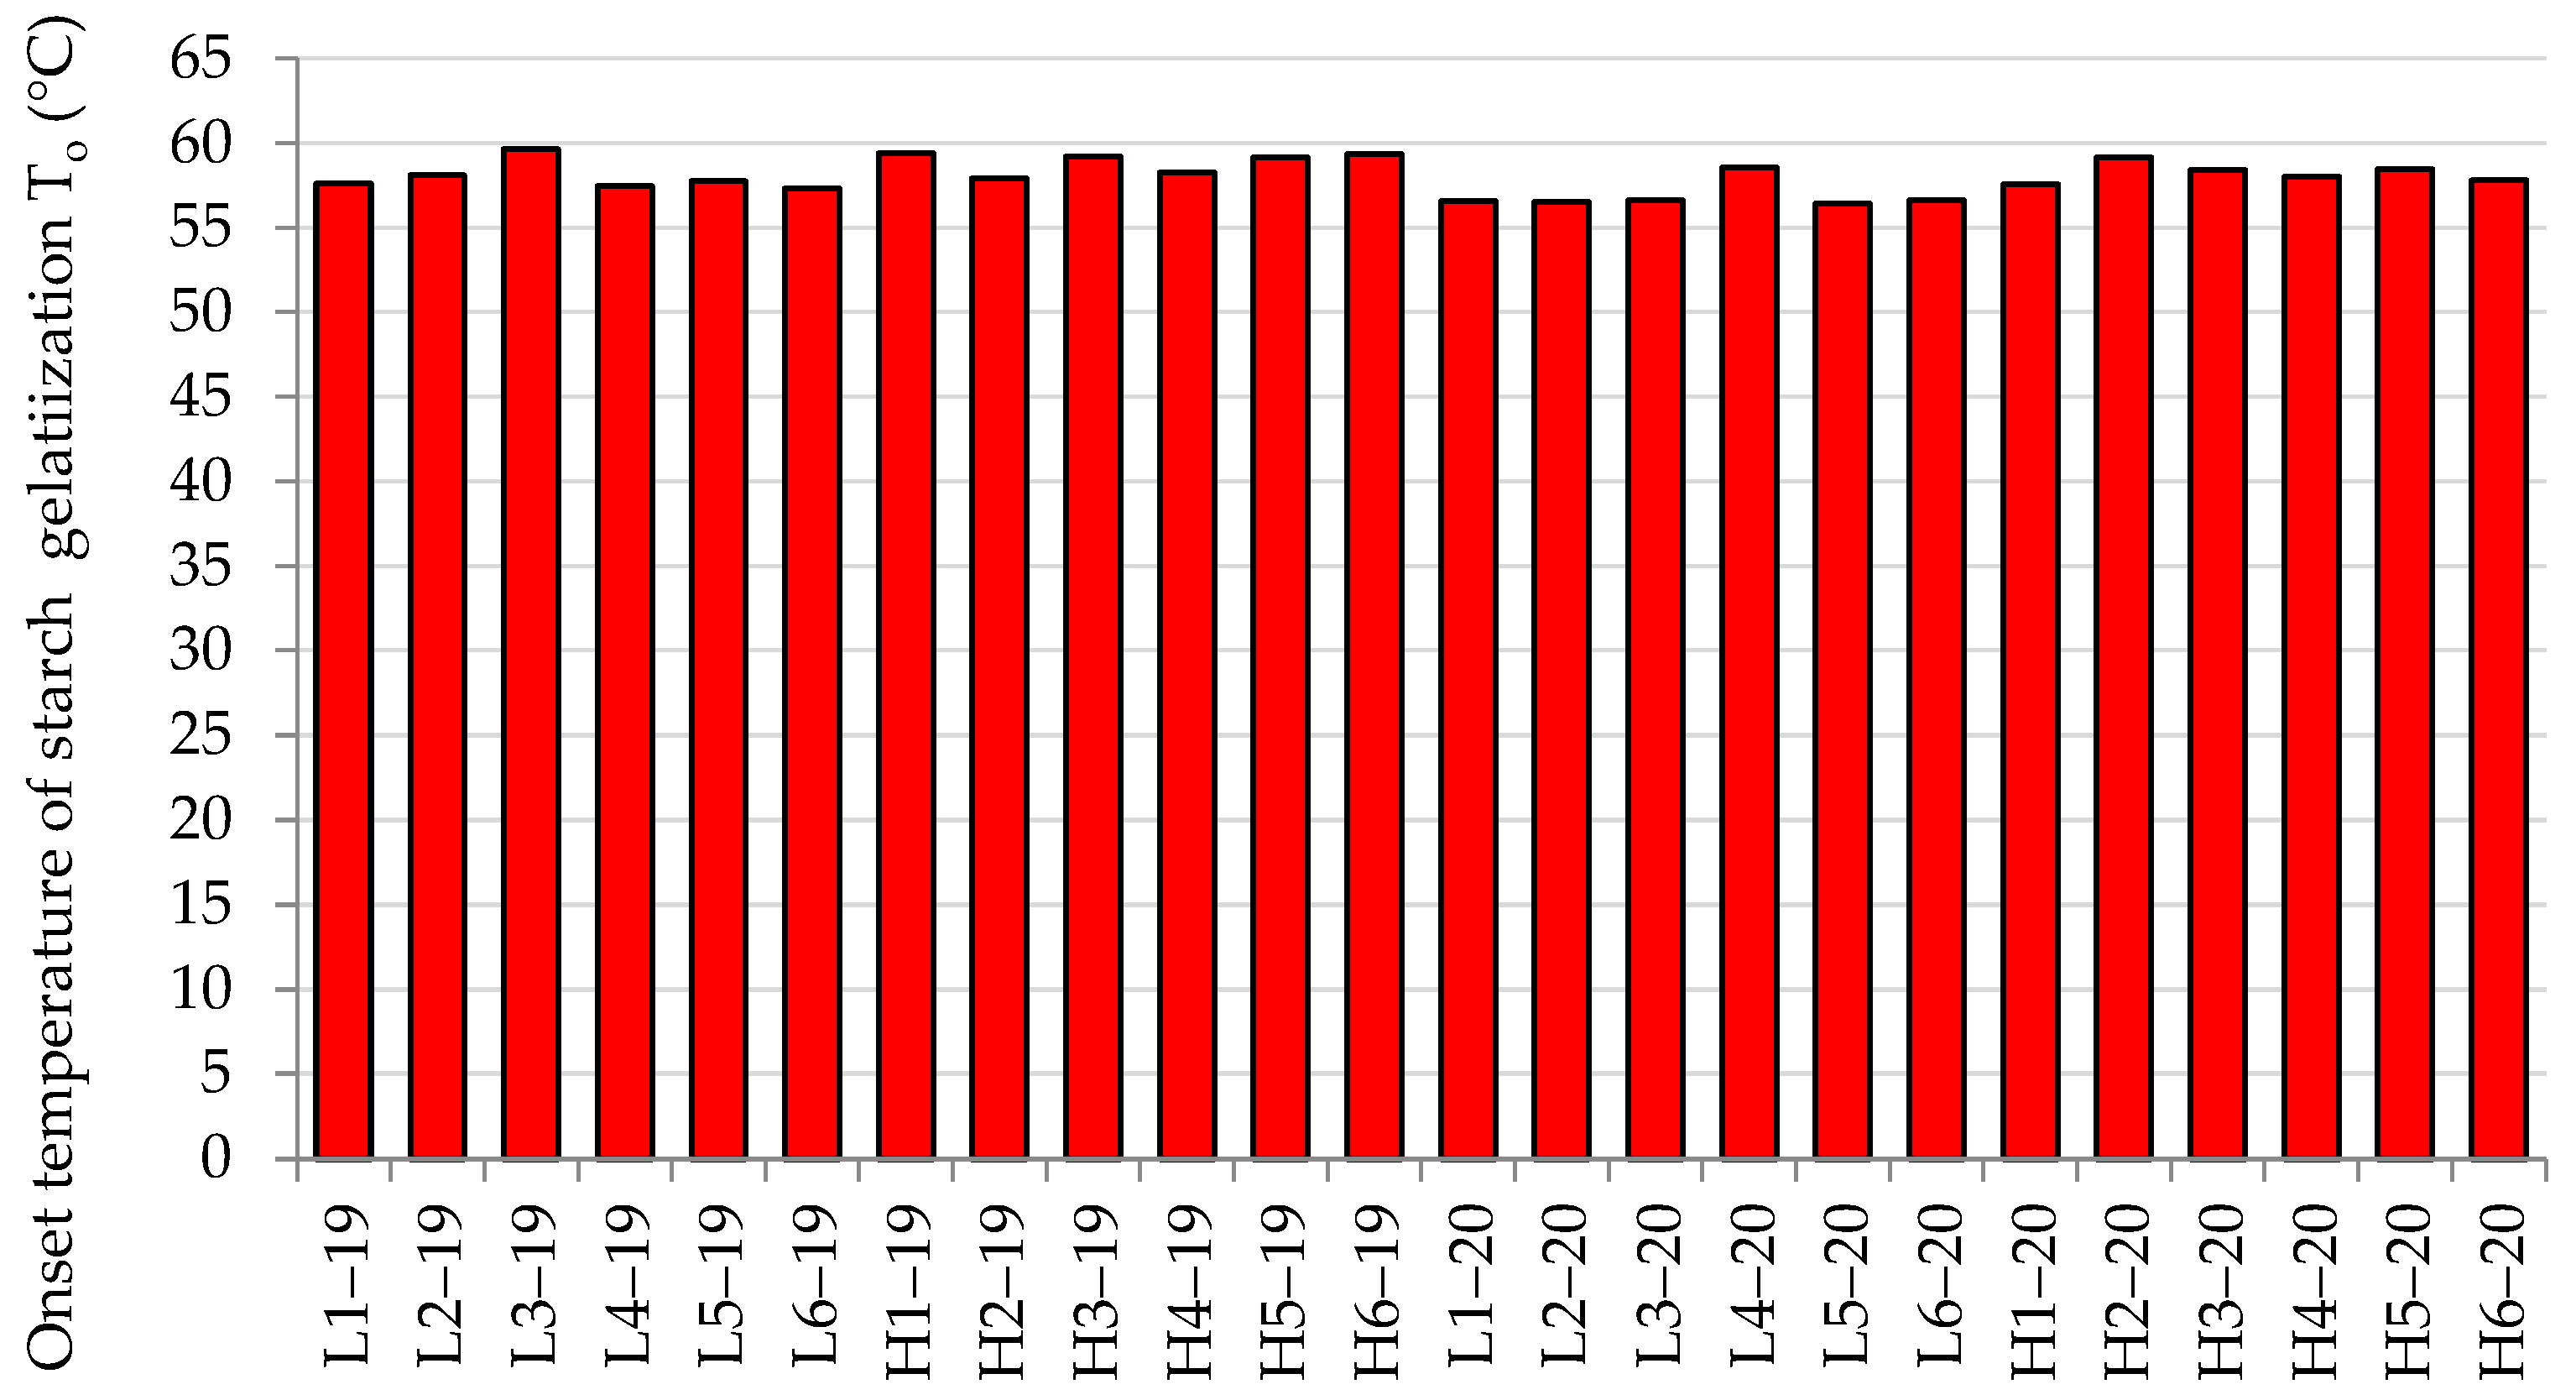
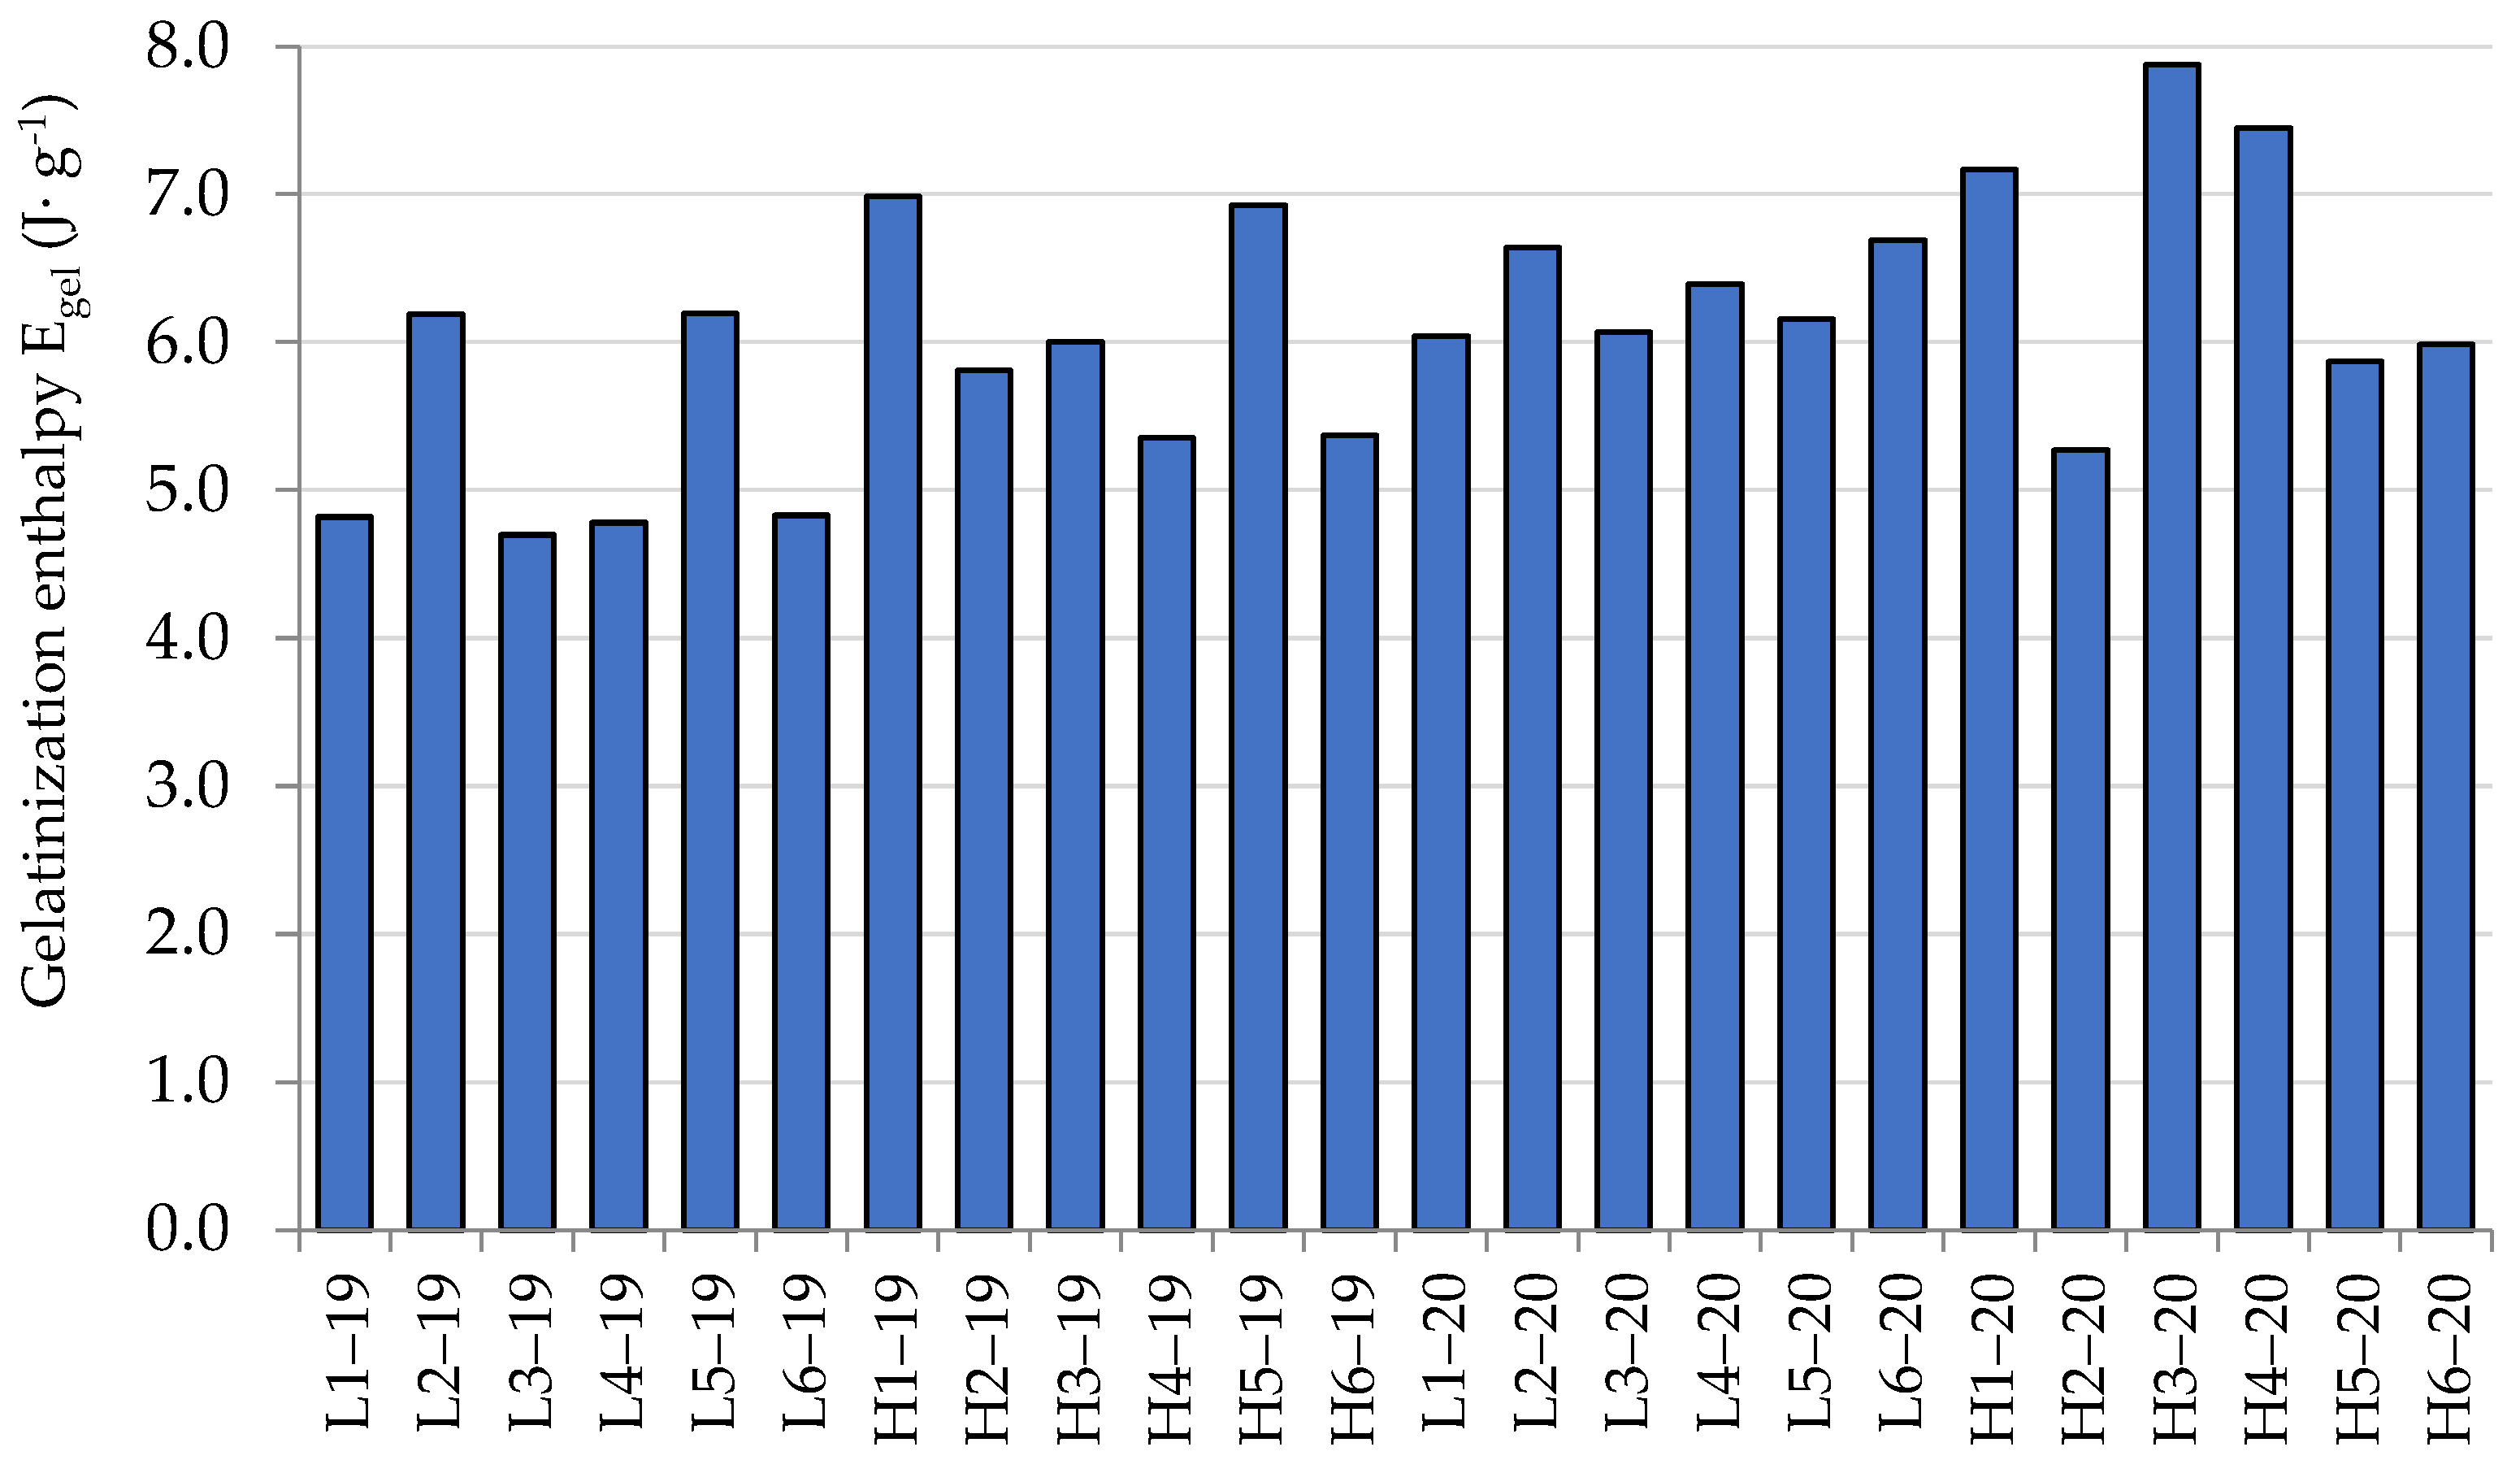
3.1.3. Differential Scanning Calorimetry (DSC)

The gelatinization temperatures of the rye flour samples were also analyzed using DSC (Table 3). Statistical analysis showed that the type of flour and its year of production had a significant impact on all the parameters obtained from the DSC curve (Table 2). According to Kaur et al. [39], the gelatinization temperatures determined by the DSC test depend on the structural and thermal stability of the crystalline region of rye starch. Starch characterized by less stable crystalline regions could absorb water rapidly and gelatinize easily compared to starch that possesses crystalline regions that are thermally and structurally more stable.
The onset temperature of starch gelatinization (To) was in the range of 56.4 to 59.8 °C (Figure 1). A similar range of the To was characteristic of low-extract rye flour in the earlier study by Stępniewska [9]. In the current study, the low-extract rye flour samples were characterized by a significantly lower To than the high-extract rye flour samples (on average, 57.1 and 58.7 °C, respectively). According to Fredriksson et al. [40] and Elgadir et al. [41], the To determined in the DSC test is related to the share of amylose in starch. The studies conducted by the above-mentioned authors showed significant negative correlations between the initial starch gelatinization temperature and the amylose content, which means that during the gelatinization of starch with a lower amylose content, more heat should be supplied, which affects the increase in the starch gelatinization temperature. Our study showed that flours produced in 2019 and 2020 were characterized by a very similar To (on average, 58.2 and 57.5 °C, respectively).
The peak temperature of starch gelatinization (Tp) and the conclusion temperature of starch gelatinization (Tc) were in the range of 57.6 to 65.3 °C and 69.2 to 76.6 °C, respectively. Similar to the temperature To, the low-extract rye flour samples were characterized by a significantly lower Tp and Tc compared to the high-extract rye flour samples (on average, Tp was 62.7 and 64.4 °C and Tc were 72.9 and 74.0 °C, respectively).
Research conducted by Sasaki [42] showed that the amylose content of starch has a significant impact on the Tc. The above studies have shown that there is a negative correlation between the Tc and amylose content. This may suggest that the differences in the Tc between the tested low-extract and high-extract rye flour samples are related to the different shares of amylose in the starches contained in these flour samples.
The gelatinization enthalpy was in the range of 4.7 to 7.9 J·g−1 (Table 3, Figure 2). The low-extract rye flour samples were characterized by significantly lower gelatinization enthalpy compared to the high-extract rye flour (on average, 5.8 and 6.4 J·g−1, respectively). Additionally, the flour samples produced in the 2019 year were characterized by significantly lower gelatinization enthalpy compared to the flour samples produced in the 2020 year (on average, 5.7 and 6.5 J·g−1, respectively). The differences in the gelatinization enthalpy might result from differences in the amylose and amylopectin content [41,43,44], the shape of the starch granules, the share of large and small granules [45] as well as differences in the fat content present in the starch granules [46].

3.2. The Parameters Related to the Pentosan–Pentosanolytic Complex

3.2.1. Pentosan Content

The results of the pentosan content and swelling curve parameters are presented in Table 4 and Figure 3. Statistical analysis revealed that the type of flour had a statistically significant impact on the total pentosan content (TPC), water soluble pentosan content (WSPC) and water insoluble (WIPC) pentosan content (Table 2). The impact oof the flour’s year of production was not significant. The TPC was in the range of 4.57 to 9.61% d.m. (Figure 3). The low-extract rye flour samples were characterized by a TPC of a lower level compared to the high-extract rye flour samples (on average, 5.92 and 8.67% d.m., respectively). In the study conducted by Banu [47], low-extract rye flour samples obtained in a laboratory mill were characterized by a lower TPC, i.e., in the range of 2.36 to 2.85% d.m. However, in our previous research [48], wholemeal rye flour samples from industrial mills were characterized by a TPC in the range of 8.3 to 13.4% d.m.
The WSPC and WIPS were in the range of 3.14 to 4.74% d.m. and 0.89 to 5.29% d.m., respectively (Figure 3). In our earlier research [25], 10 high-extract rye flour samples obtained from industrial mills were characterized by a WSPC and WIPS in the range of 2.60 to 4.3% d.m. and 4.40 to 6.10% d.m., respectively. According to many authors [49,50,51], pentosans affect the properties of starch related to its ability to swell and gelatinize, and to its susceptibility to the action of amylolytic enzymes. These compounds surround the starch granules and, together with amylose, create a film covering the surface of the swollen granules, thus limiting the access of water and amylolytic enzymes to the starch, even at low concentrations, delaying its gelatinization process. In our opinion, probably as the content of pentosans increased, the amount of water available for the starch in the gelatinization process decreased, which delayed and limited the swelling of the starch granules and resulted in an increased gelatinization temperature. A significant positive correlation between the pentosan fractions and the initial temperature of starch gelatinization determined in the amylographic and DSC tests was also observed in our study. Similar relationships were demonstrated in studies conducted by Santos et al. [52], in which soluble pentosans isolated from wheat grains were added to wheat flour, and in studies conducted by Arif et al. [50], in which insoluble pentosans isolated from wheat grains were added to wheat flour. Also, research conducted by Grossmann and Koehler [53] showed that pentosans increase the gelatinization temperature of rye starch. However, Gudmundsson et al. [54], adding soluble pentosans isolated from rye grain to wheat flour, did not find that these compounds significantly influenced the starch gelatinization temperature. These contradictory results obtained by the above-mentioned authors might result from differences in the functional properties of the soluble pentosans used in the studies and may be related to the different origins of the pentosans, their molecular weight, and their degree of branching [55]. Our study revealed that the year of production of the flour had no significant impact on the value of the TPC, WSPC, and WIPC.

3.2.2. Swelling Curve Parameters

The conducted study showed that the flour type significantly impacted all the parameters obtained from the swelling curve test (Table 2). The first parameter obtained from the swelling curve was the initial viscosity at 30 °C (V30), which depended on the ability of the flour’s ingredients (mainly pentosans) to swell, dissolve, and bind water during dough production. A high V30 value indicates the ability of rye flour ingredients to bind water quickly and strongly [25]. In our study, the V30 was in the range of 175 to 700 AU (Table 4, Figure 4). For comparison, in previous studies, high-extract rye flour samples were characterized by a V30 in the range of 175 to 845 AU [25], while in other studies, wholemeal rye flour samples were characterized by an initial viscosity in the range of 230 to 670 AU [48]. Statistical analysis showed that the low-extract rye flour samples were characterized by a low V30 compared to high-extract rye flour (on average, 223 and 540 AU, respectively).
The viscosity of the samples after reaching a temperature of 42 °C (V42) ranged from 145 to 600 AU (Figure 4). The study conducted by Banu [56] revealed that laboratory low-extract rye flour samples were characterized by a viscosity V42 in a narrow range, as in the current study, i.e., 120 to 140 AU. Similar to the viscosity V30, low-extract rye flour was characterized by a significantly lower value of the V42 compared to high-extract rye flour (average value of 191 and 435 AU, respectively). Statistical analysis did not show a significant impact of the year of flour production on the values of the V30 and V42. Suspensions from the tested rye flour samples produced in 2019 and 2020 were characterized by similar levels of V30 and V42 (average V30: 391 and 372 AU as well as V42: 309 and 317 AU, respectively).
The final viscosity after holding the suspension at 42 °C for 30 min (FV42), depending on the content and properties of the pentosans, as well as the degree of enzymatic degradation [57], ranged from 95 to 385 AU (Figure 4). The low-extract rye flour samples were characterized by a significantly lower FV42 compared to the high-extract rye flour samples (on average, 142 and 280 AU, respectively). The flours produced in 2019 also had a significantly higher FV42 value compared to the rye flour samples produced in 2020 (on average, 187 and 235 AU). Similar to the previous study by Stępniewska et al. [48], a significant positive correlation was found between all the viscosity indicators read from the swelling curve and the TPC, WSPC, and WIPC. Also, a study conducted by Autio et al. [58] revealed significant correlations between the V30, V42, and TPC. It should be noted that the viscosity of the rye flour suspension is significantly influenced not only by the content of pentosans but also by their molecular weight and degree of branching. With the same pentosan content, suspensions made from flour containing pentosans with a higher molecular weight and a greater degree of branching are characterized by higher viscosities when examining the swelling curve [59,60].
The changes in viscosity during 30 min of holding the suspension at 42 °C, determined as the differences in the logarithms of the viscosity decrease at 42 °C, allowed for an indirect assessment of the activity of the enzymes that degrade pentosans [25,61]. The rate of decrease of the suspension viscosity is interpreted as an indicator of the decomposition of soluble pentosans, both those present in flour and those formed in the bread baking process as a result of the transformation of insoluble pentosans into a soluble form [56]. It is unfavorable for rye flour to be characterized by a high value of the logarithmic decrease in viscosity at a temperature of 42 °C and also a high initial viscosity at 30 °C. Such parameters are usually characteristic of flour with a high content of pentosans, which undergo numerous transformations during kneading, fermentation, and in the first phase of baking. Insoluble pentosans are mainly transformed into a soluble form. Soluble pentosans, both present in flour and those formed as a result of transformations, undergo acid hydrolysis [59,62]. If the hydrolysis of soluble pentosans is too intense, the dough becomes too intensively loosened during fermentation due to a decrease in dough efficiency related to a reduction in the ability of pentosans to bind water [63]. Although rye flour has high pentosanolytic activity, the conversion of insoluble pentosans into a soluble form during dough kneading and fermentation occurs to a greater extent; however, this process does not have a positive impact on the quality of bread. This is mainly caused by too high a degradation of soluble pentosans, which adversely affects the volume of bread and the crumb structure. In flour characterized by the optimal activity of enzymes, there is an appropriate ability to bind water, because the content of soluble pentosans increases, as well as a decrease occurring in the amount of soluble pentosans with a high molecular weight and an increase in the amount of soluble pentosans with a low molecular weight [64]. During moderate hydrolysis of pentosans, the water remaining from their hydrolysis is available for starch, which has a positive effect on its swelling and gelatinization process. This has a positive effect on the elasticity of the dough, increasing the dough’s ability to retain carbon dioxide and increasing the bread’s volume [15,65]. In our study, the logarithmic decrease in viscosity at 42 °C was in the range of 41 to 261 (Table 4). For comparison, in the study conducted by Autio et al. [58], the values of this parameter for suspensions obtained from wholemeal rye flours were in a lower range, i.e., from 37 to 104. The observed differences could result from differences in the activity of the amylolytic enzymes of the tested rye flours. Rye flours were characterized by a falling number ranging from 200 to 324 s (Table 3), while in the research by Autio et al. [58], the research material was rye flour samples with a falling number in the range of 95 to 200 s. The statistical analysis showed that the type of flour and the year of production of the flour had a statistically significant impact on the values of the logarithmic decrease in viscosity (Table 2). According to Dornez et al. [66], the enzymes that decompose pentosans are unevenly located in the grain and their content increases from the middle part of the endosperm to the outer parts of the grain. Therefore, high-extract rye flour samples, due to the greater share of particles originating from the outer parts of the grain, are characterized by higher activity of pentosanolytic enzymes than low-extract rye flour samples. This was confirmed in our study, in which the suspensions obtained from high-extract rye flour samples were characterized by a significantly higher average value of the logarithmic decrease in viscosity compared to the suspensions from low-extract rye flour samples (136 and 190, respectively) (Table 4). Salmenkallio-Marttila and Hovinen [67] revealed that the value of the logarithmic decrease in viscosity is influenced by the weather conditions during the growth and harvesting of the grain from which the flour was produced. The study conducted by the above authors demonstrated that the rye flour suspensions obtained from grain harvested in a cold and rainy summer were characterized by higher values of the logarithmic viscosity drop than suspensions made from flour obtained from grain harvested in a sunny and dry summer. Our study showed that flours produced in the 2019 year were characterized by, on average, a significantly higher value of the discussed parameter compared to flours produced in the 2020 year (208 and 117, respectively) (Table 4). This proves that the activity of the pentosanolytic enzymes in rye flour produced in the 2019 year was significantly higher than in the 2020 year.

3.3. Bread Characteristic

The quality parameters of rye bread are presented in Table 5. The bread yield was in the range of 145 to 156%. The statistical analysis revealed a significant impact of the type of flour and production year on the above parameters (Table 2). Due to the lower dough yield, determined based on the water absorption of flour, the bread made from low-extract rye flour was characterized by a lower yield compared to the bread from high-extract rye flour (on average, 148 and 153%, respectively). Also, significantly higher yields were characteristic of the bread from flour samples produced in the 2019 year compared to the 2020 year (on average, 151 and 149%, respectively). The conducted study showed a significant correlation between the bread yield and all the parameters read from the DSC endotherm and swelling curve as well as the content of all the pentosan fractions (Table 6). Similar to the present study, a significant correlation between the bread yield and total pentosan content was demonstrated in our early study [48].
The specific bread volume (SBV) was in the range of 152 to 233 cm3/100 g. A significant impact on the SBV was only related to the type of flour (Table 2). The bread from the low-extract rye flour samples was characterized by a significantly higher SBV than the bread from the high-extract rye flour samples (on average, 193 and 171 cm3/100 g, respectively), whereas in the study conducted by Pejcz et al. [68], rye bread from the low-extract and wholemeal flour was characterized an SBV of the levels 267 and 184 cm3/ 100 g. In the present study, the bread from flour samples produced in the 2019 year was characterized by a lower SBV than the bread from flour samples produced in the 2020 year, but the obtained differences were statistically insignificant. The SBV correlated significantly with all the parameters read from the swelling curve and all the pentosan fractions (Table 6). Also, in our previous study [48], there were significant relationships between the volume of rye bread and the content of soluble pentosans, the initial viscosity determined from the swelling curve, and the value of the logarithmic decrease in viscosity at 42 °C. No significant correlation was found between the bread volume and the falling number and amylograph parameters (Table 6). This means that the content of pentosans and the activity of the enzymes that degrade these components have a greater impact on the volume of rye bread from currently produced rye flours than the properties of starch related to the susceptibility to the action of amylolytic enzymes and its ability to swell and gelatinize evaluated by traditional methods such as the falling number and amylograph test. Similar to the earlier study by Stępniewska et al. [9], it has been shown that from the methods used to assess the starch properties, the DSC parameters allow to a greater extent prediction of the rye bread volume than the falling number and amylograph test. Among the DSC parameters, a significant correlation was observed only between the SBV and the onset as well as peak temperature of starch gelatinization (r = −0.729 and −0.710, respectively; Table 6).
The bread crumb moisture (BCM) ranged from 45.3 to 51.0%. Rye bread from wholemeal rye flour samples tested by Buksa et al. [69] was characterized by crumb moisture in a narrower range, i.e., 43.0 to 48.0%. In the present study, only the type of flour had a significant impact on this quality of bread parameter (Table 2). The bread from the low-extract rye flour samples was characterized by a statistically lower BCM compared to the bread from the high-extract rye flour samples (on average, 46.4 and 48.4%, respectively). The effect of the flour’s year of production was not significant (Table 2). In the study conducted by Buksa et al. [69], the BCM was mainly controlled by the level of pentosan content (TPC). Also, in the present study, a significant correlation between the BCM and TPC (r = 0.531; Table 6) was observed. This study revealed a significant positive correlation between the BCM and all the viscosity indices read from the swelling curve (Table 6). Similarly, concerning the specific bread volume, the traditional parameters used to determine the baking quality of rye flour, such as the falling number and maximum amylograph peak viscosity, are not sufficient to predict the BCM (Table 6). The present study revealed that the initial (TI) and onset (To) temperatures of starch gelatinization are good parameters for the prediction of the BCM. The correlation coefficients between the BCM, TI and To were statistically significant (r = 0.473 and r = 0.592, respectively; Table 6).
The bread crumb hardness 24 hours (CH24) and 72 hours (CH72) after baking ranged from 37.8 to 90.7 N and from 54.1 to 115.0 N, respectively. Based on the conducted research, it was shown that the type of flour had a statistically significant impact on the above quality parameter of bread (Table 2). Bread from low-extract rye flour samples was characterized by significantly lower CM24 and CM72 values (on average, 45.1 and 63.1, respectively) compared to bread made from high-extract rye flour (on average, 66.1 and 79.2, respectively). Similar to the early study conducted by Stępniewska et al. [9], a significant correlation of the CH24 and CH72 with the starch content was found (r = −0.689 and r = −0.584, respectively; Table 5). Also, a significant correlation between the CH24, CH72 and all the swelling curve parameters (r ranged from 0.657 to 0.796; Table 6) and the TPC, WSPC, and WIPC (r ranged from 0.521 to 0.790; Table 6) was revealed. The relationship between the bread crumb hardness and the content of pentosan was previously demonstrated by Buksa et al. [69] and Li et al. [64]. The present study also found a significant correlation between the CH24 and CH72 and the initial and onset temperature of starch gelatinization. Similar to the SBV and BCM, no significant relationships were found between the CH24 and CH72 and the traditional parameters were used to determine the baking quality of rye flour, such as the falling number and maximum amylograph peak viscosity (Table 6).
The increase in the bread crumb hardness during the storage of the bread was in the range of 3.9 to 29.0 N. Statistical analysis showed that the type of flour and the year of flour production had a statistically significant impact on the discussed quality parameter of bread (Table 2). The bread from the low-extract rye flour samples was characterized by a significantly higher increase in bread crumb hardness compared to the bread made from the high-extract rye flour samples (on average, 18.0 and 13.1 N, respectively). This is probably due to the higher content of pentosans in high-extract rye flour than in low-extract rye flour (Table 4). Pentosans, through their interaction with starch, play an important role in the process of bread staling, which is mainly caused by starch retrogradations. According to Santos et al. [52], pentosans inhibit the rate of unfavorable changes that occur in bread during its storage, which may result from the formation of starch complexes with these compounds. However, according to Biliaderis et al. [18], pentosans limit starch retrogradation because they hinder the process of combining amylose and amylopectin into ordered (crystalline) structures. Gudmunsson et al. [54] found that an important feature of pentosans that affects starch retrogradations is their ability to absorb a significant amount of water. According to Courtin and Delcour [63], pentosans, by limiting the access of water to starch, influence its slower retrogradations, because starch suspensions containing less water during heating lose the crystalline structure to a lesser extent. The present study showed that the bread made from rye flour samples produced in the 2019 year was characterized by a lower increase in the crumb hardness during storage of the bread compared to the bread made from flour samples produced in 2020 year (on average, 10.7 and 20.4 N, respectively). The study revealed a significant correlation between the discussed quality parameters of bread and the logarithmic decrease in viscosity as well as the initial temperature of starch gelatinization and onset temperature of starch gelatinization (r = −0.742, r = −0.520 and r = −0.562, respectively; Table 6).

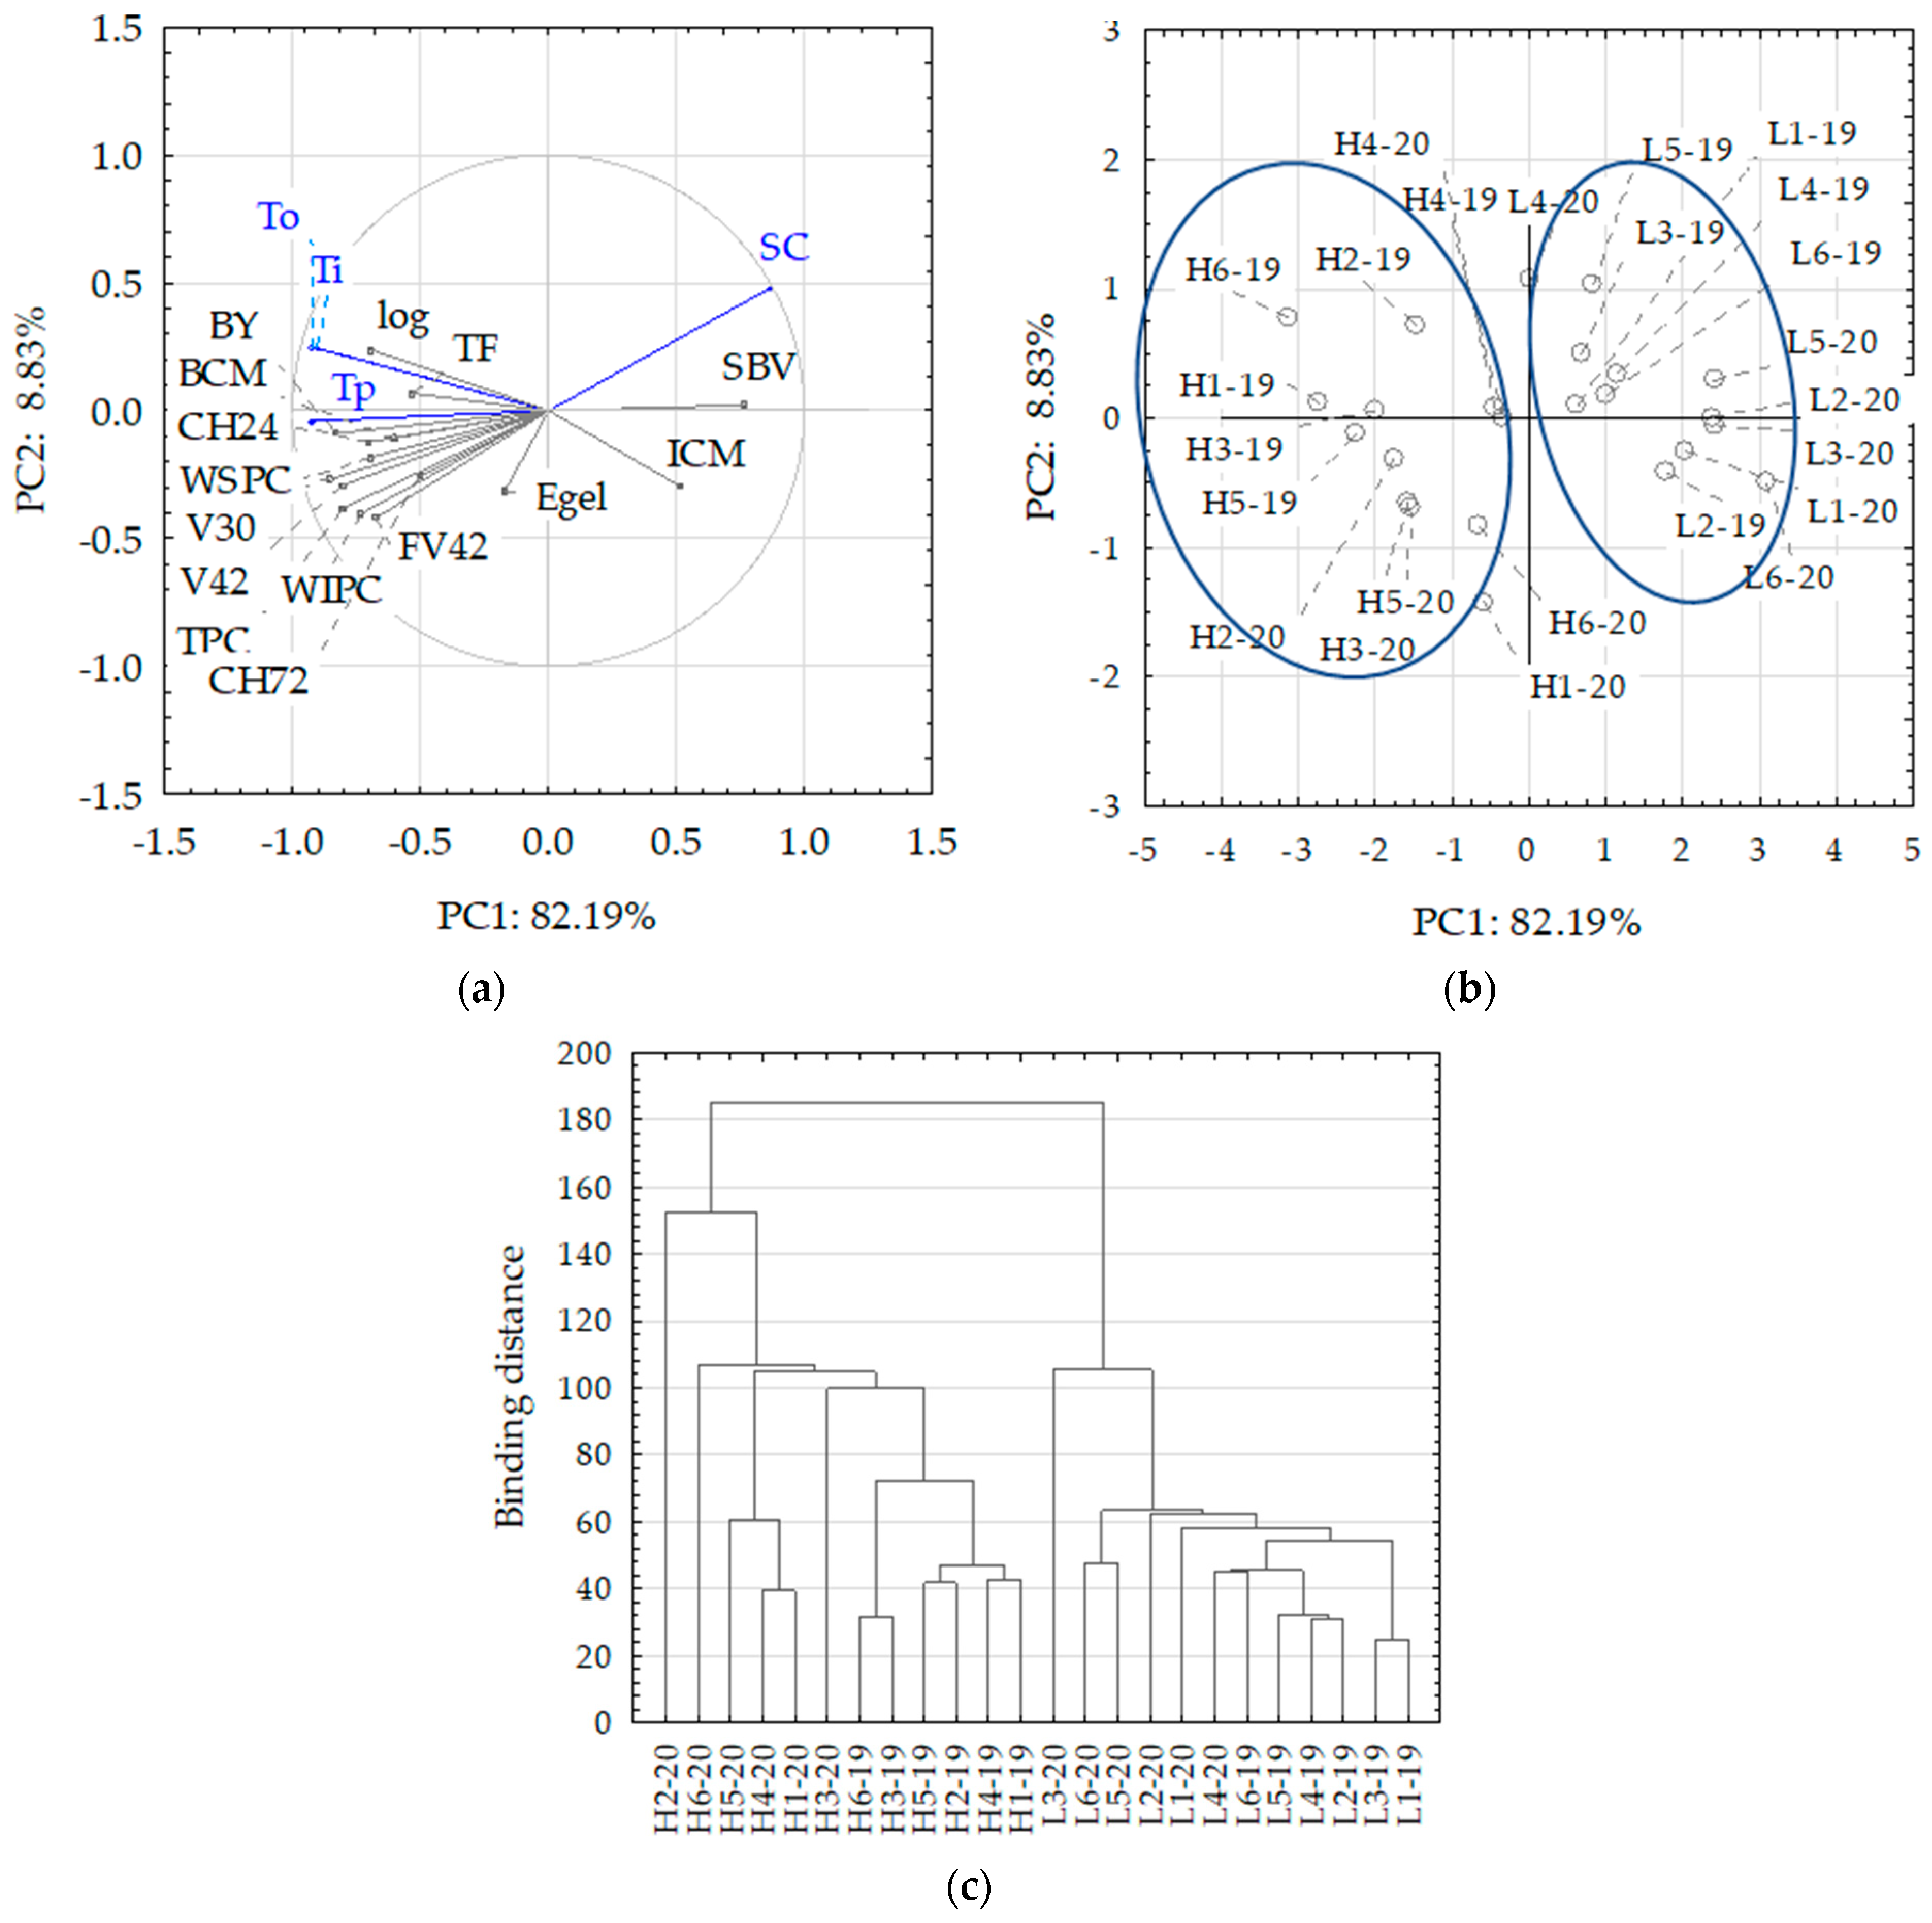
3.4. Comprehensive Assessment of the Baking Quality of Flour Using Principal Component Analysis (PCA)

Principal component analysis (PCA) was used to comprehensively examine the impact of the type of flour and the year of its production on the technological and quality indicators discussed above regarding the baking properties of the flour and the obtained bread samples (Figure 5). All the indicators discussed above were taken into account in the PCA analysis. The two main components identified (PC1, and PC2) explained 91.02% of the variability (Figure 5a). PC1 accounted for 82.19% of the variability, which consisted mainly of the TI, To, Tp, as well as the V30, V42, TPC, BY with negative values (left part of the graph) and the SC as well as the SBV with positive values (right part of the graph). PC2 explained much less, 8.83%, of the variability and was most strongly positively associated with the SC and also negatively associated with the FV42 and WIPC.
According to the above interpretation of the obtained results, the PCA and cluster analysis (Figure 5) confirmed the greater impact of the type of flour than the year of its production on the quality parameters of the tested flour and bread samples. The indicator values for the high-extract flour could be separated from those for the low-extract flour (Figure 5b,c). Most of the tested indicators placed next to each other on the negative side of the graph (Figure 5a) confirm the existence of the significant mutual correlations shown in Table 6. These indicators are inversely proportional to the starch content, which may mean that a higher starch content of flour may have a positive effect on the baking properties of the flour and extend the storage time of the bread made from it. This may be related to the lower crumb hardness, gelatinization temperature range, and pentosan content.

4. Conclusions

The tested rye flour samples were varied in terms of both the properties of the starch–amylolytic complex and the content of pentosans and their properties as determined indirectly using the swelling curve test. The greater impact on the baking quality of rye flour was related to the type of flour rather than the year of flour production. It was shown that the properties of rye dough related to the content of pentosans can be characterized based on the swelling curve test. Evaluating the baking quality of rye flour by the most frequently used parameters, such as the falling number and amylograph maximum peak viscosity, is not sufficient to assess the baking value of commercial rye flours produced from currently cultivated varieties of rye grain, and this study should be supplemented by an assessment of the properties of the pentosan–pentosanolytic complex. This study revealed a significant correlation between the pentosan content (TPC, WSPC, WIPC), swelling curve parameters, and quality parameters of rye bread, such as the specific bread volume, bread crumb moisture, and bread crumb hardness. It was shown that assessment of the baking quality of today’s commercially produced rye flours should include a swelling curve test, together with the parameters informative regarding the starch–amylolytic system, such as the initial and onset temperature of starch gelatinization. Such an assessment provides a better way to determine the baking quality of the commercial rye flour and its suitability for the production of good-quality rye bread.

Practical Application

The present research results will provide valuable information for both millers and people assessing rye flour in bakeries regarding the relationship between the flour indexes and the quality of rye bread. Due to our tests of the commercial quality of rye flour, it will be easier to assess the baking value of the flour and its suitability for baking bread. It may be difficult to directly assess the content of pentosans at milling and bakery plants, but from the presented test results, an indirect assessment of the characteristics of rye dough related to the content of pentosans can be carried out based on the swelling curve test, i.e., a test performed using an amylograph, a device commonly found among the equipment in laboratories at mills and bakeries.

Author Contributions

Conceptualization, S.S., G.C.-P. and A.S. (Anna Szafrańska); methodology, S.S., G.C.-P. and E.O.-L.; formal analysis, S.S. and H.K.; investigation, S.S., E.O.-L. and H.K.; data curation, S.S.; writing—original draft preparation, S.S. and H.K.; writing—review and editing, S.S., A.S. (Anna Szafrańska), A.S. (Agnieszka Salamon), E.O.-L. and H.K.; visualization, S.S., G.C.-P. and A.S. (Agnieszka Salamon); supervision, A.S. (Anna Szafrańska) and A.S. (Agnieszka Salamon); project administration, S.S.; funding acquisition H.K. All authors have read and agreed to the published version of the manuscript.

Funding

This research received no external funding.

Institutional Review Board Statement

Not applicable.

Informed Consent Statement

Not applicable.

Data Availability Statement

The data presented in this study are available upon request from the first author.

Conflicts of Interest

The authors declare no conflicts of interest.

References

  1. Poutanen, K.; Katina, K.; Heiniö, R.-L. Rye. In Bakery Products Science and Technology; Zhou, W., Hui, Y.H., De Leyn, I., Pagani, M.A., Rosell, C.M., Selman, J.D., Therdthai, N., Eds.; John Wiley & Sons, Inc.: Hoboken, NJ, USA, 2014; pp. 75–87. [Google Scholar]
  2. Gräber, S. Influence of enzyme treatment on the rheology of rye doughs. Nahr. Food 1999, 43, 249–252. [Google Scholar] [CrossRef]
  3. Arendt, K.; Ryan Liam, A.M.; Fabio, D.B. Impact of sourdough on the texture of bread. Food Microbiol. 2007, 24, 165–174. [Google Scholar] [CrossRef] [PubMed]
  4. Bucsella, B.; Molnár, D.; Harasztos, A.H.; Tömösközi, S. Comparison of the rheological and end-product properties of an industrial aleurone-rich wheat flour, whole grain wheat and rye flour. J. Cereal Sci. 2016, 69, 40–48. [Google Scholar] [CrossRef]
  5. Drakos, A.; Malindretoi, K.; Mandala, I. Protein isolation from jet milled rye flours differing in practicle size. Food Bioprod. Process. 2017, 104, 13–18. [Google Scholar] [CrossRef]
  6. Beck, M.; Jekle, M.; Selmair, P.L.; Koehler, P.; Becker, T. Rheological properties and baking performance of rye dough as affected by transglutaminase. J. Cereal Sci. 2011, 54, 29–36. [Google Scholar] [CrossRef]
  7. Michalska, A.; Ceglińska, A.; Zieliński, H. Bioactive compounds in rye flours with different extraction rates. Eur. Food Res. Technol. 2007, 225, 545–551. [Google Scholar] [CrossRef]
  8. Verwimp, T.; Courtin, C.M.; Delcour, J.A. Rye constituents and their impact on rye processing. In Food Biochemistry and Food Processing, 2nd ed.; Simpson, B.K., Ed.; John Wiley & Sons, Inc.: Hoboken, NJ, USA, 2012; pp. 654–672. [Google Scholar] [CrossRef]
  9. Stępniewska, S.; Cacak-Pietrzak, G.; Szafrańska, A.; Ostrowska-Ligęza, E.; Dariusz, D. Assessment of the starch-amylolytic complex of rye flours by traditional methods and modern one. Materials 2021, 14, 7603. [Google Scholar] [CrossRef] [PubMed]
  10. Bieniek, A.; Buksa, K. The influence of arabinoxylans on the properties of wheat bread baked using the postponed baking method. Molecules 2024, 29, 904. [Google Scholar] [CrossRef]
  11. Izydorczyk, M.S.; Biliaderis, C.G. Cereal arabinoxylans: Advances in structure and physicochemical properties. Carbohydr. Polym. 1995, 28, 33–48. [Google Scholar] [CrossRef]
  12. Cyran, M.; Cygankiewicz, A. Variability in the content of water-extractable and water-unextractable non-starch polysaccharides in rye flour and their relationship to baking quality parameters. Cereal Res. Commun. 2004, 32, 143–150. [Google Scholar] [CrossRef]
  13. Jaekel, L.Z.; Silva, C.B.; Steel, C.; Change, Y.K. Influence of xylanase addition on the characteristics of loaf bread prepared with white flour or whole grain wheat flour. Cienc. Tecnol. Alime. 2012, 32, 844–849. [Google Scholar] [CrossRef]
  14. Fadel, A.; Ashworth, J.; Plunkett, A.; Mahmoud, A.M.; Ranneh, Y.; Li, W. Improving the extractability of arabinoxylans and the molecular weight of wheat endosperm using extrusion processing. J. Cereal Sci. 2018, 84, 55–61. [Google Scholar] [CrossRef]
  15. Cyran, M.R.; Dynkowska, W.M. Mode of endosperm and wholemeal arabinoxylans solubilisation during rye breadmaking: Genotypic diversity in level, substitution degree and macromolecular characteristics. Food Chem. 2014, 145, 356–364. [Google Scholar] [CrossRef] [PubMed]
  16. Dziki, D. Rye flour and rye bran: New perspectives for use. Processes 2022, 10, 293. [Google Scholar] [CrossRef]
  17. Cleemput, G.; Roels, S.P.; Van Oort, M.; Grobet, P.J.; Delcour, J.A. Heterogeneity in the structure of water-soluble arabinoxylans in European wheat flour of variable bread-making quality. Cereal Chem. 1993, 70, 324–329. [Google Scholar]
  18. Biliaderis, C.G.; Izydorczyk, M.S.; Rattan, O. Effect of arabinoxylans on bread-making quality of wheat flours. Food Chem. 1995, 53, 165–171. [Google Scholar] [CrossRef]
  19. Fabritius, M.; Gates, F.; Salovaara, H.; Auto, K. Structural changes in insoluble cell walls in wholemeal rye doughs. LWT-Food Sci. Technol. 1997, 30, 367–372. [Google Scholar] [CrossRef]
  20. He, H.; Hoseney, R.C. Gas retention of different cereal flour. Cereal Chem. 1991, 68, 334–336. [Google Scholar]
  21. Izydorczyk, M.S.; Biliaderis, C.G. Effect of molecular size on physical properties of wheat arabinoxylans. J. Agric. Food Chem. 1992, 40, 581–588. [Google Scholar] [CrossRef]
  22. Vinkx, C.J.A.; Delcour, J.A. Rye (Secale cereal L.) arabinoxylans: A critical review. J. Cereal Sci. 1996, 24, 1–14. [Google Scholar] [CrossRef]
  23. Kühn, M.C.; Grosch, W. Baking functionality of reconstituted rye flours having different nonstarchy polysaccharide and starch contents. Cereal Chem. 1989, 66, 149–154. [Google Scholar]
  24. Bushuk, W. Rye: Production, Chemistry and Technology, 2nd ed.; AACC: St. Paul, MN, USA, 2001. [Google Scholar]
  25. Stępniewska, S.; Słowik, E.; Cacak-Pietrzak, G.; Romankiewicz, D.; Szafrańska, A.; Dziki, D. Prediction of rye flour baking quality based on parameters of swelling curve. Eur. Food Res. Technol. 2018, 244, 989–997. [Google Scholar] [CrossRef]
  26. ISO 10520:1997; Native Starch—Determination of Starch Content—Ewers Polarimetric Method. ISO: Geneva, Switzerland, 1997.
  27. ISO 3093:2009; Wheat, Rye and Their Flours, Durum Wheat and Durum Wheat Semolina—Determination of the Falling Number according to Hagberg-Perten. ISO: Geneva, Switzerland, 2009.
  28. ISO 7973:1992; Cereals and Milled Cereal Products—Determination of the Viscosity of Flour—Method Using an Amylograph. ISO: Geneva, Switzerland, 1992.
  29. Hashimoto, S.; Shogren, M.D.; Pomeranz, Y. Cereal pentosans. Their estimation and significance. I. Pentosans in wheat and milled wheat products. Cereal Chem. 1987, 64, 30–34. [Google Scholar]
  30. Drews, E. Quellkurven von Roggenmahlprodukten. Die Muehle 1971, 108, 723–724. [Google Scholar]
  31. Michalska, A.; Zieliński, H. Effect of flour extraction rate on bioactive compounds content of two rye varieties. Polish J. Food Nutr. Sci. 2006, 15/56, 297–303. [Google Scholar]
  32. Gómez, M.; Pardo, J.; Oliete, B.; Caballero, P.A. Effect of the milling process on quality characteristics of rye flour. J. Sci. Food Agric. 2009, 89, 470–476. [Google Scholar] [CrossRef]
  33. Ratnayake, W.S.; Jackson, D.S. Gelatinization and solubility of corn starch during heating in excess water: New insights. J. Agric. Food Chem. 2006, 54, 3712–3716. [Google Scholar] [CrossRef] [PubMed]
  34. Blazek, J.; Copeland, L. Pasting and swelling properties of wheat flour and starch in relation to amylose content. Carbohydr. Polym. 2008, 71, 380–387. [Google Scholar] [CrossRef]
  35. Lin, P.Y.; Czajkowska, Z. Role of phosphorius in viscosity, gelatinization and retrogradation of starch. Cereal Chem. 1998, 75, 705–709. [Google Scholar] [CrossRef]
  36. Jane, J.; Chen, Y.Y.; Lee, L.F.; McPherson, A.E.; Wong, K.S.; Radosavljevic, M.; Kasemsuwan, T. Effect of amylopectin branch chain length and amylose content on the gelatinization and pasting properties of starch. Cereal Chem. 1999, 76, 629–637. [Google Scholar] [CrossRef]
  37. Makowska, A.; Szwengiel, A.; Kubiak, P.; Tomaszewska-Gras, J. Characteristics and structure of starch isolated from triticale. Starch-Stärke 2014, 66, 895–902. [Google Scholar] [CrossRef]
  38. Weipert, D. Processing performance of rye as compared to wheat. Cereal Foods World 1997, 42, 706–712. [Google Scholar]
  39. Kaur, P.; Sandhu, K.S.; Purewal, S.S.; Bhatia, A. Physicochemical, morphological, thermal, pasting and tablet making properties along with drug releasing potential of rye (Secale cereale) starch: A report broadening its commercial uses. J. Food Meas. Charact. 2023, 17, 1985–1996. [Google Scholar] [CrossRef]
  40. Fredriksson, H.; Silverio, J.; Andersson, R.; Eliasson, A.-C.; Åman, P. The influence of amylose and amylopectin characteristics on gelatinization and retrogradation properties of different starches. Carbohydr. Polym. 1998, 35, 119–134. [Google Scholar] [CrossRef]
  41. Elgadir, M.A.; Bakar, J.; Zaidul, R.; Abdul Rahman, R.; Abbas, K.A.; Hashim, D.M.; Karim, R. Thermal behavior of selected starches in presence of other food ingredients studied by differential scanning calorimetery (DSC)—Review. Compr. Rev. Food Sci. Food Saf. 2009, 8, 195–201. [Google Scholar] [CrossRef] [PubMed]
  42. Sasaki, T. Effect of wheat characteristics on the gelatinization, retrogradation and gelation properties. JARQ 2005, 39, 253–260. [Google Scholar] [CrossRef]
  43. Liu, H.; Yu, L.; Xie, F.; Chen, L. Gelatinization of corn starch with different amylose/amylopectin content. Carbohydr. Polym. 2006, 65, 357–363. [Google Scholar] [CrossRef]
  44. Chen, P.; Liu, X.; Zhang, X.; Sangwan, P.; Yu, L. Phase transition of waxy and normal wheat starch granules during gelatinization. Int. J. Polym. Sci. 2015, 2015, 397128. [Google Scholar] [CrossRef]
  45. Kaur, M.; Singh, N. Studies on functional, thermal and pasting properties of flours from different chickpea (Cicer arietinum L.) cultivars. Food Chem. 2005, 91, 403–411. [Google Scholar] [CrossRef]
  46. Gomand, S.V.; Verwimp, T.; Goesaert, H.; Delcour, J.A. Structural and physicochemical characterization of rye starch. Carbohydr. Res. 2011, 346, 2727–2735. [Google Scholar] [CrossRef]
  47. Banu, I. Baking quality of rye flour. Bull. USAMV-CN 2007, 63, 488–492. [Google Scholar] [CrossRef]
  48. Stępniewska, S.; Hassoon, W.H.; Szafrańska, A.; Cacak-Pietrzak, G.; Dziki, D. Procedures for breadmaking quality assessment of rye wholemeal flour. Foods 2019, 8, 331. [Google Scholar] [CrossRef] [PubMed]
  49. Tester, R.F.; Sommerville, M.D. The effect of non-starch polysaccharides on the extent of gelatinization, swelling and α-amylase hydrolysis of maize and wheat starches. Food Hydrocoll. 2003, 17, 41–54. [Google Scholar] [CrossRef]
  50. Arif, S.; Ali, T.M.; Afzal, Q.; Ahmed, M.; Siddiqui, A.J.; Hasnain, A. Effect of pentosans addition on pasting properties of flours of eight hard white spring wheat cultivars. J. Food Sci. Technol. 2014, 51, 1066–1075. [Google Scholar] [CrossRef] [PubMed]
  51. Harasztos, H.; Balzazs, G.; Csöke, P.N.; D’Amico, S.; Schönlechner, R.; Tömösközi, S. How arabinoxylans modify gluten and starch related wheat flour characteristics. Acta Aliment. 2016, 45, 215–223. [Google Scholar] [CrossRef]
  52. Santos, D.M.J.; Gama, A.C.; Lopes da Silva, J.A. A rheological study of wheat starch-water-soluble pentosans mixtures under hydrothermal gelling conditions. J. Food Sci. 2002, 67, 3372–3380. [Google Scholar] [CrossRef]
  53. Grossmann, I.; Koehler, P. Fractionation-reconstitution studies on determine the functional properties of rye flour constituents. J. Cereal Sci. 2016, 70, 1–8. [Google Scholar] [CrossRef]
  54. Gudmundsson, M.; Eliasson, A.-C. Thermal and viscous of rye starch extracted from different varieties. Cereal Chem. 1991, 68, 172–177. [Google Scholar]
  55. Revanappa, S.B.; Nandini, C.D.; Salimath, P.V. Structural characterization of pentosans from hemicellulose B of wheat varieties with varying chapatti-making quality. Food Chem. 2010, 119, 27–33. [Google Scholar] [CrossRef]
  56. Banu, I. The evaluation of the quality rye flours on the basis of the biochemical and rheological indices. J. Agroaliment. Process. Technol. 2006, 12, 291–298. [Google Scholar]
  57. Czubaszek, A.; Wojciechowicz-Budzisz, A.; Spychaj, R.; Kawka-Rygielska, J. Baking properties of flour and nutritional value of rye bread with brewer’s spent grain. LWT-Food Sci. Technol. 2021, 150, 111955. [Google Scholar] [CrossRef]
  58. Autio, K.; Flander, L.; Heinonen, R.; Kinnunen, A. Comparison off small and large deformation measurements of whole meal rye doughs. Cereal Chem. 1999, 76, 912–914. [Google Scholar] [CrossRef]
  59. Cyran, M.R.; Ceglińska, A. Genetic variation in the extract viscosity of rye (Secale cereale L.) bread made from endosperm and wholemeal flour: Impact of high-molecular weight arabinoxylans, starch and protein. J. Sci. Food Agric. 2011, 91, 469–479. [Google Scholar] [CrossRef] [PubMed]
  60. Hemalatha, M.S.; Manohar, R.S.; Salimath, P.V.; Prasada Rao, U.J.S. Effect of added arabinoxylans isolated from good and poor chapatti making wheat varieties on rheological properties of dough and chapatti making quality. Food Sci. Nutr. 2013, 4, 884–892. [Google Scholar] [CrossRef]
  61. Autio, K.; Härkönen, H.; Parkkonen, T.; Frigård, T.; Poutanen, K.; Siika-Aho, M.; Åman, P. Effect of purified endo-β-xylanase and endo-β-glucanase on the structural and baking characteristics of rye doughs. LWT-Food Sci. Technol. 1996, 29, 18–27. [Google Scholar] [CrossRef]
  62. Meeus, Y.; Janssen, F.; Wouters, A.G.B.; Delcour, J.A.; Moldenaers, P. The role of arabinoxylan in determining the non-linear and linear rheology of bread doughs made from blends of wheat (Triticum aestivum L.) and rye (Secale cereale L.) flour. Food Hydrocoll. 2021, 120, 106990. [Google Scholar] [CrossRef]
  63. Courtin, C.M.; Delcour, J.A. Arabinoxylans and endoxylanases in wheat flour bread making. J. Cereal Sci. 2002, 35, 225–243. [Google Scholar] [CrossRef]
  64. Li, W.; Hu, H.; Wang, Q.; Brennan, C.S. Molecular features of wheat endosperm arabinoxylans inclusion in functional bread. Foods 2013, 2, 225–237. [Google Scholar] [CrossRef] [PubMed]
  65. Harris, A.D.; Ramalingam, C. Xylanases and its application in food industry: A review. J. Exp. Sci. 2010, 7, 1–11. [Google Scholar]
  66. Dornez, E.; Gebruers, K.; Wiame, S.; Delcour, J.A.; Courtin, C.M. Insight into the distribution of arabinoxylans, endoxylanases, and endoxylanases inhibitors in industrial wheat roller mill streams. J. Agric. Food Chem. 2006, 54, 8521–8529. [Google Scholar] [CrossRef]
  67. Salmenkallio-Marttila, M.; Hovinen, S. Enzyme activities, dietary fibre components and rheological properties of wholemeal flours from rye cultivars grown in Finland. J. Sci. Food Agric. 2005, 85, 1350–1356. [Google Scholar] [CrossRef]
  68. Pejcz, E.; Spychaj, R.; Gil, Z. Technological methods for reducing the content of fructan in rye bread. Eur. Food Res. Technol. 2020, 246, 1839–1846. [Google Scholar] [CrossRef]
  69. Buksa, K.; Nowotna, A.; Praznik, W.; Gambuś, H.; Ziobro, R.; Krawontka, J. The role of pentosans and starch in baking of wholemeal rye bread. Food Res. Int. 2010, 43, 2045–2051. [Google Scholar] [CrossRef]
Figure 1. The onset temperature of starch gelatinization for the studied rye flour samples; the sample codes refer to the flour types H (high-extract) and L (low-extract), the numbers from 1 to 6 indicate subsequent batches of flour samples, and the numbers 19 and 20 indicate the year of flour production (2019 and 2020, respectively).
Applsci 14 02772 g001
Figure 2. Gelatinization enthalpy of the tested rye flour samples (sample codes as in Figure 1).
Applsci 14 02772 g002
Figure 3. Pentosan content: total (TPC), water soluble (WSPC) and water insoluble (WIPC) in the studied rye flour samples (sample codes as in Figure 1).
Applsci 14 02772 g003
Figure 4. Viscosity obtained from the swelling curve test: initial (V30), when the sample reached 42 °C (V42) and final after holding the suspension at 42 °C for 30 min (FV42) obtained from the swelling curve test for the studied rye flour samples (sample codes as in Figure 1).
Applsci 14 02772 g004
Figure 5. PCA and cluster analysis of technological parameters of rye flour samples: (a) PCA loading plot of two principal components, PC1 and PC2, (b) score plot presenting analyzed samples in terms of PC1 vs. PC2, and (c) cluster analysis. Blue lines in (a) indicate active data included in the PCA analysis; points on graph (b) in the dark blue loops are isolated due to the similar values of the examined indicators; explanations: sample codes in chart (c) refer to the flour types H (high extract) and L (low extract), numbers 1 to 6 indicate subsequent batches of flour samples, and numbers 19 and 20 year of flour production, 2019 and 2020, respectively; codes of other indicators as in Table 1.
Applsci 14 02772 g005
Table 1. Rye dough recipe.
IngredientQuantity
Rye flour1000 g *
Salt15 g
Yeast30 g
Lactic acid 88%8 cm3
WaterTo obtain the appropriate dough yield **
* adjusted to the standard moisture content of 14%; ** for flour samples produced in the 2019 year: 700 cm3 (low-extract rye flour) and 780 cm3 (high-extract rye flour); concerning flour produced in the 2020 year: 680 cm3 (low-extract rye flour) and 760 cm3 (high-extract rye flour).
Table 2. F-value (ANOVA) of the study quality parameters of the rye flour and rye bread.
Parameter, Code/FactorFlour Interaction
Type
(A)
Year Production
(B)
A × B
Parameter related to starch–amylolytic complex
Starch content, ST165.55 **0.491.08
Falling number, FN3.000.460.16
Amylograph parameters
Maximum peak viscosity, APV5.07 *0.680.48
Initial temperature, TI27.98 **4.96 *0.70
Final temperature, TF3.760.000.06
DSC parameters
Onset temperature, To37.15 **7.17 *1.11
Peak temperature, Tp43.22 **11.64 **3.28
Conclusion temperature, Tc5.46 *30.05 **15.55 **
Gelatinization enthalpy, Egel3.497.26 *0.77
Parameters related to pentosan content
Total content, TPC152.78 **0.065.81 *
Water insoluble, WSPC26.03 **0.533.25
Water soluble, WIPC84.24 **0.2010.23 **
Swelling curve parameters
Initial viscosity at 30 °C, V30146.23 **0.540.04
Viscosity at 42 °C, V4293.07 **0.090.09
Viscosity at 42 °C for 30 min, FV4286.89 **10.01 **0.00
Logarithmic decrease of viscosity at 42 °C, log20.67 **59.79 **1.32
Bread quality parameters
Bread yield, BY70.76 **10.17 **3.03
Specific bread volume, SBV16.70 **2.260.14
Bread crumb moisture, BCM18.92 **0.881.60
Hardness after 24 h, CH2417.32 **0.800.21
Hardness after 72 h, CH728.44 **0.890.05
Hardness increase for 48 h, ICM10.30 **39.81 **5.15 *
* significant difference at p ≤ 0.05; ** significant difference at p ≤ 0.01. Detailed explanations: ST—starch content; FN—falling number; TI, TF—temperature of starch gelatinization—initial and final, respectively; To, Tp, Tc—temperature of starch gelatinization—onset, peak and conclusion, respectively; TPC—total pentosan content, WSPC—water soluble pentosan content, WIPC—water insoluble pentosan content, V30—the initial viscosity at 30 °C, V42—viscosity when the sample reached 42 °C, FV42—final viscosity after holding the suspension at 42 °C for 30 min, (logV42 − logFV42) × 1000 –logarithmic decrease in viscosity at 42 °C, CH24—bread crumb hardness 24 h after baking, CH72—bread crumb hardness 72 h after baking, ICM (CH72 − CH24)—increase in bread crumb hardness during 48 h of bread storage.
Table 3. Results of parameter characteristics of starch–amylolytic properties of tested rye flour samples.
Quality
Parameter
RangeFlour TypeYear of Production
Low
Extract
High
Extract
20192020
Starch content (% d.m.) ST52.2–68.766.4 ± 1.5 a55.0 ± 2.7 b61.0 ± 5.8 a60.4 ± 6.8 a
Falling number (s), FN200–324242 ± 32 a224 ± 14 a236 ± 30 a230 ± 21 a
Amylograph parameters
Maximum peak viscosity (AU), APV410–940579 ± 144 a478 ± 64 b510 ± 148 a547 ± 88 a
Initial temperature of starch gelatinization (°C), TI50.5–58.053.1 ± 0.9 b54.7 ± 1.2 a54.2 ± 1.0 a53.5 ± 1.0 a
Final temperature of starch gelatinization (°C), TF67.5–83.072.2 ± 3.7 a70.0 ± 1.6 a71.1 ± 3.8 a71.1 ± 2.1 a
DSC parameters
Onset temperature of starch gelatinization (°C), To56.4–59.857.1 ± 1.0 b58.7 ± 0.7 a58.2 ± 0.8 a57.5 ± 1.0 a
Peak temperature of starch gelatinization (°C), Tp57.6–65.362.7 ± 0.9 b64.4 ± 0.5 a64.0 ± 0.7 a63.1 ± 1.3 a
Conclusion temperature of starch gelatinization (°C), Tc69.2–76.672.9 ± 2.4 a74.0 ± 1.3 b74.7 ±1.2 a72.2 ± 1.8 b
Gelatinization enthalpy (J·g−1), Egel4.7–7.95.8 ± 0.8 a6.4 ± 0.9 b5.7 ± 0.8 b6.5 ± 0.7 a
The values in the table are given in the min–max range and average values ± standard deviation; a, b—homogenous groups obtained by the t-Tukey’s test at p ≤ 0.05. Data with the same superscript alphabets in columns are not significantly different (p > 0.05); n = 3.
Table 4. The parameters related to the pentosan content in the tested rye flour samples.
Quality
Parameter
RangeFlour TypeYear of Production
Low
Extract
High
Extract
20192020
TPC (% d.m.)4.57–9.615.92 ± 0.62 b8.67 ± 0.58 a7.26 ± 1.17 a7.32 ± 1.82 a
WSPC (% d.m.)3.14–4.743.53 ± 0.16 b4.17 ± 0.43 a3.89 ± 0.48 a3.80 ± 0.44 a
WIPC (% d.m.)0.89–5.292.38 ± 0.71 b4.47 ± 0.62 a3.78 ± 0.83 a3.48 ± 1.57 a
Swelling curve parameters
V30 (AU)175–700223 ± 34 b540 ± 81 a391 ± 177 a372 ± 180 a
V42 (AU)145–600191 ± 37 b435 ± 76 a309 ± 139 a317 ± 146 a
FV4295–385142 ± 41 b280 ± 46 a187 ± 75 b235 ± 86 a
(logV42 − logFV42)·100041–261136 ± 62 b190 ± 48 a208 ± 30 a117 ± 49 b
The values in the table are given in the min–max range and average values average ± standard deviation; a, b—homogenous groups obtained by the t-Tukey’s test at p ≤ 0.05. Data with the same superscript alphabets in columns are not significantly different (p > 0.05); n = 3. The abbreviations (codes) are described in Table 2.
Table 5. Quality traits of rye bread obtained from tested rye flour samples.
Quality
Parameter
RangeFlour TypeYear of Production
Low
Extract
High
Extract
20192020
Bread yield (%)145–156148 ± 2 b153 ± 2 a151 ± 3 b149 ± 2 a
Specific bread volume (cm3/100 g)152–233193 ± 7 a171 ± 13 b 178 ± 12 a186 ± 21 a
Bread crumb moisture (%)45.3–51.046.4 ± 0.6 b48.4 ± 1.5 a47.6 ± 1.6 a47.2 ± 1.5 a
CH24 (N)37.8–90.745.1 ± 5.1 b66.1 ± 16 a57.9 ± 13.5 a53.3 ± 18.1 a
CH72 (N)54.1–115.063.1 ± 6.1 b79.2 ± 17.8 a68.6 ± 9.8 a73.8 ± 19.0 a
CH72 − CH24 (N)3.9–29.018.0 ± 5.6 a13.1 ± 7.4 b10.7 ± 5.2 b20.4 ± 4.7 a
The values in the table are given in the min–max range and average values average ± standard deviation; a, b—homogenous groups obtained by the t-Tukey’s test at p ≤ 0.05. Data with the same superscript alphabets in columns are not significantly different (p > 0.05); n = 3. CH24—bread crumb hardness 24 h after baking, CH72—bread crumb hardness 72 h after baking, CH72 − CH24—increase in bread crumb hardness after 2 days storage of bread.
Table 6. Pearson’s correlation coefficients between the quality parameters of rye flour and rye bread (coefficient values at the level of p < 0.05 and p < 0.01 * or NS if there was no significance).
ParametersFNTIAPVToEgelTPCWSPCWIPCV30V42FV42LogBYSBVBCMCH24CH72ICM
SCNS−0.634 *NS−0.690 *NS−0.895 *−0.734 *−0.828 *−0.895 *−0.871 *−0.834 *−0.434−0.795 *0.676 *−0.581 *−0.689 *−0.584 *NS
FN NS0.761 *NSNSNSNSNSNSNSNSNSNSNSNSNSNSNS
TI −0.4470.824 *NS0.567 *0.586 *0.562 *0.684 *0.636 *0.5100.592 *0.759 *−0.729 *0.4740.611 *0.404−0.520 *
APV NSNS−0.429NS−0.454NSNSNSNSNSNSNSNSNSNS
To NS0.671 *0.663 *0.582 *0.786 *0.744 *0.589 *0.714 *0.759 *−0.664 *0.592 *0.648 *0.425−0.563 *
Egel NSNSNSNSNSNSNSNSNS0.435NSNSNS
TPC 0.674 *0.971 *0.886 *0.861 *0.823 *0.4360.786 *−0.660 *0.531 *0.681 *0.615 *NS
WSPC 0.4850.852 *0.858 *0.756 *0.5160.610 *−0.732 *0.4230.790 *0.642 *−0.409
WIPC 0.773 *0.740 *0.724 *NS0.737 *−0.549 *0.4930.551 *0.521NS
V30 0.988 *0.909 *0.563 *0.780 *−0.746 *0.591 *0.796 *0.658 *NS
V42 0.951 *0.4780.716 *−0.726 *0.5350.792 *0.692 *NS
FV42 NS0.599 *−0.589 *0.4860.658 *0.662 *NS
Log 0.562 *−0.664 *NS0.605 *NS−0.743
BY −0.636 *0.653 *0.644 *0.425−0.552 *
SBV NS−0.865 *−0.737 *NS
BCM NSNS−0.495
CH24 0.905 *NS
CH72 NS
NS, not significant; SC, starch content; FN, falling number; TI, initial temperature of starch gelatinization; APV, amylograph peak viscosity; To, onset temperature of starch gelatinization; Egel, gelatinization enthalpy; TPC, total pentosan content; WSPC, water soluble pentosan content; WIPC; water insoluble pentosan content; V30, the initial viscosity at 30 °C; V42, viscosity when the sample reached 42 °C; FV42, final viscosity after holding the suspension at 42 °C during 30 min; Log, logarithmic decrease in viscosity at 42 °C; BY, bread yield; SBV, specific bread volume; BCM, bread crumb moisture; CH24, bread crumb hardness 24 hours after baking; CH72, bread crumb hardness 72 hours after baking; ICM, increase of bread crumb hardness after 2 days storage of bread.
Disclaimer/Publisher’s Note: The statements, opinions and data contained in all publications are solely those of the individual author(s) and contributor(s) and not of MDPI and/or the editor(s). MDPI and/or the editor(s) disclaim responsibility for any injury to people or property resulting from any ideas, methods, instructions or products referred to in the content.

