Article

Effects of Pulsed Electric Field on Oil Extraction Rate and Tocopherol in Peony Seeds

1
School of Biological and Environmental Engineering, Xi’an University, Xi’an 710065, China
2
CAS Key Laboratory of Chemistry of Northwestern Plant Resources, Lanzhou Institute of Chemical Physics, Chinese Academy of Sciences, Lanzhou 730000, China
3
School of Electrical Engineering, Xi’an Jiaotong University, Xi’an 710049, China
*
Author to whom correspondence should be addressed.
Appl. Sci. 2024, 14(8), 3299; https://doi.org/10.3390/app14083299
Submission received: 6 March 2024 / Revised: 9 April 2024 / Accepted: 11 April 2024 / Published: 14 April 2024
(This article belongs to the Special Issue Advanced Food Processing Technologies and Food Quality)

Abstract

:

Featured Application

Pulsed electric field (PEF) technology has been extensively investigated in the realm of plant oil extraction, yielding positive outcomes for various oils such as olive, rapeseed, and sunflower. Consensus has been reached that PEF can undeniably enhance oil yield. Given the low yield, yet high nutritional and economic value of peony seeds, it is imperative to improve their oil production; however, limited research exists on utilizing PEF to enhance peony seed oil yield. Conducting relevant studies will facilitate the application and popularization of PEF technology and equipment in the domain of peony seed oil extraction.

Abstract

Peony seed oil, known for its high nutritional value and low production yield, has become a crucial component in high-quality health products. Consequently, enhancing the extraction efficiency of peony seed oil has become an industry objective. Pulse electric field (PEF) technology, as a non-thermal extraction method, has shown promising advancements in improving plant oil yield by enhancing cell permeability. In this study, we designed a static parallel plate PEF treatment unit to process peony seed particles. By manipulating pulse voltage parameters, we investigated the effects of particle size and PEF strength on the oil yield. We also analyzed and evaluated tocopherol in the oil before and after treatment. The results demonstrated that PEF significantly increased the oil yield. Both treated and control groups exhibited gradually increased oil yields with decreasing particle size until reaching saturation at a certain particle size. Increasing voltage frequency did not have a significant impact on the oil yield; however, increasing voltage amplitude resulted in an optimal point for maximum oil yield. Analysis of oil composition indicated that PEF appropriately increased tocopherol content. These findings provide a foundation for further optimization of PEF parameters to assist in extracting peony seed oil and facilitate its industrial application.

1. Introduction

Peony seeds can be pressed for oil, which is not only edible, but also beneficial for human health and natural wellness. Peony seed oil is a type of edible oil made from the seeds of “Feng Dan” and “Zi Ban” peony, both belonging to the family Paeoniaceae [1]. Peony seed oil has a high content of unsaturated fatty acids at 92%, with polyunsaturated fatty acids (PUFAs) accounting for 70% of that, including over 40% alpha-linolenic acid (which is 140 times higher than olive oil and 10 folds higher than soybean oil), making it highly beneficial for human health. In a study conducted by Pascual et al. in 2021 [2], it was revealed that palmitic acid (PA) promotes metastasis in oral carcinomas and melanoma in mice, indicating that consuming plant oils high in PA can be extremely detrimental to human health. However, peony seed oil has very low levels of PA. Additionally, peony seed oil contains tocopherols (especially α-tocopherol) with antioxidant properties. The content of α-tocopherol in peony seed oil is significantly higher compared to other vegetable oils such as olive oil, camellia seed oil, walnut oil, etc., providing significant advantages in skincare and healthcare treatments, reproductive disorder treatments, heart protection, prevention of non-alcoholic liver diseases, as well as anti-tumor effects and diabetes prevention.
According to the data from the China Forestry Industry Association, the planting area of oil peony in China exceeded 1.9 million MU (about 126,667 km2) in 2021, with an annual production of approximately 53,000 tons of traditional mechanically pressed peony seed oil. Peony seeds have an oil content higher than 22%. If the oil extraction rate can be increased by 5%, the oil production will increase by more than 10,000 tons, leading to significant improvement in economic benefits. In recent years, new technologies such as low-frequency ultrasound [3,4,5,6], microwave [7], high-frequency ultrasound [8,9], and pulsed electric field (PEF) [10] have been continuously introduced into the process of lipid extraction to enhance extraction efficiency and final product quality. PEF is a non-thermal technology that applies high-voltage pulses ranging from microseconds to milliseconds [11,12]. The main mechanism for improving oil yield is through increased cell membrane conductivity, resulting in micro-pore formation and subsequent rupture of cell membranes. Depending on the strength of the electric field applied, cell membrane damage can be reversible or irreversible. In reversible damage, pores are closed through rearrangement of phospholipids and proteins. In irreversible damage, pores on cell membranes cannot be closed, leading to loss of cellular integrity [13]. This phenomenon enhances mass transfer and causes leakage of small molecules [14]. Furthermore, it has been reported that PEF applications in mechanical extraction processes for improving juice, oils and other products can increase the content of bioactive compounds while maintaining sensory characteristics of extracted products [15,16].
Pulsed electric field (PEF) technology has been extensively utilized in plant oil extraction research, with a focus on enhancing oil yield and improving product quality [17,18]. Shorstkii et al. employed PEF to process sunflower seeds, resulting in a notable increase of 9.1% in oil yield [19]. Puértolas et al. observed a significant improvement of 13.3% in the extraction rate of olive paste after PEF treatment [18]. Haji-Moradkhani et al. obtained that the application of PEF enhanced extraction efficiency without causing any significant impact on refractive index, acidity, acid value, and peroxide value (POV) of hemp seed oil [20]. By utilizing a PEF device for olive paste extraction, the extraction rate increased significantly from 79.5% in the control group to 85.5% [10]. Haji-Moradkhani et al., through pulsed electric field-assisted hemp seed oil extraction, discovered that selecting samples with an optimal pulse electric field intensity of 2.33 kV/cm and pressure speed of 28.69 rpm resulted in higher efficiency and optimized physicochemical properties [20]. Rábago-Panduro et al. applied Pulsed Electric Fields on pecan nuts, and attended the indexes such as oil extraction yield, compositional characteristics of the oil, and the by-products [21]. Results demonstrated that applying PEF increased the overall oil extraction yield (OEYTOTAL) by 21.4% compared to untreated pecans and by 17.6% compared to soaked pecans; meanwhile, the oleic acid content and AC in PEF-treated pecans fell within reported ranges for pecan nut oil values.
While pulsed electric field (PEF) technology is widely studied to improve the yield of vegetable oil, researchers are also concerned about the safety and quality of the oil after PEF treatment. Leone et al., in a large-scale olive oil extraction factory, investigated the effects of PEF on extractability, chemical composition, and sensory characteristics of olive paste from the Picholine variety [22]. The results showed that compared to the control group, applying PEF treatment (2.4 kV/cm, 4 kJ/kg, 6 µs pulse width) to continuous systems significantly increased extractability (by over 3%) as well as total tocopherol content (particularly European leaf-derived compounds). Importantly, PEF treatment did not affect quality parameters such as α-tocopherol content and volatile compound characteristics in these extra virgin olive oils (EVOOs). Antonia Tamborrino et al. reported that, under energy-specific input of 5.1 kg/kJ, PEF treatment significantly enhances extractability of olive paste without adverse effects on legal quality and sensorial properties [23]. Martínez-Beamonte et al. [24] utilized PEF technology for the processing of extra virgin olive oil (EVOO), and their research revealed that PEF application resulted in a 17% increase in oil yield, while maintaining the chemical composition of plant sterols, phenolic compounds, and microRNAs largely unchanged. Only female mice fed with PEF-treated EVOO exhibited a decrease in total plasma cholesterol levels; however, no significant alterations were observed in terms of atherosclerosis or liver fat degeneration, further supporting the safe utilization of PEF-treated EVOO as food. Li et al. conducted an assessment study on Canola oil extracted after PEF treatment to evaluate genetic toxicity, acute toxicity, and subacute toxicity; the results confirmed that PEF treatment had no adverse impact on the oil product [25]. Mazroei Seydani et al. employed PEF to improve rapeseed oil extraction efficiency without negatively affecting its quality [26].
Driven by the inherent demand of the industry to achieve maximum oil extraction rates, several novel non-thermal processing technologies, such as ultrasound (US), high pressure processing (HPP), and high voltage pulsed electric field (HV-PEF), have garnered attention. Grillo et al. employed a combination of US and PEF technologies in continuous flow industrial olive oil production using Taggiasca and Coratina olive varieties. The findings revealed that both techniques can enhance virgin olive oil (VOO) extraction yield through potent nonthermal physical effects like acoustic cavitation and electroporation, resulting in an increase from 16.3% to 18.1% [27]. Additionally, they also improved the quality and commercial value of VOO by increasing total hydroxytyrosol and tyrosol levels from 271 mg/kg under conventional processes to 314 mg/kg under US-assisted PEF process. V. Andreou et al. optimized and compared the potential benefits of PEF and HPP techniques on the quality and oxidative stability of olive oil [28]. They found that both PEF and HPP pre-treatments enhanced the oxidative stability of olive oil compared to the control group, which contributes to increased extraction of polyphenols and α-tocopherol.
Peony seed oil possesses distinct advantages in terms of consumption and healthcare, earning it the moniker “liquid gold” alongside olive oil. However, there have been no reports on the utilization of pulsed electric fields to enhance oil extraction rates. This study focuses specifically on peony seeds and investigates the impact of pulse voltage parameters in PEF applications on both oil extraction rates and tocopherol. The objective is to establish a foundation for scientific research and provide guidance for industrial applications utilizing PEF technology to optimize peony seed oil extraction rates.

2. Materials and Methods

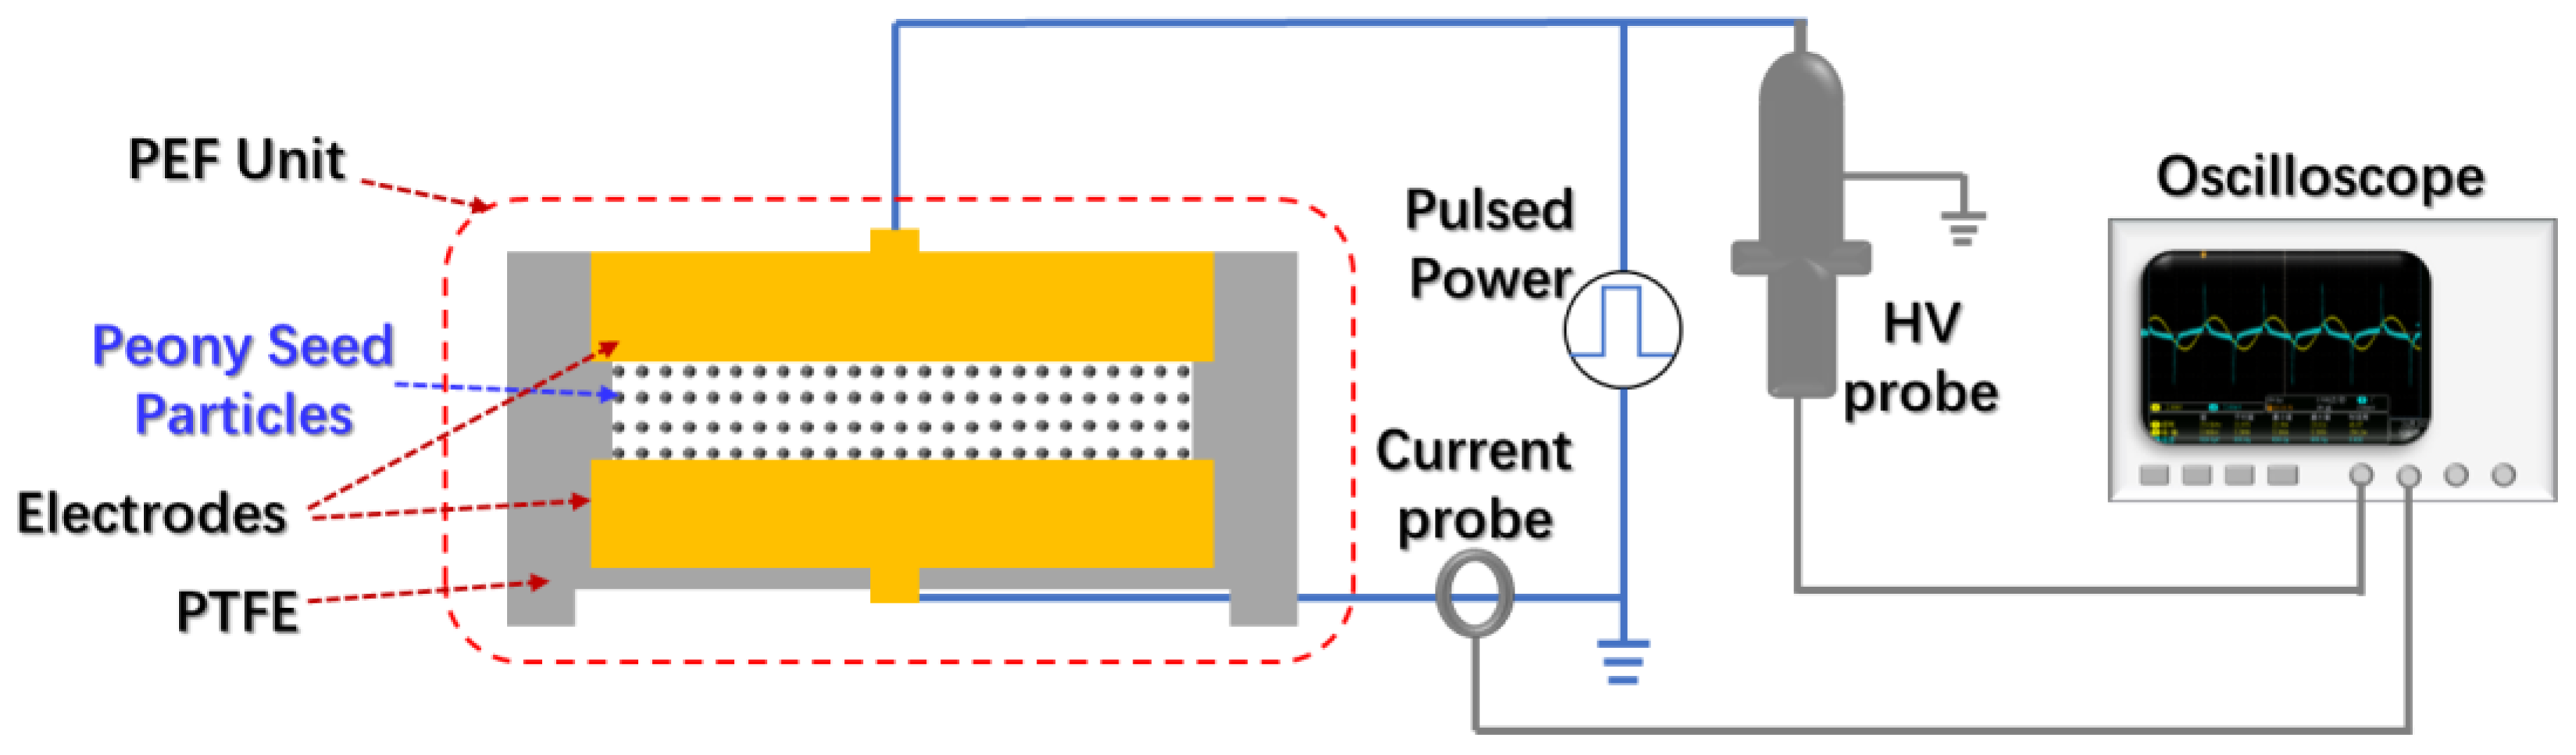
2.1. Pulsed Electric Field System

We designed a pulse electric field treatment unit with a parallel plate structure to achieve effective processing and parameter control of peony seeds. The treatment unit comprises two stainless steel electrodes, each with a diameter of 50 mm and chamfered edges. These electrodes are embedded within the interior of a polytetrafluoroethylene (PTFE) hollow cylinder, creating a uniform electric field with a spacing of 5 mm. The lower electrode is grounded and fixed, while the upper electrode is connected to high voltage and movable for filling peony seed particles. A schematic diagram illustrating the experimental treatment and electrical parameter measurement can be seen in Figure 1. The home-made high-voltage pulse power supply generates pulse voltage parameters as follows: both rise time and fall time equal to 50 ns, pulse width set at 200 ns, repetition frequencies at either 100 Hz or 1 kHz, voltage amplitude ranging from 1 kV to 10 kV, respectively. The PEF treatment time set at 2 min. Voltage applied on the treatment unit is measured using a voltage probe (Trek P6015A, Tektronix, Beaverton, OR, USA), while circuit current is measured using a current probe (Pearson6585, Pearson Electronics, Palo Alto, CA, USA). Data collected from both probes are displayed, recorded, and saved on an oscilloscope (Trek DPO4034, Tektronix, Beaverton, OR, USA).

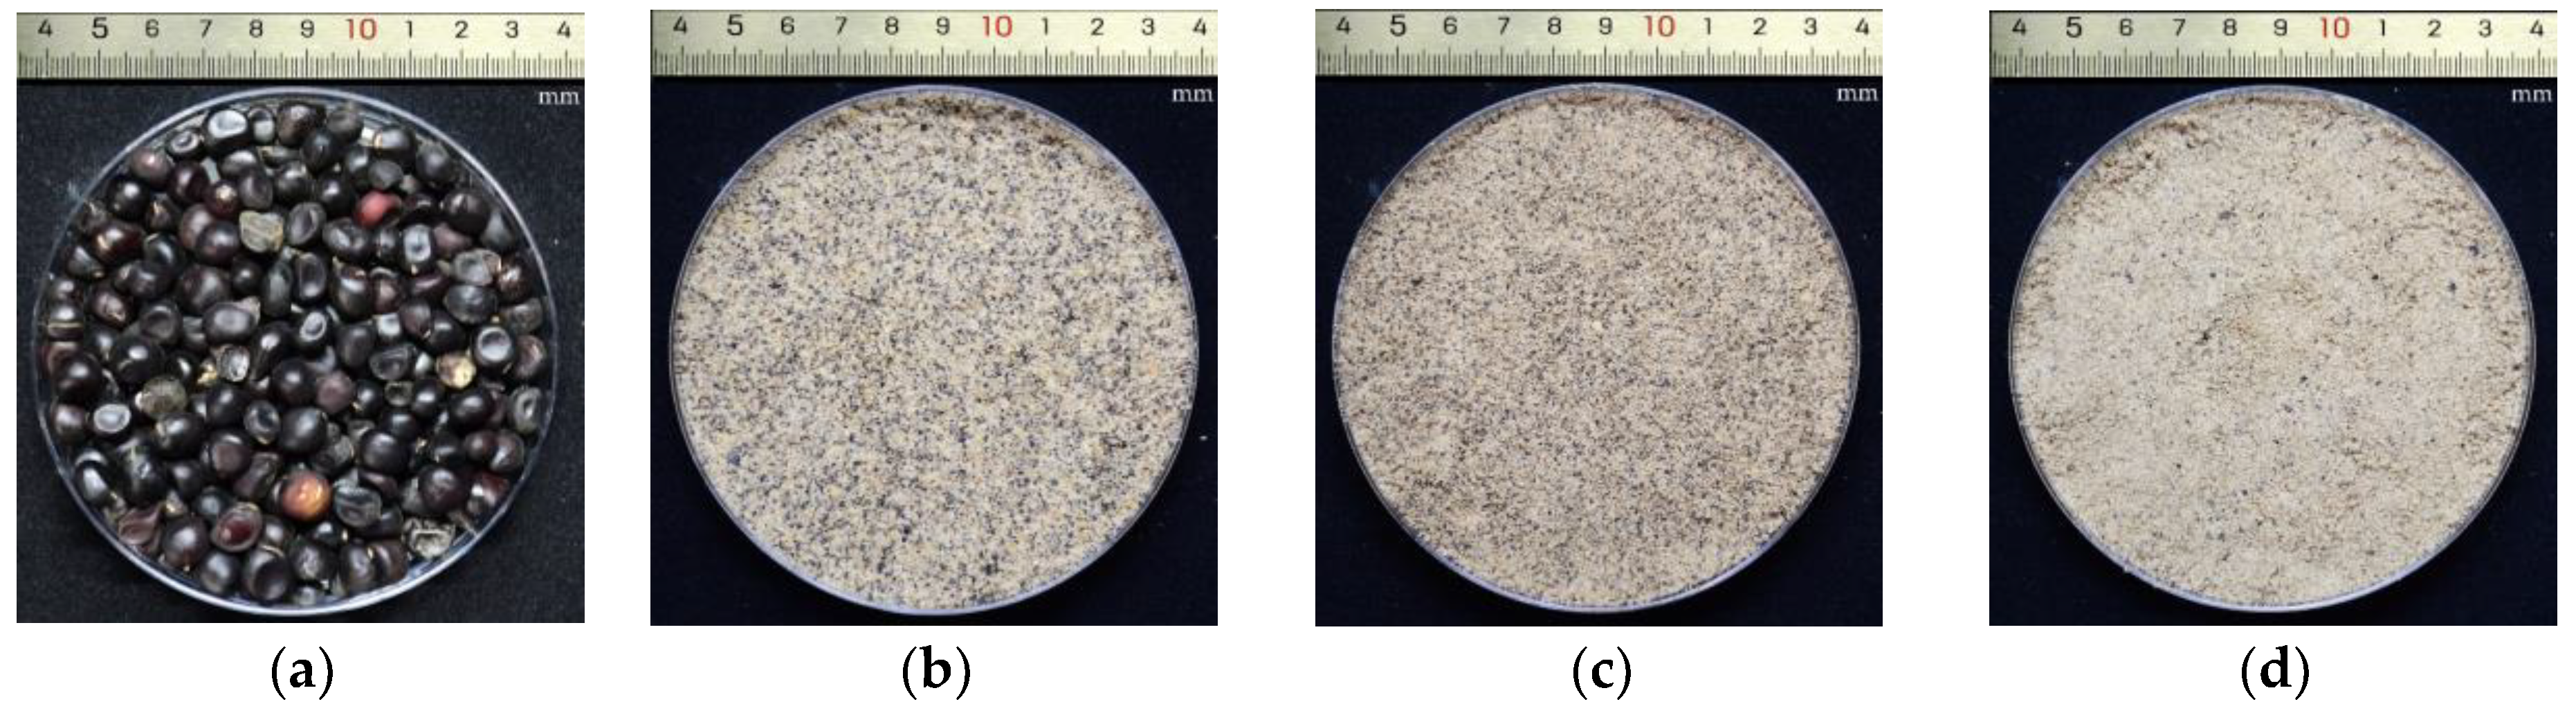
2.2. Peony Seed Sample Preparation

The seeds of peony ‘FengDan’ (Paeonia ostii) were carefully selected for this study from Xiaoliu Town, Peony District, Heze City, Shandong Province. After being air-dried in an electric oven (Shanghai Yiheng Scientific Instrument Co., Ltd., Shanghai, China) for 1–2 days, the seeds were crushed using a high-speed pulverizer (FW-400AD High-Speed Universal Grinder, Tianjin Xinbode Instrument Co., Ltd., Tianjin, China) and then sequentially sieved through 20-mesh, 40-mesh, and 60-mesh screens (Standard Test Sieves, Dahengqiao Chemical Laboratory Instruments Factory, Shangyu, Zhejiang, China). The appearance of both the peony seeds and the particles can be observed in Figure 2. The experiment involved three groups, each consisting of particles with a specific size range. A total of 81 samples were weighed, with each sample weighing 40 ± 0.1 g. Each set included three parallel replicates under different treatment conditions, while three control groups for each particle size group. The indoor temperature and humidity are 26 °C and 85%, respectively, and the room is equipped with air conditioning.

2.3. Peony Seed Oil Extraction

A total of 2.0 g of each of the 81 samples treated with various particle sizes and processing methods was accurately weighed and transferred into graduated tubes. A liquid-to-material ratio is 10:1 (mL/g) in the experiment. The precisely measured 20 mL of n-hexane was added into each tube, and the samples were treated for 60 min at a temperature set at 40 °C by utilizing ultrasound in a KQ-400DE CNC ultrasonic cleaner (manufactured by Kunshan Ultrasonic Instruments Co., Ltd., Kunshan, China) at a power level of 350 W and frequency of 40 kHz. The samples were cooled down and reweighed after performing two extractions. Any weight loss was compensated using n-hexane, then the mixture was vigorously shaken and filtered under conditions maintained at 40 °C. The n-hexane extract was concentrated under reduced pressure. Finally, the obtained peony seed oils were weighed and collected. The indoor temperature and humidity are 24 °C and 81%, respectively, and the room is equipped with air conditioning.
The oil extraction rate is calculated using the following formula.
η Extractability = w 1 oil w 2 Peony Seed

2.4. Tocopherol Detection in Peony Seed Oil

Tocopherol standards, including α, β, γ and δ tocopherol, were selected for this study. Specifically, α-tocopherol with a purity of 99.5%, β-tocopherol with a purity of 98.5%, γ-tocopherol with a purity of 98.0%, and δ-tocopherol with a purity of 98.5% were purchased from Chengdu Pusi Biotechnology Co., Ltd, Chengdu, China. Analytically pure methanol and n-hexane were purchased from Tianjin Damao Chemical Reagent Factory; chromatography-grade methanol was obtained from Sigma Aldrich (Shanghai) Trading Co., LTD., Shanghai, China; all other reagents utilized were of analytical grade. Referring to the measurement method outlined in reference [29] for determining tocopherol content in edible vegetable oils, and taking into account the practical measurement and analysis requirements of this study, a flowchart illustrating the measurement method for tocopherol in peony seed oil is presented as Figure 3, and the specific method description and the results of the validation are provided in Appendix A. This includes: (1) preparation of a standard mixed solution to generate different concentrations of tocopherol standard solutions, investigating their linear relationship, detection limit, quantification limit, and accuracy; (2) preparation of test samples to measure tocopherol content in peony seed oil, conducting stability tests, repeatability tests, and recovery rate tests; and (3) measuring the tocopherol content in test samples obtained from peony seed oil.

3. Results and Discussion

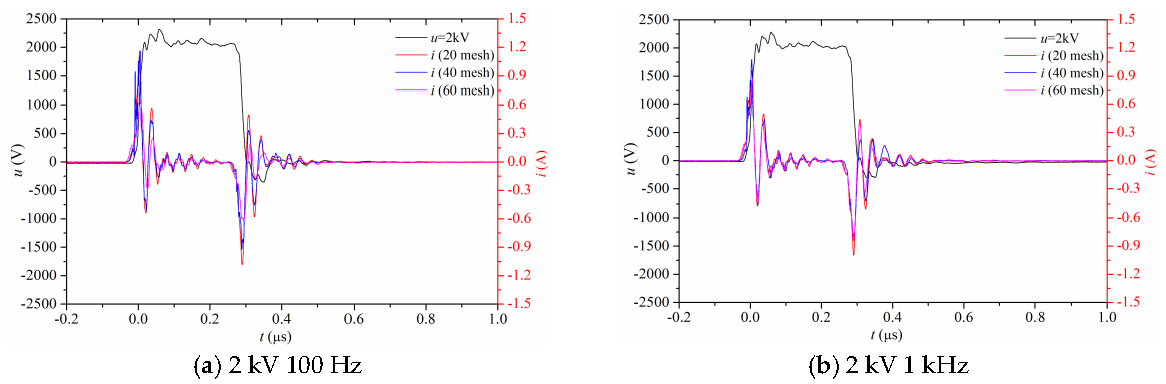
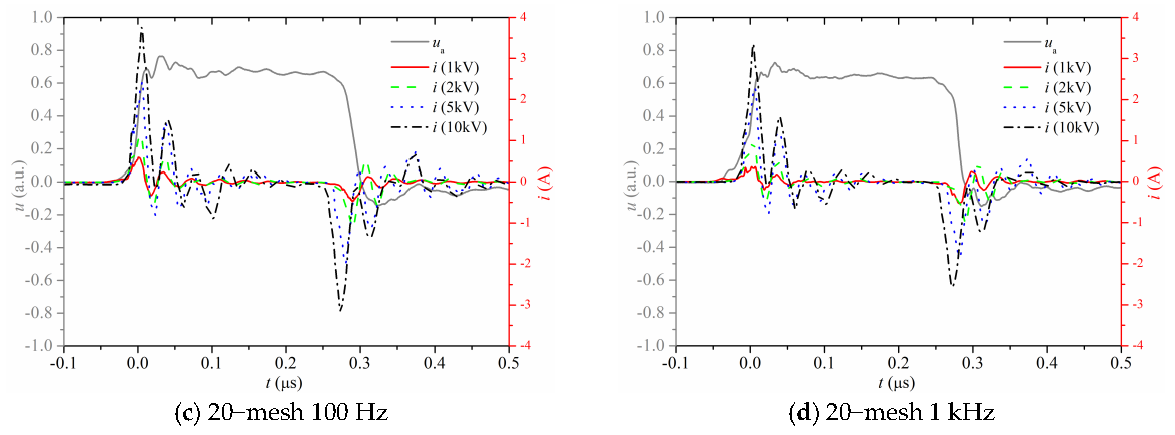
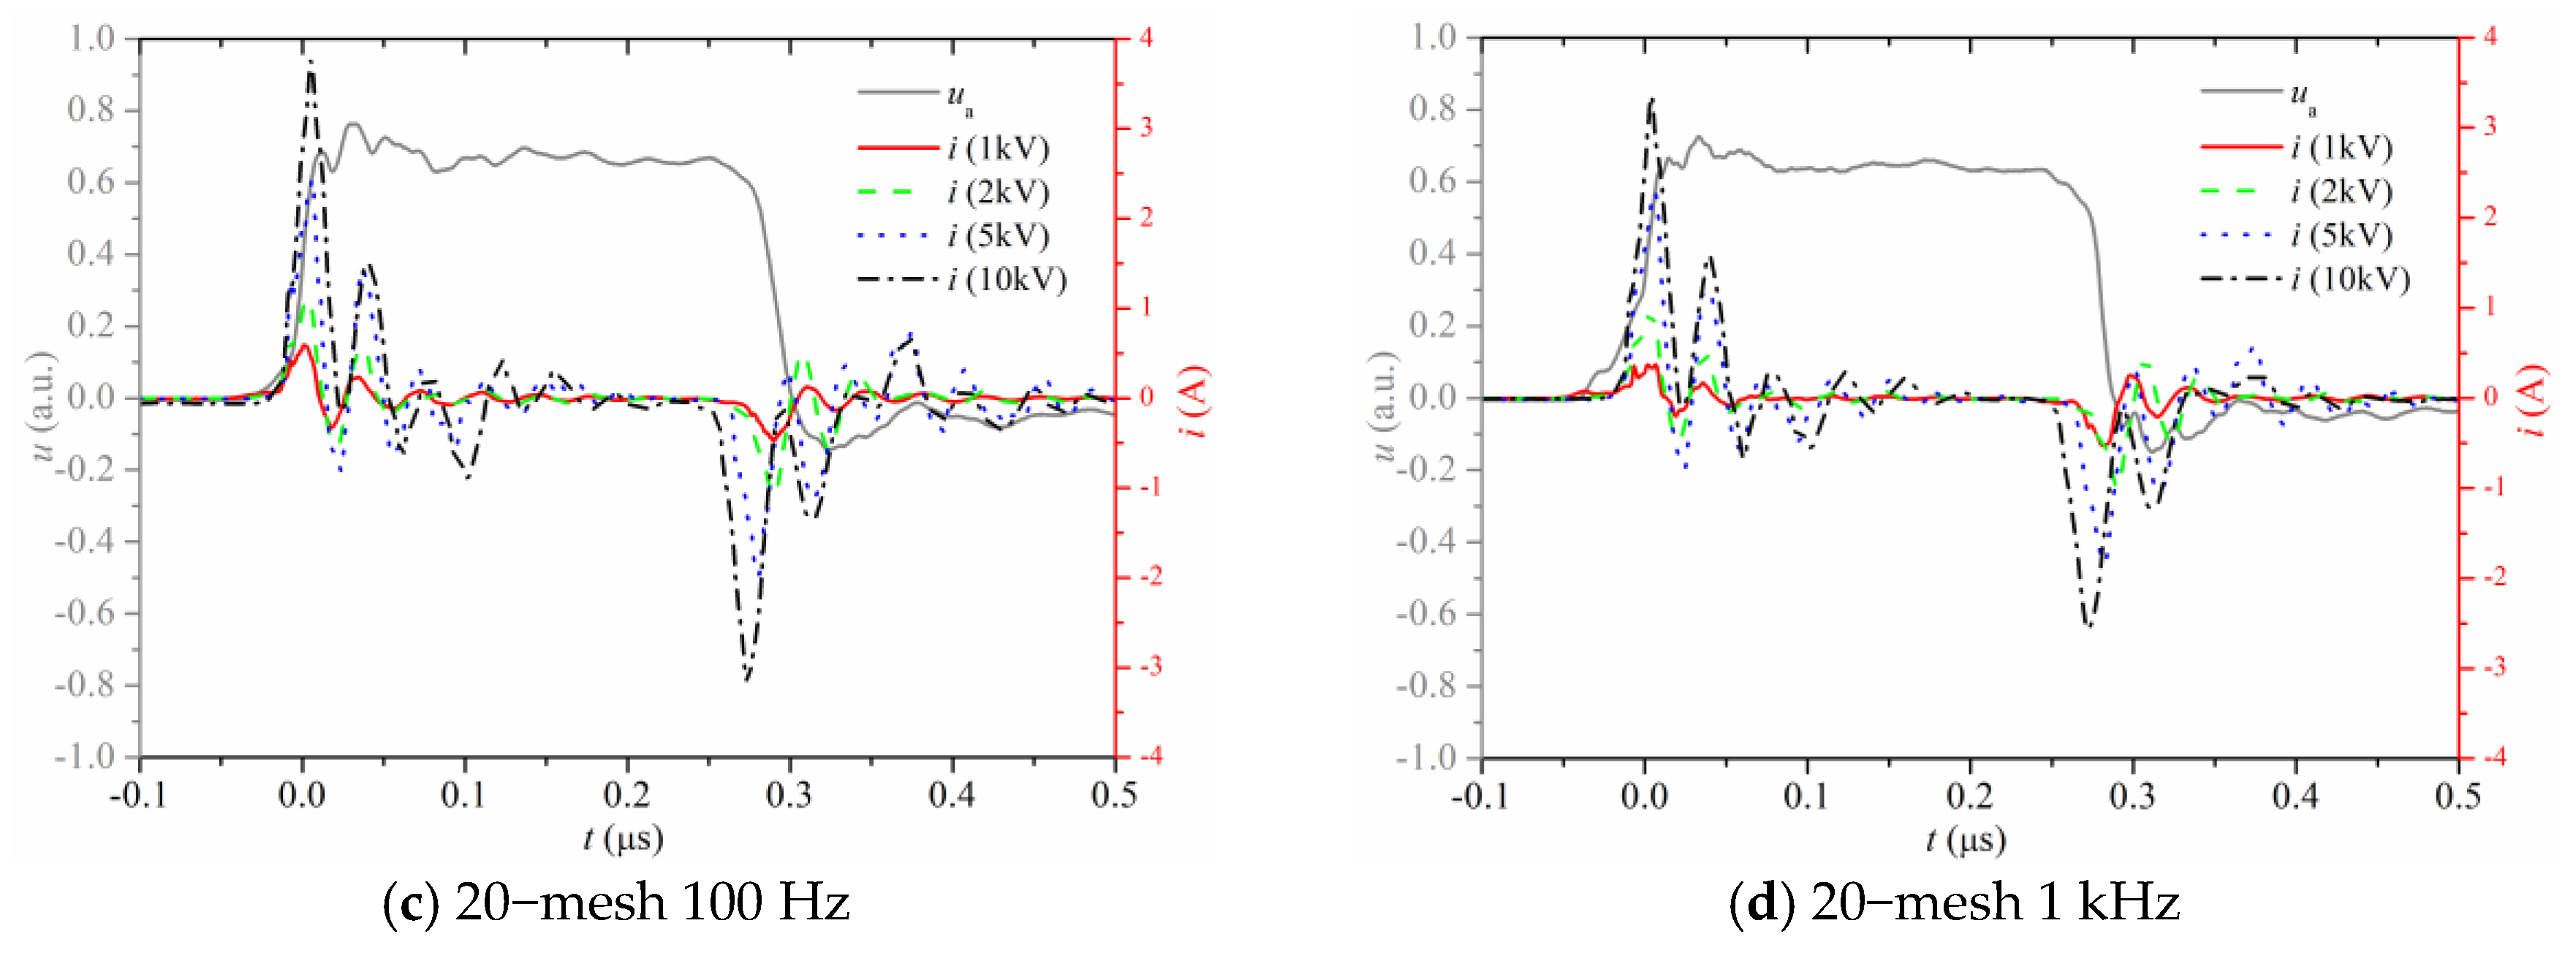
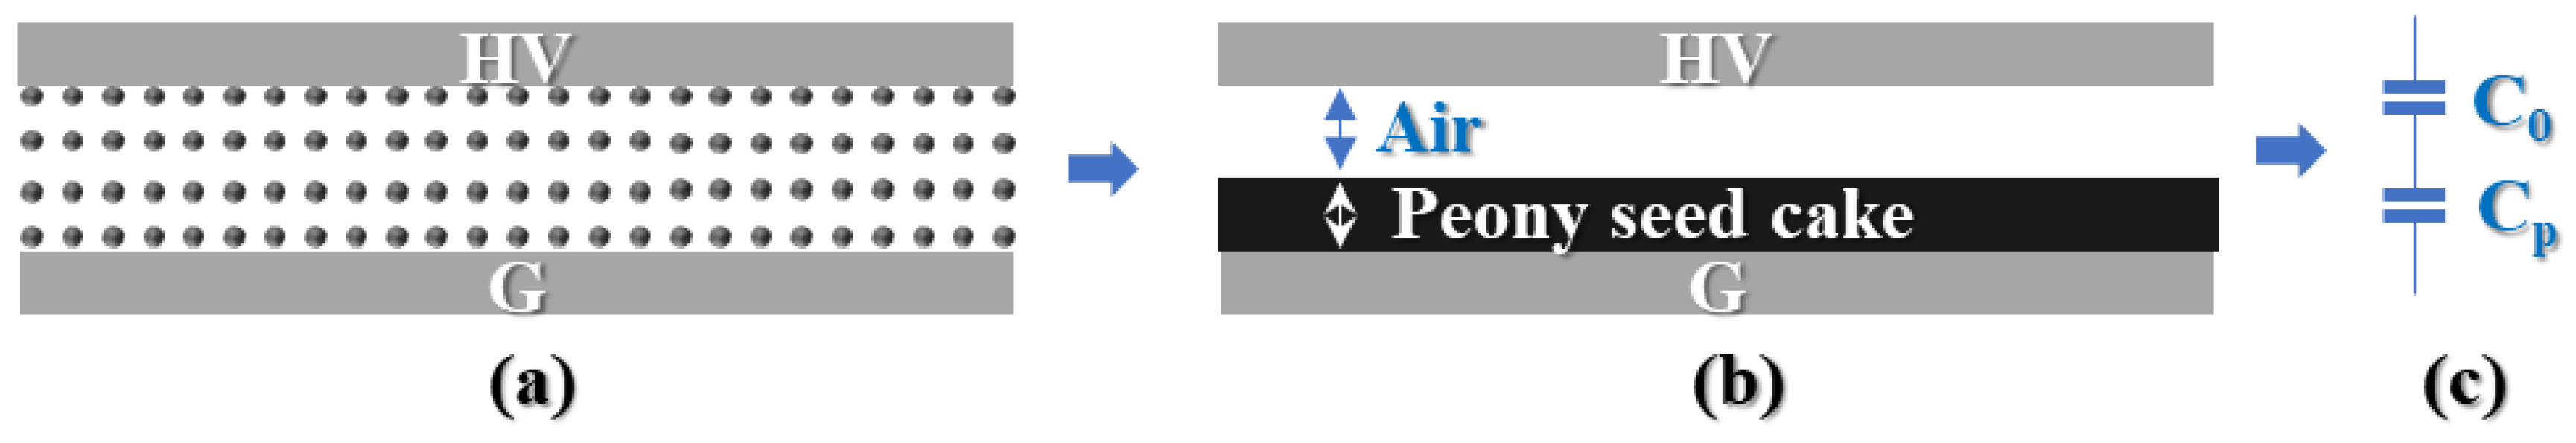
3.1. Electrical Properties
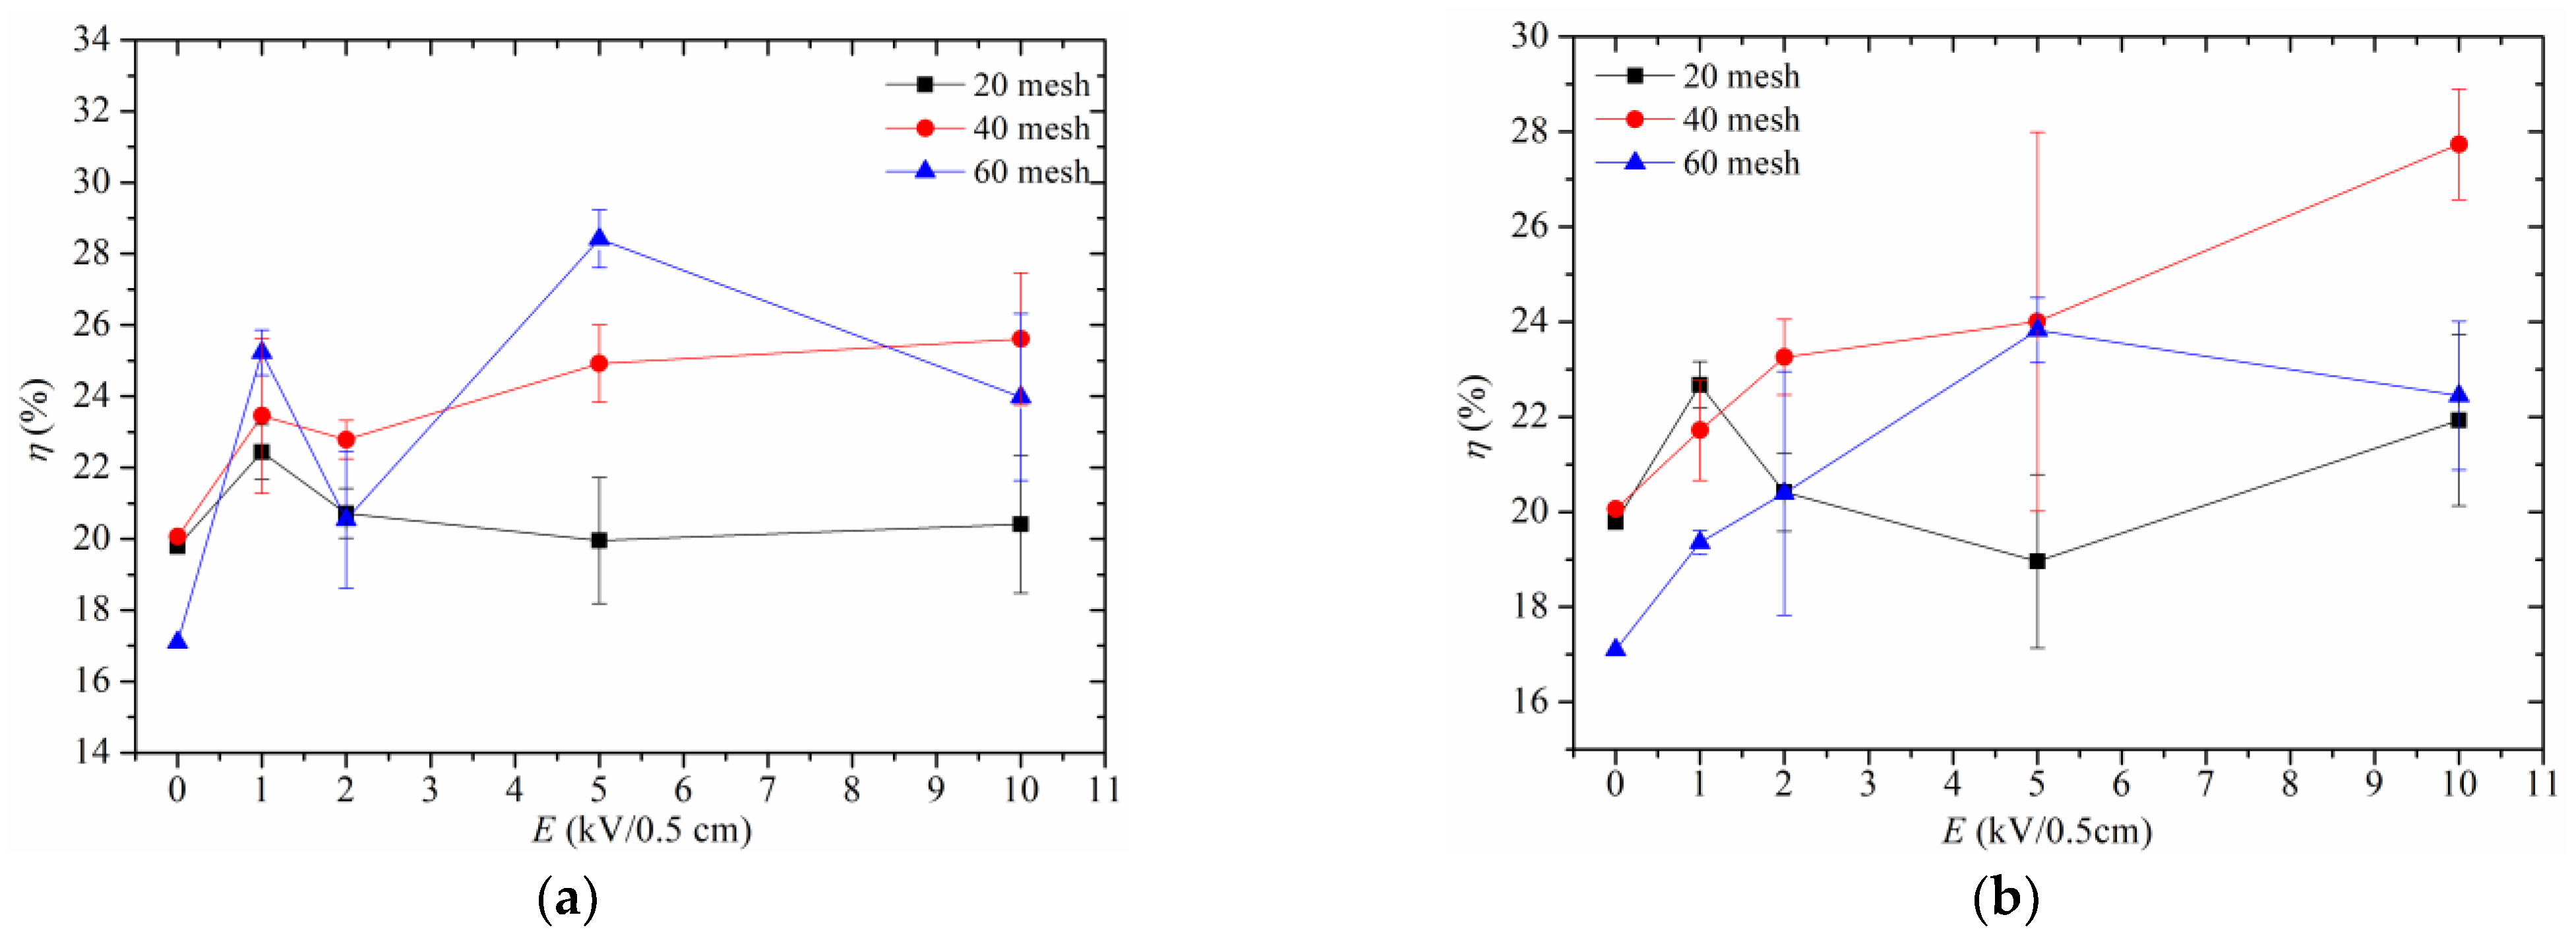
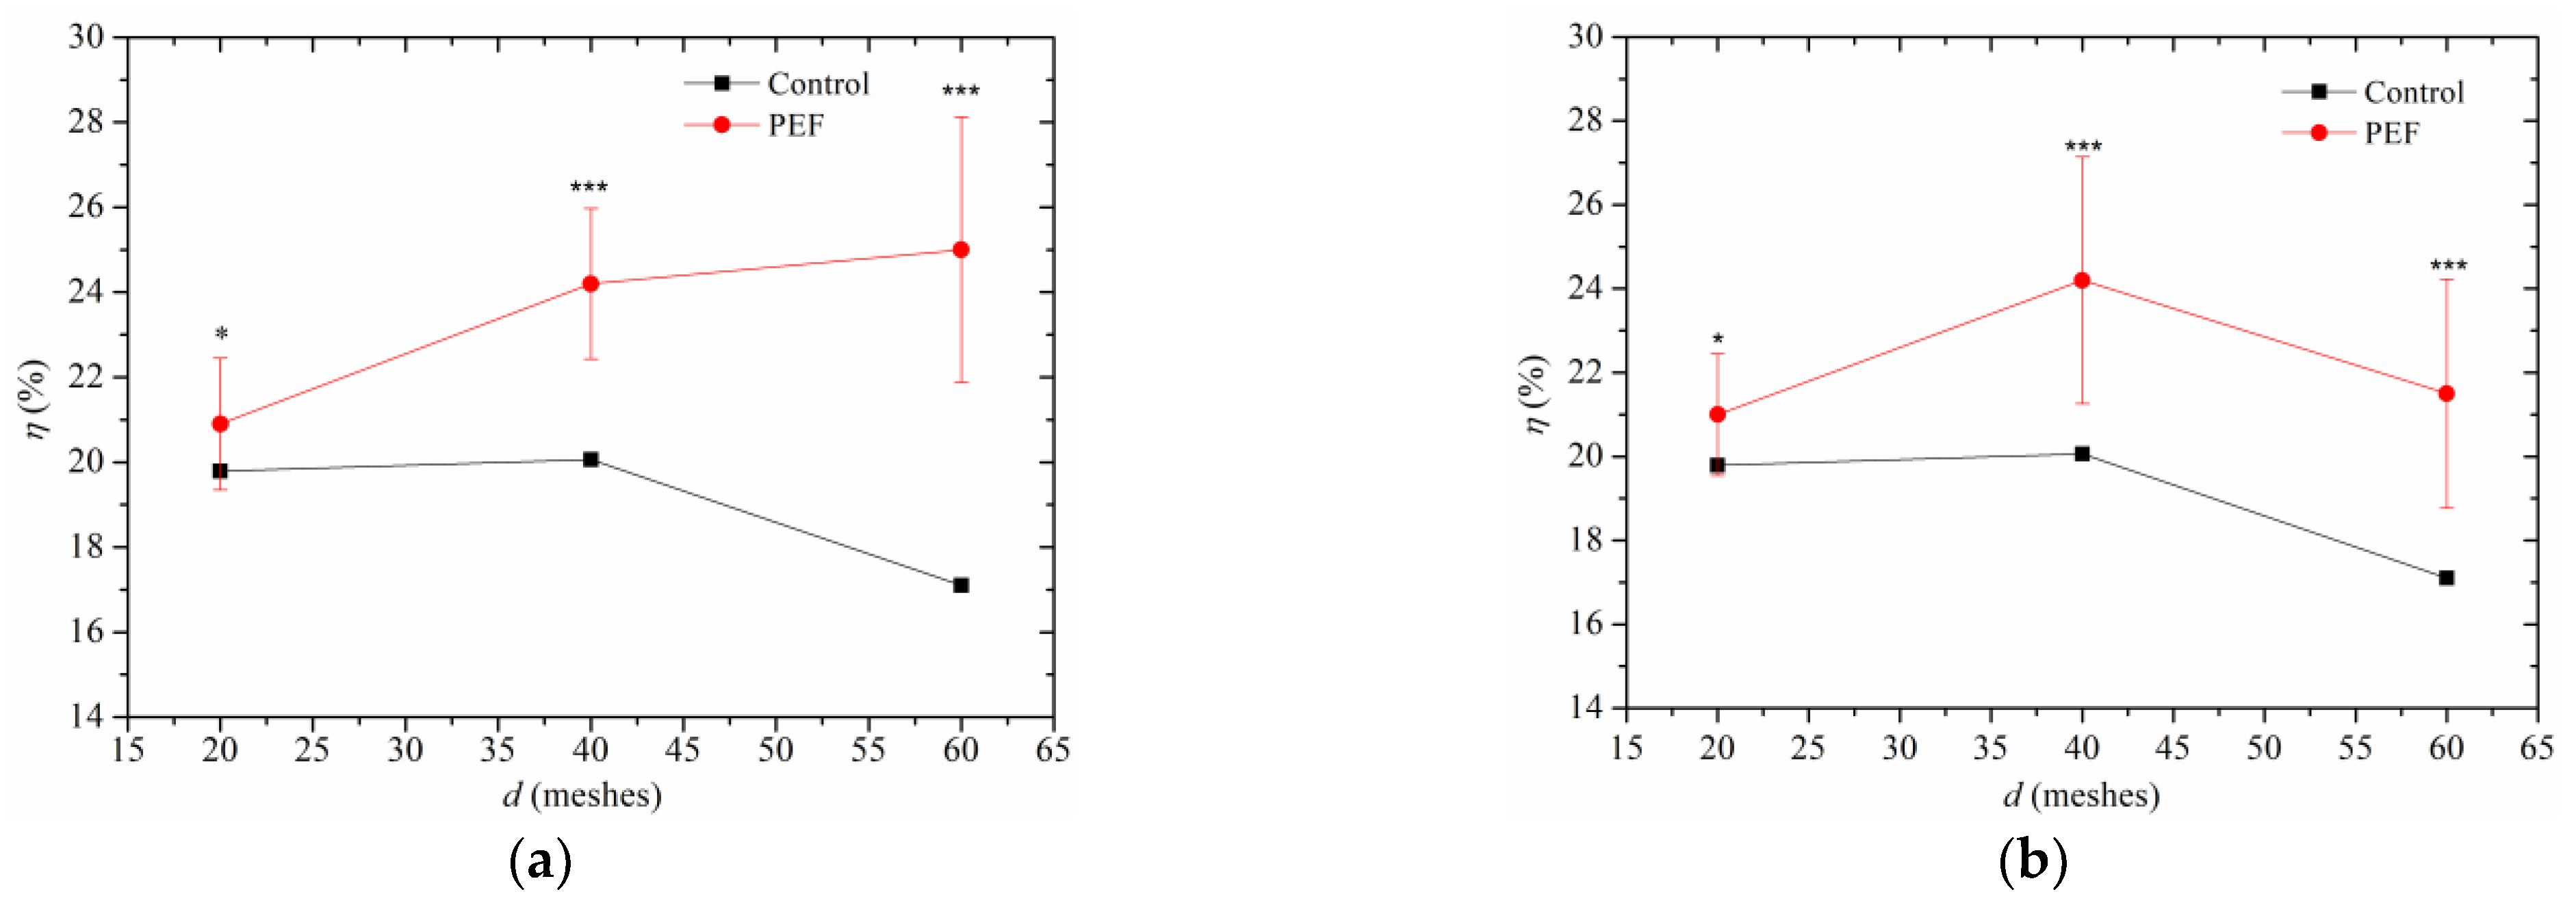
The high voltage, generated by a home-made pulse power supply, was applied to high voltage electrode of the PEF treatment unit for processing the particles of peony seeds. Taking the example of applied voltage of 2 kV, the voltage-current waveforms of Pulsed Electric Field (PEF) treatment processes with different particle sizes of peony seeds are depicted in Figure 4a,b. It can be observed that under the same voltage level, only the capacitive current is detected in the circuit. Within the scope of this experiment, the influence of peony seed particle size on the electrical properties is relatively small, and can be determined through equivalent circuit analysis. In fact, during the process of PEF treatment of peony seeds, the circuitry in the processing unit can be equivalently represented as a series or parallel connection of air capacitance and peony seed capacitance. Taking series connection as an example (the equivalent capacitance relationship is similar after parallel connection), as shown in Figure 5, assuming that the peony seeds of various particle sizes in the experiment are compacted into cakes with a capacitance Cp, and the remaining thickness forms an air column with a capacitance C0. According to series capacitors analysis, it can be concluded that Cp20 < Cp40 < Cp60 for equivalent capacitances, where Cp20 represents the capacitance of peony seed particle with size of 20-mesh. Due to the relatively large value of C0, there is only a small difference in equivalent capacitances among peony seeds with different particle sizes. Therefore, under the same voltage level, capacitive (displacement) currents are approximately equal. For peony seeds with the same particle size, their capacitance Cp remains approximately constant. Therefore, according to the expression for displacement current i = C d u d t , it can be inferred that as the voltage increases, the current also increases, as shown in Figure 4c,d. It is well known that dielectric constants vary at different frequencies, which affects capacitance and further influences displacement current. This results in different current behaviors at two frequencies mentioned in this study. However, since there is little variation in dielectric constants within the range of 100 Hz to 1000 Hz, the difference in current waveforms between Figure 4c,d is not significant. Therefore, subsequent discussions will only consider voltage amplitude and frequency without considering the impact of current on various indexes.

3.2. Oil Content

The peony seed particles, prepared in Section 2.2 with three different particle sizes, underwent PEF treatment for a duration of 2 min per group, following the processing principles outlined in Section 2.1. The treated and control samples were subsequently subjected to extraction for peony seed oil using the method and procedure outlined in Section 2.3, with the oil yield being determined by employing Formula (1). The variation curves depicting the oil yield at voltages of 100 Hz and 1 kHz under different electric field intensities are illustrated in Figure 6a,b. In order to reflect the applied voltage level and effective electric field strength, the unit of electric field strength in this paper is kV/0.5 cm. The data from Figure 6a demonstrates a negative correlation between the particle size of peony seeds and the oil yield, indicating that as the particle size increases, there is a gradual decrease in oil production. For larger particle sizes, such as a 20-mesh particle size, the oil yield initially increases and then decreases with increasing electric field intensity within lower PEF range. The highest oil yield is achieved at 1 kV, which is approximately 2 percentage points higher compared to the control group. Within the high electric field range (>5 kV/0.5 cm), the oil yield gradually increases again. For a particle size of 40-mesh diameter, the oil yield gradually increases with increasing electric field intensity, and reaches its peak at 10 kV/0.5 cm (approximately 25%). This represents a 5% improvement compared to the control group. As for peony seed particles with a particle size of 60-mesh diameter, which is the smallest among them all, the oil yield shows an overall upward trend with increasing electric field intensity, and reaches its maximum value at 5 kV/0.5 cm, close to 29%. This represents an increase of nearly 12% compared to the control group. When external voltage frequency is increased to 1 kHz, similar trends in oil yield variations are observed for all three particle sizes of peony seeds as seen at 100 Hz.
Further analysis was conducted to assess the statistical significance level of oil yield between the control group and the PEF treatment group, as shown in Figure 7. The statistical significance level was conducted by employing the t test in Excel software (Microsoft office 2021) with a single tail. The data for the PEF treatment group were obtained from the oil yield of peony seeds with the same particle size under different intensities of PEF at a constant voltage frequency. Significance level was marked using p-values, where smaller values indicate higher confidence levels and more significant results. From Figure 7, it can be seen that the PEF treatment definitely improves the oil extraction rate of peony seeds. For peony seed particles with larger particle sizes, the oil extraction rate after PEF treatment shows significant improvement compared to the control group. However, for peony seed particles with particle sizes of 40-mesh and 60-mesh, the oil extraction rate after PEF treatment was extremely significant compared to the control group. Meanwhile, comparing the oil extraction rates of peony seed particles with grain sizes of 60-mesh at frequencies of 100 Hz and 1 kHz, it can be observed that, as the voltage frequency increases, the oil extraction rate for smaller particle sizes actually decreases. According to the indirect measurement in experiment [28], in which the author employed the Z value (for intact cell matrices (without any treatment) and for matrices with completely permeable cell walls, the Z value was considered equal to 0 and 1) to evaluate the cell permeability, the results shown that the Z value can be up to 0.85 after treatment by PEF. Therefore, for peony seeds, it can be reasonable believed that PEF can lead to a temporary increase in cell membrane permeability, facilitating more efficient exchange of substances between the interior and exterior of cells, thereby aiding plants in producing more oil.

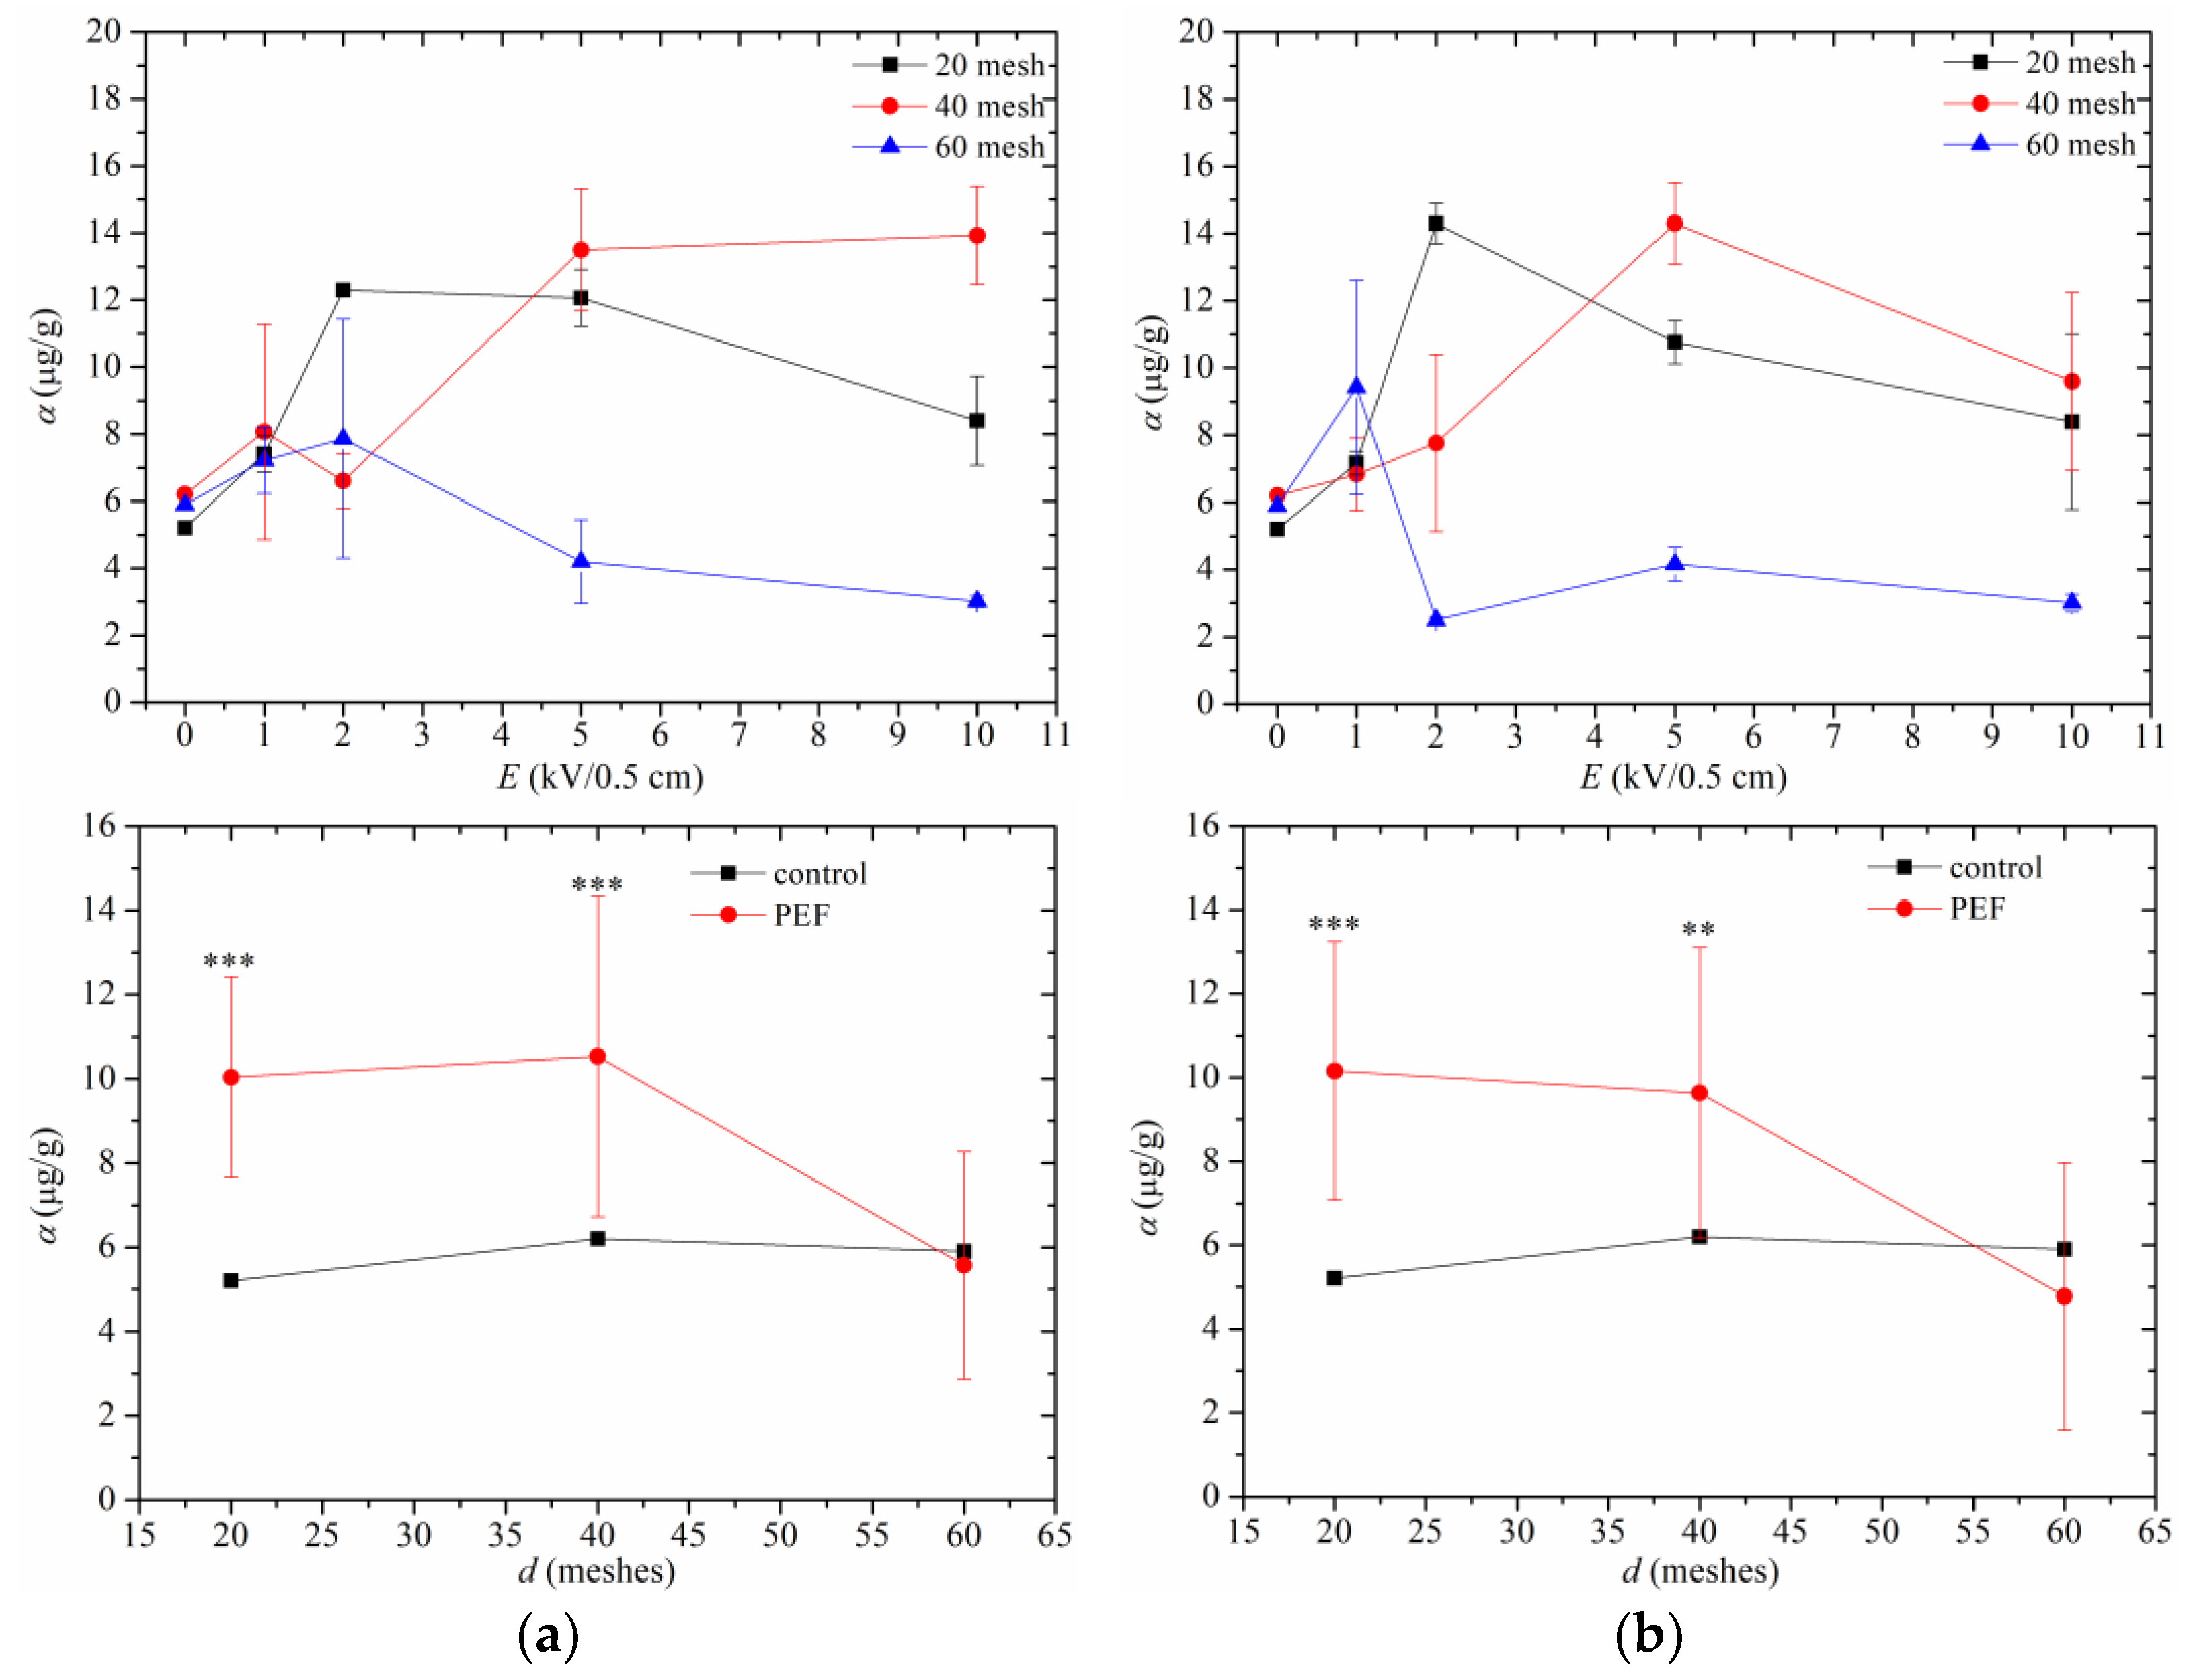
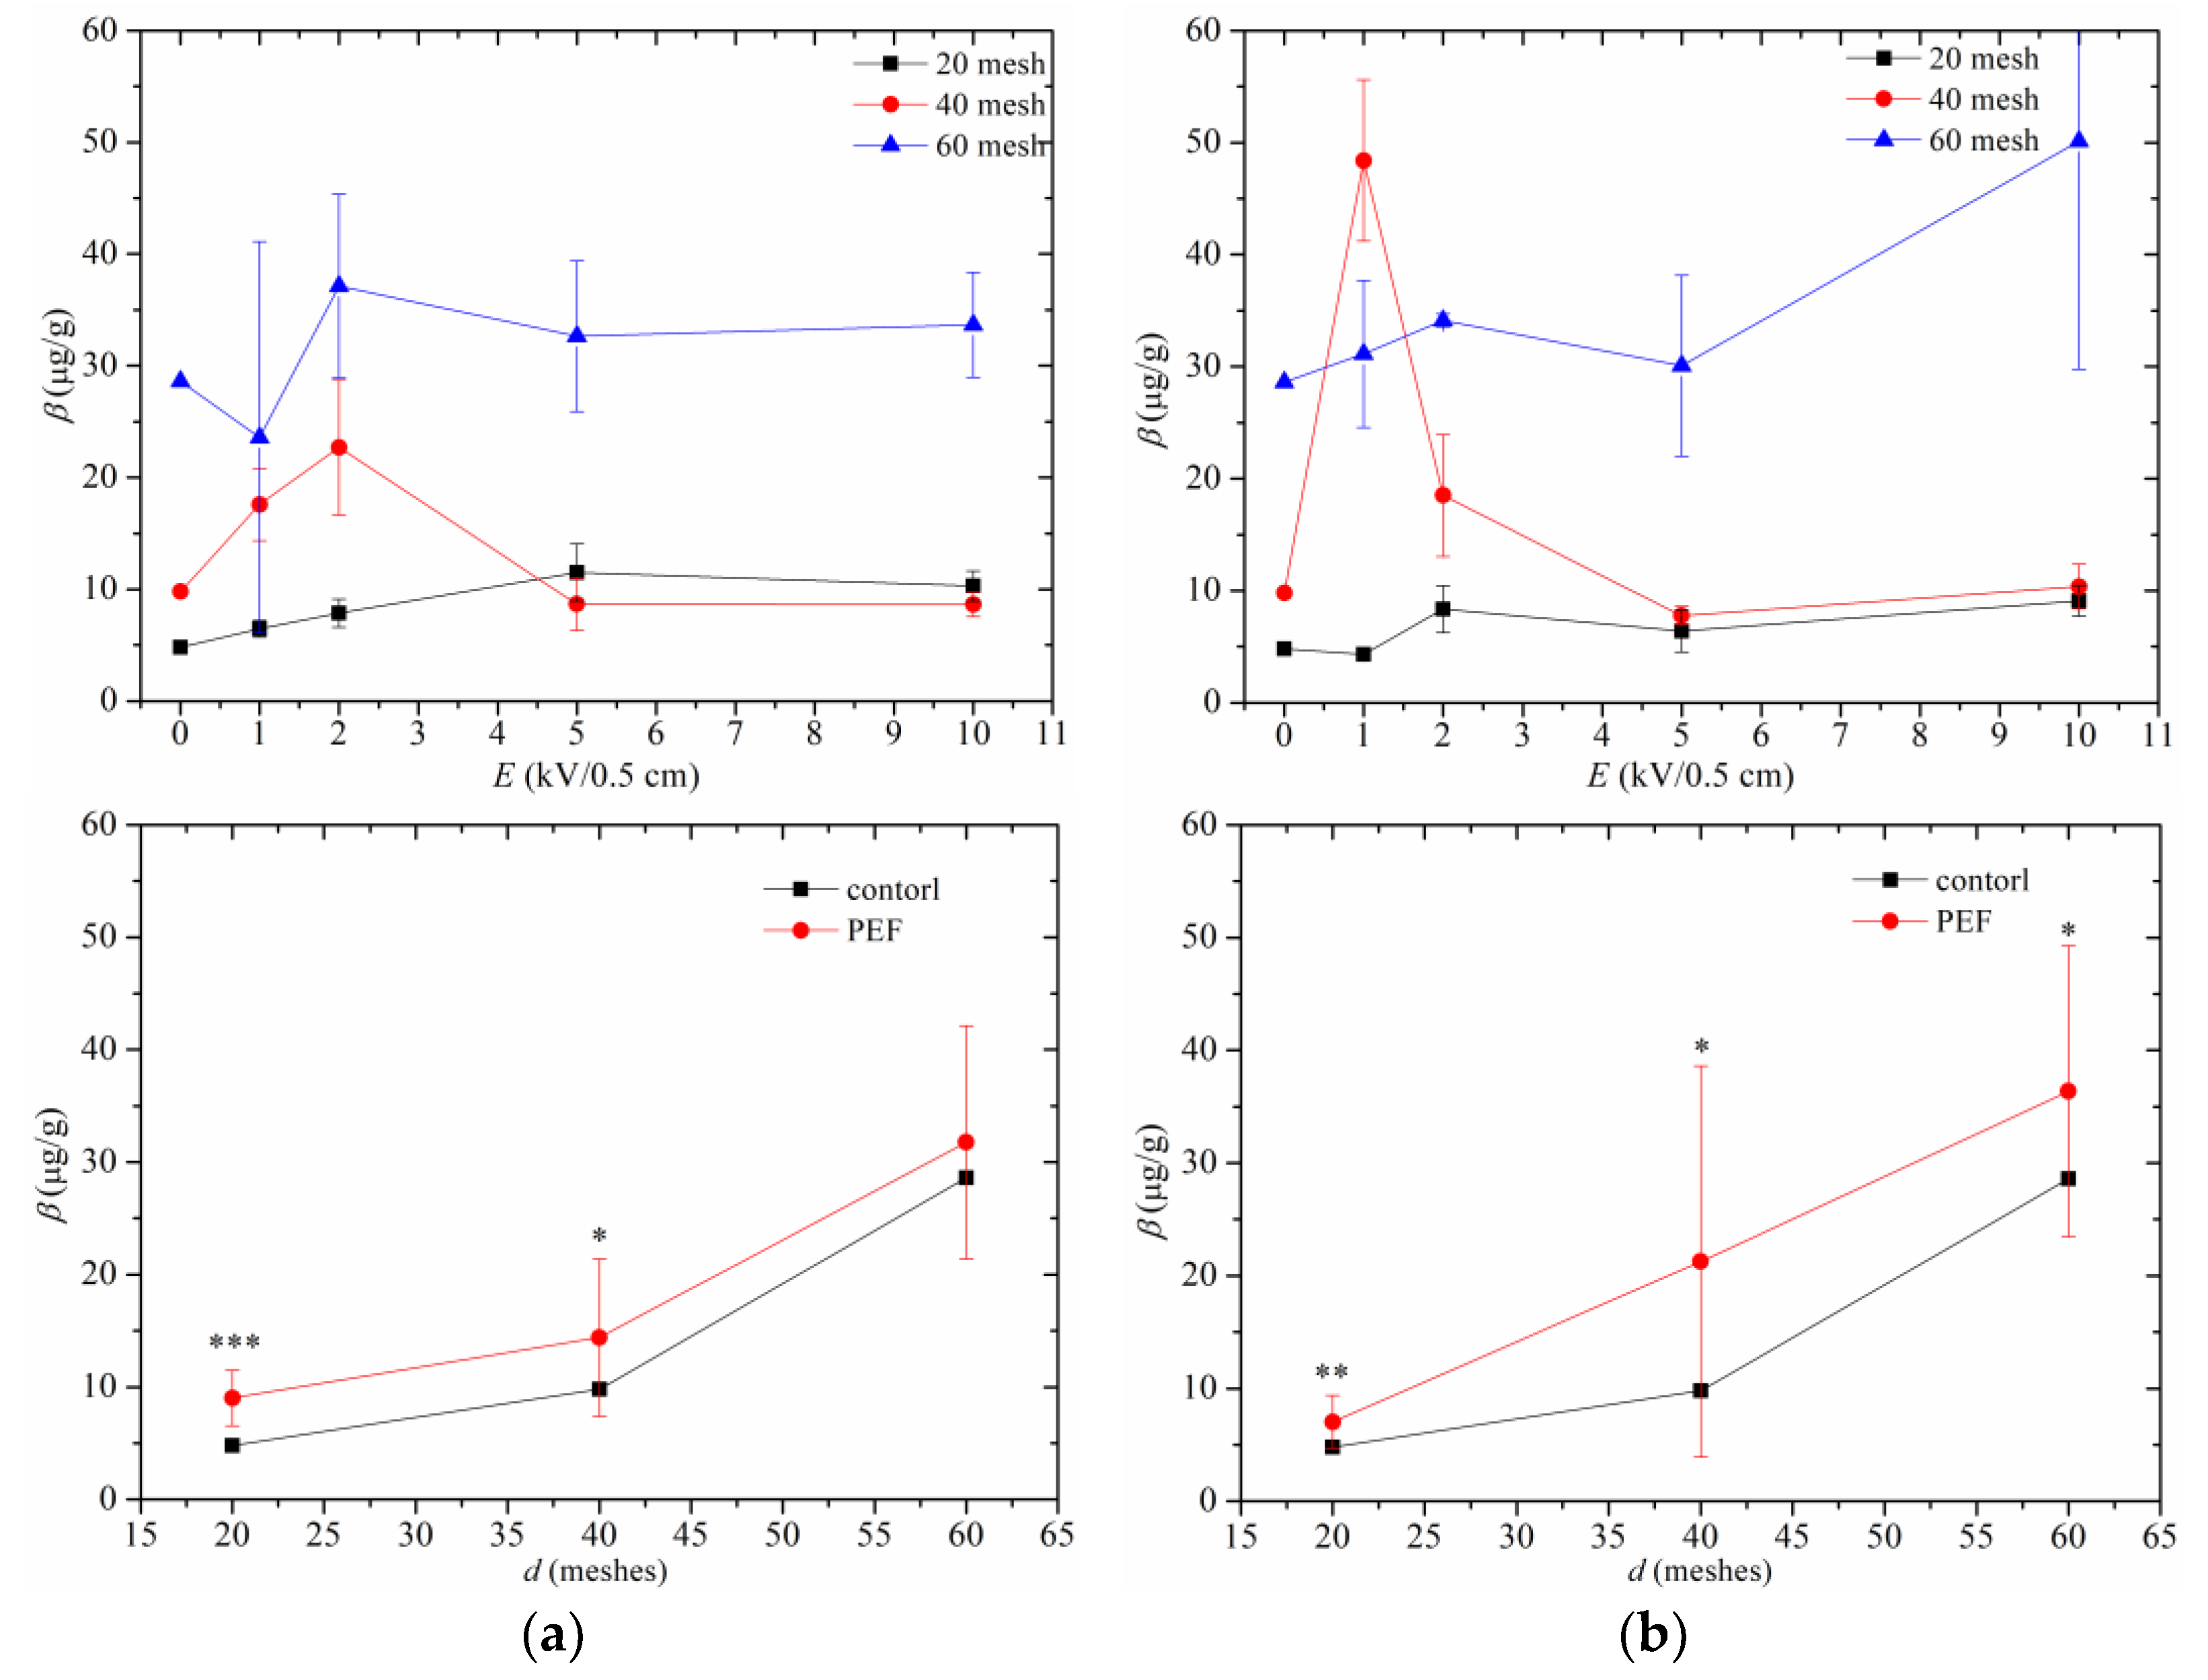
3.3. Tocopherol in Peony Oil

Tocopherol, also known as vitamin E, is a fat-soluble vitamin with numerous beneficial functions that have been extensively studied. Natural tocopherols consist of four types of right-handed optical isomers [30], which are named alpha (α), beta (β), gamma (γ), and delta (δ)-tocopherol, based on the different positions and numbers of methyl groups on their phenyl rings. Each isomer of tocopherol exhibits varying levels of biological activity, with α-tocopherol demonstrating the highest degree of bioactivity. Plant food oils are one of the main sources for obtaining tocopherols in daily life, and there is significant variation in tocopherol content among different varieties of plant oils. Peony seed oil is rich in unsaturated fatty acids, polyunsaturated fatty acids, various vitamins, etc. Therefore, the composition and content of tocopherol can be used as an important index to evaluate the quality of food plant oil.
The methods and procedures described in Section 2.4 were employed here to calculate the α-tocopherol content in the tested oil samples, and their significant differences were analyzed. Where, the statistical significance level was conducted by employing the t test in Excel software (Microsoft office 2021) with a single tail. The results are presented in Figure 8. To explore the effects of PEF on other tocopherols, we also investigated the changes in β-tocopherol (represented by β-tocopherol as γ-tocopherol peaks appear at the same time in liquid chromatography) and δ-tocopherol content, as well as their significant differences. The results are shown in Figure 9 and Figure 10. It can be observed that, apart from the peony seed particles with a particle size of 60-mesh, the three types of tocopherols extracted from the seeds have similar levels. Among them, the peony seed particles with a particle size of 60-mesh have the highest content of β-tocopherol in the extracted oil, which is approximately five times higher than that of α-tocopherol and three times higher than that of δ-tocopherol. As mentioned above, β-tocopherol and γ-tocopherol belong to the same peak in the liquid chromatography. At the same time, γ-tocopherol content in peony seed oil is much higher than that of other wood oils such as olive oil, so the content of β-tocopherol measured in this paper is higher.
After pulsed electric field treatment, the overall α-tocopherol content in peony seed particles with particle sizes of 20-mesh and 40-mesh exhibited an increasing trend, as observed from Figure 8. However, for samples with particle sizes of 20-mesh and 60-mesh at low frequencies of applied voltage, a low electric field enhanced the yield of α-tocopherol while a high electric field inhibited it. Conversely, under high frequencies of applied voltage, all three particle size samples displayed similar trends. Combining with significant difference analysis, the impact of PEF on the content of α-tocopherol in peony seed particles extracted oil with particle sizes of 20-mesh and 40-mesh is highly significant compared to the control group, while no significance was observed for samples with a particle size of 60-mesh.
According to Figure 9, it can be seen that, regardless of the frequency of the applied voltage, β-tocopherol increases significantly with larger particle size, while the significance of differences weakens as particle size decreases. From Figure 10, PEF treatment did not show a significant effect on δ-tocopherol content, indicating that it has an impact on β-tocopherol in peony seed oil (with a more pronounced effect for larger particles), but has little influence on δ-tocopherol content.
Currently, there is a lack of accurate conclusions regarding the sources and influencing factors of plant oil tocopherols. Existing research suggests that gentle processing methods are beneficial for increasing the content of tocopherols in plant oils. According to the impact of PEF treatment on α-tocopherol content in peony seed oil, it can be analyzed that there is no significant alteration in sample’s temperature during the process of PEF treatment, and it remains close to ambient temperature. This processing method is considered the gentlest one, which facilitates an increase in α-tocopherol content. Moreover, research has indicated that certain plants produce more antioxidant substances when exposed to external stress. In this experiment, a pulsed electric field may induce such stress and stimulate peony seeds to generate additional substances with antioxidant properties. Among these substances, α-tocopherol demonstrates the highest activity and exhibits a more sensitive response to pulsed electric field treatment. No significant differences were observed among various types of phytoestrogens in peony seed oil with small particle sizes. Up to now, a reasonable explanation has yet to be provided, and further research is needed for in-depth analysis.

4. Conclusions

In this paper, nanosecond PEF was employed to treat the peony seeds with varying particle sizes, investigating the impact of particle size and PEF parameters on oil yield, and analyzing the changes in tocopherol content in peony seed oil. Several conclusions were obtained as follows: (1) oil yield is correlated with the particle size of peony seeds, as smaller particles result in a higher oil yield; (2) electric field strength and voltage parameters significantly influence oil yield; higher voltage frequencies do not promote an increase in oil yield, while an elevation in electric field strength leads to a peak value of oil yield; and (3) compared to the control group, tocopherol content exhibits extremely significant levels at larger particle sizes, but no significant differences at a particle size of 60-mesh.
Overall, treating peony seed particles with PEF proves advantageous for enhancing oil yield by increasing the permeability of the cells, and further improves tocopherol content in oil. However, specific alterations depend on both the characteristics of peony seeds and PEF parameters. Therefore, when practically applying this technique, it is essential to select specific parameter ranges. In industrial applications, PEF is a solvent-free processing method that operates at non-thermal conditions. The equipment structure is simple, and the initial investment cost is low (not exceeding 1000 CYN/kg processing capacity). Based on an analysis of oil yield and nutrient content, it can be concluded that PEF demonstrates favorable cost-effectiveness in practical applications.

Author Contributions

Conceptualization, W.X. and Z.C.; methodology, Y.T., J.L. (Jianfei Liu) and Z.C.; investigation, W.X., Y.T. and Z.C.; resources, W.X. and Z.C.; data curation, W.X. and J.L. (Jianfei Liu); writing—original draft preparation, W.X., Y.T. and J.L. (Junchi Liu); writing—review and editing, Z.C.; supervision, Z.C. All authors have read and agreed to the published version of the manuscript.

Funding

This research received no external funding.

Institutional Review Board Statement

Not applicable.

Informed Consent Statement

Not applicable.

Data Availability Statement

The data presented in this study are available on request from the corresponding author.

Acknowledgments

The authors are grateful to Engineer Xuezhou Dong of Lanzhou Institute of Chemical Physics, Chinese Academy of Sciences for his help and helpful discussion on HLPC data testing.

Conflicts of Interest

The authors declare no conflicts of interest.

Appendix A. Tocopherol Detection in Peony Seed Oil

(1)
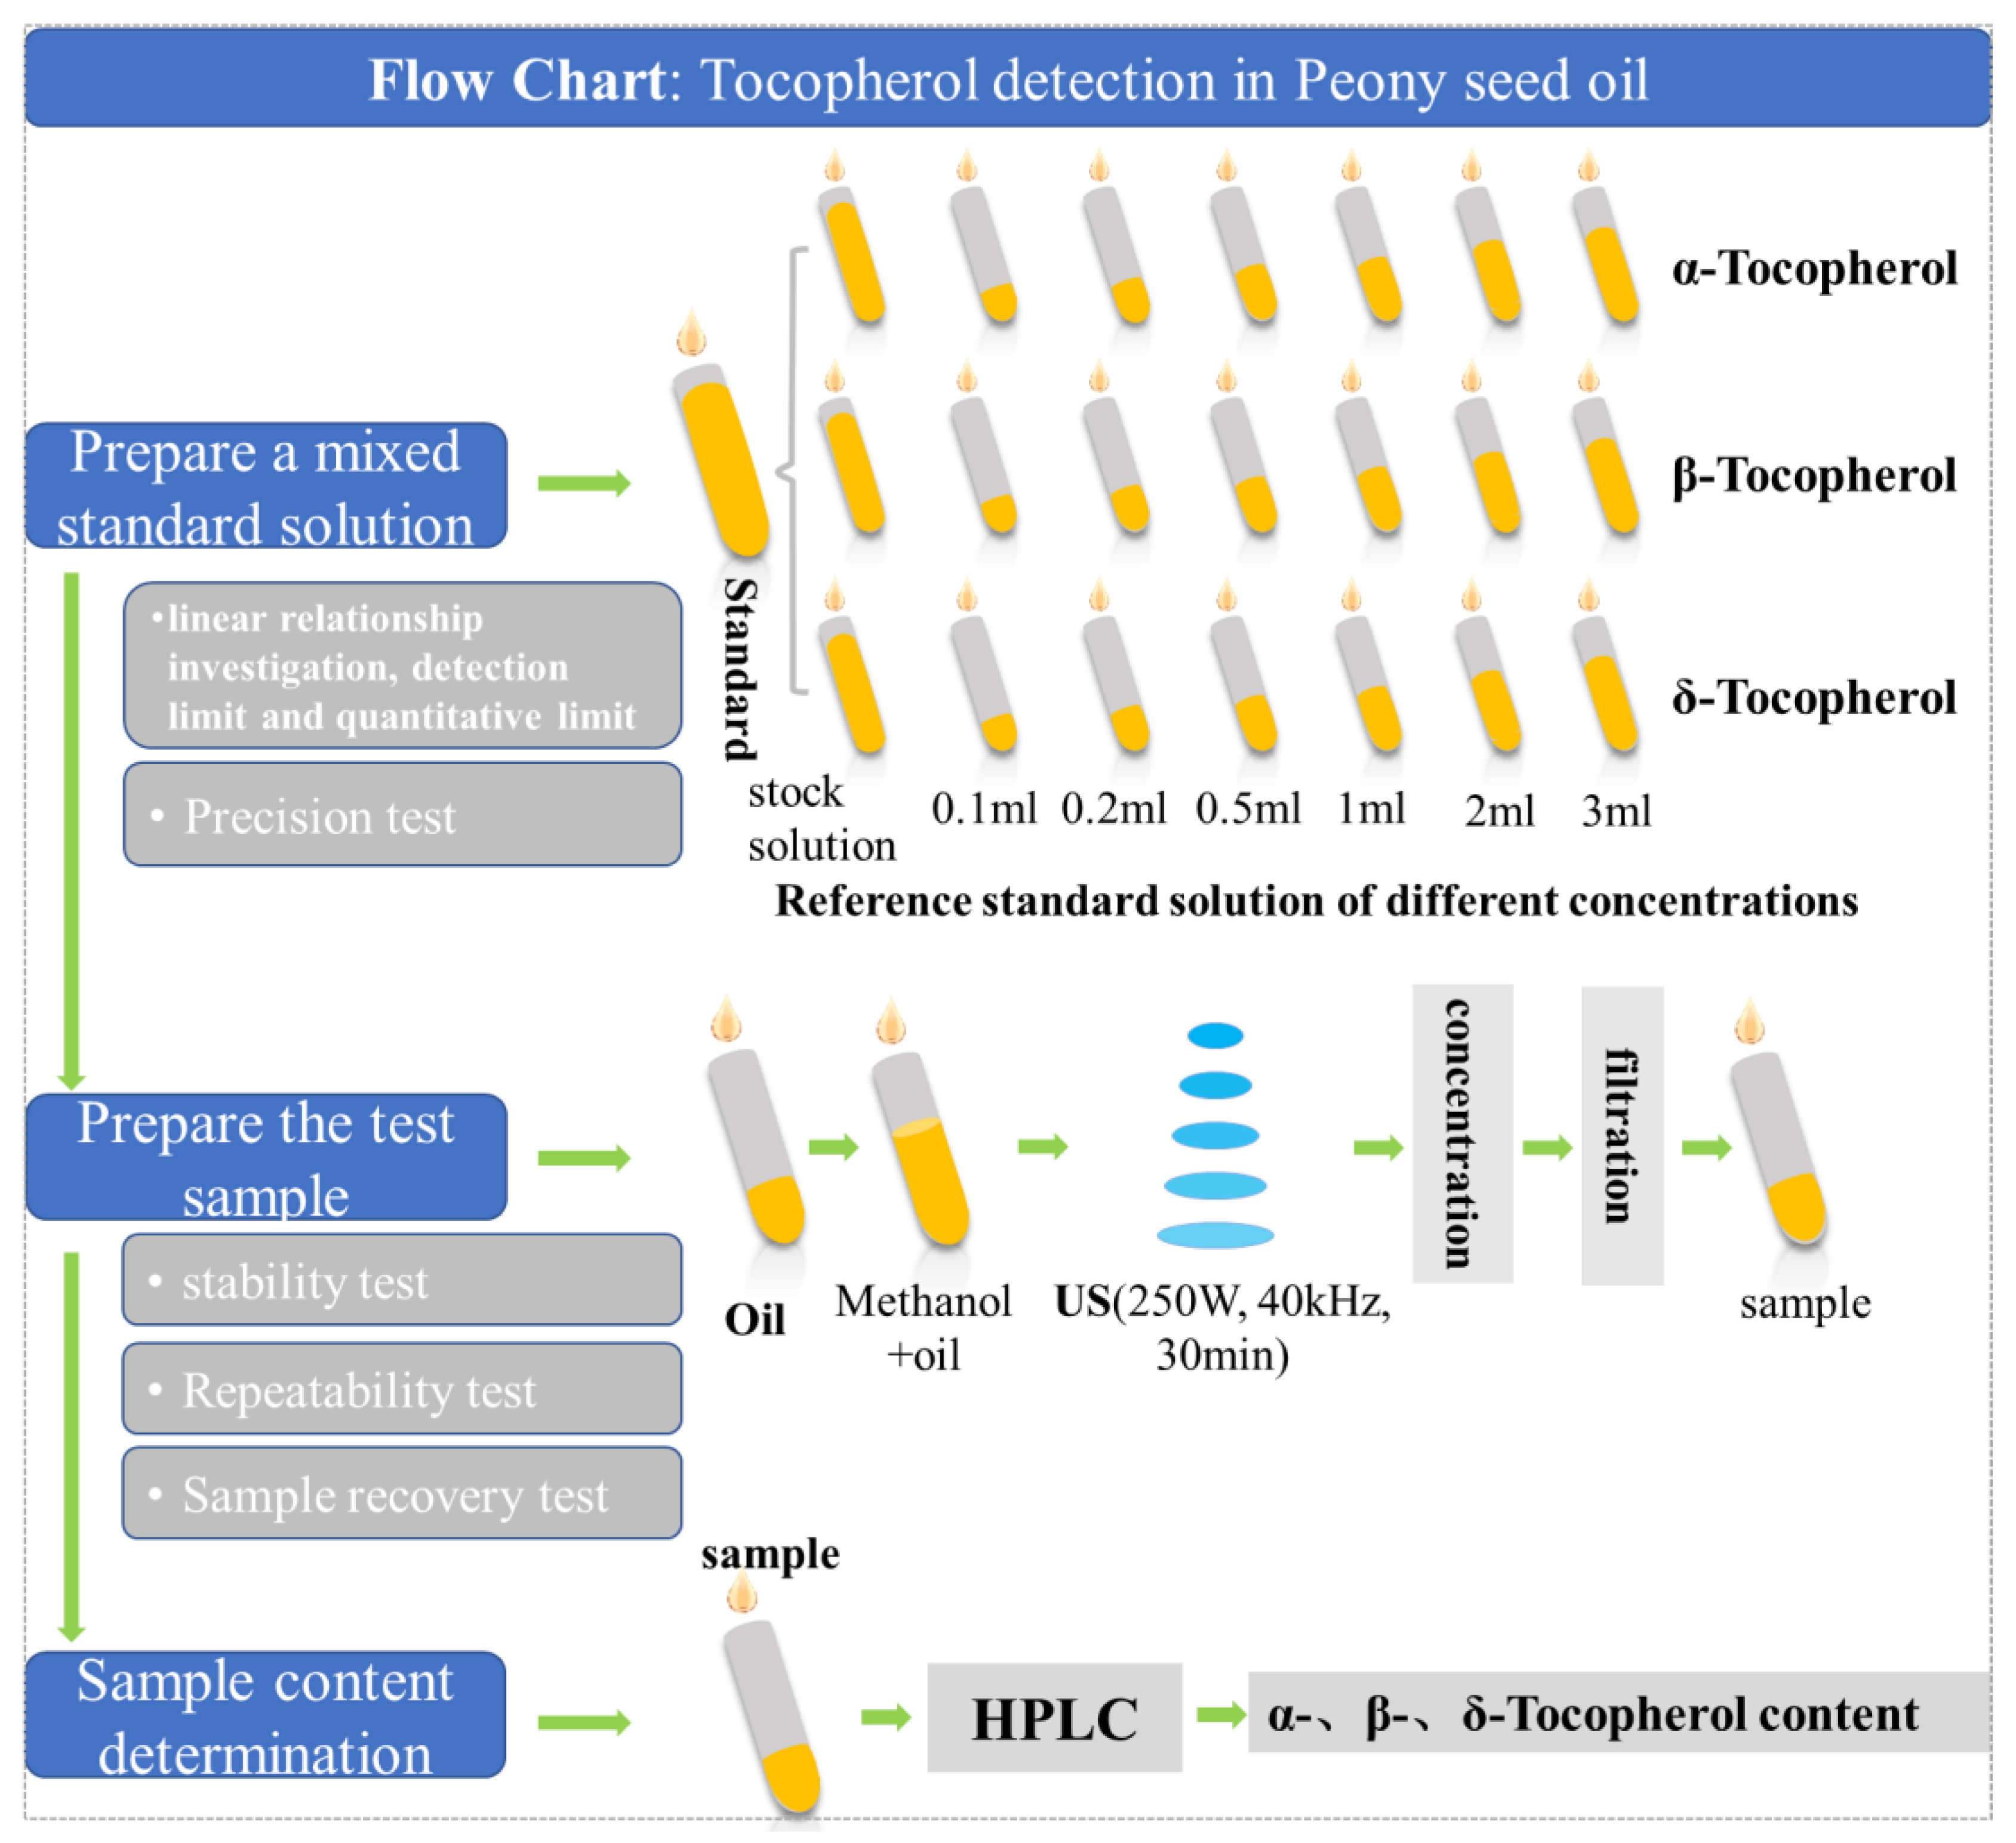
Preparation of mixed standard solution. The α-tocopherol control product, β/γ-tocopherol control product and δ-tocopherol control product were accurately weighed and placed in 25 mL brown volumetric bottle, respectively, dissolved with methanol, and fixed to the scale line. The concentration of α-tocopherol control solution was 0.425 mg·mL−1, the concentration of β/γ-tocopherol control solution was 0.1 mg·mL−1, and the concentration of δ-tocopherol control solution was 0.1 mg·mL−1. We precisely absorbed 0.1 mL, 0.2 mL, 0.5 mL, 1.0 mL, 2 mL and 3 mL of each reference solution into a 25 mL volumetric bottle, filled it with methanol to the scale line, and shook well as a mixed reference solution with different concentrations.
(2)
Preparation of test samples. The appropriate amount of peony seed oil extracted from different samples was taken, and 0.1 g was taken from each sample. As for the graduated centrifuge tube, methanol was used as the extraction agent, the ratio of solid to liquid was 1:1.2 (g/mL), ultrasonic extraction (power 250 W, frequency 40 kHz) was carried out for 30 min, and the methanol extract was extracted twice. After concentration by nitrogen blowing instrument, the volume of peony seed oil was fixed with methanol to 0.15 mL. The sample was filtrated, then the further filtrated liquid was taken, and then obtain the sample liquid to be measured.
(3)
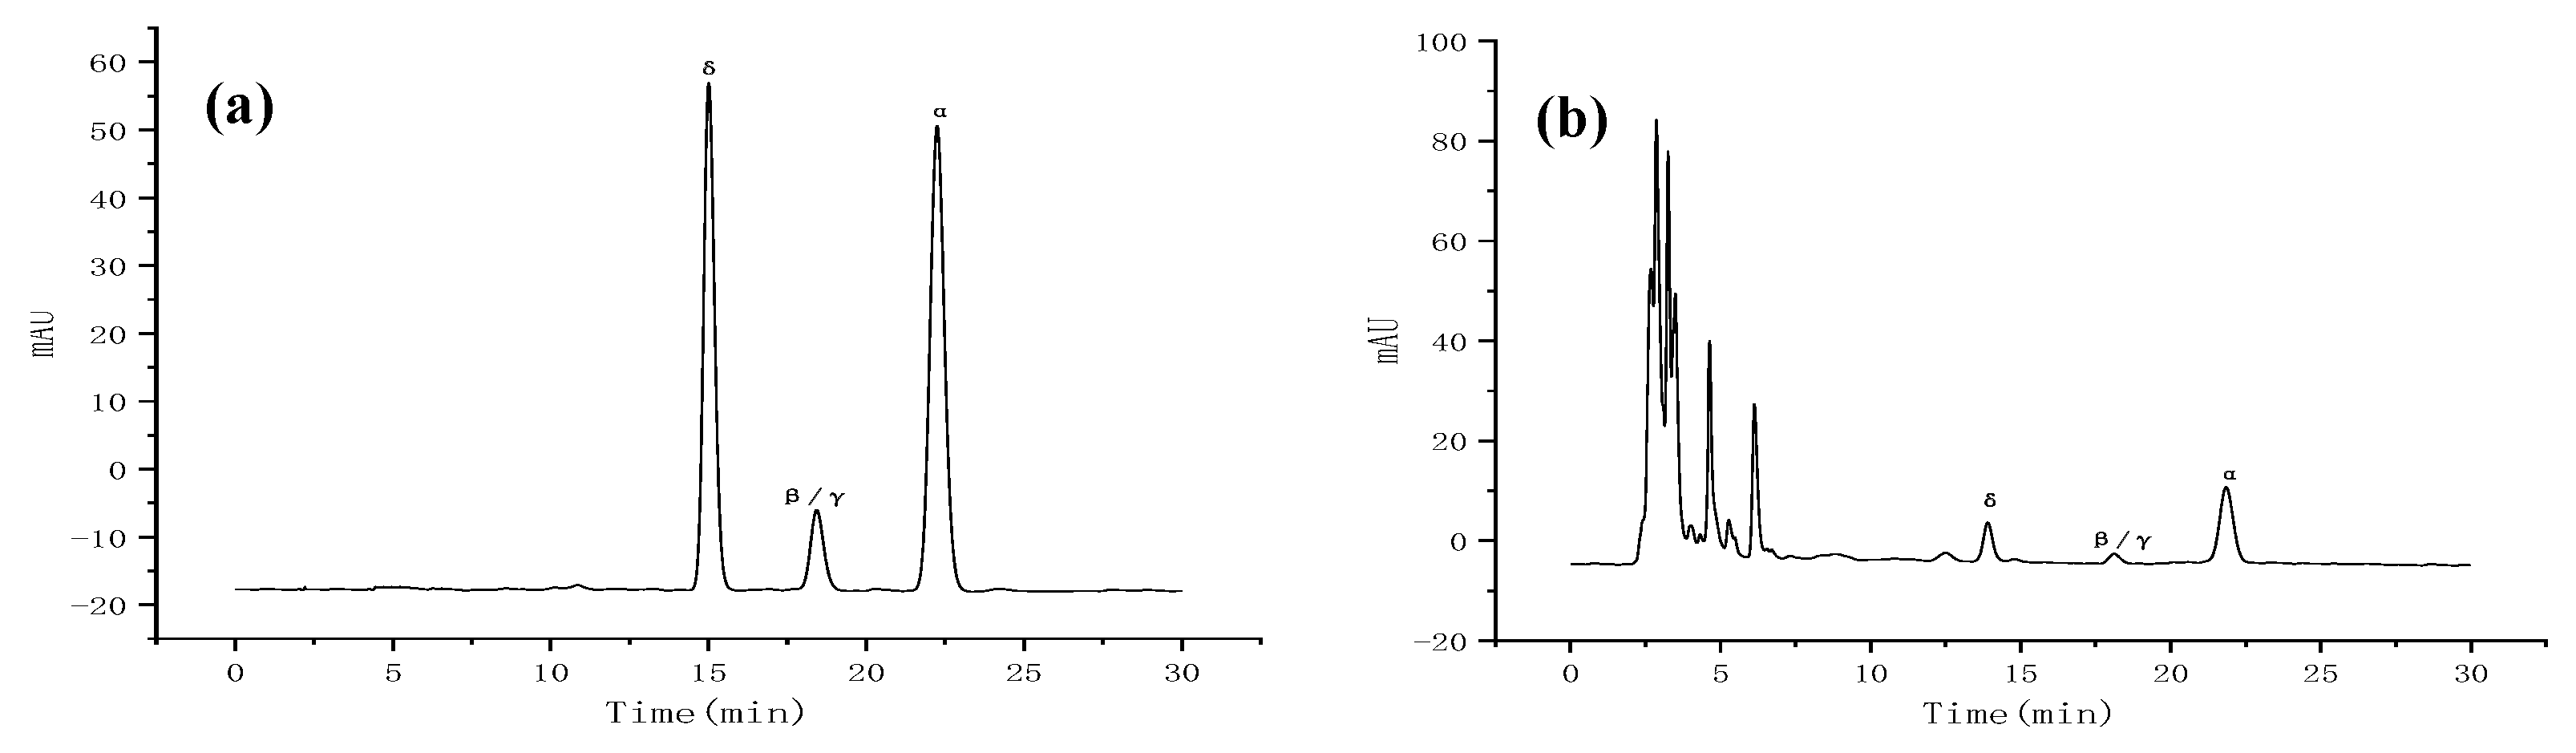
Determination of samples. High performance liquid chromatography (HPLC) was performed by AgiLent1260, including high pressure four-element pump (G1311A), column temperature chamber (AT-950) and diode array detector (G1315D), and Agilent ZORBAX Eclipse Plus C18 column (4.6 mm× 250 mm, 5 µm) was selected. The volume ratio of mobile phase methanol to water was 98:2, the volume flow rate was 1.0 mL·min−1, the column temperature was 35 °C, the detection wavelength of DAD detector was 295 nm, and the sample size was 20 μL. All components could be separated well under the chromatographic conditions. We precisely absorbed the mixed reference solution in step (1) and the sample solution to be measured in step (2), and, respectively, injected the samples for determination according to the chromatographic conditions in step (3). The liquid chromatographic spectra of several tocopherols in the mixed reference product and the sample to be measured are shown in Figure A1.
Figure A1. Liquid chromatographic spectrum of tocopherol: (a) in mixed control products, (b) in test products.
Applsci 14 03299 g0a1
(4)
Investigation of linear relationship, determination of detection limit and quantitative limit. The mixed reference solution (20 μL each) prepared in step (1) was precision absorbed and injected into the liquid chromatograph. The peak areas of α-tocopherol, β-tocopherol, γ-tocopherol and δ-tocopherol were measured according to the chromatographic conditions in (3). The peak areas were repeated 3 times, and the average values were taken. The standard curve was calculated with injection concentration X as the horizontal coordinate and peak area and Y as the vertical coordinate. When the signal-to-noise ratio (S/N) is 3, the concentration of the measured substance is the limit of detection, and when the signal-to-noise ratio (S/N) is 10, the concentration of the measured substance is the limit of quantification. The results are listed in Table A1. From Table A1, it can be seen that each component has a good linear relationship within its own range.
Table A1. Result of the linear relationship inspection, detection limit and quantification limit determination (n = 3).
TocopherolLinear EquationRLinearity Range/μg·mL−1LOD (Limit of Detection)/μgLOQ (Limit of Quantitation)/μg
αy = 6102.3x − 2.8202R = 0.99992.65–2120.180.54
β/γy = 11,459x − 0.625R = 0.99976.25–1000.240.72
δy = 33,365x − 6.0833R = 0.99996.25–1000.270.82
(5)
Precision test. A total of 20 μL of α-tocopherol, β-tocopherol, delta-tocopherol mixed reference solution was accurately absorbed, and the samples were continuously injected for 6 times according to the chromatographic conditions in step (3). The peak area was recorded, and the RSD value of the peak area of each compound was calculated. The results are shown in Table A2.
Table A2. Precision test results of two reference substances.
Number of Timesα-Tocopherol/Aβ-Tocopherol/Aδ-Tocopherol/A
1st736613805
2nd728602813
3rd738616814
4th739634818
5th748624812
6th716602804
RSD (%)1.492.030.67
(6)
Stability test. The same sample solution was taken and placed at room temperature, and the peak areas of α-tocopherol, β-tocopherol and δ-tocopherol were injected at 0, 2, 4, 6, 8, and 24 h, respectively. The peak areas were recorded, and the RSD values of α-tocopherol, β-tocopherol and δ-tocopherol were calculated, respectively. The results are shown in Table A3. The RSD% of the 7 indexes was less than 3.0%, indicating that the solution was stable within 24 h after preparation and had no significant effect on the determination results.
Table A3. Stability test results of two indicator constituent within 24 h.
Timeα-Tocopherol/Aβ-Tocopherol/Aδ-Tocopherol/A
0 h106.232.3159.7
2 h102.132.1159.0
4 h109.731.0154.6
6 h110.232.7156.0
8 h105.332.1161.2
24 h107.532.0160.0
RSD (%)2.811.751.58
(7)
Repeatability test. The test samples were prepared according to the above-mentioned preparation method, and 6 samples were taken in parallel to prepare the test product solution with a certain concentration. According to the chromatographic conditions described in (4), the peak areas of α-tocopherol, β/γ-tocopherol and δ-tocopherol were, respectively, injected to determine the peak areas of α-tocopherol, β-tocopherol and δ-tocopherol, which were recorded, and the RSD values of the peak areas of α-tocopherol, β-tocopherol and δ-tocopherol were calculated, respectively. The results are shown in Table A4. The RSD of α-tocopherol, β-tocopherol and δ-tocopherol were 1.97%, 0.67% and 0.35%, respectively, and RSD% of the peak area of the three components was less than 3.0%, indicating good reproducibility of the method.
Table A4. Repeatability test results of two index components.
Samplesα-Tocopherol/Aβ-Tocopherol/Aβ-Tocopherol/A
1st18.7103.0169.0
2nd18.2104.0168.3
3rd18.3103.5167.8
4th19.0103.7168.0
5th19.1102.6169.2
6th18.5102.2169.0
RSD (%)1.970.670.35
(8)
Sample recovery experiment. The appropriate amount of the test sample was accurately weighed and added to the volumetric bottle, 6 parts of each index component were parallel, and a certain amount of α-tocopherol, β-tocopherol, δ-tocopherol control products were added to the corresponding volumetric bottle. According to the above-mentioned preparation methods, the test samples with added recovery rates were prepared, respectively, and the results were shown in Table A5. It can be seen from Table A5 that the recoveries were between 96.36% and 99.93% after standard substances were added with different proportions, and the recoveries of the three index components were RSDS% < 3.0%, indicating a good recovery rate of the test method.
Table A5. Results of recovery test of three control substances (n = 6).
IngredientSample Content/mgAddition/mgMeasured Amount/mgSample Recovery/%Average Recovery Rate/%RSD/%
α-tocopherol0.1220.100.21998.6598.571.15
0.1230.100.22199.10
0.1200.100.21296.36
0.1240.100.22299.11
0.1210.100.21898.64
0.1230.100.22299.55
β-tocopherol0.07620.070.145899.4399.330.17
0.08150.070.151299.57
0.06820.070.137699.14
0.07160.070.141299.43
0.06260.070.132199.28
0.07380.070.143299.14
δ-tocopherol0.03250.030.062299.0099.720.36
0.03260.030.062699.93
0.03120.030.061299.90
0.03240.030.062399.87
0.03350.030.063499.80
0.03250.030.062499.83
(9)
Sample content determination. The appropriate amount of peony seed oil (about 0.1 g) of the above-mentioned prepared samples was moved into a graduated centrifuge tube. The samples were extracted for 30 min by using ultrasonic extraction (power 250 W, frequency 40 kHz) in where methanol as the extraction agent, and the materials-liquid ratio of 1:1.2 (g/mL). The above extraction process was proceeded twice. The extraction liquid after traction twice were combined and concentrated with nitrogen blowing apparatus, and then fixed volume with methanol to 0.15 mL. The samples were filtered as a sample liquid to be tested. The sample liquid was absorbed to be measured according to the chromatographic conditions described in step (3). The peak area of the target peak was recorded, and the content of α-tocopherol, β-tocopherol and δ-tocopherol in the sample were calculated.

References

  1. GBT 40622-2021; Peony Seed Oil. Standardization Administration of China: Beijing, China, 2021.
  2. Pascual, G.; Domínguez, D.; Elosúa-Bayes, M.; Beckedorff, F.; Laudanna, C.; Bigas, C.; Douillet, D.; Greco, C.; Symeonidi, A.; Hernández, I.; et al. Dietary palmitic acid promotes a prometastatic memory via Schwann cells. Nature 2021, 599, 485–490. [Google Scholar] [CrossRef] [PubMed]
  3. Leone, A.; Romaniello, R.; Juliano, P.; Tamborrino, A. Use of a mixing-coil heat exchanger combined with microwave and ultrasound technology in an olive oil extraction process. Innov. Food Sci. Emerg. Technol. 2018, 50, 66–72. [Google Scholar] [CrossRef]
  4. Iqdiam, B.M.; Abuagela, M.O.; Marshall, S.M.; Yagiz, Y.; Goodrich-Schneider, R.; Baker, G.L., IV; Welt, B.A.; Marshall, M.R. Combining high power ultrasound pre-treatment with malaxation oxygen control to improve quantity and quality of extra virgin olive oil. J. Food Eng. 2019, 244, 1–10. [Google Scholar] [CrossRef]
  5. Tamborrino, A.; Romaniello, R.; Caponio, F.; Squeo, G.; Leone, A. Combined industrial olive oil extraction plant using ultrasounds, microwave, and heat exchange: Impact on olive oil quality and yield. J. Food Eng. 2019, 245, 124–130. [Google Scholar] [CrossRef]
  6. Taticchi, A.; Selvaggini, R.; Esposto, S.; Sordini, B.; Veneziani, G.; Servili, M. Physicochemical characterization of virgin olive oil obtained using an ultrasound-assisted extraction at an industrial scale: Influence of olive maturity index and malaxation time. Food Chem. 2019, 289, 7–15. [Google Scholar] [CrossRef]
  7. Leone, A.; Tamborrino, A.; Zagaria, R.; Sabella, E.; Romaniello, R. Plant innovation in the olive oil extraction process: A comparison of efficiency and energy consumption between microwave treatment and traditional malaxation of olive pastes. J. Food Eng. 2015, 146, 44–52. [Google Scholar] [CrossRef]
  8. Leone, A.; Romaniello, R.; Tamborrino, A.; Xu, X.-Q.; Juliano, P. Microwave and megasonics combined technology for a continuous olive oil process with enhanced extractability. Innov. Food Sci. Emerg. Technol. 2017, 42, 56–63. [Google Scholar] [CrossRef]
  9. Amarillo, M.; Pérez, N.; Blasina, F.; Gambaro, A.; Leone, A.; Romaniello, R.; Xu, X.-Q.; Juliano, P. Impact of sound attenuation on ultrasound-driven yield improvements during olive oil extraction. Ultrason. Sonochem. 2019, 53, 142–151. [Google Scholar] [CrossRef]
  10. Tamborrino, A.; Urbani, S.; Servili, M.; Romaniello, R.; Perone, C.; Leone, A. Pulsed Electric Fields for the Treatment of Olive Pastes in the Oil Extraction Process. Appl. Sci. 2020, 10, 114. [Google Scholar] [CrossRef]
  11. Knorr, D.; Ade-Omowaye, B.I.O.; Heinz, V. Nutritional improvement of plant foods by non-thermal processing. Proc. Nutr. Soc. 2009, 61, 311–318. [Google Scholar] [CrossRef]
  12. Tian, Y.; Fan, W.; Lu, W.; Zhang, G.; Chang, Z. Structure optimization of pulsed electric field processor and its sterilization effect. Food Qual. Saf. 2024, 8, fyad044. [Google Scholar] [CrossRef]
  13. Han, S.-F.; Jin, W.; Yang, Q.; El-Fatah Abomohra, A.; Zhou, X.; Tu, R.; Chen, C.; Xie, G.-J.; Wang, Q. Application of pulse electric field pretreatment for enhancing lipid extraction from Chlorella pyrenoidosa grown in wastewater. Renew. Energy 2019, 133, 233–239. [Google Scholar] [CrossRef]
  14. Mohamed, M.E.; Eissa, A.H.A. Pulsed Electric Fields for Food Processing Technology. In Structure and Function of Food Engineering; InTech: Houston, TX, USA, 2012. [Google Scholar] [CrossRef]
  15. El Kantar, S.; Boussetta, N.; Lebovka, N.; Foucart, F.; Rajha, H.N.; Maroun, R.G.; Louka, N.; Vorobiev, E. Pulsed electric field treatment of citrus fruits: Improvement of juice and polyphenols extraction. Innov. Food Sci. Emerg. Technol. 2018, 46, 153–161. [Google Scholar] [CrossRef]
  16. Silve, A.; Papachristou, I.; Wüstner, R.; Sträßner, R.; Schirmer, M.; Leber, K.; Guo, B.; Interrante, L.; Posten, C.; Frey, W. Extraction of lipids from wet microalga Auxenochlorella protothecoides using pulsed electric field treatment and ethanol-hexane blends. Algal Res. 2018, 29, 212–222. [Google Scholar] [CrossRef]
  17. Guderjan, M.; Elez-Martínez, P.; Knorr, D. Application of pulsed electric fields at oil yield and content of functional food ingredients at the production of rapeseed oil. Innov. Food Sci. Emerg. Technol. 2007, 8, 55–62. [Google Scholar] [CrossRef]
  18. Puértolas, E.; Koubaa, M.; Barba, F.J. An overview of the impact of electrotechnologies for the recovery of oil and high-value compounds from vegetable oil industry: Energy and economic cost implications. Food Res. Int. 2016, 80, 19–26. [Google Scholar] [CrossRef]
  19. Shorstkii, I.; Mirshekarloo, M.S.; Koshevoi, E. Application of Pulsed Electric Field for Oil Extraction from Sunflower Seeds: Electrical Parameter Effects on Oil Yield. J. Food Process Eng. 2015, 40, e12281. [Google Scholar] [CrossRef]
  20. Haji-Moradkhani, A.; Rezaei, R.; Moghimi, M. Optimization of pulsed electric field-assisted oil extraction from cannabis seeds. J. Food Process Eng. 2019, 42, e13028. [Google Scholar] [CrossRef]
  21. Rábago-Panduro, L.M.; Morales-de la Peña, M.; Martín-Belloso, O.; Welti-Chanes, J. Application of Pulsed Electric Fields PEF on Pecan Nuts Carya illinoinensis Wangenh. K. Koch: Oil Extraction Yield and Compositional Characteristics of the Oil and Its By-product. Food Eng. Rev. 2021, 13, 676–685. [Google Scholar] [CrossRef]
  22. Leone, A.; Tamborrino, A.; Esposto, S.; Berardi, A.; Servili, M. Investigation on the Effects of a Pulsed Electric Field (PEF) Continuous System Implemented in an Industrial Olive Oil Plant. Foods 2022, 11, 2758. [Google Scholar] [CrossRef]
  23. Tamborrino, A.; Mescia, L.; Taticchi, A.; Berardi, A.; Lamacchia, C.M.; Leone, A.; Servili, M. Continuous pulsed electric field pilot plant for olive oil extraction process. Innov. Food Sci. Emerg. Technol. 2022, 82, 103192. [Google Scholar] [CrossRef]
  24. Martínez-Beamonte, R.; Ripalda, M.; Herrero-Continente, T.; Barranquero, C.; Dávalos, A.; López de las Hazas, M.C.; Álvarez-Lanzarote, I.; Sánchez-Gimeno, A.C.; Raso, J.; Arnal, C.; et al. Pulsed electric field increases the extraction yield of extra virgin olive oil without loss of its biological properties. Front. Nutr. 2022, 9, 1065543. [Google Scholar] [CrossRef] [PubMed]
  25. Li, Q.; Li, Y.-L.; Wang, X.-Y.; He, X.-D.; Qian, J.-Y. Safety Assessment of Canola Oil Extracted by Aid of Pulsed Electric Field: Genetic, Acute and Subacute Toxicity. J. Oleo Sci. 2022, 71, 959–974. [Google Scholar] [CrossRef] [PubMed]
  26. Mazroei Seydani, L.; Gharachorloo, M.; Asadi, G. Use of pulsed electric field to extract rapeseed oil and investigation of the qualitative properties of oils. J. Food Process Eng. 2022, 45, e14149. [Google Scholar] [CrossRef]
  27. Grillo, G.; Boffa, L.; Calcio Gaudino, E.; Binello, A.; Rego, D.; Pereira, M.; Martínez, M.; Cravotto, G. Combined Ultrasound and Pulsed Electric Fields in Continuous-Flow Industrial Olive-Oil Production. Foods 2022, 11, 3419. [Google Scholar] [CrossRef] [PubMed]
  28. Andreou, V.; Kourmbeti, E.; Dimopoulos, G.; Psarianos, M.; Katsaros, G.; Taoukis, P. Optimization of Virgin Olive Oil Yield and Quality Applying Nonthermal Processing. Food Bioprocess Technol. 2022, 15, 891–903. [Google Scholar] [CrossRef]
  29. Li, N.; Fan, C.; Li, X.; Long, L.; Cao, X. Optimization of determination method and analysis on tocopherol content in edible vegetable oils. J. Food Sci. Technol. 2015, 33, 59–63. [Google Scholar]
  30. Li, H. Study on the Preparation of High Content of Natural α-Tocopherol. Master’s Thesis, Jiangnan University, Wuxi, China, 2013. [Google Scholar]
Figure 1. Schematic diagram of PEF processing experiment.
Applsci 14 03299 g001
Figure 2. Peony seeds (a), particles of 20-mesh (b), 40-mesh (c), and 60-mesh (d).
Applsci 14 03299 g002
Figure 3. Flow chart of tocopherol detection.
Applsci 14 03299 g003
Figure 4. Voltage and current waveforms during the process of PEF treatment on peony seeds.
Applsci 14 03299 g004aApplsci 14 03299 g004b
Figure 5. Equivalent circuit of PEF treatment unit for peony seeds: (a) peony seeds of different particle sizes are filled in the processing unit; (b) assuming that the peony seed particles are compacted into cakes; (c) equivalent model of capacitors connected in series.
Applsci 14 03299 g005
Figure 6. The oil yield of different particle sizes of peony seeds with varying voltage amplitudes at 100 Hz (a) and 1 kHz (b).
Applsci 14 03299 g006
Figure 7. Significance level of oil yield before and after 100 Hz (a) and 1 kHz (b) PEF treatment (* p < 0.05, *** p < 0.001).
Applsci 14 03299 g007
Figure 8. Tocopherol and its significance level: (a) 100 Hz, (b) 1 kHz. (** p < 0.01, *** p < 0.001).
Applsci 14 03299 g008
Figure 9. β- tocopherol and its significance level: (a) 100 Hz, (b) 1 kHz. (* p < 0.05, ** p < 0.01, *** p < 0.001).
Applsci 14 03299 g009
Figure 10. δ-tocopherol and its significance level: (a) 100 Hz, (b) 1 kHz. (** p < 0.01).
Applsci 14 03299 g010
Disclaimer/Publisher’s Note: The statements, opinions and data contained in all publications are solely those of the individual author(s) and contributor(s) and not of MDPI and/or the editor(s). MDPI and/or the editor(s) disclaim responsibility for any injury to people or property resulting from any ideas, methods, instructions or products referred to in the content.

