Abstract
In the context of global trade and environmental concerns, this research focuses on examining the influence of the principal dimensions of a container feeder vessel whose propulsion has been modified to operate with green methanol. Methanol emerges as a sustainable marine fuel, reducing emissions and dependence on fossil fuels. The study comprehensively examines the structural challenges posed by container ships, with a particular focus on torsional stresses and hydroelasticity effects. A significant novelty of this study is the inclusion of a comparative structural analysis evaluating how changes in the vessel’s main dimensions impact its structural response. This analysis sheds some light on crucial insights into the effects of structural modifications required for accommodating these changes, ensuring the structural strength of these vessels. The research also underscores the impact of permanent and transient springing and whipping phenomena on fatigue damage. The study’s significance lies in its role in the ongoing transition to sustainable maritime transportation, as it not only examines structural challenges but also provides solutions for achieving an optimal structural configuration in this new era of environmental responsibility.
1. Introduction
Container ships play a pivotal role in the global transportation and logistics network, exerting a direct influence on the dynamics of the global economy. This influence has given rise to the proliferation of these vessels across the world’s seas and oceans, spurred by the constant expansion in their size driven by the concept of economies of scale. As the fleet of container ships continues to grow, the demand for expanded port facilities has surged. Nonetheless, the limitations in the design of certain ports restrict their ability to accommodate these larger vessels. Consequently, feeder container ships, which serve as intermediaries, are utilized to transport containers from major cargo terminals to smaller ports [1]. This has prompted extensive research into these feeder ships [2,3].
Methanol assumes a crucial function as a marine fuel amidst the intensifying environmental challenges. It has become increasingly imperative to explore cleaner and sustainable energy sources, and in this context, methanol emerges as a promising solution for propelling ships [4]. Methanol possesses remarkable versatility, as it can be derived from various sources like natural gas, biomass, or even captured carbon dioxide. This reduces our dependence on fossil fuels and opens the door to more sustainable production methods [5]. Furthermore, methanol holds the potential to reduce polluting emissions and the carbon footprint of maritime transport. When burned, it emits lesser sulfur dioxide, nitrogen oxides, and particulates in comparison to conventional fossil fuels [6]. The future market trend is towards its use in container ships, as reflected in the delivery of the first methanol-fueled container ship from Maersk, delivered in 2023 (Figure 1).
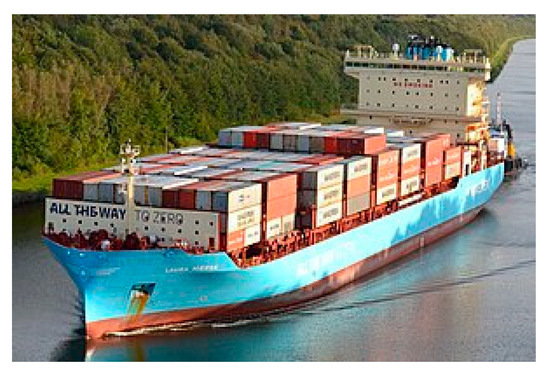
Figure 1.
Laura Maersk methanol-powered feeder container ship [7].
Evergreen and other shipping companies are already converting their container ships to methanol propulsion because it is estimated that they emit approximately 100 tons less of carbon dioxide per day when compared with conventional fossil fuel propulsion [6].
Container vessels exhibit a standardized structural general arrangement featuring slender-walled beams and expansive hatch openings, expediting swift port loading maneuvers. Nonetheless, this design concurrently exposes them to high vulnerability to strains arising from the amalgamation of global bending and torsional forces. Wang et al. [8] undertook an exploration of torsional failure mechanisms in vessels equipped with substantial hatches, employing both numerical models and experimental tests during structural failure events. Their inquiry pinpointed warping as the predominant failure mode, significantly affecting ultimate torsional strength and precipitating a noteworthy reduction. Paik et al. [9] emphasized the repercussions of torsion on warping stresses in a 4300 TEU container ship, shedding some light on its implications for shear stresses and their role in diminishing the ultimate bending moment’s magnitude. In a parallel fashion, Sun and Guedes Soares [10] devised two distinct models to portray and compare failure modes induced by torsional loads.
The assessment of a ship’s structural integrity is contingent on various factors. Senjanovic et al. [11] delved into the influence of torsional stiffness in the engine room using an energetic approach involving the modeling and simplification of the main deck as a beam affected by shear stresses.
Iijima et al. [12] devised a pragmatic approach to evaluate the torsional strength of container ship structures ranging from 1500 to 8000 TEU through numerical analysis. They identified the most critical wavelength at 120° relative to the ship’s course. The fundamental principle of load interaction, crucial in achieving maximum strength, was employed by Wang and Wang [13] in their research, which extended to a 10,000 TEU container ship, starting from the compartment model and expanding to the global hull girder. Given the global loads endured by container ships, specific attention is directed to a localized structure termed the upper wing torsional box, situated on both the port and starboard sides at the main deck’s height. This region manifests the highest stress concentrations, predominantly around the midship section, prompting multiple investigations into the structural evaluation of this area. Silva-Campillo et al. [14] scrutinized the influence of various geometric configurations resulting from different cut-out designs on the optimal weight of the torsional box. Meanwhile, Villavicencio et al. [15] directed their study toward the variations in warping stresses near the torsional box by comparing different formulations of hydrodynamic torsion moments.
The concept of hydroelasticity, especially concerning permanent and transient springing and whipping phenomena, assumes significance due to its impact on fatigue. This influence is particularly accentuated in the torsion box area due to its heightened stress levels. Han et al. [16] introduced a design methodology to predict wave-induced vibrations (springing and whipping) and their role in estimating fatigue damage for a 16,000 TEU container ship. Barhoumi and Storhaug [17] ascertained how the whipping effect contributes to fatigue phenomena in both hogging and sagging conditions through on-board stress measurements. Storhaug [18] underscored the importance of whipping in fatigue assessment through experimental tests and numerical simulations on container ships ranging from 2800 to 8600 TEU. Kim and Choung [19] presented a methodology considering multiple sea states, devising a procedure to estimate the increase in vertical wave bending moment due to whipping through a hydroelastic fluid–structure interaction model in the time domain.
The role of springing and whipping phenomena in fatigue determination is firmly established. Ren et al. [20] delved into this phenomenon for two container ships of varying capacities and under different loading conditions, revealing that fatigue damage assessment, when influenced by both whipping and springing, is 18.75% higher compared with springing alone. Other researchers have explored the contribution of permanent and transient phenomena to fatigue damage. Mao et al. [21] estimated that whipping contributes approximately 30% of fatigue damage, based on the experience of a 2800 TEU container ship operating in the Atlantic Ocean.
Hansen and Winterstein [22] observed that over 40% of fatigue cracks in ship structures occur in the side shell plating, particularly at the junction of primary and secondary elements. This structural detail has been the focal point of numerous studies in container ships. Li et al. [23] proposed a procedure for assessing fatigue in side-shell structures considering wave non-linearity and service speed. The maritime sector, driven by IMO targets, aims to reduce greenhouse gas emissions with environmentally friendly technology and fuels, such as methanol. A comparative study, such as the research by Zamboni et al. [24], highlights the potential of renewable sources such as methanol to achieve significant reductions. Ringsberg et al. [25] conducted analyses in both linear and non-linear regimes to determine results, with assessments performed for two significant wave heights. Fricke et al. [26] investigated critical locations at the intersection of primary and secondary elements using diverse structural configurations, especially the arrangement between a bulb-type profile and an attached flat bar. Lastly, Fricke and Paetzold [26] explored the influence of different loading conditions on this structural detail, incorporating various models.
The distinctive aspects of this research lie in an exhaustive structural analysis designed to unveil the optimal structural configuration by varying critical vessel dimensions. Our exploration delves into the impact of dimensional adjustments on the vessel’s structural response, elucidating the intricate relationship between these modifications and the vessel’s overall strength. A central focus of this study is a comparative structural analysis, aiming to evaluate how modifications in main vessel dimensions impact its structural response.
The paper unfolds as follows: In Section 2, the authors establish the foundational mathematical principles underpinning the analysis. Section 3 introduces a case study, a container ship that serves as the focal point of the numerical investigation and testing procedure. Section 4 meticulously outlines the numerical simulation, the generation of alternatives, the container arrangement and stowage, and finally, the loading conditions. Then, in Section 5, the authors unveil the results of the simulation, addressing crucial aspects such as stability checks, longitudinal strength, the midship section, and a comprehensive structural analysis of the openings. Concluding in Section 6, the authors derive key insights from the research, which bear significant implications for the maritime industry. A keen focus on structural modifications and their impact on vessel response enriches the design criteria for the advancement of sustainable, resilient, and structurally optimized container ships.
2. Hull Girder Loading
2.1. Ship Stability
The key concepts of ship stability are [27] GM, the metacentric height, which is the distance from the center of gravity G to the metacenter M. The second one is KB, which is the distance from the keel K to the center of buoyancy B. The third one is KG, which is the distance from the keel K to the center of gravity G. Finally, KM is the distance from the keel K to the metacenter M (Figure 2).
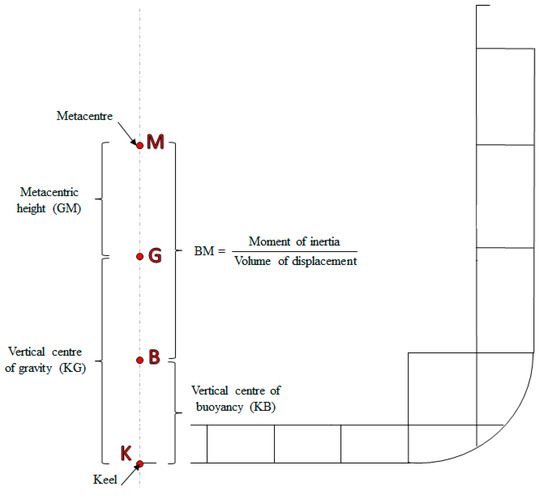
Figure 2.
Ship stability concepts.
KB and BM depend on the geometrical form of the ship, and KG depends on the loading of the ship.
2.2. Longitudinal Strength
Ship hull girder loads are the combined result of static and dynamic components. Among these components, the most significant ones are the still water bending moments and the shear forces. These are primarily influenced by the distribution of weight items on the ship and the corresponding buoyancy forces along its length. Weight items include the ship’s lightweight, cargo, and consumables. The dynamic aspects of these loads include various factors like wave-induced hydrodynamic forces, sloshing, slamming, inertia loads due to vessel motion, and impact loads. These dynamic wave-induced loads encompass vertical and horizontal shear forces, bending moments, and torsional moments. Naming the weight and buoyancy distributions as wx and bx, then the load distribution is given by [28]
The distributions of the shear force and bending moment along ship length are given by
The wave-induced shear force and bending moment components result from the distribution of the forces throughout the ship’s length of a ship advancing in waves. The wave bending moments and shear forces are determined assuming the vessel is floating on a wave of length equal to ship length, with a crest at amidships or with a trough at amidships (hogging or sagging condition). The total deflection curve of a floating free-free beam of variable cross-section under the action of an arbitrary loading system is composed of two parts: bending deflection and shear deflection. The bending deflection is calculated from the following general differential equation [28]:
where Ix denotes the moment of inertia along the x-axis, and E is Young’s modulus. The shear deflection is calculated with the following equation:
where G is the transverse modulus of elasticity, is a constant depending on the geometry of the cross-section and is given by , where A is the shear area of the section, F is the shear force, and is the shear stress. The total curvature of the elastic line at any position x along the ship length is therefore given by
Thus,
where M′x is the bending moment corrected by shear force:
where . The equation to the elastic line is therefore given by [28]
where and are arbitrary constants depending on the chosen reference line and the end conditions. Assuming the line joining the two endpoints of the elastic line is the reference line, then
The equation to the elastic line is therefore given by [28]
On the other hand, if the still water surface is assumed to be the reference line, the two constants and are determined from the following equilibrium conditions:
where is the change in load due to hull girder deflection, with the breadth of the ship at the waterline and is assumed to be constant over the ship deflection range. Substituting from Equations (9) and (11):
3. Case Study
3.1. Container Ship
The initial version of the container ship (V0) under investigation, modeled and studied with Rhinoceros® and Maxsurf®, is equivalent to Laura Maersk, Maersk’s first green methanol ship delivered in 2023 [29], and has 43 bays counted from the bow, organized in nine cargo holds, separated from each other by transverse bulkheads, in the cylindrical body forward of the superstructure and two more container bays aft of the superstructure (Figure 3).
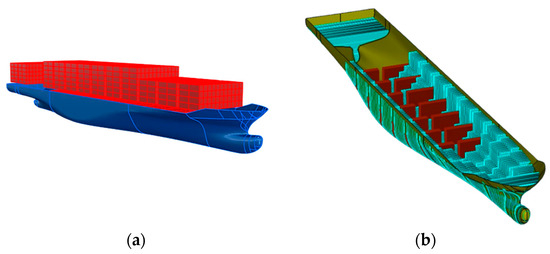
Figure 3.
Three-dimensional view and general arrangement. (a) Container arrangement, (b) Subdivision of bulkheads and holds.
Table 1 shows the main particulars of the container ship in the initial version (V0).

Table 1.
Main particulars (V0).
Table 2 shows the stowage and arrangement of containers on deck (OD) and below deck (BD) in the initial version (V0).
Table 2.
Container stowage in version V0.
Figure 4 shows the scantling of the midship section in its initial version. In Figure 4a, inside the yellow squares, the plate element number is shown and below it is the thickness (in mm) of each plate element, while in Figure 4b, the dimension (in mm) of the longitudinal stiffeners with a bulb-type cross-section is shown.
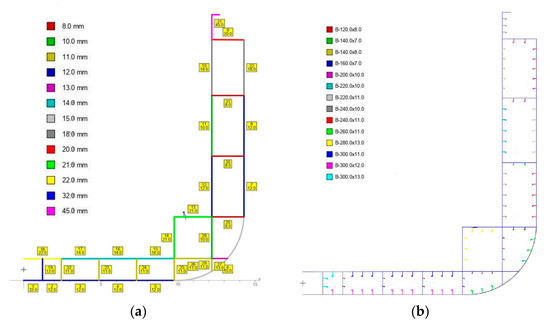
Figure 4.
Midship section in the initial version V0. (a) Plates (b) ordinary stiffeners.
Table 3 depicts the geometric properties of the midship section in the initial version.
Table 3.
Geometric properties of the midship section in the initial version.
Figure 5 shows the sectional area curve for the V0 version.
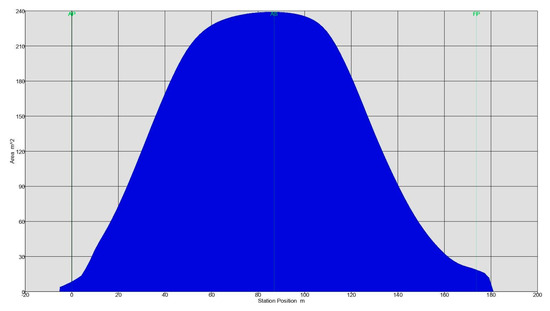
Figure 5.
Sectional area curve for the V0 version.
3.2. Testing
Proceeding to analyze the geometry of the opening of the web frame for the passage of the secondary stiffener, for this purpose, two different cut-out shapes have been chosen within a 530 × 430 × 20 mm steel plate (Young’s modulus equal to 210 GPa, Poisson’s ratio equal to 0.3, and yield stress equal to 235 MPa) in relation to the standard secondary stiffener (W.200 × 8/FB.90 × 14). Figure 6 illustrates the test specimens and their respective dimensions.
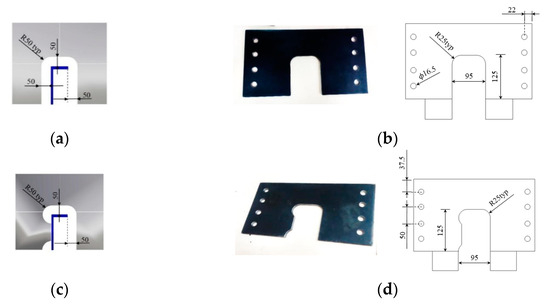
Figure 6.
Dimensions of the geometry and test specimens (in mm). (a) Opening a, (b) test specimen of opening a, (c) opening b, and (d) test specimen of opening b.
The specimens consist of two welds: one linking the opening to the side shell and another connecting the opening to the standard stiffener (only for opening b). The weld between the opening and the standard stiffener is replaced with a standard bending moment of 7.5 kN·m and a shear force of 15 kN, with a load ratio (R) of −1. The load scenario entails a uniformly distributed load of 200 kN on the web frame, resulting in a SENT-type condition (Single Edge Notch Tension). Figure 7 illustrates the load condition as well as the adjustments made to the specimens for testing on the machine.
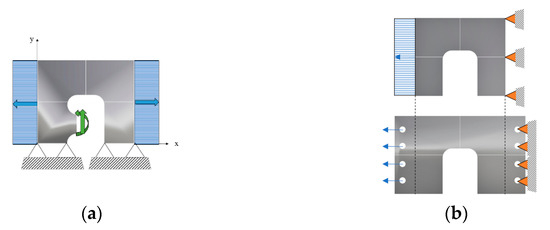
Figure 7.
(a) Loading and boundary conditions, (b) testing machine adjustment.
Each specimen is positioned within the fatigue machine using two integrated auxiliary structures, one above and one below, to simulate the intended design load. The upper transition structure includes a U-block bolted and welded to another component supporting a link connected to the machine, ensuring alignment and load consistency. Similarly, the lower transition structure features an identical U-block connected to a parallelepiped element, also linked to the machine. This setup is depicted in Figure 8.
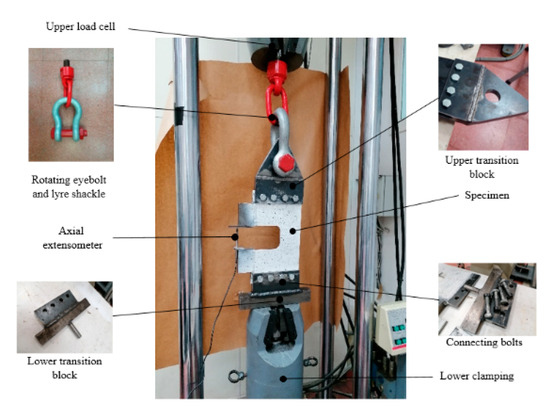
Figure 8.
Experimental general arrangement.
The experimental loading condition follows a similar geometric scaling process as previously, but this time, it is scaled down by a factor of 2.5. The stress range is constrained within ±25% of the mean stress component (R = 0.6). The load is gradually applied to the specimens in an upward continuous manner at a rate of 0.5 kN/s until reaching the desired design load, initiating the testing process. In order to record strain and displacement data, an axial extensometer is attached to the model. The standard load from the upper load cell operates at a designed frequency of 5 Hz.
4. Methodology
Different alternative geometries are presented for the case container vessel, involving modifications to the main particulars while maintaining the total number of TEU and service speed. A standard 10% extension is applied to the container dimensions in the length direction to account for cell guides and space between containers. No additional percentage adjustments are considered necessary for the remaining dimensions, as the containers maintain sufficient contact both vertically and transversely.
4.1. Generation of Alternatives
The first alternative (V1) involves increasing the length through an additional hold. When introducing this additional hold, it is necessary to remove the breadth or depth containers. In the case of removing containers in the breadth direction, the vessel’s beam dimension would have to be reduced by one row, and in the case of removing containers from the strut, it would have to be reduced by one tier. For this alternative, it is decided to remove containers from the beam direction.
The second alternative (V2) includes increasing the breadth with one more row. The number of containers has to be constant; therefore, a row has to be added, and the containers can be removed from the length or from the breadth. In the case of removing containers in the direction of the length, the same situation as above would apply; therefore, it is discarded as it does not provide a new alternative. In the case of removing containers in the vertical direction, the ship’s depth would have to be reduced by one tier. For this alternative, it is decided to remove containers in the direction of the strut as it is a new proposal.
The third version (V3) consists of increasing the depth by introducing one more tier. The containers can be subtracted from the length or from the beam. For this alternative, it was decided to remove containers from the length direction because the beam option would be in the previous case. Table 4 shows the main particulars of the original version and the different geometries.
Table 4.
Main particulars of the different versions.
The values of the hull coefficients are quite similar in the four models, indicating that there have been no significant changes in the shapes (Figure 9).
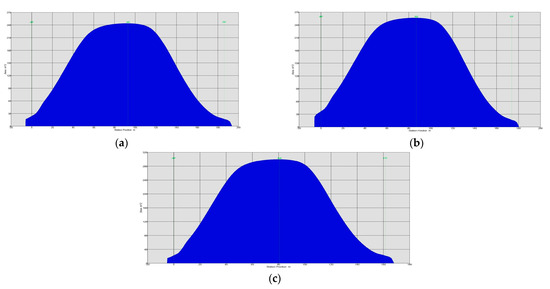
Figure 9.
Sectional area curve for the different versions. (a) V1, (b) V2, and (c) V3.
4.2. Container Arrangement and Stowage
According to International Maritime Organization (IMO) rules [30], certain criteria need to be followed to ensure full visibility from the wheelhouse. Of particular interest at this stage of the project is the requirement that the sea surface must be visible at a distance of two times the ship length or 500 m (whichever is less) from the wheelhouse at a height of 1.80 m without any blind spot, regardless of draft and trim. This aspect has to be checked as it restricts the height of containers stacked on the deck and must also be incorporated into the general arrangement drawings.
Each container is identified by means of the “Bay-Row-Tier” system. Two containers per hold are considered in the direction of the length, except for the forwardmost hold and seven stacks maximum in height. Table 5 shows the distribution of containers by bays in each of the structural alternatives.
Table 5.
Container arrangement and stowage of the different versions.
The first version has a 97.8% coincidence with the initial container ship, the second version has a 95.6% similarity, and the third version has a 99.8% similarity. As the difference in load capacity is less than 5% in each of the modified versions with respect to the initial version, the three versions are considered valid as they do not represent a degree of modification that alters the conclusions derived therefrom.
4.3. Loading Conditions
For the study of the ship’s stability and longitudinal strength, it is necessary to define the most important loading conditions in which the ship will find itself throughout its service life. The loading conditions outlined in the 2008 Intact Stability Code [22] are considered:
- (a)
- Departure from port fully loaded (L1): the vessel is loaded to the limit, and the cargo is evenly distributed with consumables at 100%.
- (b)
- Arrival at port fully loaded (L2): the vessel is loaded to the limit with consumables at 10%.
- (c)
- Departure from the port in ballast (L3): the vessel leaves the port having discharged its cargo but carries consumables at 100%.
- (d)
- Arriving in port in ballast (L4): the vessel arrives in port unladen, and consumables are at 10%.
Because the maximum load capacity varies for each model, the decision has been made to set an additional load condition (L5) with a common load of 62% and consumables at 10%. In this new load condition, all models will be loaded to approximately 62% of their maximum capacity.
Figure 10 shows the loading conditions established at the transverse strength level.
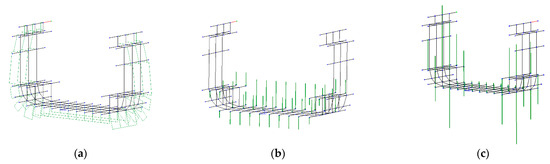
Figure 10.
Loading conditions. (a) Hydrostatic pressure, (b) nodal load due to weight of containers in upright vessel condition, (c) nodal load due to weight of containers in standard heeled vessel condition.
4.4. Finite Element Modelling
The validation process for the finite element model of the analyzed opening, featuring 4626 nodes and a combination of 20-noded cubic and 10-noded tetrahedral elements, is a three-stage endeavor. Initially, the assessment is centered on the viability of modifications made to the test specimens to enable their connection to the testing machine. This stage entails a comparison of parameters related to displacement, with a minimal difference of 4.5%, as well as the identification of the location of maximum von Mises stress, as illustrated in Figure 11.
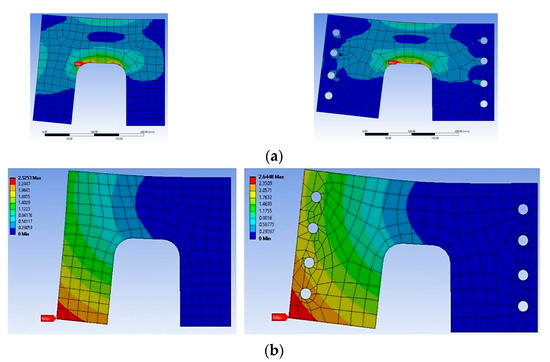
Figure 11.
Opening a. (a) Maximum stress location. (b) Maximum displacement value and location (in mm).
In the second stage of validation, the test specimens’ surfaces are meticulously prepared through a sequence of steps involving cleaning with acetone and applying contrasting white and black paint to create a random mesh pattern. This mesh serves as the basis for measuring strains and displacements during the loading process. The digital image correlation (DIC) technique is employed, using the Ncorr® open source 2D MATLAB® R2023b software, following the method outlined by Kumar et al. to perform this validation [31]. The DIC results are subsequently compared to the Finite Element Method (FEM) outcomes, particularly in terms of displacements. This comparison reveals a 7.1% variation in results for a standard load of 130 kN, as depicted in Figure 12.
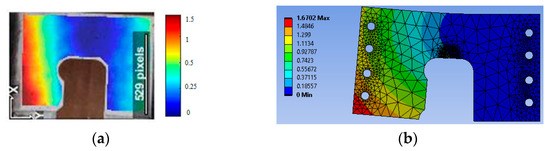
Figure 12.
Maximum displacement comparison (in mm) between techniques. (a) Digital image correlation and (b) finite element method.
5. Results and Discussion
5.1. Stability Check
Table 6 shows the most characteristic stability values for each of the specified structural alternatives and loading conditions.
Table 6.
Stability values for the different versions and loading conditions.
For the transverse metacentric radius (BM), the largest value is obtained in the V2 model. This is mainly due to the fact that the V2 model has a larger beam, which results in a higher buoyancy inertia. It is worth mentioning that as the inertia approaches that of a rectangle (with a high waterplane coefficient), it grows according to the cube of the beam, which shows consistency in the results. Similarly, model V1 has the smallest metacentric radius due to its smaller beam.
With respect to the center of gravity (KG), it can be noted that model V2 has the lowest center of gravity compared with the other models. This is due to the fact that the breadth is smaller in the V2 model. It is necessary to distribute the load over the beam and length to equalize the load with the other models, which does not affect the height of the KG. Also, the model with the higher depth has the highest center of gravity.
Metacentric height (GM) is a value indicating stability at small angles. Therefore, a higher GM provides a higher righting arm, which means higher stability. The V2 model is expected to have the largest GM because it has the largest BM and the smallest KG. As for the V3 model, despite not having the lowest BM, its lower KG disadvantages it, placing it as the option with the lowest stability.
5.2. Longitudinal Strength
Figure 13 shows the longitudinal strength at load condition L1 for each of the versions.
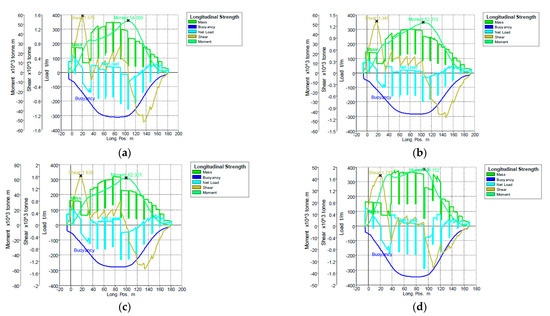
Figure 13.
Longitudinal strength in loading condition L1. (a) V0, (b) V1, (c) V2, (d) V3.
Figure 14 shows the longitudinal strength at load condition L2 for each of the versions.
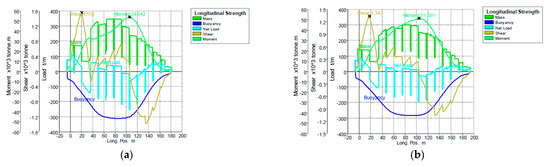
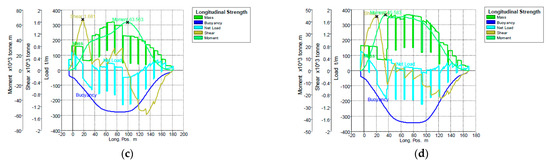
Figure 14.
Longitudinal strength in loading condition L2. (a) V0, (b) V1, (c) V2, (d) V3.
Figure 15 shows the longitudinal strength at load condition L3 for each of the versions.
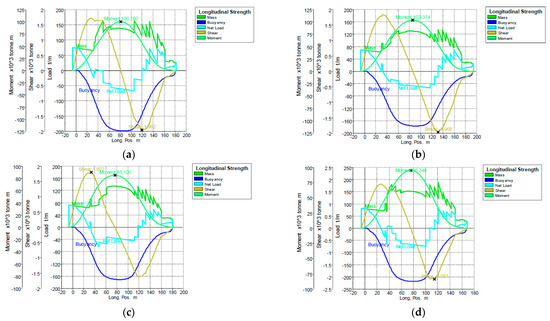
Figure 15.
Longitudinal strength in loading condition L3. (a) V0, (b) V1, (c) V2, (d) V3.
Figure 16 shows the longitudinal strength at load condition L4 for each of the versions.
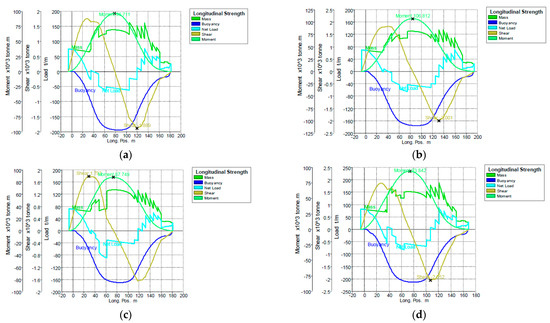
Figure 16.
Longitudinal strength in loading condition L4. (a) V0, (b) V1, (c) V2, (d) V3.
Figure 17 shows the longitudinal strength at load condition L5 for each of the versions.
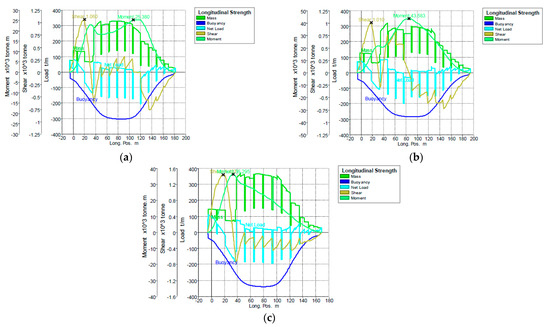
Figure 17.
Longitudinal strength in loading condition L5. (a) V0, (b) V1, (c) V2.
Figure 18 shows the maximum value of the bending moment as a function of the version of the structural alternative and the loading condition.
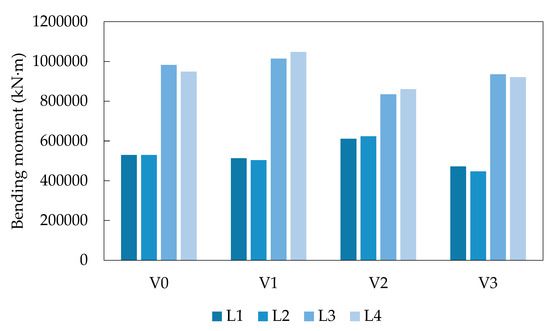
Figure 18.
Comparison in the bending moment value between container ship versions and loading conditions.
It is evident that the choice of the structural alternative significantly influences the maximum bending moment values, with some alternatives proving to be more robust than others under variable load conditions. Load conditions L3 and L4 generate the highest maximum bending moment values, and structural alternatives V1 and V2 display more noticeable changes in response to these conditions. These findings underscore the critical importance of selecting the most suitable structural alternative based on specific load conditions, emphasizing their relevance in the design and evaluation of the container vessel’s structural integrity.
5.3. Midship Section
For each of the versions, the midship section is designed considering the minimum requirements by the classification society in order to obtain a comparison criterion between them. Figure 19 shows the midship section of each version.
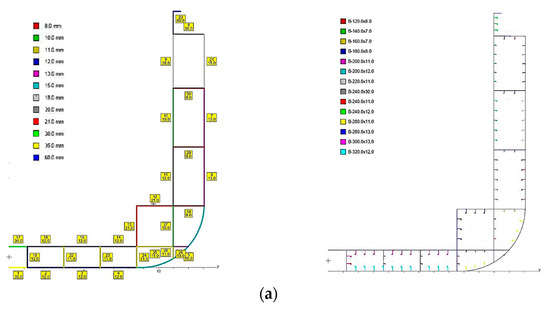
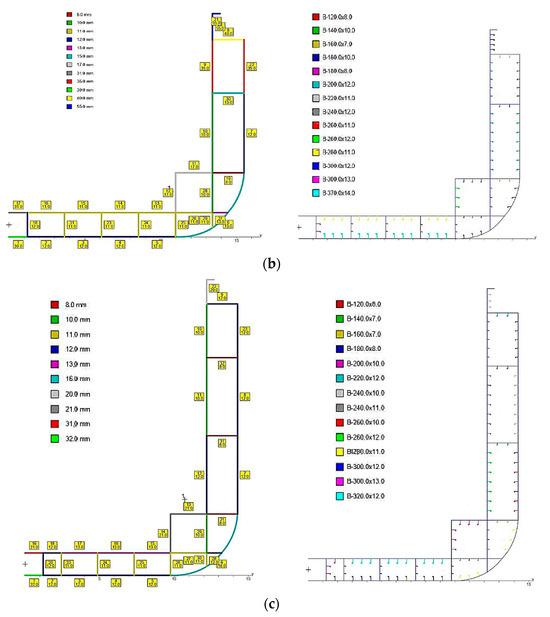
Figure 19.
Midship section scantling. (a) V1, (b) V2, (c) V3.
Table 7 shows the properties of the section of each version.
Table 7.
Section properties of the different versions.
V2 contains the largest quantity of steel, due to a reduced moment of inertia in comparison with the other models. Conversely, the remaining versions exhibit a comparable amount of steel, with V1 having the least. Specifically, the ratio of A235 steel to AH315 steel stands at 69% to 31% for V0, 67% to 33% for V1, 61% to 39% for V2, and 77% to 23% for V3.
Figure 20 shows the distribution of shear forces in the midship section (red lines, numbers and arrows refer to the modeling process, not numerical values) for the V2 caused by vertical shear force associated with a vertical bending moment in still water (Qs), the vertical shear force associated with vertical bending moment due to wave (QW), the horizontal shear force associated with horizontal bending moment due to wave (Qhc), Saint-Venant component of hydrodynamic and static torsional moment (Mwtc, Mstc), and warping torsional moment of hydrodynamic and static torsional moment (Mwtc, Mstc).
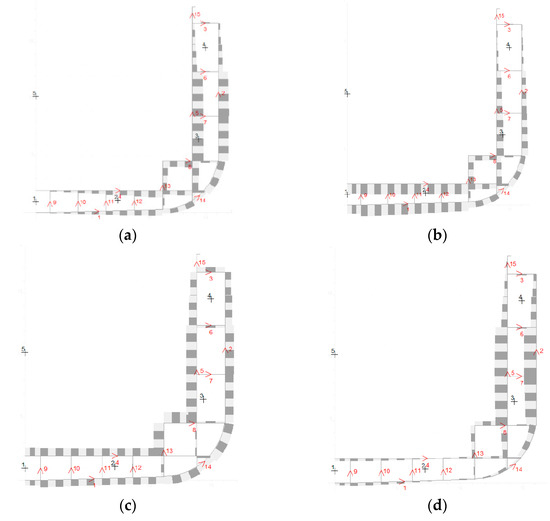
Figure 20.
Shear force distribution. (a) Qw, (b) Qhc, (c) Mstc (Saint-Venant), (d) Mwtc (warping).
Vertical shear forces are most pronounced along the shell side and double hull side near the neutral axis, particularly where the double bottom connects to the inner side. The region with the highest shear stress is within the double bottom cell, but its thickness balances the stresses, making them similar to areas with lower shear stress and thinner sections in the double bottom. Maximum shear stress distribution (Qhc) is found in the bottom and double bottom strakes near the neutral axis and smaller scantlings. For Mwtc and Mstc (Saint-Venant), the highest stresses occur where multiple shear stresses converge at intersections. In contrast, Mwtc and Mstc (warping) stresses are notably lower, peaking near the neutral axis along the double side and at the centerline.
Figure 21 shows the von Mises stress distribution and the deformed structure of the beam model representing the cross-section of the midship section of the V1 for standard upright and heeled conditions. The values in red represent the highest values expressed in stresses (permissible values lower than the yield stress), while the values in blue represent the opposite, the intermediate colours refer to intermediate stresses located between the maximum and minimum stresses.
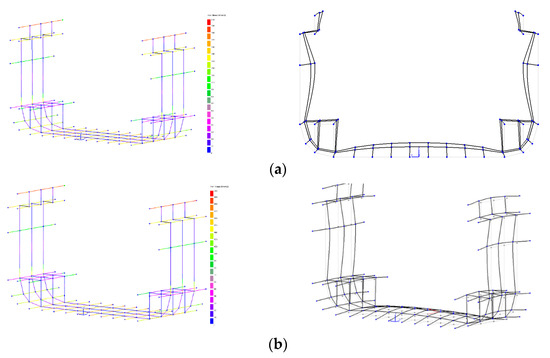
Figure 21.
Distribution of von Mises stresses due to sea pressure and container weight for V1. (a) Upright condition, (b) heeled condition.
5.4. Structural Analysis of the Opening
Due to the structure’s nature, conducting full-scale experimental tests is impractical due to machinery limitations. Instead, experiments are performed at a scaled-down model level. This scaling includes adjusting the load conditions to ensure proper correlation between experimental and numerical results. The scaling process involves modifying the geometries of openings a and b in all three coordinate directions and adjusting the thickness variable. This approach allows for meaningful structural testing despite size constraints and ensures that fatigue life determinations are accurate and reliable in the context of experimental and numerical data correlation. The scaling procedure is carried out globally on the geometries of openings a and b in all three directions corresponding to the three coordinate axes. It is performed in a similar manner with the thickness variable as with its main counterparts (Figure 22).
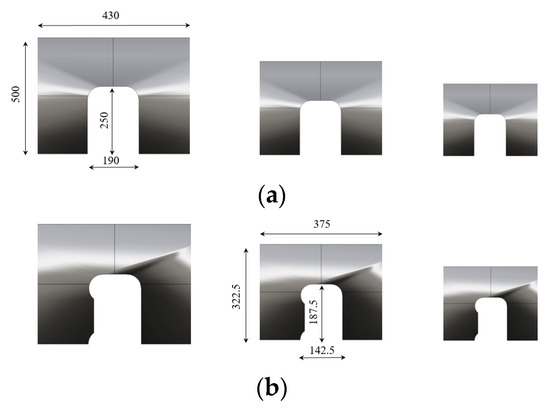
Figure 22.
Scaling process of the original submodel at unit scale factor (α) values, 0.75 and 0.5 (dimensions in mm). (a) Opening a, (b) opening b.
An arithmetic relationship is established between the geometric and load variables, allowing for the adjustment of the fatigue life of the original model and the experimentally tested model, which is not feasible in terms of size, obtained through a scaling factor α. The rationale behind this procedure is to enhance the level of reliability between the two models, enabling a high-level alignment of the experimental and numerical domains. The technique for obtaining results is characterized by an iterative process, starting with fatigue life data from the original model and yielding the following expression.
where F2 (with F2 < F1) represents the load required to be applied to the experimental model to achieve the same fatigue life as the numerical original model (F1). From this scenario, the concept is generalized to make the mathematical model valid for all three proposed geometries and independently applicable (Table 8). The bilogarithmic diagram arises as a direct consequence of manipulating the above expression, and with its derivation, the process is standardized by introducing additional scaling factors that establish the regression line defining the behavior and forming the fundamental relationship between variables with a high degree of reliability (Figure 23).
Table 8.
Iterative process of fatigue life equalization for each cut-out geometry and established scaling factor.
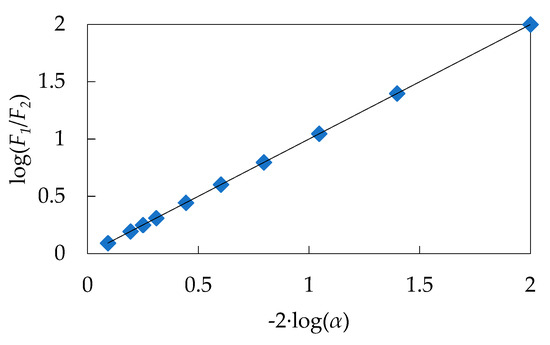
Figure 23.
Bilogarithmic diagram of the relationship between geometric and load variables.
In Figure 24, the stress distribution for each of the geometries defining the openings and each of the established scaling factors is observed.
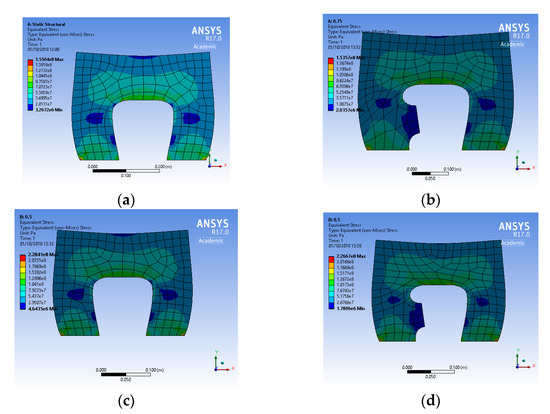
Figure 24.
Stress distribution. (a) Opening a and scale factor (α) 0.75, (b) opening b and scale factor (α) 0.75, (c) opening a and scale factor (α) 0.5, and (d) opening b and scale factor (α) 0.5.
6. Conclusions
The novel aspects of the research are focused on a comprehensive structural analysis to identify the optimal structural configuration in light of varying vessel dimensions. This paper investigates how modifications to the key dimensions impact the structural response of the vessel, shedding some light on the interplay between dimension changes and structural resilience. The study encompasses a comparative structural analysis aimed at evaluating how changes in the vessel’s key dimensions affect its structural response. This analysis offers crucial insights into the effects of structural modifications required to accommodate these changes effectively.
The stability analysis and structural assessment of various alternatives for the container vessel reveal critical insights. The V2 model, characterized by a larger transverse metacentric radius (BM) due to its wider beam, offers enhanced stability, making it the preferred choice for this application. V1, with its narrower beam, demonstrates the least favorable metacentric properties, emphasizing the significance of selecting an optimal structural alternative. Furthermore, the structural material composition shows V2 to have a higher quantity of steel, a result of its reduced moment of inertia, setting it apart from other versions and underscoring its suitability for the intended purpose.
Additionally, the examination of shear stress distribution pinpoints areas of maximum stress concentration, particularly along the shell side and double hull side. These findings hold considerable significance for vessel design, performance optimization, and safety enhancement in maritime operations. The study’s comprehensive insights not only contribute to the ongoing advancement of maritime engineering but also endorse the V2 model as the preferred choice, aligning it with the industry’s evolving demands for efficient and resilient container vessel design. In the context of structural analysis of the opening, an arithmetic relationship, facilitated by scaling factors, bridges the experimental and numerical models, yielding a standardized procedure with a high degree of reliability. This approach facilitates accurate and practical fatigue life determinations and demonstrates the effectiveness of scaled-down testing in achieving meaningful correlations with full-scale models.
Author Contributions
Conceptualization, A.S.-C. and F.P.-A.; methodology, A.S.-C. and F.P.-A.; software, A.S.-C.; validation, F.P.-A.; formal analysis, A.S.-C. and F.P.-A.; investigation, A.S.-C. and F.P.-A.; resources, A.S.-C.; data curation, F.P.-A.; writing—original draft preparation, A.S.-C.; writing—review and editing, F.P.-A.; visualization, A.S.-C. and F.P.-A.; supervision, F.P.-A.; project administration, A.S.-C. and F.P.-A. All authors have read and agreed to the published version of the manuscript.
Funding
This research received no external funding.
Institutional Review Board Statement
Not applicable.
Informed Consent Statement
Not applicable.
Data Availability Statement
The data presented in this study are available in article.
Acknowledgments
The authors would like to acknowledge the support received by the Universidad Politécnica de Madrid.
Conflicts of Interest
The authors declare no conflicts of interest.
References
- Drozhzhyn, O. Containership traffic optimization on feeder shipping line. Transp. Telecommun. 2016, 17, 314–317. [Google Scholar] [CrossRef]
- Paik, J.K.; Lee, D.H.; Noh, S.H.; Park, D.H.; Ringsberg, J.W. Full-scale collapse testing of a steel stiffened plate structure under cyclic axial-compressive loading. Structures 2020, 25, 996–1009. [Google Scholar] [CrossRef]
- Yi, M.S.; Lee, D.H.; Lee, H.H.; Paik, J.K. Direct measurements and numerical predictions of welding-induced initial deformations in a full-scale steel stiffened plate structure. Thin-Walled Struct. 2020, 153, 106786. [Google Scholar] [CrossRef]
- Bayraktar, M.; Yulksel, O.; Pamik, M. An evaluation of methanol engine utilization regarding economic and upcoming regulatory requirements for a container ship. Sustain. Prod. Consum. 2023, 39, 345–356. [Google Scholar] [CrossRef]
- Ban, D.; Bebic, J. An introduction of future fuels on working ship for GHGs reduction: Trailing suction hopper dredger case study. J. Clean. Prod. 2023, 405, 137008. [Google Scholar] [CrossRef]
- Li, C.; Wang, Z.; Liu, H.; Guo, F.; Xiu, X.; Qin, J.; Wei, L. 4E analysis of a novel proton exchange membrane fuel cell/engine based cogeneration system with methanol fuel for ship application. Energy 2023, 282, 128741. [Google Scholar] [CrossRef]
- Laura Maersk. 2023. Available online: https://en.wikipedia.org/wiki/Laura_Maersk_(2023) (accessed on 4 December 2023).
- Wang, Q.; Wang, C.; Wu, J.; Wang, D. Investigations on the torsional failure characteristics of the global hull girder with large deck openings. Ocean Eng. 2020, 128, 107007. [Google Scholar] [CrossRef]
- Paik, J.K.; Thayamballi, A.K.; Pedersen, P.T.; Park, Y.I. Ultimate strength of ship hulls under torsion. Ocean Eng. 2001, 28, 1097–1133. [Google Scholar] [CrossRef]
- Sun, H.H.; Soares, C.G. An experimental study of ultimate torsional strength of a ship type hull girder with a large deck opening. Mar. Struct. 2003, 16, 51–67. [Google Scholar] [CrossRef]
- Senjanovic, I.; Vladimir, N.; Tomic, M. Investigation of torsion, warping and distortion of large container ships. Ocean Syst. Eng. 2011, 1, 73–93. [Google Scholar] [CrossRef]
- Iijima, K.; Shigemi, R.; Miyake, R.; Kumano, A. A practical method for torsional strength assessment of container ship structures. Mar. Struct. 2004, 17, 355–384. [Google Scholar] [CrossRef]
- Wang, Q.; Wang, D. Ultimate strength envelope of a 10,000TEU large container ship subjected to combined loads: From compartment model to global hull girder. Ocean Eng. 2020, 213, 107767. [Google Scholar] [CrossRef]
- Silva-Campillo, A.; Herreros-Sierra, M.A.; Suárez-Bermejo, J.C. Optimum weight of the torsion box, in terms of fatigue life, of an ultra large container ship. In Trends in the Analysis and Design of Marine Structures; CRC Press: Boca Raton, FL, USA, 2019; pp. 183–187. [Google Scholar] [CrossRef]
- Villavicencio, R.; Zhang, S.; Tong, J. A study of cross deck effects on warping stresses in large container ships. Anal. Des. Mar. Struct. V 2015, 2015, 385–393. [Google Scholar] [CrossRef]
- Han, F.; Wang, C.; Hu, A. Numerical investigation of wave-induced vibrations and their effect on the fatigue damage of container ships. Ocean Eng. 2017, 142, 245–258. [Google Scholar] [CrossRef]
- Barhoumi, M.; Storhaug, G. Assessment of whipping and springing on a large container vessel. Int. J. Nav. Arch. Eng. 2014, 6, 442–458. [Google Scholar] [CrossRef]
- Storhaug, G. The measured contribution of whipping and springing on the fatigue and extreme loading of container vessels. Int. J. Nav. Arch. Eng. 2014, 6, 1096–1110. [Google Scholar] [CrossRef][Green Version]
- Kim, B.; Choung, J. A study on prediction of whipping effect of very large container ship considering multiple sea states. Int. J. Nav. Arch. Eng. 2020, 12, 387–398. [Google Scholar] [CrossRef]
- Ren, H.; Zhang, K.; Li, H. Research of Springing and Whipping Influence on Ultra-Large Containerships. J. Shanghai Jiaotong Univ. (Sci.) 2018, 23, 429–437. [Google Scholar] [CrossRef]
- Mao, W.; Ringsberg, J.W.; Rychlik, I. The effect of whipping/springing on fatigue damage and extreme response of ship structures. In Proceedings of the ASME 2010 29th International Conference on Offshore Mechanics and Artic Engineering, Shanghai, China, 6–11 June 2010; Volume 20124, pp. 123–131. [Google Scholar] [CrossRef]
- Hansen, P.F.; Winterstein, S.R. Fatigue Damage in the Side Shells of Ships. Mar. Struct. 1995, 8, 631–655. [Google Scholar] [CrossRef]
- Li, Z.; Ringsberg, J.W.; Storhaug, G. Time-domain fatigue assessment of ship side-shell structures. Int. J. Fatigue 2013, 55, 276–290. [Google Scholar] [CrossRef]
- Zamboni, G.; Scamardella, F.; Gualeni, P.; Canepa, E. Comparative analysis among different alternative fuels for ship propulsion in a well-to-wake perspective. Helyon 2024, 10, e26016. [Google Scholar] [CrossRef]
- Ringsberg, J.W.; Li, Z.; Tesanovic, A.; Knifsund, C. Linear and nonlinear FE analyses of a container vessel in harsh sea state. Ships Offshore Struct. 2015, 10, 20–30. [Google Scholar] [CrossRef]
- Fricke, W.; Lilienfeld-Toal, A.V.; Paetzold, H. Fatigue strength investigations of welded details of stiffened plate structures in steel ships. Int. J. Fatigue 2012, 34, 17–26. [Google Scholar] [CrossRef]
- Fricke, W.; Paetzold, H. Full-scale fatigue tests of ship structures to validate the S-N approaches for fatigue strength assessment. Mar. Struct. 2010, 23, 115–130. [Google Scholar] [CrossRef]
- Bu, S.; Zhang, P.; Liu, H.; Shi, Y.; Gu, M. Researches on the motion and flooding process of a damaged passenger ship in regular and irregular beam waves. Ocean Eng. 2023, 281, 114927. [Google Scholar] [CrossRef]
- Shama, M. Buckling of Ship Structures; Springer: Berlin/Heidelberg, Germany, 2013. [Google Scholar] [CrossRef]
- Available online: https://www.youtube.com/watch?v=7GddX6xkbeg&t=2868s (accessed on 1 October 2023).
- Kumar, S.; Aravind, H.; Hossiney, N. Digital image correlation (DIC) for measuring strain in brick masonry specimen using Ncorr open source 2D MATLAB program. Results Eng. 2019, 4, 1000061. [Google Scholar] [CrossRef]


Disclaimer/Publisher’s Note: The statements, opinions and data contained in all publications are solely those of the individual author(s) and contributor(s) and not of MDPI and/or the editor(s). MDPI and/or the editor(s) disclaim responsibility for any injury to people or property resulting from any ideas, methods, instructions or products referred to in the content. |
© 2024 by the authors. Licensee MDPI, Basel, Switzerland. This article is an open access article distributed under the terms and conditions of the Creative Commons Attribution (CC BY) license (https://creativecommons.org/licenses/by/4.0/).