Article

A Rapid Segmentation Method of Highway Surface Point Cloud Data Based on a Supervoxel and Improved Region Growing Algorithm

1
College of Surveying and Geo-Informatics, Shandong Jianzhu University, Jinan 250101, China
2
College of Ocean Science and Engineering, Shandong University of Science and Technology, Qingdao 266590, China
*
Author to whom correspondence should be addressed.
Appl. Sci. 2024, 14(7), 2852; https://doi.org/10.3390/app14072852
Submission received: 18 February 2024 / Revised: 23 March 2024 / Accepted: 26 March 2024 / Published: 28 March 2024

Abstract

:
Mobile laser scanning (MLS) systems have become an important technology for collecting and measuring road information for highway maintenance and reconstruction services. However, the efficient and accurate extraction of unstructured road surfaces from MLS point cloud data collected on highways is challenging. Specifically, the complex and unstructured characteristics of road surveying point cloud data lead to traditional 3D point cloud segmentation. When traditional 3D point cloud algorithms extract unstructured road surfaces, over-segmentation and under-segmentation often occur, which affects efficiency and accuracy. To solve these problems, this study introduces an enhanced road extraction method that integrates supervoxel and trajectory information into a traditional region growing algorithm. The method involves two main steps: first, a supervoxel data structure is applied to reconstruct the original MLS point cloud data, which diminishes the calculation time of the point cloud feature vector and accelerates the merging speed of a similar region; second, the trajectory information of the vehicle is used to optimize the seed selection strategy of the regio growing algorithm, which improves the accuracy of road surface extraction. Finally, two typical highway section tests (flat road and slope road) were conducted to validate the positioning performance of the proposed algorithm in an MLS point cloud. The results show that, compared with three kinds of traditional road surface segmentation algorithms, our method achieves an average extraction recall and precision of 99.1% and 96.0%, and by calculating the recall and precision, an F1 score of 97.5% can be obtained to evaluate the performance of the proposed method, for both datasets. Additionally, our method exhibits an average road surface extraction time that is 45.0%, 50.3%, and 55.8% faster than those of the other three automated segmentation algorithms.

Graphical Abstract

1. Introduction

Highways are used to realize rapid and timely interactions between multiple cities; alleviating the traffic congestion and other problems within a city brings great convenience to social production and residents’ living and gradually becomes the foundation and lifeline of national economic development [1]. High-quality highway road surfaces can greatly reduce the probability of traffic accidents, support economic development, and are considered the core elements in the construction of intelligent city applications, such as high-precision maps, high-precision navigation and positioning, intelligent transportation systems, etc. [2]. Road surveying is the basis work of road designing, construction, and maintenance, particularly for highways. The information and model of the road surface are the most important parts of this type of regular work. The effective acquisition of road surface 3D information, geometric parameters, and various technical indicators is quite important, especially for assessing the quality of highways, conducting road surface maintenance and repair, designing expansion projects, etc. [3]. Traditional road surveying methods, such as total station, GNSS-RTK, etc., usually involve a large amount of data calculation and processing before the collected information can be converted into digital records; therefore, they heavily rely on various professional testing equipment and on-site manual investigations. Moreover, these methods are inefficient, costly, disruptive, pose safety hazards for personnel, and even cause potential damage to road structures [4]. In addition, there is excessive manual intervention in the detection process, which makes it difficult to ensure the objectivity and accuracy of the evaluation results, and it is difficult to provide fast, efficient, and accurate data support for large-scale highway maintenance tasks. Therefore, there is an urgent need for fast and accurate measurement methods to replace traditional technologies and realize efficient and accurate 3D road information acquisition. With the emergence of laser scanning technology, three-dimensional (3D) terrain data of road networks can be captured accurately and quickly [5]. This new measurement method can significantly improve the efficiency and accuracy of road surface information collection, reduce traffic and personnel interference, and provide reliable data support for road maintenance and management tasks.
Mobile laser scanning (MLS) integrates multiple sensors, including a 3D laser, the Global Navigation Satellite System (GNSS), the inertial navigation system (INS), and panoramic cameras, into a mobile or airborne platform. This integration allows for the accurate and rapid acquisition of target information with features such as real-time capability, high precision, high density, non-contact operation, and automation [6]. Compared with traditional surveying methods, MLS offers significant efficiency and cost advantages. It has been widely applied in engineering surveying [7], intelligent driving [8,9], urban planning [10], mobile robots [11], digital city construction [12], and various other fields. The emergence of MLS has facilitated their extensive and effective use in road-related applications, such as the 3D geometric reconstruction of roads [13], road surface damage identification [14,15], road marking [16], and traffic sign extraction [17]. However, due to the complexity and richness of most road scenes, MLS data collection can result in datasets of up to 2 million points per second or approximately 62 GB/km [18]. Moreover, point cloud data often exhibit characteristics such as an uneven density distribution and strong non-structured patterns. Consequently, the accurate and efficient automated extraction of road surfaces from MLS data remains a significant challenge.

2. Related Work

Currently, methods for detecting road surfaces from MLS point clouds can be roughly divided into two categories: (1) extracting road surface point clouds based on the detected curbs as boundaries and (2) directly extracting road surface point clouds based on road surface geometric features.
In the first type, the extraction of road surface information is mainly based on the geometric constraints of the MLS point cloud, which first detects the edge of the road, and all points located within the edge of the road are extracted as road surface data. Yao et al. [19] proposed a boundary recognition algorithm based on scan lines to extract the road surface and detect the curb (or road boundary) by identifying sudden changes in slope or elevation. However, this method has some difficulties when the number of MLS scan lines changes or the quality of point cloud data is not high. Guan et al. [20] developed a method based on the slope and elevation to extract road curbs and surfaces. This method forms multiple cross-sectional profiles by connecting pairs of curb points to extract road edges. However, it cannot accurately extract the road edges with significant curvature changes. Wang et al. [21] proposed a method for curb extraction based on the local normal saliency. They partitioned the road into overlapping segments and extracted dense curb points from each segment. However, their experimental data were limited to flat urban roads, and owing to the influence of curved trajectory data, their method could not fully extract the road edges at T intersections. Cabo et al. [22] applied the concept of linear clouds to extract highway road surfaces automatically. However, to generate linear clouds from 3D data points, their method requires strictly ordered point cloud data based on timestamps.
The second method for extracting road surface information is mostly based on the statistical rules and semantic information of MLS point clouds. Balado et al. [23] proposed a method for extracting road surfaces from MLS point cloud data by combining topological and geometric information. However, their method is limited by the uneven and irregular terrain of the road surfaces. Miyazaki et al. [24] used a line-based region growing method to create road surfaces, assuming that most road surfaces are planar. Wu et al. [25] proposed a step-wise method for off-ground point removal. First, the raw point clouds were vertically partitioned along the trajectory of the vehicle. Subsequently the Random Sample Consensus (RANSAC) method was employed for ground point extraction by determining the average height of the ground points. Tran et al. [26] presented a voxel-based region growing method for automatic road surface extraction from mobile laser scanning point clouds in an expressway environment. However, these methods were designed for relatively flat and simple road scenes. When dealing with complex highways with large-scale data and significant elevation variations, these methods often suffer from low efficiency and poor robustness when extracting road surfaces from MLS data.
Furthermore, it is worth mentioning that in recent years, with the rapid development of deep learning and neural networks, many researchers have used them to study the semantic classification of point clouds [27]. Some image-based deep learning methods are used for point cloud classification, which mainly convert 3D point cloud data into 2D image data through projection or direct conversion, extract image features, and finally use the correlation between image data and point cloud data to complete the classification task. Such as Saovana et al. [28] proposed Point cloud Classification based on image-based Instance Segmentation (PCIS), to classify point clouds automatically; this method is based on two-dimensional digital images from a daily work basis. Su et al. [29] proposed a Multi-view Convolutional Neural Network (MVCNN) architecture to maximize the multi-view features of point clouds into global descriptors that can be used to identify 3D shapes to complete point cloud classification. Yang et al. [30] first used a network of relationships to leverage the interrelationships of a set of views (region–region relationship or view–view relationship) and then aggregated these views to classify point clouds. Moreover, there are other deep learning methods that use point-based strategies to directly perform semantic segmentation on a point cloud and process and manipulate the point cloud through the relationship between the kernel points and local points, defined in the point cloud, to realize the feature extraction and learning of point cloud data. Examples include Point Cloud Neural Networks (PointNet [31], PointNet++ [32]), Kernel Point Convolution (KPConv) [33], RandLA-Net [34], and Dynamic Graph Convolutional Neural Networks (DGCNNs) [35]. Most of these methods are point-based strategies that directly use point clouds for feature extraction and have achieved promising results in relatively straightforward and structured road extraction scenarios. However, while the accuracy has been improved, a deep learning-based method requires a large sample set and time for training, which reduces the efficiency of the road surface point cloud extraction [36]. Additionally, there is a lack of relevant datasets and experiments established for proving the effectiveness and robustness of these algorithms for the extraction of unstructured road surfaces in complex scenarios. Among these approaches, Gao et al. [37] proposed a deep learning framework for the extraction of off-highway drivable areas for the application of 3D point clouds in autonomous driving. To reduce the need for the manual labeling of data when the neural network processes data, they used weakly supervised or semi-supervised training methods and successfully improved the efficiency of the algorithm. However, the road boundary was not accurately segmented, and the robustness of the algorithm must be improved.
In summary, the above methods usually require the collection and processing of additional point cloud data information, such as the surface condition of the road, geometry of the road, point cloud density, reflection intensity of the laser, and GPS time. Owing to the large topographic fluctuations in China, the longitudinal elevation of an expressway changes significantly. Therefore, the previously used method was not applicable. To overcome these limitations, a new method is proposed that combines a supervoxel model, vehicle trajectory data, and region growing segmentation technology to improve the robustness and efficiency of highway road surface extraction.
This study proposes a road surface extraction method based on a supervoxel-assisted region growing algorithm to solve the aforementioned challenges, reduce data processing complexity, and efficiently and accurately extract road surfaces from highway MLS point cloud data. This method combines the supervoxel data model with region growing segmentation to accelerate road surface extraction and optimize the quality and precision of road extraction results. Subsequently, the proposed method was experimentally validated using measured data from two typical highway scenarios: flat and sloped. The results are compared with the extraction results of three other traditional segmentation algorithms: Euclidean clustering, Random Sample Consensus (RANSAC), and traditional region growing algorithms.
The remainder of this study is structured as follows. Section 2 provides an overview of the work related on road surface extraction with MLS point clouds. Section 3 describes the proposed method for extracting road surfaces in detail. Section 4 describes the parameterization and analysis of the proposed method. The results of the experiment and related discussions are presented in Section 5. Section 6 concludes the study with a summary of the findings.

3. Materials and Methods

This method begins by utilizing the octree data structure to perform supervoxel over-segmentation, and then reorganizes the original vehicle-mounted laser point cloud, and transforms the processing from point-based to supervoxel-based. Next, within the supervoxel segmented regions, the MLS trajectory data are used to extract the required seed supervoxel for the region growing algorithm. The region growing algorithm then utilizes constraints based on residuals, slopes, and curvatures to extract road surface point clouds. Finally, the Alpha Shape algorithm was employed for the boundary extraction and optimization of the extracted road point cloud.
This method can be summarized in the following three main steps: (1) building a supervoxel model for point cloud data, (2) the extraction of road surfaces using an improved region growing segmentation algorithm, and (3) optimizing road boundaries using an Alpha Shape algorithm [38]. The overall technical process is illustrated in Figure 1.

3.1. Data Denoising Based on Statistical Analysis

Due to the sensor and the complexity of the acquisition environment, MLS point clouds inevitably have some noise. This can have a very large impact on the calculation of the characteristics of local points, such as the calculation of surface normals or curvature changes and can produce many unforeseen errors. Therefore, it is necessary to preprocess the original point cloud before road surfaces extraction to remove obvious outliers and noise values to then improve the efficiency and accuracy of the data processing. In this study, a statistical filtering method [39] was used to achieve this purpose. A statistical analysis was carried out on the neighborhood of each point in the collected original point cloud data, and the distances between each point and their mean μ ( μ = 1 n i = 1 i D i ) and standard deviation σ ( σ = 1 n i = 1 i ( D i μ ) 2 ) were calculated; the standard deviation multiple is s t d . Only two thresholds, m and s t d , need to be input in the algorithm implementation process. When the average distance of a point near the m point is within the standard range ( μ σ · s t d , μ + σ · s t d ) , the point is retained, and the point is defined as an outlier point if it is not within the range. Figure 2 shows the results of removing large-scale noise and outliers, and it can be seen that statistical filtering has a good effect on removing large-scale noise points. After removing noise and outliers, there are still some unrelated points in the point cloud (such as moving objects), which significantly affect the voxel-based region growing algorithm. Therefore, these were further removed in this study using CloudCompare [40] software (Version 2.13).

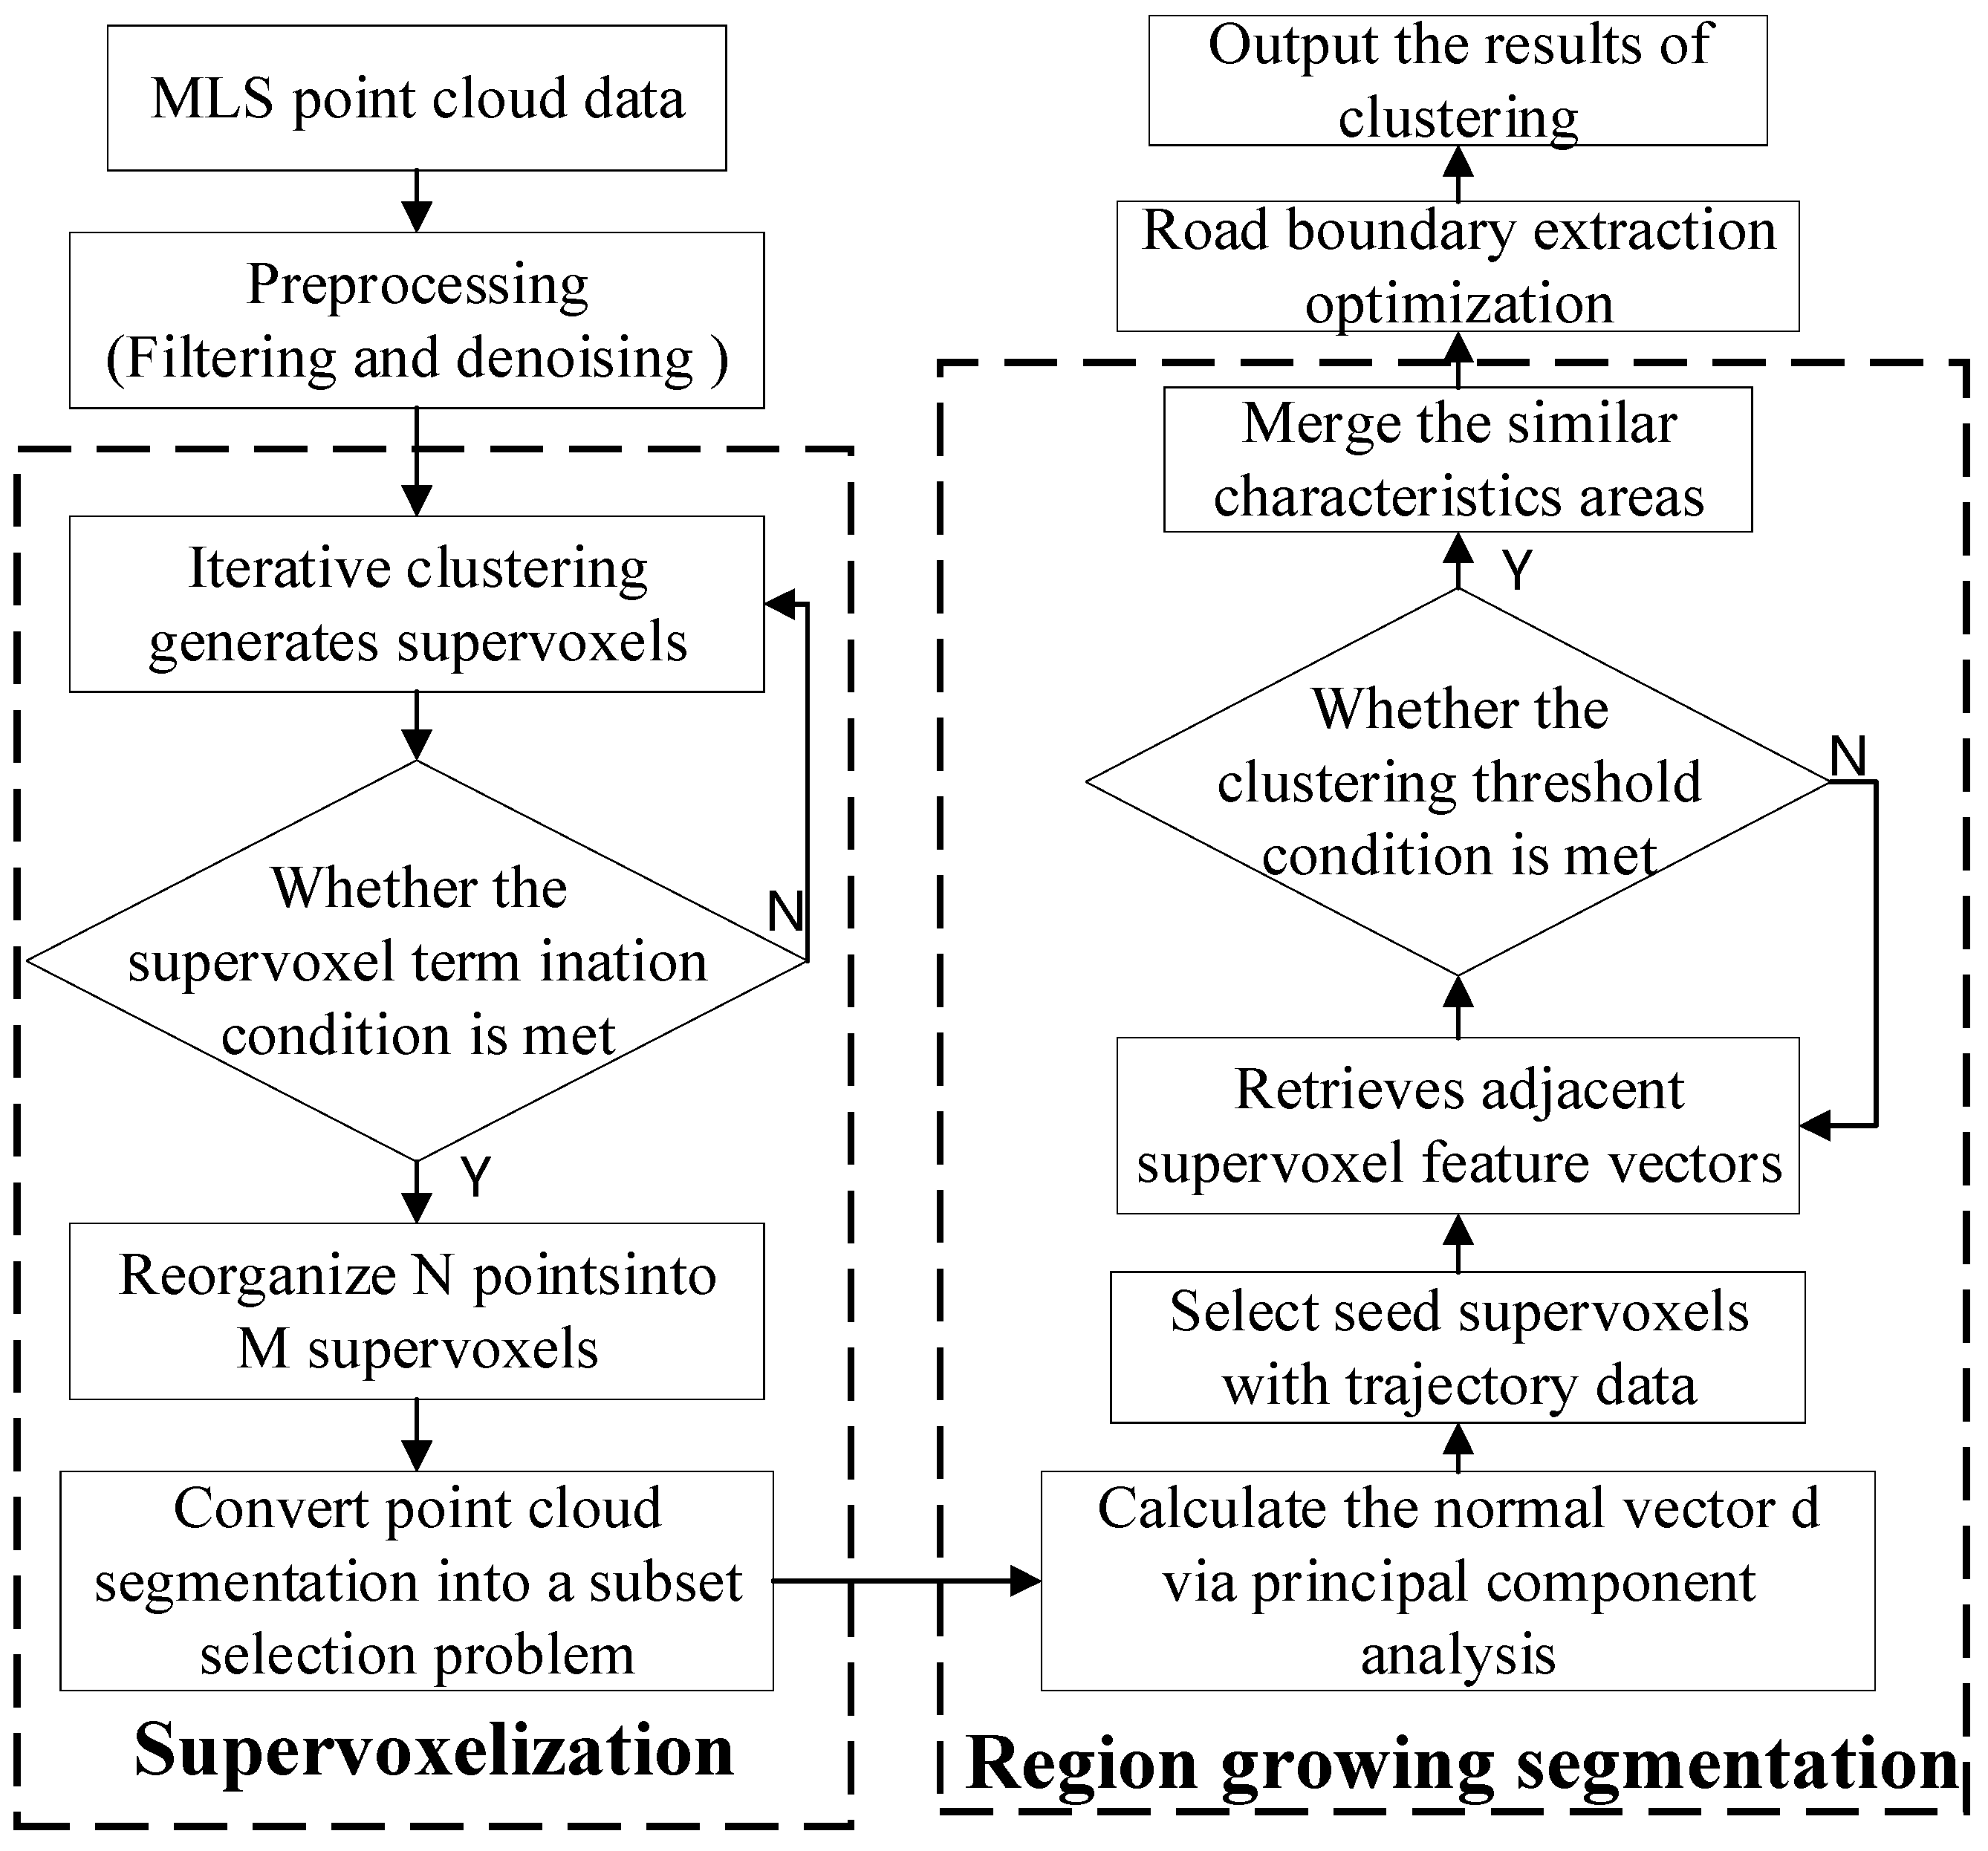
3.2. Supervoxel Model Construction

Supervoxelization: Original MLS point clouds collected using onboard LiDAR systems are often noisy and unorganized. The amount of data and the density of the point cloud data are reduced by reorganizing the original MLS point cloud into supervoxels, thereby reducing computational time and storage costs while improving processing efficiency. Supervoxels represent a collection of points designed to segment a point cloud into 3D models with a certain level of connectivity and semantic consistency [41]. In this study, we used the boundary-enhanced supervoxel segmentation algorithm proposed by Lin et al. [42] to process the original MLS point cloud. This algorithm considers local information and accurately reflects the boundary characteristics of objective objects during the transformation of a point cloud dataset into supervoxel sets. The supervoxelization results for the MLS point data are shown in Figure 3. Supervoxelization converts 3D discrete point information into clustered information with defined geometric and spatial features, providing the foundation for accurate and comprehensive road surface and road boundary extraction in subsequent steps.

3.3. Improved Region Growing Algorithm Based on Vehicle Trajectory Information

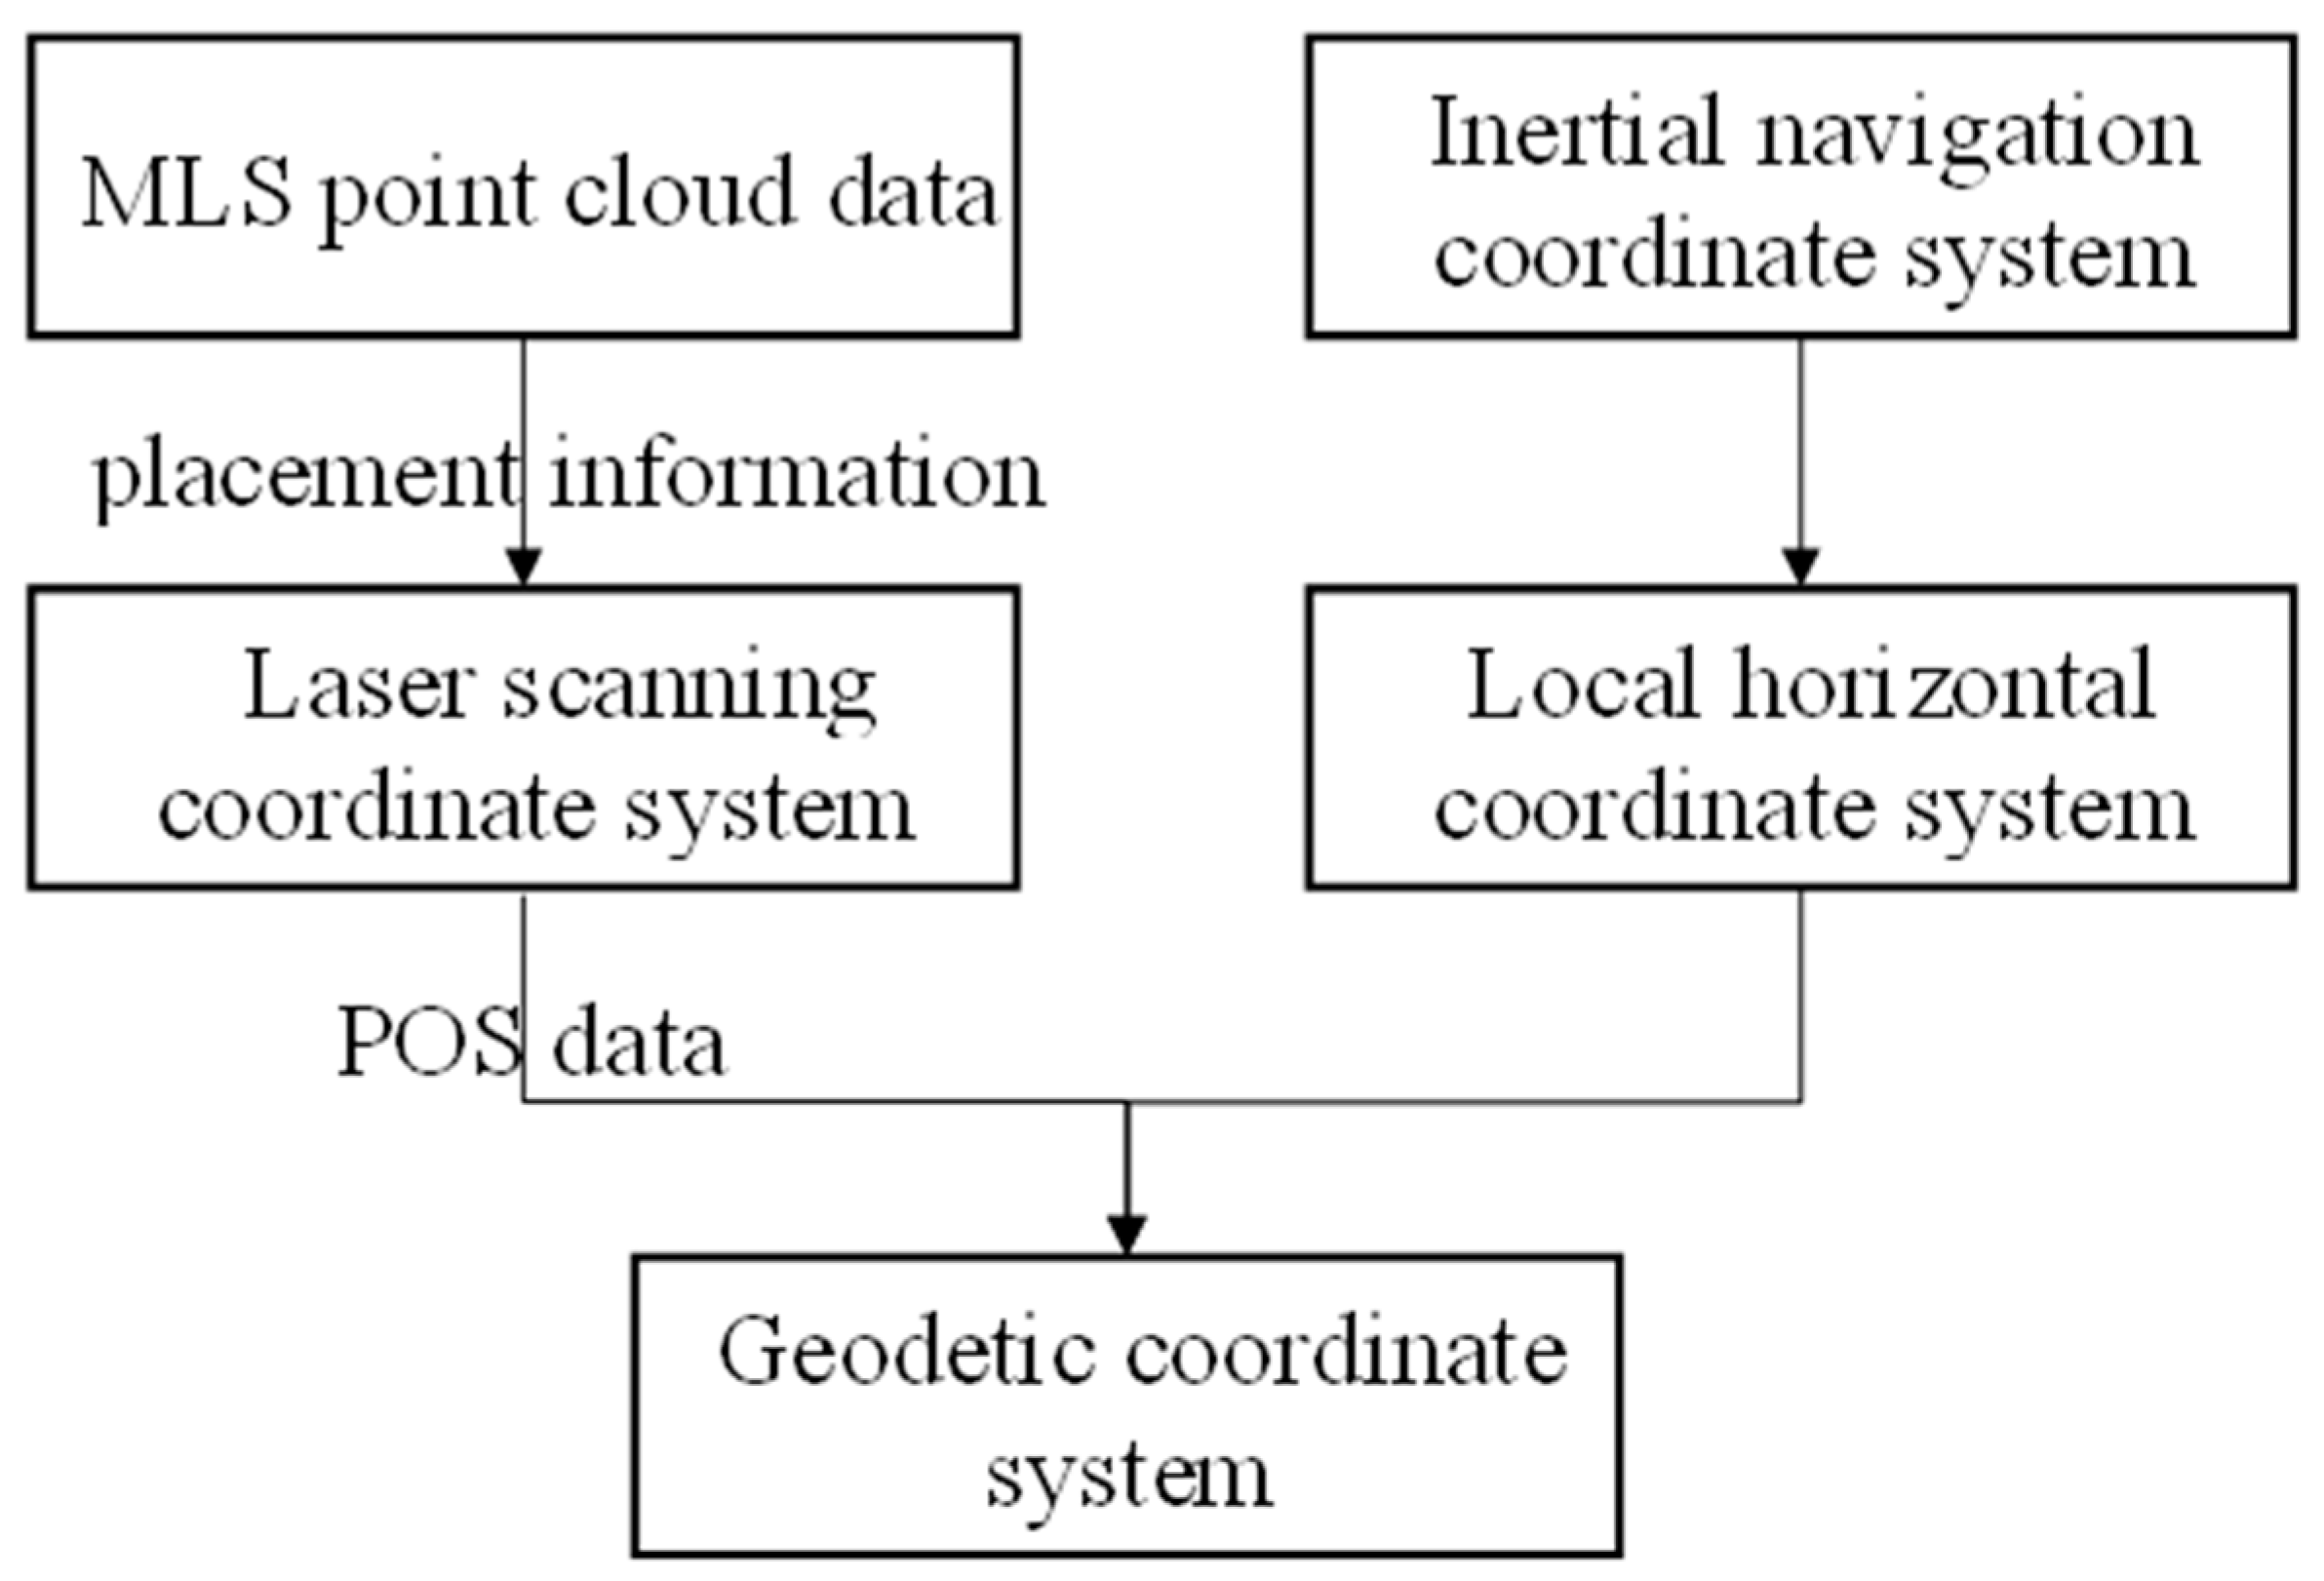
3.3.1. Trajectory Data Calculation

The point cloud data collected using the mobile laser scanning system, with coordinates in the laser scanner coordinate system, are referred to as the laser scanning data. The data obtained from the GNSS/IMU (Global Navigation Satellite System/Inertial Measurement Unit) integrated navigation system is referred to as POS (Position and Orientation System) data. This study aimed to fuse laser scanning and POS data through a data processing process to obtain coordinates in the Earth coordinate system. The specific process was as follows. First, the differential positioning GNSS data were processed using a Kalman filter to obtain the position and velocity information of the vehicle platform. Subsequently, by combining the pose information from the IMU data, the navigation positioning error was solved, and the error was input into the inertial navigation system to obtain the final position and attitude information. Finally, after completing the POS data computation, the obtained position and attitude information, along with the calibration information of the laser scanner placement, were used to transform the point cloud coordinates into the Earth coordinate system, and then the high-precision MLS trajectory data could be obtained. The specific process is illustrated in Figure 4.

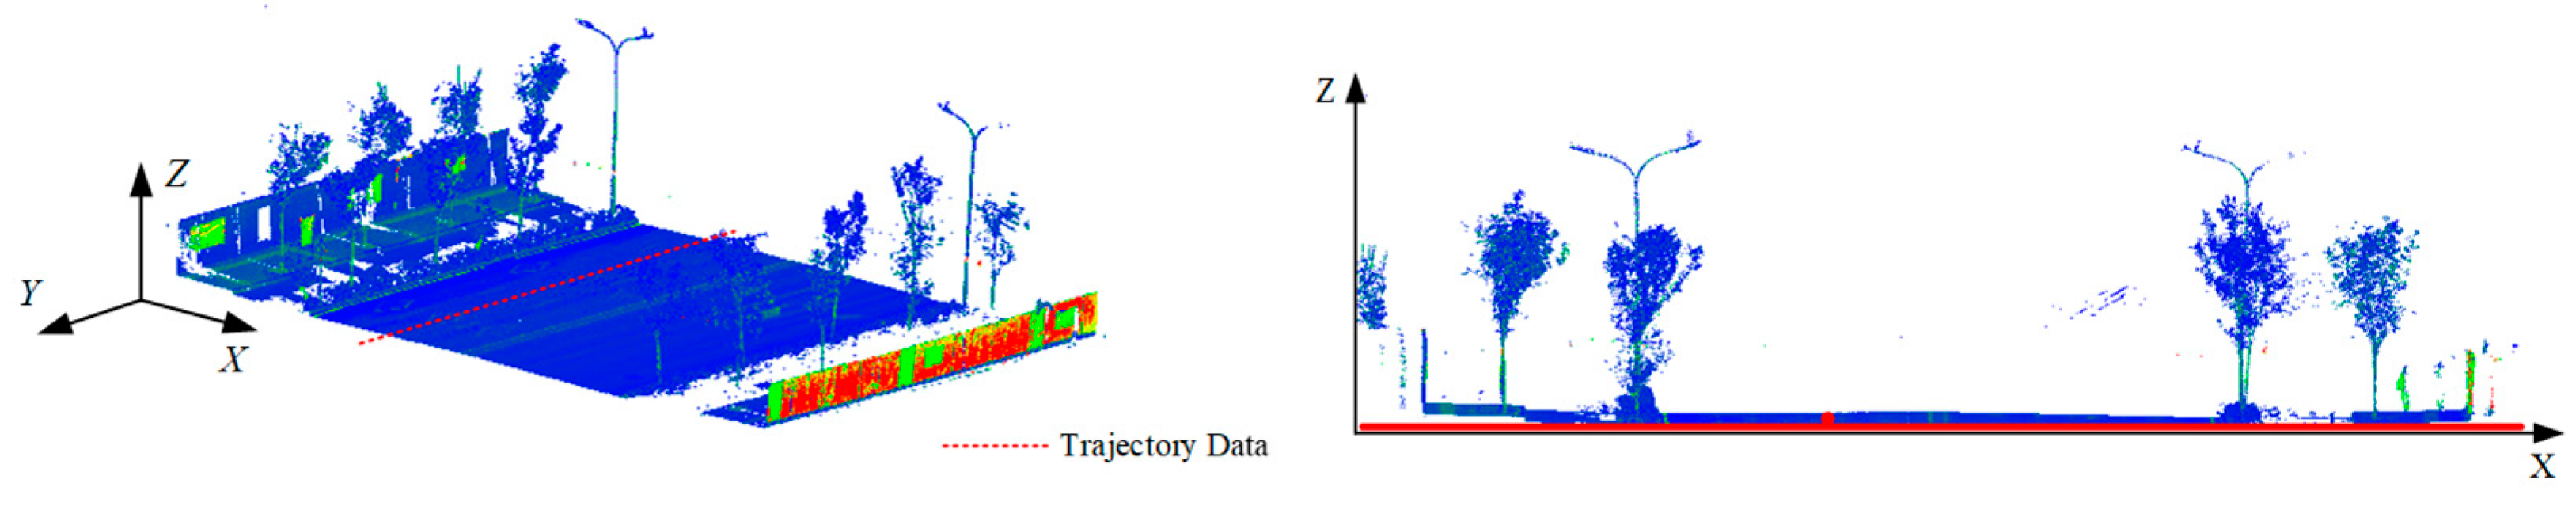
3.3.2. Seed Supervoxel Selection

The improved seed selection method was used to extract seed supervoxels ( S s e e d ) from the supervoxel dataset, which are complete supervoxels on the road surface. The selection of seed points is a crucial step in region growing algorithms. The region growing algorithm segments the point cloud by continuously expanding outward from the selected initial seed points based on the given criteria. The positions of the seed points directly affect the quality of the segmentation results. In this study, the trajectory of the vehicle during data collection using a mobile laser scanning system was utilized to extract seed supervoxels from the road point cloud data after supervoxel segmentation. However, it should be noted that the trajectory data collected using the mobile laser scanning system are not necessarily exactly at the center of the road. Therefore, it was necessary to calculate the curvature residual for the extracted candidate seed supervoxels and perform filtering to select the most suitable seed supervoxels for region growing segmentation. If a seed supervoxel S 0 is surrounded by neighboring supervoxels ( S i and S j ) belonging to the same segmentation region and the curvature of S 0 is smaller than that of S i and S j , then S 0 is more likely to be chosen as the center of the cluster for the region growing algorithm.
The specific process of extracting seed supervoxels is as follows:
  • The vehicle’s trajectory data and the 3D coordinates of the point cloud are projected onto a 2D plane (XOY) to determine the candidate seed supervoxel dataset { S Δ }, as shown in Figure 5.
  • The supervoxel with the largest number of points and located in the vehicle trajectory data is selected as the seed supervoxel.

3.3.3. Region Growing

The region growing segmentation method was employed using supervoxels as the basic elements to extract the road surface point cloud. First, the geometric features and surface characteristics were computed for each complete supervoxel, including normal vectors and residuals. Because the complete road surface is the target of the segmentation algorithm in this study, each supervoxel was assumed to represent a small patch of the road surface, and all points within each complete supervoxel should approximately lie on a flat plane. The normal vectors of each supervoxel were computed using Principal Component Analysis (PCA) [43]. The normal vector is determined using the eigenvector corresponding to the smallest eigenvalue of the covariance matrix, M , as shown in Equation (1):
M = 1 k i = 1 n ( p i p ¯ ) ( p i p ¯ ) T
where k is the number of points within the supervoxel, and p ¯ = i = 1 n p i m is the center point p i = ( x i , y i , z i ) of the supervoxel, also considered the centroid of the supervoxel.
The residual is defined as the root mean square of the perpendicular distance from each point to the fitted surface, as shown in Equation (2):
r = i = 1 m d i 2 n
d i = A x i + B y i + C z i + D A 2 + B 2 + C 2
where d i is the orthogonal distance from each point p i to the fitted plane, which is defined by the normal vector N i = ( A , B , C ) and centroid. D is a constant that represents the intercept of the fitting plane.
Finally, the supervoxel dataset was iteratively clustered using the input threshold values as constraints to complete the extraction of the road surface. During the extraction process, as the road surface is typically smooth and continuous, starting from the first extracted seed supervoxel, its adjacent supervoxels can be included in the current region if they satisfy three conditions: ① deviation of the normal vectors, ② residual, and ③ slope, as shown in Equation (4):
ρ = z S i z S j x S i x S j 2 + y S i y S j × 100 %
where z S i and z S j is the elevation of adjacent supervoxels S i and S j .

3.4. Road Boundary Optimization Based on Alpha Shape Algorithm

The road surface point cloud is generally extracted after the previous steps. However, owing to the unstructured nature of point cloud data, some of the extracted road boundary points may be sparse and discontinuous. Additionally, occlusions caused by obstacles, such as vehicles, during data acquisition can lead to interruptions in the road boundary, making it necessary to determine continuous road edges. To achieve a complete extraction of the road surface point cloud, this study employed an edge extraction algorithm based on the characteristics of the road boundary points in highway scenarios. The goal was to extract the road contours and then generate smooth boundaries through curve fitting.
  • After applying the region growing segmentation algorithm to the MLS point cloud, there may still be some scattered points or fragments other than road points. These points were traversed and removed based on the point threshold after clustering.
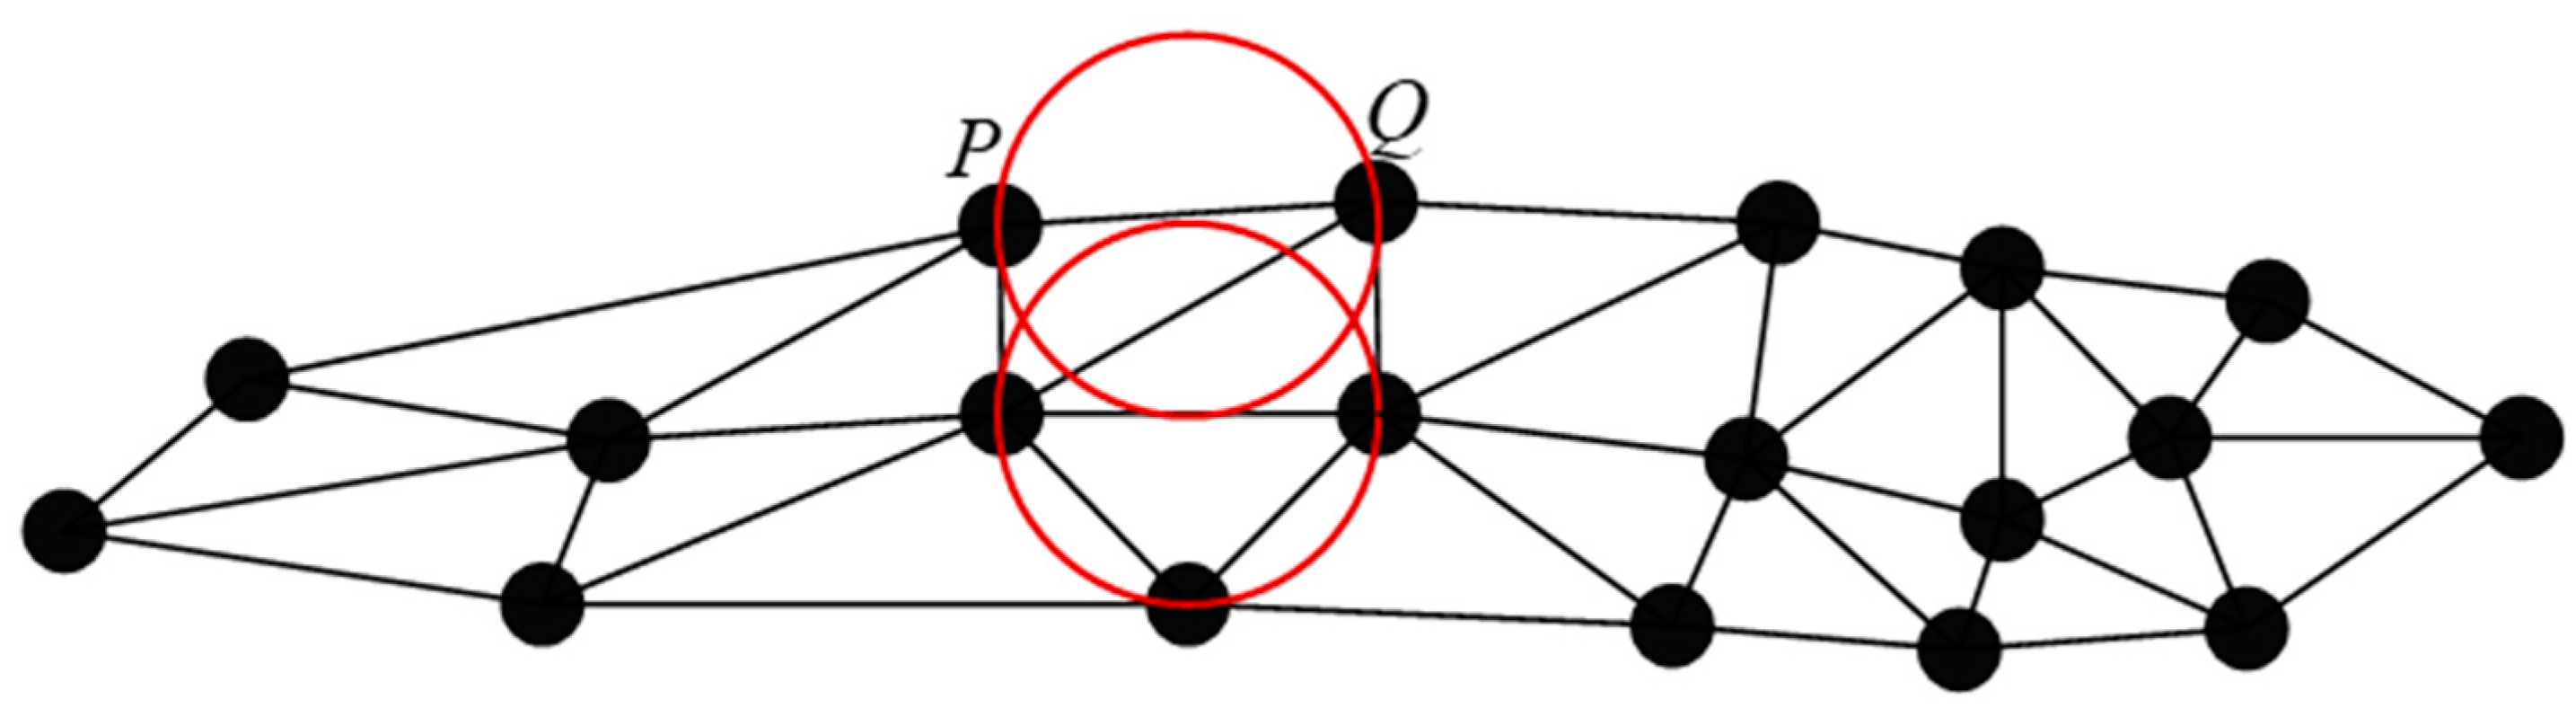
  • The Alpha Shape algorithm was used for boundary extraction because it has good shape retention and a faster calculation speed when extracting point cloud road boundaries, and can realize a flexible description and a fast extraction and analysis of point set geometry [37]. The point cloud was projected onto the X O Y plane, and delay triangulation was performed on the projected points. For any edge of the triangulation with endpoints P and Q , two circles were drawn with O 1 and O 2 as the centers and radius of α . The coordinates of O 1 and O 2 are shown in Equations (5) and (6), respectively:
    X O 1 , O 2 = x p + x q 2 ± α 2 a 2 2 2 y p y p 2
    Y O 1 , O 2 = y p + y q 2 ± α 2 a 2 2 2 x p x p 2
    where a is the vector composed of endpoints P and Q ; α is the radius of circle; x p and y p are the horizontal and vertical coordinates of the P point; and x q and y q are the transverse and vertical coordinates of point Q . As shown in Figure 6, if at least one of the circles does not contain any points from the point set, then the endpoints of that edge are determined to be boundary points.
  • After extracting the road contours, it was necessary to perform a smoothing process on the road boundaries. B-spline curves are a type of curve based on polynomial equations that possess strong adaptability, where local point variations do not significantly affect the overall shape of the boundary. They can effectively preserve the local features of the road boundaries. Therefore, B-spline curves were adopted for smoothing [44].

3.5. Experimental Dataset

The MLS point cloud data used in this experiment were sourced from the research project “Intelligent Extraction of Structured Features of Highway Surfaces Based on Mobile Measurement Systems (2022KY09)” conducted by the Sixth Geological Brigade of the Jiangsu Geological and Mineral Bureau. The data pertain to the G25 expressway section from Lianyungang to Huai’an, with a mainline length of approximately 39.58 km. The data included information about roads, fences, trees, power lines, low vegetation, vehicles, and traffic signs, among other features. To validate the robustness and processing efficiency of the proposed method, we selected two typical scenarios from these data: a flat road section and a sloped road section, both of which were approximately 300 m (Figure 7). These datasets were used for the comparative analysis in this study.
The data collection equipment used was a mobile laser scanning system that we assembled ourselves based on the Huace AS-1300H measurement platform that we purchased (Huace, Hangzhou, China). The system is shown in Figure 8. The parameters of the laser scanning system and inertial navigation system are listed in Table 1 and Table 2, respectively.
The algorithm adopted in this study was independently developed and implemented based on C++, and the experimental environment is shown in Table 3.

4. Parameter Setting and Analysis

To evaluate the accuracy of the proposed method, the obtained extraction results were compared with manually extracted road surface results, and the following three metrics (Equations (7)–(9)) were introduced to assess the quality of the extraction results:
Recall = T P T P + F N × 100 %
Precision = T P T P + F P × 100 %
F 1 = 2 × Recall × Precision Recall + Precision × 100 %
where T P is the number of correctly detected road surface points; F N is the number of road surface points that were not detected; and F P represents the number of incorrectly detected road surface points.

4.1. Supervoxel Resolution

Supervoxel resolution refers to the spatial resolution used in the process of supervoxel segmentation to divide a point cloud into supervoxels. Generally, a higher supervoxel resolution can provide more accurate detailed information, but it also increases the computational burden and storage requirements. In the context of processing highway point cloud data acquired using a mobile laser scanning system, the common range for supervoxel resolution is typically between 0.1 and 0.5 m. In this chapter, we describe and discuss the series of experiments conducted to select the appropriate supervoxel resolution size.
Based on the results shown in Figure 9, we observed that on flat roads, there was no significant difference in the segmentation accuracy when the supervoxel resolution size increased from 0.1 m to 0.2 m. However, when the supervoxel size exceeded 0.2 m, the segmentation accuracy significantly decreased. For instance, with a voxel size of 0.3 m, the recall rate and F1 score decreased significantly to 94.3% and 94.9%, respectively (as shown in Figure 9a). This decrease in accuracy was attributed to the inclusion of a large number of non-road point clouds because of the choice of a larger supervoxel resolution size. Additionally, for sloped road surfaces, a larger supervoxel resolution size resulted in lower accuracy.
Furthermore, Figure 10 illustrates the computational time for different supervoxel resolution sizes in the two experimental scenarios. As shown in figure, compared to using a 0.1 m supervoxel resolution model, the processing time was significantly reduced when using a 0.2 m or 0.3 m supervoxel resolution model. For both scenes, the computational time with a 0.2 m supervoxel resolution was 3–4 times faster than that with a 0.1 m supervoxel resolution, while the accuracy did not significantly change.
Taking both accuracy and processing efficiency into consideration, we selected 0.2 m as the supervoxel resolution size for our research.

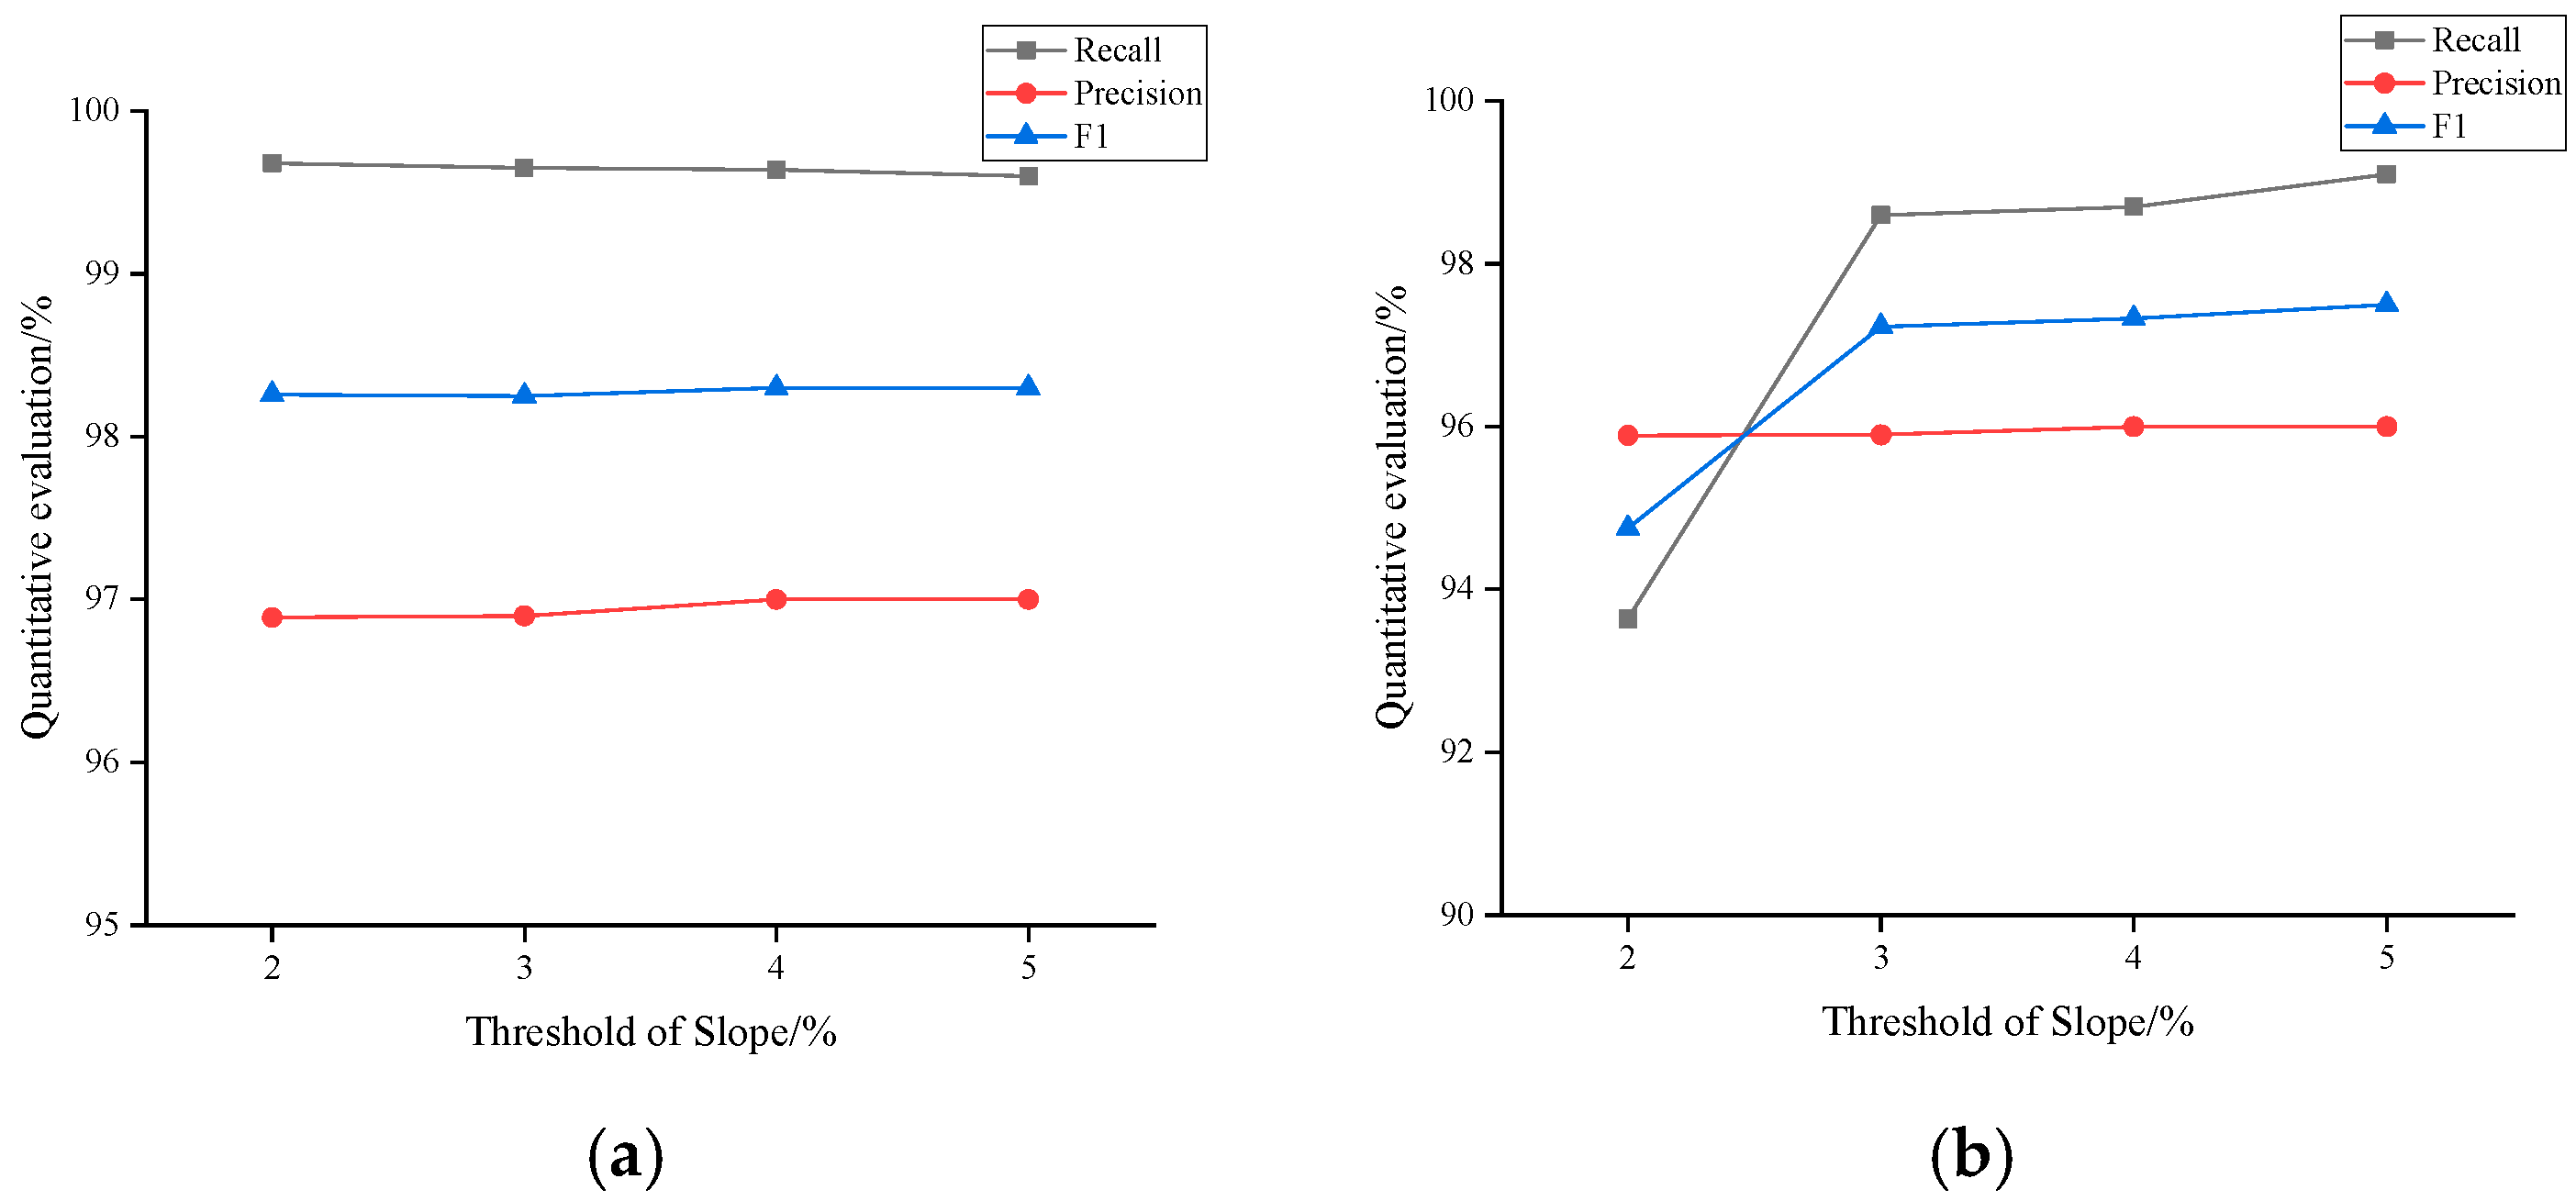
4.2. Slope Threshold

The slope threshold was determined based on the maximum values of the road’s cross and longitudinal slopes. Typically, highway cross slopes range from 2.5% to 4%; therefore, this study focused on four different slope threshold values. From Figure 11a, it can be observed that the slope threshold has a minimal impact on the accuracy of flat road surfaces. Similar results were obtained for sloped road surfaces when the slope threshold exceeded 2.5% (Figure 11b). However, the accuracy is poor when the slope threshold is 2% because of the excessively large longitudinal slopes, causing some road points to not be accurately identified. Therefore, to satisfy the threshold requirements for both experimental scenarios, in this study, 5% was chosen.

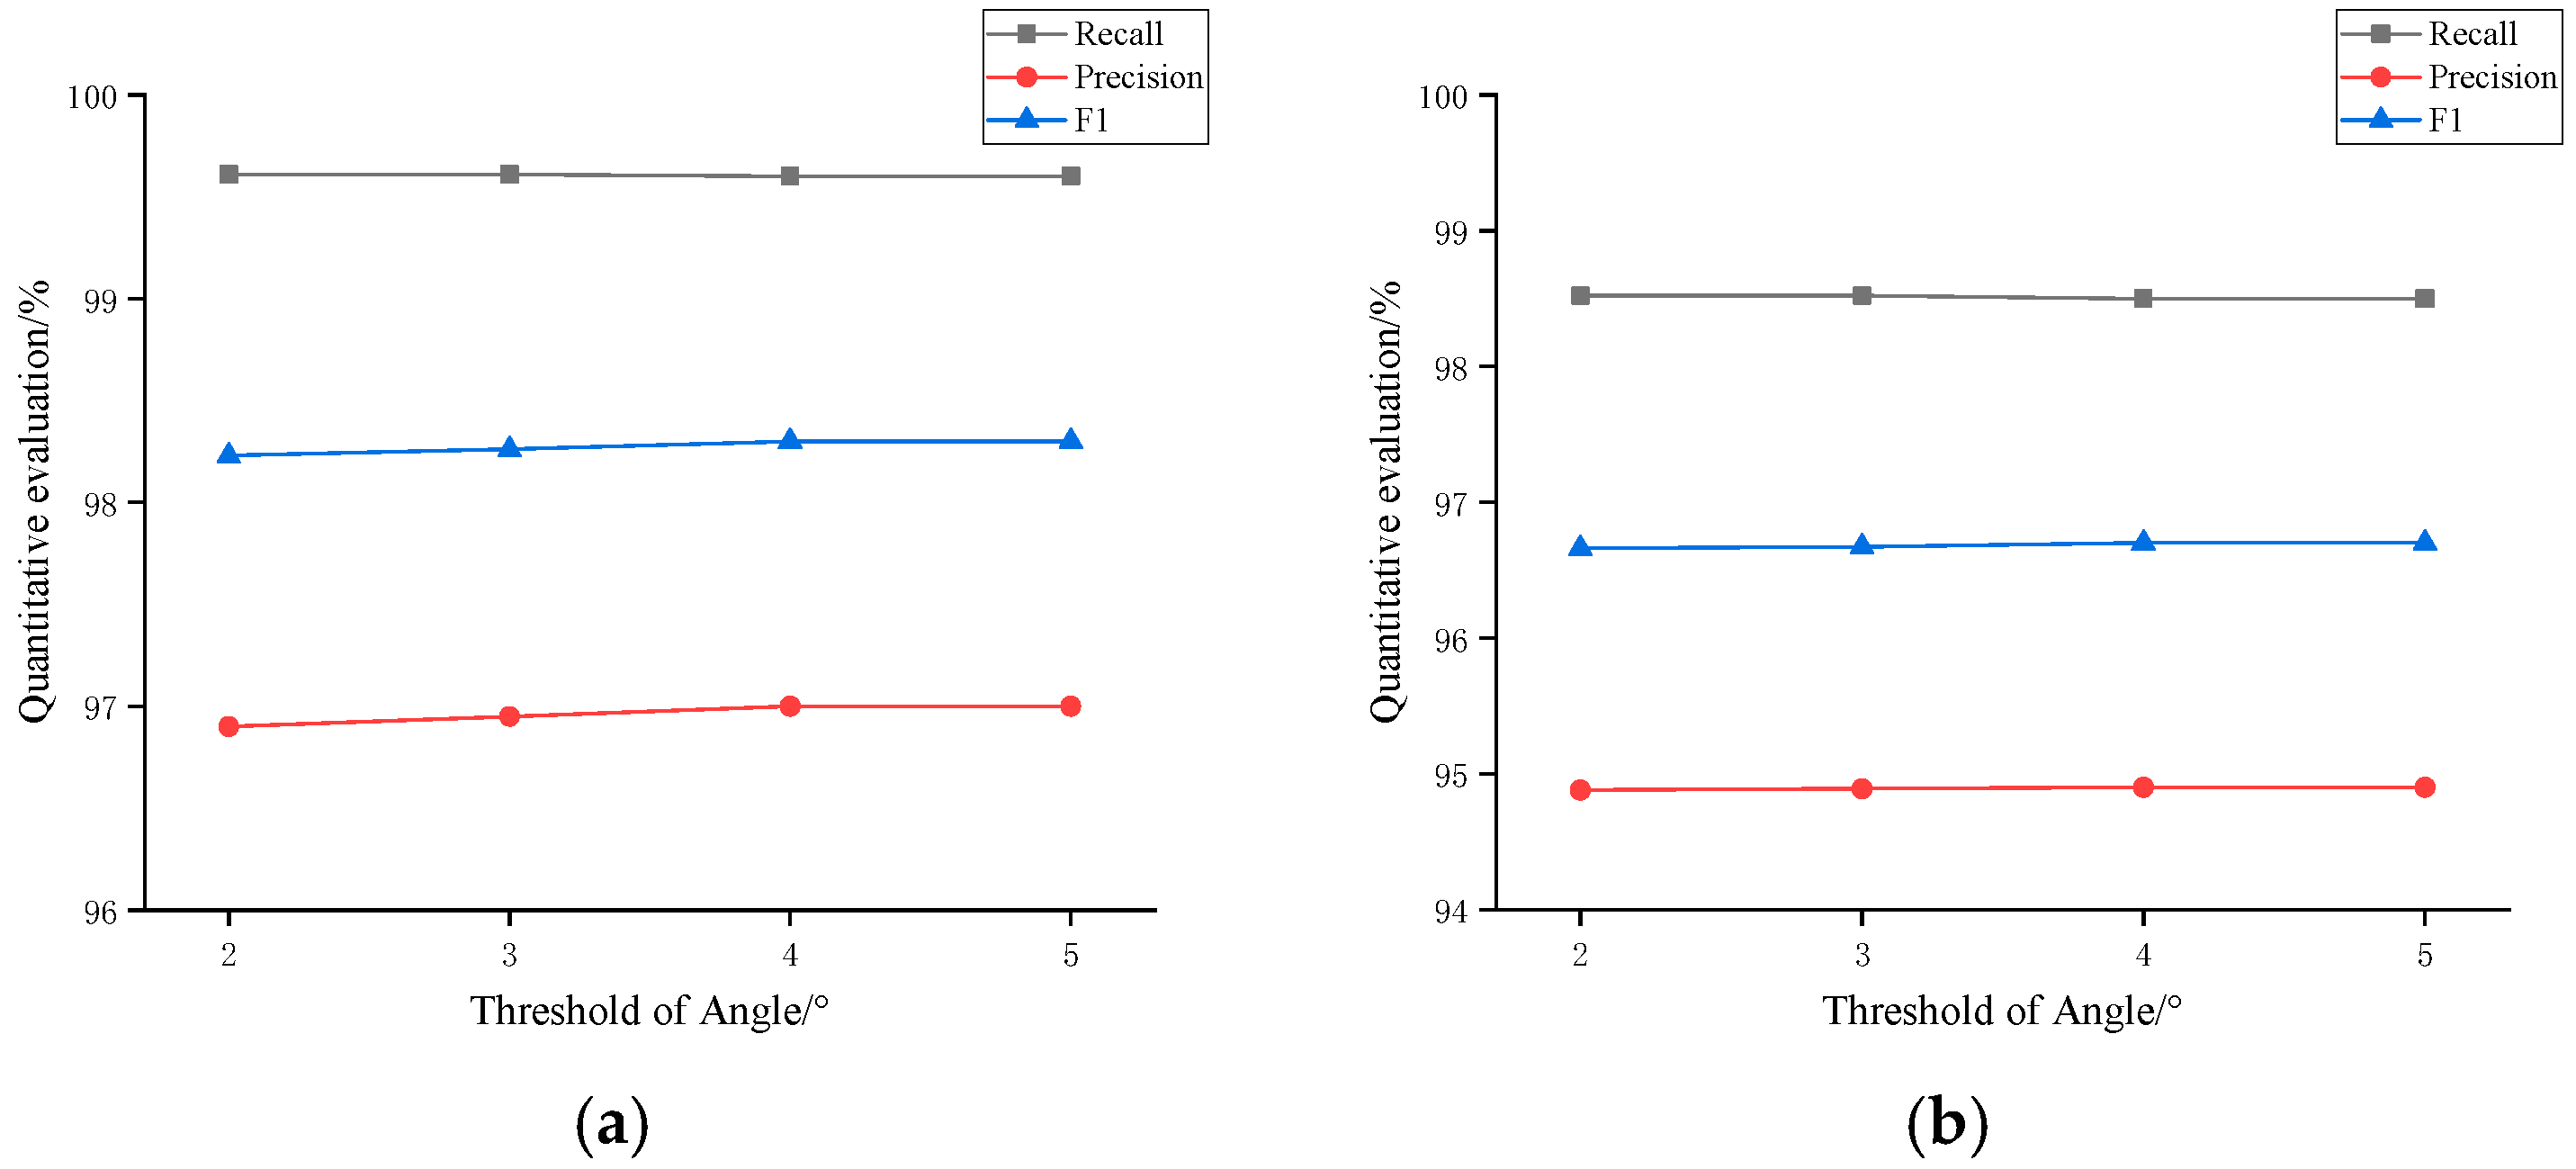
4.3. Angle Threshold

Selecting an appropriate angle threshold is a crucial step in the region growing segmentation of highway road surface point clouds. In this study, the angle threshold was determined based on two adjacent supervoxels, denoted as S i and S j , respectively. First, the normal vectors N i and N j between supervoxels S i and S j were computed using Principal Component Analysis (PCA). Then, the angle ( arccos ( N i · N j ) × 180 π ) between these two normal vectors was calculated to check whether it satisfied the angle threshold requirement. If the angle was less than or equal to the angle threshold, the two supervoxels were merged into the same region. Otherwise, if the angle was greater than the angle threshold, this indicates that they did not belong to the same region, and the calculation continued with other neighboring supervoxels.
There are two main cases of adjacent supervoxels on highway road surfaces. In one case, both supervoxels are on the same side of the road, resulting in a small angle or even an angle close to zero between their normal vectors. The other case occurs when the two supervoxels are on opposite sides of the road center. In this study, we conducted multiple experiments and adjustments to the angle threshold to select an appropriate value that met the segmentation requirements.
From Figure 12a, it can be observed that when the angle threshold varies from 2° to 5°, there is a slight variation in the accuracy for Site 1. This is because, with a smaller angle threshold, the segmentation precision improves in terms of details, but it may also lead to over-segmentation and noise generation. Similar results were obtained at Site 2 (Figure 12b).

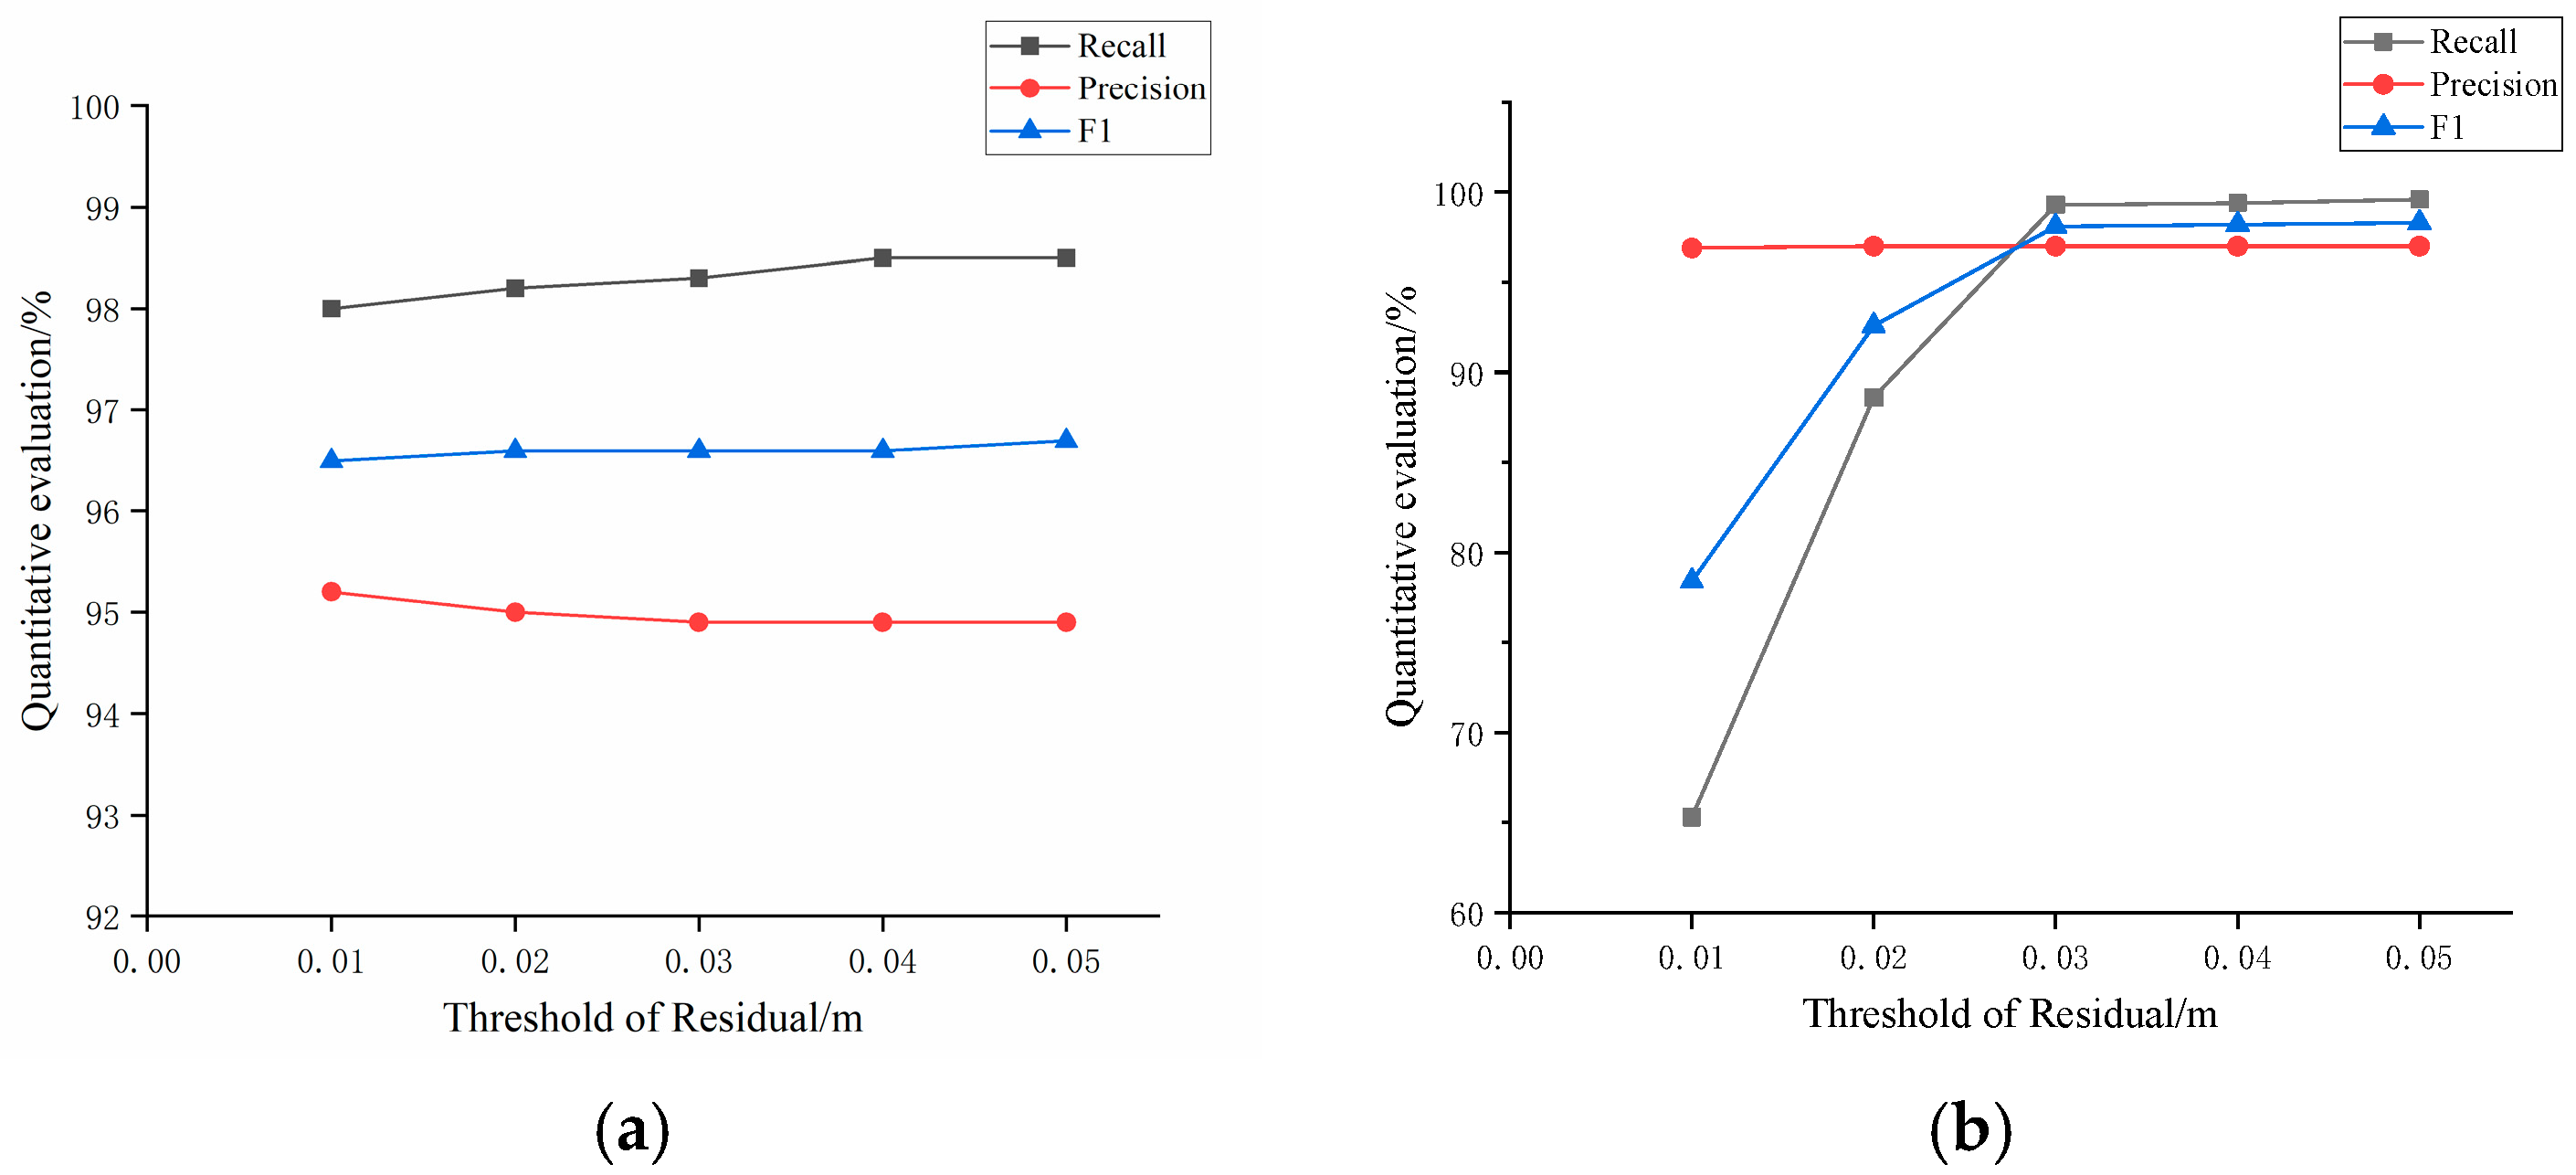
4.4. Residual Threshold

Experimentation and adjustments are commonly used to determine the residual thresholds. The residual threshold was calculated based on the noise level of the road surface sample data. To estimate this threshold, we randomly selected 50 representative supervoxels that represented the road surface. The noise level in each supervoxel was the square root of the variance in the orthogonal distances from all points within the supervoxels to the fitting plane.
In this study, we used different residual thresholds for the region growing segmentation and observed the segmentation results. From Figure 13a, it can be observed that for Site 1, the change in accuracy was not significant when the residual varies from 0.01 to 0.05 m. This is because Site 1 data points have a relatively low noise level. For the slope road surface (Figure 13b), there is no difference in accuracy when the residual threshold increases from 0.03 to 0.05 m. However, when the residual threshold decreases from 0.03 m to 0.01 m, the accuracy significantly decreases. This lower accuracy is due to the higher noise level in Site 2 data. After experimenting and discussing different residual thresholds, we finally selected 0.05 m as the residual threshold for this study.
Finally, the thresholds and input parameters of the road surfaces of the flat and sloped road datasets were extracted experimentally, as shown in Table 4.

5. Results and Discussion
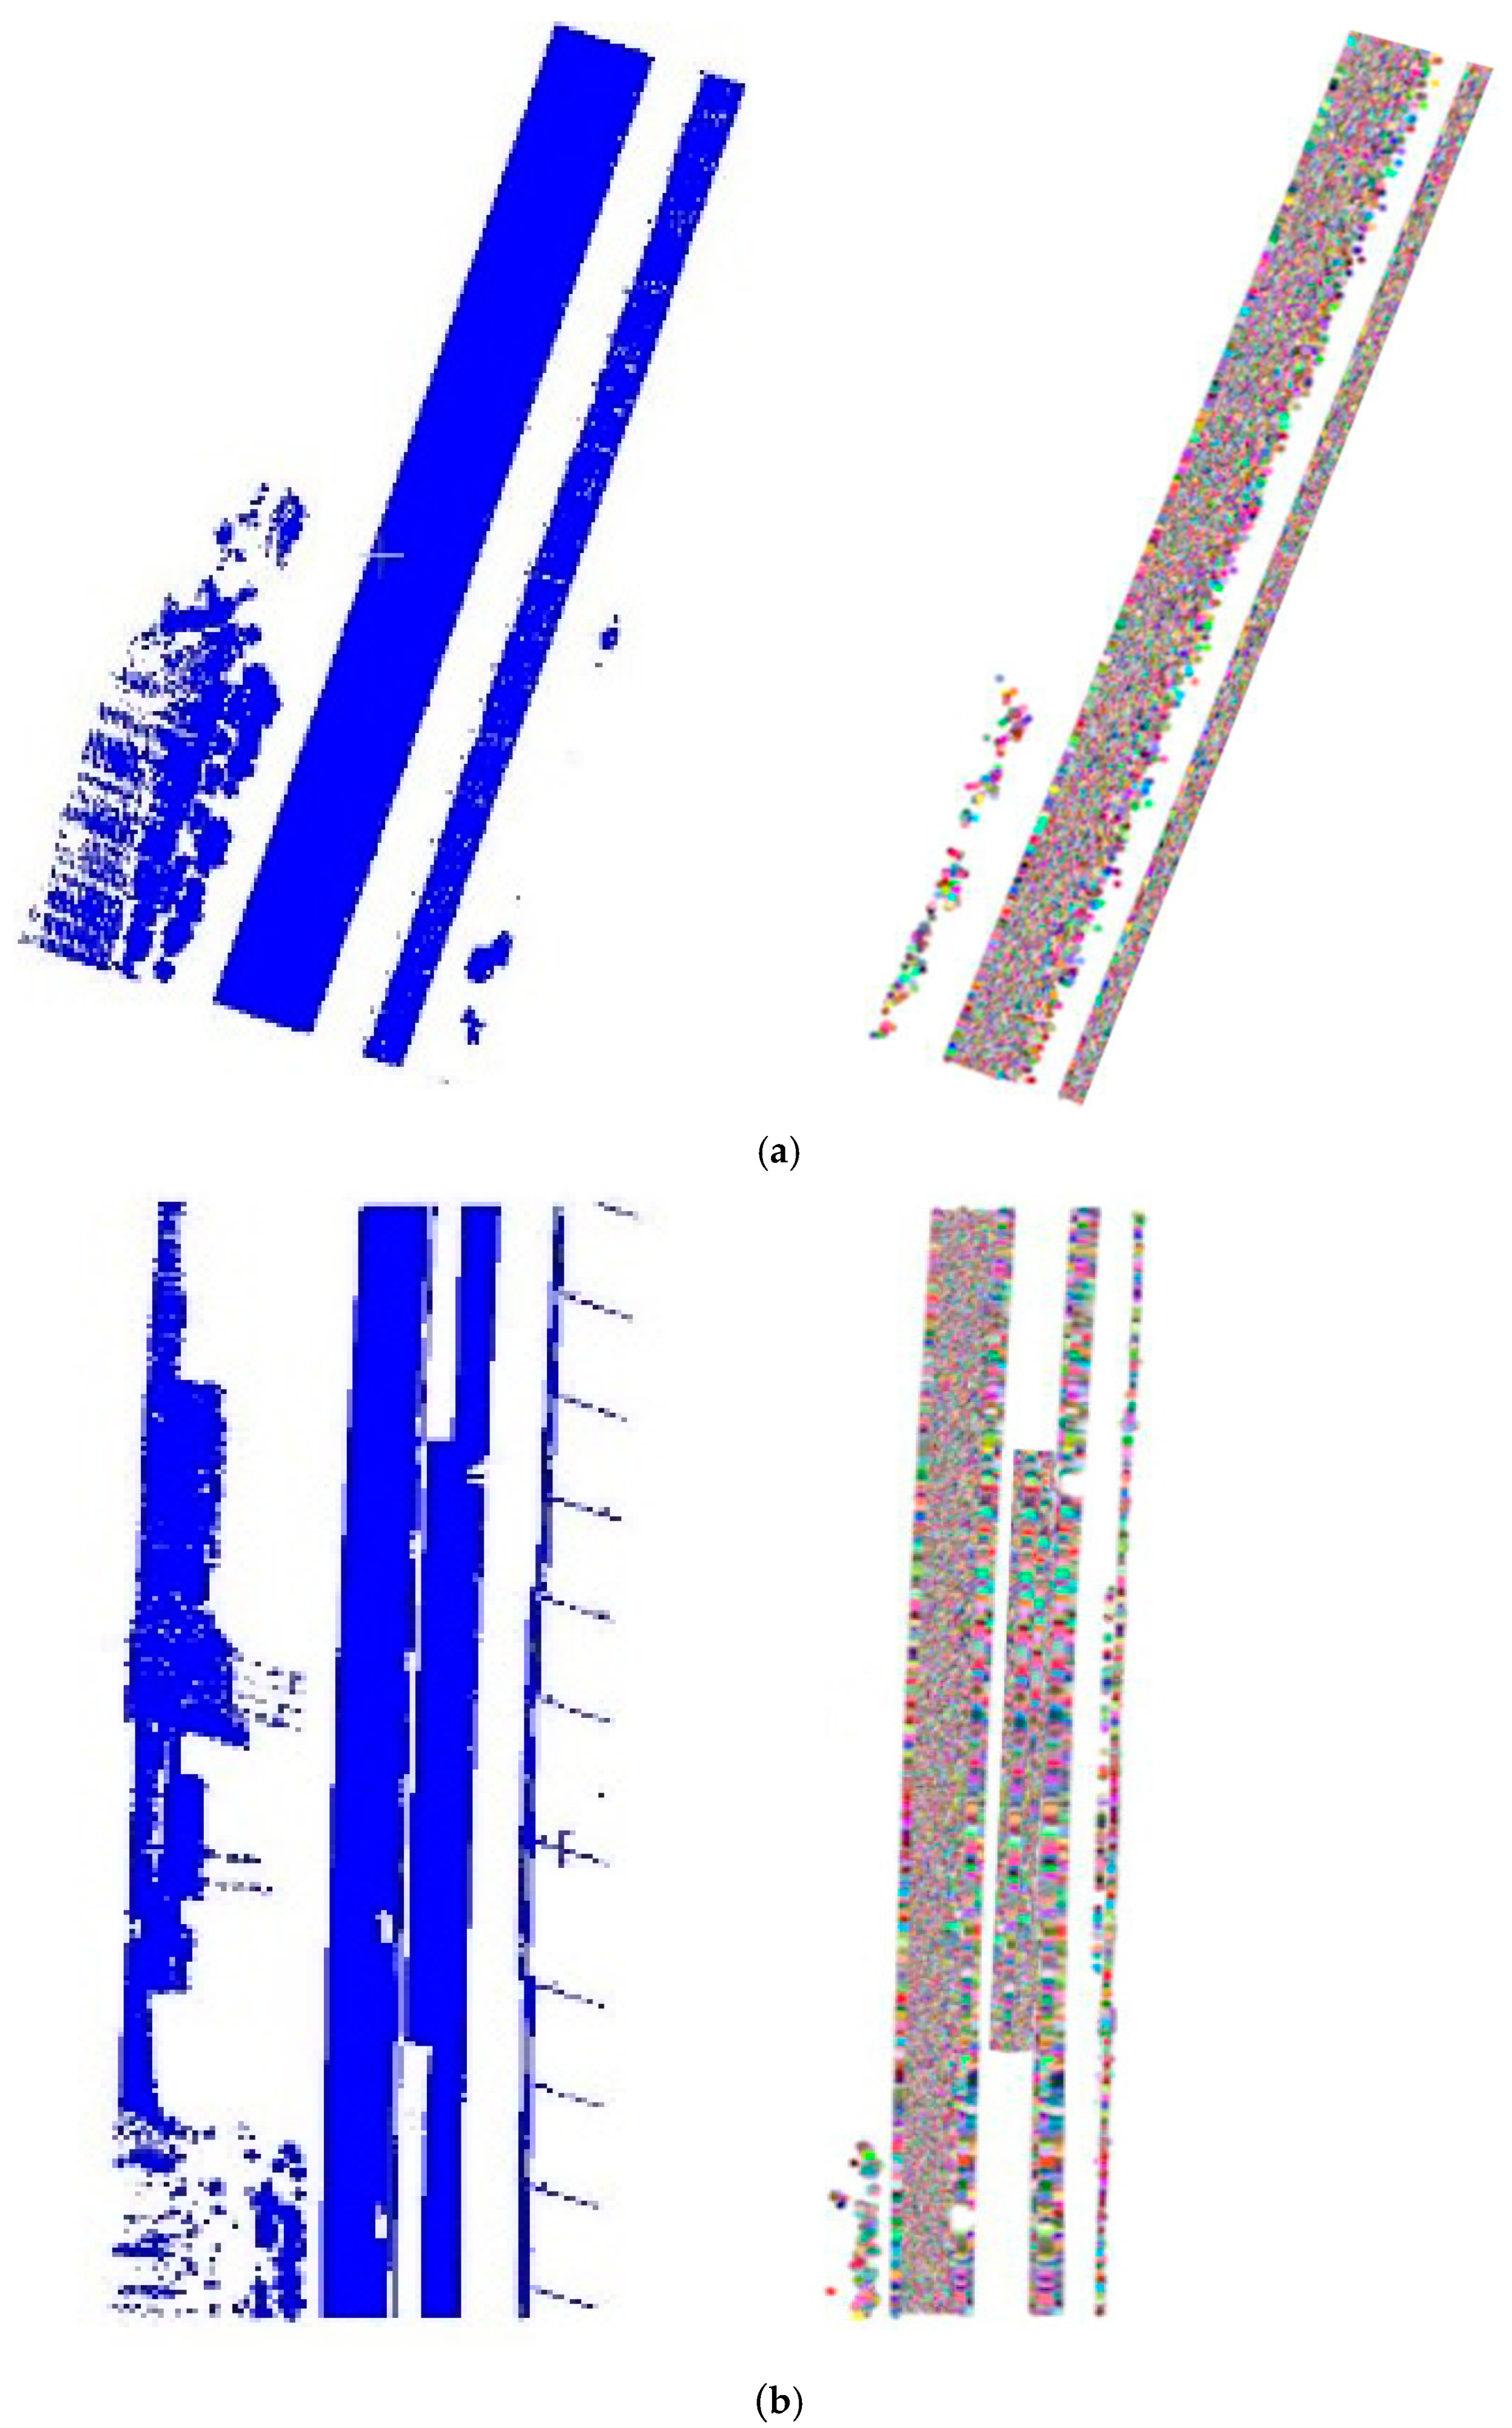
5.1. Results

The traditional 3D point cloud segmentation algorithm is primarily based on strict artificial design characteristics formulated from the geometric constraints and statistical rules of the point cloud. For example, the Euclidean clustering algorithm calculates the Euclidean distance between point clouds, and then the point with the smallest distance is divided into a category until the Euclidean distance between any two clusters is greater than a pre-set threshold [45]. The RANSAC algorithm is a model-based method of point cloud segmentation; however, the algorithm must manually define or select a model, usually a plane, sphere, or other geometry that can be represented by algebraic formulas [46]. The region growth algorithm is a classic point cloud segmentation method that measures the similarity between point clouds by combining features between N points or N area units and merging them [47].
In this study, four different point cloud segmentation algorithms, namely Euclidean clustering-based segmentation, RANSAC-based segmentation, traditional region growing-based segmentation, and the improved region growing algorithm, were compared in two typical highway scenarios. The aim was to effectively validate the efficiency, accuracy, and robustness of the proposed algorithm in automatically extracting road surfaces from MLS data.
By comparing the road surface extraction results obtained from these four segmentation algorithms, this study aimed to assess the performance of the proposed method and its ability to handle unstructured road surfaces in MLS point cloud data.

5.1.1. Flat Road Dataset

First, we applied the supervoxel segmentation method to perform coarse segmentation on the MLS point cloud data of a flat road. Then, using supervoxels as segmentation primitives, we employed a region growing algorithm for iterative clustering to extract the road surface point cloud. Finally, we compared the extracted road surface point cloud with the results obtained from the other three segmentation algorithms, as shown in Figure 14.
In comparing the results in Figure 14, it can be visually observed that all four methods achieved good segmentation results for the flat road scenario and successfully extracted the road surface. However, as shown in Figure 14d, the extracted road surface exhibits a clearer and more complete structure. In Figure 14a, the edges of the extracted road result are relatively rough, whereas in Figure 14b, the extracted road surface is incomplete. In Figure 14c, the result is relatively continuous, but there are instances of over-segmentation at the edges of the road, leading to insufficient details.

5.1.2. Sloped Road Dataset

First, the supervoxel segmentation method was used to over-segment an MLS point cloud data with slopes. Then, based on the super-voxels, the region growing algorithm was applied for iterative clustering to extract the road surface point cloud. Finally, the extracted road surface results were compared with those obtained using the other three segmentation algorithms, as shown in Figure 15. It should be noted that the blank holes in the road parts of figures are errors caused by occlusion during the data acquisition conducted by the vehicle-mounted laser scanning system.
From the comparison of the extraction results in Figure 15, it is evident that for a road scene with slopes, the extracted road surface region in Figure 15d is more complete and clearer compared with the other three segmentation algorithms. Figure 15a shows under-segmentation and discontinuity issues in the boundary parts of the extracted road surface, whereas Figure 15b shows under-segmentation and rough edges. The extraction result in Figure 15c shows a large number of over-segmentation phenomena on the road surface. Furthermore, to verify the time efficiency differences between the proposed method and comparative methods, the authors conducted experiments under the same conditions and recorded the time required for target information segmentation and clustering using different algorithms. The results are presented in Table 5 and Table 6, respectively. Compared to the other three algorithms, the proposed method also demonstrates improved computational efficiency.

5.2. Discussion

Combined with the above experimental results, it can be concluded that the effect of the Euclidean clustering algorithm is highly dependent on the design of the distance threshold, the distribution of the MLS point cloud data is uneven and unstructured, and the problem of under-segmentation often exists in the application of road surfaces extraction. The MLS point cloud data are numerous, and the spatial distribution is extremely irregular, which makes it impossible to segment the road surface extraction using RANSAC. The accuracy of the traditional regional growth algorithm depends on the growth standard and location of the seeds, which is computationally expensive and easily causes over-segmentation. The method proposed in this paper enables the road surface to be extracted completely, which greatly shortens the processing time and improves the efficiency. It can be observed from Table 7 that the proposed method achieved over 95% in all three quality evaluation metrics for the road surface extraction in both scenarios. This indicates that the vast majority of the roads were correctly extracted, and the results closely resemble the manually collected road surface data.
In conclusion, the experimental analysis of MLS point cloud data in two highway scenarios demonstrated that the combination of supervoxel segmentation and improved regional growth segmentation algorithm performs well in highway road surface extraction. Not only does it exhibit high accuracy, but it also outperforms other automated extraction algorithms in terms of efficiency. In addition, the proposed method successfully extracted precise road surface point cloud data in both flat and undulating road scenarios, proving its robustness across different structural data applications. Therefore, the proposed approach has advantages in terms of road surface extraction accuracy and algorithm efficiency.

5.3. Road Boundary Optimization Results

During the boundary extraction process, the key aspect of the Alpha Shape algorithm is determining the value of the radius. In this study, the value of α was set to 6, based on the characteristics of the highway road point cloud. An allowable error of 0.004 was considered. The extracted boundary results are shown in Figure 16.
It can be observed from Figure 16 that the extracted road boundary has a complete and clear structure, providing a reliable foundation for the subsequent output of standardized road surface results.

6. Conclusions

To solve the problems of the low accuracy and efficiency of the automatic extraction of road surfaces from MLS point cloud data when the road scene is complex, in this study, we proposed an improved region growing method based on supervoxel and vehicle trajectory data to automatically extract the road surface using MLS point cloud data with structured or unstructured patterns. From the above discussion, we can draw the following conclusions:
  • In order to solve the problems of redundant and unstructured MLS point cloud data, in this study, we reorganized the original scattered point cloud data through supervoxelization without changing their characteristics. The optimization of this data structure allows for a better differentiation of boundaries between different objects, significantly improving the quality of the target extraction and producing a more complete road surface.
  • To address the issue of low accuracy caused by the difficulty in selecting seed points on a road surface extracted using the region growing segmentation algorithm, the proposed algorithm combines the trajectory data of a mobile laser scanning system to enhance the selection strategy of seed voxels in the regional growth algorithm. This integration ensures a high-precision extraction of the road surface.
  • The neighborhood definition based on adjacent supervoxels was used in this study to facilitate the calculations of the Euclidean distance and normal vectors and to reduce the need for a time-consuming K-D tree nearest neighbor search for initial point data. This method can quickly and efficiently identify adjacent supervoxels, which can significantly improve the computational efficiency.
The experimental results demonstrate that the proposed method achieves a high performance in extracting road surfaces from MLS point cloud data, with an average extraction completeness, accuracy, and quality of 99.1%, 96.0%, and 97.5%, respectively, for both flat and sloped road datasets. In addition, the method utilizes only the xyz coordinates of the point cloud, making it applicable to other datasets.
In conclusion, this study provides a good method for infrastructure management departments to monitor and evaluate road surface quality and provides key support for the further exploration of road 3D information processing applications and related engineering construction. Moreover, with the development of autonomous driving, intelligent driving, and other technologies, high-resolution 3D maps will become the main source of information support, and excellent MLS point cloud processing technology can provide the necessary navigation data for dynamic autonomous vehicles.
The results presented herein are promising. However, the final conclusions regarding the absolute accuracy of the proposed algorithm and its suitability for road applications can be drawn only from extensive tests on ground realities. The authors plan to publish the results of these tests in subsequent studies. At the same time, we are also verifying some methods to solve highway classification on the market, for example, the Pointly.AI point cloud classifier was specially designed for highway classification and has a high degree of automation. However, this kind of solution needs to ensure the accuracy of the extraction through certain classification training, and on the other hand, it also lacks a detailed evaluation of the performance of the solution, such as in terms of the accuracy, recall rate, and other indicators, making it difficult for users to evaluate its applicability and effect in specific practical scenarios.
The next research goal of this research is to further explore the application of MLS point cloud data in high-precision maps and optimize the calculation speed of the algorithm to meet the positioning and safety requirements of vehicles while driving.

Author Contributions

Conceptualization, W.Z. and Y.N.; methodology, W.Z.; software, X.J.; validation, D.C. and X.J.; formal analysis, F.S.; investigation, S.W.; resources, W.Z.; data curation, Y.N. and X.J.; writing—original draft preparation, W.Z.; writing—review and editing, W.Z.; visualization, D.C.; supervision, X.J.; project administration, F.S.; funding acquisition, X.J. All authors have read and agreed to the published version of the manuscript.

Funding

This research was supported by the Natural Science Foundation of Shandong Province (grant number ZR2021QD058); partly supported by the Natural Science Foundation of China (grant number 42204011); partly supported by the Science and Technology Project of Jiangsu Geological Bureau 2022 (grant number 2022KY09), and partly supported by the Natural Science Foundation of Shandong Province (grant numbers ZR2022QD108).

Institutional Review Board Statement

Not applicable.

Informed Consent Statement

Not applicable.

Data Availability Statement

The datasets presented in this article are not readily available because the data is part of an ongoing real-world engineering project study. Requests to access the datasets should be directed to [email protected].

Acknowledgments

Special thanks to Jianfei Sun for his financial support and experimental materials.

Conflicts of Interest

The authors declare no conflicts of interest.

References

  1. De Blasiis, M.R.; Di Benedetto, A.; Fiani, M. Mobile Laser Scanning Data for the Evaluation of Pavement Surface Distress. Remote Sens. 2020, 12, 942. [Google Scholar] [CrossRef]
  2. Balado, J.; Martínez-Sánchez, J.; Arias, P.; Novo, A. Road Environment Semantic Segmentation with Deep Learning from MLS Point Cloud Data. Sensors 2019, 19, 3466. [Google Scholar] [CrossRef] [PubMed]
  3. Guan, H.; Li, J.; Yu, Y.; Cha, M.; Cheng, W. Automated Road Information Extraction From Mobile Laser Scanning Data. IEEE Trans. Intell. Transport. Syst. 2015, 16, 194–205. [Google Scholar] [CrossRef]
  4. Manohar Yadav, A.K.S.; Lohani, B. Extraction of Road Surface from Mobile LiDAR Data of Complex Road Environment. Int. J. Remote Sens. 2017, 38, 4655–4682. [Google Scholar] [CrossRef]
  5. Mancini, A.; Frontoni, E.; Zingaretti, P. Automatic road object extraction from Mobile Mapping Systems. In Proceedings of the 2012 IEEE/ASME 8th IEEE/ASME International Conference on Mechatronic and Embedded Systems and Applications, Suzhou, China, 8–10 July 2012; pp. 281–286. [Google Scholar]
  6. Ma, L.; Li, Y.; Li, J.; Wang, C.; Wang, R.; Chapman, M. Mobile Laser Scanned Point-Clouds for Road Object Detection and Extraction: A Review. Remote Sens. 2018, 10, 1531. [Google Scholar] [CrossRef]
  7. El-Halawany, S.I.; Lichti, D.D. Detecting Road Poles from Mobile Terrestrial Laser Scanning Data. GIScience Remote Sens. 2013, 50, 704–722. [Google Scholar] [CrossRef]
  8. Wen, J.; Qian, C.; Tang, J.; Liu, H.; Ye, W.; Fan, X. 2D LiDAR SLAM Back-End Optimization with Control Network Constraint for Mobile Mapping. Sensors 2018, 18, 3668. [Google Scholar] [CrossRef] [PubMed]
  9. Wang, L.; Zhang, Y.; Wang, J. Map-Based Localization Method for Autonomous Vehicles Using 3D-LIDAR. IFAC-PapersOnLine 2017, 50, 276–281. [Google Scholar] [CrossRef]
  10. Yang, B.; Dong, Z.; Liu, Y.; Liang, F.; Wang, Y. Computing Multiple Aggregation Levels and Contextual Features for Road Facilities Recognition Using Mobile Laser Scanning Data. ISPRS J. Photogramm. Remote Sens. 2017, 126, 180–194. [Google Scholar] [CrossRef]
  11. Chen, D.; He, X. Fast Automatic Three-Dimensional Road Model Reconstruction Based on Mobile Laser Scanning System. Optik 2015, 126, 725–730. [Google Scholar] [CrossRef]
  12. Wu, B.; Yu, B.; Huang, C.; Wu, Q.; Wu, J. Automated Extraction of Ground Surface along Urban Roads from Mobile Laser Scanning Point Clouds. Remote Sens. Lett. 2016, 7, 170–179. [Google Scholar] [CrossRef]
  13. Huang, L.; Chen, S.; Zhang, J.; Cheng, B.; Liu, M. Real-Time Motion Tracking for Indoor Moving Sphere Objects with a LiDAR Sensor. Sensors 2017, 17, 1932. [Google Scholar] [CrossRef] [PubMed]
  14. Akgul, M.; Yurtseven, H.; Akburak, S.; Demir, M.; Cigizoglu, H.K.; Ozturk, T.; Eksi, M.; Akay, A.O. Short Term Monitoring of Forest Road Pavement Degradation Using Terrestrial Laser Scanning. Measurement 2017, 103, 283–293. [Google Scholar] [CrossRef]
  15. Kheradmandi, N.; Mehranfar, V. A Critical Review and Comparative Study on Image Segmentation-Based Techniques for Pavement Crack Detection. Constr. Build. Mater. 2022, 321, 126162–126187. [Google Scholar] [CrossRef]
  16. Yang, M.; Wan, Y.; Liu, X.; Xu, J.; Wei, Z.; Chen, M.; Sheng, P. Laser Data Based Automatic Recognition and Maintenance of Road Markings from MLS System. Opt. Laser Technol. 2018, 107, 192–203. [Google Scholar] [CrossRef]
  17. Fang, L.; Sun, T.; Wang, S.; Fan, H.; Li, J. A Graph Attention Network for Road Marking Classification from Mobile LiDAR Point Clouds. Int. J. Appl. Earth Obs. Geoinf. 2022, 108, 102735–102741. [Google Scholar] [CrossRef]
  18. Gehrung, J.; Hebel, M.; Arens, M.; Stilla, U. An approach to extract moving objects from MLS data using a volumetric background representation. ISPRS Ann. Photogramm. Remote Sens. Spat. Inf. Sci. 2017, 4, 107–114. [Google Scholar] [CrossRef]
  19. Yao, L.; Chen, Q.; Qin, C.; Wu, H.; Zhang, S. Automatic extraction of road markings from mobile laser-point cloud using intensity data. Int. Arch. Photogramm. Remote Sens. Spat. Inf. Sci. 2018, 42, 2113–2119. [Google Scholar] [CrossRef]
  20. Guan, H.; Yan, W.; Yu, Y.; Zhong, L.; Li, D. Robust Traffic-Sign Detection and Classification Using Mobile LiDAR Data With Digital Images. IEEE J. Sel. Top. Appl. Earth Obs. Remote Sens. 2018, 11, 1715–1724. [Google Scholar] [CrossRef]
  21. Wang, H.Y.; Luo, H.; Wen, C.L.; Cheng, J.; Li, P.; Chen, Y.P.; Wang, C.; Li, J. Road boundary detection based on local normal saliency from mobile laser scanning data. IEEE Geosci. Remote Sens. Lett. 2015, 12, 2085–2089. [Google Scholar] [CrossRef]
  22. Cabo, C.; Kukko, A.; García-Cortés, S.; Kaartinen, H.; Hyyppä, J.; Ordoñez, C. An Algorithm for Automatic Road Asphalt Edge Delineation from Mobile Laser Scanner Data Using the Line Clouds Concept. Remote Sens. 2016, 8, 740. [Google Scholar] [CrossRef]
  23. Balado, J.; Díaz-Vilariño, L.; Arias, P.; González-Jorge, H. Automatic Classification of Urban Ground Elements from Mobile Laser Scanning Data. Autom. Constr. 2018, 86, 226–239. [Google Scholar] [CrossRef]
  24. Miyazaki, R.; Yamamoto, M.; Hanamoto, E.; Izumi, H.; Harada, K. A Line-Based Approach for Precise Extraction of Road and Curb Region from Mobile Mapping Data. ISPRS Ann. Photogramm. Remote Sens. Spat. Inf. Sci. 2014, 2, 243–250. [Google Scholar] [CrossRef]
  25. Wu, F.; Wen, C.; Guo, Y.; Wang, J.; Yu, Y.; Wang, C.; Li, J. Rapid localization and extraction of street lightpoles in mobile LiDAR point clouds: A supervoxel-based approach. IEEE Trans.Intell. Transp. Syst. 2017, 18, 292–305. [Google Scholar] [CrossRef]
  26. Tran, T.H.; Taweep, C. Automated Extraction of Expressway Road Surface from Mobile Laser Scanning Data. J. Cent. South Univ. 2020, 27, 1917–1938. [Google Scholar] [CrossRef]
  27. Guo, Y.; Wang, H.; Hu, Q.; Liu, H.; Liu, L.; Bennamoun, M. Deep Learning for 3D Point Clouds: A Survey. IEEE Trans. Pattern Anal. Mach. Intell. 2021, 43, 4338–4364. [Google Scholar] [CrossRef]
  28. Saovana, N.; Yabuki, N.; Fukuda, T. Automated Point Cloud Classification Using an Image-Based Instance Segmentation for Structure from Motion. Autom. Constr. 2021, 129, 103804. [Google Scholar] [CrossRef]
  29. Su, H.; Maji, S.; Kalogerakis, E.; Learned-Miller, E. Multi-View Convolutional Neural Networks for 3D Shape Recognition. In Proceedings of the 2015 IEEE International Conference on Computer Vision (ICCV), Santiago, Chile, 7–13 December 2015; pp. 945–953. [Google Scholar]
  30. Yang, Z.; Wang, L. Learning Relationships for Multi-View 3D Object Recognition. In Proceedings of the 2019 IEEE/CVF International Conference on Computer Vision (ICCV), Seoul, Republic of Korea, 27 October–2 November 2019; pp. 7504–7513. [Google Scholar]
  31. Qi, C.R.; Su, H.; Mo, K.; Guibas, L.J. Pointnet: Deep learning on point sets for 3d classification and segmentation. In Proceedings of the IEEE Conference on Computer Vision and Pattern Recognition, Honolulu, Hl, USA, 21–26 July 2017; pp. 652–660. [Google Scholar]
  32. Qi, C.R.; Yi, L.; Su, H.; Guibas, L.J. Pointnet++: Deep hierarchical feature learning on point sets in a metric space. In Proceedings of the 31st International Conference on Neural Information Processing Systems (NIPS 2017), Long Beach, CA, USA, 4–9 December 2017; pp. 5105–5114. [Google Scholar]
  33. Thomas, H.; Qi, C.R.; Deschaud, J.-E.; Marcotegui, B.; Goulette, F.; Guibas, L.J. Kpconv: Flexible and deformable convolution fo rpoint clouds. In Proceedings of the IEEE International Conference on Computer Vision, Seoul, Republic of Korea, 27 October–2 November 2019; pp. 6411–6420. [Google Scholar]
  34. Hu, Q.; Yang, B.; Xie, L.; Rosa, S.; Guo, Y.; Wang, Z.; Trigoni, N.; Markham, A. Randla-net: Efficient semantic segmentation of large-scale point clouds. In Proceedings of the IEEE Conference on Computer Vision and Pattern Recognition, Seattle, WA, USA, 16–18 June 2020; pp. 11108–11117. [Google Scholar]
  35. Wang, Y.; Sun, Y.; Liu, Z.; Sarma, S.E.; Bronstein, M.M.; Solomon, J.M. Dynamic Graph CNN for Learning on Point Clouds. ACM Trans. Graph. 2019, 38, 146. [Google Scholar] [CrossRef]
  36. Zhu, Z.; Li, X.; Xu, J.; Yuan, J.; Tao, J. Unstructured Road Segmentation Based on Road Boundary Enhancement Point-Cylinder Network Using LiDAR Sensor. Remote Sens. 2021, 13, 495. [Google Scholar] [CrossRef]
  37. Gao, B.; Xu, A.; Pan, Y.; Zhao, X.; Yao, W.; Zhao, H. Off-Road Drivable Area Extraction Using 3D LiDAR Data. In Proceedings of the 2019 IEEE Intelligent Vehicles Symposium (IV), Paris, France, 9–12 June 2019; pp. 1505–1511. [Google Scholar]
  38. Zai, D.; Li, J.; Guo, Y.; Cheng, M.; Lin, Y.; Luo, H.; Wang, C. 3-D Road Boundary Extraction From Mobile Laser Scanning Datavia Supervoxels and Graph Cuts. IEEE Trans. Intell. Transp. Syst. 2018, 19, 802–813. [Google Scholar] [CrossRef]
  39. Rusu, R.B.; Marton, Z.C.; Blodow, N.; Dolha, M.; Beetz, M. Towards 3D Point Cloud Based Object Maps for Household Environments. Robot. Auton. Syst. 2008, 56, 927–941. [Google Scholar] [CrossRef]
  40. CloudCompare; Version 2.13; GNU General Public License, [EB/OL]. Available online: https://www.gnu.org/licenses/gpl-3.0.html (accessed on 17 February 2024).
  41. Papon, J.; Abramov, A.; Schoeler, M.; Worgotter, F. Voxel Cloud Connectivity Segmentation-Supervoxels for Point Clouds. In Proceedings of the 2013 IEEE Conference on Computer Vision and Pattern Recognition, Portland, OR, USA, 23–28 June 2013; IEEE: Portland, OR, USA, 2013; pp. 2027–2034. [Google Scholar]
  42. Lin, Y.; Wang, C.; Zhai, D.; Li, W.; Li, J. Toward Better Boundary Preserved Supervoxel Segmentation for 3D Point Clouds. ISPRS J. Photogramm. Remote Sens. 2018, 143, 39–47. [Google Scholar] [CrossRef]
  43. Aït-Sahalia, Y.; Xiu, D. Principal Component Analysis of High-Frequency Data. J. Am. Stat. Assoc. 2019, 114, 287–303. [Google Scholar] [CrossRef]
  44. Wirges, S.; Rösch, K.; Bieder, F.; Stiller, C. Fast and Robust Ground Surface Estimation from LIDAR Measurements Using Uniform B-Splines. arXiv 2022, arXiv:2203.01180. [Google Scholar]
  45. Cao, Y.; Wang, Y.; Xue, Y.; Zhang, H.; Lao, Y. FEC: Fast Euclidean Clustering for Point Cloud Segmentation. Drones 2022, 6, 325. [Google Scholar] [CrossRef]
  46. Fischler, M.A.; Bolles, R.C. Random Sample Consensus: A Paradigm for Model Fitting with Applications to Image Analysis and Automated Cartography. In Readings in Computer Vision; Elsevier: Amsterdam, The Netherlands, 1987; pp. 726–740. [Google Scholar]
  47. Ma, X.; Luo, W.; Chen, M.; Li, J.; Yan, X.; Zhang, X.; Wei, W. A Fast Point Cloud Segmentation Algorithm Based on Region Growth. In Proceedings of the 2019 18th International Conference on Optical Communications and Networks (ICOCN), Huangshan, China, 5–8 August 2019; pp. 1–2. [Google Scholar]
Figure 1. Process based on improved region growth segmentation algorithm.
Applsci 14 02852 g001
Figure 2. Statistical filter denoising: (a) Before point cloud denoising (b) After point cloud denoising.
Applsci 14 02852 g002
Figure 3. Illustrates the point cloud after supervoxelization: (a) supervoxelization results of the flat road dataset; (b) supervoxelization results of the flat road dataset. The different colors in the image represent different supervoxel data.
Applsci 14 02852 g003
Figure 4. Trajectory data calculation process.
Applsci 14 02852 g004
Figure 5. Schematic of seed supervoxel selection.
Applsci 14 02852 g005
Figure 6. Schematic of Alpha Shape algorithm.
Applsci 14 02852 g006
Figure 7. Location of the test data set in Google Earth.
Applsci 14 02852 g007
Figure 8. Mobile laser scanning system.
Applsci 14 02852 g008
Figure 9. Accuracy analysis of five different supervoxel resolution sizes: (a) Site 1; (b) Site 2.
Applsci 14 02852 g009
Figure 10. Execution time of five different supervoxel sizes: (a) Site 1; (b) Site 2.
Applsci 14 02852 g010
Figure 11. Accuracy analysis of four different slope threshold values: (a) Site 1; (b) Site 2.
Applsci 14 02852 g011
Figure 12. Accuracy analysis of four different angle threshold values: (a) Site 1; (b) Site 2.
Applsci 14 02852 g012
Figure 13. Accuracy analysis of four different residual threshold values: (a) Site 1; (b) Site 2.
Applsci 14 02852 g013
Figure 14. Extraction results of MLS point cloud road surface for flat road: (a) Euclidean clustering-based segmentation; (b) RANSAC-based segmentation; (c) traditional region growing-based segmentation; (d) improved region growing algorithm.
Applsci 14 02852 g014
Figure 15. Extraction results of MLS point cloud surface for sloped road: (a) Euclidean clustering-based segmentation; (b) RANSAC-based segmentation; (c) traditional region growing-based segmentation; (d) improved region growing algorithm.
Applsci 14 02852 g015
Figure 16. Road boundary extraction results: (a) Site 1; (b) Site 2.
Applsci 14 02852 g016
Table 1. Parameter information of CTI AS-1300HL LIDAR.
Indicator ParametersPerformance Specifications
PrecisionHorizontal: <0.05 mRMS
Vertical: <0.05 mRMS
Minimum ranging5 m
Laser field of viewThe range of 0°–330° is adjustable
Inertial navigation update rate200 Hz
Gyroscope bias stability<0.05°/h
Gyroscope range±490°/s
Accelerometer range±10 g
Post-processing attitudeRoll/Pitch:0.005
accuracyHeading: 0.017
Post-processing positionHorizontal: 0.01 m
accuracyElevation: 0.02 m
Table 2. Parameter information of IMU-KVH1750IMU inertial navigation technology.
Indicator ParametersPerformance Specifications
Gyro input range (max)±490°/s
Gyro bias stability (25 °C)≤0.1°/h(max)
≤0.05°/h(typical)
Gyro scale factor (maximum input range, 25 °C)≤50 ppm
Gyro angle random walk (25 °C)0.012°/√h
(≤0.7°/h/√h)
Accelerometer range (max)±10 g
Accelerometer bias stability
(constant temperature)
<0.05 mg
Accelerometer velocity walks randomly≤0.12 mg/√h(0.23 ft/s/√h)
Table 3. Experimental operating environment.
NameConfiguration
ProcessorAMD Ryzen 5 5600H (AMD, Santa Clara, CA, USA)
Graphics cardNVIDIA GeForce GTX 1650 (NVIDIA, Santa Clara, CA, USA)
Run memory8 GB
Table 4. Experimental parameters.
ParametersSupervoxel
Resolution/m
Slope
Threshold/%
Angle
Threshold/°
Residual
Threshold/m
Flat road dataset0.2550.2
Sloped road dataset0.2550.2
Table 5. Comparison of four segmentation algorithms for MLS point cloud data in flat road scenario.
AlgorithmsNumber of Point CloudsSupervoxelization/sPartition/sTotal Time/s
Euclidean clustering-based segmentation3,975,648/253253
RANSAC-based segmentation3,975,648/284284
Traditional region growing-based segmentation3,975,648/307307
Improved region growing algorithm3,975,64818130148
Table 6. Comparison of four segmentation algorithms for MLS point cloud data in sloped road scene.
AlgorithmsNumber of Point CloudsSupervoxelization/sPartition/sTotal Time/s
Euclidean clustering-based segmentation4,815,042/315315
RANSAC-based segmentation4,815,042/344344
Traditional region growing-based segmentation4,815,042/399399
Improved region growing algorithm4,815,04223141164
Table 7. Accuracy of classification results on two experimental datasets.
Experimental ScenariosRoad
Surface Points
Detected Road
Surface Points
TPFNFPRecall/%Precision/%F1/%
Flat road3,483,9793,576,9813,470,82413,155106,15799.697.098.3
Sloped road4,304,1064,468,1554,242,85461,252225,30198.594.996.7
Average 99.196.097.5
Disclaimer/Publisher’s Note: The statements, opinions and data contained in all publications are solely those of the individual author(s) and contributor(s) and not of MDPI and/or the editor(s). MDPI and/or the editor(s) disclaim responsibility for any injury to people or property resulting from any ideas, methods, instructions or products referred to in the content.

