1. Introduction
Advances in science and technology have brought about the rapid development of high-speed rail transportation, including the increasing mileage of high-speed rail and the increase in train speeds [
1,
2]. Nevertheless, the increase in train speed has given rise to significant environmental noise pollution along railway lines. Constructing sound barriers on both sides of the railway is an effective measure to mitigate noise pollution generated by running high-speed trains [
3]. Strongly disturbed aerodynamic pressure caused by trains traveling at high speeds will act on the surface of the sound barrier, threatening its structural safety and durability [
4]. The sound barriers on the Cologne-Frankfurt high-speed railway in Germany were not designed to account for the dynamic effects of aerodynamic pressure. In 2003, resonance failure occurred when the train speed exceeded 250 km/h. Hence, the issue of aerodynamic pressure in high-speed trains has gradually received widespread attention [
5], and studying the changing rules of train-induced aerodynamic pressure acting on the sound barrier is of great significance to the safety design of the sound barrier.
Current research methods for studying the aerodynamic load characteristics of sound barriers include numerical simulations, field tests, and scaled model tests [
6]. Among them, numerical simulation methods based on computational fluid dynamics (CFD) have attracted the attention of most scholars. Li et al. [
7] developed a calculation model of a train passing through a sound barrier using the sliding mesh method and investigated the impact of train speed on simulation results. They concluded that the aerodynamic pressure experienced by the sound barrier is essentially proportional to the square of the train speed. Luo et al. [
8] investigated the transient flow field generated by a maglev train passing through a sound barrier using the Improved Delayed Separation Eddy Simulation (IDDES) method. They further analyzed the effects of sound barrier height and noise barrier distance from the track center on the pressure and velocity distributions. Using CFD simulation, Bi et al. [
9] examined the changes in aerodynamic pressure as a high-speed train with a speed of 400 km/h passed through a sound barrier. They analyzed the influences of various parameters, including train speed, distance from the center of the train to the sound barrier, and the height of the sound barrier on the aerodynamic pressure on the inner surface of the sound barrier. The distance between the track centerline and the sound barrier is a crucial factor influencing these aerodynamic pressures, which increase non-linearly in magnitude as the sound barrier gets closer to the track [
10,
11]. Chen et al. [
12] similarly constructed a three-dimensional model of a high-speed train and sound barrier through numerical simulation. They conducted an analysis to obtain the time-varying curve of aerodynamic pressure on the sound barrier during train passage. Additionally, a study on sound barriers by the German engineering consultancy PEC + S [
13] concluded that various factors such as train type, barrier height, and structural type of the sound barrier exert different influences on the peak aerodynamic pressure generated by an ICE 3 train passing through a sound barrier. Schetz [
14] synthesized research findings from Japanese, French, and German scholars. After extensive data processing, the following conclusion was reached: the peak pressure induced by a train passing through a sound barrier increases proportionally to the square of the train speed. Notably, significant variation exists in the peak pressures generated by various locomotive types, with those equipped with streamlined designs demonstrating superior aerodynamic performance.
Other scholars carried out field tests to measure the aerodynamic pressure on the sound barrier caused by the passing trains. Belloli et al. [
15] developed a three-dimensional CFD simulation model for the train and sound barrier, utilizing the slip mesh technique for simulation and analysis. Moreover, they conducted wind tunnel testing to collect aerodynamic pressure data at different locations on the sound barrier, further validating the test results using field test data along the high-speed railway line between Rome and Naples. The comparison revealed a notable consistency among the results obtained from the CFD simulation, wind tunnel tests, and field experiments. Lv et al. [
16] conducted field tests on the aerodynamic load characteristics of the sound barrier from three aspects: the speed of Electric Multiple Unit (EMU) trains, the distance between the train and the sound barrier, and the type of EMU train. Zou et al. [
17] performed on-site measurements of the aerodynamic load generated by the CRH380A EMU train on the sound barrier at various speeds. The analysis revealed that the train-induced aerodynamic load exhibits distinct head wave and wake wave effects, with the peak pressure gradually decreasing along the vertical direction of the sound barrier. In a full-scale experiment conducted by Rochi et al. [
18] involving high-speed trains on an Italian railroad line, the changes in aerodynamic pressure were measured as three high-speed trains passed the same sound barrier. The study revealed that the magnitude of the pressure curve on the surface of the sound barrier was closely linked to the height and shape of the high-speed train.
It can be observed from the literature review that establishing a numerical model of a high-speed train passing through a sound barrier area based on the CFD method and conducting simulation calculations is an effective approach to studying the aerodynamic pressure generated by a running train [
19]. While field measurements can provide reliable results regarding train-induced aerodynamic pressure fluctuations, there are limitations such as high cost, low efficiency, and operational constraints. For safety reasons, railway authorities sometimes do not permit on-site measurements [
16], especially for high-speed railway lines. Therefore, the use of CFD numerical simulation [
20] has become a suitable and mainstream method for studying the impact of aerodynamic loads generated by high-speed trains on sound barriers.
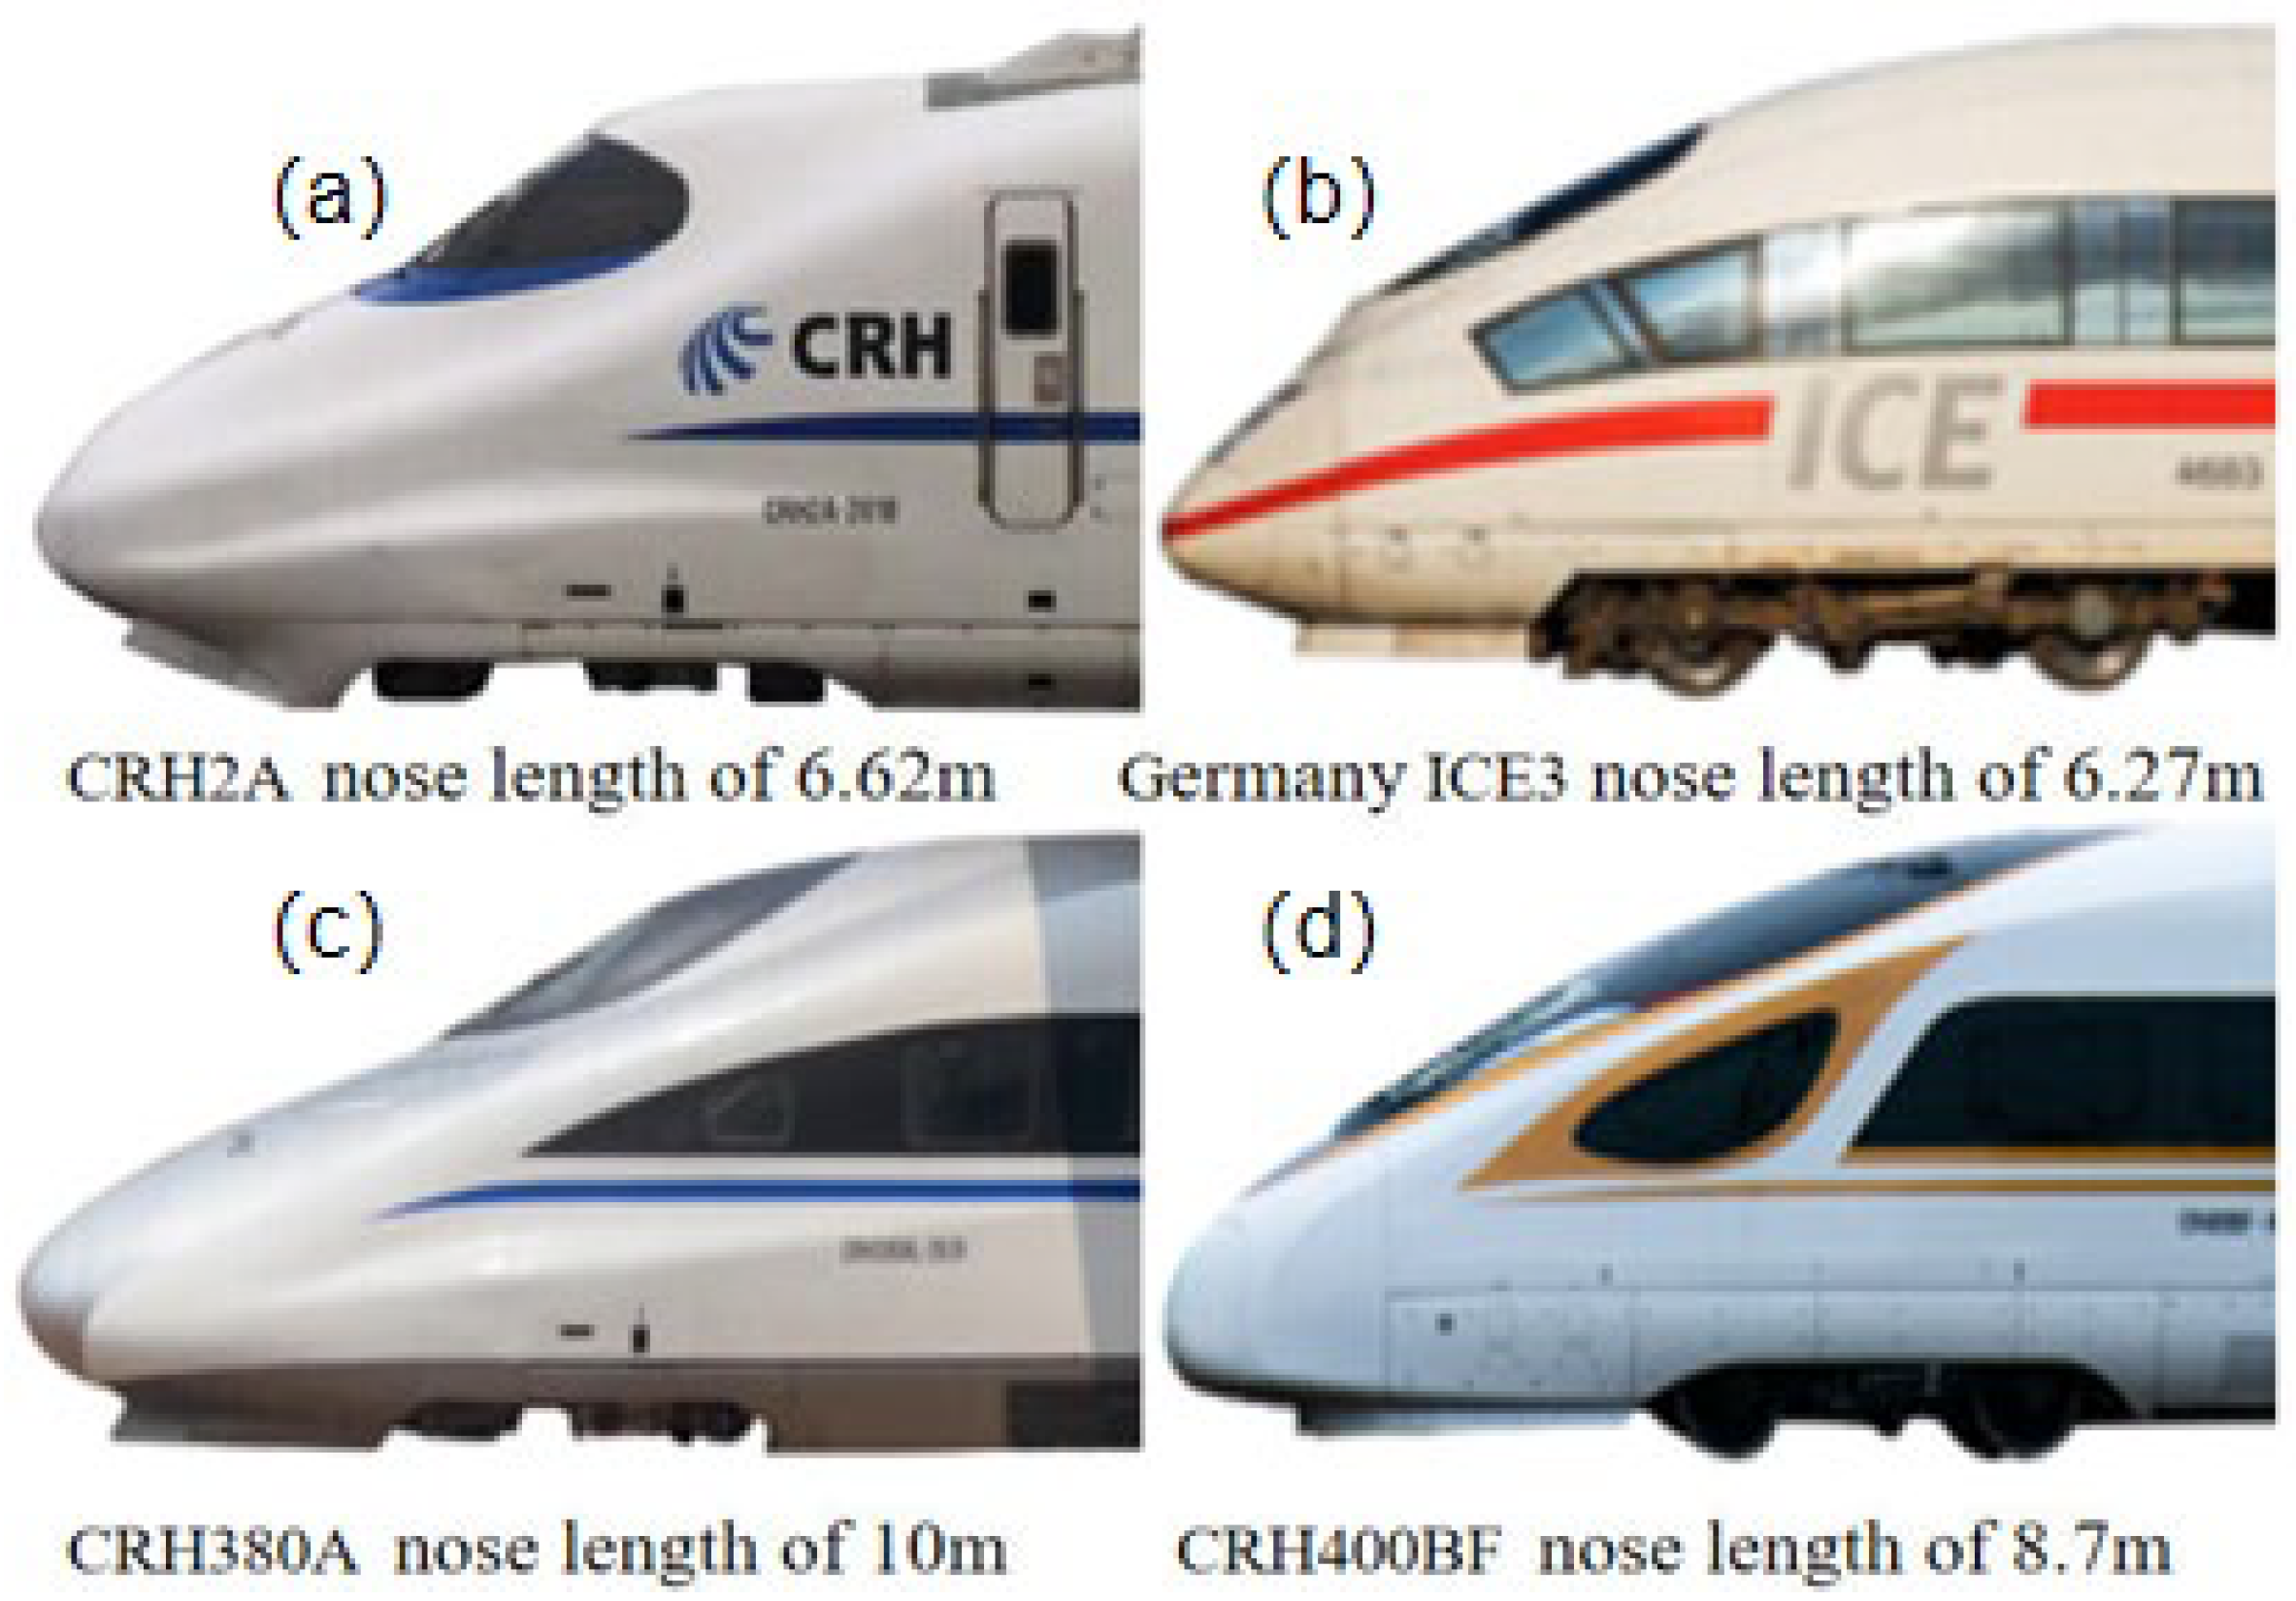
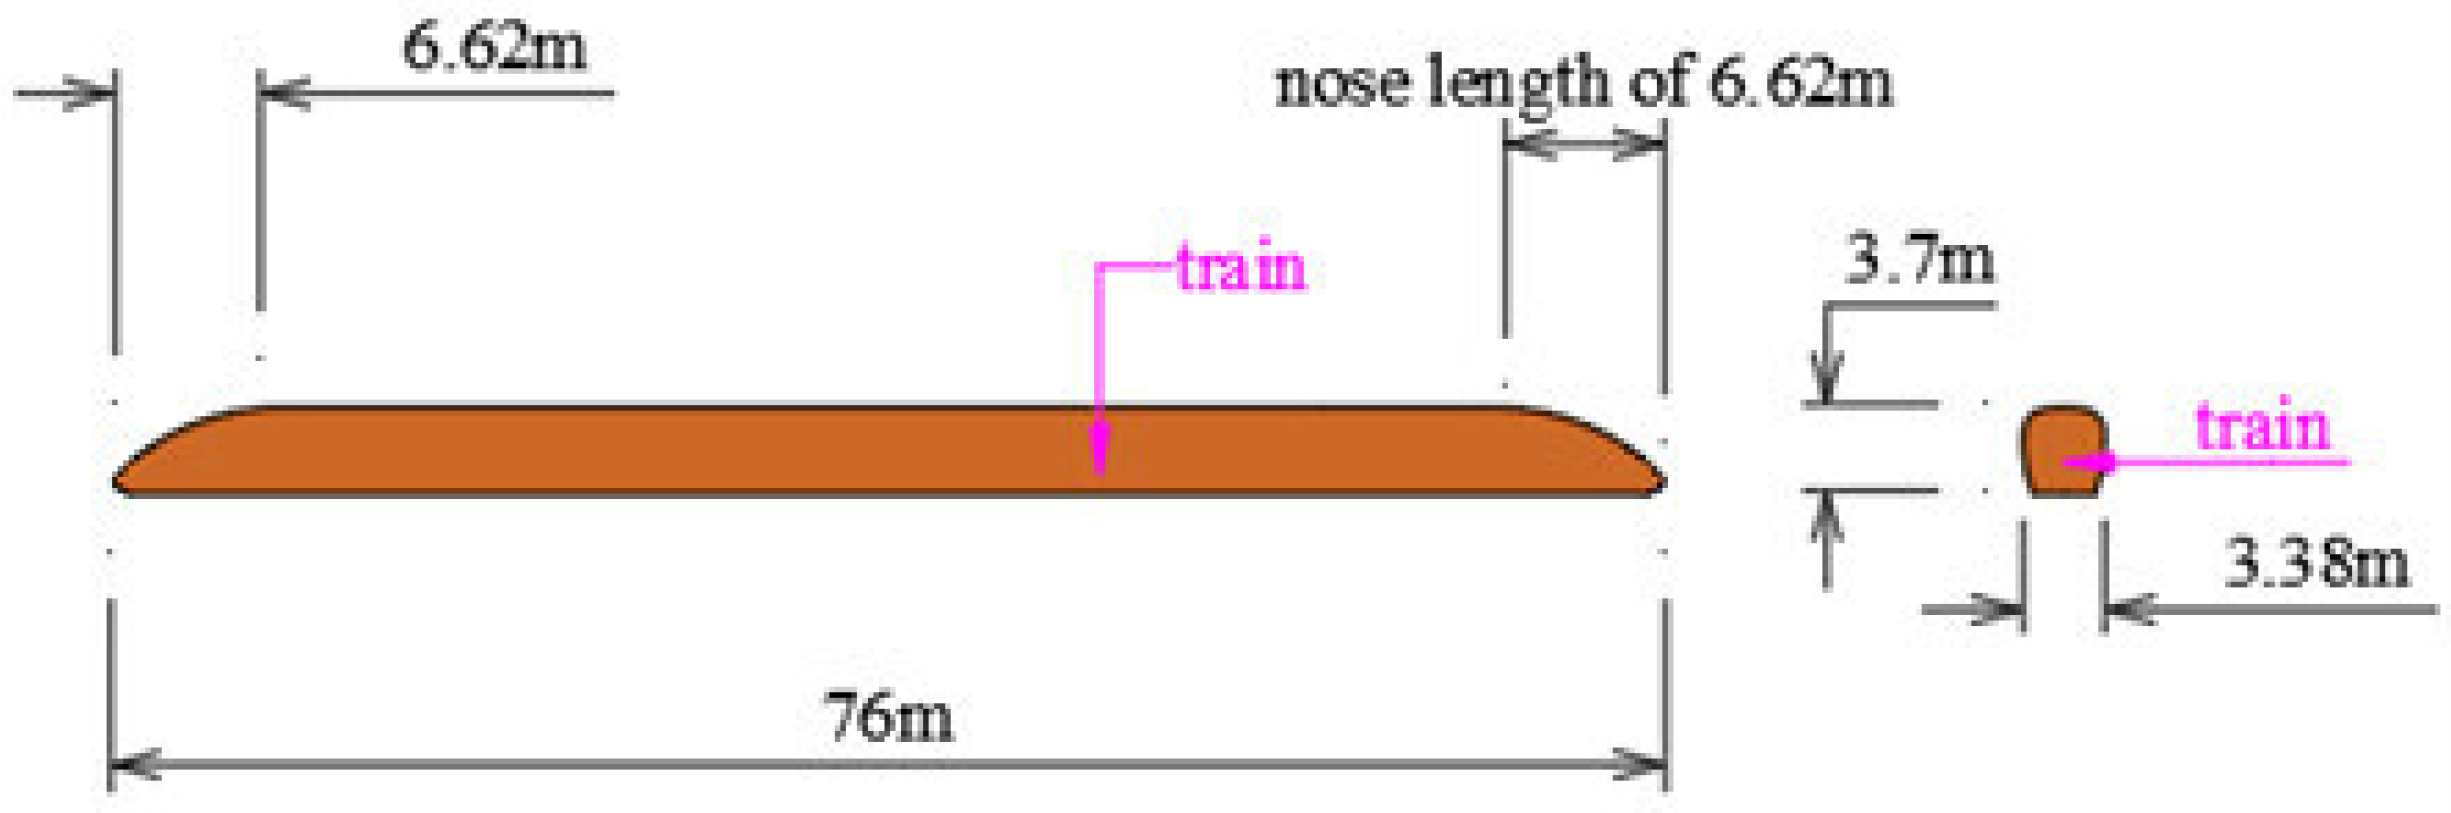
Most of the aforementioned studies concentrate on the impacts of parameters such as train speed, the distance from the train center to the sound barrier, and the height of the sound barrier on the train-induced aerodynamic load acting on the surface of the sound barrier. Furthermore, due to the rapid development of high-speed trains, significant variations exist in the nose lengths of high-speed trains across different countries and regions, as illustrated in
Figure 1. Therefore, in this study, based on the CFD simulation method, the distribution law of aerodynamic pressure on the inner surface of the sound barrier when the high-speed train with different nose lengths passes through was investigated, and the quantitative relationship between the aerodynamic pressure and the nose length was analyzed. The research results are expected to contribute to the precise characterization of aerodynamic load acting on the sound barrier from high-speed trains.
3. Model Validation
The accuracy of numerical simulation in this study was validated using field test data of aerodynamic pressure on the sound barrier in the Tianjin-Qinhuangdao Passenger Dedicated Line in China from the literature [
31]. Employing the aforementioned numerical simulation method, the calculation models corresponding to the field test were established. In this scenario, the CRH 380B high-speed train travels at a speed of 385 km/h, with a distance of 3.4 m between the sound barrier and the center of the train. The simulated peak pressure on the inner surface of the sound barrier was compared with the field test data, and the results are presented in
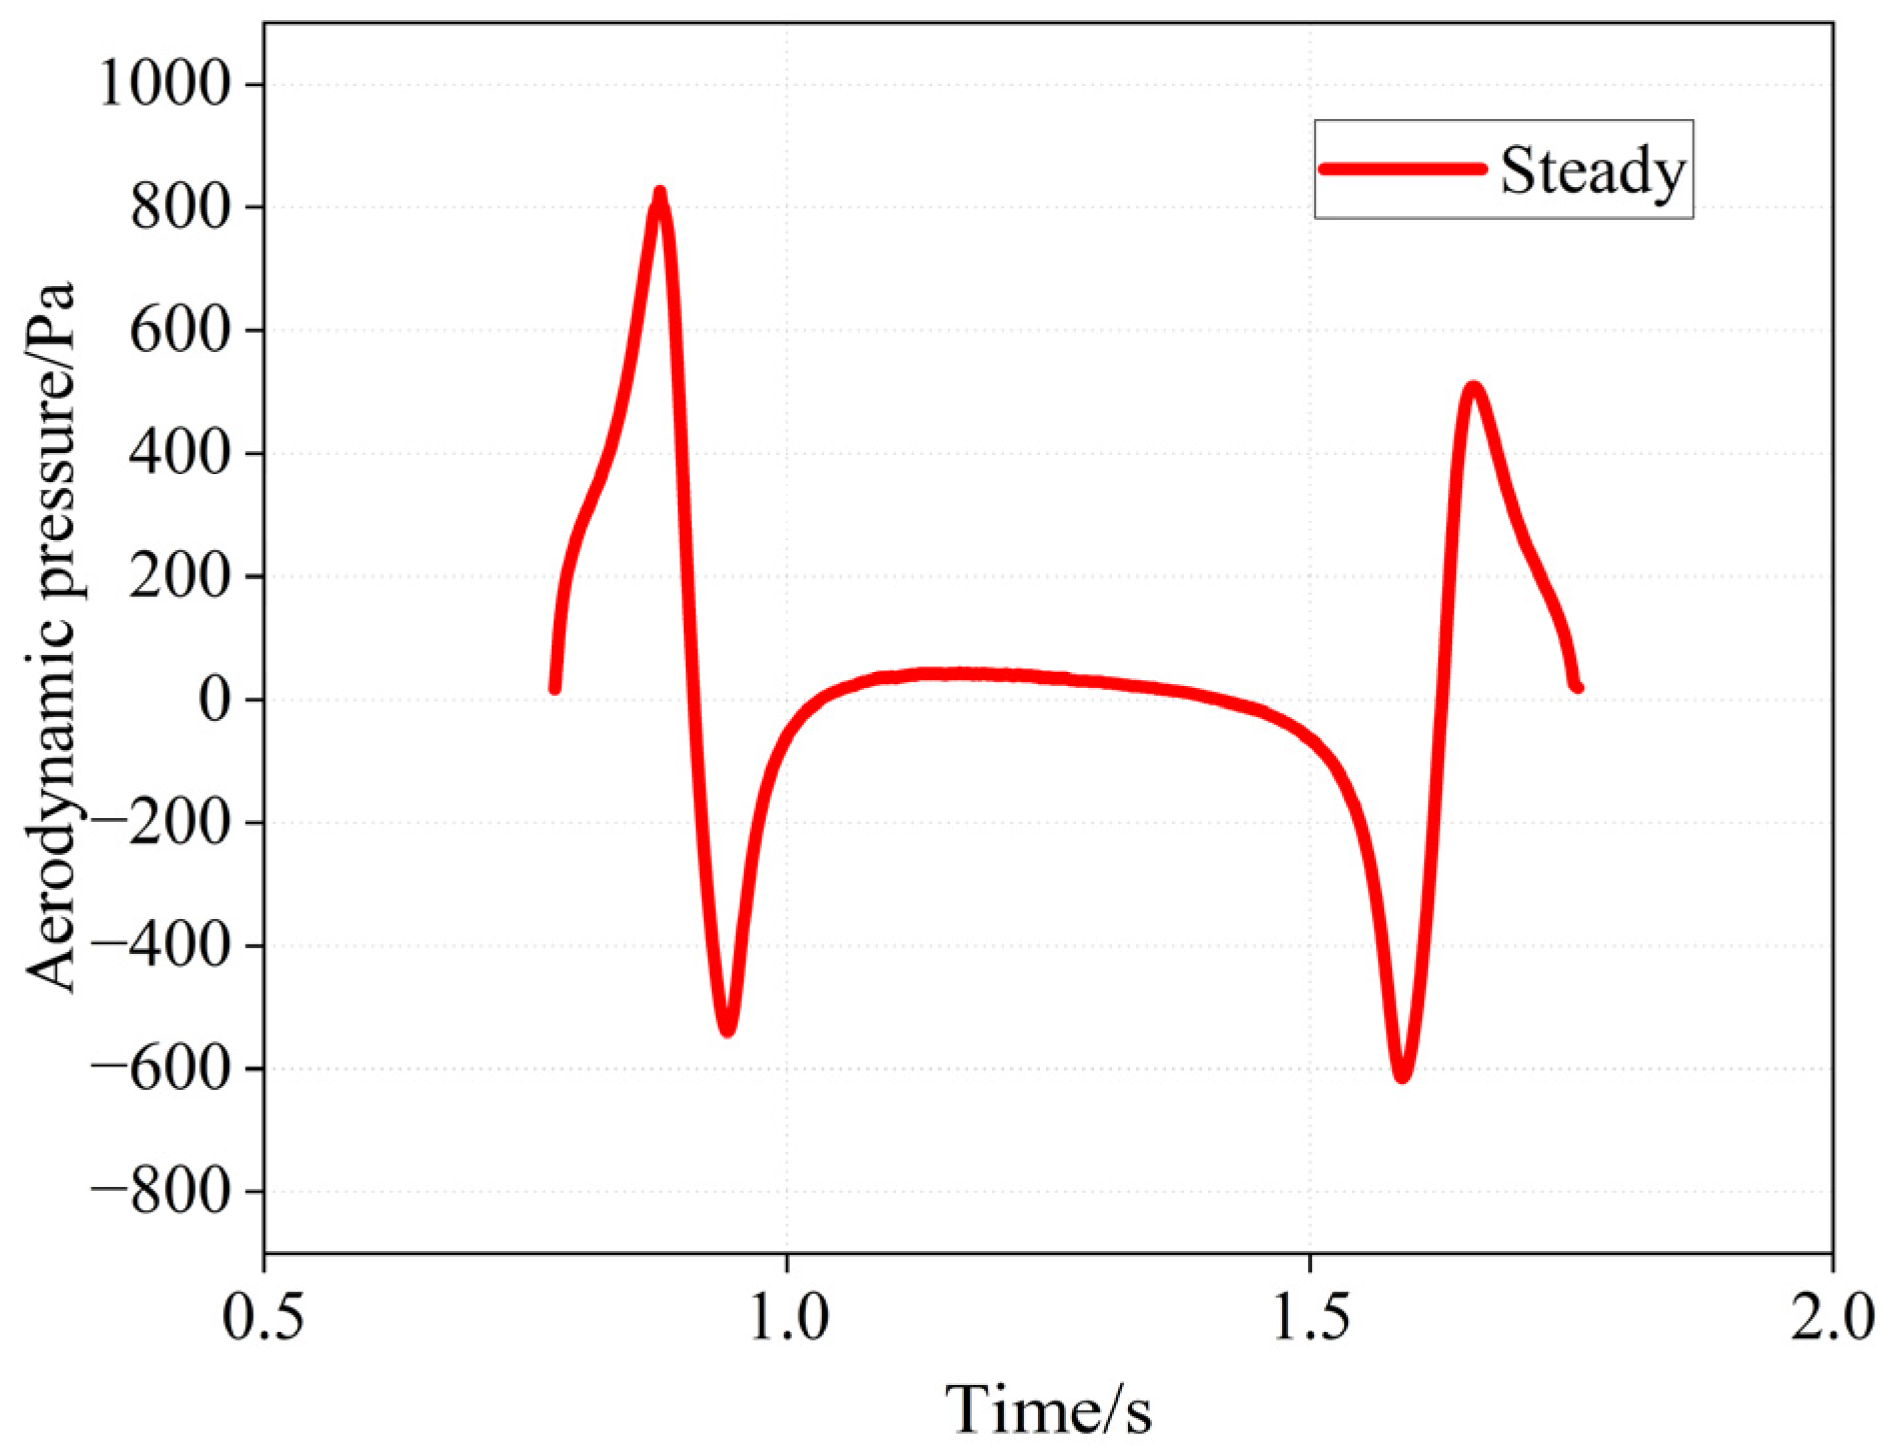
Table 3. In both transient and steady calculation models, the absolute differences in pressure peak results for two measuring points between numerical simulation and field measurements are below 4%. When the steady-state calculated pressure data is converted from spatial variation to time variation, and compared with the transient pressure curve, as depicted in
Figure 8, it becomes evident that the steady-state model and the transient model exhibit substantial consistency in the change of pressure with time. Particularly noteworthy is the close proximity of pressure peaks at the head and tail cars.
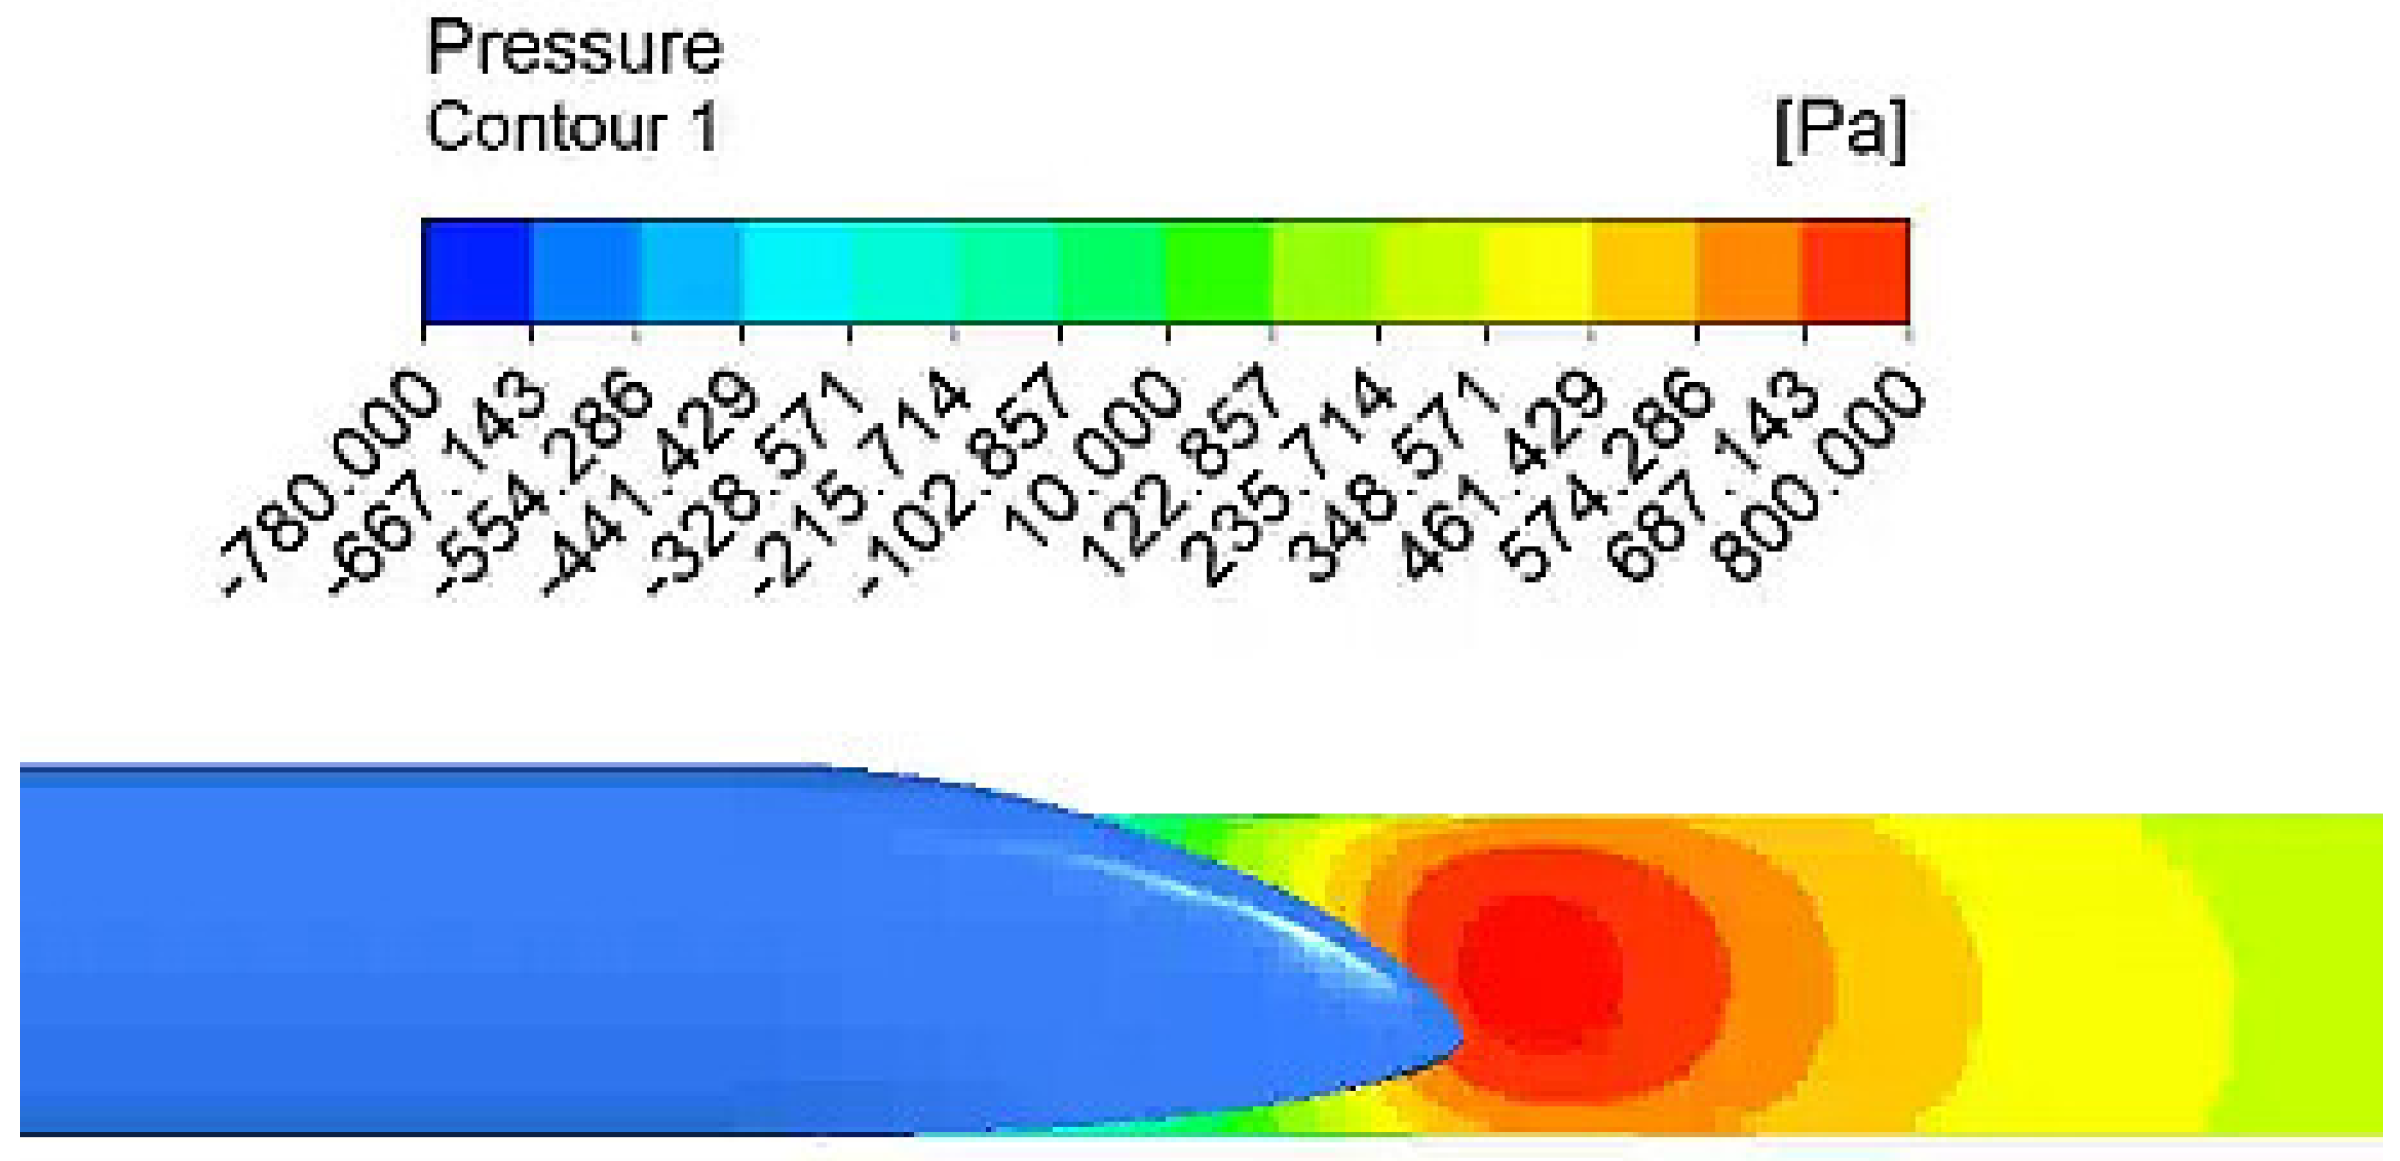
Figure 9 shows the pressure cloud of the numerically validated simulation model as well as the pressure distribution.
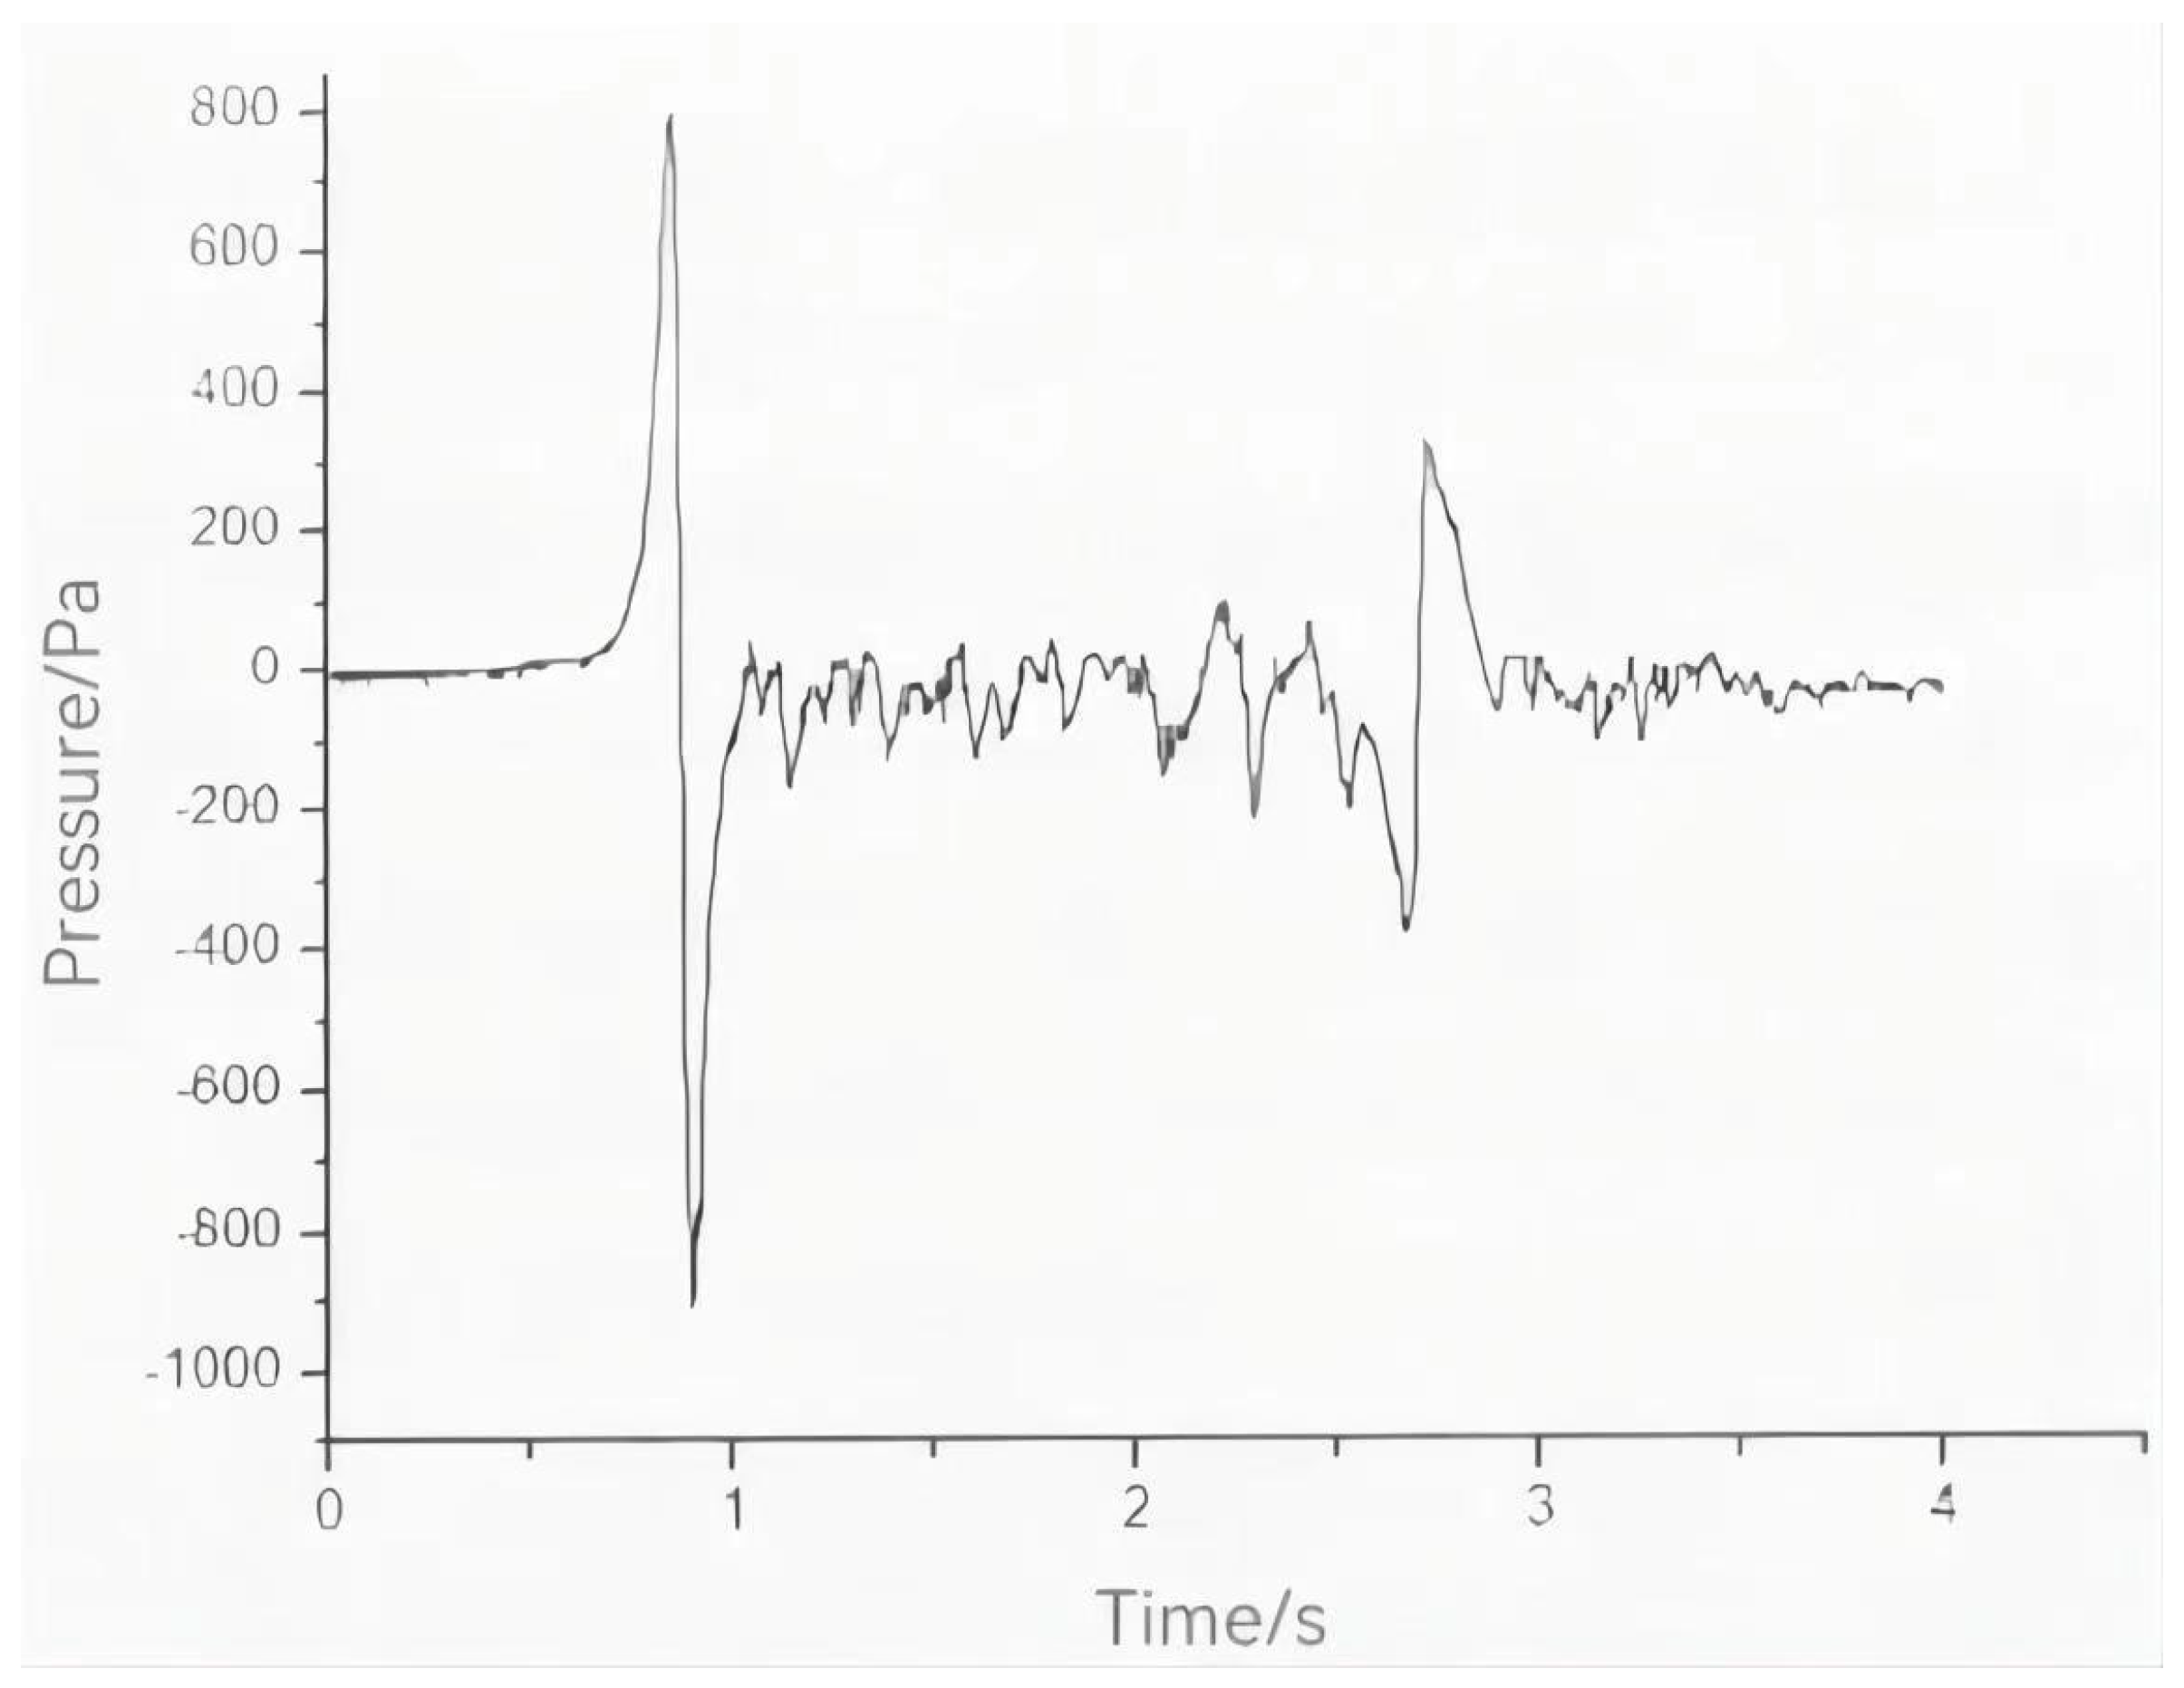
Figure 10 shows the time-varying curve of aerodynamic pressure in the in-situ testing. It can be observed that the time variation curve of pressure obtained by numerical simulation closely aligns with the in-situ test results, particularly for the head wave. The peak pressure of the head wave in the numerical simulation closely approximates that observed in the in-situ test. These results affirm that the calculation methods and parameters employed in this study can accurately replicate the actual pressure distribution on the sound barrier [
32]. Further parametric analyses can be conducted utilizing the aforementioned CFD modeling method.
5. Conclusions
In this study, the aerodynamic pressure on sound barriers induced by high-speed trains was computed using CFD simulations. Through a comparison between the simulation results and field measurements extracted from the literature, it was observed that there was a notable concurrence in the peak pressure data and development with time, indicating the efficacy of the simulation method. Subsequently, the essential characteristics of pressure variation on sound barriers and pressure distribution along the vertical direction were explored. Additionally, the impact of distance to the train center and the train nose length on aerodynamic pressure on sound barriers was analyzed. The following conclusions were drawn:
- (1)
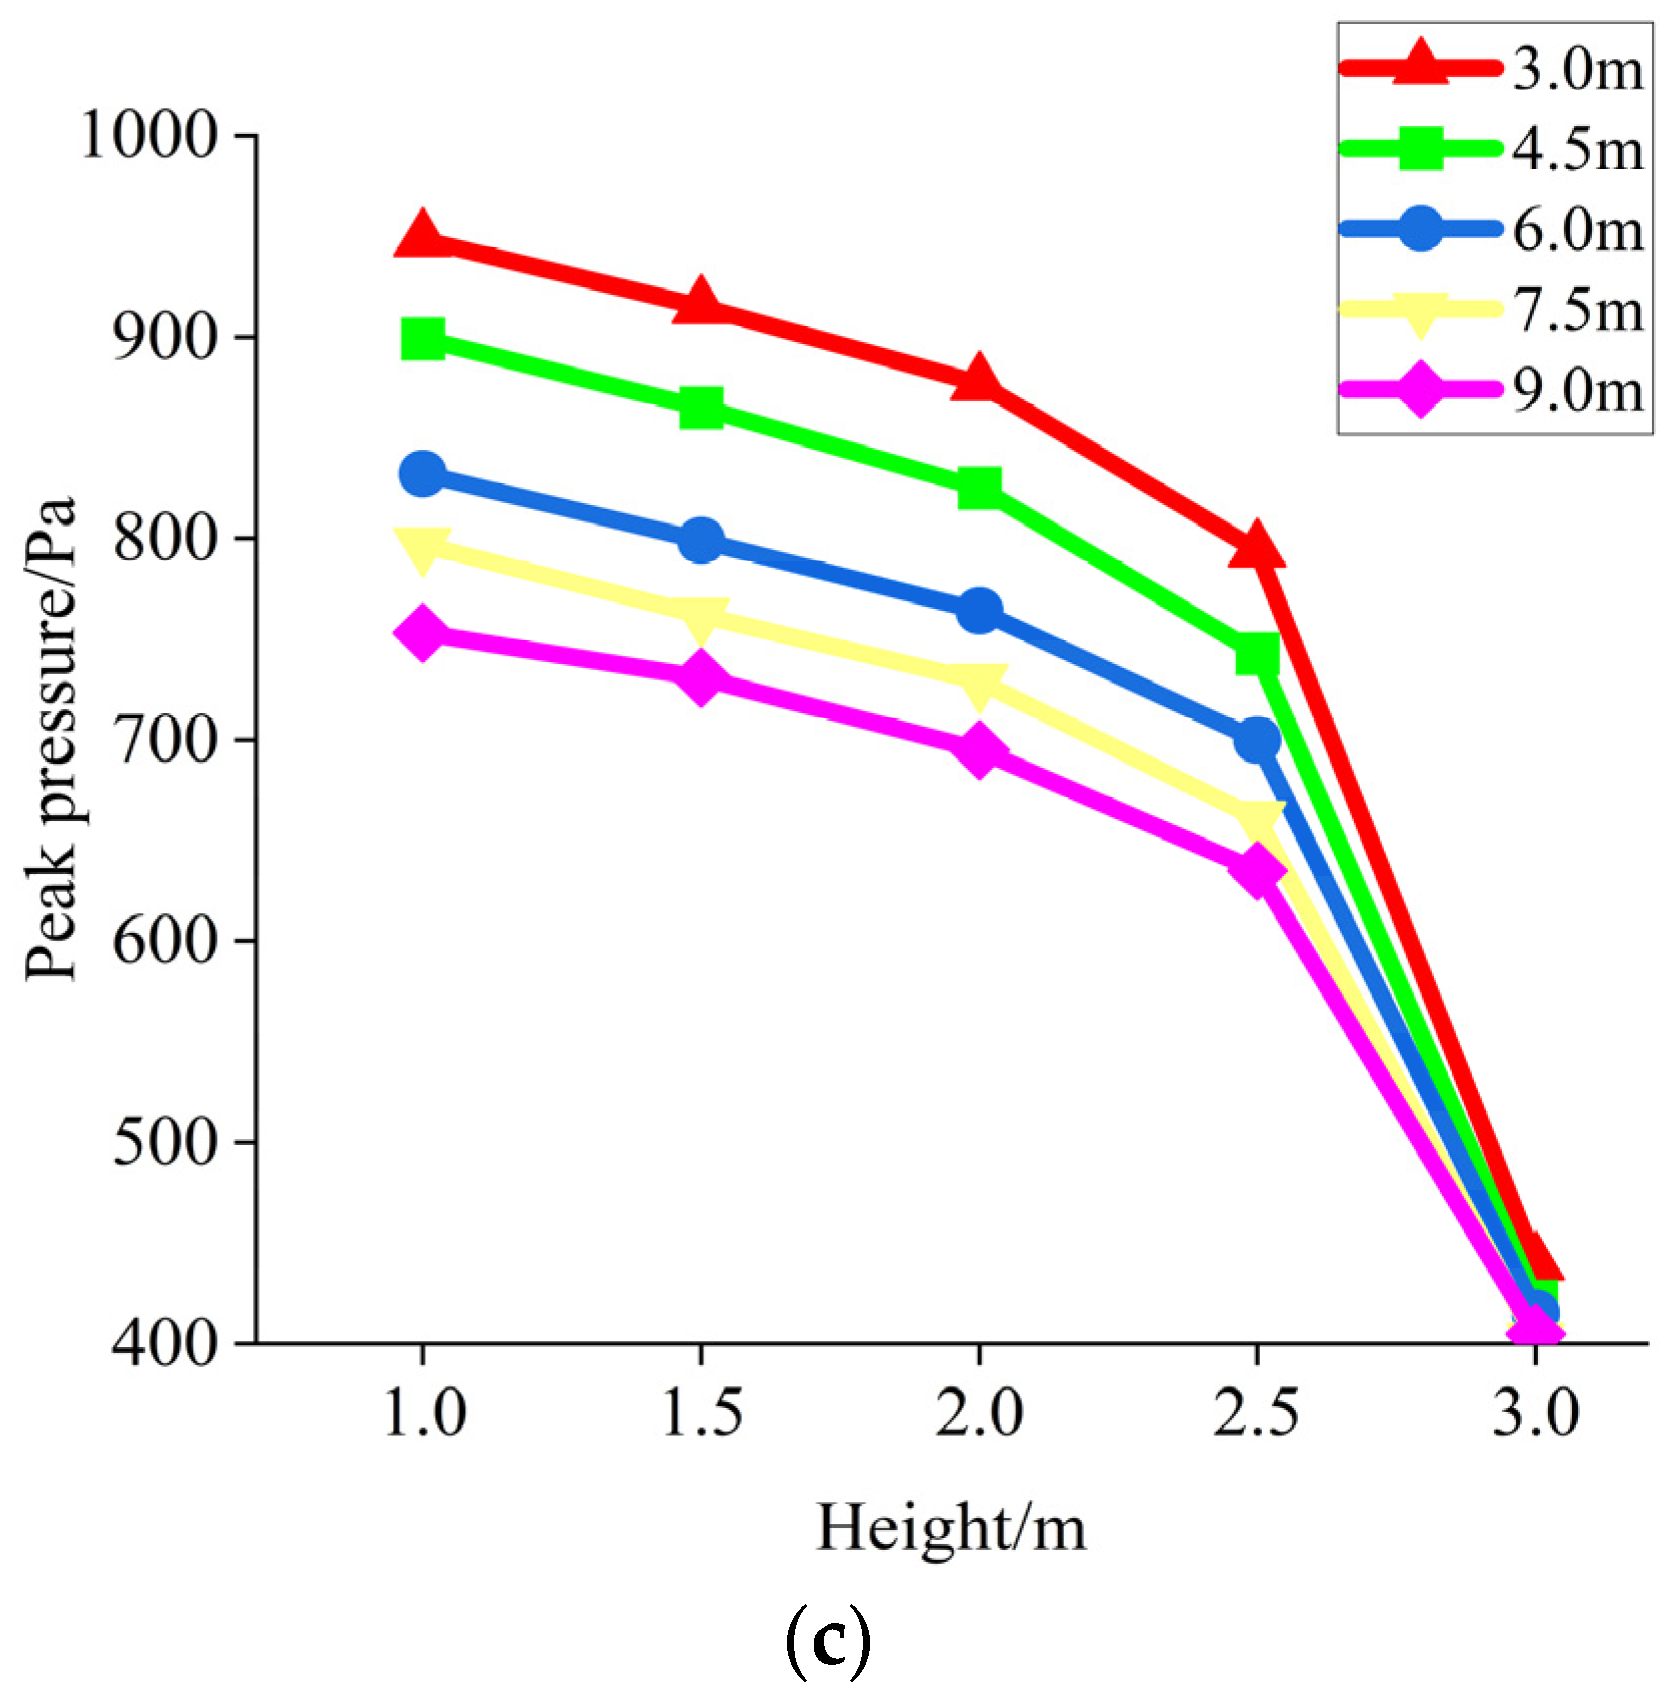
When a high-speed train passes through the sound barrier, it produces obvious “head wave” and “tail wave” effects, and the peak value of the “head wave” is obviously larger than the peak value of the “tail wave”; in the vertical direction of the sound barrier, the pressure reaches the peak value at the bottom, decreases gradually from the bottom to the top, and decreases rapidly when it is near the top of the sound barrier.
- (2)
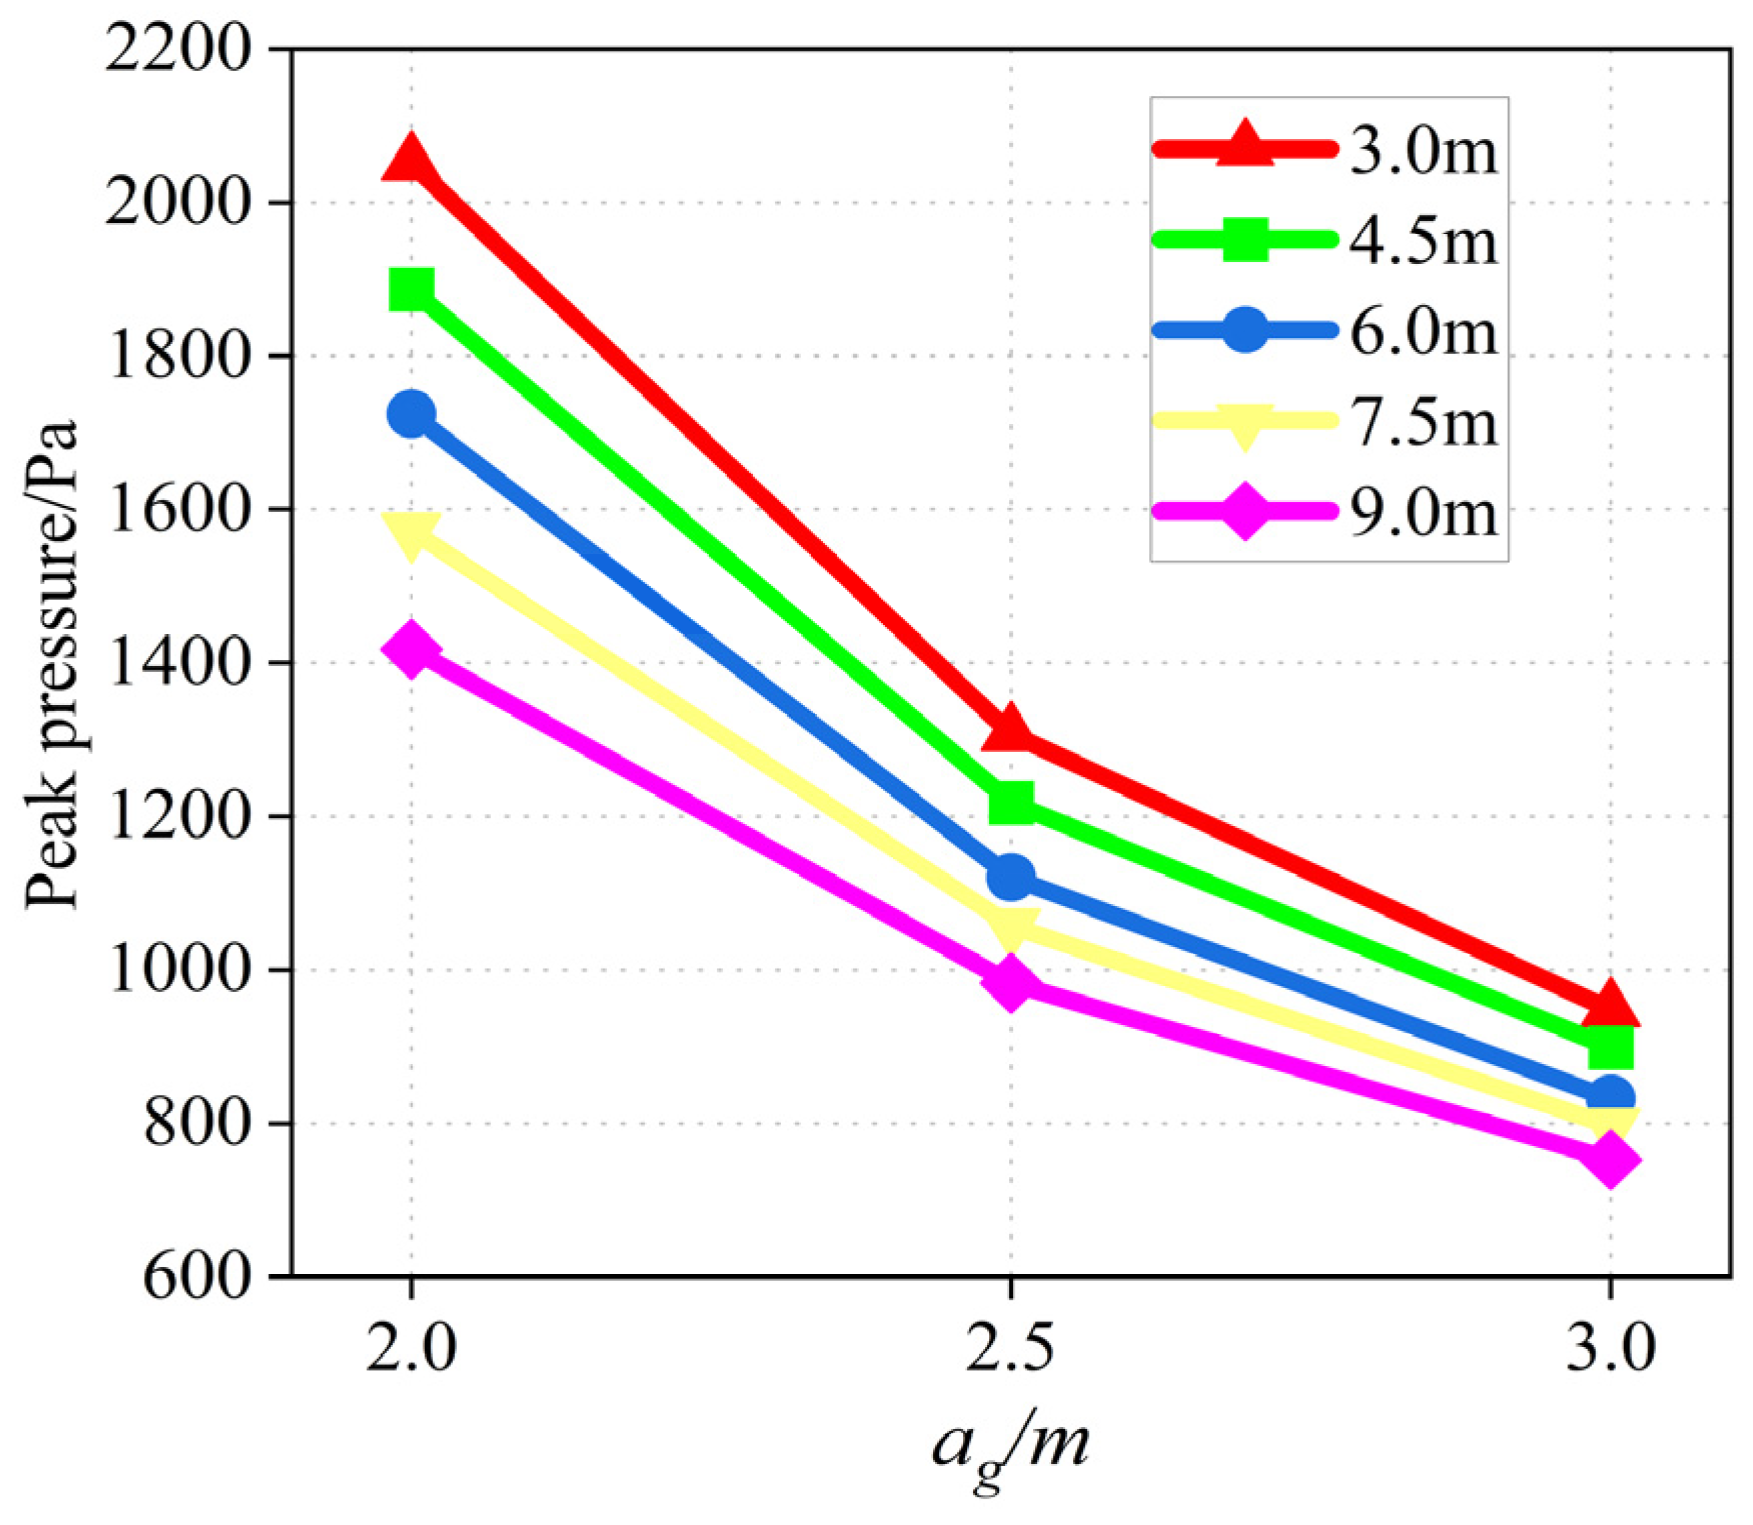
As the distance between the sound barrier and the center of the train gradually increases, the peak aerodynamic pressure on the surface of the sound barrier gradually decreases, showing a non-linear development trend.
- (3)
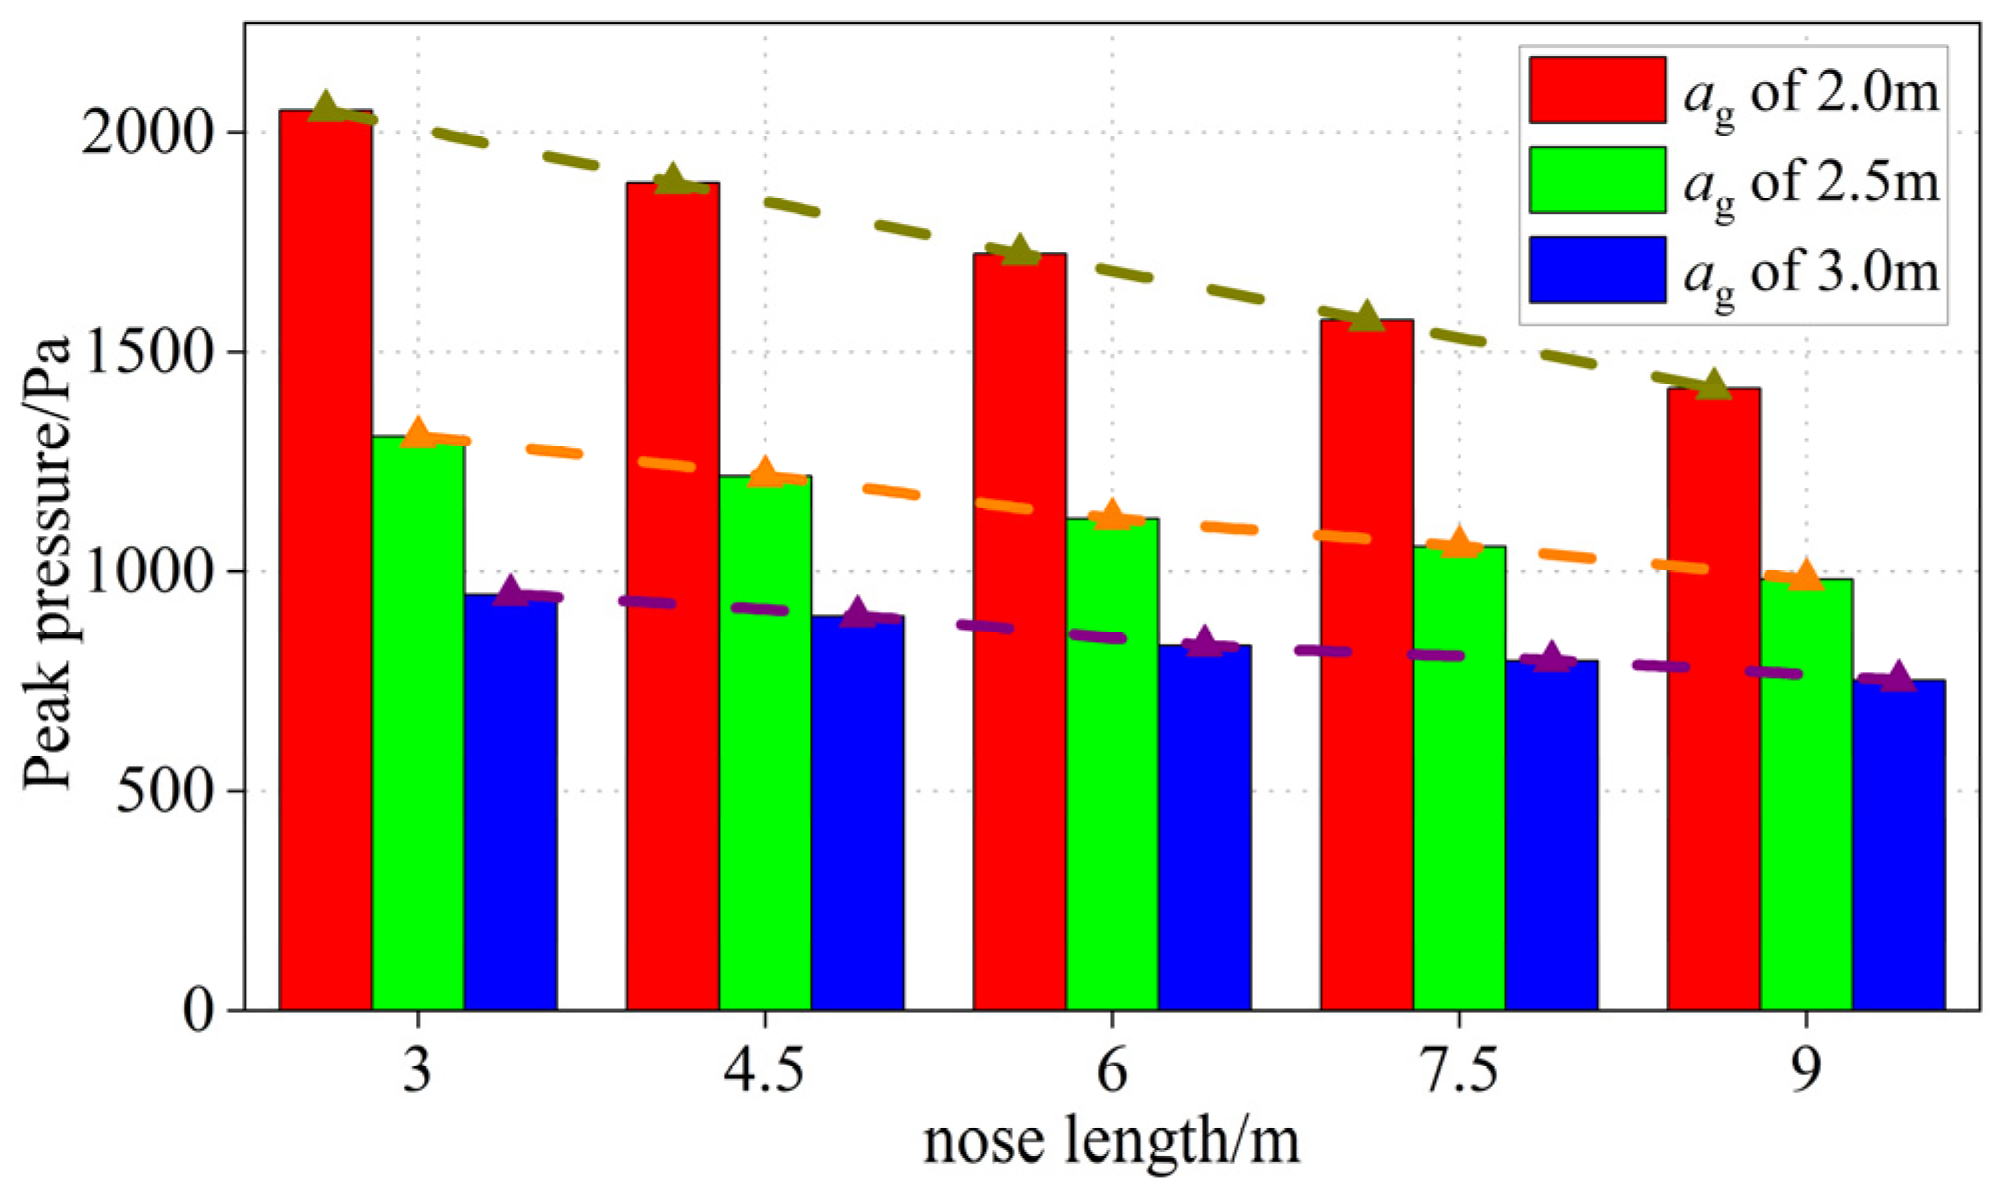
The nose length has a great influence on the aerodynamic force of the sound barrier, the aerodynamic pressure generated by a train with a long nose length is smaller than that of a train with a short nose length, and the formula for calculating the aerodynamic pressure generated by a high-speed train on the sound barrier with respect to the nose length has been established.
This study focuses solely on the distribution of aerodynamic pressure on vertical sound barriers when a train passes. A limitation is that it does not address other types of sound barriers, such as semi-enclosed or fully enclosed sound barriers.


