Article

Green Solvent Extraction of Antioxidants from Herbs and Agro-Food Wastes: Optimization and Capacity Determination

by
Malo Hamieau
1,
Patrick Loulergue
2 and
Aleksandra Szydłowska-Czerniak
3,*
1
Univ Rennes, IUT de Rennes, F-35000 Rennes, France
2
Univ Rennes, CNRS, ISCR (Institut des Sciences Chimiques de Rennes)—UMR 6226, F-35000 Rennes, France
3
Department of Analytical Chemistry and Applied Spectroscopy, Faculty of Chemistry, Nicolaus Copernicus University in Toruń, Gagarina 7, 87-100 Toruń, Poland
*
Author to whom correspondence should be addressed.
Appl. Sci. 2024, 14(7), 2936; https://doi.org/10.3390/app14072936
Submission received: 25 February 2024 / Revised: 25 March 2024 / Accepted: 26 March 2024 / Published: 30 March 2024

Abstract

:
Herbs and agro-food wastes are rich sources of bioactive compounds vital for organisms and valuable for many fields of industry. Therefore, in this study, green deep eutectic solvents (DESs) such as choline chloride/citric acid (ChCl:CitA), glucose/citric acid (Gu:CitA), glucose/urea (Gu:U), betaine/citric acid (B:CitA), and betaine/urea (B:U) at a molar ratio of 1:1 for ultrasound-assisted extraction (UAE) of antioxidants from four herbs (chamomile—Cha, lemon balm—LB, mint—M, and nettle—N) and two agro-food wastes (buckwheat husk—BH and chokeberry pomace—ChoP) were proposed. The antioxidant capacity (AC) of the obtained extracts was evaluated utilizing three antioxidant assays: cupric reducing antioxidant capacity (CUPRAC = 0.0–429.9 μmol of Trolox (TE)/g); 2,2′-azino-bis(3-ethylbenzothiazoline-6-sulfonic acid) (ABTS = 0.0–146.5 μmol TE/g); and 2,2-diphenyl-1-picrylhydrazyl (DPPH = 11.9–170.3 μmol TE/g). The LB extracts revealed the highest CUPRAC (59.3–429.9 μmol TE/g), ABTS (30.7–144.3 μmol TE/g), and DPPH (32.6–170.3 μmol TE/g) values. Due to the lowest antioxidant potential of LB extracts prepared using ChCl:CitA (AC = 30.7–59.3 μmol TE/g) and the highest AC demonstrated by extracts based on B:U (AC = 144.3–429.9 μmol TE/g), the UAE conditions using a new DES consisting of ChCl and U were optimized by the Box–Behnken design (BBD). Effects of three independent variables, molar ratios of the ChCl and U (mol/mol), water content (%), and sonication time (t) on the AC of LB extracts were studied by response surface methodology (RSM). The results of principal component analysis (PCA) and hierarchical cluster analysis (HCA) demonstrated that different DESs had great differences in the extraction of antioxidant compounds from herbs and agro-food residues.

1. Introduction

In recent years, as a result of scientific research, a hypothesis has been put forward regarding the factors responsible for lifestyle diseases such as cancer, cardiovascular, lung, neurological diseases, degenerative changes in joints, diabetes, cataracts, aging processes, and allergies [1,2]. The leading cause of these changes in the human body is primarily oxidative stress, defined as the overproduction of free radicals and reactive oxygen species (ROS), surpassing existing anti-oxidative defense mechanisms in the human body and damaging cellular biomolecules, including proteins, lipids, and DNA. Endogenous antioxidants in the human body counterbalance the effect of free radicals and other ROS. Non-enzymatic and enzymatic endogenous antioxidants naturally exist in extracellular and intracellular environments to prevent ROS generation by interacting with them and neutralizing free radicals [1]. However, the body’s antioxidant system is incomplete without exogenous antioxidants such as phenolic compounds, vitamins C, A, and E, and carotenoids, the primary source of which is daily diet [2].
Many recent studies report that various herbs added to food products to improve color and sensory attributes of taste and aroma are vital to our diet. Moreover, herbs, as rich sources of bioactive compounds with antioxidant properties (polyphenols, non-flavonoid phenolics, carotenoids, vitamins), are widely used as an antimicrobial, anti-inflammatory, food preservative, and food ingredient stabilization [3,4,5].
Interestingly, herb residues and agro-food by-products still contain high amounts of bioactive components, such as polyphenols, vitamins, carotenoids, tannins, and other phytochemicals (minerals, dietary fibers, fatty acids, amino acids, prebiotics) with high nutritional value and antioxidant properties. Recently, the antioxidant potential of phenolic extracts from various by-products such as the distillation solid wastes of Greek oregano, rosemary, Greek sage, lemon balm, and spearmint [6], chestnut shell [7,8,9], berry biowaste [10], chokeberry pomace [11], grape pomace and skin [9,12], rapeseed, mustard, sesame meals and cakes [13,14], olive pomace and leaves, spent coffee grounds, brewer’s spent grain, fruit and vegetable leaves, pulp, peel, pomace and seeds [9,15,16], gray and black alder bark [17], and buckwheat hulls [18,19] have been investigated.
Industries such as agro-foods produce thousands of tonnes of waste that can contain antioxidants each year. The application of plant by-products enables agro-food corp to obtain value from them and avoids producing natural resources. Such waste management protects against environmental pollution and leads to a cheap source of bioactive components, which can be transformed into value-added products for other industries.
Thus, there is potential to increase the use of herbal and agricultural wastes in the food sector, including creating active biodegradable food packaging. However, extraction processes of antioxidants are necessary for the recovery of natural bioactive compounds from plant residues, which can be applied in food industries as functional additives, food flavoring, and preservatives. For example, diarylheptanoid-rich extracts isolated from gray and black alder bark containing oregonin [17] as well as flavonoids, mainly vitexin extracted from common buckwheat hull and rutin present in tartary buckwheat hull extracts [18], were used to improve the oxidative stability of mayonnaise samples. However, the fortification of rapeseed oil with the optimum extracts from rapeseed meal ethanol wash solutes containing phenylacetic and ferulic acids as the most predominant phenolic compounds delayed the oxidation processes of oils up to 45–61% [13]. Similarly, enrichment of the refined rapeseed oil with acetonic and methanolic rapeseed meal extracts rich in sinapine and sinapic acid was beneficial and increased the antioxidant properties of fortified oils [14]. Moreover, catechin, gallic acid, rosmarinic acid, resveratrol, and other phenolic compounds present in ethanolic extract of chestnut shells added to fresh cheese increased the total phenolic content and cheese’s overall antioxidant properties, enhancing its stability and shelf-life period and the nutritional value [8].
These antioxidant properties of biologically active substances isolated from plant wastes can also be of interest to cosmetic and pharmaceutical applications for the enhancement of therapeutic agent stability, photostability and protection of skin from UV rays, and formulation of new functional cosmetic and pharmaceutical ingredients [9]. It is known that different techniques and solvents, including traditional procedures and innovative processes, can be applied to extract antioxidant compounds from plant materials and by-products of agro-food industries [6,7,8,9,10,11,12,13,14,15,16,17,18,19]. Among them, solid–liquid extraction, Soxhlet extraction, heating–stirring extraction, ohmic heating extraction, homogenization-assisted extraction, heat refluxing extraction, high hydrostatic pressure-assisted extraction, supercritical and subcritical extraction, accelerated solvent extraction (ASE), microwave-assisted extraction (MAE), and ultrasound-assisted extraction (UAE) were employed. Often-used conventional extraction techniques have some limitations regarding the high organic solvent consumption, hazardous to human health and environmental pollution, the long extraction time required, and the low quality of the extracts obtained. Thus, unconventional alternatives for faster extractions, with better yield, quality, and purity, especially from edible materials and food by-products, are proposed. Additionally, a new extraction alternative involves replacing conventional organic solvents (methanol, acetone, ethyl acetate) with green solvents, offering enhanced extract quality and cost-effective extraction efficiency, minimizing the use of solvents and reagents while being more respectful of the environment and human health. Among traditional green solvents are water and glycerol, but with the growing demand for clean-label products, natural deep eutectic solvents (DESs) have been developed as an alternative to toxic organic solvents. DESs are solvents that consist of two (or more) components of plant origin, a hydrogen donor and a hydrogen acceptor capable of forming a liquid eutectic mixture with a lower melting point than its components due to the hydrogen bond interactions.
Recently, green solvents (different DESs and water) and organic solvents for extracting antioxidant compounds from herbs and agro-food by-products have been reported using conventional and unconventional extraction techniques (Table 1).
Some researchers optimized extraction process parameters to improve the efficiency of antioxidants from plant materials based on response surface methodology (RSM) [7,13,20,22,23]. RSM is a statistical tool that can optimize extraction conditions. The quantitative data from the appropriate experimental design are used to evaluate multiple parameters of complex extraction procedures and their interactions by generating less laborious and time-consuming mathematical models. On the other hand, only a few reports on applications of DESs in the extraction of phenolic compounds from buckwheat hull and chokeberry pomace were noted [11,27].
Therefore, in this study, antioxidants from the most popular herbs in Poland (chamomile—Cha, lemon balm—LB, mint—M, and nettle—N) and two agricultural wastes (buckwheat husk—BH and chokeberry pomace—ChoP) were extracted using the eco-friendly UAE technique and DESs formed by different mixing ratios of the hydrogen bond donor (HBD: citric acid—CitA and urea—U) and the hydrogen bond acceptor (HBA: choline chloride—ChCl, glucose—Gu, and betaine—B). Chemometric tools such as principal component analysis (PCA) and hierarchical cluster analysis (HCA) were applied to check similarities and differences between the antioxidant capacities (ACs) of the obtained extracts using three analytical methods: cupric reducing antioxidant capacity (CUPRAC); 2,2′-azino-bis(3-ethylbenzothiazoline-6-sulfonic acid) (ABTS); and 2,2-diphenyl-1-picrylhydrazyl (DPPH). Moreover, the three factors (HBA/HBD ratio, water content, and extraction time) affecting the extraction process were optimized for the plant material with the highest AC by the RSM to achieve the best extraction effect.
The data obtained can be used to fill existing gaps in knowledge about the recovery of bioactive components from by-products of agro-food and herbal industries, enabling their application as functional ingredients in food products and packaging materials.

2. Materials and Methods

2.1. Chemicals and Plant Materials

All reagents for DES preparation and AC determination were of analytical or HPLC grade and were purchased from Merck Sp. z o. o. (Warszawa, Poland). Redistilled water was used for the preparation of solutions.
Four herbs (chamomile (Matricaria chamomilla L.)—Cha, lemon balm (Melissa officinalis L.)—LB, mint (Mentha spicata)—M, and nettle (Urtica dioica)—N) were provided by a commercial supplier in Poland, while two agro-food wastes (buckwheat (Fagopyrum esculentum Moench.) husk—BH and chokeberry (Aronia melanocarpa) pomace—ChoP) were kindly donated by domestic manufacturers. Plant samples in the original packing were stored in the dark at ambient temperature until treatment and further analysis.

2.2. Preparation of Deep Eutectic Solvents

All DESs were prepared by mixing each HBA and HBD component at specific molar ratios and placed in beakers, while the water content was controlled. The mixed components were kept at a temperature of 80 °C with a stirring rate of 400 rpm for 2–6 h until a perfectly clear and transparent liquid was formed.
The codes of the prepared DESs used in this study and details regarding their synthesis are listed in Table 2.

2.3. Ultrasound-Assisted Extraction of Antioxidants

The UAE of antioxidants from the studied four herbs—Cha, LB, M, and N—and two agro-food wastes—BH and ChoP—was performed according to a previously described methodology [28]. The analyzed plant materials were ground into a powder with an approximate mean particle diameter of 0.5 mm. Next, 0.5000 g of each pulverized material and 5.0 mL of the prepared DESs (Table 2) were transferred into glass tubes and extracted using an ultrasonic bath (Sono Swiss, SW 6H, Labo Plus, Warszawa, Poland) with an ultrasonic frequency of 37 kHz and ultrasonic power effective of 150 W at a temperature of 50 °C for 10 min. After ultrasound treatment, mixtures were centrifuged at 4500 rpm (MPW-54, Chemland, Stargard, Poland) for 5 min, and the supernatants were collected. The same sample was extracted in triplicate. The supernatants were kept in amber glass bottles and stored in the refrigerator before AC determination.

2.4. Analytical Methods for Antioxidant Capacity Determination

The ACs of 36 extracts from 6 plant materials prepared in 6 different DESs were determined by three spectrophotometric assays: CUPRAC, ABTS, and DPPH, previously described in our work [29]. The absorbance of each studied solution was read in three repetitions using a Hitachi U-2900 spectrophotometer (Tokyo, Japan) in a 1 cm glass cell. The AC results were expressed as μmol Trolox equivalents (TEs) per 1 g of sample.

2.4.1. CUPRAC Method

In brief, 0.1 mL of each extract, 2 mL of 0.01 mol Cu(II)/L, 2 mL of neocuproine solution (0.0075 mol/L), and 2 mL of ammonium acetate buffer (pH = 7) were transferred into 10 mL volumetric flasks and made up to volume with redistilled water. The obtained solutions were kept at room temperature for 30 min. The absorbance was measured at 450 nm against a reagent blank (2 mL of CuCl2, 2 mL of neocuproine solution, and 2 mL of ammonium acetate buffer made up to 10 mL with redistilled water).
Calibration curves were prepared using working solutions of TE in methanol between 6.00 × 10⁻³ and 7.00 × 10⁻² μmol/mL. Three calibration curves were plotted using the least-squares method resulting in the equation A450 = (18.35 ± 0.08)cTE + (0.013 ± 0.001), R2 = 0.9979.

2.4.2. ABTS Method

In this procedure, 0.05–0.1 mL of diluted extracts was added to 2.45–2.40 mL of ABTS•+ solution (7 mmol/L), and the mixtures were incubated at 30 °C for 5 min. The absorbance was measured at 734 nm against a reagent blank (2.5 mL of ABTS•+ solution).
The scavenging of ABTS was calculated using Equation (1):
% A B T S s c a v e n g i n g = A c o n t r o l A s a m p l e A c o n t r o l × 100 %
where Acontrol = absorbance of ABTS•+ + methanol; Asample = absorbance of ABTS•+ + sample extracts (or standard solutions).
Calibration curves were prepared using working solutions of TE between 2.50 × 10⁻² and 1.50 × 10⁻¹ μmol/mL. Three calibration curves were plotted using the least-squares method resulting in equation %ABTSscavenging = (361.52 ± 4.42)cTE + (9.78 ± 0.23), R2 = 0.9899.

2.4.3. DPPH Method

Briefly, 0.1 mL of diluted extracts was added to 1.9 mL of methanol. Next, 0.5 mL of DPPH methanolic solution (304.0 μmol/L) was introduced, and the obtained mixtures were shaken vigorously and then left in darkness for 15 min. The absorbance was measured at 517 nm against a reagent blank (2 mL of methanol and 0.5 mL of DPPH methanolic solution). The scavenging of DPPH was calculated using Equation (2):
% D P P H s c a v e n g i n g = A c o n t r o l A s a m p l e A c o n t r o l × 100 %
where Acontrol = absorbance of DPPH + methanol; Asample = absorbance of DPPH + sample extracts (or standard solutions).
Three calibration curves were prepared using working solutions of TE in methanol between 0.02 and 0.10 µmol/mL. The least-squares method was applied to calculate the line equation %DPPHscavenging = (702.89 ± 7.34)x − (4.61 ± 0.92), resulting in a determination coefficient R2 = 0.9799.

2.5. Box–Behnken Optimization

Box–Behnken design (BBD) with 3 factors and 3 levels ranging from low (−1) to medium (0) to high (+1), consisting of 15 experimental runs, was employed for the optimization of DES–UAE procedure. The corresponding codes and real values for each variable are presented in Table 3.
The effects of the independent variables—ChCl:U ratio, WC in DES, and extraction time (t)—on the dependent variable—AC of the prepared extracts determined by the CUPRAC, ABTS, and DPPH methods—were evaluated. After obtaining the data, response surface methodology (RSM) was used to determine the optimal processing setting for each independent variable.
The partial cubic model (PCM) was assumed for predicting three responses: CUPRAC, ABTS, and DPPH. The proposed model for each response of Yn was expressed according to Equation (3):
Y n = β 0 + β 1 × C h C l : U + β 2 × W C + β 3 × t + β 11 × C h C l : U 2 + β 22 × W C 2 + β 33 × t 2 + β 12 × C h C l : U × W C + β 13 × C h C l : U × t + β 23 × W C × t + β 112 × C h C l : U 2 × W C + β 113 × ( C h C l : U ) 2 × t
where Yn is one of the three predicted responses: CUPRAC, ABTS, and DPPH; ChCl:U, WC, and t represent the independent variables; β0 is the constant; β1, β2, and β3 are the linear term coefficients; β11, β22, and β33 are the quadratic term coefficients; and β12, β13, β23, β112, and β113 are the cross-term coefficients.
The quality of the developed PCM was estimated by the calculation of the determination coefficient (R2) values, whereas analysis of variance (ANOVA) was used to evaluate the statistical significance of the proposed model by the values of regression and the mean square of residual error.

2.6. Statistical and Chemometric Analyses

The obtained results were expressed as mean ± standard deviation (SD). All data were statistically tested using analysis of variance (ANOVA), and the means were compared by one-factor ANOVA with subsequent comparisons by Duncan’s test at a significance level at 0.05. In addition, data were subjected to chemometric analyses as principal component analysis (PCA) and hierarchical cluster analysis (HCA). PCA was employed to study the clustering and differentiation of 36 extracts of four herbs (Cha, LB, M, and N) and two by-products (BH and ChoP) obtained using six various DESs based on CUPRAC, ABTS, and DPPH results. The scores and loadings of the data analyzed by PCA were displayed as a bi-plot. HCA with Ward’s method using Euclidean distances was also applied to identify analyzed extracts based on the degree of similarity among their total antioxidant potential. HCA was also used for grouping AC determined by different analytical methods in order to recognize their ability to determine the reducing capability and radical scavenging activity by antioxidants present in prepared plant extracts. The similarities of extracts and analytical methods applied for analyzing their AC were represented on two-dimensional diagrams (dendrograms).
The statistical and chemometric analyses, including the BBD–RSM, were performed using Statistica Windows software package (version 8.0, StatSoft, Tulsa, OK, USA).

3. Results and Discussion

3.1. Comparative Performance of Different DESs for Antioxidant Extraction

The experimental AC values of 36 extracts of four herbs (Cha, LB, M, and N) and two agricultural residues (BH and ChoP) obtained by six green DESs (ChCl:CitA, Gu:CitA, Gu:U-30, Gu:U-50, B:CitA, and B:U) and determined using three analytical methods (CUPRAC, ABTS, and DPPH) are depicted in Figure 1.
As can be seen, the values of ACs for studied extracts determined by the modified analytical procedures differ significantly from each other (Figure 1, Duncan test). This variability can be explained by the influences of (1) the chosen DES type, its viscosity and polarity affecting the extraction efficiency of antioxidants, (2) analytical parameters of the applied analytical assays, and (3) genetic, agronomic, and environmental factors, which would affect the level of antioxidants in natural plant materials and residues from them. DES polarity and viscosity mainly depend on their constituents, the molar ratios of HBAs to HBDs, and the water content in the DES [30].
These studies suggest that amide HBDs (urea) were more suitable for extracting antioxidant compounds present in the analyzed plant materials than acid HBDs (citric acid). Among the tested green solvents, the DES based on betaine (B) and urea (U) (1:1) had the highest performance in extracting antioxidants capable of forming a color Cu(I)-chelate after the reduction of Cu(II) to Cu(I). Therefore, the studied extracts (except BH) prepared based on B:U (1:1) revealed the highest CUPRAC values ranging between 56.7 μmol TE/g for Cha and 429.9 μmol TE/g for LB (Figure 1a). Similarly, B:U (1:1) was the best DES to recover the antioxidants from LB, M, and ChoP, which could scavenge ABTS•+ and DPPH radicals (ABTS = 136.8–146.5 μmol TE/g and DPPH = 145.2–170.3 μmol TE/g, Figure 1b,c). Interestingly, the highest ABTS results (40.5–136.5 μmol TE/g) for Cha, N, and BH extracts were obtained using glucose (Gu) and urea (U) as DES after adding 30% of water (Gu:U-30), whereas these samples had the highest DPPH values (101.7–111.5 μmol TE/g) using also the same DES mixed with a higher water concentration of 50% (Gu:U-50). These results suggest that the addition of a higher WC (50%) reduced the viscosity of a DES based on Gu:U and improved the mass transfer. Thus, the extraction efficiency of antioxidants with the ability to scavenge DPPH radicals was enhanced. However, adding excessive amounts of water probably suppressed the interactions between the DES constituents (Gu and U) and reduced the performance of this green solvent in the extraction of antioxidants capable of quenching ABTS•+ cation radical. Unexpectedly, more water can break the hydrogen bond network between HBD and HBA, resulting in a ruptured Gu:U structure [31]. Apart from this, high WC in Gu:U solvent may enhance the preferential Gu hydration, thereby reducing the extraction efficacy.
Surprisingly, the ABTS•+ cation radical is the least sensitive to antioxidant compounds present in the investigated plant extracts prepared by all proposed types of DESs (ABTS = 0.0–146.5 μmol TE/g < DPPH = 11.9–170.3 μmol TE/g < CUPRAC = 0.0–429.9 μmol TE/g).
Evidently, among the studied herbs, the richest source of antioxidants (regardless of the applied analytical tests) was LB, while the ChoP as agricultural waste revealed more potent antioxidant properties than BH (Figure 1). However, LB extract obtained by ChCl:CitA–UAE exhibited approximately 7.2, 4.7, and 5.2 times lower CUPRAC, ABTS, and DPPH results, respectively, than those achieved using B:U.
As shown in Figure 1, M extracts obtained with all six DESs had somewhat lower antioxidant properties (CUPRAC = 60.2–358.2 μmol TE/g, ABTS = 21.3–136.8 μmol TE/g, and DPPH = 29.6–162.8 μmol TE/g) than the LB extracts (CUPRAC = 59.3–429.9 μmol TE/g, ABTS = 30.7–144.3 μmol TE/g, and DPPH = 32.6–170.3 μmol TE/g). Importantly, insignificant differences in ABTS results for LB, N, and ChoP extracts obtained by the Gu:U-30–UAE procedure were observed (Figure 1b, Duncan test). The Duncan test also indicated that the effectiveness of Gu:U-50 in extracting bioactive compounds from Cha, N, and BH, which can neutralize DPPH radicals, did not differ significantly (Figure 1c).
Similarly, Bouloumpasi et al. [6] reported that among five studied ethanolic extracts of post-distillation solid residues, lemon balm presented the highest antioxidant activity determined using ABTS, DPPH, and FRAP assays, followed by spearmint, Greek oregano, Greek sage, and rosemary, respectively.
On the other hand, the selected ChCl-based DES, Gu-based DESs, and B-based DESs affected the AC of plant extracts (Figure 2). Various DES types have shown differences in the extractability of antioxidants from four herbs and two by-products. This can be explained by the disparate hydrogen bonding and π–π interactions of target antioxidant molecules with particular DESs [32].
Among six prepared DESs, DES6 composed of B and U (1:1) demonstrated the highest extraction efficiency for antioxidants from LB, M, and ChoP, whereas the Gu-based DESs (DES3 and DES4) were the best green solvents for the recovery of antioxidants from Cha, N, and BH (Figure 2). Although, Gu:U (1:1) with a lower water amount of 30% (DES3) can be deemed the most effective extraction solvent for compounds having antioxidant potential from N and BH (Figure 2d,e). However, increasing the WC to 50% in this green solvent (DES4) increased extraction effects on antioxidants in Cha (Figure 2a). In contrast, Figure 2 shows that two DESs (DES1 and DES5) containing CitA (ChCl:CitA and B:CitA) had the lowest extraction efficiency for antioxidant compounds from the studied samples.
Moreover, among five lactic acid-based DESs, lactic acid/glycine/water (3:1:3) was found to be significantly more potent in extracting antioxidants from dittany, marjoram, mint, and sage with the highest ability to scavenge DPPH radicals. The highest antiradical activity (above 2000 μmol DPPH/g dw) had sage and mint extracts [24].
In addition, higher amounts of total phenolics extracted from chokeberry pomace were achieved using green solvents such as 50% glycerol + 1% formic acid or 50% ethanol + 1% citric acid (TPC = 8676–11,036 mg gallic acid (GA)/100 g) compared to water and ethanol acidified with 1% of these two acids (TPC = 2712–9268 mg GA/100 g dw) [11].
The solvent type (methanol, ethanol, and water) used for the extraction of total antioxidants from nettle by three different techniques (UAE, without stirring extraction, and stirring extraction) affected the DPPH and ABTS values of the obtained extracts [25]. The highest DPPH values had nettle extracts prepared using water as a solvent and traditional extraction without stirring (DPPH = 87.7%) and with stirring (DPPH = 91.1%), as well as methanol and UAE (DPPH = 90.2%). In contrast, water extracts prepared by UAE and traditional extraction without stirring revealed the highest ABTS results (91.8% and 90.8%), whereas methanol was the most effective solvent for the stirring method to isolate the antioxidants with a high ability to ABTS•+ cation radical scavenging (86.6%).
Furthermore, buckwheat hull extracts prepared with 20% and 50% ethanol exhibited significantly higher DPPH (81.8–86.5%) and ABTS (85.9–95.4%) radical scavenging activities than those extracted by the other solvents such as 80% ethanol (DPPH = 71.3–72.2%, ABTS = 83.8–92.2%), ethanol (DPPH = 38.7–39.9%, ABTS = 65.1–74.0%), methanol (DPPH = 50.3–57.1%, ABTS = 67.1–74.1%), acetone (DPPH = 8.92–23.4%, ABTS = 21.0–32.6%), and water (DPPH = 67.7–72.1%, ABTS = 75.9–77.6%) for 2 h in a water bath [18]. Interestingly, the methanol extract of buckwheat hull had two and eight times higher DPPH values than the acetone and water extracts (DPPH = 165.8, 73.5, and 19.9 mmol TE/g, respectively) [19].

3.2. Chemometrics of the DES-Based Extracts

The chemometric approach was applied to visually distinguish the patterns, groupings, similarities, and differences between extracts of four herbs and two agro-food wastes prepared using six DESs and the UAE procedure.

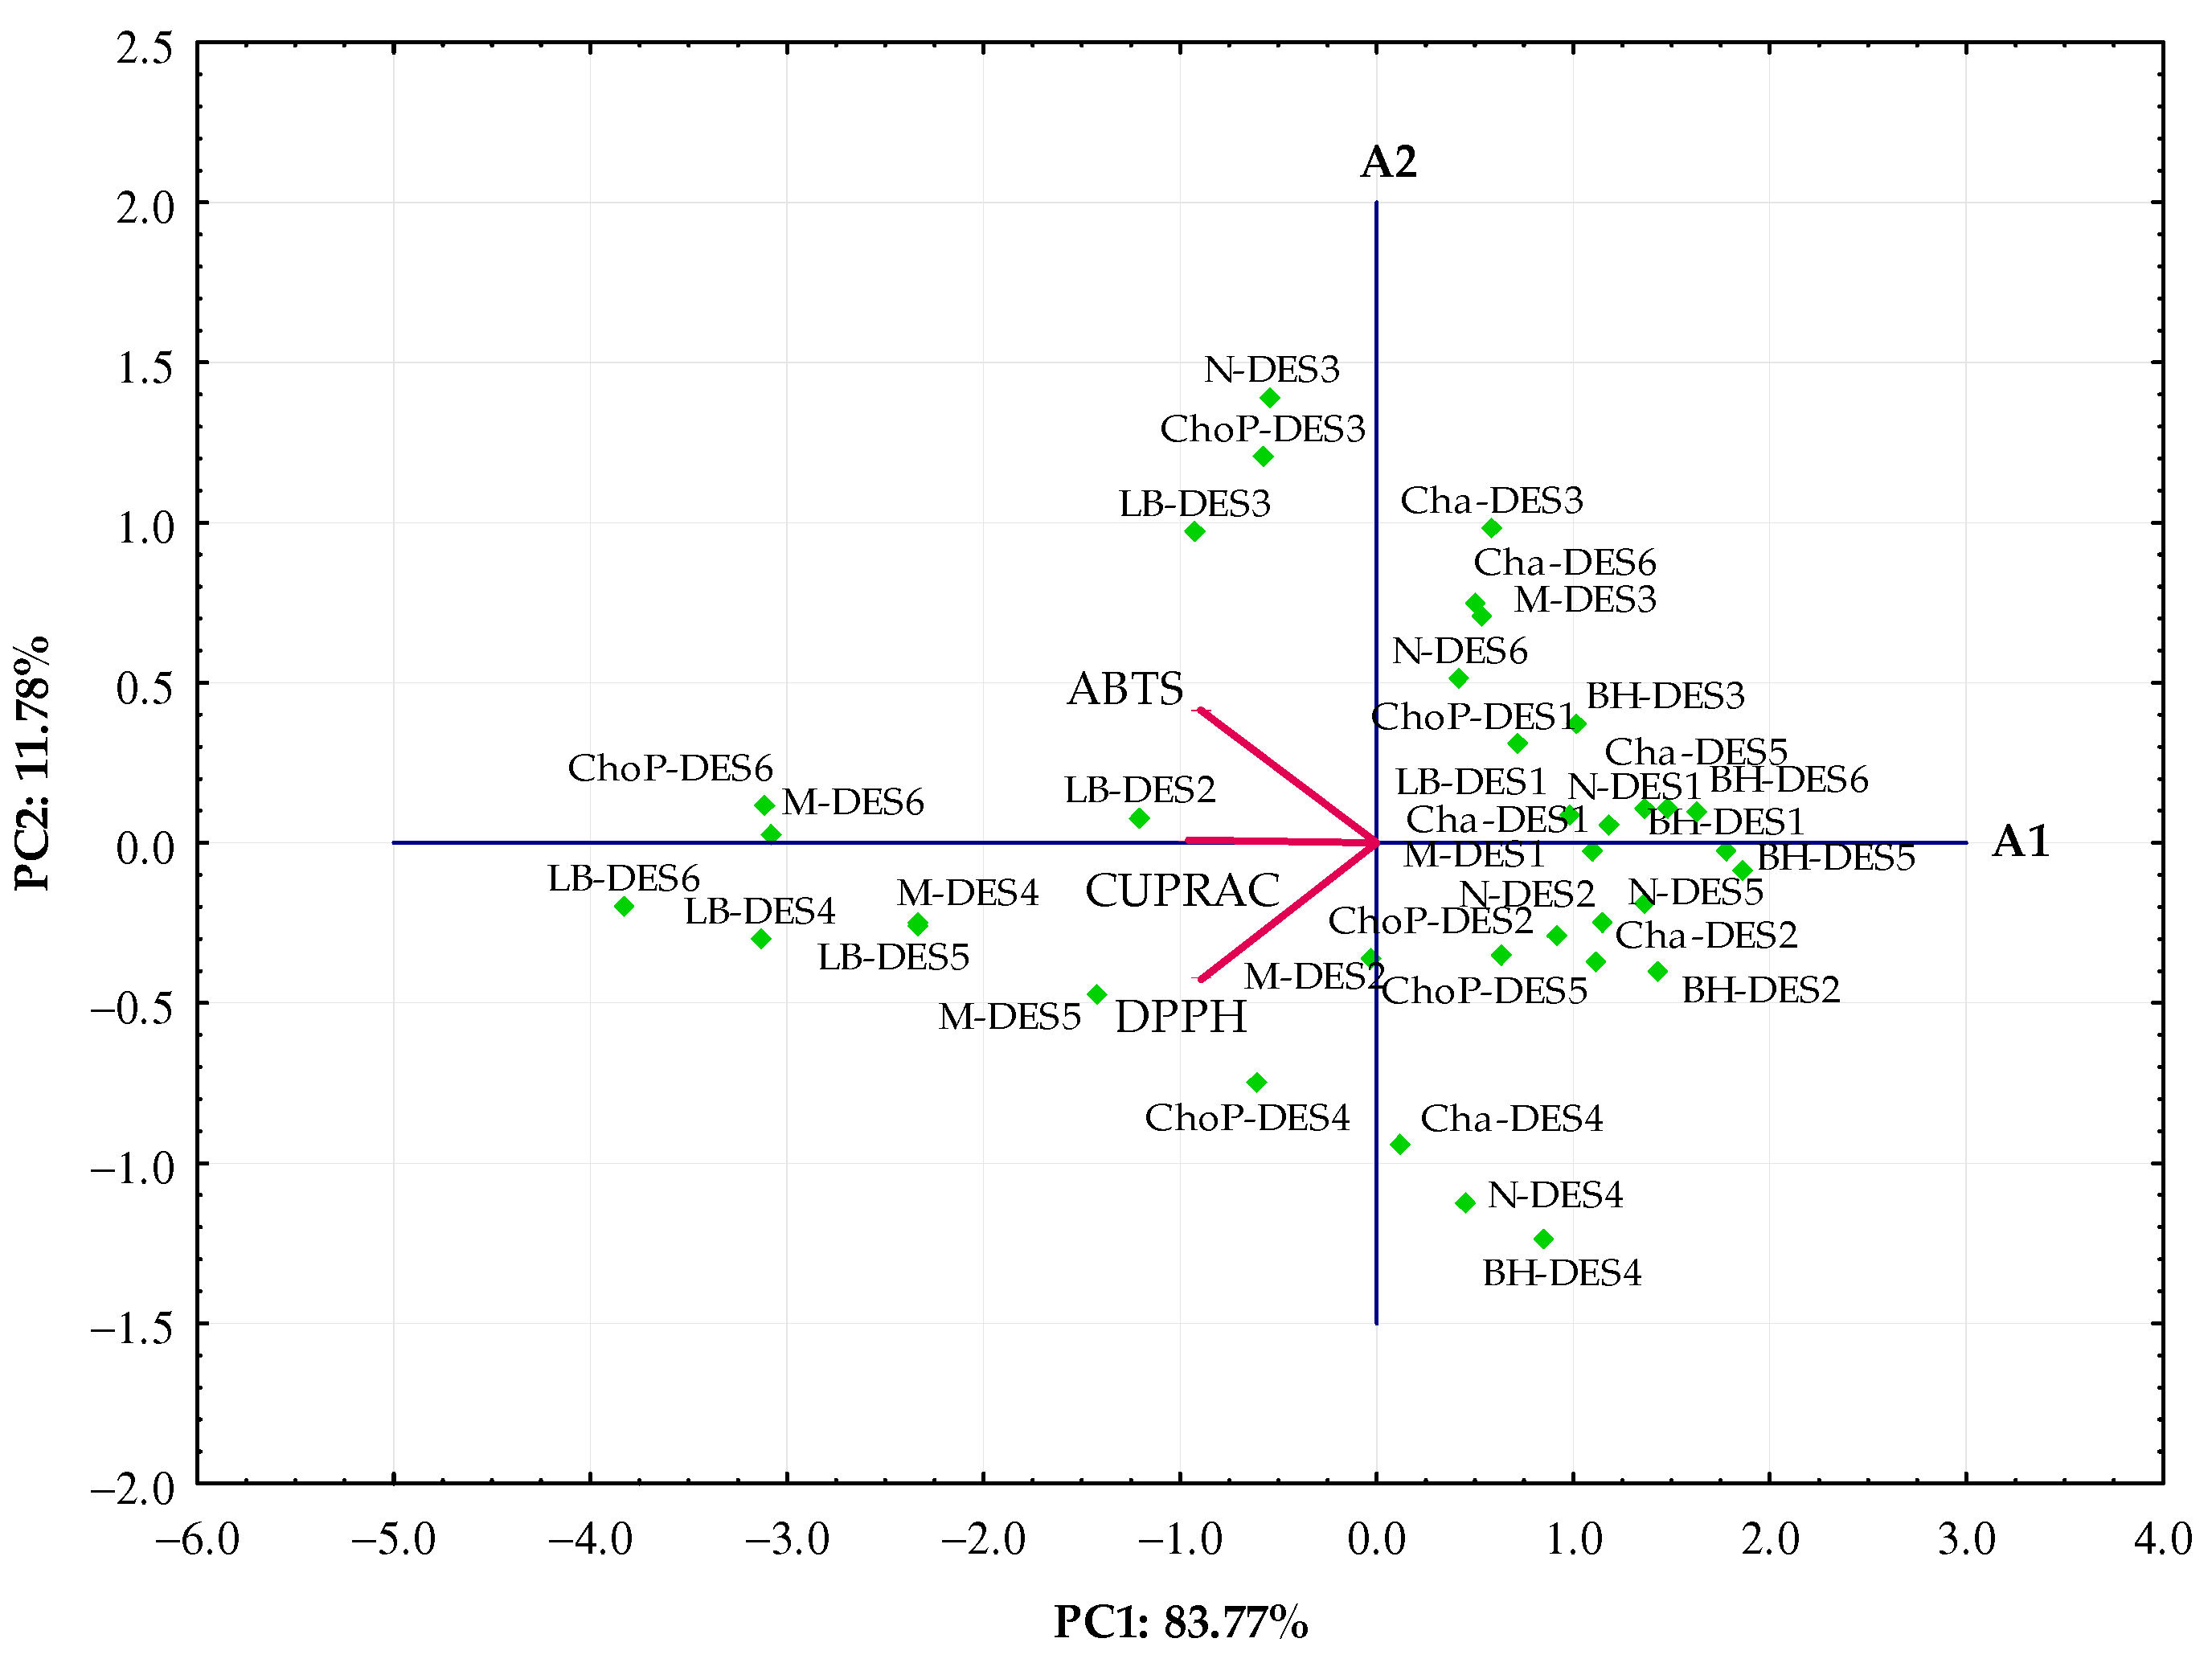
3.2.1. Principal Component Analysis

Multivariate processing of the AC data obtained for the studied extracts yielded two principal components (PC1 and PC2), with the variables explaining 95.55% of the total variability. PC1 explained 83.77% and PC2 was 11.78% of the total variability. The first principal component (PC1) had the highest eigenvalue of 2.51 and accounted for 83.77% of the variability in the data set, while the remaining two generated PCs (PC2 and PC3) yielded progressively lower eigenvalues (<1; 0.35 and 0.13) and did not explain the variability in the data (<16.22% total). PC1 inversely correlated with all variables: CUPRAC (−0.9567), ABTS (−0.8957), and DPPH (−0.8921). Moreover, PC2 was highly negatively contributed by DPPH (−0.4261). This suggests that PC1 is generally more correlated with the variables than PC2.
From the bi-plot of PC1 and PC2, as shown in Figure 3, ABTS and CUPRAC were the variables with negative loadings on PC1 and positive loadings on PC2, while DPPH was the feature with negative loadings on PC1 and PC2.
The depicted PCA bi-plot revealed that the LB, M, and ChoP extracts obtained using betaine- and glucose-based DESs (DES2–DES6, Table 2) with high antioxidant properties were located to the left in the score graph and had negative values for PC1. In contrast, all choline–chloride extracts (DES1), as well as Cha, N, and BH samples extracted with other green solvents (DES2-DES6), had lower AC values and were situated at the right in the diagram and had positive values for PC1.
As can be seen, extracts with high DPPH (LB and M extracted by DES4, DES5, and DES6 and DES4-based extracts of Cha, N, ChoP, and BH) as well as low ABTS and CUPRAC values (Cha, N, and ChoP obtained by DES2 and DES5) were located under the A1 axis (Figure 3). For this reason, these analyzed extracts fell into three distinct groups, respectively. However, three LB, N, and ChoP extracts obtained using DES3 (Gu:U-30) with the longest distance from others exhibited high ABTS results and similar medium values of CUPRAC and DPPH. In addition, all samples having the lowest antioxidant potential determined by three analytical methods were separated from other tested extracts. Although Cha-DES3, Cha-DES6, M-DES3, and N-DES6 extracts with low DPPH and similar moderate ABTS clustered around, these two green solvents were more suitable for the simultaneous extraction of compounds scavenging ABTS•+ cation radicals.
The PCA bi-plot revealed that the samples of herbs and agricultural residues can be clearly separated based on the type of DES mixture used to prepare extracts before AC determination.

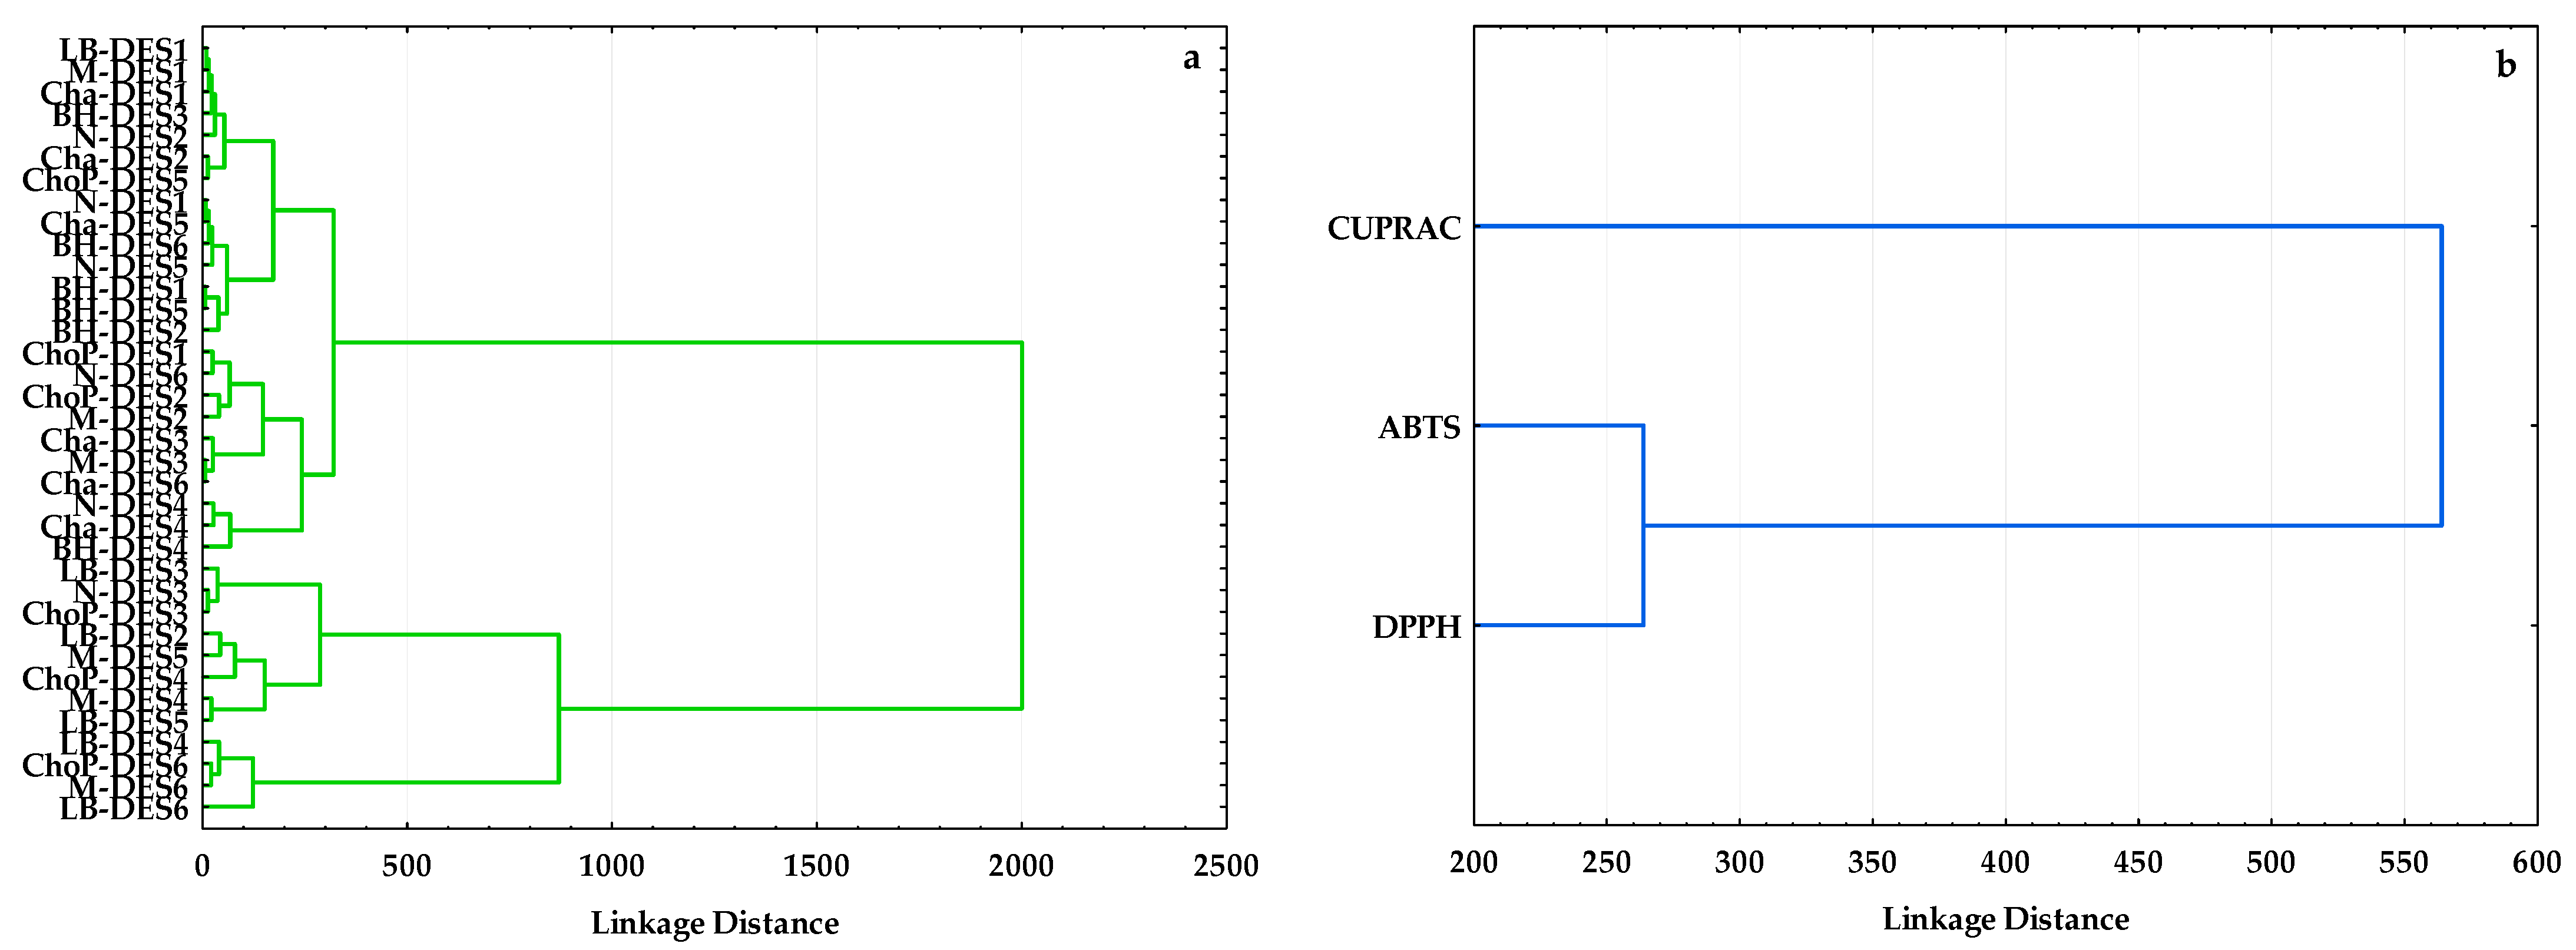
3.2.2. Hierarchical Cluster Analysis (HCA)

Hierarchical cluster analysis (HCA) was utilized for classification of the tested extracts prepared by the DES–UAE procedure on a similar basis. According to the results presented in Figure 4a as a dendrogram, different extracts of herbs and agro-food residues can be classified into two major categories accounting for their antioxidant properties determined by three analytical methods.
The dendrogram depicted a clear separation of twelve extracts (all LB extracts (except LB-DES1), three M extracts (M-DES4, M-DES5, and M-DES6), three ChoP extracts (ChoP-DES3, ChoP-DES4, and ChoP-DES6), and N-DES3 extract) with high antioxidant potential from the other analyzed samples. LB, M, and ChoP samples obtained using betaine-based DES6 (B:U) with the highest CUPRAC values, as well as LB, N, and ChoP samples prepared with DES3 (Gu:U-30) having high ABTS results, created two inter-clusters (Figure 1a,b and Figure 4a). As can be seen in the dendrogram, the second main group was divided into two sub-groups. Fourteen extracts (extracts from all herbs prepared with ChCl-based, BH extracts obtained with all DESs, N and Cha after extraction by DES2 and DES5 containing CitA, and ChoP-DES5) were arranged in one sub-group characterized by the lowest AC values determined by three analytical methods. However, the second sub-group clustered ten extracts (ChoP-DES1, N-DES6, ChoP-DES2, M-DES2, Cha-DES3, M-DES3, Cha-DES6, N-DES4, Cha-DES4, and BH-DES4), which exhibited moderate antioxidant potential. It is noteworthy that DES4 (Gu:U-50) extracted bioactive compounds with a high ability to scavenge DPPH radicals from Cha, N, and BH, which differentiated them in this sub-group (Figure 1c and Figure 4a).
Importantly, various DESs can highly efficiently extract antioxidants and further distinguish the different plant materials.
Additionally, HCA depicted two clusters and connections between three assays utilized for the AC determination of herbs and waste extracts (Figure 4b). The ABTS and DPPH methods formed a distinct group and were more closely connected to each other, while the CUPRAC test clearly separated from this cluster.
This can be explained by the fact that ABTS and DPPH tests are classified as mixed-mode assays, where hydrogen atom transfer (HAT), electron transfer (ET), and proton-coupled electron transfer (PCET) mechanisms play different roles in varied proportions, depending on the corresponding reaction conditions (pH and solvent) [33]. These analytical methods are based on the scavenging of a stable radical chromophore (ABTS•+ and DPPH) by antioxidants; thus, they allow for the measuring the radical scavenging activity of the samples. However, CUPRAC is a well-known ET-based method associated with Cu(II) reduction to Cu(I) by antioxidants in the presence of neocuproine as a ligand and generation of a yellow–orange complex with a maximum absorption peak at 450 nm. Moreover, CUPRAC and ABTS methods can be applied to matrices containing hydrophilic and lipophilic antioxidants, whereas the DPPH test has a higher affinity toward lipophilic than hydrophilic antioxidants.

3.2.3. Correlations between Antioxidant Capacity Methods

The degree of linear association between the three analytical methods applied for AC measurements was determined using regression analysis and calculating Pearson correlation coefficient (r). The calculated r values presented in Figure 5 indicate that there are significant associations among AC results of all extracts determined by CUPRAC, ABTS, and DPPH assays (r ranged between 0.6466 and 0.8138, p = 0.000000001–0.00002).
These high r values demonstrated strong relationships between the ET-based CUPRAC method and the scavenging activity of antioxidants present in the analyzed extracts toward stable ABTS•+ cation radicals and DPPH radicals. Unexpectedly, the lowest r = 0.6466 for ABTS and DPPH can be explained by the fact that examined extracts obtained by six different DESs were not rich sources of antioxidants, which at the same time are capable of neutralizing ABTS•+ cation radicals and DPPH radicals.
For comparison, a higher significant linear correlation (r = 0.979, p < 0.001) between ABTS and DPPH results for extracts from the perennial herb Blumea aromatica prepared using seven deep eutectic solvents (ChCl:LA (1:3), ChCl:AceA (1:3), ChCl:Eth (1:3), ChCl:U (1:3), ChCl:Ge (1:3), ChCl:Be (1:3), and ChCl:OxaA (1:2)) and three traditional solvents (ethanol, methanol, and water) was demonstrated by Dai et al. [34]. In addition, statistical analysis revealed positive correlations (r = 0.4226–0.8603) between the AC determined by DPPH and FRAP tests and the total contents of phenolics and flavonoids in five extracts from Greek medicinal plants (dittany, fennel, marjoram, mint, and sage) prepared using LA-based DESs, EtOH (60%), and UAE techniques [24]. Similarly, ABTS values for ethanolic extracts of chokeberry (Aronia melanocarpa) prepared by four different extraction methods (UMAE, UAE, MAE, and TSE) highly correlated with DPPH results (r = 0.9843) [26]. High correlation coefficients (0.813–0.906) between ACs determined by DPPH, ABTS, and FRAP assays were also found for water infusions of 87 medicinal herbs and spices [4]. Nevertheless, Popova et al. [35] observed very strong correlations (r = 0.9514–0.9999) between CUPRAC, DPPH, and FRAP values and TPC in the water extract of Melissa officinalis L. herb.

3.3. Optimal Green Solvent Design for Antioxidant Extraction from Lemon Balm

The above AC results suggested that the capability of DESs to extract antioxidant compounds differed depending on the type of DES mixture, which was probably because DESs with various HBAs and HBDs can form intermolecular hydrogen bonds of different strengths with bioactive compounds, resulting in additional extraction capabilities.
Therefore, ChCl:U was selected as the optimal new DES for recovering antioxidants from the richest source, such as LB.
A BBD was employed to investigate the effects of the ChCl:U molar ratio, the water content (WC) in this DES, and extraction time (t) on the antioxidant potential analyzed by three analytical assays, creating a total of 15 experiments under different conditions. The experimental and predicted CUPRAC, ABTS, and DPPH values of the obtained LB extracts are listed in Table 4.
As can be seen in Figure 6, the antioxidant properties of the LB extracts prepared by the UAE technique with the ChCl-based DES differ significantly from each other (Table 4, Duncan test).
This variability can be explained by the influence of extraction conditions (ChCl:U, WC, and t) as well as analytical parameters of the proposed assays, which would affect the total level of antioxidants. The highest antioxidant properties (CUPRAC = 493.7 μmol TE/g, ABTS = 273.5 μmol TE/g, and DPPH = 209.5 μmol TE/g) had LB extract treated for 15 min by ChCl:U solvent synthesized in the 1:1 ratio with 40% WC. In contrast, the same molar ratio (1:1) of ChCl-based DES components containing the lowest concentration of water (WC = 20%) extracted during the shortest time (t = 5 min) the lowest amount of total antioxidants from LB (CUPRAC = 133.9 μmol TE/g, ABTS = 53.9 μmol TE/g, and DPPH = 84.9 μmol TE/g). This suggests that the AC of the resulting extracts increased with an increase in WC in the utilized DES by prolonging the UAE time because the effect of acoustic cavitation can completely crack LB cells and prompt the release of antioxidant components from them into the green solvent.
Furthermore, insignificant differences in AC results were observed between LB extracts obtained under the following conditions: ChCl:U = 1:2 and 3:2, WC = 40 and 30%, and t = 10 and 15 min, respectively (exps. 3, 4, 7, and 8) (Table 4, Figure 6, Duncan test). However, changing the ChCl:U ratio from 1:2 to 3:2, without changing the WC (20 and 30%) in DES and time (10 and 5 min, respectively), reduced the extraction of compounds with antioxidant features from LB (exps. 1, 2, 5, and 6). In these cases, the higher amount of ChCl in DES significantly decreased the binding of the chloride anion to the target antioxidant compounds, thereby hampering the extraction potency of this DES (Figure 6).
It is noteworthy that WC in ChCl:U solvent and the extraction time (t) significantly affected the AC of LB (Table 4 and Figure 6). In this study, adding water to ChCl:U reduced the viscosity of this DES and increased its polarity, enhancing the extraction efficiency of antioxidants from LB. The higher viscosity and density of the DES containing low amounts of water led to a compact intermolecular structure, which hindered contact between the bioactive compounds and the DES. Moreover, for the same levels of the first two independent variables (ChCl:U and WC), the UAE of total antioxidants from LB increased significantly with the increase in extraction time (t).
For comparison, various molar ratios of ChCl and Eth (1:2, 1:3, 1:4, 1:5, and 1:6, mol/mol), water contents (0, 5, 10, 20, 30, and 40%), and conventional extraction times (30, 40, 50, 60, 70, and 80 min) were investigated to find the most effective extraction yield of rutin from S. japonica [23]. The highest extraction yield of rutin from this herb (about 23%) was achieved when ChCl:Eth was 1:3 containing 10% of water after 60 min. Additionally, an increase in water amount in ChCl:CitA (1:1) increased polyphenol yields from Chamaenerion angustifolium (L.) Scop. [22]. The optimal conditions of polyphenol extraction were found: temperature = 58 °C, time of UAE = 35 min, and WC = 70 wt%. At these conditions, TPC = 301 mg/mL, TFC = 74 mg/mL, TAC = 54 mg/mL, and DPPH = 70%.

3.3.1. Fitting the Models for Predicting Antioxidant Capacity

A BBD factorial model requiring 15 experimental runs was employed to study the responses of CUPRAC, ABTS, and DPPH of LB extracts prepared by UAE with a new DES (ChCl:U).
Experimental results were fitted to the PCM, and the least-squares method was used to calculate the regression coefficients for linear, quadratic, and interaction terms.
The following regression Equations (4)–(6) were obtained:
C U P R A C = 758.70 1561.40 C h C l : U + 2.02 W C 46.43 t + 703.69 C h C l : U 2 0.16 W C 2 + 0.94 t 2 + 28.16 C h C l : U × W C + 37.00 C h C l : U × t + 0.55 W C × t 12.69 C h C l : U 2 × W C 17.06 C h C l : U 2 × t
A B T S = 537.00 832.97 C h C l : U 10.41 W C 29.39 t + 380.58 C h C l : U 2 0.005 W C 2 0.047 t 2 + 13.27 C h C l : U × W C + 34.00 C h C l : U × t + 0.83 W C × t 4.94 C h C l : U 2 × W C 18.33 C h C l : U 2 × t
D P P H = 260.12 591.14 C h C l : U + 9.93 W C 26.07 t + 267.10 C h C l : U 2 0.19 W C 2 + 0.35 t 2 + 4.14 C h C l : U × W C + 24.90 C h C l : U × t + 0.33 W C × t 1.74 C h C l : U 2 × W C 11.26 C h C l : U 2 × t
The ANOVA results for the predicted response PCM are presented in Table 5.
The ANOVA test revealed that the PCMs adequately represent responses of AC values for LB extracts. The high R2 values (0.9658–0.9992) indicate that generated PCMs were adequate for the description of the effects of three independent variables (ChCl:U, WC, and t) on the antioxidant potential of LB measured by three analytical methods (CUPRAC, ABTS, and DPPH). Moreover, the adjusted R2 values (0.9961, 0.8405, and 0.8620 for CUPRAC, ABTS, and DPPH, respectively) were also high and indicated a good correlation between experimental and predicted results. The calculated R2 and adjusted R2 values were higher than 80%, which represented that the model predictions were highly confirmative of the experimental data.
On the other hand, the ANOVA results of CUPRAC, ABTS, and DPPH for LB extracts revealed insignificant lack-of-fit (F-value = 1 × 10⁻⁵–2.6, p > 0.05) (Table 5). This suggests that the proposed models were statistically ideal, and their accuracy and reliability were adequate for prediction within the range of variables evaluated.
Furthermore, a high F-value = 413.2 for CUPRAC illustrated that this empirical model was significant with a low probability value (p < 0.05) (Table 5). In contrast, low F-values (4.3 and 5.2 for ABTS and DPPH, respectively) and p-values > 0.05 indicated that the models’ predictions of the AC in LB extracts by these two analytical assays were insignificant.
Therefore, all linear, quadratic, and interaction parameters (except C h C l : U × t ) of the empirical model were highly significant (F = 29.7–3574.1, p = 0.00028–0.032) for the CUPRAC of LB extracts. Unexpectedly, only the linear term of WC had a significant positive effect on the ABTS and DPPH of the analyzed LB extracts. This can be explained by the fact that the addition of water significantly changed the structure and properties of the new DES, facilitating the dissolution of the bioactive compounds with higher radical scavenging activity in ChCl:U.

3.3.2. Analysis of Response Surfaces

The three-dimensional response surface plots demonstrate the effects of the interaction between two continuous variables (conditions of ChCl:U–UAE) by keeping the third variable constant (at the central level) on the predicted CUPRAC, ABTS, and DPPH of LB extracts (Figure 7).
As can be seen, the shapes of response surfaces for AC of LB extracts determined by different analytical methods were similar. The parabolic shapes of CUPRAC surfaces indicate that the quadratic terms of all independent variables were significant. The ChCl:U ratio displayed negative linear and quadratic effects on AC values, whereas WC and t positively affected the antioxidant properties of LB extracts. Therefore, LB extracts prepared using this DES with various molar ratios of ChCl and U containing the lowest WC and extracted in the shortest time revealed the lowest AC (Figure 7a,b,d,e,g,h). However, the CUPRAC, ABTS, and DPPH values rapidly increased with the increasing extraction time and WC in ChCl:U solvent (Figure 7c,f,i) because these two parameters (t and WC) positively affected the antioxidant potential of all studied samples. These response surfaces demonstrate that the highest AC of the investigated extracts occurred when the highest WC (40%) was added to green solvent ChCl:U (1:1) and the longest time (15 min) was used to extract antioxidants from LB.
The proposed mathematical models allow for the calculation of the optimum operating parameters of the UAE of total antioxidants from LB. The optimum conditions for DES–UAE were as follows: ChCl:U = 1.01 mol/mol, WC = 40%, and t = 15 min, under which CUPRAC = 493.7 μmol TE/g, ABTS = 273.8 μmol TE/g, and DPPH = 209.6 μmol TE/g were predicted.
Verification experiments were carried out at the predicted conditions derived from the RSM analysis to evaluate the sufficiency of the proposed mathematical models. Insignificant differences (p > 0.05) between the predicted and experimental (CUPRAC = 488.6 ± 15.8 μmol TE/g, ABTS = 276.5 ± 7.5 μmol TE/g, and DPPH = 212.6 ± 9.1 μmol TE/g) response values confirmed that the proposed models were accurate and adequate for optimizing UAE antioxidants from LB.

4. Conclusions

Herbs and agricultural by-products are valuable sources of antioxidant compounds that can be recovered by green eco-solvents and employed to improve the quality of food and cosmetic products.
The present study revealed that B:U (1:1), among six synthesized DESs, had the highest capacity for extraction antioxidants from LB, M, and ChoP able to reduce Cu(II) ions (CUPRAC = 339.5–429.9 μmol TE/g) as well as to scavenge ABTS•+ cation radicals (136.8–146.5 μmol TE/g) and DPPH radicals (145.2–170.3 μmol TE/g). However, Gu:U (1:1) with various amounts of water achieved the best extraction efficiency for antioxidants from Cha, N, and BH (CUPRAC = 43.2–103.6 μmol TE/g and ABTS = 40.5–136.5 μmol TE/g for extracts prepared in Gu:U-30, while DPPH = 101.7–111.5 μmol TE/g for extracts obtained in Gu:U-50). On the contrary, ChCl:CitA and B:CitA at a 1:1 ratio showed the lowest extractability of total bioactive compounds with antioxidant potential from these three plant materials (CUPRAC = 0.0–47.6 μmol TE/g, ABTS = 0.0–23.5 μmol TE/g, and DPPH = 13.5–31.2 μmol TE/g).
Moreover, the results of PCA and HCA indicated that components of six synthesized DESs significantly affected the antioxidant potential of herbs and agro-food residues.
For this reason, a new ChCl:U mixture and RSM were utilized to evaluate the influence of UAE conditions, such as the molar ratio of ChCl and U, the amount of water (WC) added to this DES, and ultrasonication time (t), on antioxidant properties of LB because this herb was the richest source of antioxidants. WC had a greater effect than the ultrasonication time and ChCl:U molar ratio on CUPRAC, ABTS, and DPPH results of LB extracts. The PCM can be applied to optimize the DES–UAE conditions to obtain LB extracts with potent ACs. The calculated optimal conditions were ChCl:U = 1.01 mol/mol, WC = 40%, and t = 15 min. The experimental CUPRAC (133.9–493.7 μmol TE/g), ABTS (53.9–273.5 μmol TE/g), and DPPH (84.9–209.5 μmol TE/g) values very closely matched the predicted results (CUPRAC = 133.9–493.7, 53.9–273.5, and 84.9–209.5 μmol TE/g, respectively). Therefore, chemometric tools such as BBD, in conjunction with RSM, can be successfully used for the preparation of natural extracts with a high content of bioactive compounds by the DES–UAE technique.
The proposed UAE technique using different DESs enhances the efficiency of antioxidant extraction and reduces the use of solvents and reagents, providing the cost-effective production of high-quality extracts with more respect for the environment and human health. A green UAE based on DESs sheds light on future perspectives of industrial applications of herbs and agro-food waste extracts with high antioxidant potential in developing innovative and sustainable food packaging materials and improving the preservation of food products and their physicochemical and sensory characteristics.

Author Contributions

Conceptualization, A.S.-C., P.L. and M.H.; methodology, A.S.-C. and M.H.; software, A.S.-C. and M.H.; validation, A.S.-C. and M.H.; formal analysis, M.H.; investigation, A.S.-C. and M.H.; resources, A.S.-C.; data curation, M.H. and A.S.-C.; writing—original draft preparation, M.H.; writing—review and editing, A.S.-C.; visualization, A.S.-C. and M.H.; supervision, A.S.-C. and P.L.; project administration, A.S.-C. and P.L.; funding acquisition, A.S.-C. All authors have read and agreed to the published version of the manuscript.

Funding

This research received no external funding.

Institutional Review Board Statement

Not applicable.

Informed Consent Statement

Not applicable.

Data Availability Statement

The data presented in this study are available on request from the corresponding author.

Conflicts of Interest

The authors declare no conflicts of interest.

References

  1. Chaudhary, P.; Janmeda, P.; Docea, A.O.; Yeskaliyeva, B.; Abdull Razis, A.F.; Modu, B.; Calina, D.; Sharifi-Rad, J. Oxidative stress, free radicals and antioxidants: Potential crosstalk in the pathophysiology of human diseases. Front. Chem. 2023, 11, 1158198. [Google Scholar] [CrossRef] [PubMed]
  2. Kotha, R.R.; Tareq, F.S.; Yildiz, E.; Luthria, D.L. Oxidative stress and antioxidants—A critical review on in vitro antioxidant assays. Antioxidants 2022, 11, 2388. [Google Scholar] [CrossRef] [PubMed]
  3. Dragland, S.; Senoo, H.; Wake, K.; Holte, K.; Blomhoff, R. Several culinary and medicinal herbs are important sources of dietary antioxidants. J. Nutr. 2003, 133, 1286–1290. [Google Scholar] [CrossRef] [PubMed]
  4. Ulewicz-Magulska, B.; Wesolowski, M. Antioxidant activity of medicinal herbs and spices from plants of the Lamiaceae, Apiaceae and Asteraceae families: Chemometric interpretation of the data. Antioxidants 2023, 12, 2039. [Google Scholar] [CrossRef] [PubMed]
  5. Singh, T.; Singh, P.; Pandey, V.K.; Singh, R.; Dar, A.H. A literature review on bioactive properties of betel leaf (Piper betel L.) and its applications in food industry. Food Chem. Adv. 2023, 3, 100536. [Google Scholar] [CrossRef]
  6. Bouloumpasi, E.; Hatzikamari, M.; Christaki, S.; Lazaridou, A.; Chatzopoulou, P.; Biliaderis, C.G.; Irakli, M. Assessment of antioxidant and antibacterial potential of phenolic extracts from post-distillation solid residues of oregano, rosemary, sage, lemon balm, and spearmint. Processes 2024, 12, 140. [Google Scholar] [CrossRef]
  7. Kocer, S.; Copur, O.U.; Tamer, C.E.; Suna, S.; Kayahan, S.; Uysal, E.; Cavus, S.; Akman, O. Optimization and characterization of chestnut shell pigment extract obtained microwave assisted extraction by response surface methodology. Food Chem. 2024, 443, 138424. [Google Scholar] [CrossRef] [PubMed]
  8. Ferreira, S.M.; Matos, L.C.; Santos, L. Harnessing the potential of chestnut shell extract to enhance fresh cheese: A sustainable approach for nutritional enrichment and shelf life extension. J. Food Meas. Charact. 2024, 18, 1559–1573. [Google Scholar] [CrossRef]
  9. Tapia-Quirós, P.; Granados, M.; Sentellas, S.; Saurina, J. Microwave-assisted extraction with natural deep eutectic solvents for polyphenol recovery from agrifood waste: Mature for scaling-up? Sci. Total Environ. 2024, 912, 168716. [Google Scholar] [CrossRef]
  10. Albuquerque, B.R.; Finimundy, T.C.; Pinela, J.; Pires, T.C.S.P.; Calhelha, R.C.; Vaz, J.; Corrêa, R.C.G.; Oliveira, M.B.P.P.; Barros, L. Exploring the bioactive compounds from berry biowaste: Eugenia involucrata DC. as a study case. Food Biosci. 2024, 58, 103532. [Google Scholar] [CrossRef]
  11. Kavela, E.T.A.; Szalóki-Dorkó, L.; Máté, M. The efficiency of selected green solvents and parameters for polyphenol extraction from chokeberry (Aronia melanocarpa (Michx)) pomace. Foods 2023, 12, 3639. [Google Scholar] [CrossRef] [PubMed]
  12. Ferreira-Santos, P.; Nobre, C.; Rodrigues, R.M.; Genisheva, Z.; Botelho, C.; Teixeira, J.A. Extraction of phenolic compounds from grape pomace using ohmic heating: Chemical composition, bioactivity and bioaccessibility. Food Chem. 2024, 436, 137780. [Google Scholar] [CrossRef] [PubMed]
  13. Cisneros-Yupanqui, M.; Chalova, V.I.; Kalaydzhiev, H.R.; Mihaylova, D.; Krastanov, A.I.; Lante, A. Ultrasound-assisted extraction of antioxidant bioactive compounds from wastes of rapeseed industry and their application in delaying rapeseed oil oxidation. Environ. Technol. Innov. 2023, 30, 103081. [Google Scholar] [CrossRef]
  14. Szydłowska-Czerniak, A.; Amarowicz, R.; Szłyk, E. Antioxidant capacity of rapeseed meal and rapeseed oils enriched with meal extract. Eur. J. Lipid Sci. Technol. 2010, 112, 750–760. [Google Scholar] [CrossRef]
  15. Coscarella, M.; Nardi, M.; Alipieva, K.; Bonacci, S.; Popova, M.; Procopio, A.; Scarpelli, R.; Simeonov, S. Alternative assisted extraction methods of phenolic compounds using NaDESs. Antioxidants 2024, 13, 62. [Google Scholar] [CrossRef] [PubMed]
  16. Lauberts, M.; Mierina, I.; Pals, M.; Latheef, M.A.A.; Shishkin, A. Spent coffee grounds valorization in biorefinery context to obtain valuable products using different extraction approaches and solvents. Plants 2023, 12, 30. [Google Scholar] [CrossRef]
  17. Lauberts, M.; Telysheva, G.; Venskutonis, P.R.; Lauberte, L.; Dizhbite, T.; Kazernavičiūte, R.; Pukalskas, A. Diarylheptanoid-rich extract of grey and black alder barks: An effective dietary antioxidant in mayonnaise. Chem. Pap. 2017, 71, 1007–1012. [Google Scholar] [CrossRef]
  18. Park, B.I.; Kim, J.; Lee, K.; Lim, T.; Hwang, K.T. Flavonoids in common and tartary buckwheat hull extracts and antioxidant activity of the extracts against lipids in mayonnaise. J. Food Sci. Technol. 2019, 56, 2712–2720. [Google Scholar] [CrossRef]
  19. Hęś, M.; Górecka, D.; Dziedzic, K. Antioxidant properties of extracts from buckwheat by-products. Acta Sci. Pol. Technol. Aliment. 2012, 11, 167–174. [Google Scholar]
  20. Xiong, Z.; Wang, M.; Guo, H.; Xu, J.; Ye, J.; Zhao, J.; Zhao, L. Ultrasound-assisted deep eutectic solvent as green and efficient media for the extraction of flavonoids from Radix scutellariae. New J. Chem. 2019, 43, 644–650. [Google Scholar] [CrossRef]
  21. Herman; Ibrahim, A.; Rahay, B.P.; Arifuddin, M.; Nur, Y.; Prabowo, W.C.; Maryono; Ambarwati, N.S.S.; Rijai, L.; Ahmad, I. Single factor effect of natural deep eutectic solvent citric acid-glucose based microwave-assisted extraction on total polyphenols content from Mitragyna speciosa Korth. Havil leaves. Pharmacogn. J. 2021, 13, 1109–1115. [Google Scholar] [CrossRef]
  22. Tsvetov, N.; Pasichnik, E.; Korovkina, A.; Gosteva, A. Extraction of bioactive components from Chamaenerion angustifolium (L.) Scop. with choline chloride and organic acids natural deep eutectic solvents. Molecules 2022, 27, 4216. [Google Scholar] [CrossRef] [PubMed]
  23. Le, N.T.; Nguyen, T.P.D.; Ho, D.C.; Phung, H.T.; Nguyen, H.T. Green solvents-based rutin extraction from Sophora japonica L. J. Appl. Res. Med. Aromat. Plants 2023, 36, 100508. [Google Scholar] [CrossRef]
  24. Bakirtzi, C.; Triantafyllidou, K.; Makris, D.P. Novel lactic acid-based natural deep eutectic solvents: Efficiency in the ultrasound-assisted extraction of antioxidant polyphenols from common native Greek medicinal plants. J. Appl. Res. Med. Aromat. Plants 2016, 3, 120–127. [Google Scholar] [CrossRef]
  25. Flórez, M.; Cazón, P.; Vázquez, M. Antioxidant extracts of nettle (Urtica dioica) leaves: Evaluation of extraction techniques and solvents. Molecules 2022, 27, 6015. [Google Scholar] [CrossRef]
  26. Peng, M.; Jiang, C.; Jing, H.; Du, X.; Fan, X.; Zhang, Y.; Wang, H. Comparison of different extraction methods on yield, purity, antioxidant, and antibacterial activities of proanthocyanidins from chokeberry (Aronia melanocarpa). J Food Meas. Charact. 2022, 16, 2049–2059. [Google Scholar] [CrossRef]
  27. Huang, Y.; Feng, F.; Jiang, J.; Qiao, Y.; Wu, T.; Voglmeir, J.; Chen, Z.G. Green and efficient extraction of rutin from tartary buckwheat hull by using natural deep eutectic solvents. Food Chem. 2017, 221, 1400–1405. [Google Scholar] [CrossRef]
  28. Tymczewska, A.; Klebba, J.; Szydłowska-Czerniak, A. Antioxidant capacity and total phenolic content of spice extracts obtained by ultrasound-assisted extraction using deep eutectic and conventional solvents. Appl. Sci. 2023, 13, 6987. [Google Scholar] [CrossRef]
  29. Szydłowska-Czerniak, A.; Tułodziecka, A.; Momot, M.; Stawicka, B. Physicochemical, antioxidative, and sensory properties of refined rapeseed oils. J. Am. Oil Chem. Soc. 2019, 96, 405–419. [Google Scholar] [CrossRef]
  30. Yu, Q.; Wang, F.; Jian, Y.; Chernyshev, V.M.; Zhang, Y.; Wang, Z.; Yuan, Z.; Chen, X. Extraction of flavonoids from Glycyrrhiza residues using deep eutectic solvents and its molecular mechanism. J. Mol. Liq. 2022, 363, 119848. [Google Scholar] [CrossRef]
  31. Gabriele, F.; Chiarini, M.; Germani, R.; Tiecco, M.; Spreti, N. Effect of water addition on choline chloride/glycol deep eutectic solvents: Characterization of their structural and physicochemical properties. J. Mol. Liq. 2019, 291, 111301. [Google Scholar] [CrossRef]
  32. Chen, J.; Li, Y.; Wang, X.; Liu, W. Application of deep eutectic solvents in food analysis: A review. Molecules 2019, 24, 4594. [Google Scholar] [CrossRef] [PubMed]
  33. Munteanu, I.G.; Apetrei, C. Analytical methods used in determining antioxidant activity: A review. Int. J. Mol. Sci. 2021, 22, 3380. [Google Scholar] [CrossRef] [PubMed]
  34. Dai, W.; Dai, L.; Chu, D.; Pang, R.; Deng, J.; Wang, S.; Li, J.; Chen, H.; Zheng, X. Deep eutectic solvents as efficient extractants of caffeoylquinic acids from Blumea aromatica: A comparative analysis of content and antioxidant potential. Arab. J. Chem. 2024, 17, 105596. [Google Scholar] [CrossRef]
  35. Popova, A.; Dalemska, Z.; Mihaylova, D.; Hristova, I.; Alexieva, I. Melissa officinalis L.—GC profile and antioxidant activity. Int. J. Pharmacogn. Phytochem. Res. 2016, 8, 634–638. [Google Scholar]
Figure 1. CUPRAC (a), ABTS (b), and DPPH (c) results for four herbs and two agro-food wastes extracts prepared by six various DESs. Bars with different letters indicate significant differences (one-way ANOVA and Duncan test, p < 0.05).
Applsci 14 02936 g001
Figure 2. Effect of DES type on total antioxidant potential of four herbs: chamomile (Cha) (a), lemon balm (LB) (b), mint (M) (c), and nettle (N) (d) and two agro-food wastes: buckwheat husk (BH) (e) and chokeberry pomace (ChoP) (f).
Applsci 14 02936 g002
Figure 3. Principal component analysis (PCA) bi-plot of scores and loadings for extracts of herbs and ago-food by-products representing various DES mixtures utilized in the UAE procedure before AC analysis by CUPRAC, ABTS, and DPPH assays.
Applsci 14 02936 g003
Figure 4. Dendrograms of hierarchical cluster analysis for (a) the studied extracts obtained by six DESs and (b) and the applied analytical methods for AC determination.
Applsci 14 02936 g004
Figure 5. Correlation matrix (Pearson’s correlation coefficients) for the 36 studied extracts.
Applsci 14 02936 g005
Figure 6. Effect of DES–UAE conditions (ChCl:U molar ratio, water content, and extraction time) on CUPRAC, ABTS, and DPPH of LB extracts. Bars with different letters indicate significant differences (one-way ANOVA and Duncan test, p < 0.05).
Applsci 14 02936 g006
Figure 7. Response surfaces and contour plots for CUPRAC (ac), ABTS (df), and DPPH (gi) of LB extracts obtained by UAE with green DES expressed as a function of ChCl:U and WC (at t = 10 min), ChCl:U and t (at WC = 30%), and WC and t (at ChCl:U = 1:1).
Applsci 14 02936 g007
Table 1. Methods and solvents for extraction of antioxidant compounds from herbs and agro-food residues.
SolventSampleExtraction TechniqueAnalytical MethodKey FindingsRef.
SpectroMChromM
Extraction with natural deep eutectic solvents (NADESs)
ChCl:Gl (1:4)
ChCl:Ge (1:4)
ChCl:Pe (1:4)
ChCl:Be (1:4)
ChCl:LA (1:4)
ChCl:MA:H2O (1:1:3)
ChCl:Gu (1:1:2)
Pr:Ge (1:4)
Pr:Gu:H2O (5:3:8)
Pr:Fr:H2O (1:1:5)
CitA:Fr:H2O (1:1:3)
CitA:Gu:H2O (1:1:5)
Radix scutellariae—perennial herbUltrasonic irradiation at Troom for 42 min RP-HPLC-UVDifferent DESs were investigated as tunable and superior extraction media for extraction of flavonoids from Radix scutellariae.[20]
CitA:Gu (4:1; 5:1; 6:1)Mitragyna speciosa Korth. Havil (Rubiaceae family)—herbMAETPC The proposed NADES is very suitable for extracting polyphenol compounds from herb leaves.[21]
ChCl:MalA (1:1)
ChCl:MA (1:1)
ChCl:CitA (1:1)
ChCl:TarA (2:1)
Chamaenerion angustifolium (L.) Scop. (fireweed)—perennial herbaceous plant of the Onagraceae familyUAETPC
TFC
DPPH
ChCl:CitA is the most effective solvent for the extraction of biologically active compounds.[22]
ChCl:CitA (1:1)
ChCl:LA (1:2)
ChCl:AceA (1:2)
ChCl:ForA (1:2)
ChCl:OxaA (1:1)
ChCl:TarA:H2O (1:1:1)
ChCl:Ge (1:2)
ChCl:Pro (1:2)
ChCl:Eth (1:2)
ChCl: Sor (1:1)
ChCl:Gu (1:1)
ChCl:Fr (1:1)
ChCl:Xyl:H2O (1:1:1)
ChCl:Suc:H2O (1:2:2)
ChCl:Mal:H2O (1:2:2)
ChCl:Act (1:2)
MeOH
MeOH:H2O (60:40)
EtOH
EtOH:H2O (60:40)
Sophora japonica L. (S. japonica)—flowering herb belonging to the Fabaceae familyTSE at Troom for 60 min DPPH HPLC-UVChCl:Eth showed the best extraction. It can be productively recovered and reused at least three times for rutin extraction from S. japonica without notably changing the extraction yield, the target compound recovery efficiency, and the purity of the obtained rutin.
ChCl:Eth had no significant effect on the antioxidant activity of rutin, and recovered rutin demonstrated more antioxidant activity than MeOH extract.
[23]
LA:ChCl (3:1)
LA:AceS (3:1)
LA:AceAm (3:1)
LA:Gc:H2O (3:1:3)
LA:Gc (3:1)
EtOH (60%)
Mint (Mentha spicata)
Sage (Salvia officinalis)
Dittany (Origanum dictamnus)
Fennel (Foeniculum vulgare)
Marjoram (Origanum Majorana)—Greek medicinal plants
UAETPC
TFC
DPPH
TRP
NADES composed of LA:Gc displayed significantly higher capacity than the highly efficient EtOH regarding the extraction of polyphenols.
NADES composed of LA:AceS and LA:AceAm showed relatively lower efficiency.
Extracts with high polyphenol concentration may also possess higher antiradical activity and reducing power.
[24]
Ge:H2O (50:50%) (1% CitA)
Ge:H2O (50:50%) (1% ForA)
EtOH:H2O
(50:50%) (1% CitA)
EtOH:H2O
(50:50%) (1% ForA)
H2O (1% CitA)
H2O (1% ForA)
Chokeberry
(Aronia melanocarpa (Michx)) pomace
TSE
UAE
TPC
TAC
HPLCThe 50% Ge acidified with 1% ForA was identified as optimal for extracting TPC, while 50% Ge acidified with 1% CitA can be used for extraction of polyphenols in replacement of EtOH. However, 50% EtOH +1% CitA yielded significantly higher total anthocyanin content obtained by spectrometric and HPLC measurements.[11]
Extraction with conventional solvents
EtOH (50%)Oregano (Origanum vulgare)
Rosemary (Rosmarinus officinalis L.)
Spearmint (Mentha spicata)
Lemon balm (Melissa officinalis L.)
Greek sage (Salvia fruticosa Miller)—post-distillation solid residues of medicinal and aromatic plants
UAETPC
TFC
ABTS
DPPH
FRAP
HPLC-DAD-MSThe lemon balm extract had the highest phenolic concentration and moderate antioxidant activity, along with spearmint.
In the rosemary and Greek sage extracts, the primary recognized compounds were rosmarinic acid, carnosol, and carnosic acid, whereas in the Greek oregano, spearmint, and lemon balm extracts, there were salvianolic acid isomers and rosmarinic acid.
[6]
MeOH
EtOH
H2O
Nettle
(Urtica dioica)
UAE
TSE
TSE without stirring
TPC
DPPH
ABTS
The high antioxidant activity had nettle extracts prepared by UAE using water as a solvent in a shorter time.[25]
EtOH (60%)Chokeberry
(Aronia melanocarpa)
UMAE
UAE
MAE
TSE
ABTS
DPPH
SASC
TRP
HPLC-MSThe UMAE was an effective, simple, and rapid method for extracting proanthocyanidins from chokeberry with excellent antioxidant activity compared with the other extraction techniques.
The main proanthocyanidins in purified chokeberry proanthocyanidins were B-type procyanidins, including procyanidin B2, B5 dimer, and procyanidin C1 trimer, with a degree of polymerization of 14.
[26]
H2O (distilled)Rapeseed mealUAE
TSE
TPC
FRAP
HPLC-DADRapeseed meal extracts prepared by UAE revealed higher TPC and FRAP values than those obtained with the TSE.
Phenylacetic acid and ferulic acid were the most predominant phenolic compounds in these extracts.
[13]
Ac
MeOH
H2O
Buckwheat by-products (grain, hull, and bran)TSE
at Troom for 24 h
TPC
DPPH
MChA
The capacity of scavenging DPPH radicals by buckwheat hull extracts was higher than that of extracts from unhulled and hulled buckwheat grains. However, bran extracts had a lower activity than grains.
MeOH and Ac bran extracts formed complexes with iron ions to a higher degree than hull extracts. An opposite dependence was observed in the case of water extracts.
[19]
ABTS—2,2-azinobis-3-ethylbenzothiazoline-6-sulfonic acid; Ac—acetone; AceA—acetic acid; AceAm—ammonium acetate; AceS—sodium acetate; Act—acetamide; Be—1,4-butanediol; ChCl—choline chloride; ChromM—chromatographic method; CitA—citric acid; DPPH—2,2-diphenyl-1-picrylhydrazyl; Eth—ethylene glycol; EtOH—ethanol; ForA—formic acid; Fr—fructose; FRAP—ferric reducing antioxidant potential; Gc—glycine; Ge—glycerol; Gl—glycol; Gu—glucose; H2O—water; HPLC -DAD—high-performance liquid chromatography with a diode array detector; HPLC-DAD-MS—high-performance liquid chromatography–diode array detector–mass spectrometry; HPLC-MS—high-performance liquid chromatography–mass spectrometry; HPLC-UV—high-performance liquid chromatography with ultraviolet detection; LA—lactic acid; MA—malic acid; MAE—microwave-assisted extraction; Mal—maltose; MalA—malonic acid; MChA—metal chelating activity; MeOH—methanol; OxaA—oxalic acid; Pe—1,2-propylene; Pr—L-proline; Pro—propylene glycol; RP-HPLC-UV—reversed-phase high-performance liquid chromatography with ultraviolet detection; SASC—superoxide anion (O2•−) scavenging capacity; Sor—sorbitol; SpectroM—spectrophotometric method; Suc—sucrose; T—temperature; TAC—total anthocyanin content; TarA—tartaric acid; TFC—total flavonoid content; TPC—total polyphenol content using Folin–Ciocalteau reagent; TRP—total reducing power; TSE—traditional solvent extraction; UAE—ultrasound-assisted extraction; UMAE—ultrasonic–microwave-assisted extraction; and Xyl—xylose.
Table 2. The prepared deep eutectic solvents.
No.Combination of HBA and HBDMolar Ratio
(mol/mol)
Water Content
(%)
Code
DES1Choline chloride/Citric acid1:130 ChCl:CitA
DES2Glucose/Citric acid1:150 Gu:CitA
DES3Glucose/Urea1:130 Gu:U-30
DES4Glucose/Urea1:150 Gu:U-50
DES5Betaine/Citric acid1:130 B:CitA
DES6Betaine/Urea1:140 B:U
Table 3. Independent variables for the optimization of DES–UAE of antioxidants from lemon balm.
Independent VariableLevels with the Codes
−101
Choline chloride/Urea ratio (ChCl:U) (mol/mol)1:2 (0.5)1:1 (1)3:2 (1.5)
Water content (WC) (%)203040
Extraction time (t) (min)51015
Table 4. Box–Behnken design with three independent variables, experimental and predicted results for the CUPRAC, ABTS, and DPPH values of lemon balm extract responses.
Exp.Independent VariablesDependent Variables
ChCl:U
(mol/mol)
WC
(%)
t
(min)
CUPRAC *
(µmol TE/g)
ABTS *
(µmol TE/g)
DPPH *
(µmol TE/g)
Exp. ± SDPred.Exp. ± SDPred.Exp. ± SDPred.
10.5 (−1)20 (−1)10 (0)234.8 ± 8.4 c231.9104.5 ± 4.3 d,e104.5121.5 ± 13.3 c121.7
21.5 (1)20 (−1)10 (0)159.5 ± 10.3 a,b162.473.8 ± 3.8 b73.7102.1 ± 6.8 b101.9
30.5 (−1)40 (1)10 (0)413.9 ± 15.7 g411.0164.0 ± 4.0 g164.0186.6 ± 2.2 e186.8
41.5 (1)40 (1)10 (0)394.4 ± 5.0 g397.3201.0 ± 7.5 h201.0180.5 ± 0.3 e180.3
50.5 (−1)30 (0)5 (−1)341.8 ± 16.1 e344.799.1 ± 11.7 c,d99.1180.4 ± 8.1 e180.2
61.5 (1)30 (0)5 (−1)291.6 ± 22.3 d288.7115.4 ± 5.4 e115.4155.1 ± 10.4 d155.2
70.5 (−1)30 (0)15 (1)374.1 ± 28.2 f,g377.1168.1 ± 5.7 g168.0184.4 ± 4.7 e184.3
81.5 (1)30 (0)15 (1)352.8 ± 14.6 f,g349.8157.8 ± 7.8 g157.8183.0 ± 10.9 e183.1
91 (0)20 (−1)5 (−1)133.9 ± 12.6 a,b133.953.9 ± 5.5 a53.984.9 ± 4.8 a84.9
101 (0)40 (1)5 (−1)349.0 ± 9.9 f,g349.089.3 ± 4.8 c89.3132.5 ± 8.4 c132.5
111 (0)20 (−1)15 (1)168.0 ± 5.1 b168.072.7 ± 9.3 b72.796.1 ± 8.2 a,b96.1
121 (0)40 (1)15 (1)493.7 ± 29.7 h493.7273.5 ± 6.9 i273.5209.5 ± 3.1 f209.5
131 (0)30 (0)10 (0)284.2 ± 0.6 d278.4140.9 ± 7.6 f124.0152.9 ± 0.6 d141.4
141 (0)30 (0)10 (0)274.5 ± 2.8 d278.4139.6 ± 10.3 f124.0149.9 ± 6.5 d141.4
151 (0)30 (0)10 (0)276.4 ± 6.9 d278.491.5 ± 3.2 c124.0121.4 ± 3.1 c141.4
* n = 3; SD standard deviation; and different letters within the same column indicate significant differences between AC results of the LB extracts (one-way ANOVA and Duncan test, p < 0.05).
Table 5. Analysis of variance (ANOVA) results for the studied responses: CUPRAC, ABTS, and DPPH values of lemon balm extracts prepared using choline chloride/urea as a deep eutectic solvent.
Model ParametersdfSSMSF-Value
CUPRAC
Regression11119,139.510830.9413.2 *
Residual3120.540.2
Lack-of-fit168.168.12.6
Pure error252.426.2
Total14119,260.0
R2, Adjusted R20.9992, 0.9961
ABTS
Regression1137,749.53431.84.3
Residual31586.91529.0
Lack-of-fit10.010.011 × 10−5
Pure error21586.9793.5
Total1439,336.41
R2, Adjusted R20.9658, 0.8405
DPPH
Regression1117,320.81574.65.2
Residual3603.4201.1
Lack-of-fit10.20.26.6 × 10−4
Pure error2603.2301.6
Total1417,924.2
R2, Adjusted R20.9704, 0.8620
* Significant at p < 0.05.
Disclaimer/Publisher’s Note: The statements, opinions and data contained in all publications are solely those of the individual author(s) and contributor(s) and not of MDPI and/or the editor(s). MDPI and/or the editor(s) disclaim responsibility for any injury to people or property resulting from any ideas, methods, instructions or products referred to in the content.

