

Enhancing Scrap Reduction in Electric Motor Manufacturing for the Automotive Industry: A Case Study Using the PDCA (Plan–Do–Check–Act) Approach

 , , , , and
Abstract
Featured Application
Abstract
1. Introduction
2. Literature Review
2.1. Understanding the PDCA Methodology: Core Principles and Applications
2.2. PDCA’s Synergy with Quality Tools and Continuous Improvement Initiatives
- Scrap reduction: Studies like those conducted by Amaral et al. [17] demonstrate the successful application of PDCA alongside a SIPOC (Suppliers, Inputs, Process, Outputs, Customers) matrix, chart control, 5S (Sort, Straighten, Shine, Standardize, Sustain), and visual management in an automotive electromechanical component manufacturer. This implementation led to significant waste reduction through improved quality and productivity. Additionally, Silva et al. [18] demonstrated its practical application in minimizing can loss within a beverage company, ultimately resulting in significant waste reduction through improved quality and productivity.
- Defect reduction: Isniah et al.’s research [23] focused on reviewing existing literature from 2015 to 2020 on the use of the PDCA cycle as a tool for improvement in organizations. This study showed that a total of 16% of all references found are related to defect reduction, using the PDCA cycle in conjunction with other tools such as KAIZEN, seven basic statistical tools, statistical process control, and PFMEA (Process Failure Mode Effect Analysis).
2.3. Variations of the PDCA Cycle
2.4. PDCA Integration with Quality Management Systems
- ISO 9001: The ISO 9001:2015 standard [32] leverages the PDCA cycle to illustrate how its clauses 4 to 10 can be systematically grouped and implemented (Figure 5). This serves as a powerful testament to the PDCA cycle’s effectiveness and versatility in driving continuous improvement within quality management systems [33,34,35].
- Adaptability: Research by Chiarini and Cherafi [36] demonstrated this adaptability by developing an implementation guideline for manufacturing companies. This guideline, rooted in the PDCA model, effectively integrates ISO 9001 requirements with Industry 4.0 technologies. It showcases how PDCA can bridge the gap between established quality management systems and the latest technological advancements.
- Service industry: Habibie and Kresiani [28] meticulously analyzed the ISO/IEC (International Electrotechnical Commission) 17025:2017 standard clause by clause, exploring its connection to the PDCA concept within the process approach framework. Their findings suggest that ISO/IEC 17025:2017 incorporates the principles of the PDCA model. The standard’s specific clauses address each stage within the overall framework of a laboratory’s quality management system (Figure 6).
- IATF (International Automotive Task Force) 16949: This standard requires organizations to have a documented problem-solving process to prevent recurrence in clause 10.2.3. Subclause c) of this clause specifies that this includes root cause analysis, the methodology used, analysis, and results [37]. The 8Ds technique is documented in the literature as a widely accepted technique for meeting this requirement [38,39]. The PDCA cycle has served as a reference due to its strong relationship with the 8Ds, as it has functioned as an advanced approach to decision-making and problem-solving [40,41].
2.5. Hipot (High-Potential) Failures in Electric Armatures
- Partial discharge (PD) activity: PDs are localized dielectric breakdowns within the insulation system, often indicated by increased current leakage during hipot tests. Chai et al. [42] explored the use of advanced PD detection techniques to identify and locate PD sources in electric motor stator windings, aiding in early failure prediction. Diab et al. [43] provided detailed experimental specifications involving PD measurements methods and PD data post-processing Algorithms. The obtained results are drawn as a useful and timely reference that enhances the understanding of the insulation PD process in SiC (silicon-carbide)-based power electronics applications.
- Automated hipot failure detection: Research by Agnes [44] introduced a new concept developed for high-voltage testing in electrical apparatus used in railway systems, which supports predictive maintenance. This device conducts insulation tests between contacts and the ground wherein contacts must withstand the test voltage for a specified time; it also tests several apparatus at the same time, improving efficiency in the maintenance sector.
- Moisture ingress: Moisture absorption in the insulation degrades its dielectric properties and increases the risk of hipot test failures. Ghani et al. [45] examined the effect of moisture content on the breakdown strength of stator coil insulation under various temperatures.
- Advanced detection and mitigation techniques: Recent research has focused on developing advanced methods for detecting and mitigating hipot test failures in electric armatures. These include (a) non-destructive testing (NDT) techniques. Research by Nageshwar et al. [46] reviewed the main aging and failure mechanisms of stator winding and methods for extending the useful life of the machine. The symptoms of each failure mechanism were discussed, and an overview of various electrical diagnostic techniques for condition assessment of stator winding insulation was presented. (b) Machine Learning for Anomaly Detection. Research by Ferras et al. [47] explored the application of machine learning algorithms to data for different possible types of anomalies in electric motors, such as uncoupled, overloaded, unbalanced, misaligned, and normal anomalies. The obtained results show how these algorithms can be effective in classifying the different types of anomalies and that the two models that presented the best accuracy values were k-nearest neighbor and multi-layer perceptron.
3. Research Design
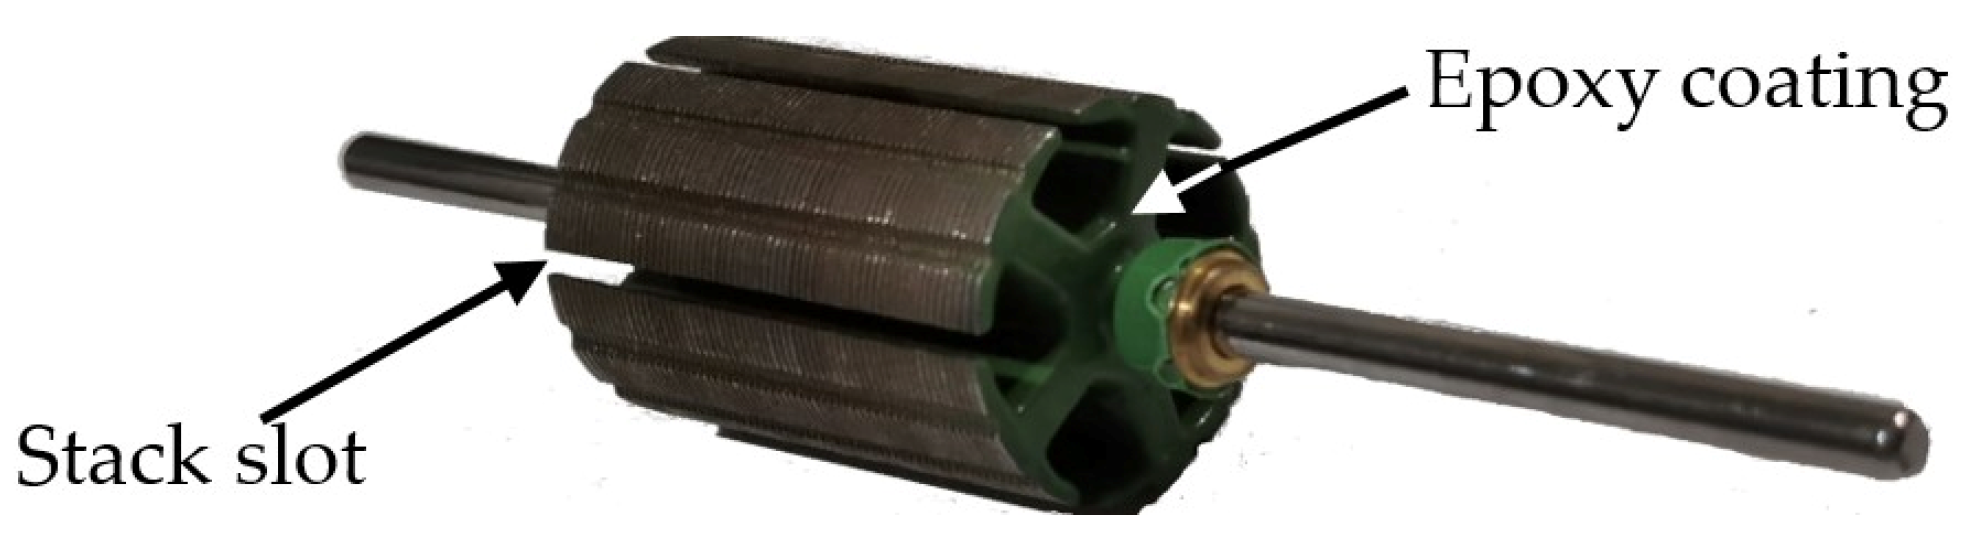
- Lamination: This sub-process is responsible for generating the armature body, which is made of 60 layers of steel material called laminations. This number of laminations can vary until enough are stacked to achieve the armature stack length specification (Figure 1). Each lamination comes to the company under study from a stamping process performed by an external supplier. The first and last laminations that make up the armature are the same as the rest that are in the middle of them. For the union between the laminations to the shaft, a pressing device is used that introduced a shaft under pressure in the center of the laminations, which have a star-shaped cut, achieving a tight fit. For additional fixation, the device then makes a rivet on both sides of the laminations’ center at the end of the process.
- Epoxy coating: This sub-process is responsible for generating electrical insulation by applying an epoxy resin in powder form along the entire interior of the armature body, covering from the first lamination to the last. Then, through a curing process, the powder is heated to form a solid layer (Figure 2).
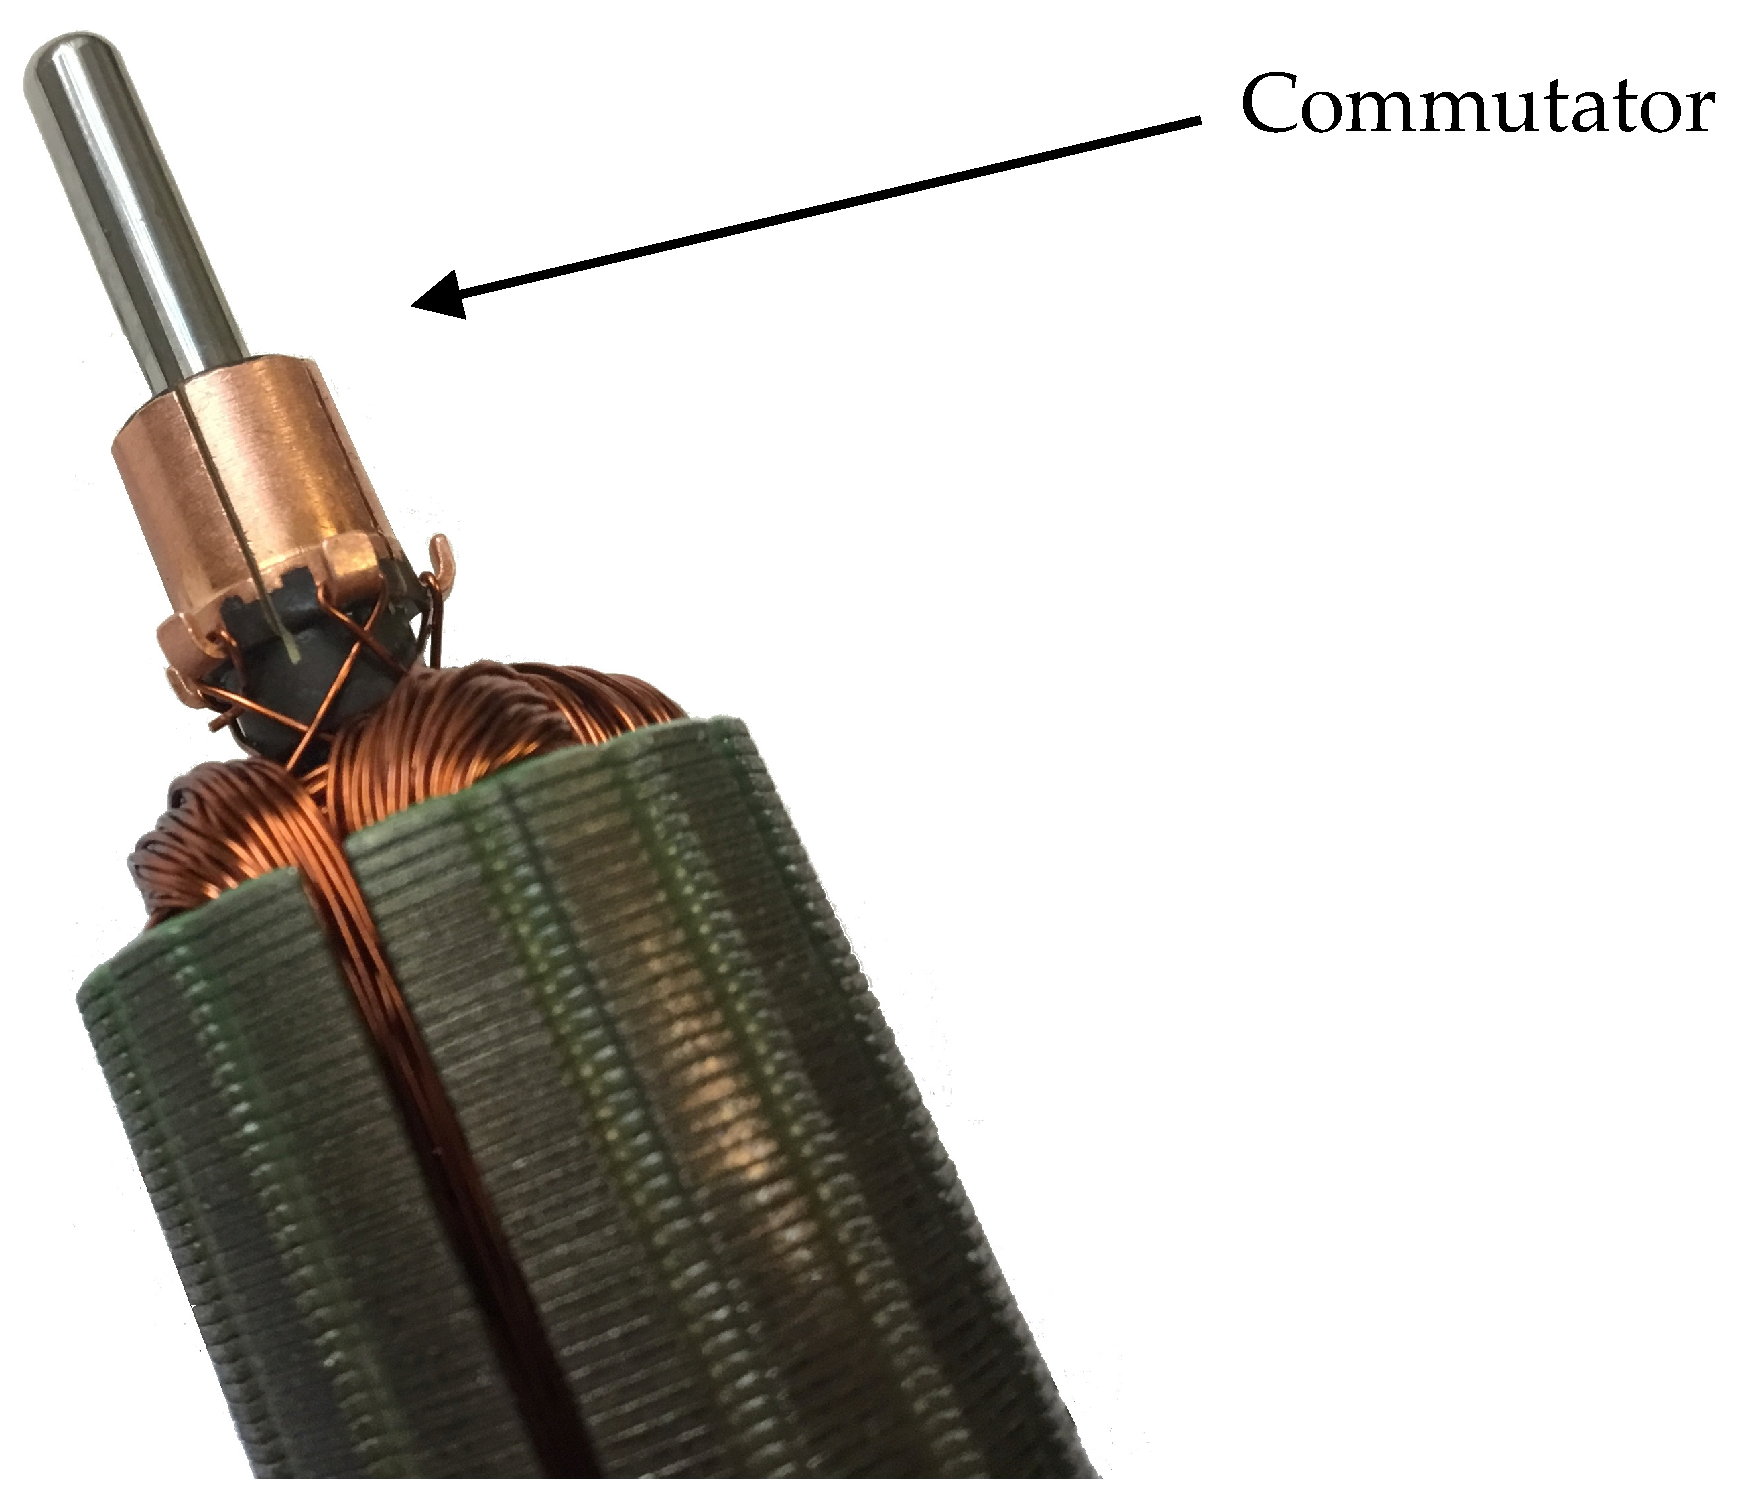
- Wire winding: This sub-process involves a continuous series of winding from each bar on the commutator, which loops around the stack teeth and connects to the next bar on the commutator, using the stack slots to insert the wire winding from one side of the armature to the other (Figure 2 and Figure 3). It is in this winding that the magnetic fields are generated for the speed that the motor will have. To perform this operation, an automatic winding machine is used in which the operator prepares the correct cable sizes and coil heads. Afterward, only the required dimensions and the number of turns need to be entered into the machine’s computer; the rest of the process is automatic (Figure 3).
- Literature review: This phase involved analyzing published articles featuring case studies demonstrating the PDCA cycle in practice, as well as examining the individual PDCA phases, exploring the interconnections between PDCA and other improvement methodologies, and investigating its relationships with quality management systems.
- Case study development: This stage focused on constructing the specific case relevant for this research study.
- Results analysis: Following the implementation of the PDCA cycle, the obtained results were exhaustively analyzed.
- Conclusions and recommendations: Based on the findings, concrete conclusions were formulated, and practical recommendations for further improvement were provided.
4. Case Study
4.1. The Method Employed in this Study Is Illustrated in Figure 7
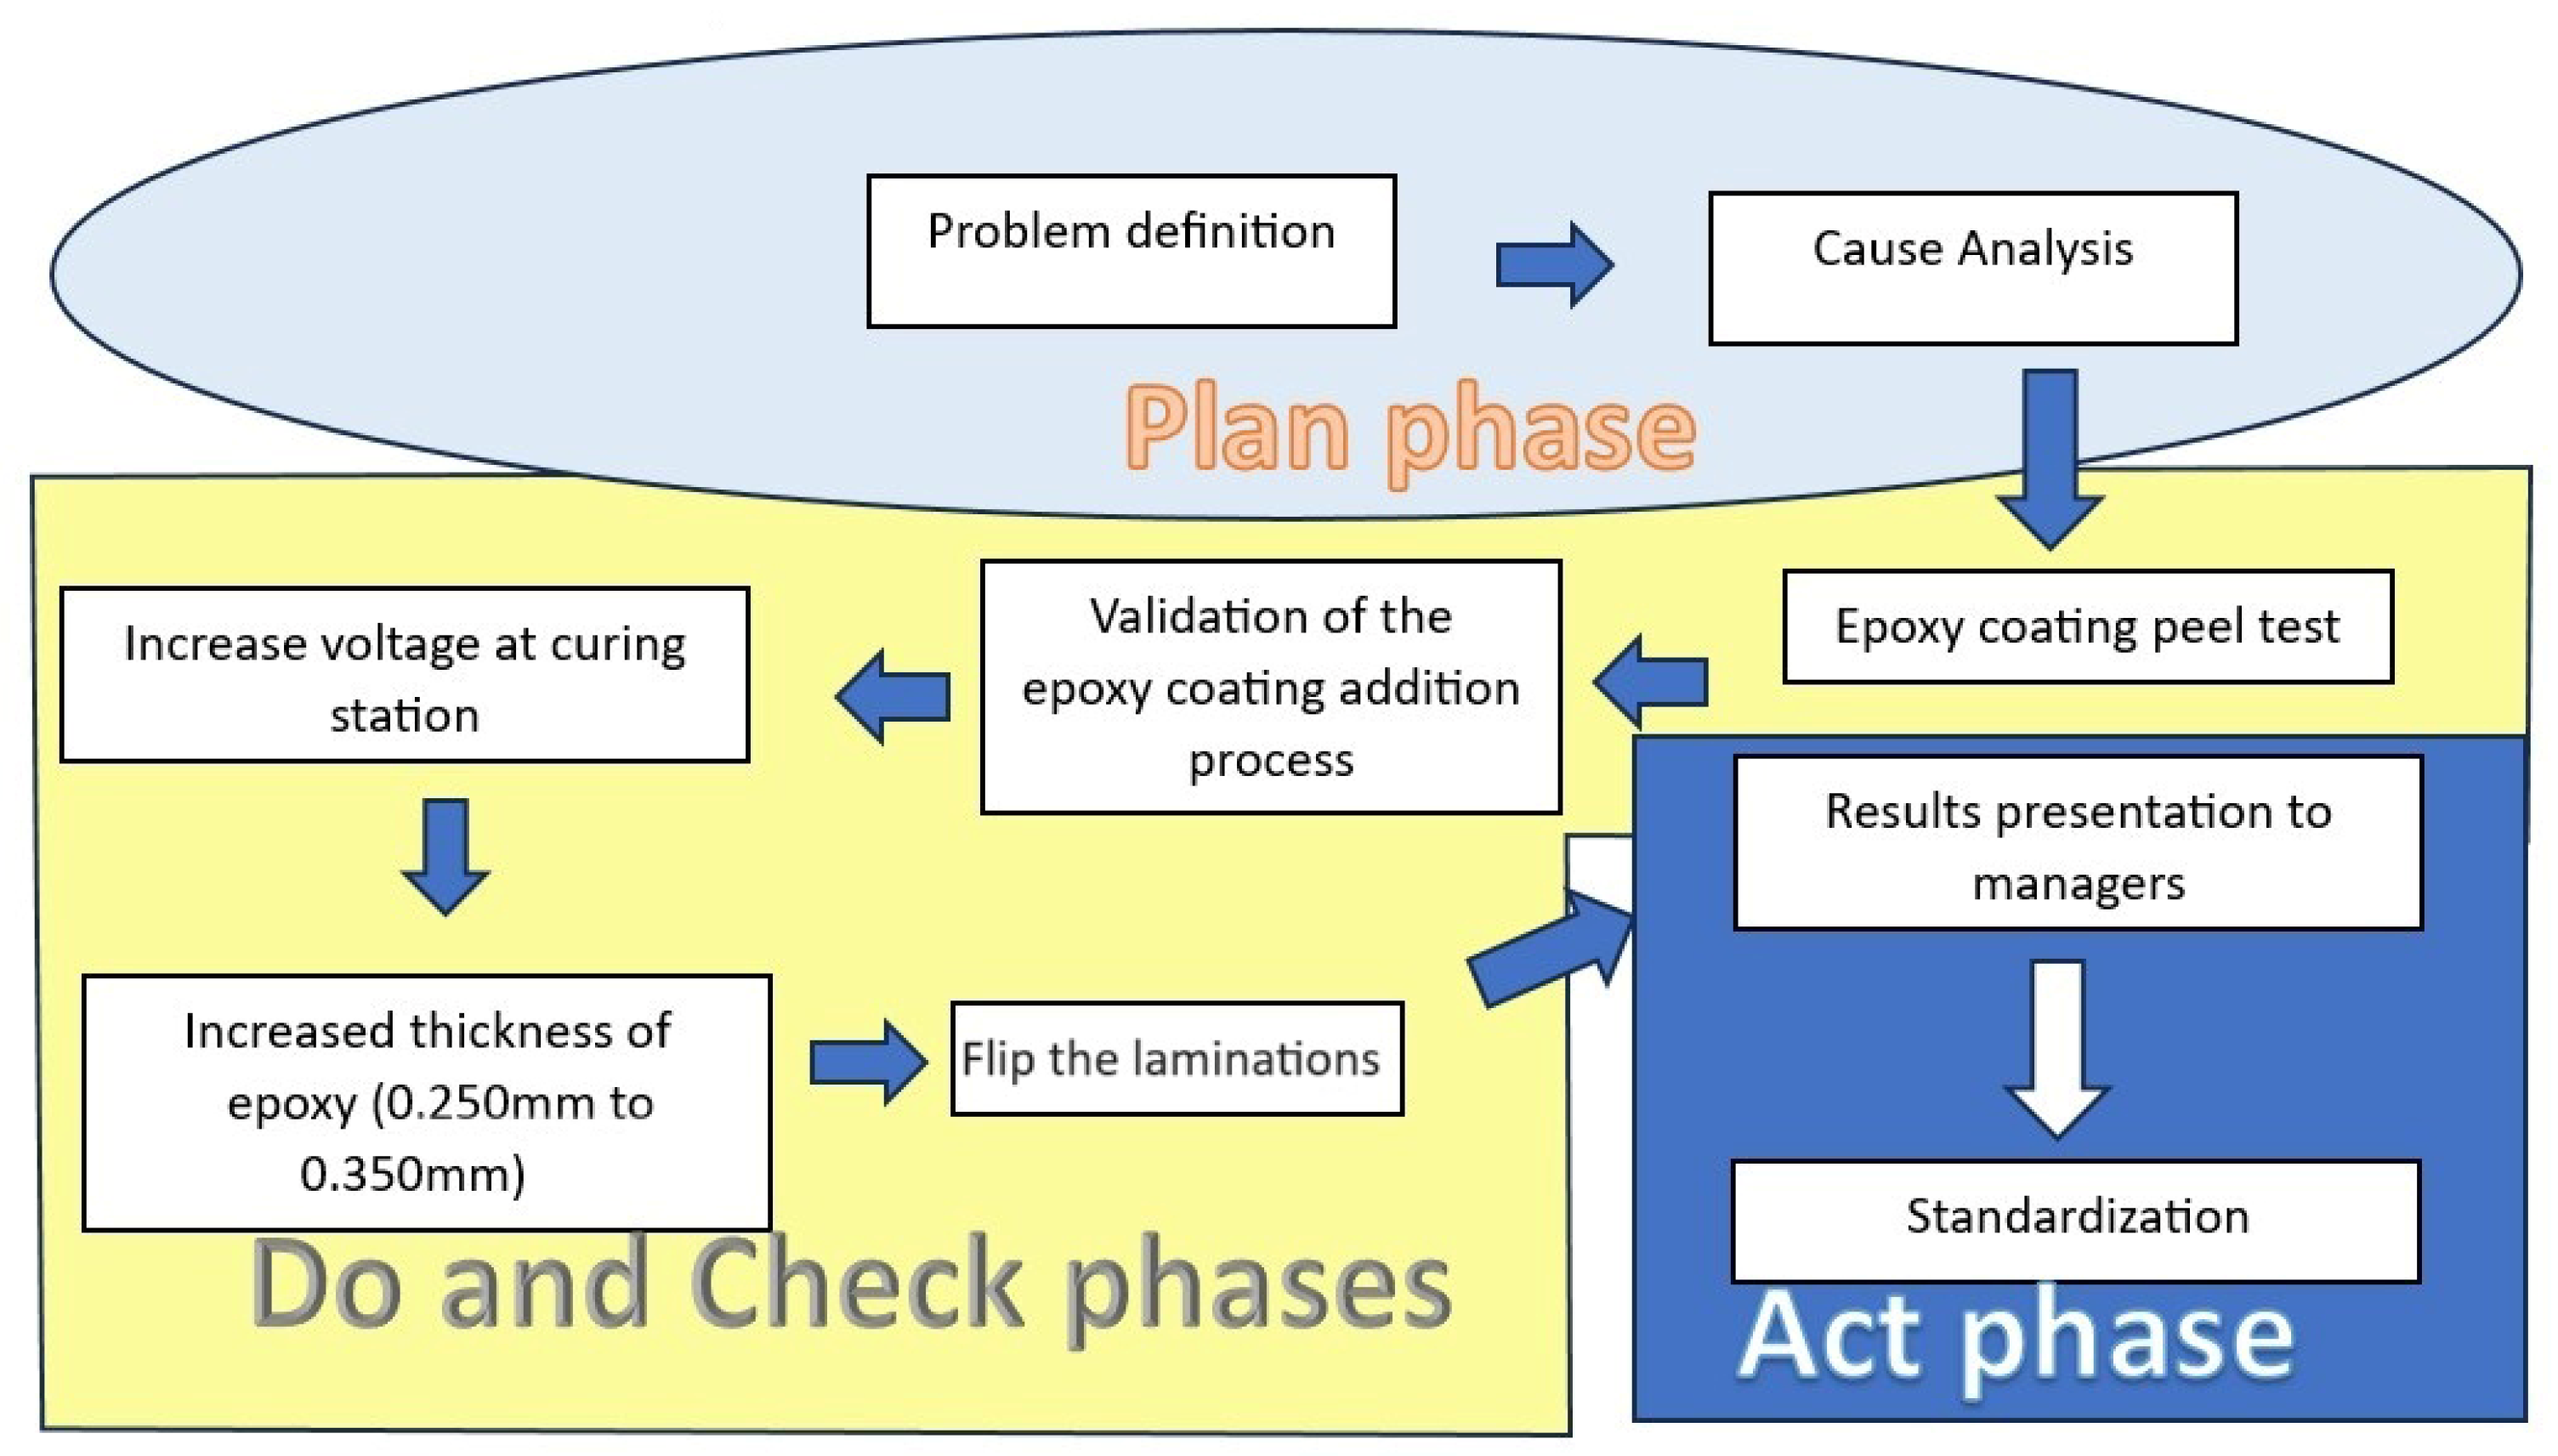
4.1.1. Phase 1: Plan
- (a)
- The armature production line frequently halts due to hipot issues, resulting in costly stoppages and the generation of scrap. Unwanted continuity in the pieces renders them unusable in electric motors, necessitating their disposal.
- (b)
- Thin or uneven epoxy coating, crucial for preventing contact between the cable and lamination, is identified as a significant factor contributing to the hipot failures.
- (c)
- The validation process for the epoxy coating addition process is deemed unreliable.
4.1.2. Phases 2 and 3: Do and Check
- Conducting peel strength analysis to assess the adhesive strength of the epoxy coating;
- Validating the epoxy coating addition process;
- Adjusting the voltage at the epoxy coating curing station to optimize curing conditions for better insulation;
- Testing different thicknesses of the epoxy coating to determine the optimal balance between insulation effectiveness and production efficiency;
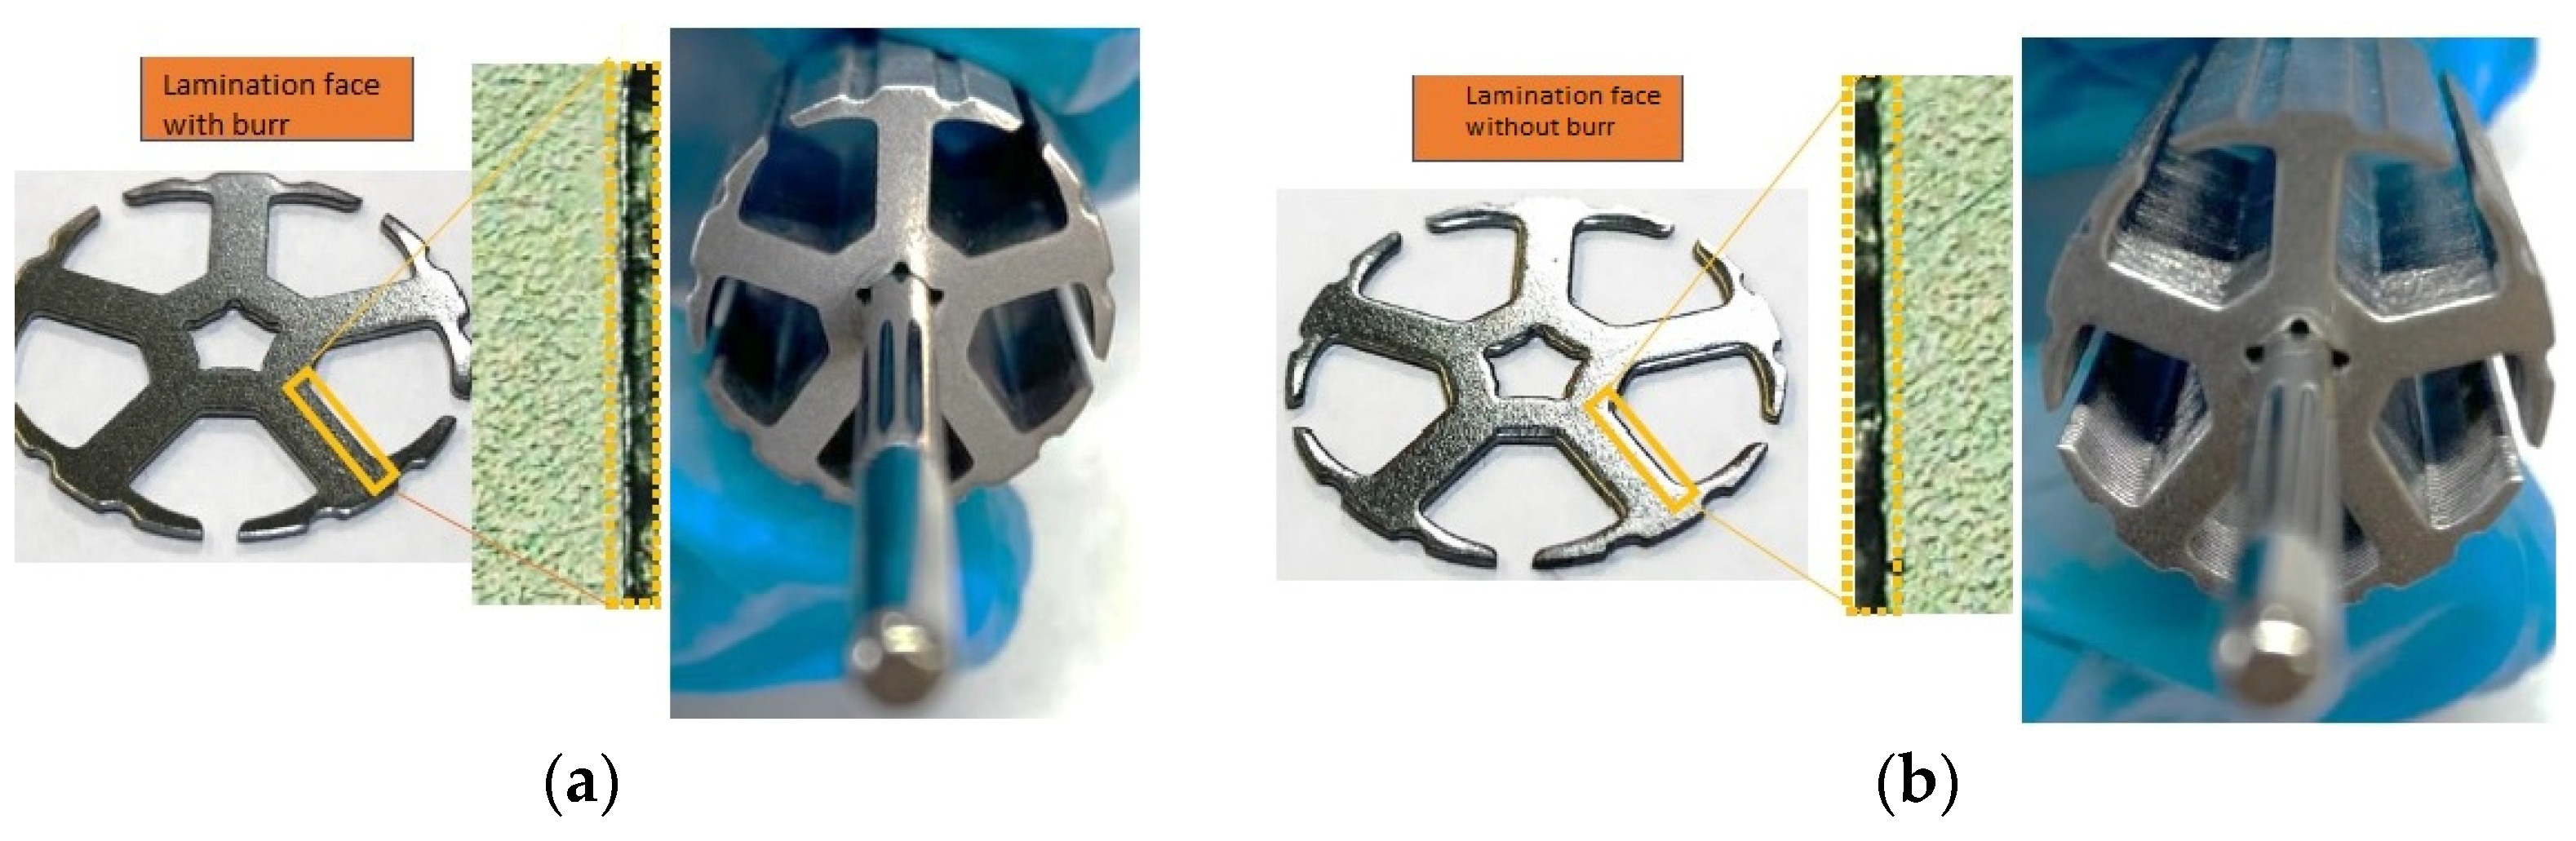
- Evaluating the impact of rotating the lamination faces 180° on the compatibility of the armature body with the epoxy coating.
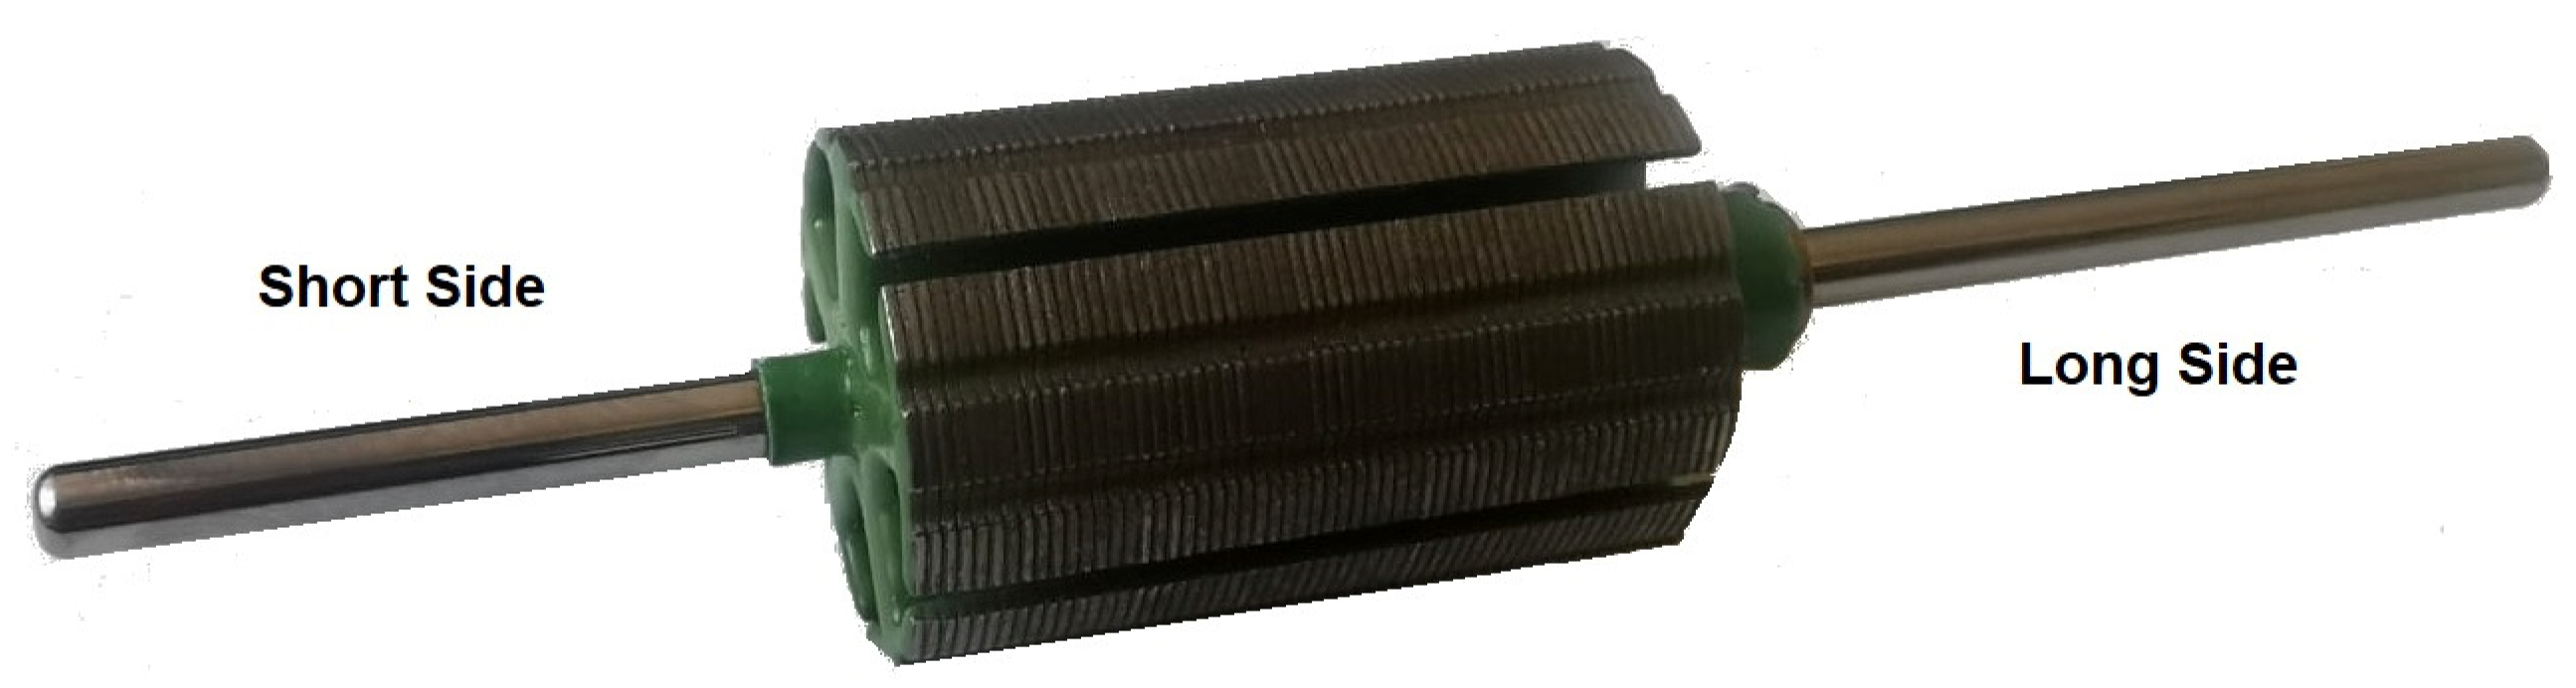
Epoxy Coating Peel Test
Validation of the Epoxy Coating Addition Process
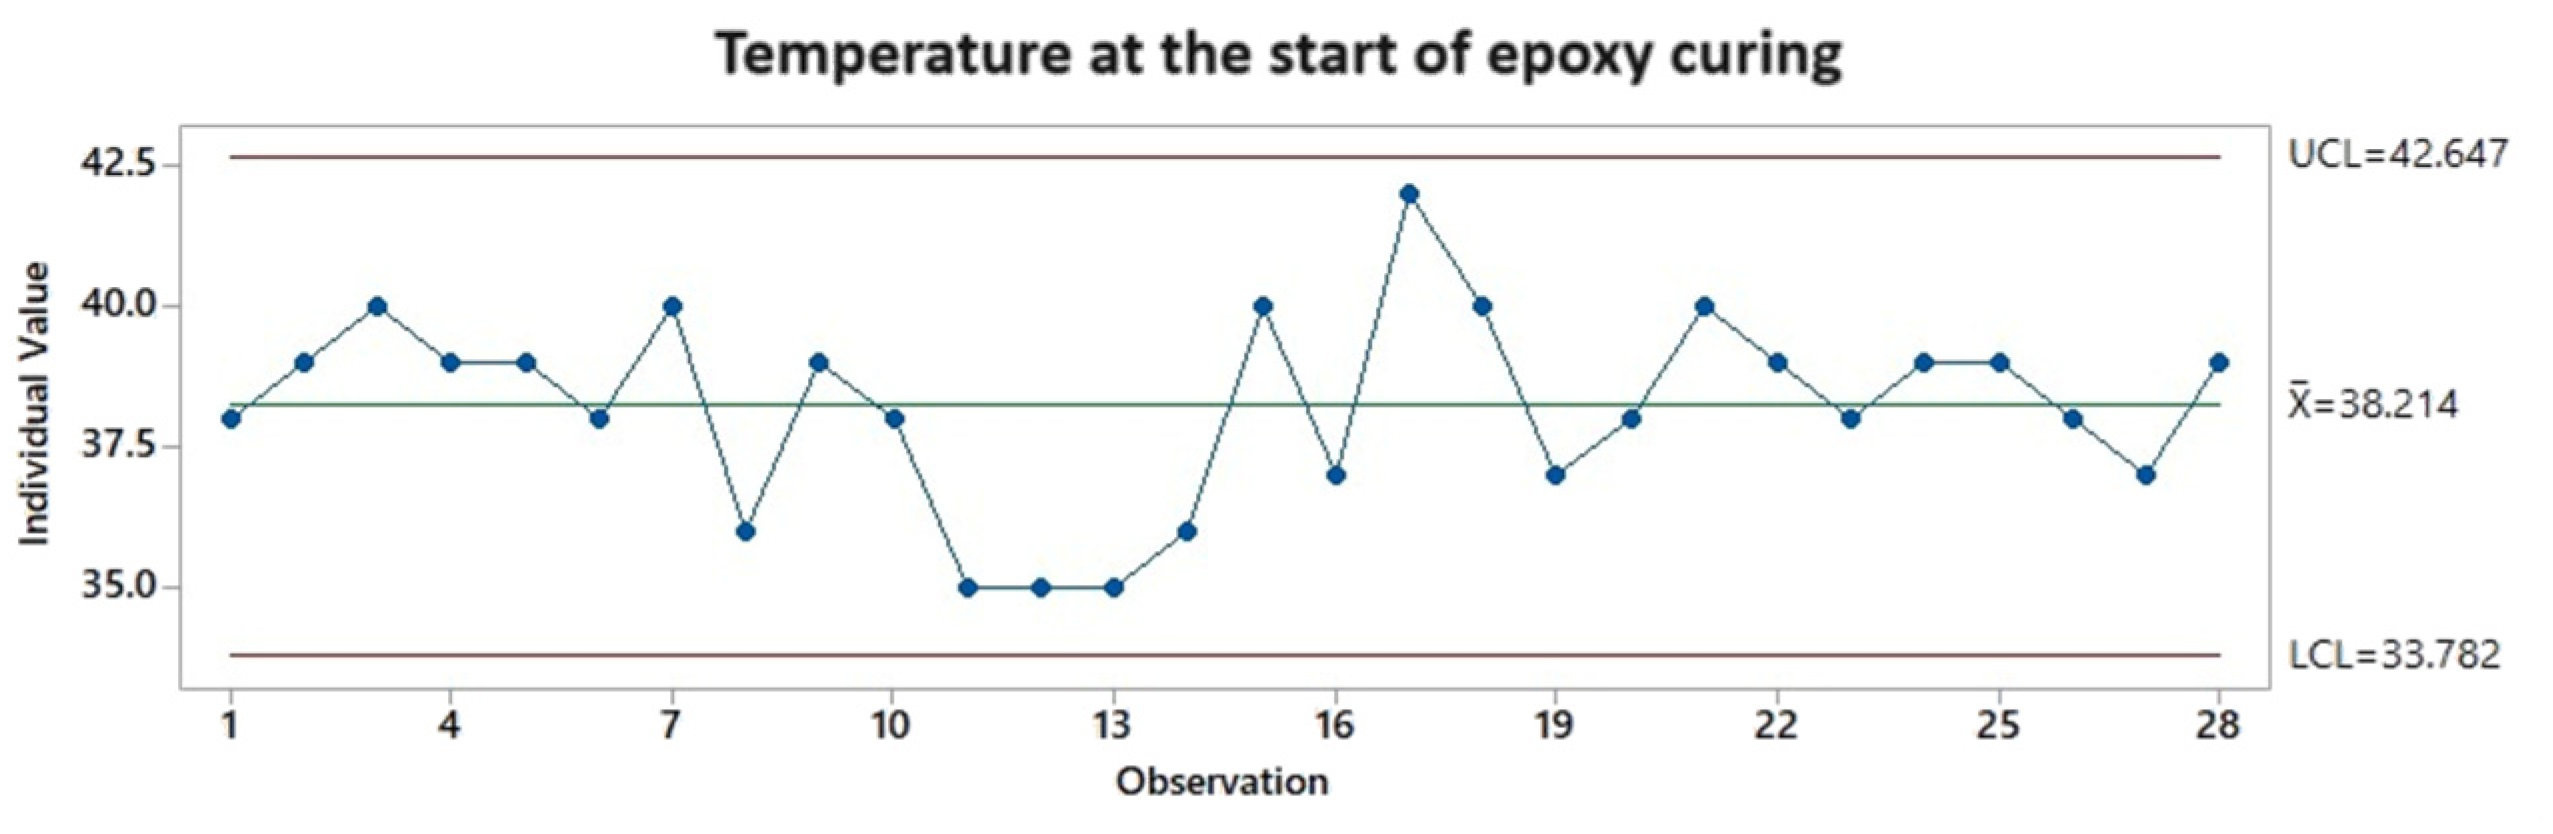
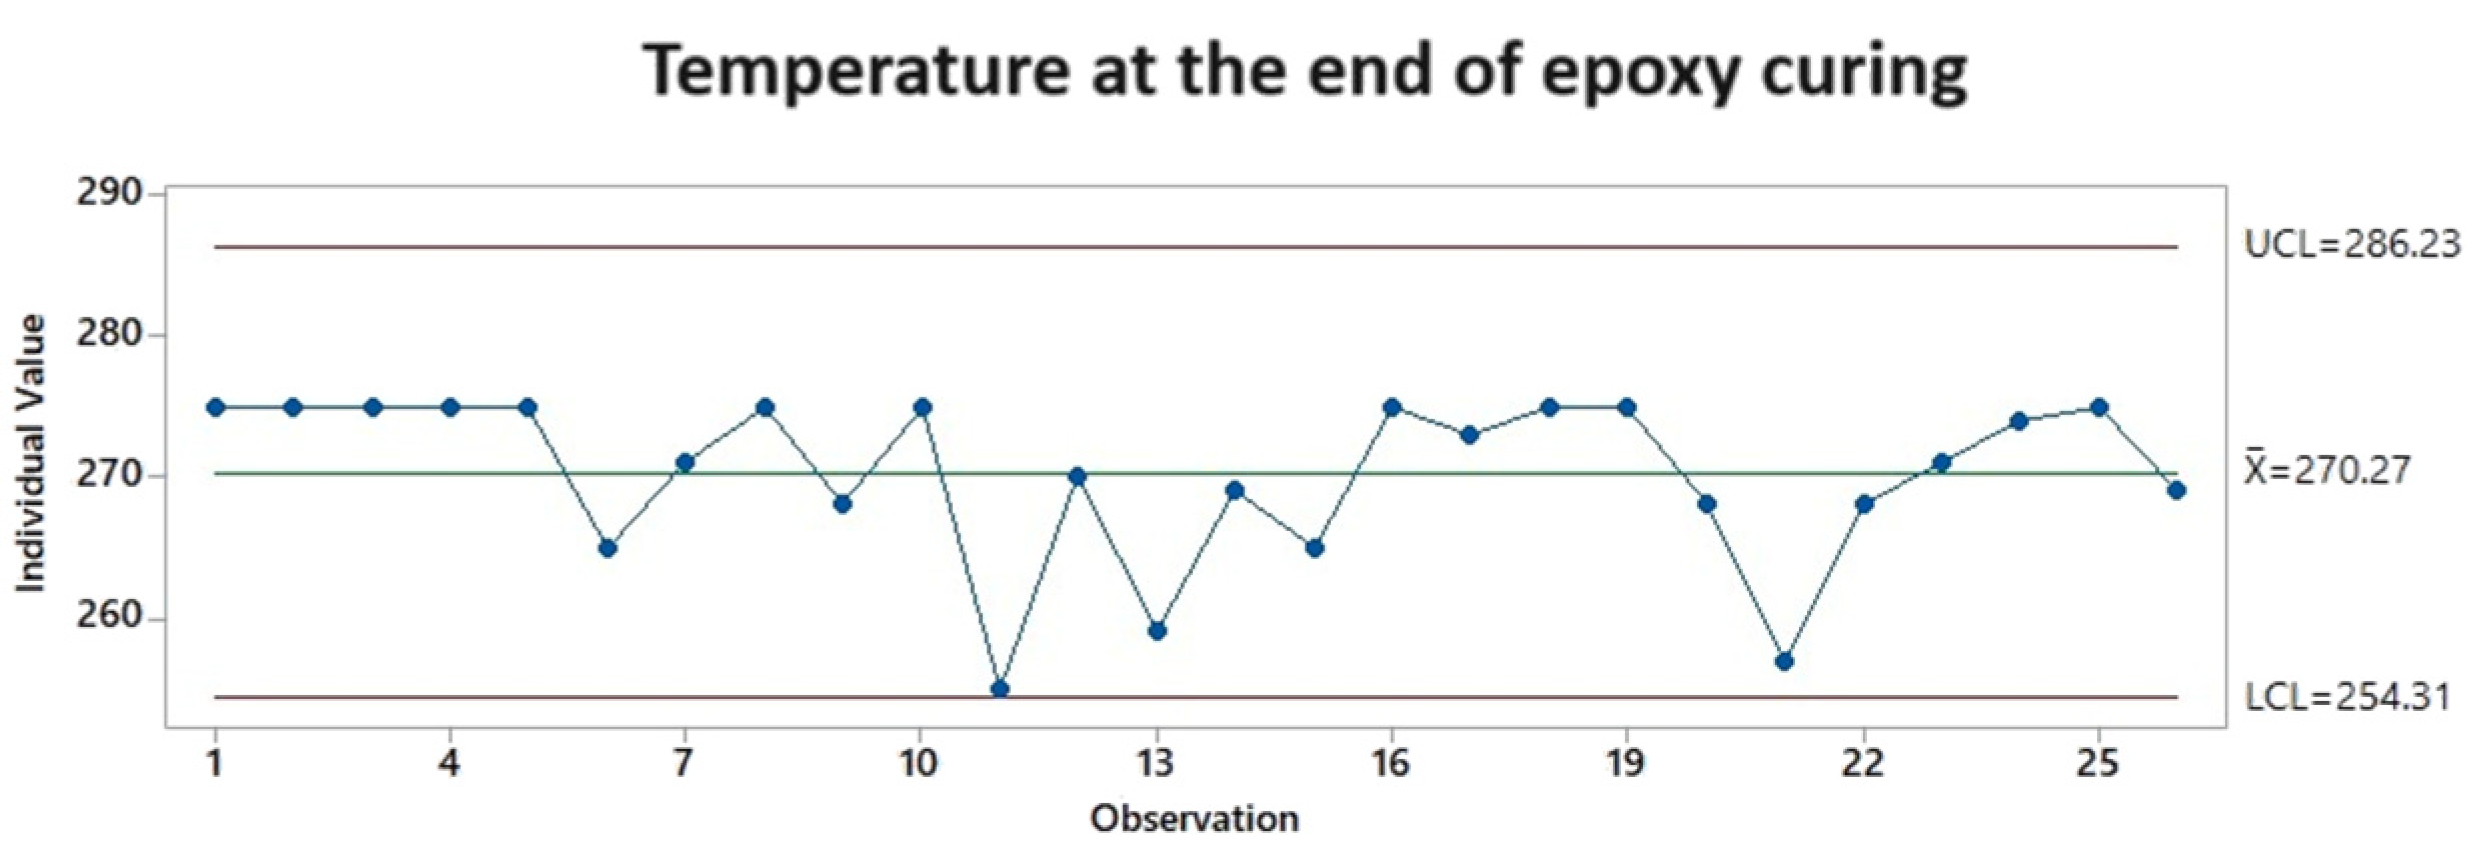
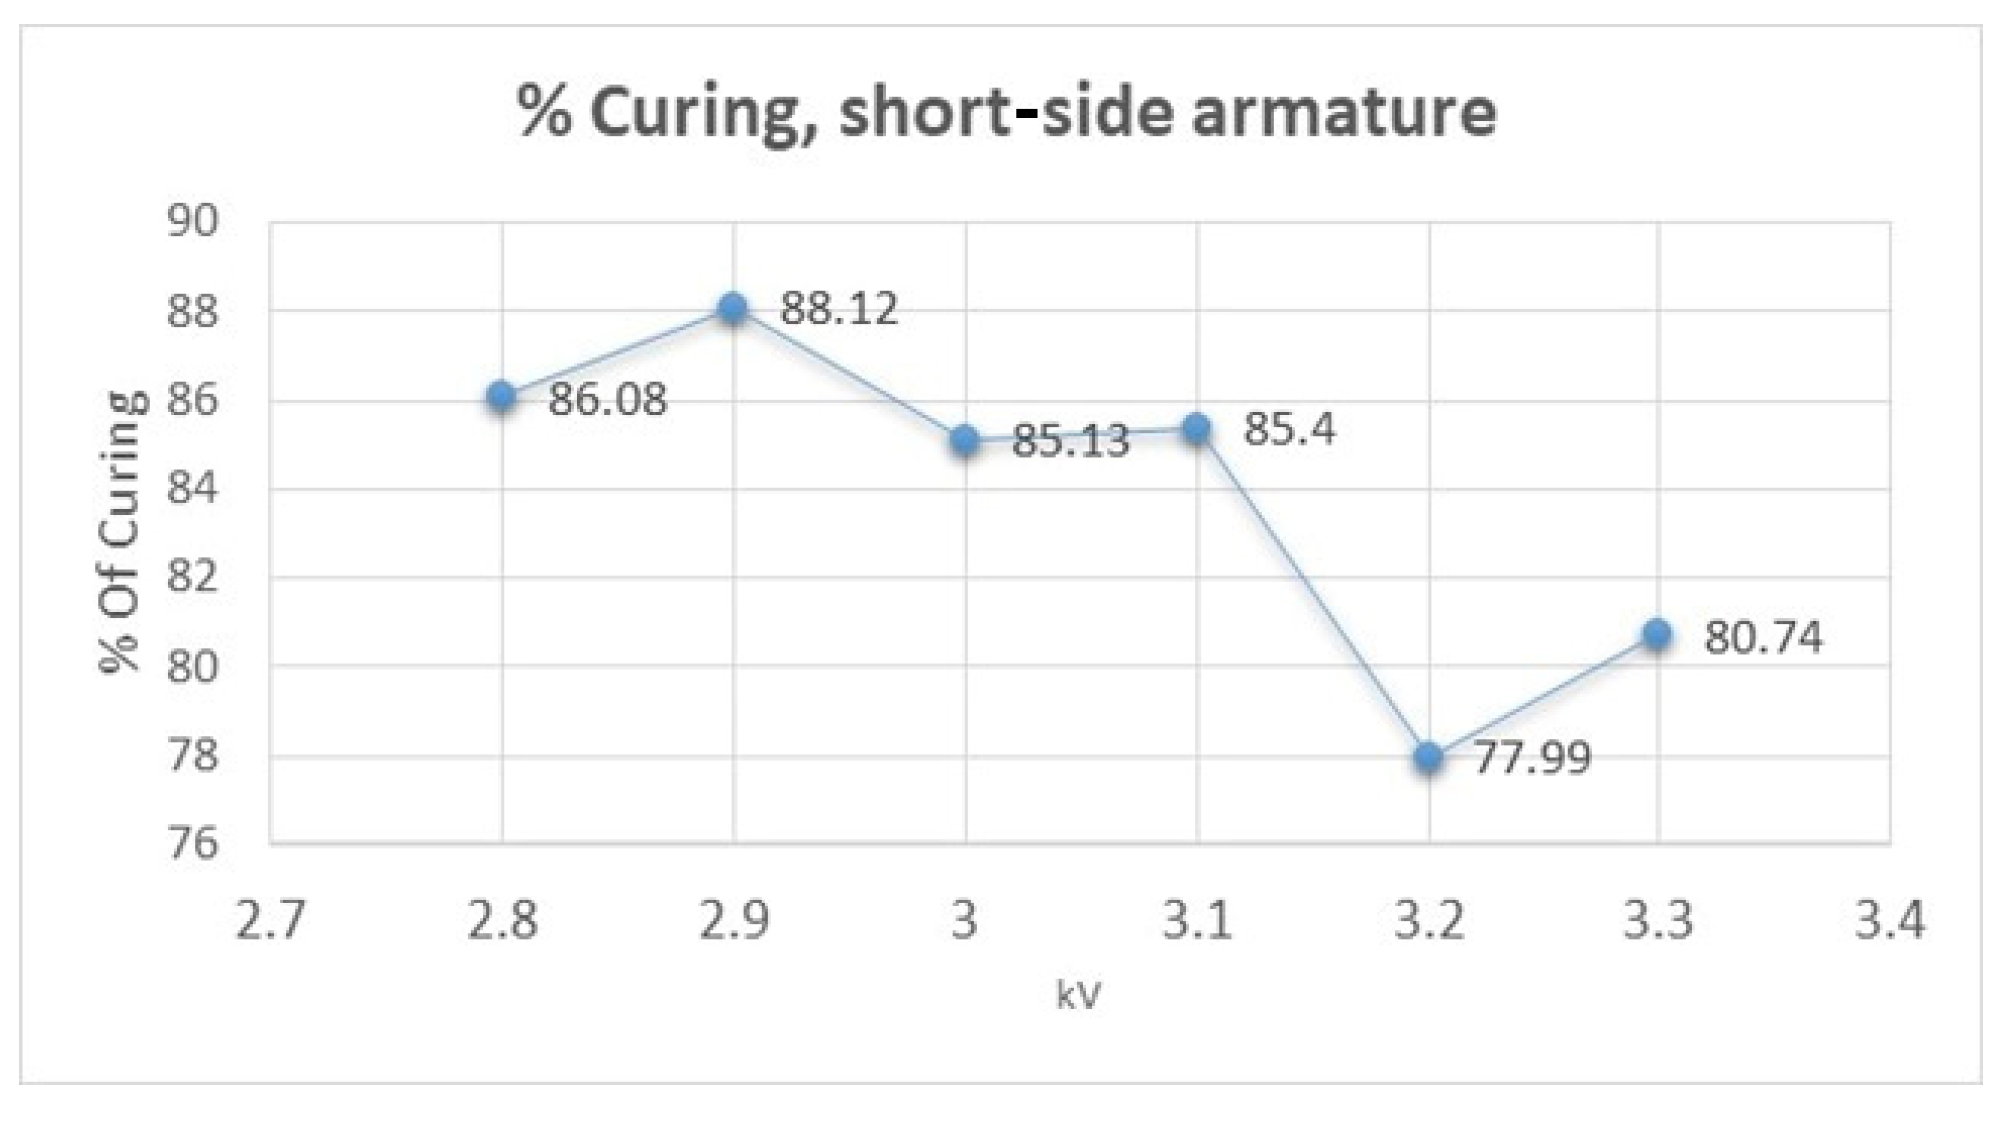
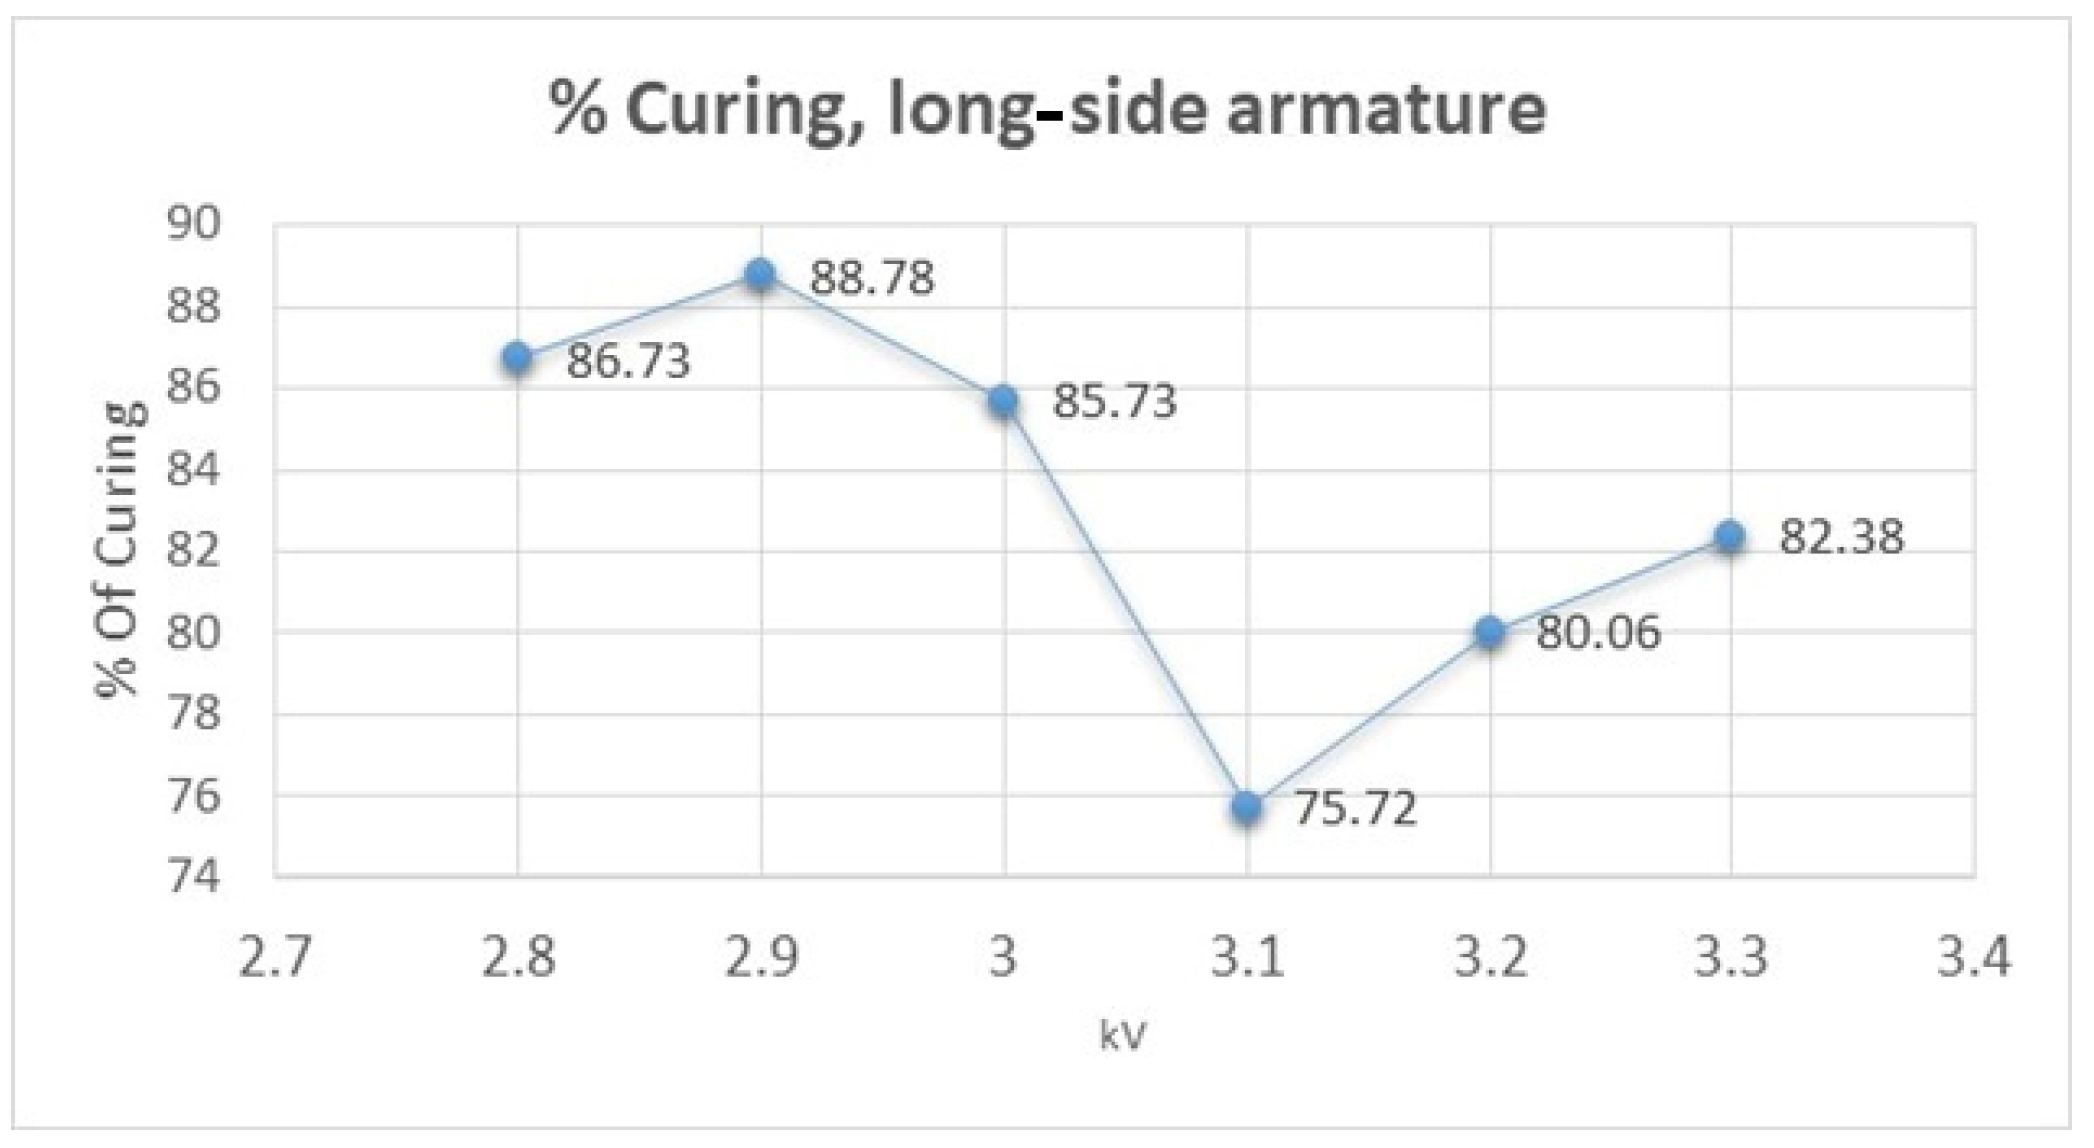
Adjusting the Voltage at the Epoxy Coating Curing Station to Optimize Curing Conditions
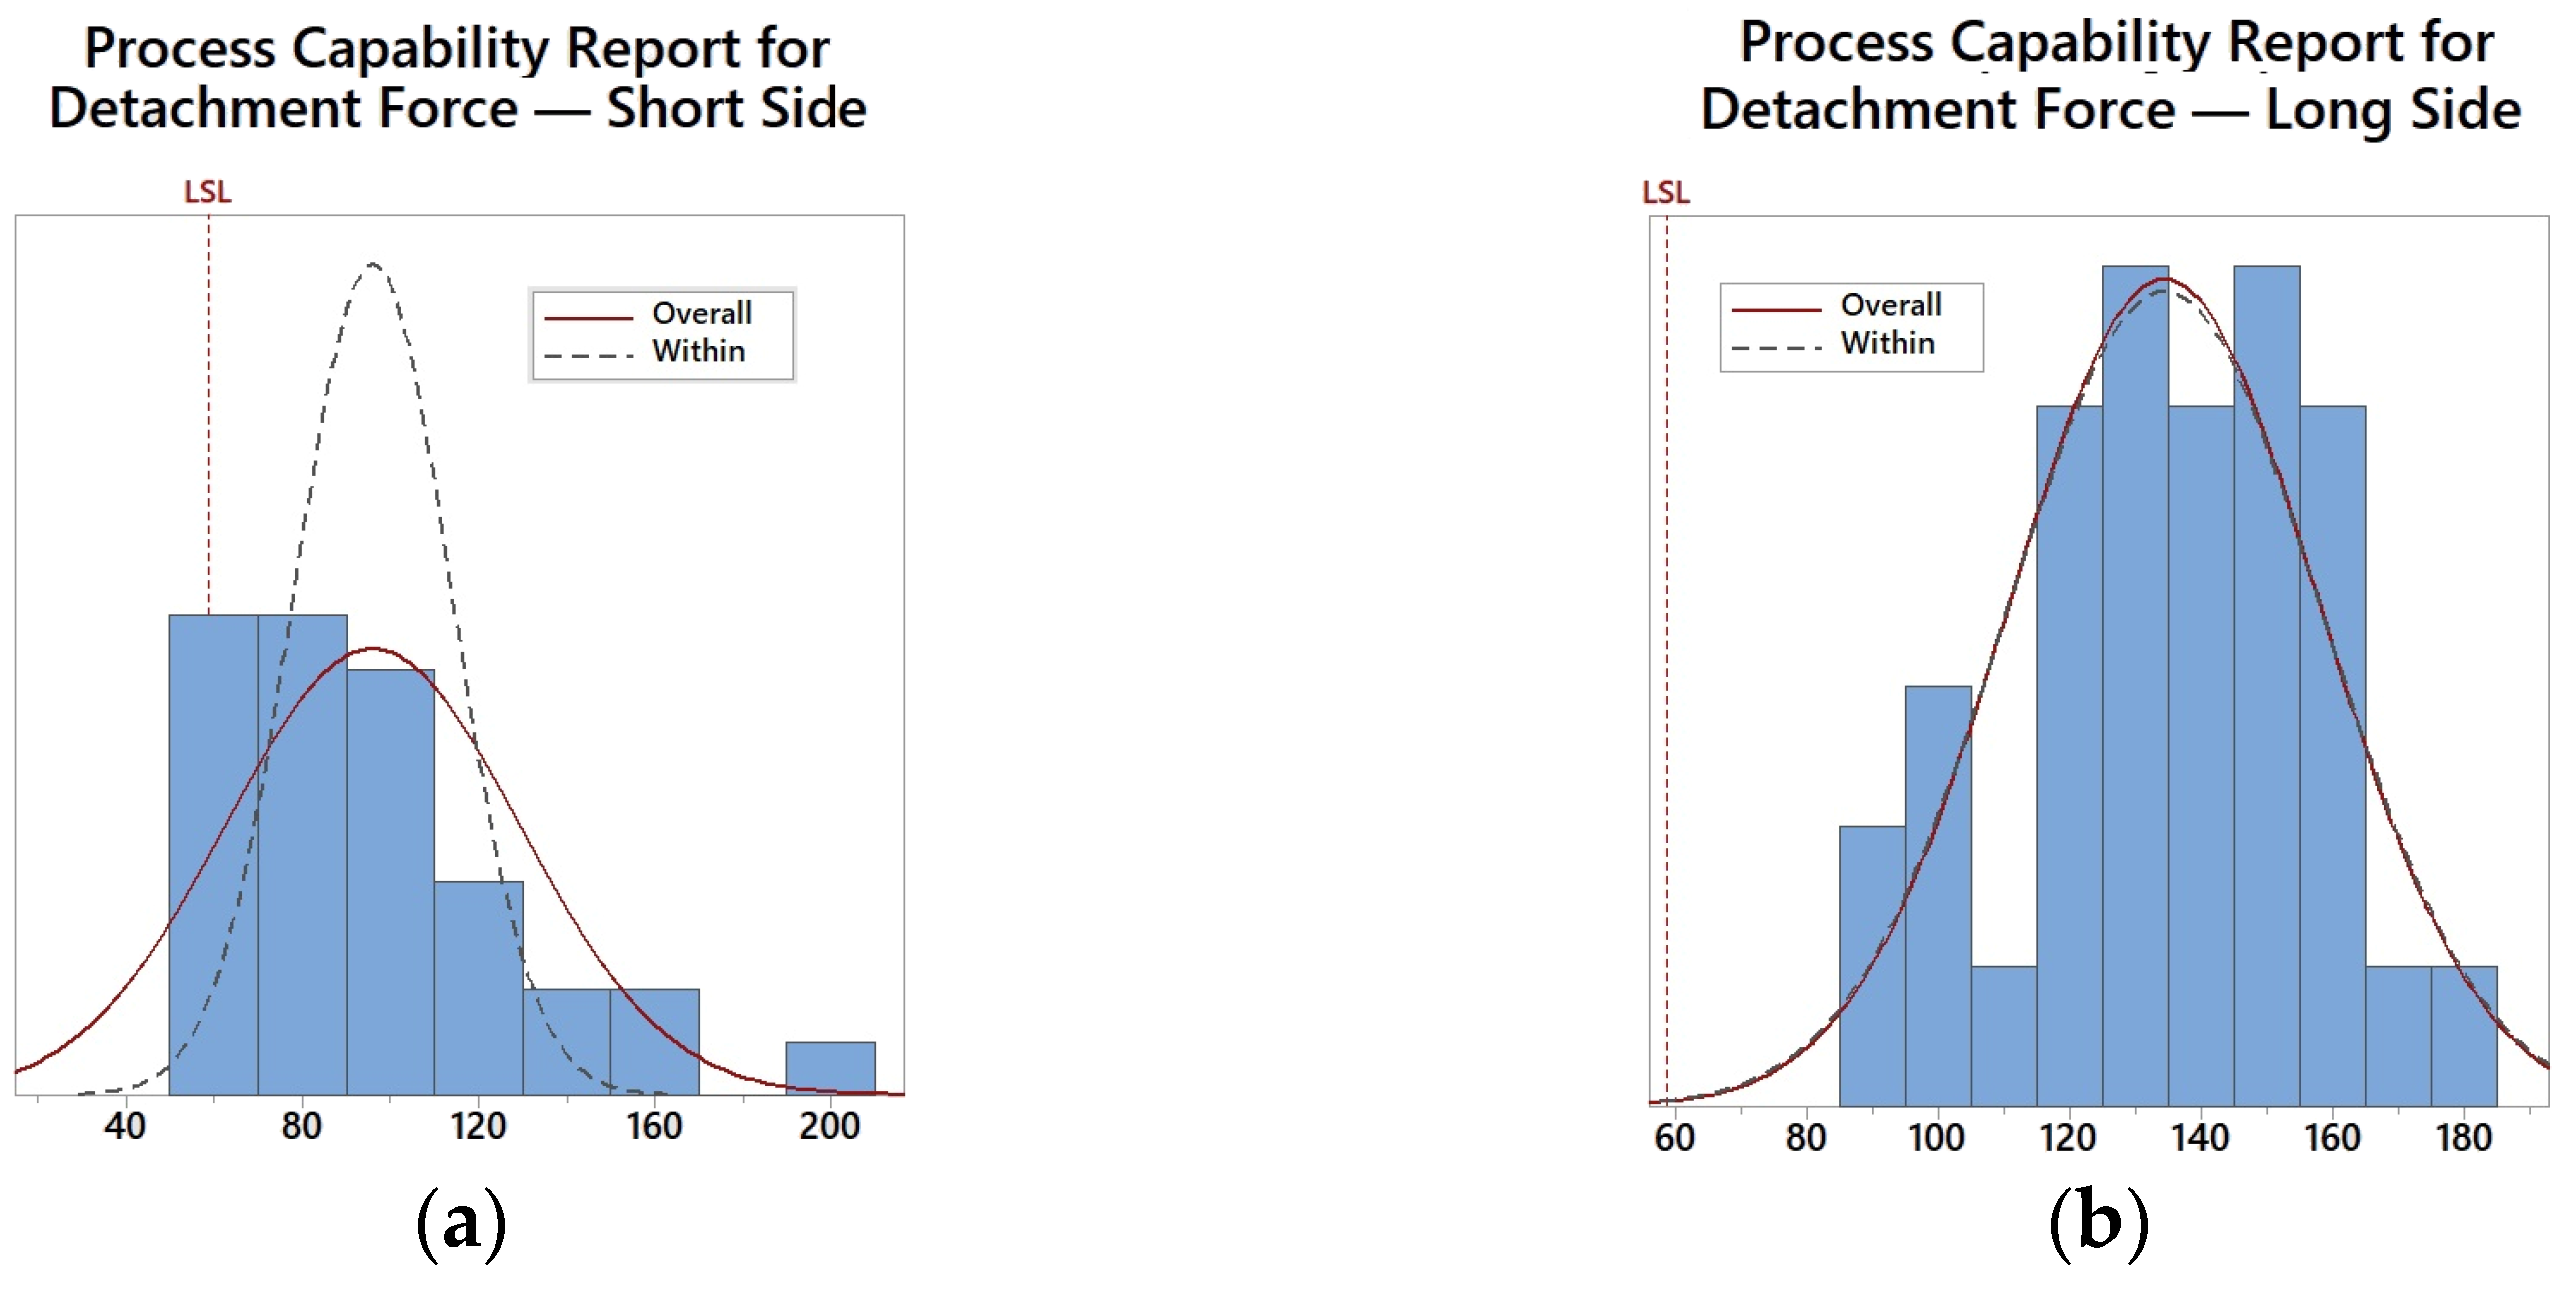
Testing Different Thicknesses of the Epoxy Coating to Find the Optimal Balance between Insulation and Production Efficiency
Evaluating the Impact of Rotating the Lamination Faces 180° on the Compatibility of the Armature Body with the Epoxy Coating
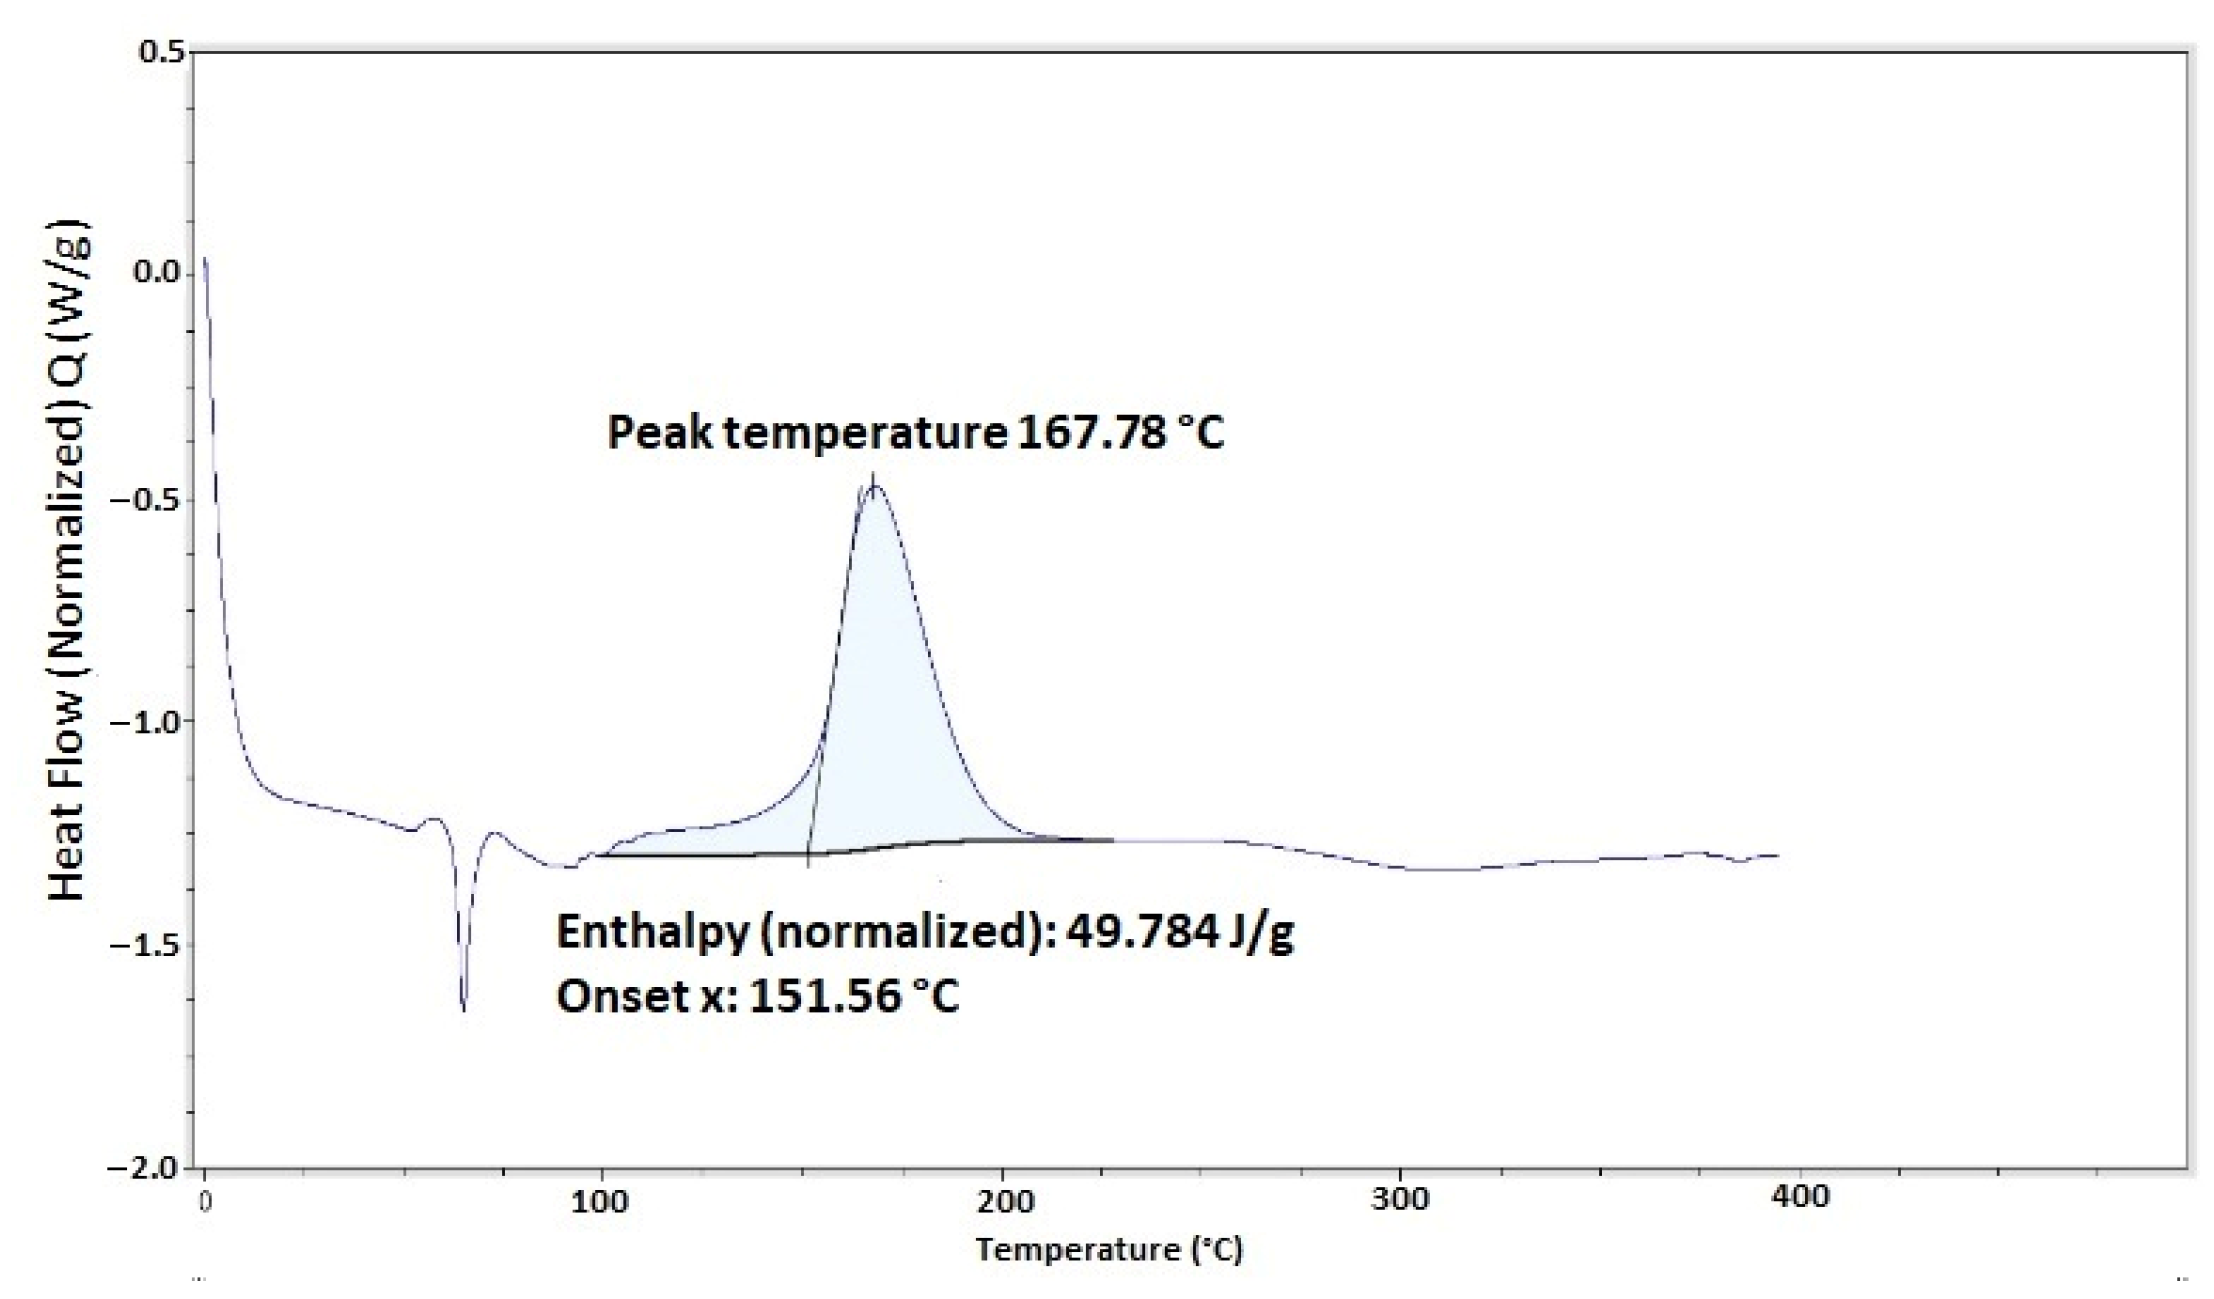
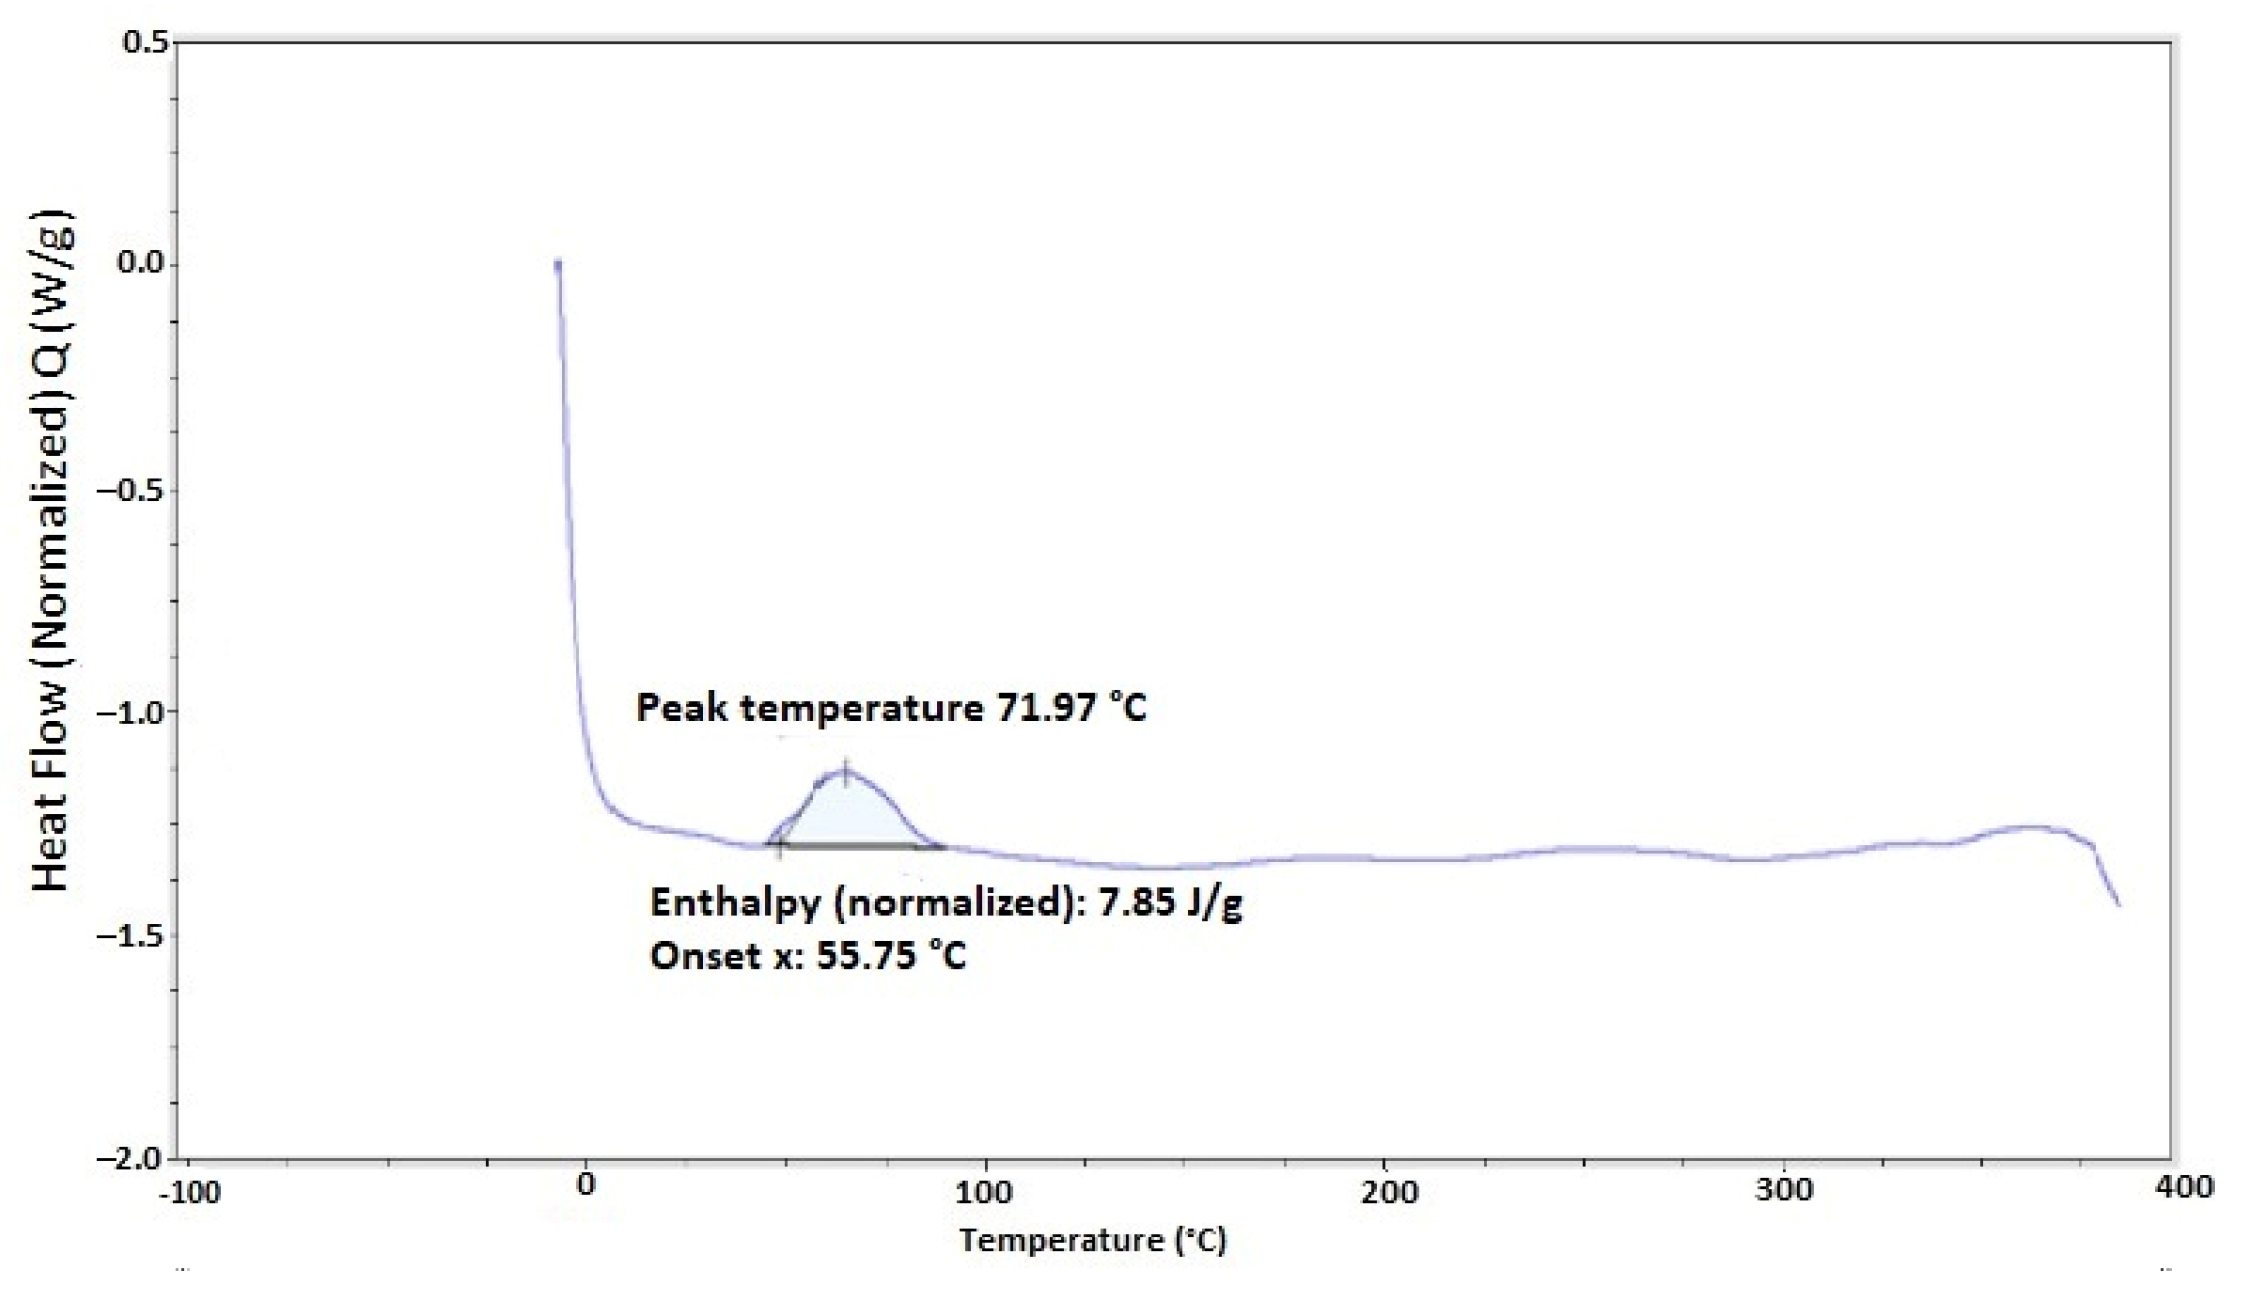
Differential Scanning Calorimetry Test
4.1.3. Phase 4: Act
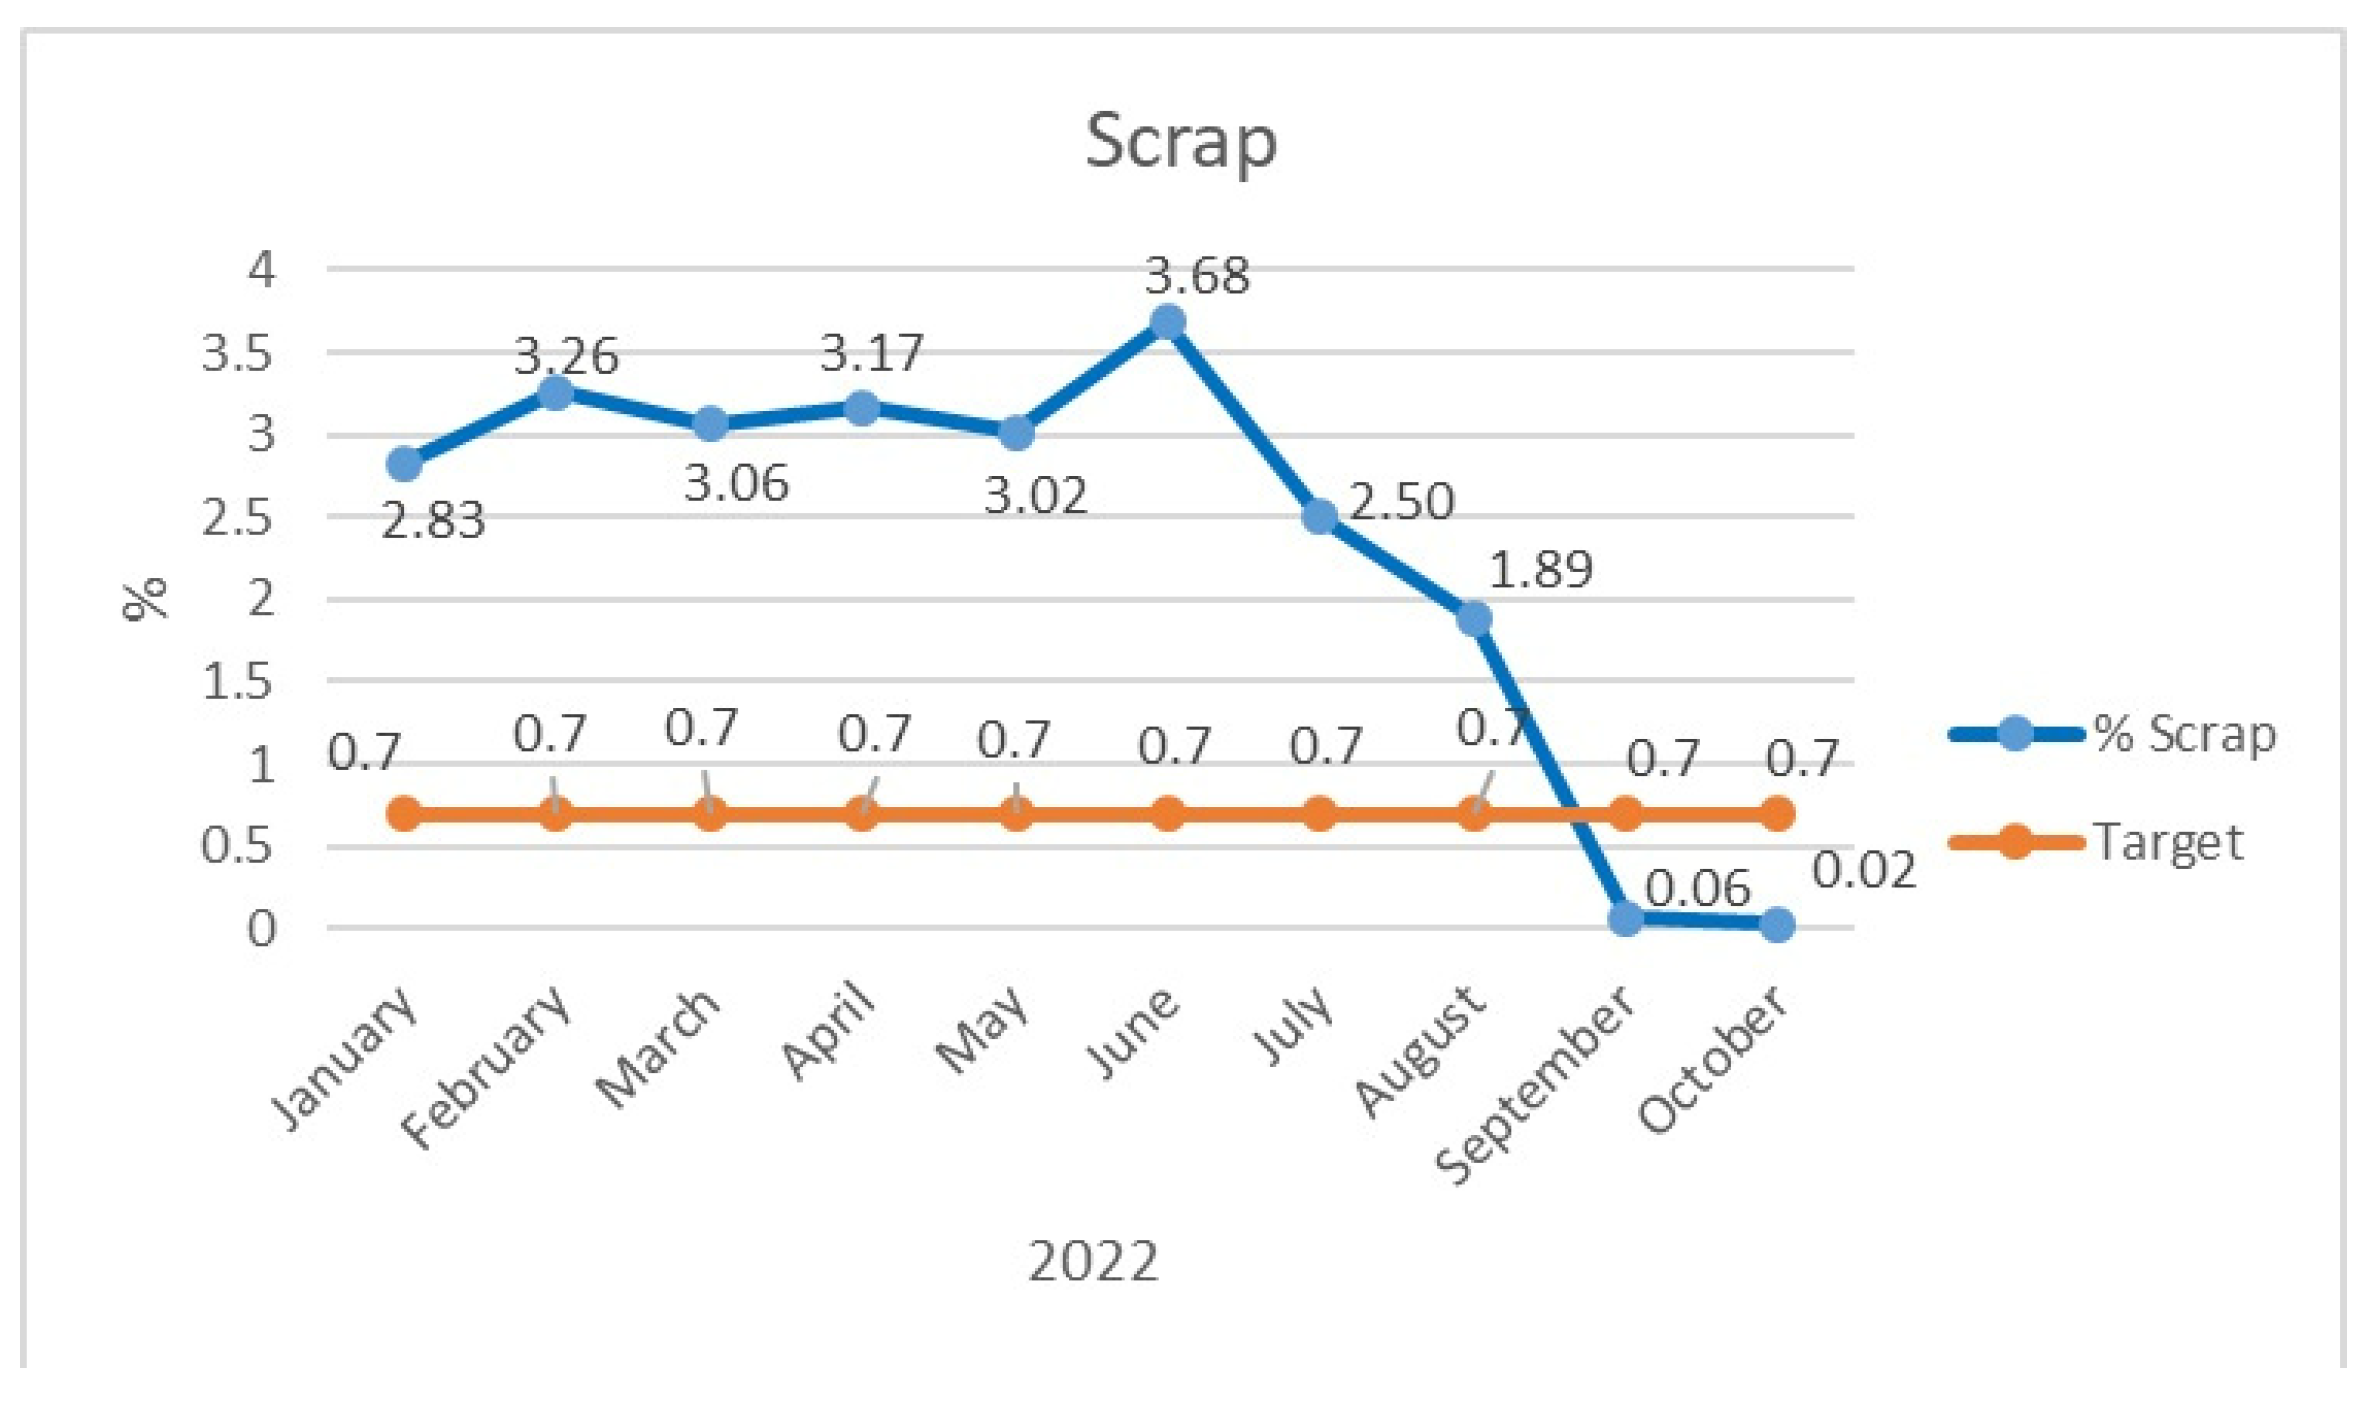
5. Results
6. Conclusions
6.1. Implications for Theory
- (a)
- Integration with other quality management frameworks: This research achieves this goal by combining PDCA with other quality tools like capability analysis and control charts for a more comprehensive approach to continuous improvement. In addition, this research proposes a simplified version of the PDCA cycle, combining the “Do” and “Check” phases into a single “Do/Check” phase. This streamlined approach can expedite the achievement of results.
- (b)
- Application in specific contexts: While this study was applied in electric motor manufacturing, the framework’s replicability allows for adaptation and application in organizations that manufacture products with wire windings. This includes generators, alternators, pumps, transformers, switchgears, and similar equipment.
6.2. Implications for Practice
6.3. Limitations and Future Research
Author Contributions
Funding
Institutional Review Board Statement
Informed Consent Statement
Data Availability Statement
Acknowledgments
Conflicts of Interest
References
- Abdel-Shafy, H.; Mansour, M. Solid waste issue: Sources, composition, disposal, recycling, and valorization. Egypt. J. Pet. 2018, 27, 1275–1290. [Google Scholar] [CrossRef]
- Liladhar, N.; Achari, A.; Choudhary, S. Enhancing customer loyalty through quality of service: Effective strategies to improve customer satisfaction, experience, relationship, and engagement. Int. Res. J. Mod. Eng. Technol. Sci. 2023, 5, 427–452. [Google Scholar] [CrossRef]
- Palange, A.; Dhatrak, P. Lean manufacturing a vital tool to enhance productivity in manufacturing. Mater. Today Proc. 2021, 46, 729–736. [Google Scholar] [CrossRef]
- Nallusamy, S. Execution of lean and industrial techniques for productivity enhancement in a manufacturing industry. Mater. Today Proc. 2021, 37, 568–575. [Google Scholar] [CrossRef]
- Arunagiri, P.; Suresh, P.; Jayakumar, V. Assessment of hypothetical correlation between the various critical factors for lean systems in automobile industries. Mater. Today Proc. 2020, 33, 35–38. [Google Scholar] [CrossRef]
- International Labour Organization [ILO]. The Future of Work in the Automotive Industry: The Need to Invest in People’s Capabilities and Decent and Sustainable Work. 2020. Available online: http://www.jstor.org/stable/26296382 (accessed on 3 February 2024).
- Moen, R.; Norman, C. Evolution of the PDCA Cycle. In Proceedings of the 7th ANQ Congress, Tokyo, Japan, 17 September 2009. [Google Scholar]
- Nabiilah, A.; Hamedon, Z.; Faiz, M. Improving quality of light commercial vehicle using PDCA approach. J. Adv. Manuf. Technol. 2017, 12, 525–534. [Google Scholar]
- Jagusiak-Kocik, M. PDCA cycle as a part of continuous improvement in the production company—A case study. Prod. Eng. Arch. 2017, 14, 19–22. [Google Scholar] [CrossRef]
- Sztorc, M.; Savenkovs, K. The Use of Lean Management Instruments to Shape Business Models of Service Companies. Manag. Prod. Eng. Rev. 2020, 11, 128–140. [Google Scholar] [CrossRef]
- Rosa, C.; Silva, F.; Pinto-Ferreira, L. Improving the quality and productivity of steel wire-rope assembly lines for the automotive industry. Procedia Manuf. 2017, 11, 1035–1042. [Google Scholar] [CrossRef]
- Kigha, B.; Butu, H.; Owolabi, A.; Wook, J.; Suh, D.; Huh, J. Integrating multi-criteria analysis with PDCA cycle for sustainable energy planning in Africa: Application to hybrid mini-grid system in Cameroon. Sustain. Energy Technol. Assess. 2020, 37, 100628. [Google Scholar] [CrossRef]
- Kumaar-Kathirvel, A.; Paddock-Moore, C.; Chakravorty, S. Plan-Do-Check-Act (PDCA) Based Approach to Business Process Mapping. In Proceedings of the International Conference on Industrial Engineering and Operations Management, Bangalore, India, 16–18 August 2021. [Google Scholar]
- Nedra, A.; Néjib, S.; Yassine, C.; Morched, C. A new lean Six Sigma hybrid method based on the combination of PDCA and the DMAIC to improve process performance: Application to clothing SME. Ind. Textila J. 2019, 70, 447–456. [Google Scholar] [CrossRef]
- Sokovic, M.; Pavletic, D.; Kern-Pipan, K. Quality Improvement Methodologies–PDCA Cycle, RADAR Matrix, DMAIC and DFSS. J. Achiev. Mater. Manuf. Eng. 2010, 43, 476–483. [Google Scholar]
- Sunadi, S.; Hardi-Purba, H.; Hasibuan, S. Implementation of Statistical Process Control through PDCA Cycle to Improve Potential Capability Index of Drop Impact Resistance: A Case Study at Aluminum Beverage and Beer Cans Manufacturing Industry in Indonesia. Qual. Innov. Prosper. 2020, 24, 104–127. [Google Scholar] [CrossRef]
- Amaral, V.; Ferreira, A.; Ramos, B. Internal Logistics Process Improvement using PDCA: A Case Study in the Automotive Sector. Bus. Syst. Res. 2022, 13, 100–115. [Google Scholar] [CrossRef]
- Silva, A.; Medeiros, C.; Vieira, R.K. Cleaner Production and PDCA cycle: Practical application for reducing the Cans Loss Index in a beverage company. J. Clean. Prod. 2017, 150, 324–338. [Google Scholar] [CrossRef]
- Singh-Sidhu, B.; Kumar, V.; Bajaj, A. The “5S” Strategy by Using PDCA Cycle for Continuous Improvement of the Manufacturing Processes in Agriculture Industry. Int. J. Res. Ind. Eng. 2013, 2, 10–23. [Google Scholar]
- Tahiduzzaman, M.; Rahman, M.; Kumar-Dey, S.; Kumar_Kapuria, T. Minimization of Sewing Defects of an Apparel Industry in Bangladesh with 5S & PDCA. Am. J. Ind. Eng. 2018, 5, 17–24. [Google Scholar] [CrossRef]
- Garza-Reyes, J.; Torres, J.; Govindan, K.; Cherrafi, A.; Ramanathan, U. A PDCA-based approach to Environmental Value Stream Mapping (E-VSM). J. Clean. Prod. 2018, 180, 335–348. [Google Scholar] [CrossRef]
- Goyal, A.; Agrawal, R.; Kumar-Chokhani, R.; Saha, C. Waste reduction through Kaizen approach: A case study of a company in India. Waste Manag. Res. 2018, 37, 102–107. [Google Scholar] [CrossRef]
- Isniah, S.; Hardi, H.; Debora, F. Plan do check action (PDCA) method: Literature review and research issues. J. Sist. Dan Manaj. Ind. 2020, 4, 72–81. [Google Scholar] [CrossRef]
- De Lima, J.; Correa, P.; Drumond, R.; Carvalho, A.; Goncalves, R. Ferramentas da qualidade nas indústrias de papel e celulosa da Bahia. Sodebras 2015, 10, 49–54. [Google Scholar]
- Zhong, X.; Wu, X.; Xie, X.; Zhou, Q.; Xu, R.; Wang, J.; He, L.; He, Y.; Qiu, X. A descriptive study on clinical department managers’ cognition of the Plan-Do-Check-Act cycle and factors influencing their cognition. BMC Med. Educ. 2023, 23, 294. [Google Scholar] [CrossRef] [PubMed]
- Knop, K.; Mielczarek, K. The improvement on the basis pf PDCA and SDCA cycles. Zesz. Nauk. Qual. Prod. Improv. 2015, 2, 60–71. [Google Scholar] [CrossRef]
- Praveen, G. Beyond PDCA—A new process management model. Qual. Prog. Improv. 2006, 7, 45–52. [Google Scholar]
- Habibie, M.; Kresiani, R. Implementation of PDCA Cycle in Calibration and Testing Laboratory Based on ISO/IEC 17025:2017. IOP Conf. Ser. Mater. Sci. Eng. 2019, 598, 012108. [Google Scholar] [CrossRef]
- Stefanova-Stoyanova, V.; Danov, P. Comparative Analysis of Specialized Standards and Methods on Increasing the Effectiveness and Role of PDCA for Risk Control in Management Systems. In Proceedings of the 10th International Scientific Conference on Computer Science (COMSCI), Sofia, Bulgaria, 30 May–2 June 2022; pp. 1–6. [Google Scholar] [CrossRef]
- Majerník, M.; Daneshjo, N.; Chovancová, J.; Sančiová, G. Design of integrated management systems according to the revised ISO standards. Pol. J. Manag. Stud. 2017, 15, 135–143. [Google Scholar] [CrossRef]
- Algheriani, M.; Majstorovic, V.; Kirin, S.; Spasojevic, V. Risk Model for Integrated Management System. Teh. Vjesn. Tech. Gaz. 2019, 26, 1833–1840. [Google Scholar] [CrossRef]
- ISO 9001:2015; Quality Management Systems—Requirements. International Organization for Standardization: Geneva, Switzerland, 2015.
- Pallawala, N.; Jayamaha, N.; Grigg, P. Testing the ISO 9001:2015 Process Model: An Australasian Empirical Study. In Proceedings of the 2018 IEEE International Conference on Industrial Engineering and Engineering Management (IEEM), Bangkok, Thailand, 16–19 December 2018; pp. 1–6. [Google Scholar] [CrossRef]
- Salazar, F.; Tigre, F.; Tubón-Núñez, E.; Carrillo, S.; Buele, J. Implementation of the Quality Management System (ISO 9001: 2015) in the Bodywork Industry. J. Inf. Syst. Eng. Manag. 2019, 4, em0091. [Google Scholar] [CrossRef]
- Susanti, D.; Nur-Amalia, V.; Asbari, M. Analysis of ISO 9001:2015 Implementation in Higher Education: A Narrative Literature Review. Int. J. Soc. Manag. Stud. (IJOSMAS) 2023, 4, 42–48. [Google Scholar] [CrossRef]
- Chiarini, A.; Cherrafi, A. Integrating ISO 9001 and Industry 4.0. An implementation guideline and PDCA model for manufacturing sector. Total Qual. Manag. Bus. Excell. 2023, 34, 1629–1654. [Google Scholar] [CrossRef]
- IATF 16949:2016; Quality Management System for Organizations in the Automotive Industry. AIAG: Southfield, MI, USA, 2016.
- Koncz, A. 8D Usage in Automotive Industry. In Proceedings of the 18th IEEE International Symposium on Computational Intelligence and Informatics, Budapest, Hungary, 21–28 November 2018. [Google Scholar]
- Aguilar-Morales, D.; Pérez-Dominguez, L.; Sánchez-Mojica, K. Application of the 8D methodology for problem solving: A case study in the automotive industry. Mundo Fesc. 2022, 12, 259–268. [Google Scholar]
- Phanden, R.; Sheokand, A.; Goyal, K.; Gahlot, P.; Demir, H. 8Ds method of problem solving within automotive industry: Tools used and comparison with DMAIC. Mater. Today Proc. 2022, 65, 3266–3272. [Google Scholar] [CrossRef]
- Realyvásquez-Vargas, A.; Arredondo-Soto, K.; García-Alcaraz, J.; Jimenez, E. Improving a Manufacturing Process Using the 8Ds Method. A Case Study in a Manufacturing Company. Appl. Sci. 2020, 10, 2433. [Google Scholar] [CrossRef]
- Chai, H.; Phung, B.; Mitchell, S. Application of UHF Sensors in Power System Equipment for Partial Discharge Detection: A Review. Sensors 2019, 19, 1029. [Google Scholar] [CrossRef]
- Diab, M.; Zhou, W.; Emersic, C.; Yuan, X. Impact of PWM Voltage Waveforms on Magnet Wire Insulation Partial Discharge in SiC-Based Motor Drives. IEEE Access 2021, 9, 156599–156612. [Google Scholar] [CrossRef]
- Agnes, W. Railway transport sustainability with automated hipot failure detection. In Proceedings of the 5th International Conference on Road and Rail Infrastructure, Zadar, Croatia, 17–19 May 2018. [Google Scholar]
- Ghani, S.; Bakar, N.; Chairul, I.; Ahmad, M.; Hakimah, N. Effects of Moisture Content and Temperature on the Dielectric Strength of Transformer Insulating Oil. J. Adv. Res. Fluid Mech. Therm. Sci. 2019, 63, 107–116. [Google Scholar]
- Nageshwar, R.; Mallikarjunappa, K.; Sundara, J.; Ramachandra, B.; Sudhindra, A. Assesment of stator winding insulation. Part 1—Review of Deterioration Mechanisms and Condition Monitoring Techniques. Power Res. J. CPRI 2010, 6, 61–76. [Google Scholar]
- Ferras, F.; Francelin, R.; Sundara, J.; Sheng, H. Machine Learning for the Detection and Diagnosis of Anomalies in Applications Driven by Electric Motors. Sensors 2023, 23, 9725. [Google Scholar] [PubMed]
- Jahromi, A. Review of Field Acceptance Hipot & PD Testing of Medium Voltage Underground Cables. In Proceedings of the 2017 IEEE Electrical Insulation Conference (EIC), Baltimore, MD, USA, 11–14 June 2017; pp. 241–244. [Google Scholar] [CrossRef]
- Saiful, M.F.C.; Tjahjono, N.; Fatma, C. Peningkatan Grade Kain Sarung dengan Mengurangi Cacat Menggunakan Metode Kaizen dan Siklus PDCA pada PT. X. Widya Tek. 2018, 26, 222–231. [Google Scholar] [CrossRef]
- Kurniawan, H.S.E.; Merjani, A. Peningkatan Kualitas Produksi Untuk Mengurangi Unit Cacat Insufficient Epoxy Dengan Metode Pdca Di Area Die Attach (studi kasus di pt. unisem). Profisiensi 2017, 5, 44–50. [Google Scholar] [CrossRef]
- Realyvásquez-Vargas, A.; Arredondo-Soto, K.; Carrillo-Gutiérrez, T.; Ravelo, G. Applying the Plan-Do-Check-Act (PDCA) Cycle to Reduce the Defects in the Manufacturing Industry. A Case Study. Appl. Sci. 2018, 8, 2181. [Google Scholar] [CrossRef]
- Hernández, C.; Da-Silva, F. Application of Statistical Process Control (SPC) in its Quality control. Tecnol. Quím. 2016, 36, 104–116. [Google Scholar]


| PDCA Quick Response | |
|---|---|
| Problem description by customer/location of the problem: During hipot testing, armatures fail due to cable contact with laminations when windings are introduced. This creates continuity between the cable and metal part. | |
| What is the problem? > Use 5W + 2H to determine the current situation (C/S). | |
| Customer view | |
| |
| Company View | |
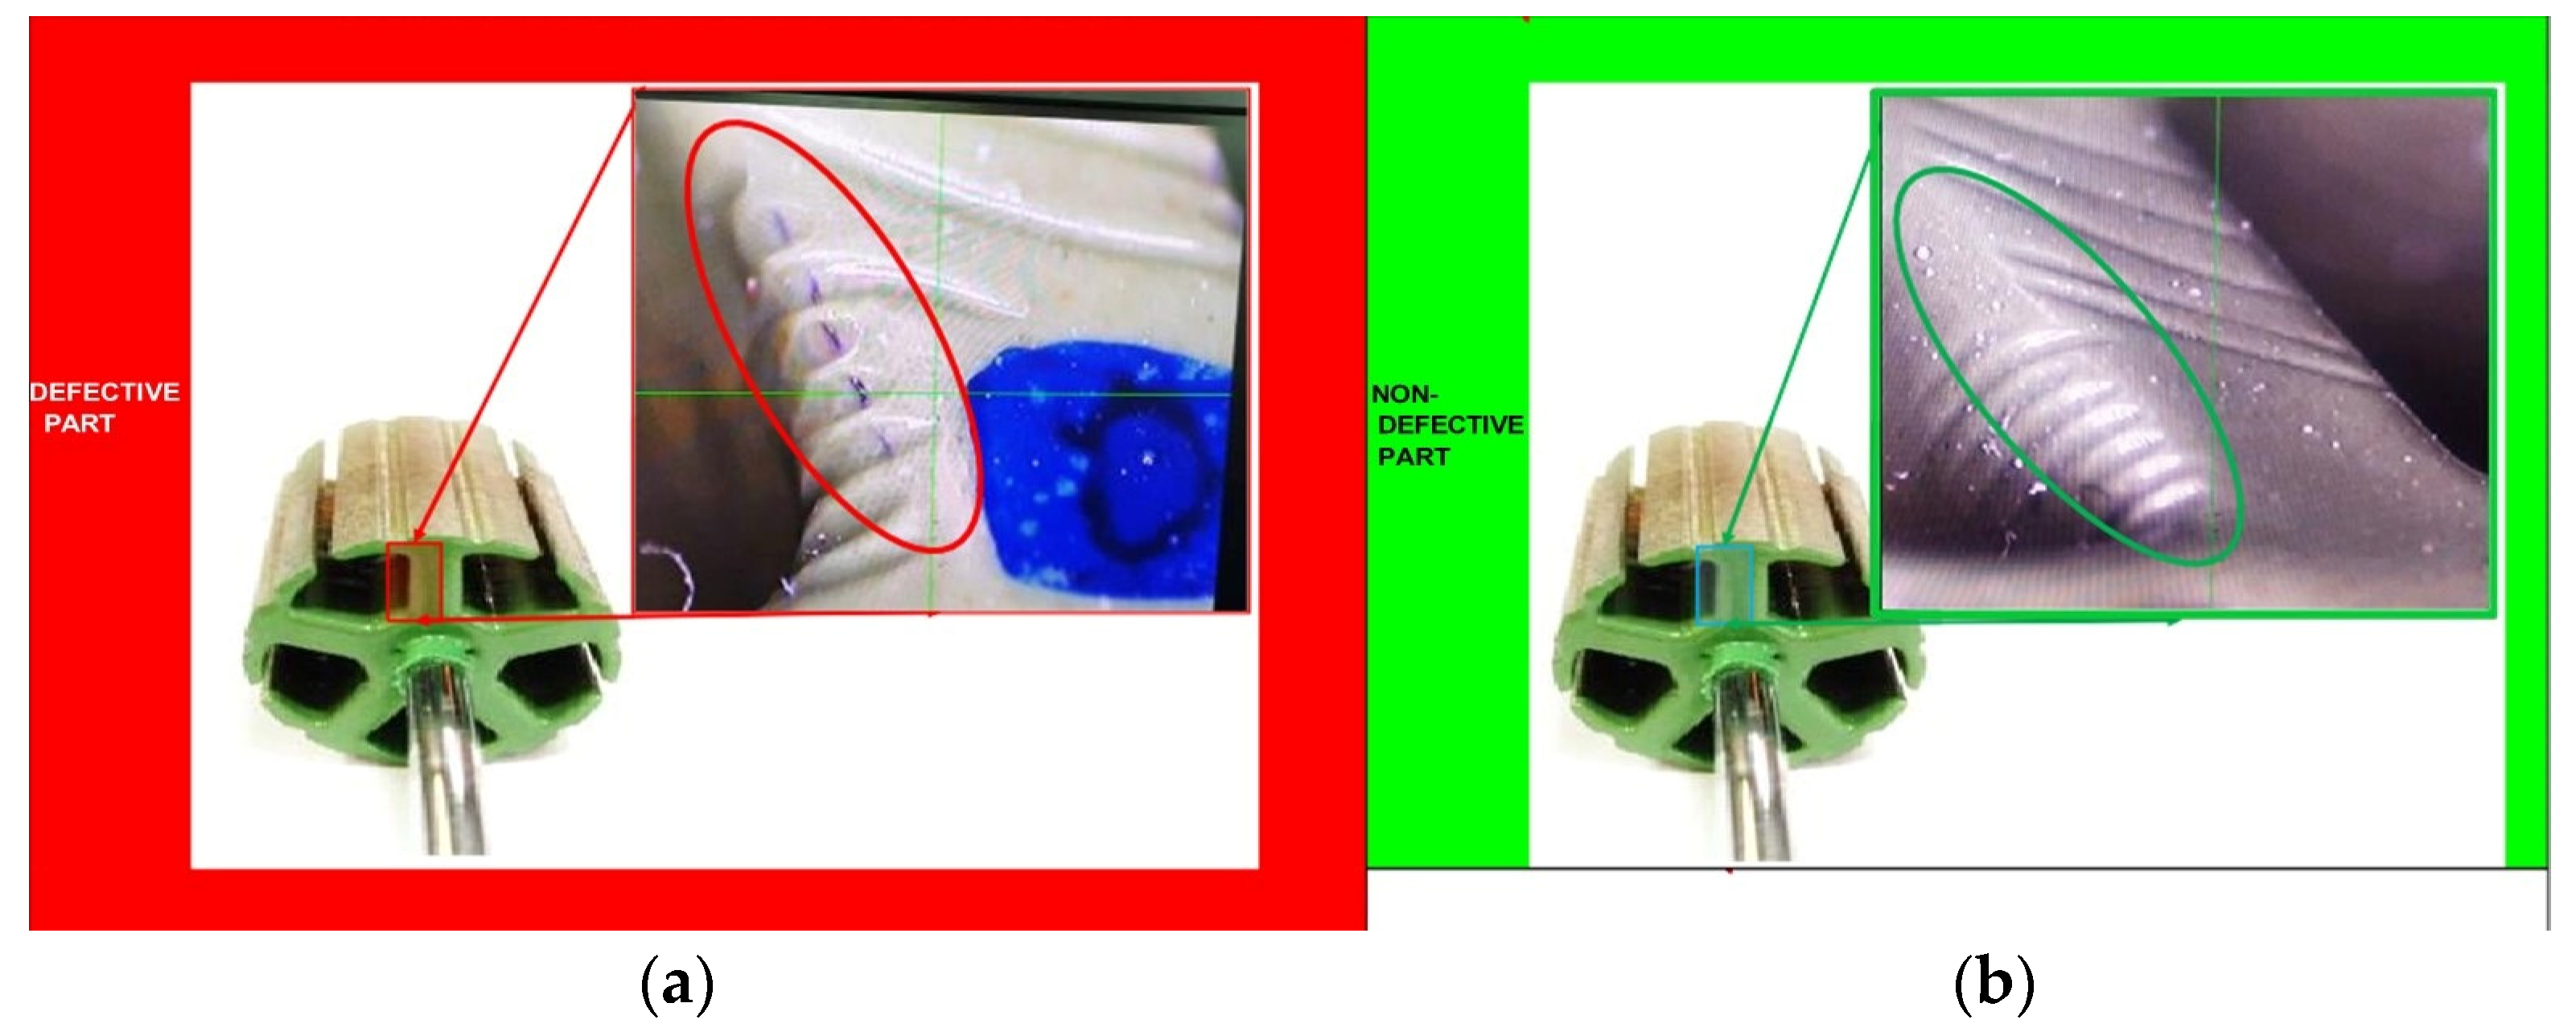
Non-defective part: Successfully completes the hipot test without triggering any alarms. The cable does not come into contact with the laminations during the test. Defective part: Fails hipot test, triggering an alarm. The cable makes contact with the laminations during the test, leading to failure indication. | |
| |
| Issue Description: |
| The production line for the armature subassembly came to a halt due to failures in the hi-pot tests. |
| Details: During the specific process of checking armature resistance and varistor function and conducting a hipot test, the machine triggered the alarm due to a detected defective part, prompting a subsequent investigation. |
| The high-potential tester’s alarm blared, alerting operators of a part that failed the crucial insulation test. |
| Why? |
| The high-potential test detected unintended leakage current, indicating a direct electrical path between the armature cable and the laminated core. |
| Why? |
| The stress event compromised the epoxy coating, leading to a breach in cable insulation and contact with the lamination. |
| Why? |
| Non-uniform coating distribution during the manufacturing process resulted in a significant decrease in epoxy thickness on the lamination walls. |
| ROOT CAUSE |
| Non-uniform coating distribution during the manufacturing process led to a significant decrease in epoxy thickness on the lamination walls. |
| Detection |
| Why? |
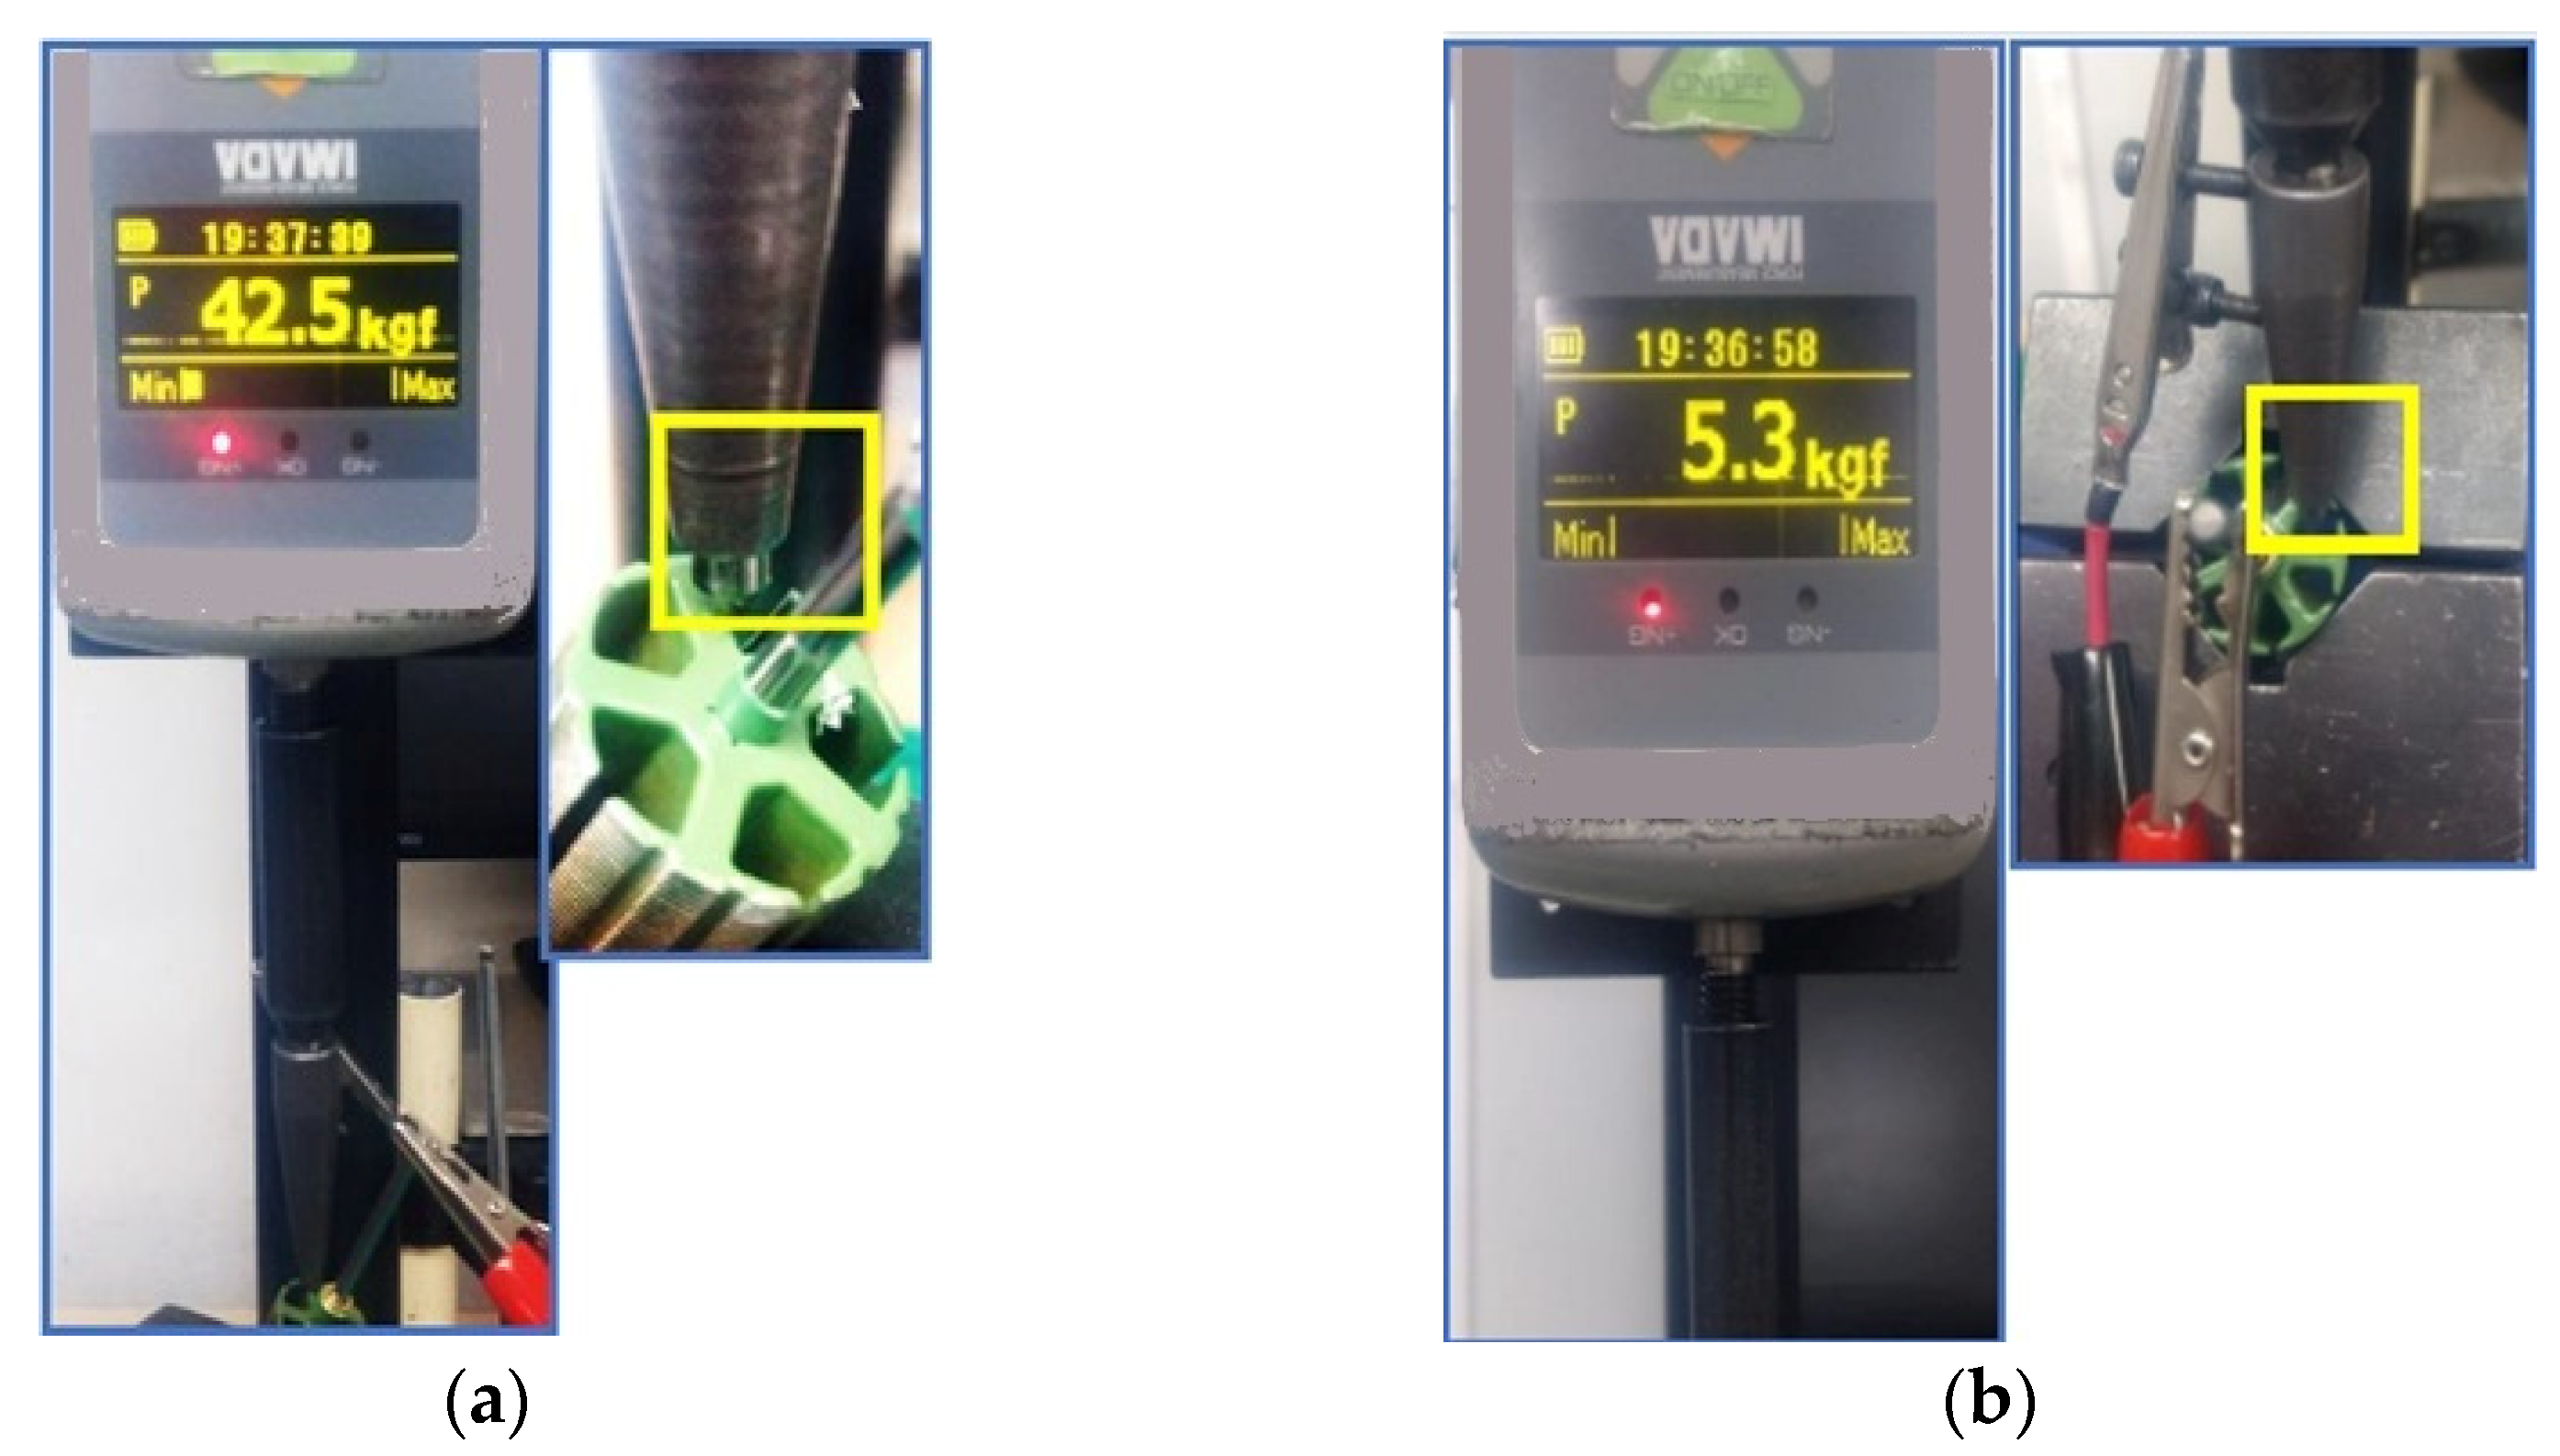
| The tester measured a detachment force (the resistance to peeling), falling within the acceptable range with a minimum value of 58.8399 N (6 kgf). |
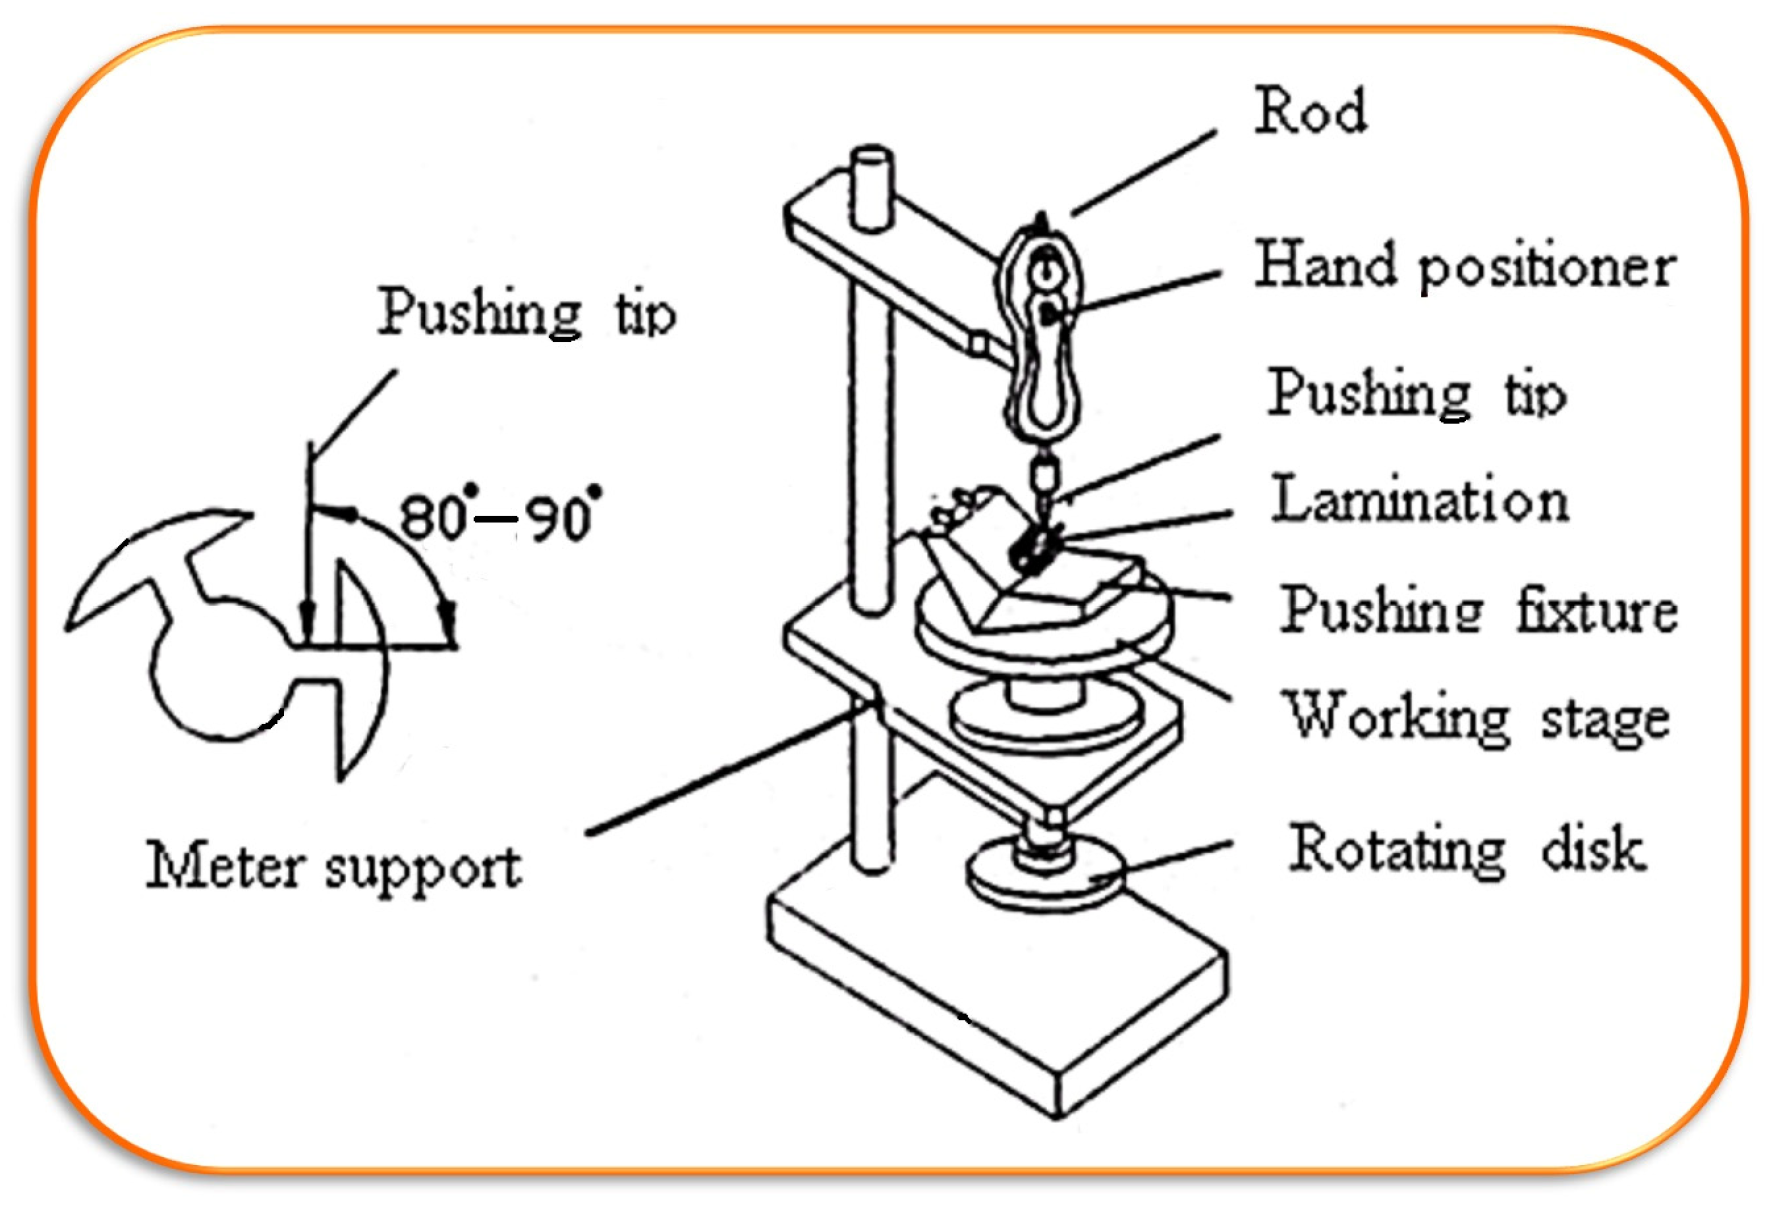
| Why? |
| For the adhesion test, the armature sample must be tilted to an angle between 80° and 90° from the vertical to simulate the stress conditions experienced by the cable during winding. |
| ROOT CAUSE |
| For the adhesion test, the armature sample must be tilted to an angle between 80° and 90° from the vertical to simulate the stress conditions experienced by the cable during winding. |
| Systemic |
| Why? |
| This failure mode was not identified as a potential risk in the PFMEA or addressed in the control plan. |
| ROOT CAUSE |
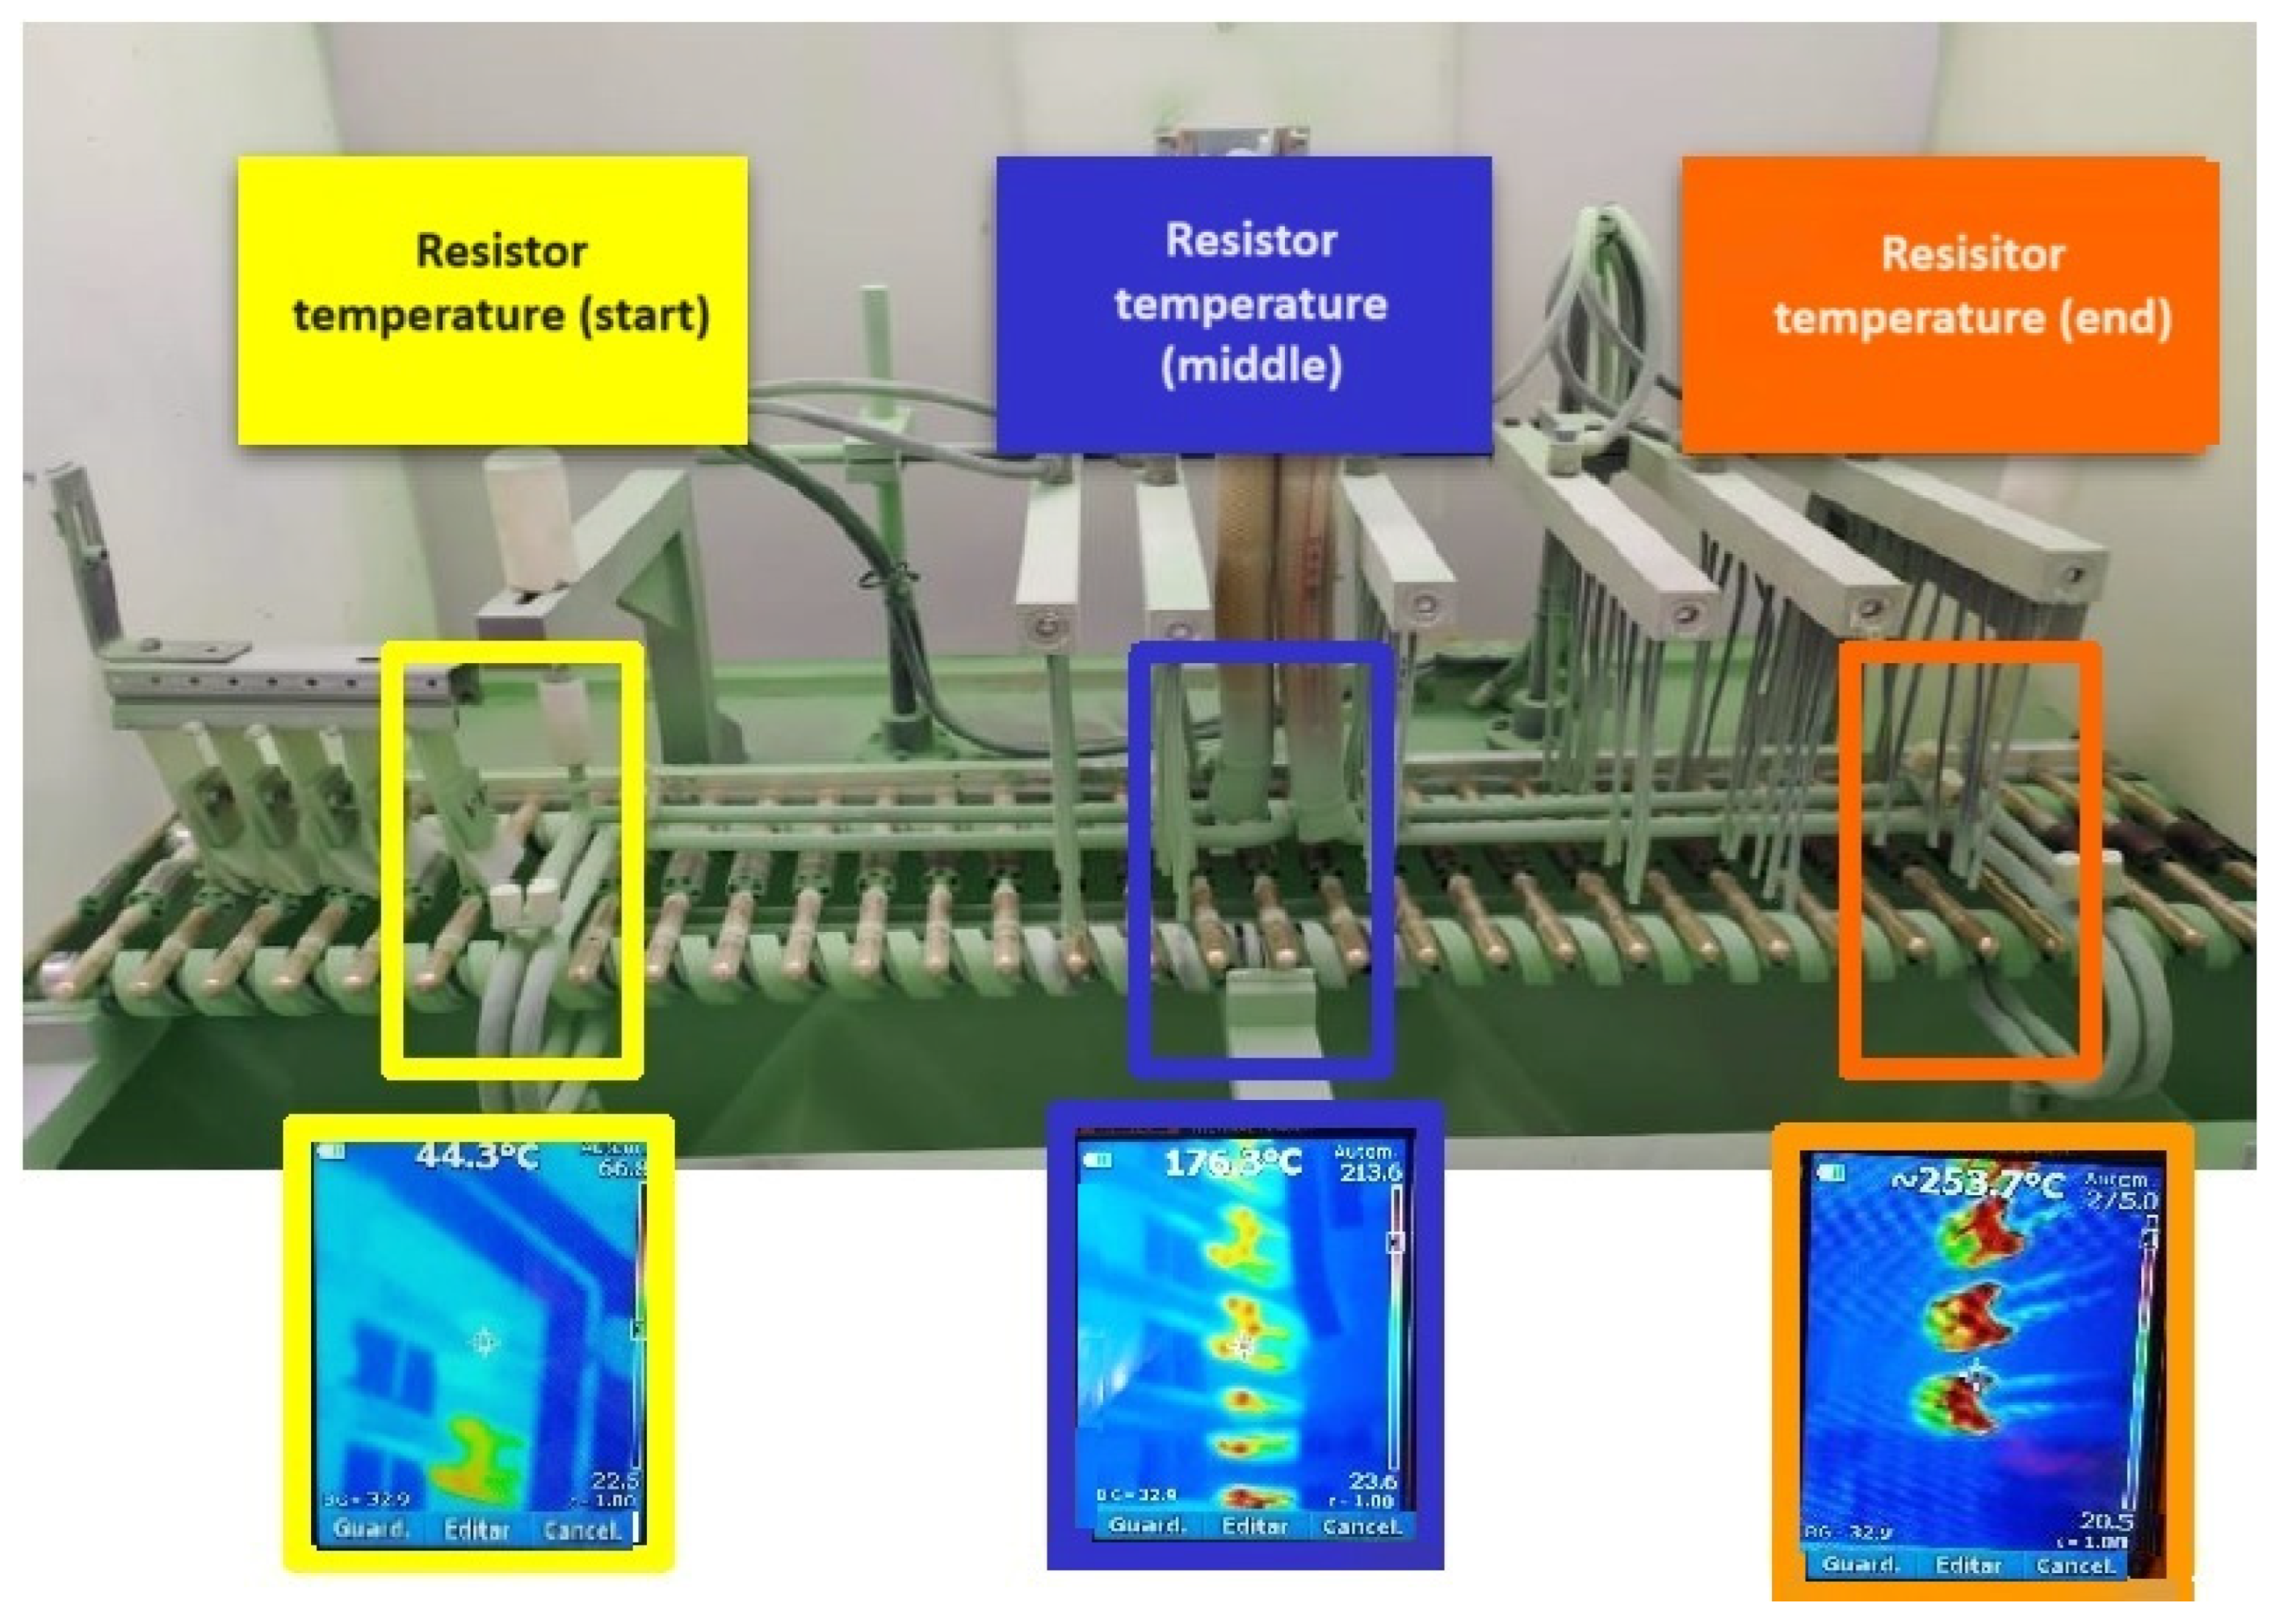
| Transfer Time | Laminating and Degreasing | ||||||||||
| Parameter | Worm Gear Velocity | Voltage Across Heating Resistor | Resistor Temperature (Start) | Resistor Temperature (Middle) | Resistor Temperature (End) | Air Pressure | |||||
| Units | rpm | kV | °C | °C | °C | kPa | |||||
| Max | 15 | 2.7 | 33 | 129 | 202 | 0.55 | |||||
| Min | 14.63 | 2.7 | 30 | 112 | 166 | 0.55 | |||||
| Average | 14.68 | 2.7 | 32.14 | 123 | 187 | 0.55 | |||||
| Epoxy addition | |||||||||||
| Parameter | Coat 1 Pressure | Coat 2 Pressure | Feeder Pressure | Vacuum Pressure | Guide Rail 1 Distance | Guide Rail 2 Distance | Electrostatic Box | ||||
| Units | kPa | kPa | kPa | °C | mm | mm | kV | ||||
| Max | 0.1 | 0.1 | 0.16 | 0.1 | 3.5 | 2 | 61 | ||||
| Min | 0.06 | 0.06 | 0.14 | 0.1 | 3.5 | 2 | 61 | ||||
| Average | 0.08 | 0.08 | 0.151 | 0.1 | 3.5 | 2 | 61 | ||||
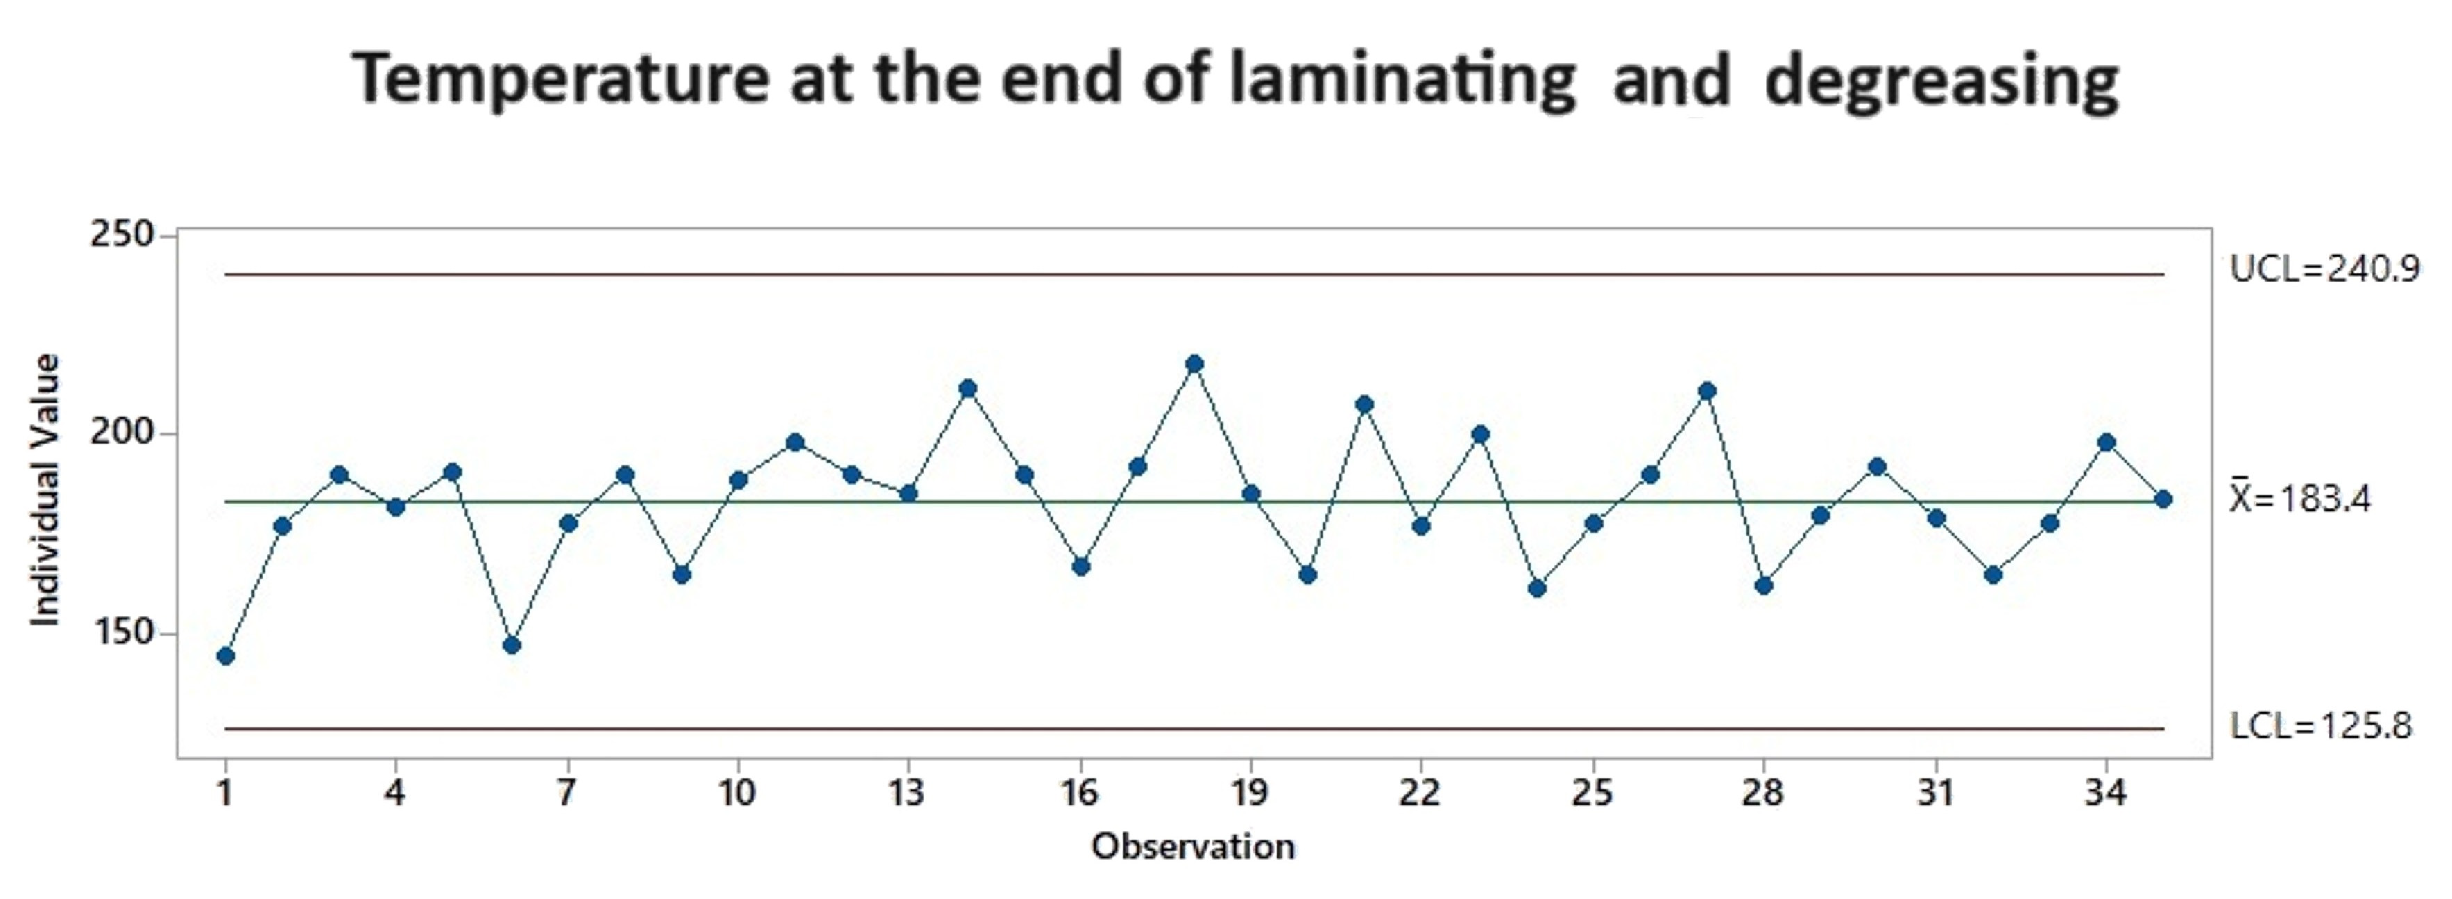
| Epoxy Addition | Epoxy Curing | ||||||||||
| Parameter | Water Pressure | Voltage Across Heating Resistor | Resistor Temperature (Start) | Resistor Temperature (Middle) | Resistor Temperature (End) | ||||||
| Units | kPa | kV | °C | °C | °C | ||||||
| Max | 0.4 | 3 | 39 | 212 | 272 | ||||||
| Min | 0.4 | 3 | 37 | 163 | 264 | ||||||
| Average | 0.4 | 3 | 38.28 | 192.14 | 271.42 | ||||||
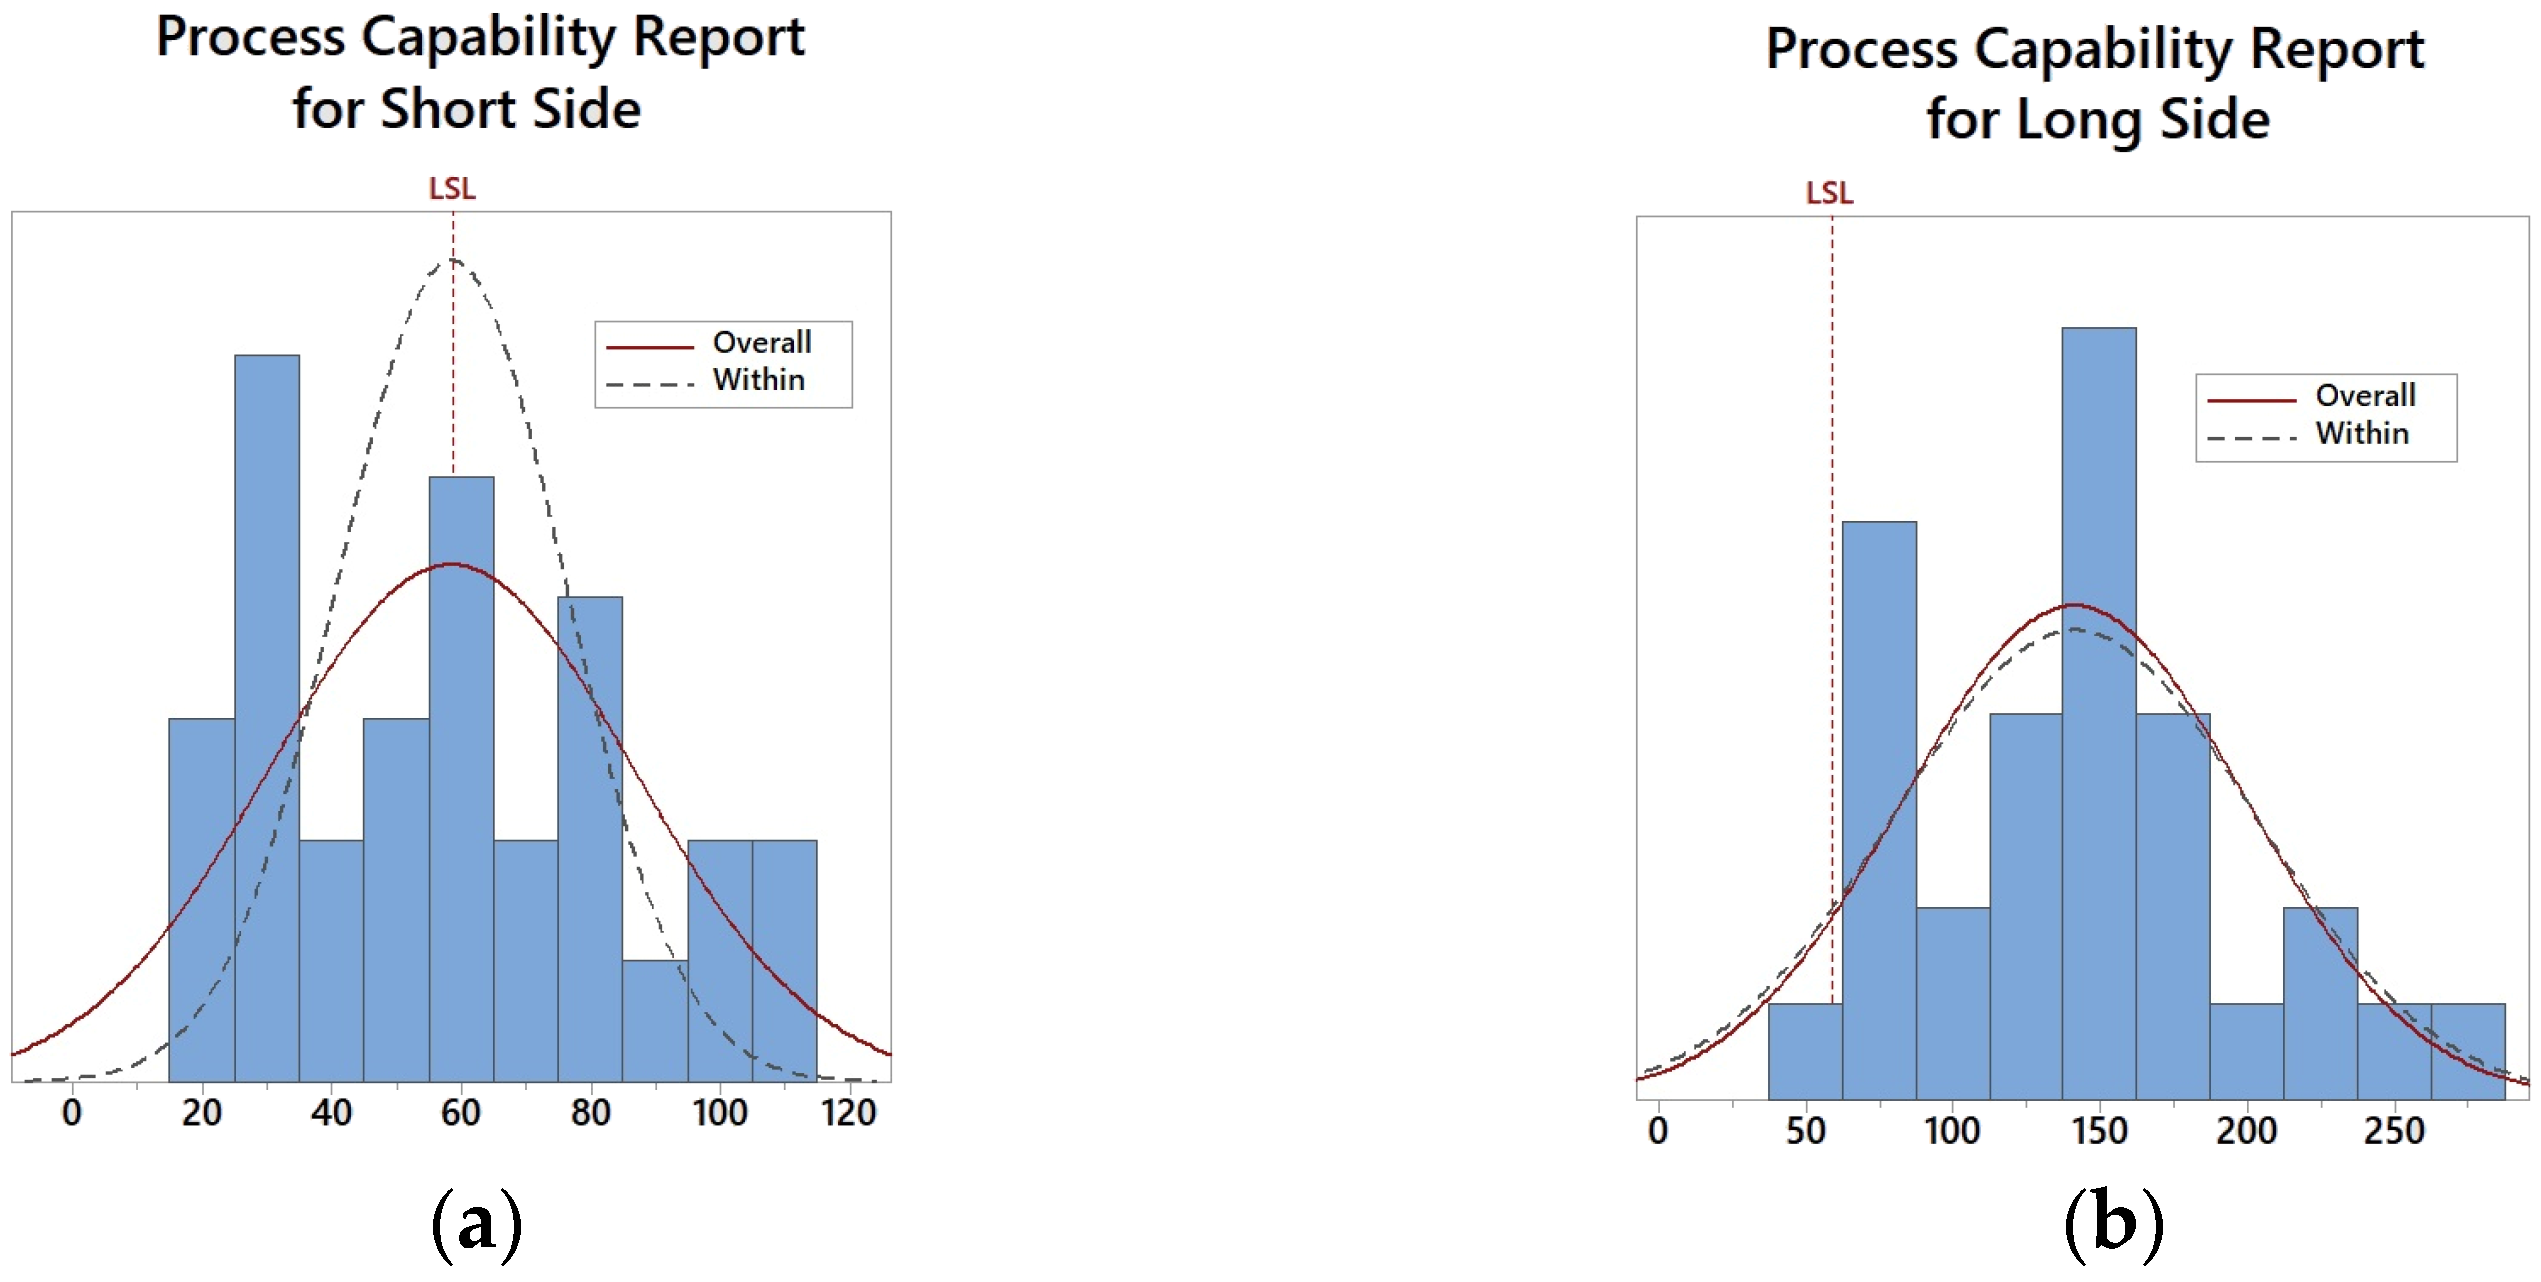
| Short-Side Armature | |||||
|---|---|---|---|---|---|
| Process Data: | Overall Capability | Potential (Within) Capability | |||
| LSL (lower specification limit) | 100 | Pp | 2.63 | Cp | 28.41 |
| UPL (upper specification limit) | 500 | PPL | 1.92 | CPL | 20.70 |
| Sample mean | 245.714 | PPU | 3.34 | CPU | 36.12 |
| Sample N | 35 | Ppk | 1.92 | Cpk | 20.70 |
| Overall StDev (standard deviation) | 25.3546 | ||||
| StDev (within) | 2.34668 | ||||
| Performance: | |||||
| Observed | Expected Overall | Expected Within | |||
| PPM < LSL | 0 | 0 | 0 | ||
| PPM > USL | 0 | 0 | 0 | ||
| PPM total | 0 | 0 | 0 | ||
| Long-Side Armature | |||||
| Process data: | Overall Capability | Potential (Within) Capability | |||
| LSL (lower specification limit) | 100 | Pp | 3.76 | Cp | 25.57 |
| UPL (upper specification limit) | 500 | PPL | 2.68 | CPL | 18.26 |
| Sample mean | 242.857 | PPU | 4.83 | CPU | 32.87 |
| Sample N | 35 | Ppk | 2.68 | Cpk | 18.26 |
| Overall StDev (standard deviation) | 17.7518 | ||||
| StDev (within) | 2.60743 | ||||
| Performance: | |||||
| Observed | Expected Overall | Expected Within | |||
| PPM < LSL | 0 | 0 | 0 | ||
| PPM > USL | 0 | 0 | 0 | ||
| PPM total | 0 | 0 | 0 | ||
| Process Data: | Overall Capability | |||||
|---|---|---|---|---|---|---|
| Short-Side Armature | Long-Side Armature | Short-Side Armature | Long-Side Armature | |||
| LSL | 58.8399 | 58.8399 | PPL | 0.37 | 1.07 | |
| Sample mean | 96.0496 | 134.436 | Ppk | 0.37 | 1.07 | |
| Sample N | 35 | 35 | Potential (within) capability | |||
| Overall StDev | 33.3546 | 23.6373 | CPL | 0.69 | 1.05 | |
| StDev (within) | 17.9247 | 23.9849 | Cpk | 0.69 | 1.05 | |
| Performance: | ||||||
| Observed | Expected Overall | Expected Within | ||||
| Short-Side Armature | Long-Side Armature | Short-Side Armature | Long-Side Armature | Short-Side Armature | Long-Side Armature | |
| PPM < LSL | 0 | 0 | 132,301.04 | 691.52 | 18,952.24 | 811.29 |
| Total PPM | 0 | 0 | 132,301.04 | 691.52 | 18,952.24 | 811.29 |
| (a) | (b) | ||||||||
|---|---|---|---|---|---|---|---|---|---|
| N | Mean | StDev | SE Mean | N | Mean | StDev | SE Mean | ||
| C9 | 35 | 96.0 | 33.4 | 5.6 | C10 | 35 | 134.4 | 23.6 | 4.0 |
| C11 | 30 | 58.5 | 28.0 | 5.1 | C12 | 30 | 141.3 | 58.4 | 11 |
| C9 = Data before 1st experiment | C10 = Data before 1st experiment | ||||||||
| C11 = Data after 1st experiment | C12 = Data after 1st experiment | ||||||||
| Difference = µ (C9)—µ (C11) | Difference = µ (C10)—µ (C12) | ||||||||
| Estimate for difference: 37.54 | Estimate for difference: −6.9 | ||||||||
| 95% CI for difference: (22.31, 52.76) | 95% CI for difference: (−30.0, 16.2) | ||||||||
| T-Test of difference = 0 (vs ≠) | T-Test of difference = 0 (vs ≠) | ||||||||
| T-Value = 4.93 | T-Value = −0.61 | ||||||||
| p-Value = 0.000 DF = 62 | p-Value = 0.548 DF = 37 | ||||||||
| Process Data: | Overall Capability | |||||
|---|---|---|---|---|---|---|
| Short-Side Armature | Long-Side Armature | Short-Side Armature | Long-Side Armature | |||
| LSL | 58.8399 | 58.8399 | PPL | 0 | 0.47 | |
| Sample mean | 58.5133 | 141.347 | Ppk | 0 | 0.47 | |
| Sample N | 30 | 30 | Potential (within) capability | |||
| Overall StDev | 28.0494 | 58.3937 | CPL | −0.01 | 0.45 | |
| StDev (within) | 17.6576 | 61.4867 | Cpk | −0.01 | 0.45 | |
| Performance: | ||||||
| Observed | Expected Overall | Expected Within | ||||
| Short-Side Armature | Long-Side Armature | Short-Side Armature | Long-Side Armature | Short-Side Armature | Long-Side Armature | |
| PPM < LSL | 500,000 | 33,333.33 | 504,644.93 | 78,835.22 | 507,378.31 | 89,818.74 |
| PPM total | 500,000 | 33,333.33 | 504,644.93 | 78,835.22 | 507,378.31 | 89,818.74 |
| (a) | (b) | ||||||||
|---|---|---|---|---|---|---|---|---|---|
| N | Mean | StDev | SE Mean | N | Mean | StDev | SE Mean | ||
| C3 | 30 | 58.5 | 28.0 | 5.1 | C4 | 30 | 141.3 | 58.4 | 11 |
| C5 | 30 | 61.3 | 15.5 | 2.8 | C6 | 30 | 114.4 | 27.0 | 4.9 |
| C3 = Data before 2nd experiment | C4 = Data before 2nd experiment | ||||||||
| C5 = Data after 2nd experiment | C6 = Data after 2nd experiment | ||||||||
| Difference = µ (C3)—µ (C5) | Difference = µ (C4)—µ (C6) | ||||||||
| Estimate for difference: −2.75 | Estimate for difference: 26.9 | ||||||||
| 95% CI for difference: (−14.53, 9.04) | 95% CI for difference: (3.2, 50.7) | ||||||||
| T-Test of difference = 0 (vs ≠) | T-Test of difference = 0 (vs ≠) | ||||||||
| T-Value = −0.47 | T-Value = 2.29 | ||||||||
| p-Value = 0.641 DF = 45 | p-Value = 0.027 DF = 40 | ||||||||
| Process Data: | Overall Capability | |||||
|---|---|---|---|---|---|---|
| Short-Side Armature | Long-Side Armature | Short-Side Armature | Long-Side Armature | |||
| LSL | 58.8399 | 58.8399 | PPL | 0.05 | 0.69 | |
| Sample mean | 61.2592 | 114.412 | Ppk | 0.05 | 0.69 | |
| Sample N | 30 | 30 | Potential (within) capability | |||
| Overall StDev | 15.5159 | 26.9718 | CPL | 0.05 | 0.67 | |
| StDev (within) | 15.2593 | 27.5506 | Cpk | 0.05 | 0.67 | |
| Performance: | ||||||
| Observed | Expected Overall | Expected within | ||||
| Short-Side Armature | Long-Side Armature | Short-Side Armature | Long-Side Armature | Short-Side Armature | Long-Side Armature | |
| PPM < LSL | 500,000 | 33,333.33 | 43,8046.75 | 19,681.94 | 437,013.53 | 21,843.95 |
| PPM total | 500,000 | 33,333.33 | 43,8046.75 | 19,681.94 | 437,013.53 | 21,843.95 |
| (a) | (b) | ||||||||
|---|---|---|---|---|---|---|---|---|---|
| N | Mean | StDev | SE Mean | N | Mean | StDev | SE Mean | ||
| C5 | 30 | 61.3 | 15.5 | 2.8 | C6 | 30 | 114.4 | 27.0 | 4.9 |
| C7 | 27 | 291.4 | 73.3 | 14 | C8 | 27 | 105.2 | 23.1 | 4.5 |
| C5 = Data before 3rd experiment | C6 = Data before 3rd experiment | ||||||||
| C7 = Data after 3rd experiment | C8 = Data after 3rd experiment | ||||||||
| Difference = µ (C5)—µ (C7) | Difference = µ (C6)—µ (C8) | ||||||||
| Estimate for difference: −230.2 | Estimate for difference: 9.23 | ||||||||
| 95% CI for difference: (−259.7, −200.7) | 95% CI for difference: (−4.09, 22.54) | ||||||||
| T-Test of difference = 0 (vs ≠) | T-Test of difference = 0 (vs ≠) | ||||||||
| T-Value = −16.00 | T-Value = 1.39 | ||||||||
| p-Value = 0.000 DF = 28 | p-Value = 0.170 DF = 54 | ||||||||
| Process Data: | Overall Capability | |||||
|---|---|---|---|---|---|---|
| Short-Side Armature | Long-Side Armature | Short-Side Armature | Long-Side Armature | |||
| LSL | 58.8399 | 58.8399 | PPL | 1.06 | 0.67 | |
| Sample mean | 291.441 | 105.186 | Ppk | 1.06 | 0.67 | |
| Sample N | 27 | 27 | Potential (within) capability | |||
| Overall StDev | 73.2918 | 23.1488 | CPL | 1.26 | 0.65 | |
| StDev (within) | 61.6931 | 23.741 | Cpk | 1.26 | 0.65 | |
| Performance: | ||||||
| Observed | Expected Overall | Expected Within | ||||
| Short-Side Armature | Long-Side Armature | Short-Side Armature | Long-Side Armature | Short-Side Armature | Long-Side Armature | |
| PPM < LSL | 0 | 0 | 752.74 | 22,637.33 | 81.53 | 25,460.03 |
| Total PPM | 0 | 0 | 752.74 | 22,637.33 | 81.53 | 25,460.03 |
Disclaimer/Publisher’s Note: The statements, opinions and data contained in all publications are solely those of the individual author(s) and contributor(s) and not of MDPI and/or the editor(s). MDPI and/or the editor(s) disclaim responsibility for any injury to people or property resulting from any ideas, methods, instructions or products referred to in the content. |
© 2024 by the authors. Licensee MDPI, Basel, Switzerland. This article is an open access article distributed under the terms and conditions of the Creative Commons Attribution (CC BY) license (https://creativecommons.org/licenses/by/4.0/).
Share and Cite
Rangel-Sánchez, M.-Á.; Urbina-González, J.-D.-J.; Carrera-Escobedo, J.-L.; Guirette-Barbosa, O.-A.; Murillo-Rodríguez, V.-A.; Celaya-Padilla, J.-M.; Durán-Muñoz, H.-A.; Cruz-Domínguez, O. Enhancing Scrap Reduction in Electric Motor Manufacturing for the Automotive Industry: A Case Study Using the PDCA (Plan–Do–Check–Act) Approach. Appl. Sci. 2024, 14, 2999. https://doi.org/10.3390/app14072999
Rangel-Sánchez M-Á, Urbina-González J-D-J, Carrera-Escobedo J-L, Guirette-Barbosa O-A, Murillo-Rodríguez V-A, Celaya-Padilla J-M, Durán-Muñoz H-A, Cruz-Domínguez O. Enhancing Scrap Reduction in Electric Motor Manufacturing for the Automotive Industry: A Case Study Using the PDCA (Plan–Do–Check–Act) Approach. Applied Sciences. 2024; 14(7):2999. https://doi.org/10.3390/app14072999
Chicago/Turabian StyleRangel-Sánchez, Miguel-Ángel, José-De-Jesús Urbina-González, José-Luis Carrera-Escobedo, Omar-Alejandro Guirette-Barbosa, Virgilio-Alfonso Murillo-Rodríguez, José-María Celaya-Padilla, Héctor-Antonio Durán-Muñoz, and Oscar Cruz-Domínguez. 2024. "Enhancing Scrap Reduction in Electric Motor Manufacturing for the Automotive Industry: A Case Study Using the PDCA (Plan–Do–Check–Act) Approach" Applied Sciences 14, no. 7: 2999. https://doi.org/10.3390/app14072999
APA StyleRangel-Sánchez, M.-Á., Urbina-González, J.-D.-J., Carrera-Escobedo, J.-L., Guirette-Barbosa, O.-A., Murillo-Rodríguez, V.-A., Celaya-Padilla, J.-M., Durán-Muñoz, H.-A., & Cruz-Domínguez, O. (2024). Enhancing Scrap Reduction in Electric Motor Manufacturing for the Automotive Industry: A Case Study Using the PDCA (Plan–Do–Check–Act) Approach. Applied Sciences, 14(7), 2999. https://doi.org/10.3390/app14072999