Article

Experimental Study on Flexural Resistance of UHPC Wet Joint Precast Reinforced Concrete Bridge Deck Slabs with Variable Cross-Section

School of Civil Engineering, Fuzhou University, Fuzhou 350108, China
*
Author to whom correspondence should be addressed.
Appl. Sci. 2024, 14(7), 3028; https://doi.org/10.3390/app14073028
Submission received: 7 March 2024 / Revised: 28 March 2024 / Accepted: 29 March 2024 / Published: 4 April 2024
(This article belongs to the Special Issue Bridge Structural Analysis)

Abstract

:
With the convenient and fast requirements for construction in bridge engineering, prefabricated assembly technology is widely applied in engineering construction. Typically, prefabricated bridge decks are connected through cast-in-place wet joints. Wet joints, as the primary load-bearing parts of bridge decks, undergo complex stress and are prone to cracking and damage. Particularly in the negative bending moment region of bridges, the influence of tensile stress on wet joints is more severe, thus enhancing the mechanical performance and crack resistance of joints becomes crucial. This paper investigates the mechanical behavior of prefabricated reinforced concrete bridge deck panels with variable cross-sections under negative bending moments, focusing on the performance of Ultra High-Performance Concrete (UHPC) wet joints. Full-scale experimental tests were conducted on a 176 m steel truss composite continuous rigid bridge, employing C50 concrete panels with UHPC wet joints. Results show three distinct stages: elastic, crack initiation and propagation, and failure. The maximum failure load reached 822 kN, with a maximum displacement of 21.64 mm. Concrete strains indicate compressive stress near the wet joint and tensile stress near the loading positions. Cracks primarily develop at the wet joint interface and propagate under increasing load, ultimately leading to flexural–shear failure near the variable cross-section of the wet joint. Numerical simulations using ABAQUS/CAE (2020) corroborate experimental findings, closely matching load-displacement curves and identifying damage locations. The study demonstrates that UHPC wet joints significantly enhance crack resistance, meeting design requirements for improved mechanical performance in bridge structures subjected to negative bending moments.

1. Introduction

With the gradual advancement of bridge engineering, prefabricated assembly technology is widely utilized in civil construction, facilitating standardized, factory-oriented, and modular development in engineering construction. Prefabricated assembly bridge deck panels are increasingly employed in numerous bridge projects. Under negative bending moments, conventional concrete used in the wet joints of prefabricated bridge deck panels often exhibits cracking phenomena. To enhance the crack resistance of prefabricated bridge deck panel wet joints, consideration is given to employing Ultra High-Performance Concrete (UHPC) as the connecting material for wet joints between prefabricated panels. Currently, there is extensive research on this subject.
UHPC, recognized as a novel cementitious material with high strength, toughness, and exceptional durability [1,2,3,4,5,6], has been extensively studied for its mechanical properties concerning wet joints by Perry and Royce [7], demonstrating its significant capability in enhancing the mechanical performance of joints, thus facilitating better load transmission in wet joints. Studies by Carbonell et al. [8] and others have explored the impact of different treatment methods on the bond strength of UHPC-ordinary strength concrete interfaces. Moreover, domestic researchers have found through experiments that U-shaped reinforcement greatly enhances the mechanical performance of wet joints, with varying lap lengths significantly affecting its performance [9,10,11,12]. Studies by Su Qingtian et al. [13] and others have investigated the mechanical properties and crack development of three types of wet joints: welded reinforcement joints, U-shaped reinforcement joints, and arc-shaped reinforcement joints proving the effective mechanical and load transmission mechanisms of wet joints. Cao Sugong et al. [14] and others have examined the influence of different lap forms and lengths of U-shaped reinforcement on wet joints and conducted static tests, demonstrating that in static tensile tests, cracks tend to develop earlier at the construction joints of lateral U-shaped reinforcement, and using welded or increasing lap lengths can reduce the average stress on the reinforcement. Furthermore, research on wet joint construction has been conducted both domestically and internationally, with different construction forms significantly improving the mechanical properties of wet joints [15,16]. Yao and Yan [17] and others analyzed the bending failure modes of wet joints under different construction forms, concluding that the stiffness of the upper and lower strip diamond joint beams is the highest. Shao Xudong et al. [18] analyzed the mechanical properties of different forms of wet joints in bridge deck panels and experimentally demonstrated that densely welded reinforcement on steel slabs significantly improves the crack resistance of wet joints compared to unwelded wet joints on steel slabs. Most of the domestic and foreign research mentioned above mainly focuses on the mechanical properties of bridge deck panels and their wet joints under positive bending moments, with the concrete in the joint area often being high-strength concrete. However, the mechanical properties of bridge deck panels with variable cross-sections and their wet joints under negative bending moments require further investigation.
In addition to Ultra High-Performance Concrete (UHPC), alternative materials such as High Strength Concrete (HSC), Engineered Cementitious Composites (ECC), and cementitious nanocomposites have garnered attention in the realm of bridge engineering. These materials offer unique properties and advantages that contribute to their suitability for various applications. HSC, characterized by its enhanced compressive strength and durability, presents a viable alternative to conventional concrete, particularly in scenarios demanding high load-bearing capacity and resistance to environmental degradation [19]. ECC, on the other hand, distinguishes itself through its superior ductility and strain-hardening behavior, making it well-suited for applications requiring enhanced flexural performance and crack resistance [20]. Additionally, cementitious nanocomposites, leveraging the incorporation of nano-sized particles, exhibit remarkable mechanical properties and improved durability compared to traditional concrete materials. Despite the merits of these alternative materials, UHPC stands out due to its exceptional combination of high strength, toughness, and durability. Specifically, UHPC demonstrates superior crack resistance, attributed to its dense microstructure and advanced composition. Compared to HSC, ECC, and cementitious nanocomposites, UHPC offers enhanced performance in mitigating crack propagation and minimizing the risk of structural failure under adverse loading conditions. Furthermore, UHPC’s ability to achieve higher compressive and tensile strengths, coupled with its reduced permeability and excellent bond strength, reinforces its position as a preferred material for critical infrastructure projects, including bridge construction [8]. Hence, while alternative materials present viable options for specific applications, UHPC emerges as a versatile and superior choice, particularly in demanding structural environments where crack resistance and long-term durability are paramount concerns.
To investigate the overall bending resistance of prefabricated reinforced concrete bridge deck panels with variable cross-sections under negative bending moments in practical bridge structures, this paper conducts full-scale experimental design, analyzing the cracking load, load-displacement curve, and strain curve of prefabricated bridge deck panels and their wet joints in the negative bending moment region. The study aims to obtain the overall bending resistance performance and failure mode of prefabricated bridge deck panels with variable cross-sections, providing technical support for the application of such prefabricated bridge deck panels.

2. Experiment Overview

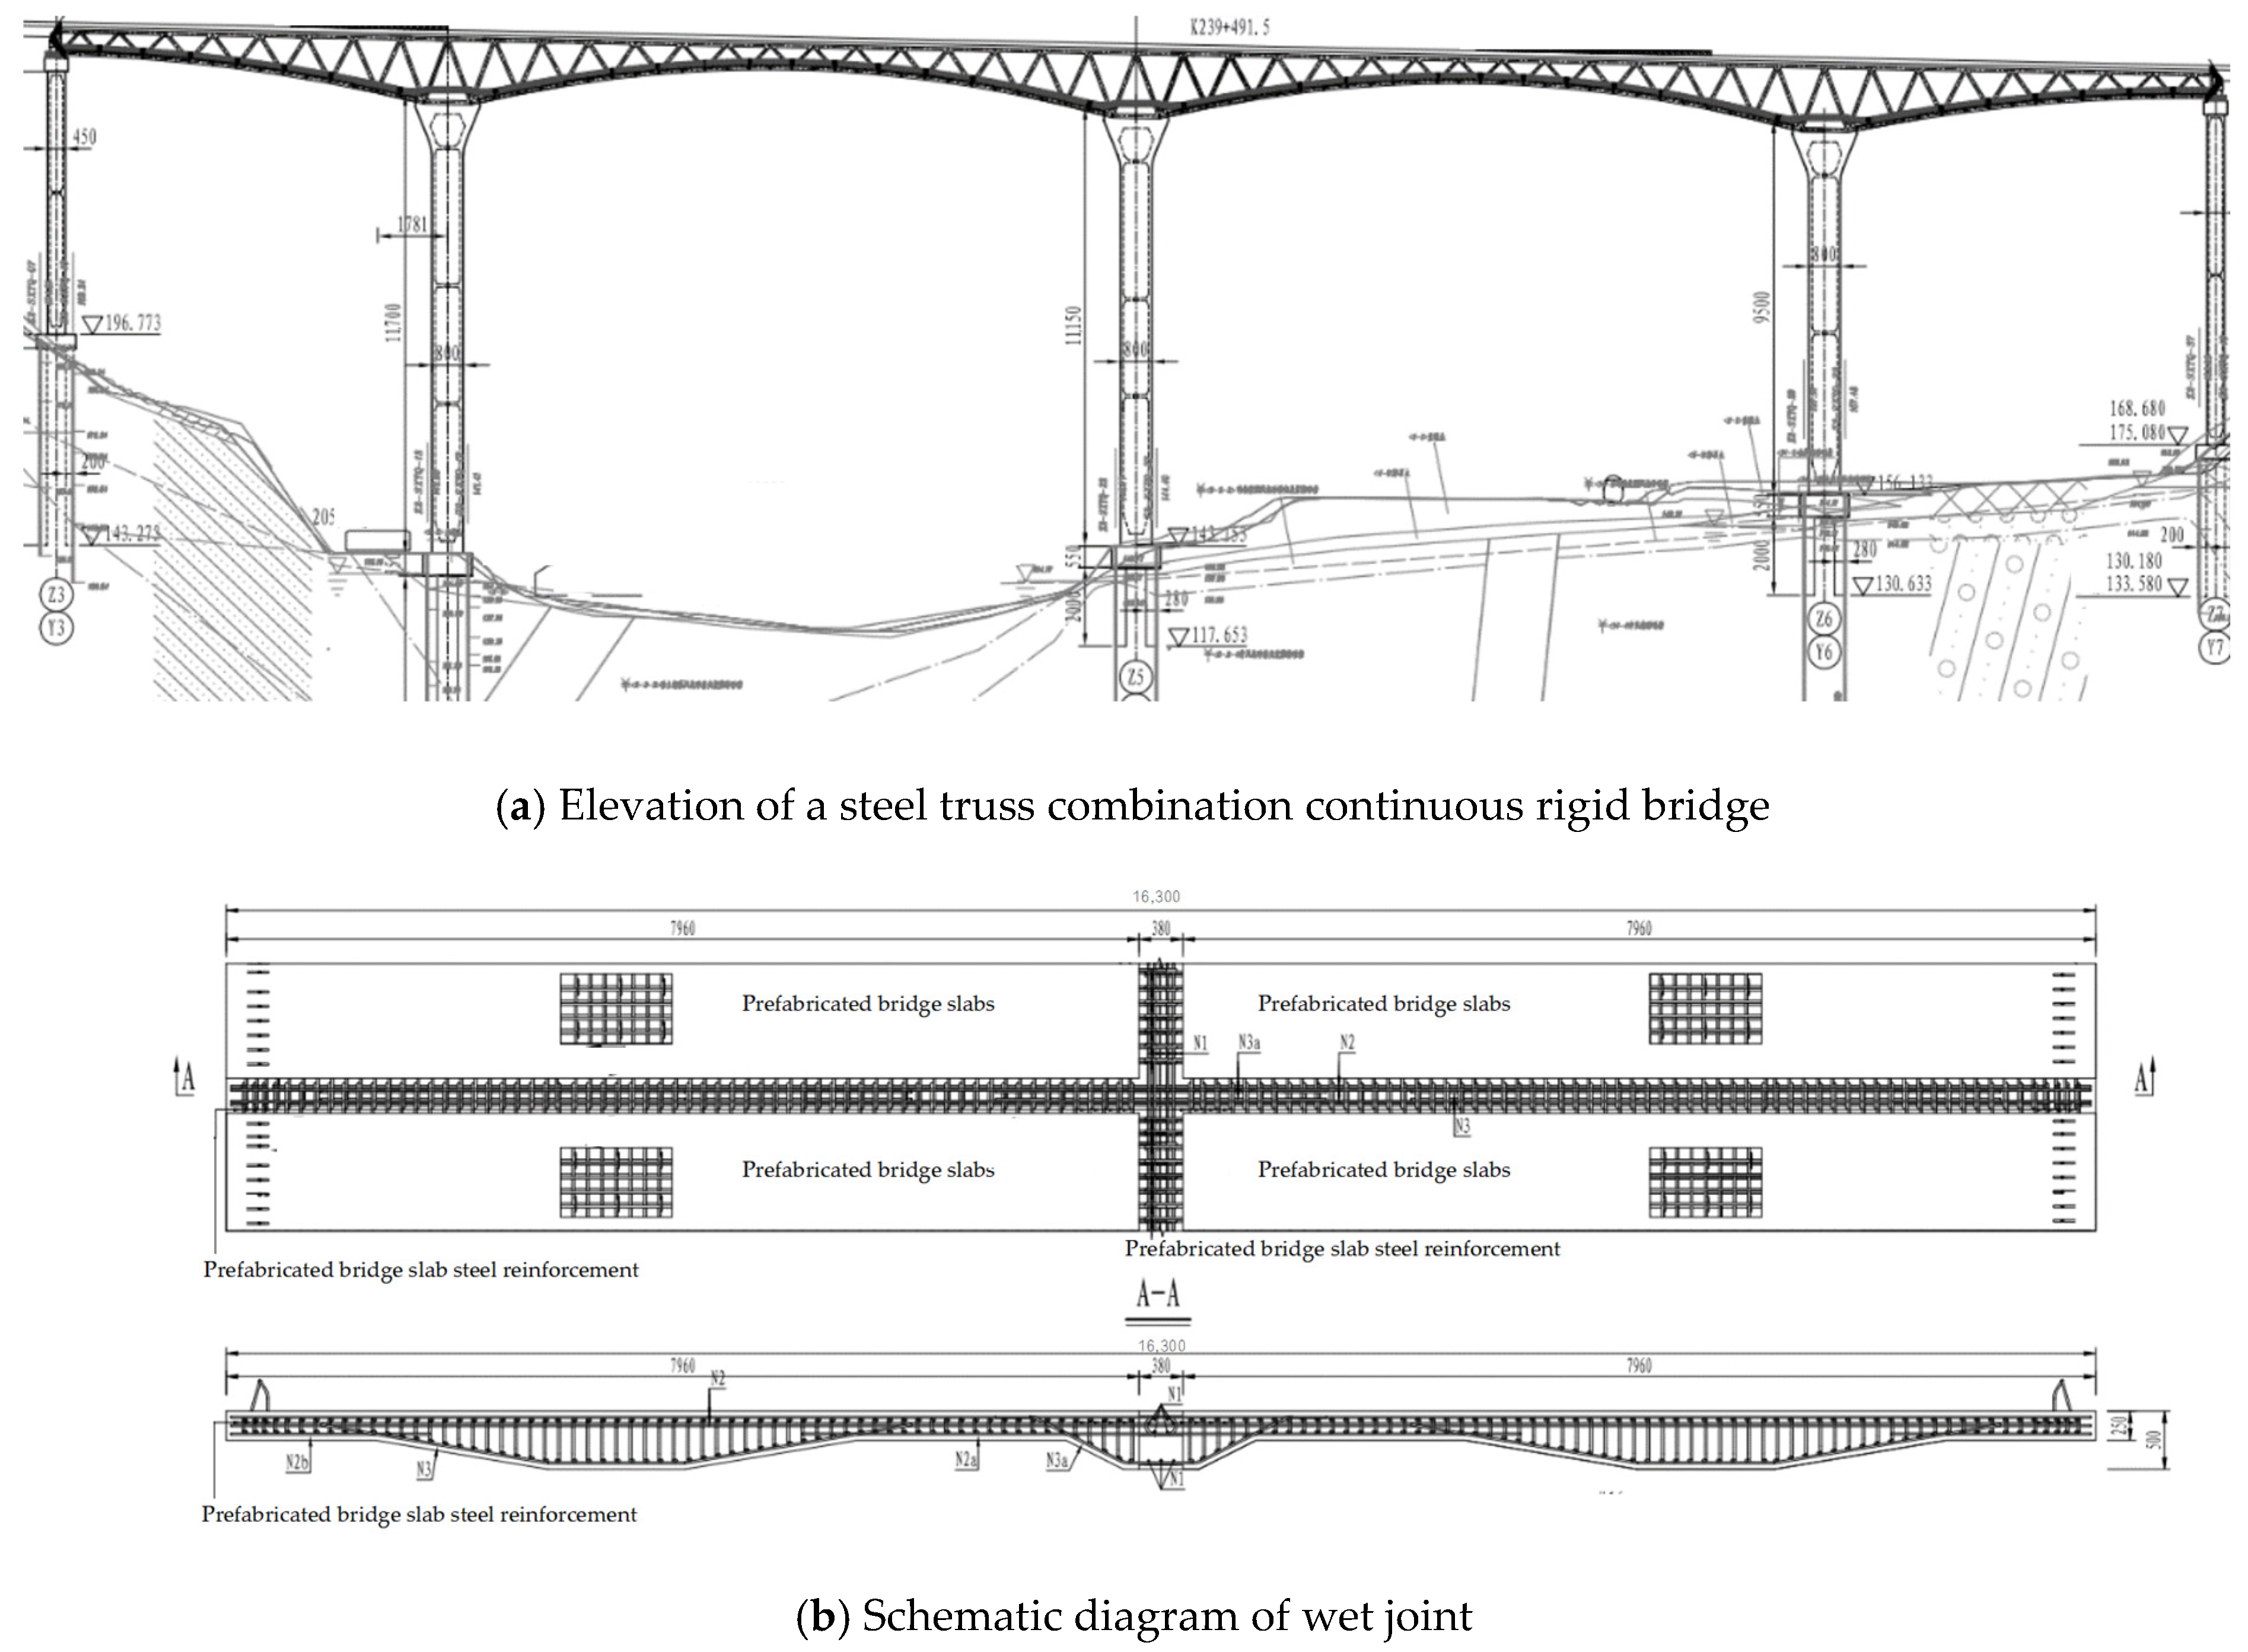
2.1. Engineering Background and Specimen Description

The engineering context pertains to the main span of a 176 m steel truss composite continuous rigid bridge, as depicted in Figure 1a,c. The bridge deck panels are constructed of variable-section C50 reinforced concrete prefabricated panels, joined by wet joints cast on-site at the seams. Wet cast concrete joints employ UHPC (Ultra-High-Performance Concrete) in the negative moment region atop piers, while the rest utilize C50 self-compacting micro-expanding concrete. Longitudinal wet joint configurations are illustrated in Figure 1b,d. In accordance with the engineering context, full-scale experiments are designed, with the bridge deck panels spanning the entire length of the bridge at 16.3 m. The steel beams consist of welded I-beams and welded rectangular beams made of Q420 material. The I-beams have a flange width of 500 mm, a thickness of 22 mm, a web height of 556 mm, and a width of 16 mm, and a lower flange width of 300 mm and a thickness of 22 mm. The bridge deck panels are made of C50 concrete, with two panels (Panel 1, Panel 2) connected via wet joints. Shear studs connect the steel beams to the bridge deck panels, and UHPC is poured at corresponding shear slots and wet joints. Shear studs at wet joints consist of ML15 studs, with a diameter of 22 mm and a length of 250 mm, arranged in two rows with longitudinal and transverse spacing of 125 mm. A schematic of the model is provided in Figure 2.

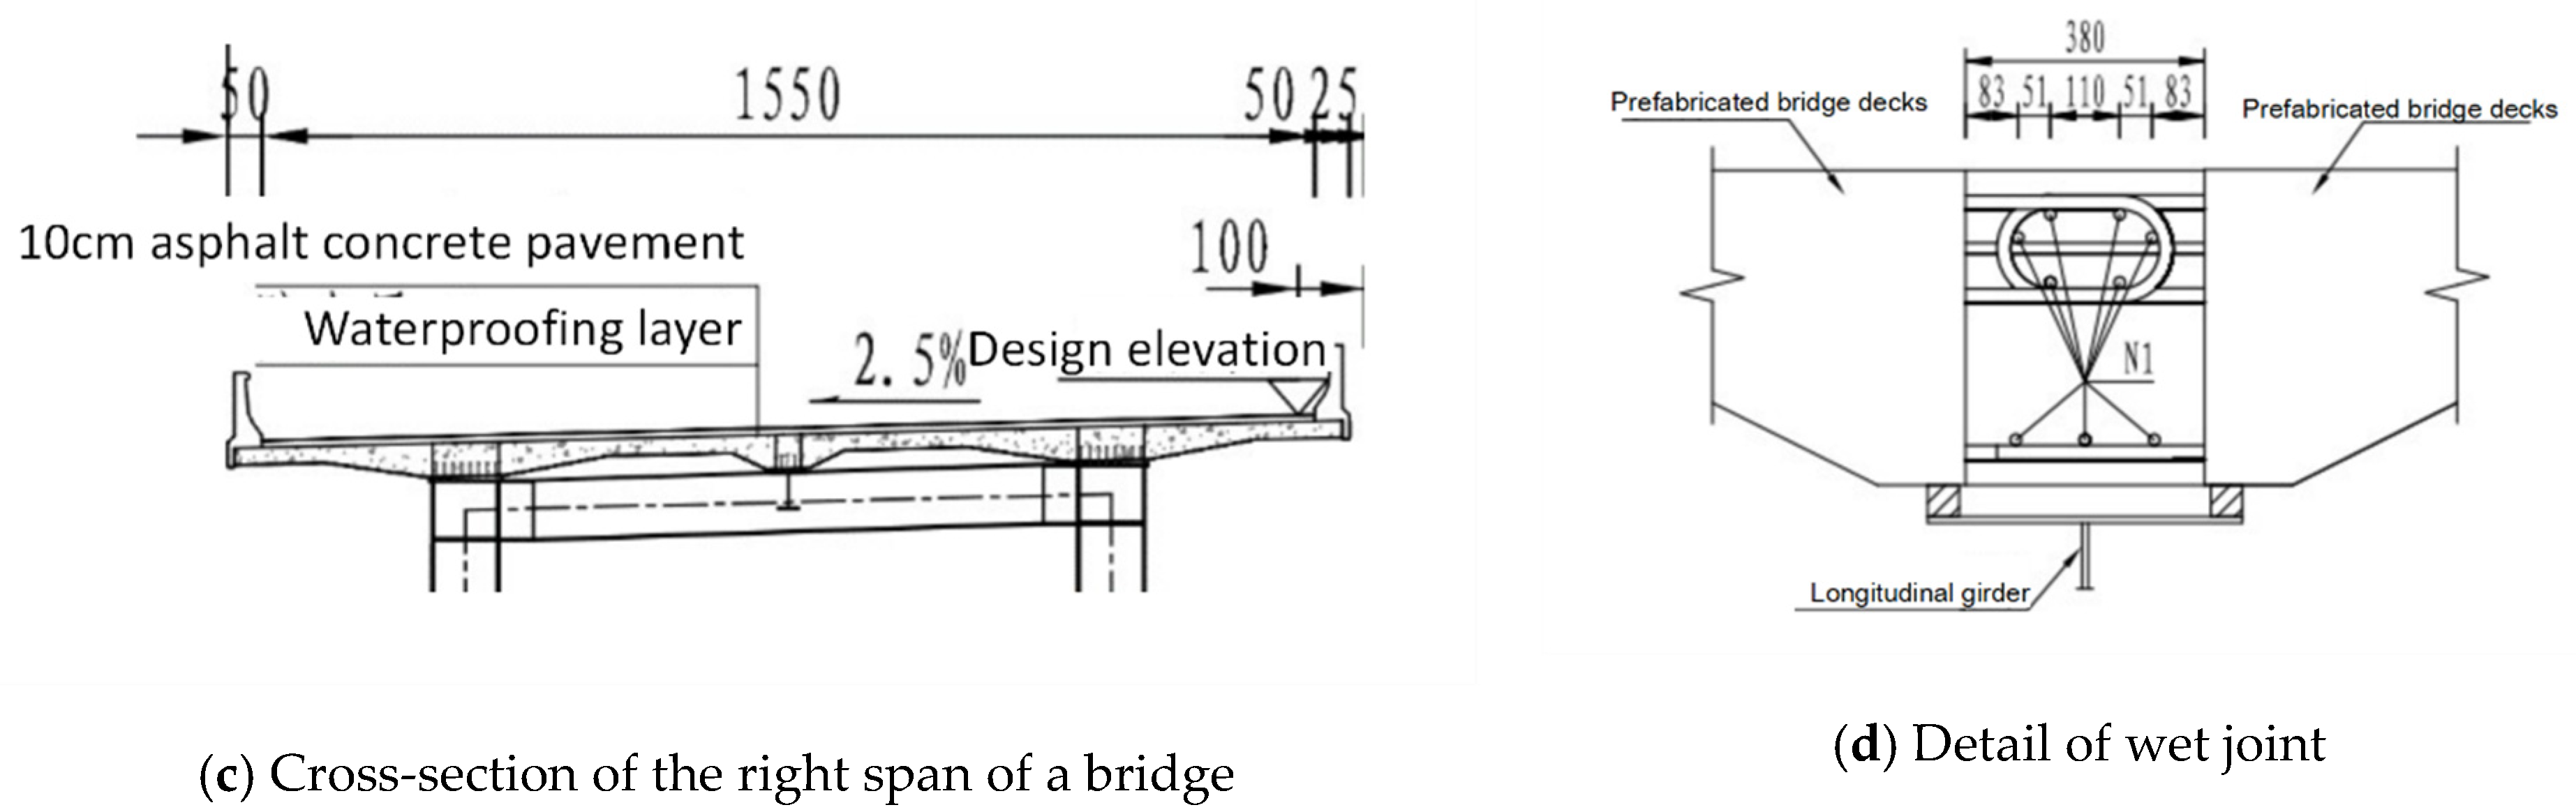
2.2. Model Loading and Test Procedure

To ensure maximum stress at the wet joint location, structural influence lines are computed, indicating that loading at a distance of 1.96 m from the wet joint satisfies loading requirements, as shown in Figure 2c. The experiment utilizes four 300 t tension jacks to load the specimens through beam allocation. Initial loading is set at 75 kN, followed by incremental loading of 30 kN per level until reaching 255 kN, then reduced to 15 kN per level until structural failure. Crack width measurements are conducted at each loading level using crack gauges. To ensure precise operation of the four jacks simultaneously and minimize errors, pressure ring sensors for jacks are prepared to determine the load level and equipped with a hydraulic pump diverter for precise control. Before testing, corresponding sensors are tested to ensure their proper functioning.
To ensure the normal operation of the jacks and apply the required force levels, holes are drilled at the bridge deck loading points to facilitate the passage of PSB830 hot-rolled threaded steel, and holes are drilled at the positions corresponding to the allocation beams and reaction beams to allow one end of the hot-rolled threaded steel to act on the allocation beam and the other end on the reaction beam, generating relative self-reactions at both ends of the hot-rolled threaded steel to achieve the loading objective, as illustrated in Figure 2a.
Test procedures include monitoring of steel strain, concrete strain, structural vertical displacement, and crack propagation in the bridge deck. Strain measurement points are arranged at the wet joint interface at 1/2, 1/4, and end positions, as shown in positions JF1–JF5 in Figure 2a. Loading positions at 1/2, 1/4, and end positions are depicted in positions JY6–JY10 in Figure 2b. Variable-section positions at 1/2 and end positions are indicated by positions C1–C3 and JF11–JF13 in Figure 2b. Displacement measurement points are arranged at the bottom of the loading slab, as shown in Figure 2c. Steel strain distribution and panel side strain distribution are illustrated at positions R1–R3 and BC1–BC4 in Figure 2d,e. The on-site conditions of the components are depicted in Figure 2f.

3. Experimental Results Analysis

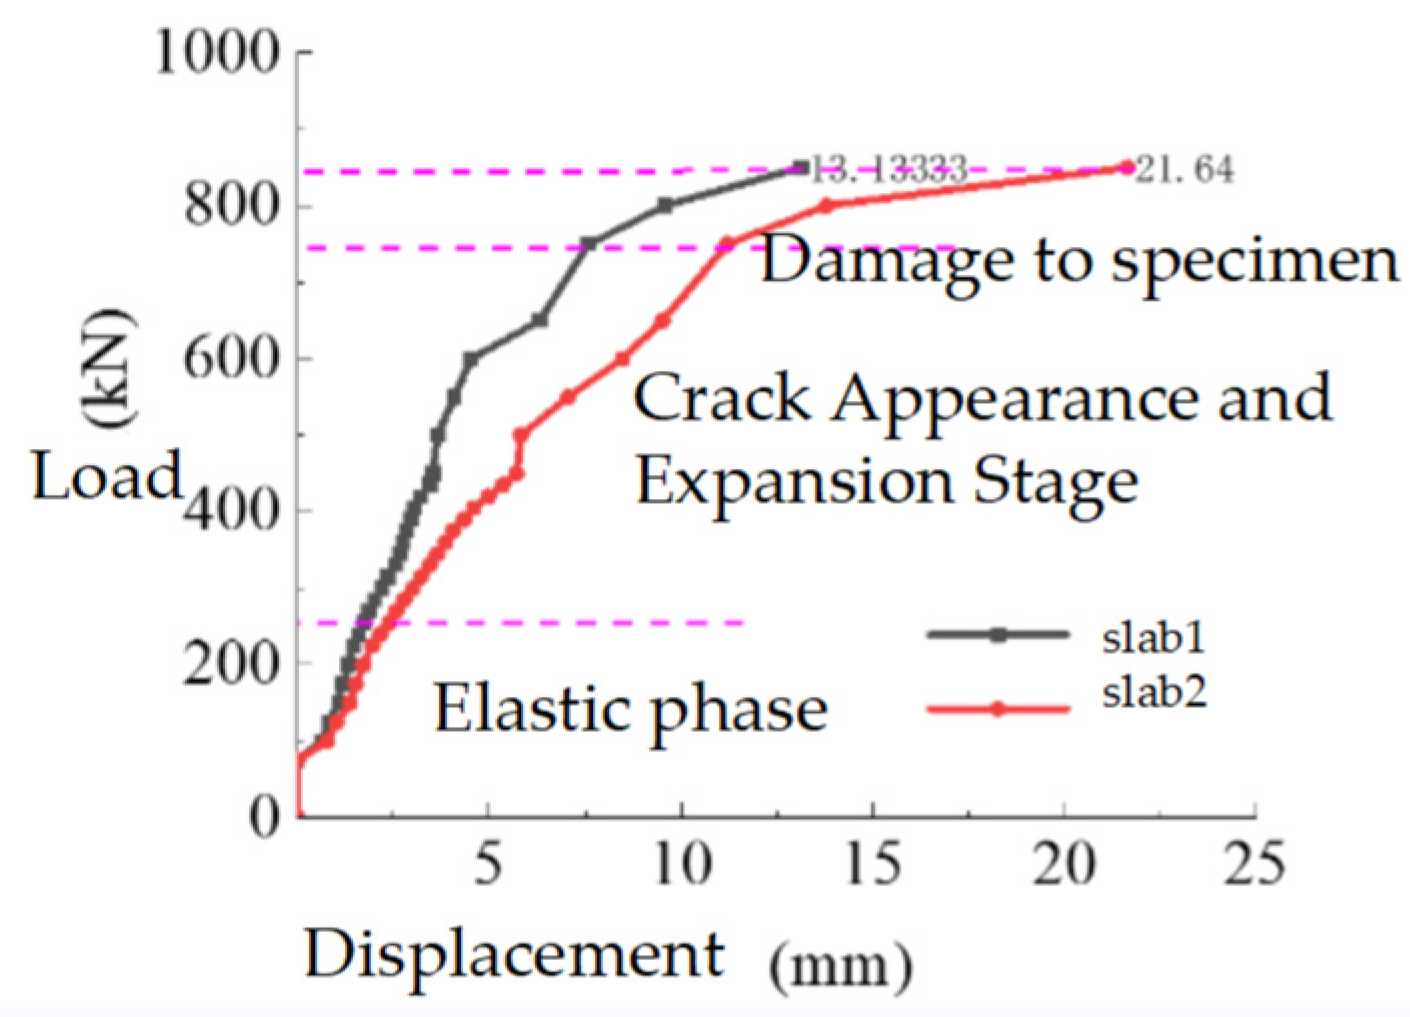
3.1. Load-Displacement Curve
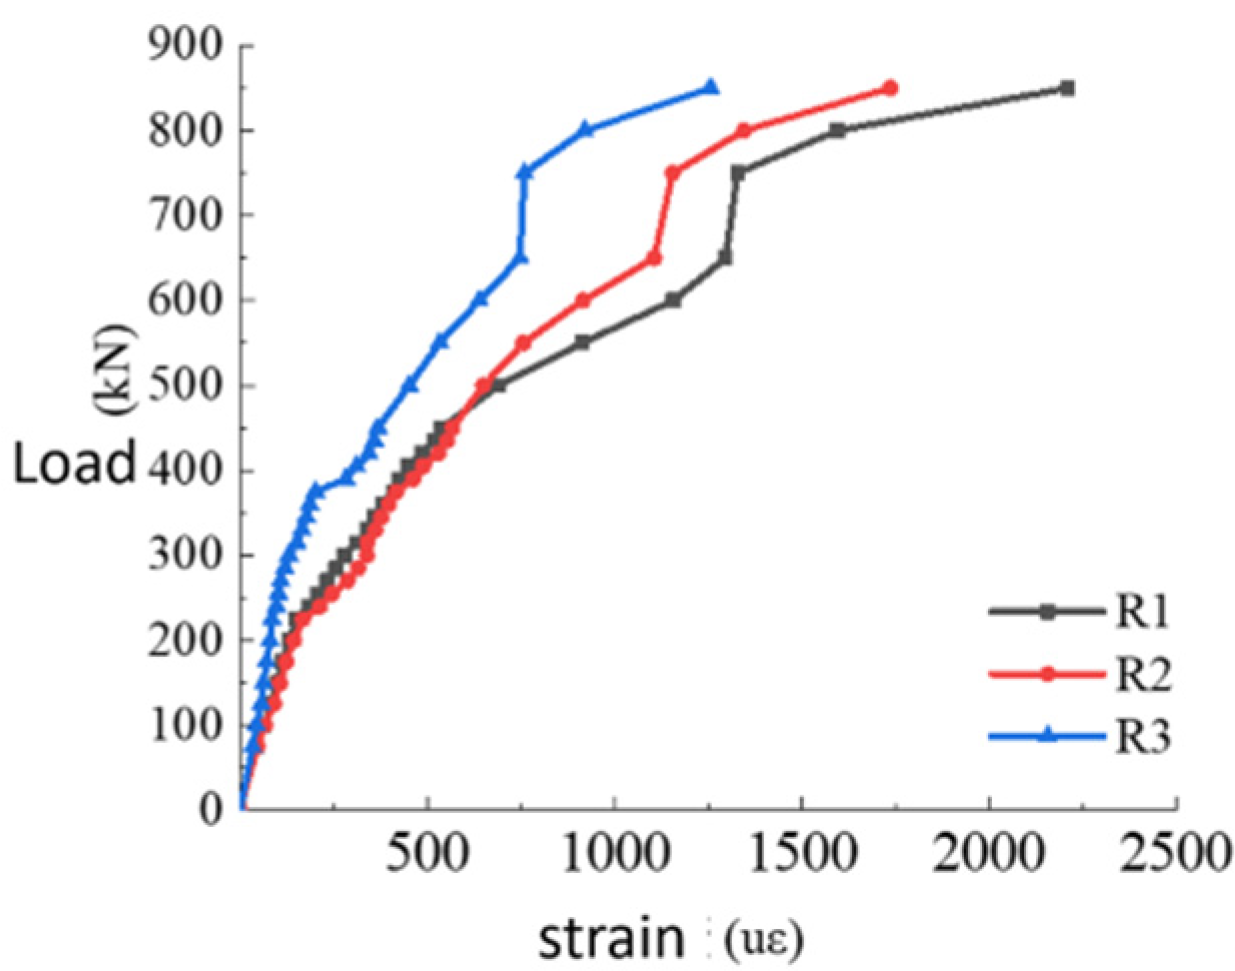
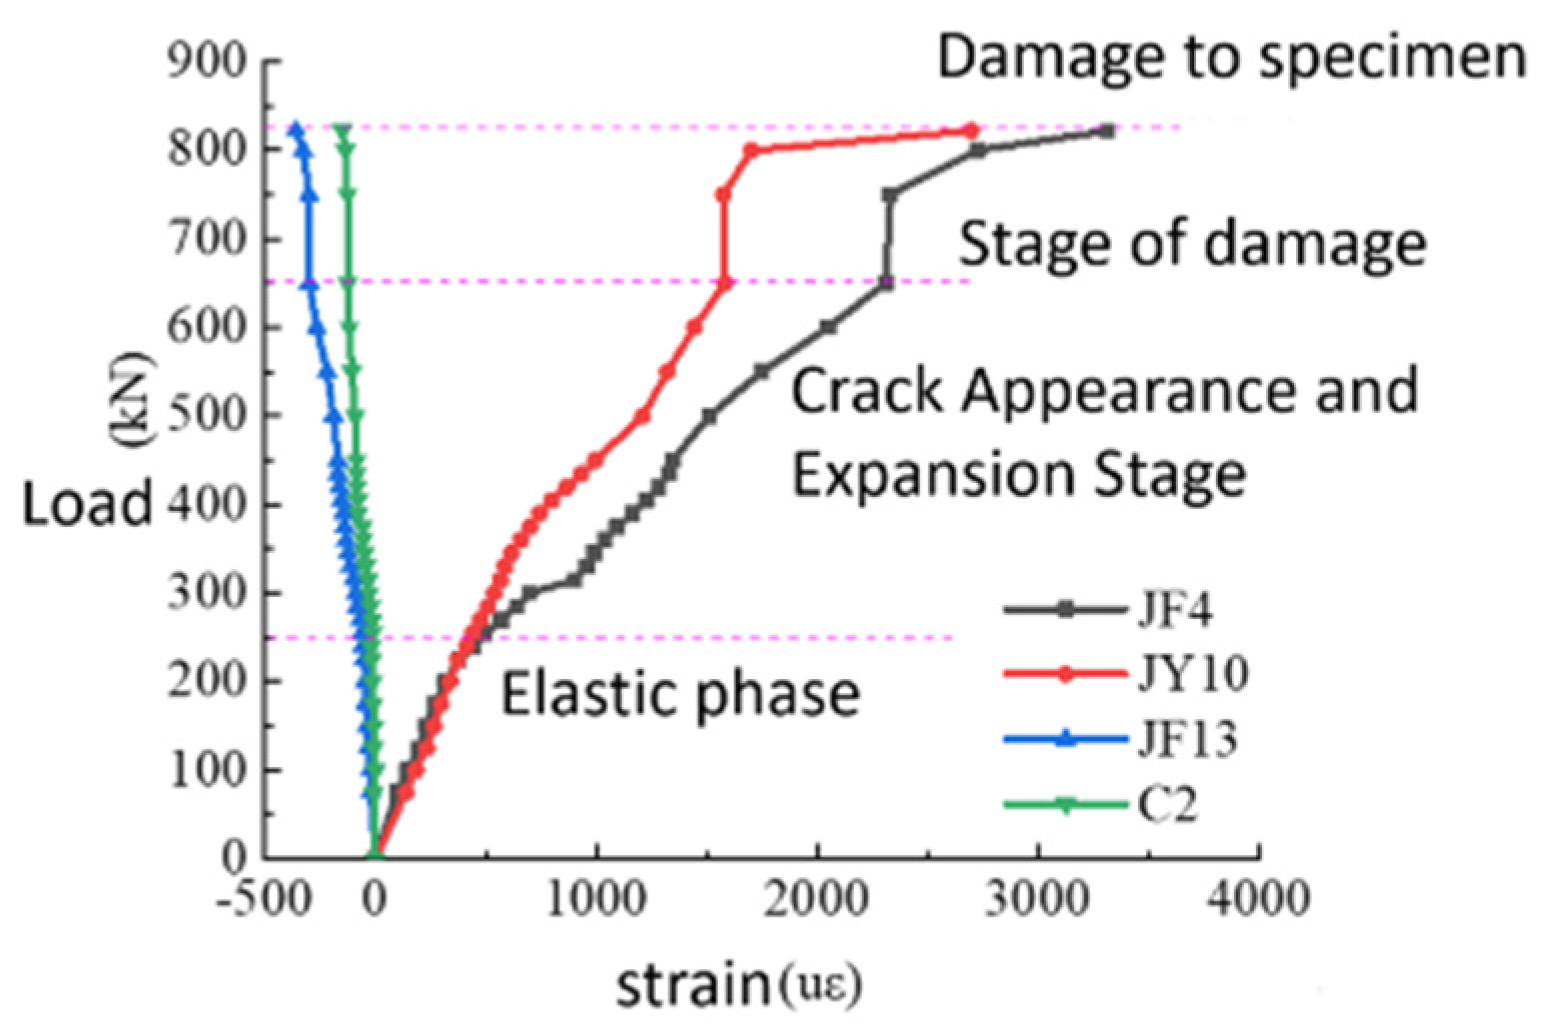
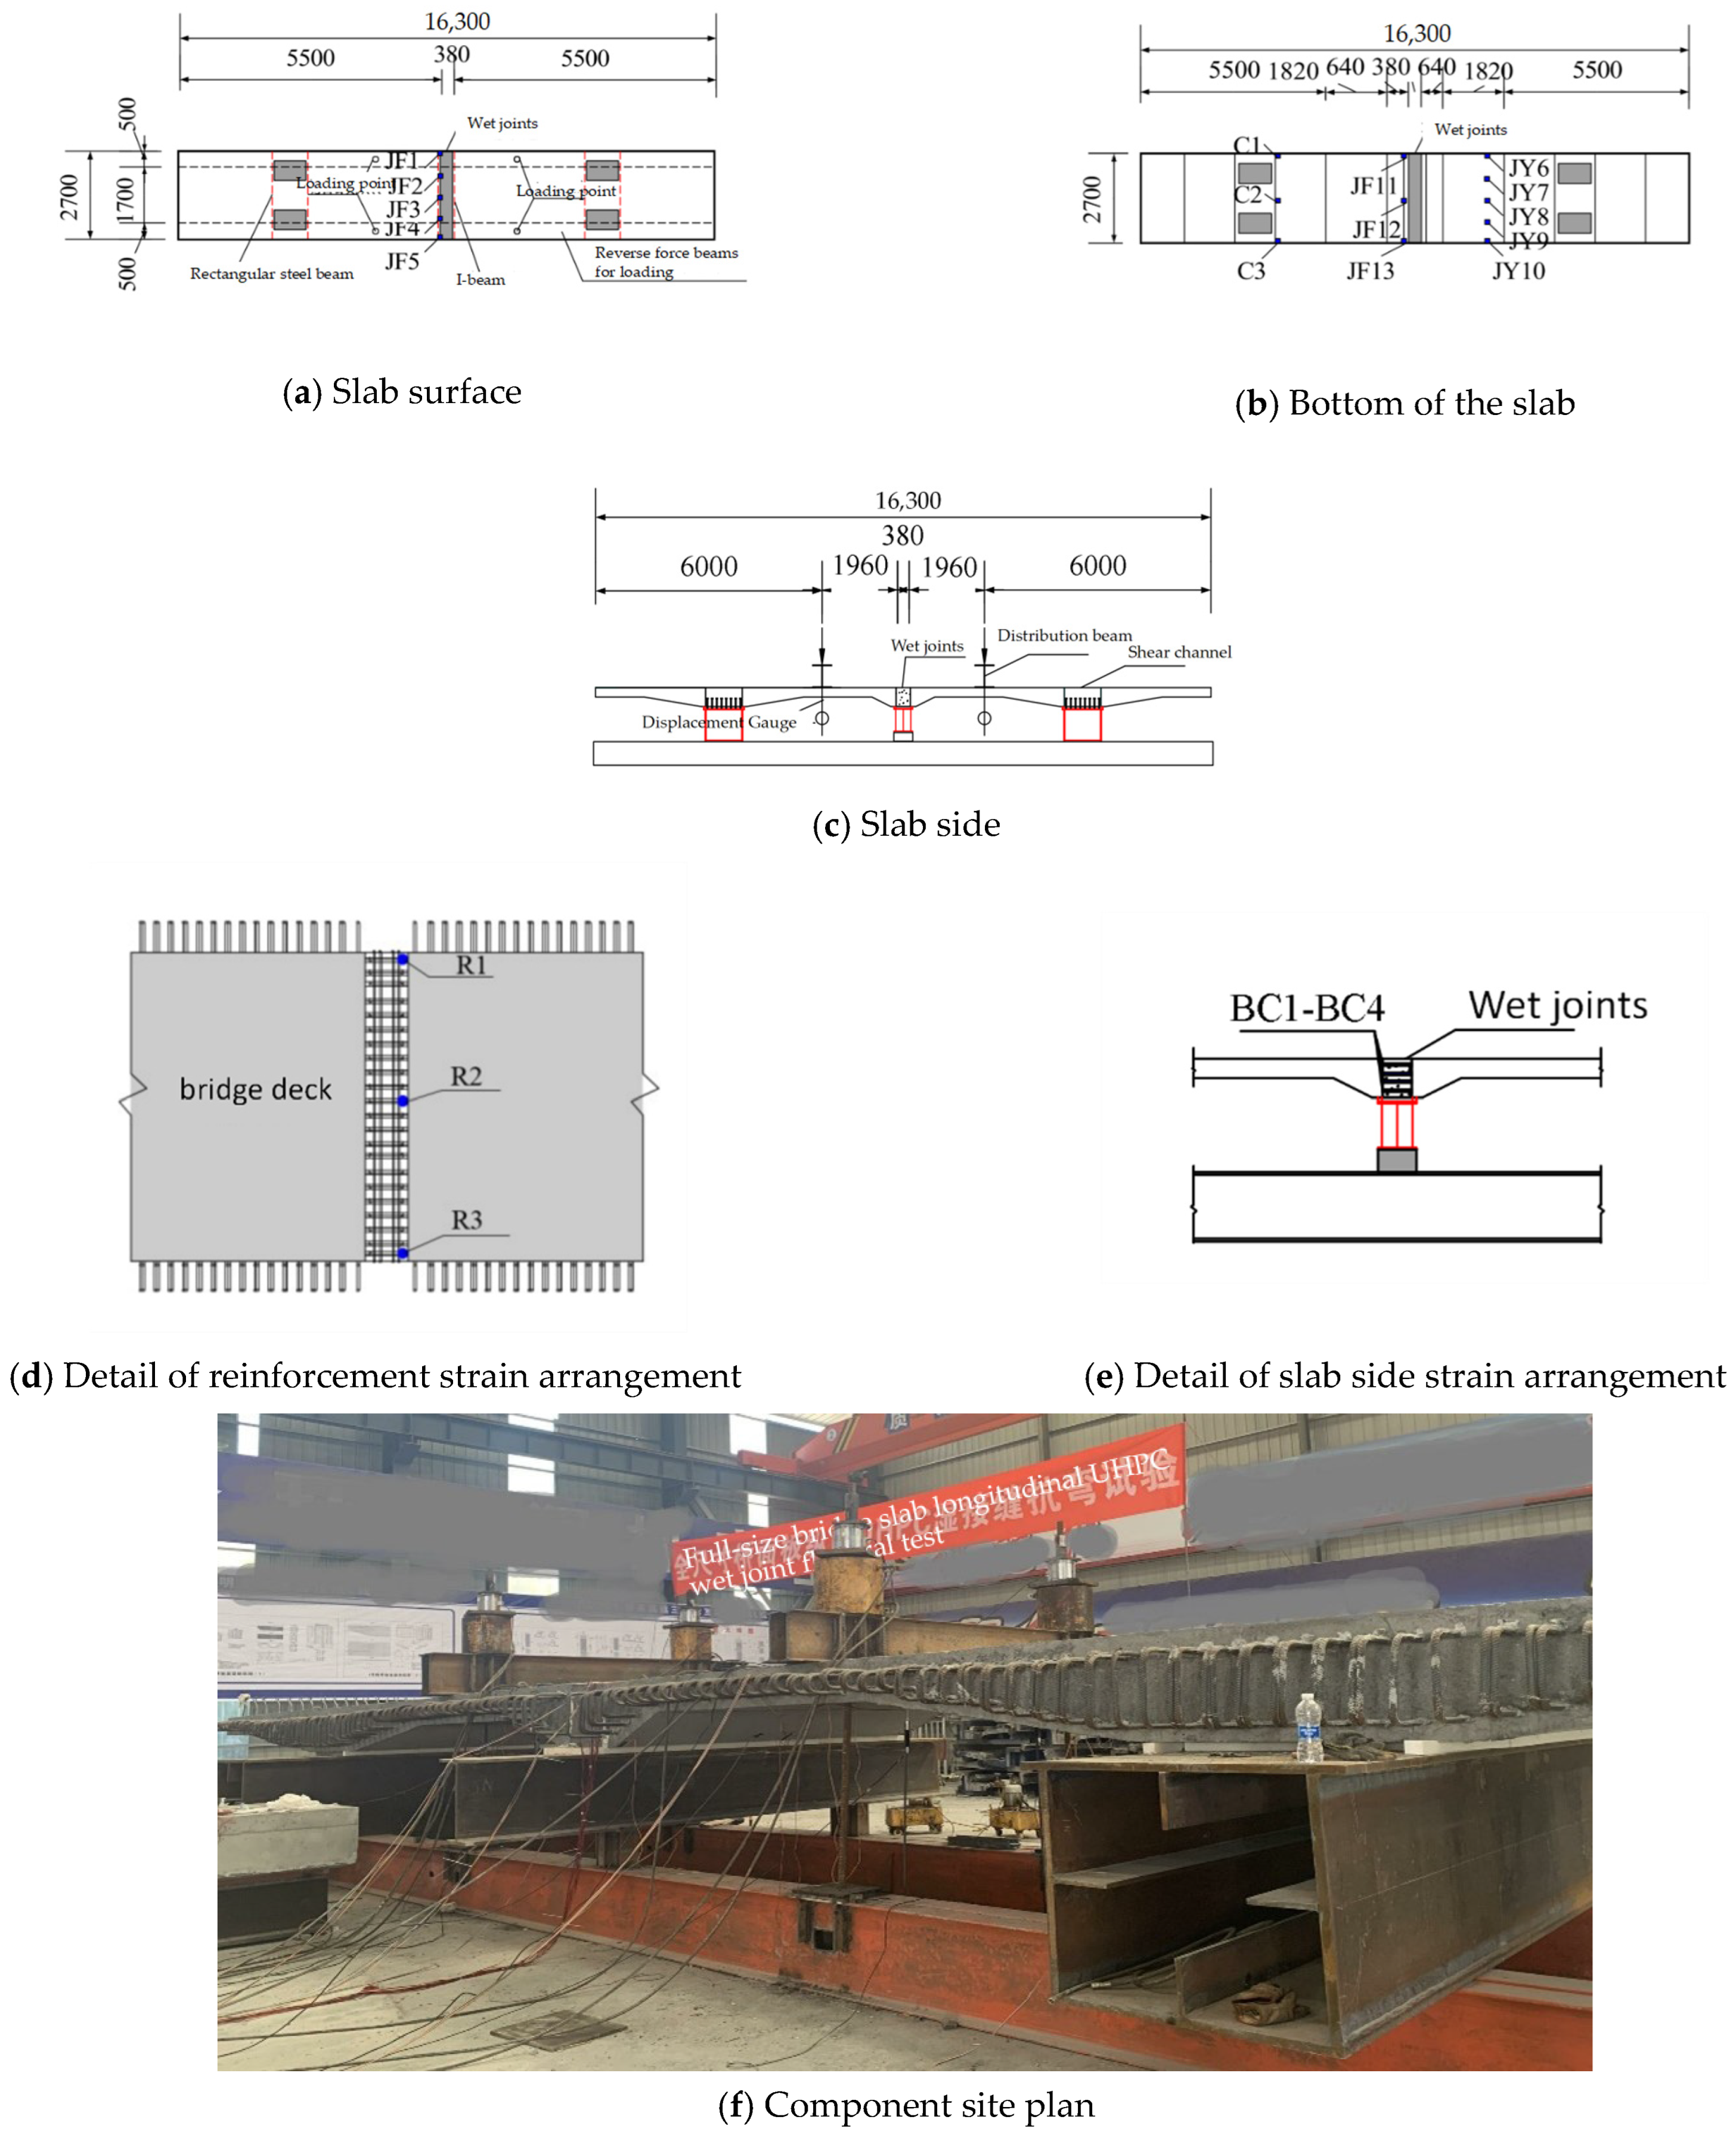
The relationship between load and displacement of the specimens obtained from the experiments is illustrated in Figure 3. The displacement of the specimens with the development of load can be primarily divided into three stages: elastic stage, crack initiation and propagation stage, and failure stage. When the load is less than 0.27 of the failure load (225 kN), the load-deflection curve exhibits predominantly linear development (elastic stage). Subsequently, the specimen enters the crack initiation and propagation stage, where cracking occurs at the interface between the old and new segments of the bridge deck panel and the bottom of the loading slab, resulting in a sudden increase in displacement. At this point, the displacement at the loading position of Slab 1 is 1.41 mm, and for Slab 2, it is 2.12 mm. Continuation of loading until reaching 0.9 of the failure load (750 kN) leads to the specimen entering the failure stage (failure load being 822 kN). Vertical displacement at the loading positions of the bridge deck panels continues to increase, and the stiffness of the specimen decreases. Ultimately, failure occurs near the interface of the old and new segments of the bridge deck panel, with displacements at the loading positions of Slab 1 and Slab 2 reaching 13.13 mm and 21.64 mm, respectively.

3.2. Load-Strain

From the load-displacement curve, it is evident that the specimen can be divided into three stages: elastic stage, crack initiation and propagation stage, and failure stage. Therefore, measurements were taken at various critical positions of the specimen for analysis corresponding to these three stages. As shown in Figure 4, the load-strain curve in the elastic stage exhibits linear growth, followed by a continuous increase in strain values, and finally, a rapid increase in strain values in the failure stage, where the load-strain curve tends towards a horizontal line. Strains at JF13 and C2 are negative and smaller than those at JF4 and JY10, indicating significant compressive stress near the shear groove section, with strains lower than those at the loading positions and the interface of old and new sections. As shown in Figure 5, at loads less than 200 kN, the steel at the interface exhibits an elastic stage, followed by crack initiation and propagation. As concrete cracks and gradually loses effectiveness, stress on the steel increases rapidly, leading to a rapid increase in strain after reaching 600 kN, indicating the yielding of the steel and entry into the failure stage. Figure 6 depicts the variation of load-strain at various concrete measurement points. As shown in Figure 6a, at loads less than 200 kN, the load-strain curve exhibits linear growth, indicating the specimen remains in the elastic stage, and upon reaching 600 kN, a significant increase in strain is observed at JF4 and JY10, indicating entry into the failure stage. Comparing strain values at the loading position with those at the interface of old and new sections, it is evident that strains at the interface are greater. Moreover, the rate of strain increases at the interface after entering the stage of crack initiation and propagation is significantly lower than at the loading position, indicating significant tensile stress on the concrete near the interface of old and new sections after the elastic stage, ultimately leading to failure near the interface. As shown in Figure 6b, strains at the interface and bottom of the slab near the interface exhibit negative values, indicating significant compressive stress at these positions, with strains slightly larger at the bottom of the slab near the interface than at the section near the shear groove. Throughout the loading process, strains at various measurement points before failure exhibit a generally linear distribution, satisfying the assumption of a plane section, as shown in Figure 6c.

3.3. Development and Distribution of Concrete Cracks

The experiment obtained the crack development and distribution of the variable cross-section bridge deck specimens under static load, as shown in Figure 7, Figure 8, Figure 9 and Figure 10. In the elastic stage, there were generally no visible cracks in the concrete. When the load reached 0.27 (225 kN) of the failure loads, short visible longitudinal cracks first appeared at the interface between the old and new sections of the wet joint, with an initial crack width of 0.02 mm, corresponding to position ① in Figure 7. With increasing load, these cracks developed into through cracks. Continued loading led to further extension of the cracks at the interface between the old and new sections, with increasing crack width, and tiny cracks appearing on both sides of the wet joint panels. Eventually, the maximum crack width at the interface between the old and new sections of the concrete reached 0.24 mm. The specific expansion of cracks at the interface between the old and new sections is shown in Figure 8a–c. When the load reached 0.31 (255 kN) of the failure load, cracking occurred on the surface of the concrete at the bottom of the slab at the loading position, with an initial crack width of 0.06 mm, corresponding to position ② in Figure 7, and multiple cracks rapidly developed, with crack widths exceeding those at the interface between the old and new sections of the concrete surface, with the maximum crack width at the bottom of the slab at the loading position reaching 0.34 mm. The specific expansion of cracks at the bottom of the slab at the loading position is shown in Figure 9a–c. Finally, when the load reached the failure load of 822 kN, the bridge deck failed near the variable cross-section at the wet joint, corresponding to position ③ in Figure 7, with diagonal cracks extending from the bottom to the top surface of the slab at the loading position, as shown in Figure 10a,b. From the above, it can be concluded that, in the early stages of loading, the specimen experienced significant tensile stress at the wet joint position, but as cracking occurred at the interface between the old and new sections of the concrete, stress redistribution occurred, resulting in the location near the variable cross-section at the wet joint becoming the weakest point of the entire specimen. As shown in Figure 11, crack width generally undergoes two stages with increasing load: the first stage is a linear stage (elastic stage), where the load and crack width are roughly proportional, and concrete cracking continuously increases during this stage. The second stage is a line with decreasing slope (working with cracks), where concrete gradually loses effectiveness at crack locations, and the rate of crack width increase decreases. Due to stress redistribution after cracking occurred at the interface between the old and new sections of the wet joint, the crack width at the bottom of the slab continues to increase, while the crack width at the interface between the old and new sections no longer increases.

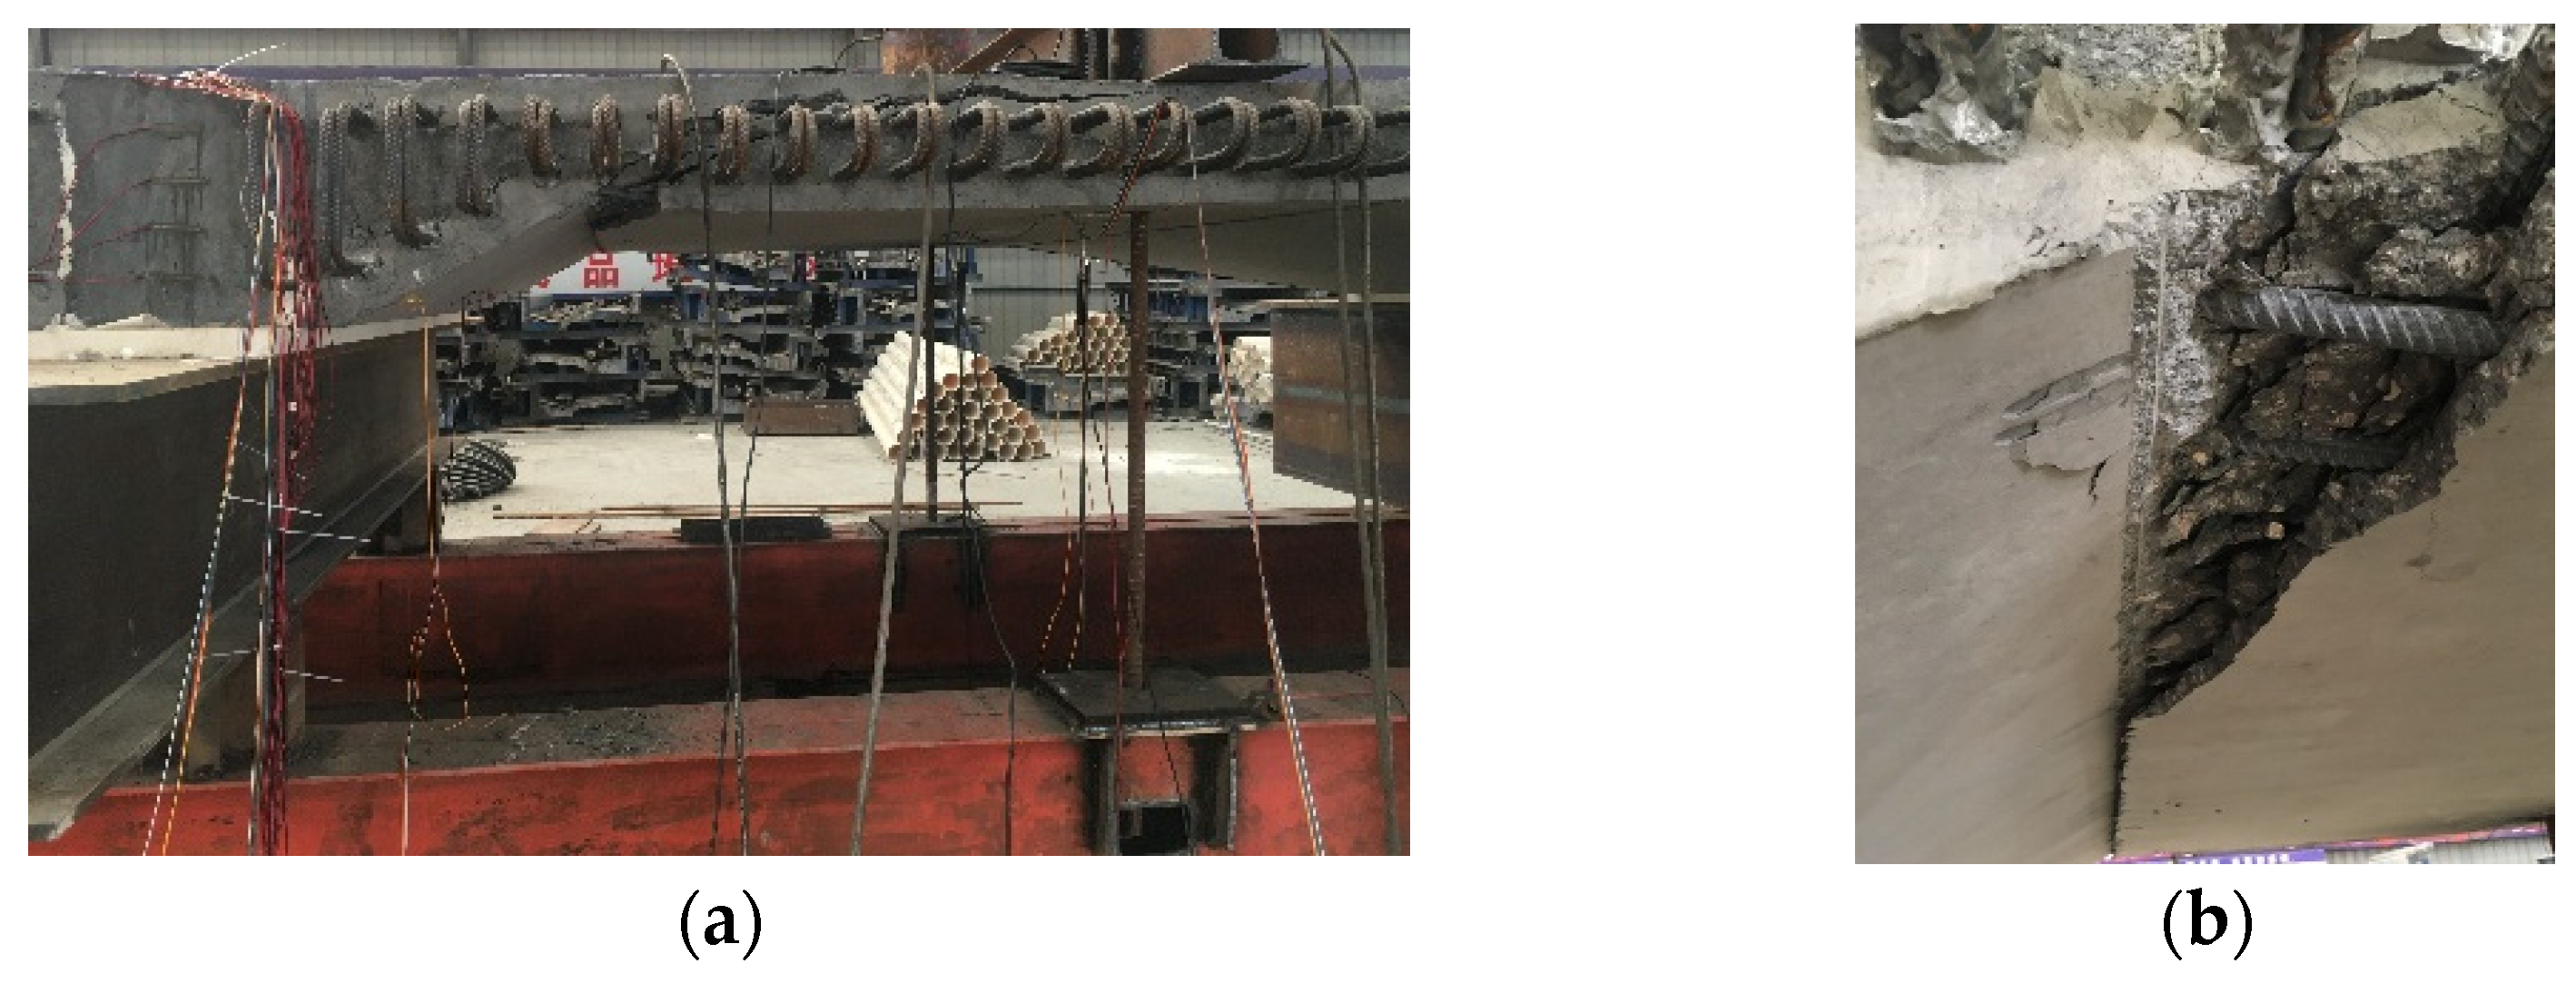
3.4. Destruction Mode

The ultimate failure mode of the experiment is characterized by flexural–shear failure near the location of the wet joint, which differs from the cracking pattern observed in the wet joint of equal cross-section bridge deck panels. Initially, cracks appear at the interface region under loading, followed by noticeable cracks at the mid-span of the specimen. Subsequently, cracks occur at corresponding positions of the loading point on the lower edge of the specimen. As the load increases further, multiple vertical and longitudinal cracks develop on the side and bottom surfaces of the pure bending section, continuously extending and propagating toward the upper edge of the specimen. The width of the cracks increases, and the mid-span displacement rapidly enlarges, ultimately resulting in the bending failure of the specimen [21,22].

4. Numerical Modelling and Analysis

This section conducts numerical simulations using finite element software and compares the simulation results with experimental data to obtain a robust finite element computational model.

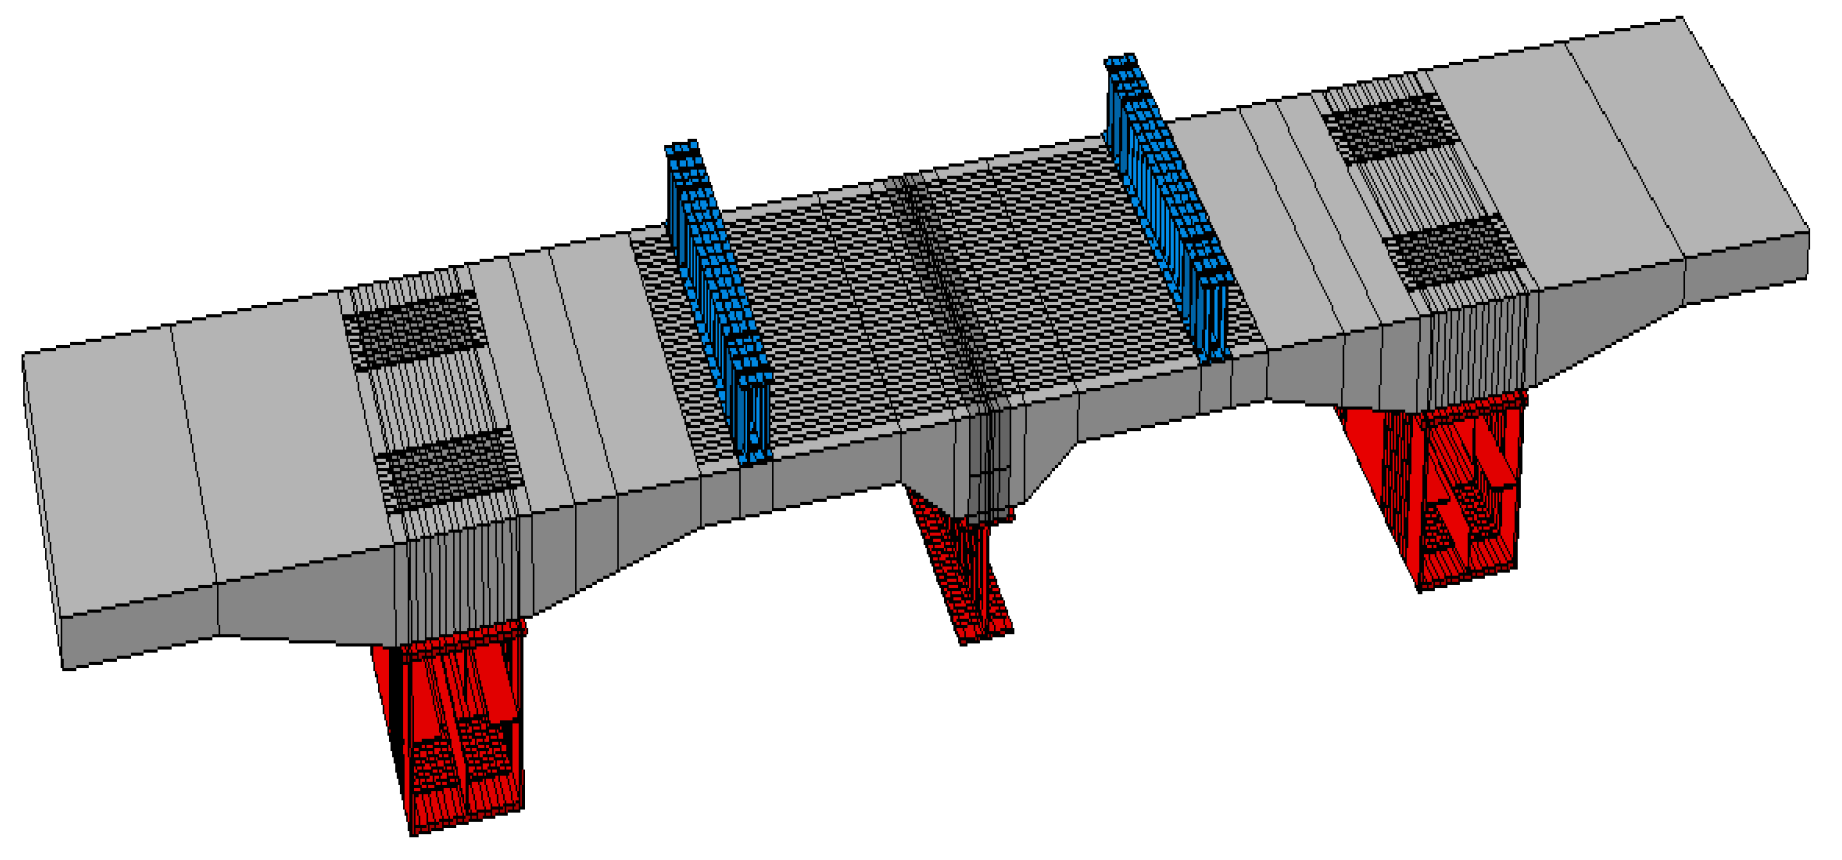
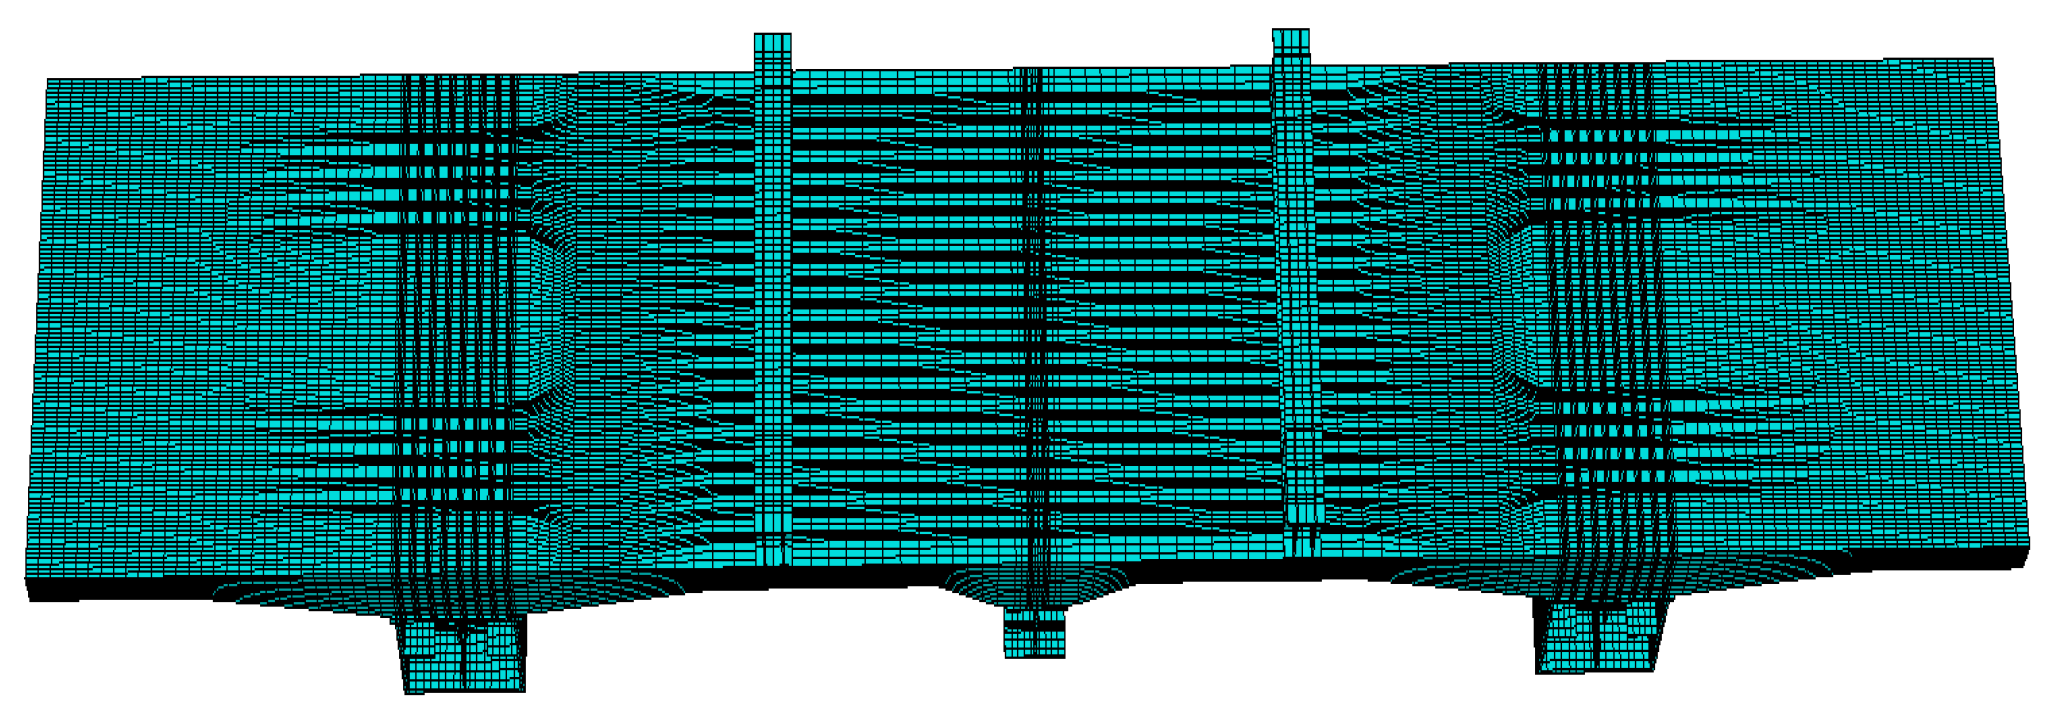
4.1. Establishment of Numerical Analysis Model

In this study, ABAQUS is employed as the analysis platform for the numerical modeling and analysis of Ultra-High-Performance Concrete (UHPC) wet joints precast steel-reinforced concrete variable cross-section bridge decks. The established finite element model is depicted in Figure 12.
The simulation model employs eight-node hexahedral reduced integration solid elements to simulate the variable cross-section bridge decks, wet joints, and shear studs; while 3D two-node truss elements are used to model the reinforcement within the structure. Steel reinforcement is embedded within concrete instances to simulate the steel-concrete contact relationship. Interaction between two sections is realized by defining tangential friction coefficients. The shear studs are welded onto the steel beam, and the finite element model adopts the TIE formulation to simulate their welding relationship. A cohesive force model is utilized to simulate the wet joint interfaces of the bridge deck. The finite element model in this section employs a quadratic nominal stress criterion to assess the damage extent at the wet joint interfaces, primarily induced by the combined effect of normal and tangential stresses leading to concrete failure.
[ s n s n 0 ] 2 + [ s s s s 0 ] 2 + [ s t s t 0 ] 2 = 1
where: s n , s s , s t —are the normal stress, the first tangential stress, and the second tangential stress on the old and new interfaces, respectively; s n 0 , s s 0   s t 0 are the critical stresses corresponding to the stresses in each direction, respectively; and the specific parameters selected for the finite element model are shown in Table 1:
Considering that the model’s steel beams do not undergo rigid body displacements, boundary conditions are established by restraining the translational motion of the lower flange of the steel beams to simulate real structural conditions. During meshing, the wet joints and the bridge decks on both sides are finely divided into meshes, as shown in Figure 13.

4.2. Selection of Material Constitutive Models

For finite element modeling, the choice of material constitutive models significantly impacts numerical analysis results; thus, selecting appropriate constitutive relationships is crucial for establishing finite element models.

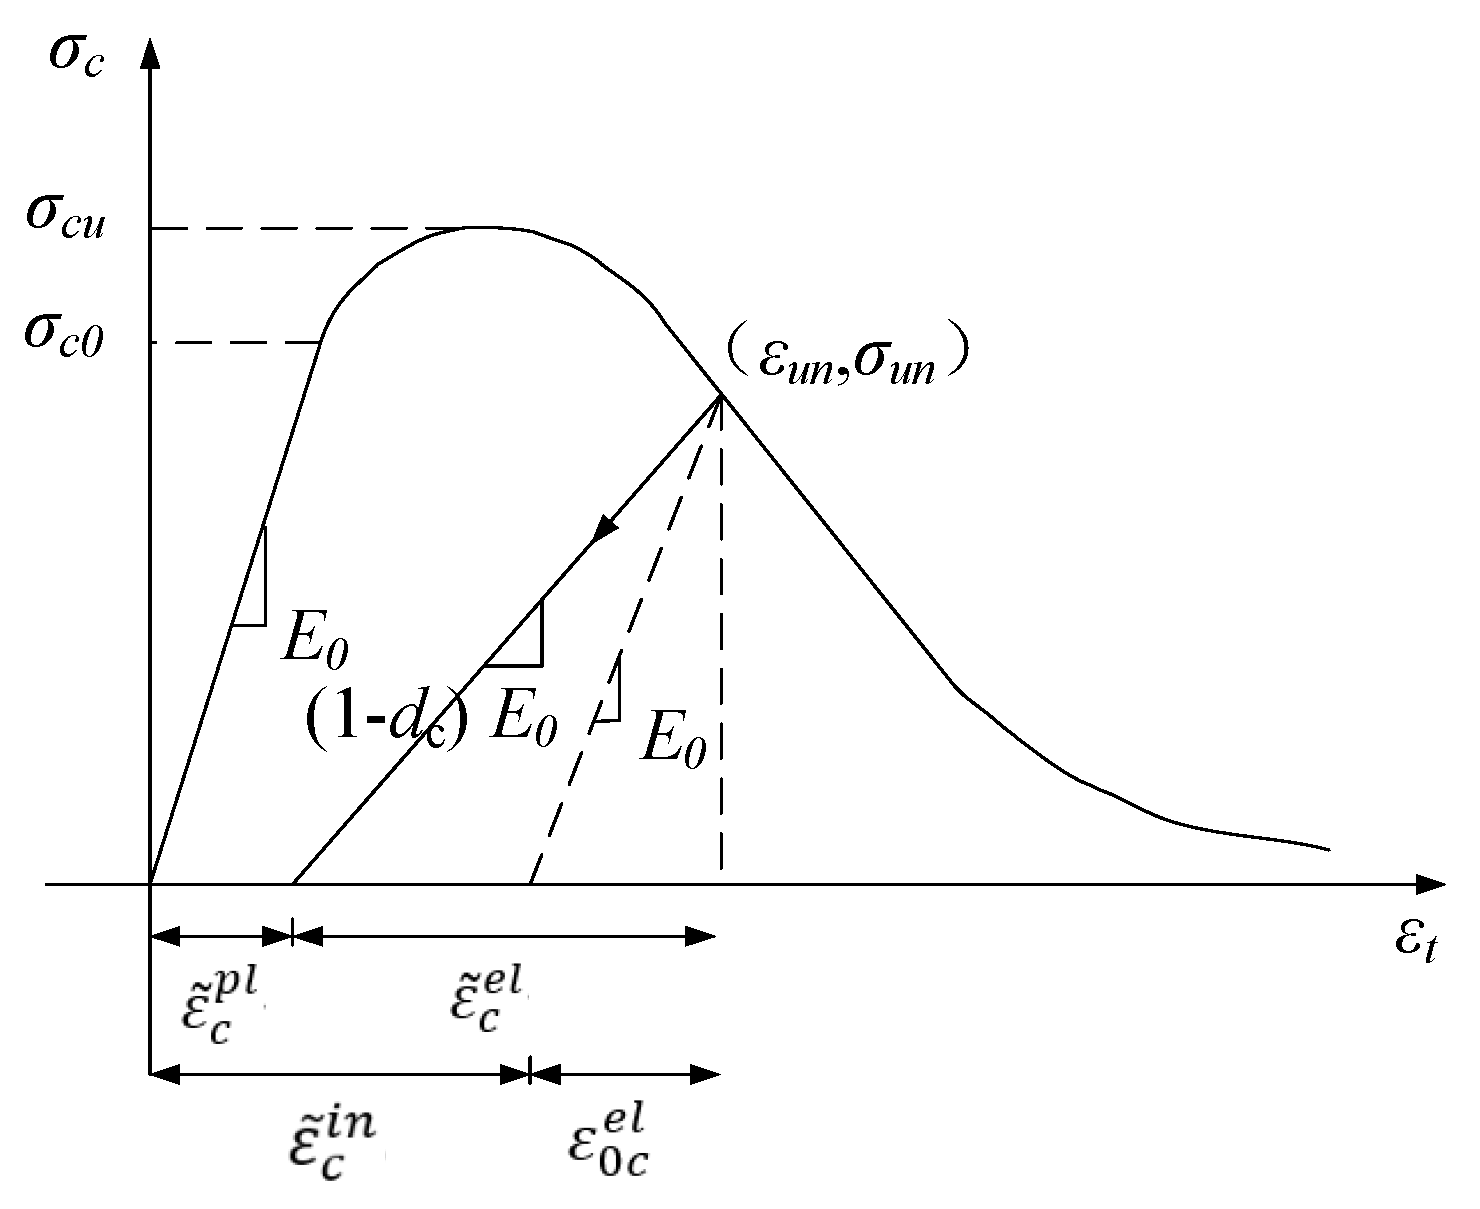
4.2.1. Concrete Constitutive Model

In order to ensure the correctness of the concrete constitutive relationship, the concrete constitutive relationship in this paper is selected from the “Code for the Design of Concrete Structures” (GB50010-2010) [24]. The concrete stress-strain curve is shown in Figure 14.
To simulate the accumulation of damage in concrete during the elastic–plastic phase under static loading conditions. The Concrete Damaged Plasticity (CDP) damage model included in the Abaqus CAE (2020) software was employed in this study.
Sidiroff’s principle of energy equivalence is used to determine the damage factor d, according to which the concrete compressive and tensile damage factors can be derived:
Pressure damage:
D c = 1 ( 1 d c ) E c E 0 ,   D C 0
Tension damage:
D t = 1 ( 1 d t ) E c E 0 ,   D C 0
The parameters of concrete properties used in the model are determined based on the specification values corresponding to the concrete strengths measured in the tests. In this paper, the model is calculated using the axial compressive strength values corresponding to C50 concrete and UHPC in the specification, which are brought into the equation of the constitutive relationship.

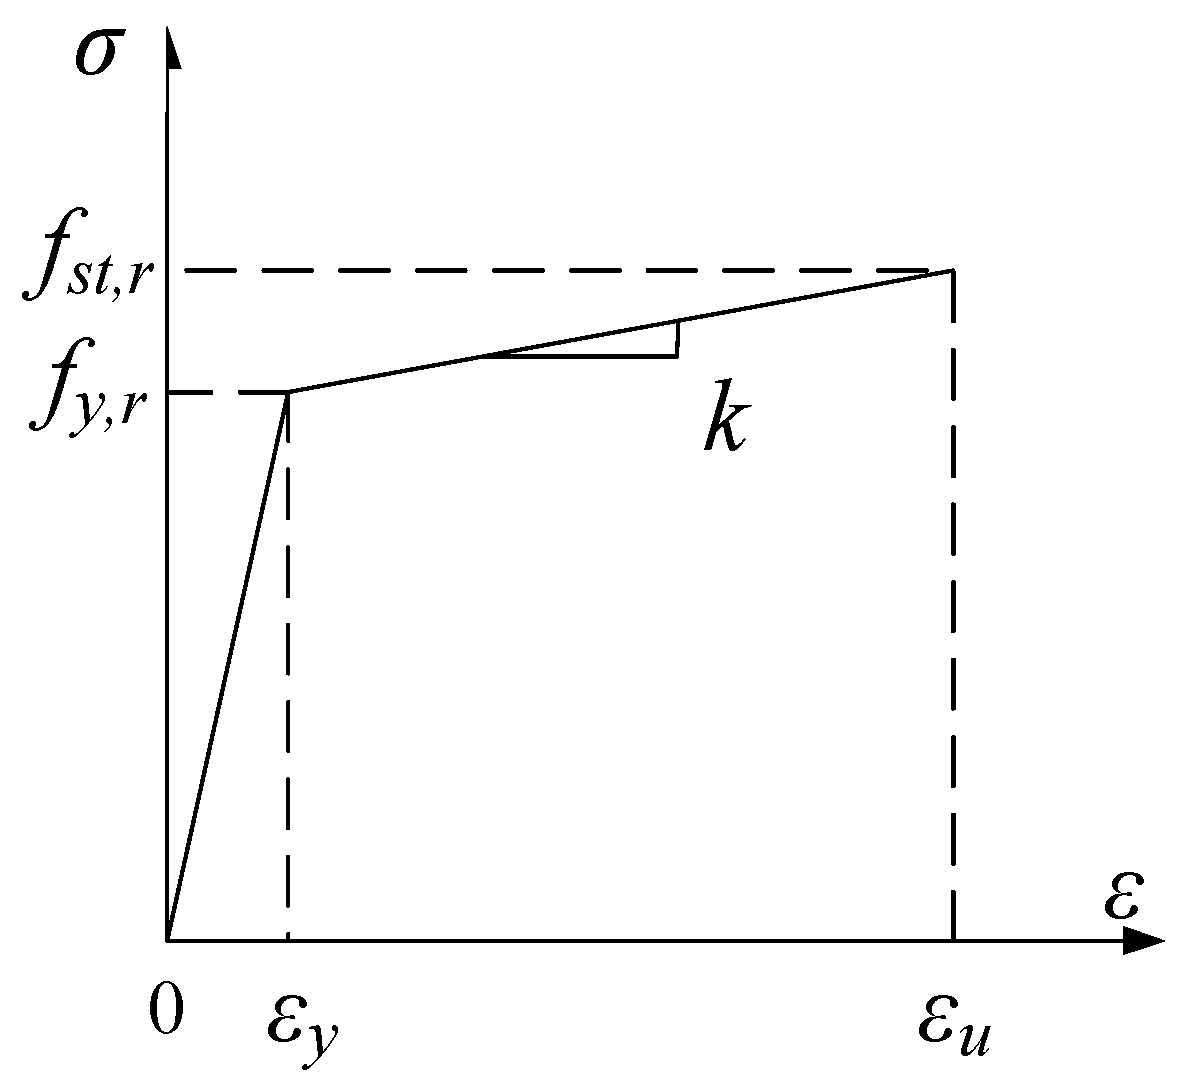
4.2.2. Reinforcing Steel Constitutive Model

In this paper, the parameters of the reinforcing steel model principal relationship are selected from the “Code for the Design of Concrete Structures” (GB50010-2010) [24]. The stress-strain principal relationship of reinforcement without yield point is shown in Figure 15.
The reinforcing effect of the reinforcement in the actual simulation has little effect on the simulation, so in this paper, a simple bifold model is used to define the material properties of the reinforcement, i.e., let k = 0 and fy,r = 400 MPa.

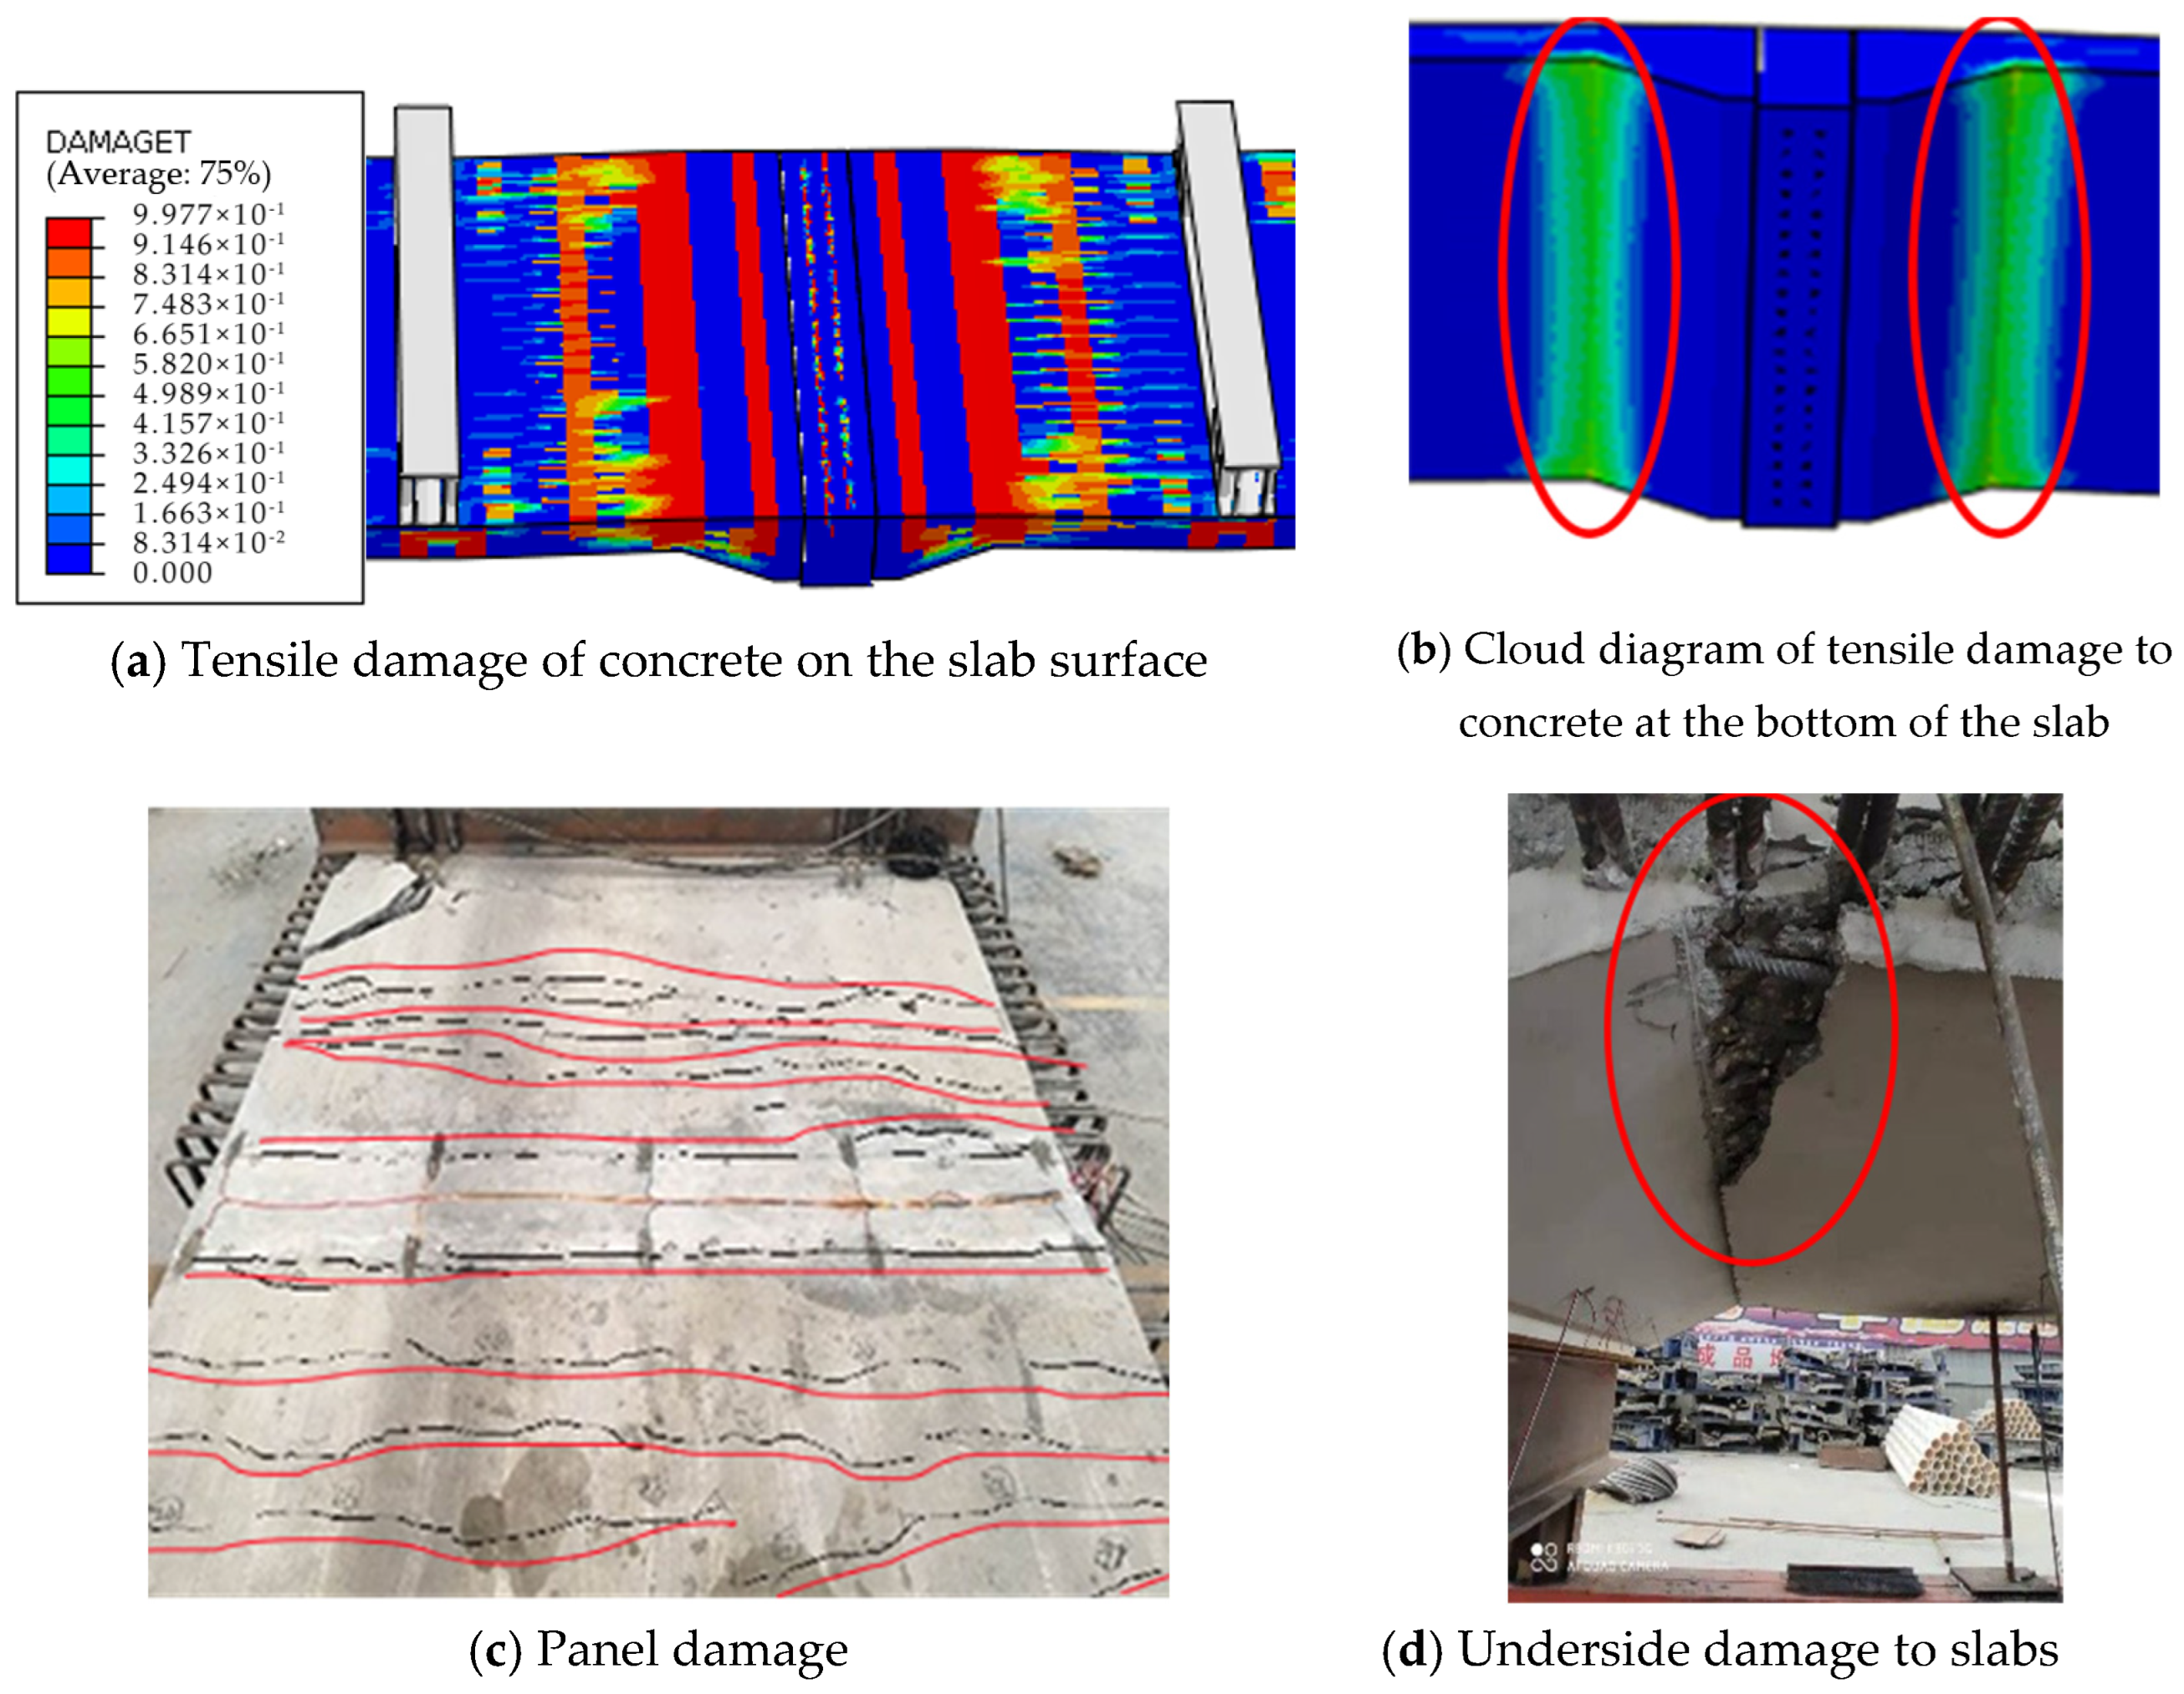
4.3. Analysis of Numerical Calculation Results

(1) Load-Displacement Curve
As depicted in Figure 16, the numerical analysis results reveal that the displacement obtained from the finite element model follows a pattern consistent with experimental results as the load varies: the ultimate bearing capacity and ultimate displacement are close, with errors not exceeding 10%. Moreover, both exhibit consistent load-displacement variations, categorized into three stages: (1) linear elastic stage, during which displacement changes minimally, and the structure’s stiffness remains unaffected. (2) Appearance and propagation of cracks stage, characterized by an increased rate of displacement growth and decreasing stiffness. (3) Failure stage, where the model is nearing failure, rebar yielding occurs at the section, leading to a rapid increase in displacement and significant stiffness reduction.
(2) Concrete Damage
As shown in Figure 17, the plastic damage model for concrete material in the ABAQUS software effectively identifies the location of plastic damage in the model. Although this model cannot precisely determine the position of “cracks”, it aids in identifying the location of damage, indicating the formation and expansion of cracks. At the ultimate load, as depicted in Figure 17, the damage locations in the model are consistent with the positions of cracks observed in experiments, mainly occurring at the interface of wet joints, both sides of the panel, and the bottom of the loaded position. Viewing from the side of the panel, damage mainly occurs at the section and extends to the loaded position. Figure 17a,b demonstrates that the simulated concrete damage locations align well with the experimental crack initiation and failure positions. Thus, this finite element model effectively simulates the loading process of the specimen, providing a modeling foundation for subsequent theoretical research.

5. Conclusions

Utilizing full-scale model tests, the flexural behavior of Ultra-High-Performance Concrete (UHPC) wet joints with variable cross-section precast reinforced concrete bridge decks under negative bending moments was investigated. The following conclusions were drawn from experimental analysis:
(1)
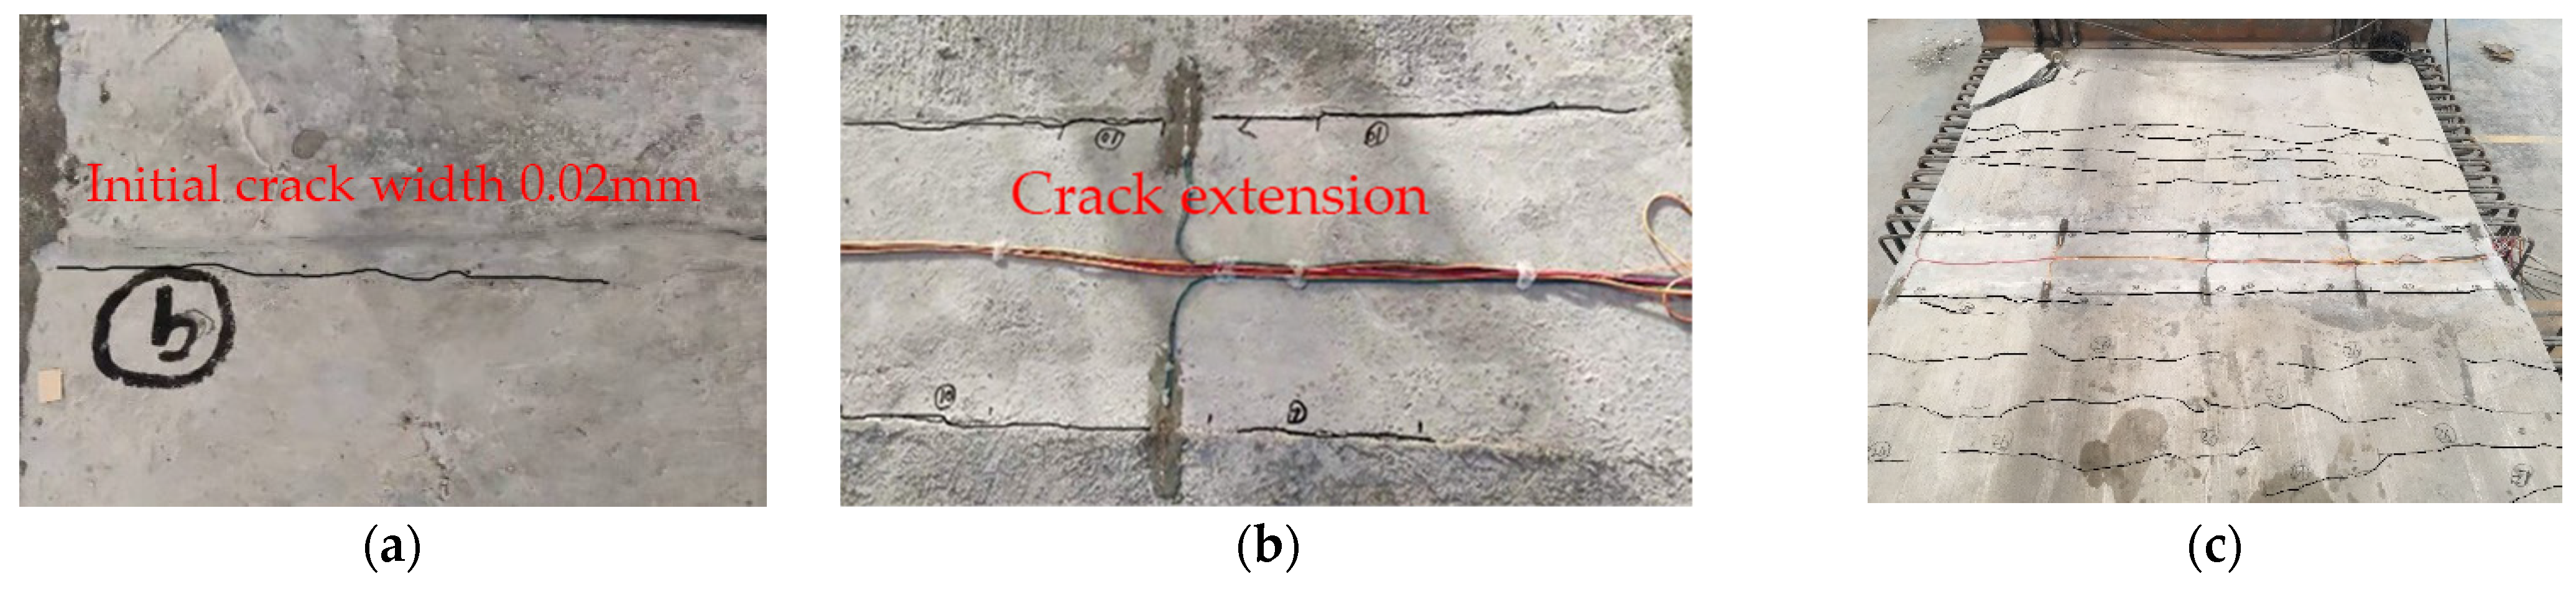
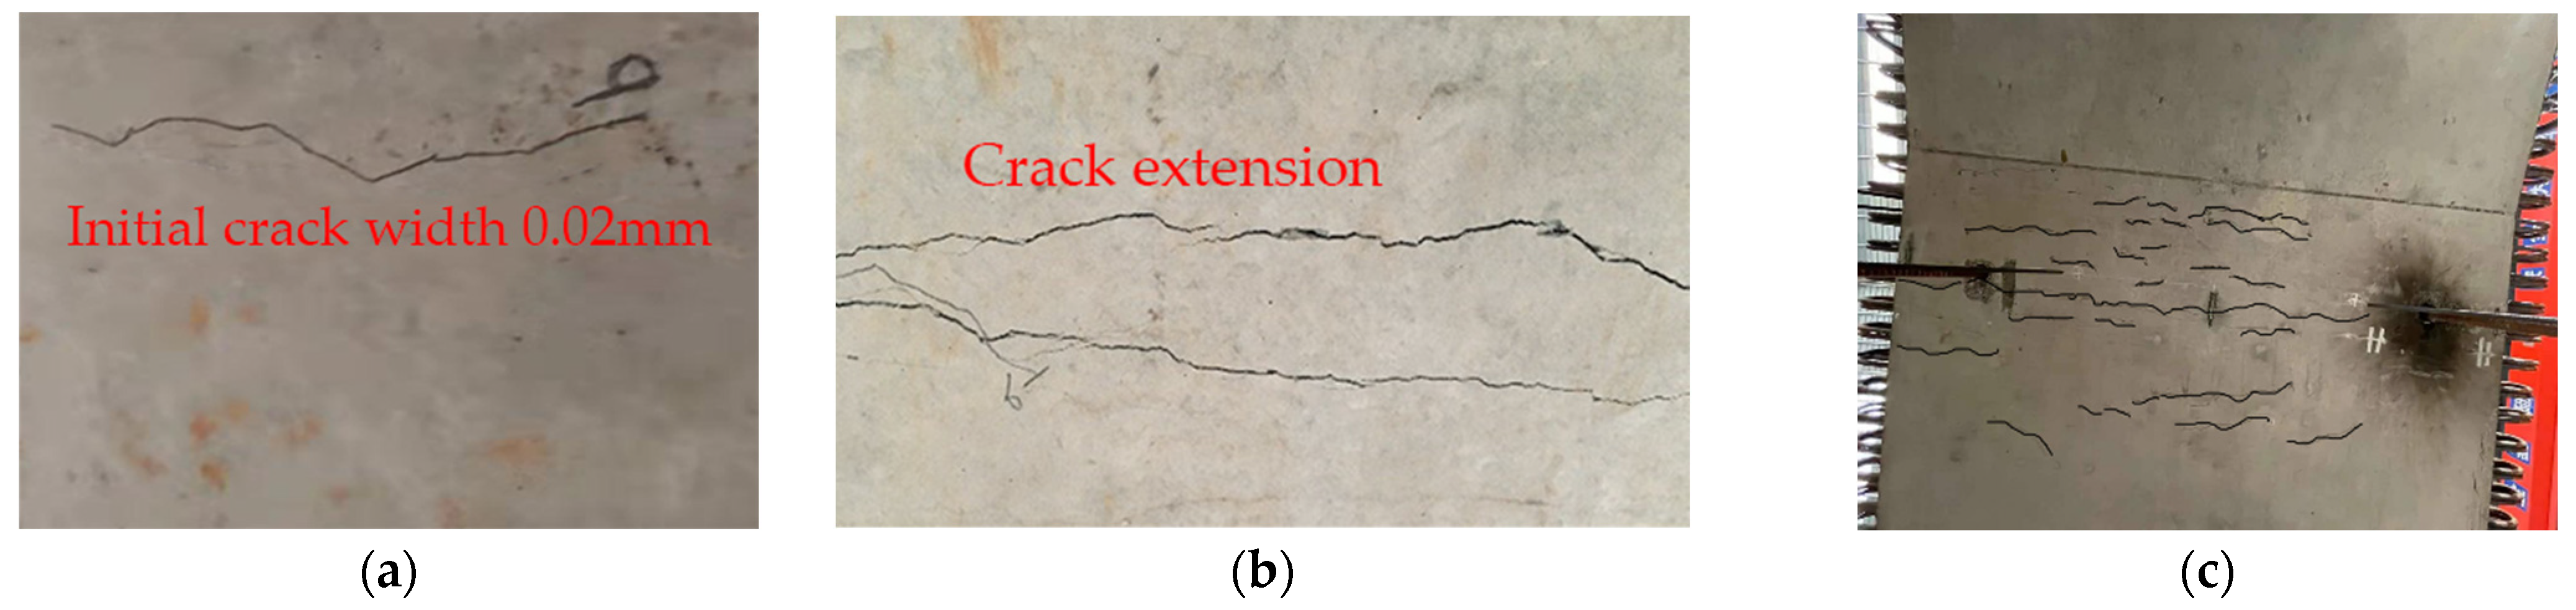
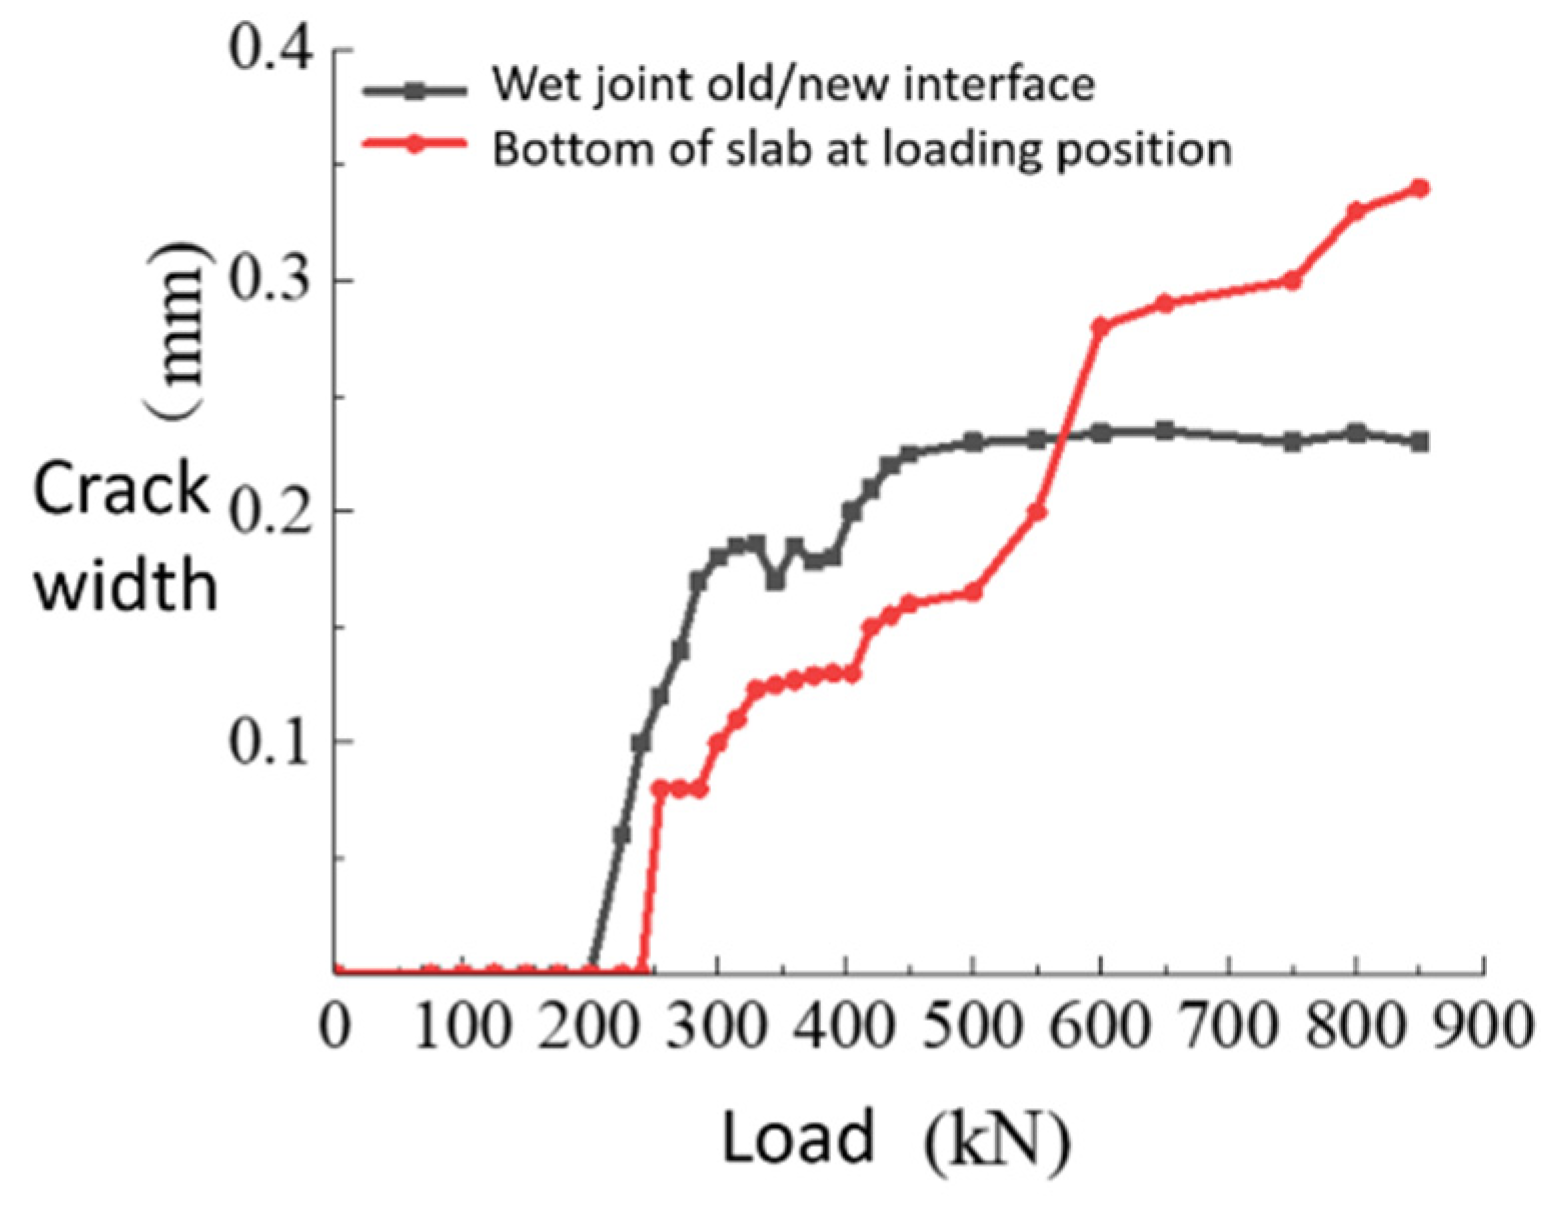
During loading, cracking initially occurred at the interface between new and old concrete of the wet joint, with a maximum crack width of 0.24 mm. As the load increased, minor cracks appeared on both sides of the wet joint, and cracking occurred at the bottom of the deck at the loading location, with a maximum crack width of 0.34 mm. The specimen ultimately failed near the variable cross-section location adjacent to the wet joint. The initial cracking load was 0.27 times the failure load (225 kN), with a failure load of 822 kN, and the maximum displacement was 21.64 mm.
(2)
Apart from the interface between new and old concrete, no cracks appeared at other locations of the wet joint, indicating that the use of UHPC wet joints with variable cross-section bridge decks significantly improves crack resistance under negative bending moments, meeting design requirements with good mechanical performance. The most critical position for wet joint failure in variable cross-section bridge decks is at thinner deck thicknesses and their variable cross-section locations.
(3)
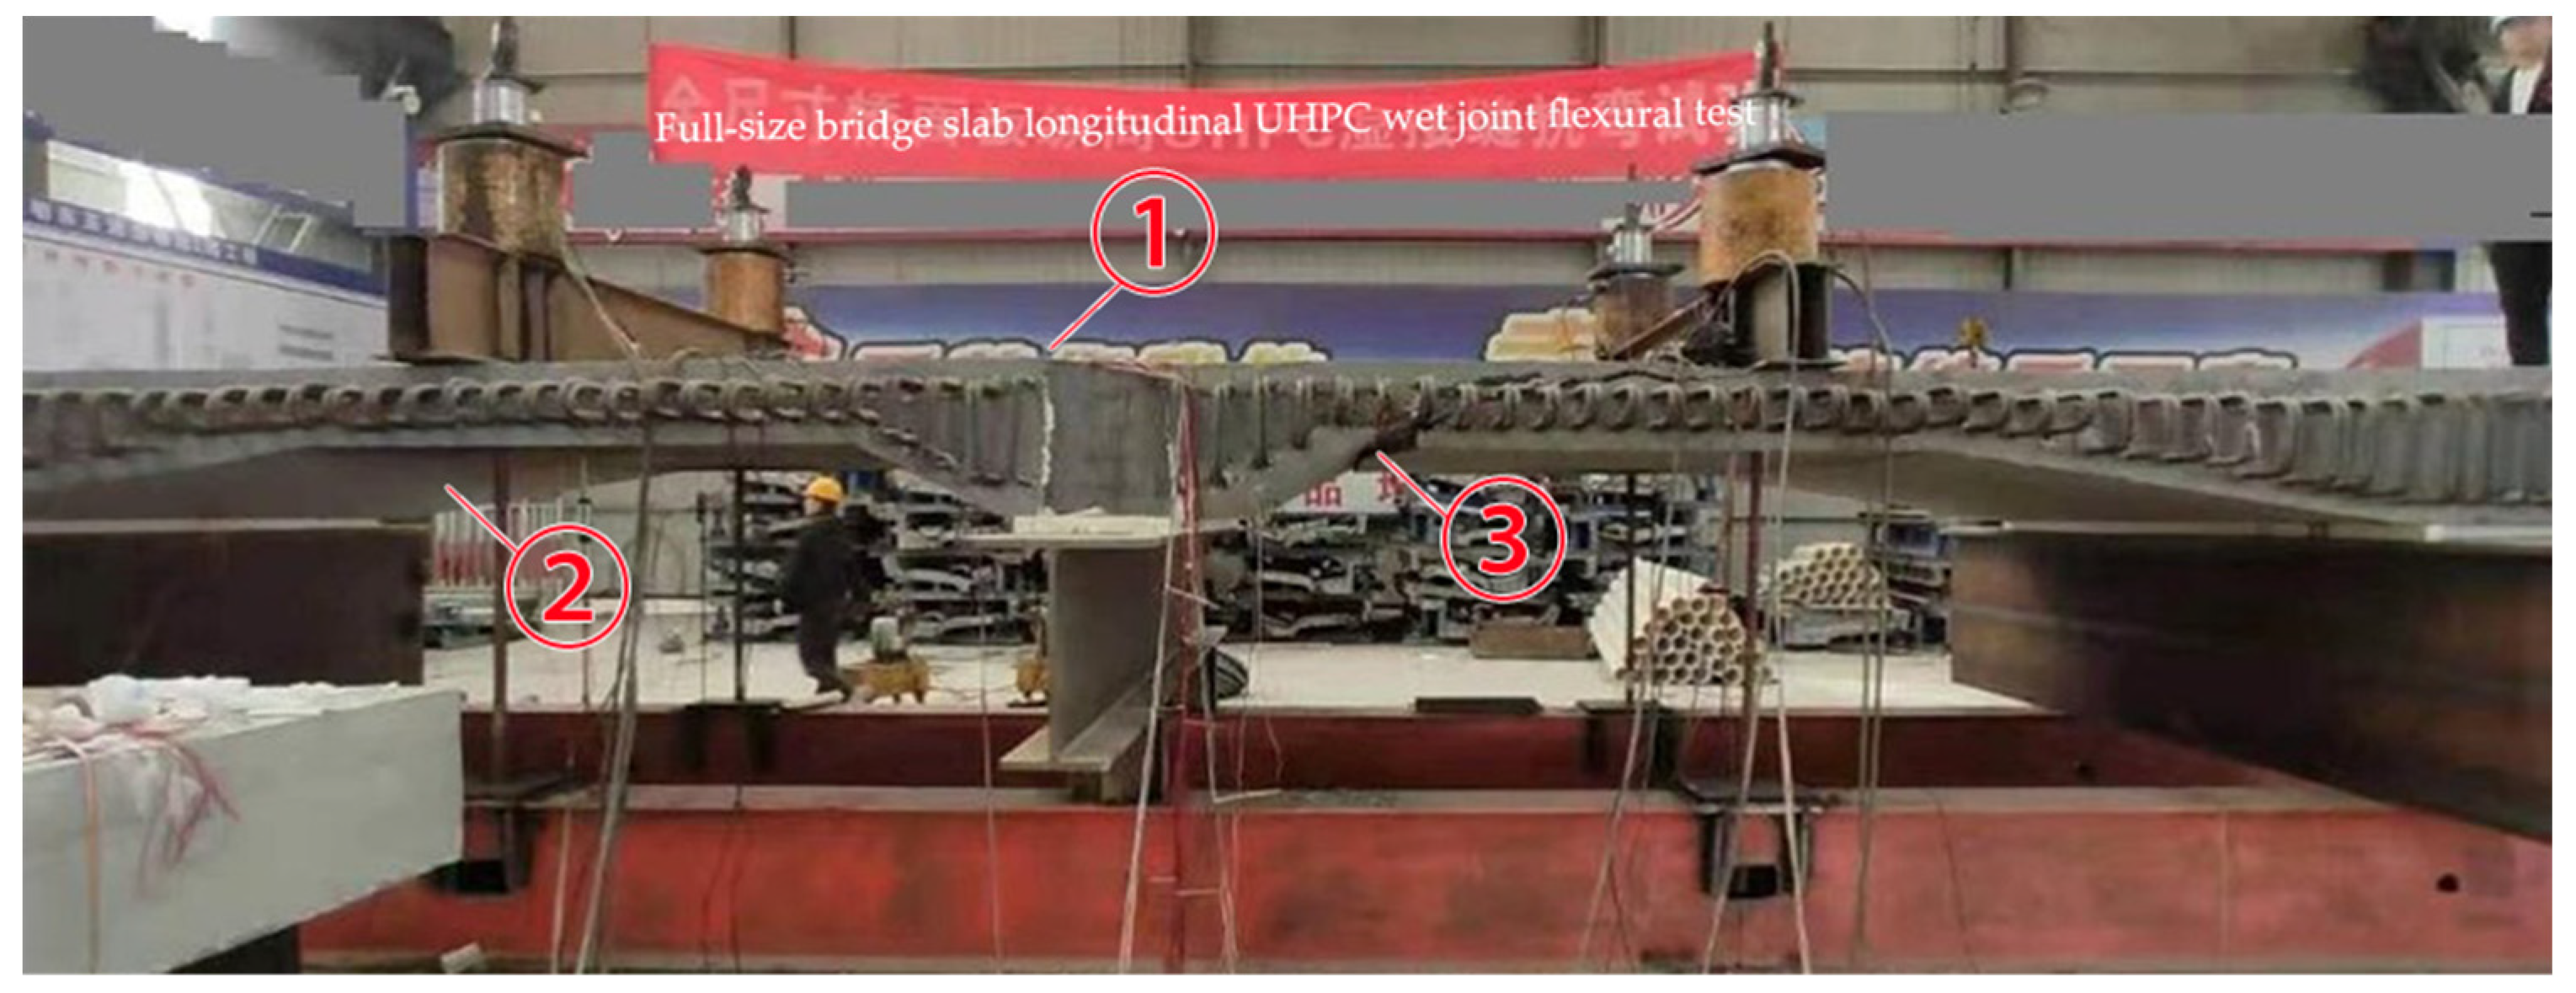
In contrast to the failure pattern of uniform cross-section bridge decks, where failures often occur at wet joint locations, the failure mode of variable cross-section precast reinforced concrete bridge decks with UHPC wet joints involves flexural–shear failure near the variable cross-section of the wet joint. Vertical cracks initiate at the bottom of the deck and propagate upwards, evolving into diagonal cracks. From a lateral view, a major diagonal crack rapidly forms and extends to the edge of the load-bearing pad, ultimately resulting in the concrete specimen tearing into two parts and losing its load-bearing capacity.
(4)
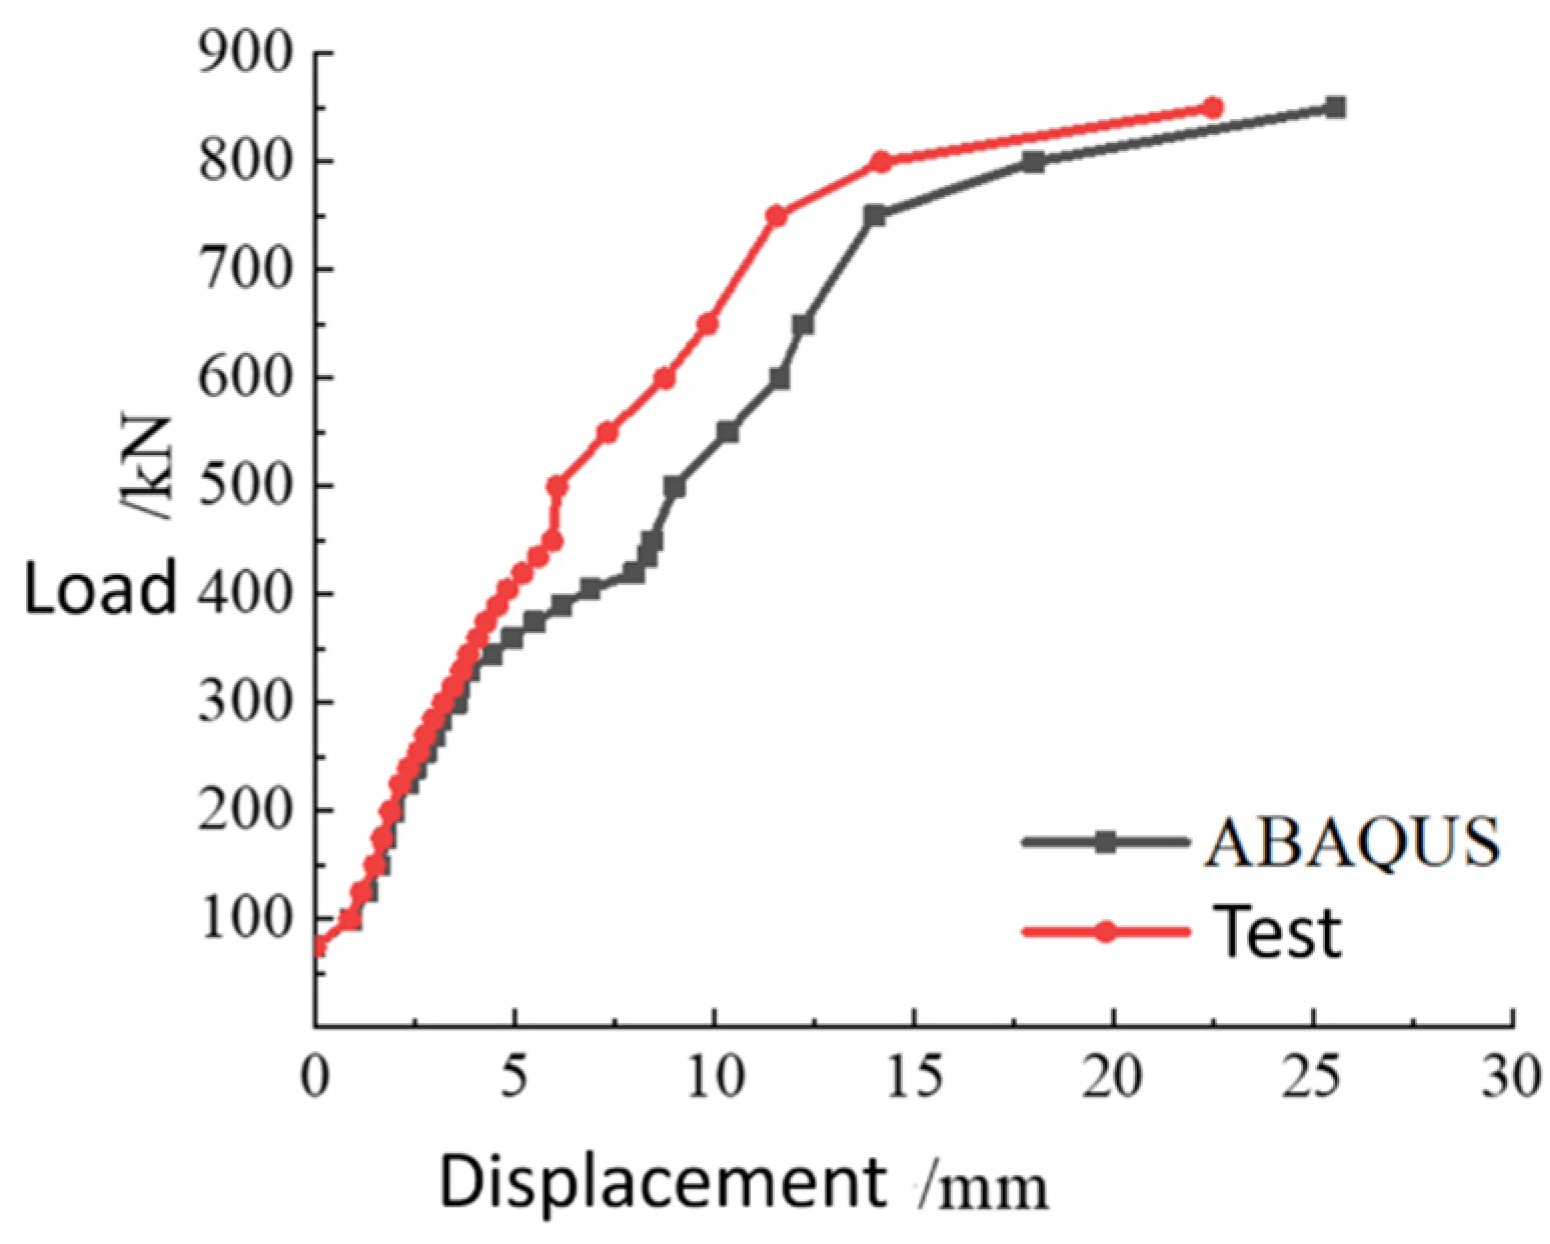
Displacement variation computed by the finite element model closely matches experimental results: both exhibit similar ultimate bearing capacities and ultimate displacements, with errors not exceeding 10%. Moreover, both follow similar load-displacement variation patterns, divisible into three stages. Employing the plastic damage model of concrete materials in ABAQUS software effectively identifies the position of plastic damage in the model. While this model cannot precisely pinpoint crack locations, it aids in determining damage locations and predicting the formation and propagation of cracks, with simulated concrete damage locations closely resembling experimental crack initiation and failure locations.

Author Contributions

Conceptualization, J.Y.; Methodology, Y.S.; Resources, X.H.; Writing—original draft, J.H.; Supervision, Y.G. All authors have read and agreed to the published version of the manuscript.

Funding

National Natural Science Foundation of China, Funding Number: 52278159.

Institutional Review Board Statement

Not applicable.

Informed Consent Statement

Not applicable.

Data Availability Statement

The raw data supporting the conclusions of this article will be made available by the authors on request.

Acknowledgments

This study was funded by the National Natural Science Foundation of China, Funding Number: 52278159. We are grateful to Ming Li and Hongliang Xu for providing us with the necessary experimental sites and for working closely with us on the study and the design of the experimental protocol.

Conflicts of Interest

The authors declare no conflict of interest.

References

  1. Deng, S.; Shao, X.; Yan, B.; Guan, Y. Fully prefabricated rapid erection steel-UHPC lightweight combination urban bridge. Natl. Highw. J. 2017, 30, 159–166. [Google Scholar]
  2. Zhang, Q.; Cai, S.; Wang, S.; Wang, L.; Zhai, J. Flexural test analysis of steel-UHPC combined beams in negative moment zone. Munic. Technol. 2020, 38, 41–45. [Google Scholar]
  3. Zhang, Y.; Cao, S.; Ye, P.; Chen, J.; Tian, H. Experimental study on mechanical properties of U-shaped steel wet joints in steel plate girder bridges. China Munic. Eng. 2019, 5, 95–97. [Google Scholar]
  4. Zhang, Y.; Chen, B. Finite element analysis study on flexural performance of cast-in-place UHPC joints of prefabricated NC slab. Highw. Eng. 2018, 43, 1–5+51. [Google Scholar]
  5. Zhong, Y.; Wu, F.; Dai, L. Flexural performance test of ultra-high performance concrete beams with wet joints. Water Transp. Eng. 2020, 41–46. [Google Scholar]
  6. Zhang, P.; Hu, R.; Zou, X.; Liu, Y.; Li, Q.; Wu, G.; Sheikh, S.A. Experimental study of a novel continuous FRP-UHPC hybrid beam. Compos. Struct. 2021, 261, 113329. [Google Scholar] [CrossRef]
  7. Perry, V.H.; Royce, M. Innovative Field Cast UHPC Joints for Precast Bridge Decks. In Proceedings of the 2010 Concrete Bridge Conference; Achieving Safe, Smart & Sustainable Bridges, Phoenix, AZ, USA, 24–26 February 2010; Nation Concrete Bridge Concil: Phoenix, AZ, USA, 2010; pp. 197–213. [Google Scholar]
  8. Carbonell, M.A.; Harris, D.H.; Shann, S.V.; Ahlborn, T.M. Bond strength between UHPC and normal strength concrete (NSC) in accordance with split prism and freeze-thaw cycling tests. In Proceedings of the 3rd International Symposium on UHPC and Nanotechnology for High Performance Construction Materials, Kassel, Germany, 7–9 March 2012; pp. 377–384. [Google Scholar]
  9. Yuan, J.; Jia, Y.; Yan, B. Study on flexural performance of rectangular UHPC wet joints. Highw. Eng. 2020, 45, 129–134. [Google Scholar]
  10. Zhou, R. Study on the force characteristics of wet joints of prefabricated bridge decks. Shanghai Highw. 2020, 2, 73–78. [Google Scholar]
  11. Zhu, Y.; Ding, D. Research on lap length of ring reinforcement in wet joints of precast concrete beams. Highway 2015, 60, 89–93. [Google Scholar]
  12. Tian, F. Structural Performance and Experimental Study of Continuous Girder Bridge with Steel-Precast Concrete Slab Combination. Master’s Thesis, Southeast University, Nanjing, China, 2016. [Google Scholar]
  13. Su, Q.; Hu, Y.; Tian, L.; Zeng, M. Arc-shaped reinforcement connection structure for wet joints of combined girder bridge deck slabs. Chin. J. Highw. 2017, 30, 86–92. [Google Scholar]
  14. Cao, S.; Zhang, Y.; Ma, Q.; Ma, R.; Tian, H. Experimental study on mechanical properties of transverse U-bar wet joints in steel plate composite girder bridges. Bridge Constr. 2020, 50, 70–75. [Google Scholar]
  15. Zhao, C.; Wang, K.; Zhou, Q.; Deng, K.; Cui, B. Full-Scale Test and Simulation on Flexural Behavior of Dovetail-Shaped Reactive Powder-Concrete Wet Joint in a Composite Deck System. J. Bridge Eng. 2018, 23, 04018051. [Google Scholar] [CrossRef]
  16. Di, J.; Han, B.; Qin, F. Investigation of U-bar joints between precast bridge decks loaded in combined bending and shear. Structures 2020, 27, 37–45. [Google Scholar] [CrossRef]
  17. Yao, Z.; Yan, B. Research on model test and bending performance of assembled UHPC bridge with wet joint. Highw. Eng. 2020, 45, 105–110, 138. [Google Scholar]
  18. Shao, X.; Chen, B.; Zhou, X. Wet joint bending test of steel-RPC lightweight combination bridge deck structure. Chin. J. Highw. 2017, 30, 210–217. [Google Scholar]
  19. Ramezani, M.; Dehghani, A.; Sherif, M.M. Carbon nanotube reinforced cementitious composites: A comprehensive review. Constr. Build. Mater. 2022, 315, 125100. [Google Scholar] [CrossRef]
  20. Shang, X.Y.; Yu, J.T.; Li, L.Z.; Lu, Z.D. Strengthening of RC structures by using engineered cementitious composites: A review. Sustainability 2019, 11, 3384. [Google Scholar] [CrossRef]
  21. Shen, Y.; Guo, W.; Han, Z.; Fan, T. Experimental study on pure bending damage behaviour of concrete bridge deck slabs with wet joints. Bridge Constr. 2019, 49, 34–39. [Google Scholar]
  22. Zhang, J.; Huang, S.; Guan, Z. Static load test of longitudinal U-bars of prefabricated small box girder with staggered lap joints. Chin. J. Highw. 2018, 31, 115–123. [Google Scholar]
  23. Hussein, H.H.; Walsh, K.K.; Sargand, S.M.; Al Rikabi, F.T.; Steinberg, E.P. Modeling the Shear Connection in Adjacent Box-Beam Bridges with Ultrahigh-Performance Concrete Joint. I: Model Calibration and Validation. J. Bridge Eng. 2017, 22, 04017043. [Google Scholar] [CrossRef]
  24. GB50010-2010; Code for Design of Architecture & Concrete Structures. China Architecture & Building Press: Beijing, China, 2010.
Figure 1. Schematic diagram of bridge deck slab and wet joints.
Applsci 14 03028 g001aApplsci 14 03028 g001b
Figure 2. Arrangement of measuring points for the longitudinal joint test of full-scale bridge deck (unit: mm).
Applsci 14 03028 g002
Figure 3. Load-displacement curve.
Applsci 14 03028 g003
Figure 4. Comparison of concrete strain at key measurement point locations.
Applsci 14 03028 g004
Figure 5. Load–strain diagram of reinforcement at the old and new interfaces of wet joints.
Applsci 14 03028 g005
Figure 6. Concrete load–strain curve. (a) Old and new interfaces and loading locations concrete load-strain. (b) Concrete load strain near the base of the shear channel variable section and wet joint slabs. (c) Concrete load strain on the slab side.
Applsci 14 03028 g006
Figure 7. Final failure of the test.
Applsci 14 03028 g007
Figure 8. Expansion process of concrete cracks at the old and new interfaces of wet joints. (a) Initial cracking of concrete at the old/new interface of wet joints. (b) Expansion of concrete cracks at the old and new interfaces of wet joints. (c) Cracking of concrete slabs.
Applsci 14 03028 g008
Figure 9. Expansion process of concrete cracks at the bottom of the slab at the loading place. (a) Initial cracking of concrete at the bottom of the slab at the loading position. (b) Expansion of cracks in the concrete at the bottom of the slab at the loading position. (c) Cracking of concrete at the bottom of the slab at the loading position.
Applsci 14 03028 g009
Figure 10. Damage to bridge deck slabs at various locations. (a) Damage on the slab side. (b) Damage at variable section locations.
Applsci 14 03028 g010
Figure 11. Bridge deck slab load—crack widths.
Applsci 14 03028 g011
Figure 12. Finite Element Modelling of UHPC Wet Joint Flexural Test.
Applsci 14 03028 g012
Figure 13. Full-size bridge deck UHPC wet joint flexural test model.
Applsci 14 03028 g013
Figure 14. Stress–strain curve of concrete under compression in CDP.
Applsci 14 03028 g014
Figure 15. Tensile stress-strain curve of steel bar.
Applsci 14 03028 g015
Figure 16. Comparison of load-displacement results.
Applsci 14 03028 g016
Figure 17. Comparison of damage results.
Applsci 14 03028 g017
Table 1. Parameters of the cohesion model [23].
CausalitySmoothnessRoughnessRougher
Knn (N/mm3)135813581358
Kss, Ktt (N/mm3)20,35820,35820,358
s n 0 ,   s s 0 ,   s t 0 3.025.015.63
Totle, plastic displacement (mm)0.0180.1170.241
Disclaimer/Publisher’s Note: The statements, opinions and data contained in all publications are solely those of the individual author(s) and contributor(s) and not of MDPI and/or the editor(s). MDPI and/or the editor(s) disclaim responsibility for any injury to people or property resulting from any ideas, methods, instructions or products referred to in the content.

