Article

Modulation of the Cellular Microenvironment by Mechanical Fluid Shear Stress and Hypoxia Alters the Differentiation Capacity of Skeletal Muscle-Derived Stem Cells

1
Institute of Veterinary Anatomy, Histology and Embryology, Justus-Liebig-University of Giessen, 35392 Giessen, Germany
2
Clinic of Small Animals, c/o Institute of Veterinary Anatomy, Histology and Embryology, Justus-Liebig-University of Giessen, 35392 Giessen, Germany
*
Author to whom correspondence should be addressed.
These authors contributed equally to this work.
Appl. Sci. 2024, 14(7), 3047; https://doi.org/10.3390/app14073047
Submission received: 15 March 2024 / Revised: 1 April 2024 / Accepted: 3 April 2024 / Published: 4 April 2024

Abstract

:
Skeletal muscle-derived stem cells (MDSCs) are the key modulators of muscle regeneration. An inappropriate cellular microenvironment can reduce the regenerative capacity of MDSCs. This study evaluates the effect of microenvironmental alterations on the cell differentiation capacity using either mechanical fluid shear stress (FSS) or hypoxic conditions. C2C12 mouse myoblasts were differentiated under cyclic FSS (CFSS), periodic FSS (PFSS) for one hour, and hypoxia (3% O2) for up to seven days. Cell proliferation and myogenic differentiation capacities were evaluated using cell viability assays, immunohistochemical staining, and morphometric analysis. The expression of MyoD, myogenin, myosin heavy chain, nitric oxide, hypoxia-inducible factor 1 alpha (HIF1α), vascular endothelial growth factor (VEGF) and mammalian target of rapamycin (mTOR) was quantified by means of RT-qPCR. The data showed that FSS conditions altered cell morphology and increased cell viability and cell distribution compared to static conditions. MyoD and myogenin expression was upregulated under both FSS conditions. CFSS induction improved myogenic differentiation parameters including myotube number, size and fusion capacity. Although hypoxia enhanced cell viability compared to normoxia, it reduced differentiation capacity, as indicated by the downregulation of myogenin and mTOR expression, as well as reducing myotube formation. Under hypoxic conditions, increased nitric oxide production and upregulation of VEGF expression were detected for up to 72 h. The data suggest an improved myogenic differentiation capacity under mechanical FSS; in contrast, the cell differentiation capacity was impaired under hypoxic conditions. The data point out that optimizing the biomechanical and oxidative stressors in the cellular microenvironment could improve stem cell transplantation and enhance their regenerative potential in the context of cell-based therapies.

1. Introduction

Skeletal muscle degeneration causes physical disability and reduces quality of life as described in muscular dystrophies, neuromuscular diseases, and cancer cachexia. Additionally, muscle injuries resulting from prolonged exercise and trauma are well documented [1,2]. Recently, skeletal muscle-derived stem cells (MDSCs) have been introduced as a powerful tool to improve muscle regeneration. Following muscle injury, MDSCs undergo cyclic division to restore cell numbers and express specific myogenic regulatory factors (MRFs), including MyoD and myogenin [3]. Simultaneously, cells are committed to a myogenic differentiation fate, and a small population returns to quiescence to maintain the stem cell pool [4]. The combined expression of these myogenic factors leads to the activation of myogenic regulatory factor 4 (MRF4) and the expression of muscle fiber-specific contractile proteins [5]. MRF4 plays a role in the maturation of myotubes into adult muscle fibers [6].
Physical activity induces mechanical stress, which can alter gene expression and lead to adaptations in muscle protein synthesis, as well as affecting the performance of MDSCs [7,8]. Studies have shown that cells change their physiological parameters, such as proliferation and differentiation, in response to mechanical stimulation, and the observed changes were influenced by various factors including cell–matrix interaction, substrate properties, and external forces such as expansion, compression, and shear stress [8,9,10]. The adaptation of cells is characterized by alterations in cell focal adhesion and the remodeling of cytoskeletal proteins, which activate mechanosensitive ion channels, leading to changes in gene expression and cell fate [7,8]. The application of stretch stress modulates cell differentiation based on the direction, magnitude, frequency, and duration of the force applied [8]. Research has shown that while stretch stress promotes the osteogenic differentiation of mesenchymal stem cells (MSCs) in humans [11], it inhibits adipogenic differentiation [12]. Similarly, stretching stress increases the size of myotubes in vitro by promoting protein synthesis and hypertrophy [13]. In this context, stretching muscle fibers not only activates MDSCs in their niche but also enhances their proliferative capacity in vitro [7,14]. Additionally, mechanical stress has been shown to trigger Ca2+ flow into quiescent cells, inducing cyclic division [15]. Previous studies have shown that pressure stress can enhance the osteogenic and chondrogenic differentiation of MSCs [16,17]. Additionally, cyclic compression has been found to increase the regenerative capacity of MSCs in the tibialis anterior muscle following injury in mice [18]. The effect of fluid shear stress on the differentiation fate of MSCs is dependent on various parameters, such as strength, frequency, direction, and duration [19]. Meanwhile, the application of FSS has different effects on cell differentiation depending on the intensity. Although intensive FSS promoted cardiovascular cell differentiation [20], a less intensive FSS was required to drive the osteogenic differentiation of MSCs [21]. In skeletal muscle, the interstitial fluid generates physiological local pressure during muscle contraction [7,22]. Applying approximately 0.4–1.4 Pa of pulsed FSS on C2C12 myotubes activates the signaling pathways involved in muscle fiber size alteration [23]. A study demonstrated that an FSS of 0.016 Pa enhanced myogenic differentiation by upregulating myogenic differentiation markers and promoting extensive myotube formation [24]. Furthermore, FSS increased nitric oxide (NO) production, cell adhesion, and cell proliferation in mouse MDSCs [25].
The oxygen concentration in tissues is typically around 3%. However, in skeletal muscles, it is approximately 5% [26]. Modulating the oxygen concentration can affect the regenerative capacity of MDSCs. A study demonstrated changes in cell proliferation, migration, differentiation capacities, and cell death under hypoxia [27,28,29]. Meanwhile, short-term hypoxia has been shown to have a positive effect on wound healing, including the activation of MDSCs, angiogenesis, and phagocytic infiltration [30]. However, long-term hypoxic conditions can result in muscle wasting, as seen in chronic obstructive pulmonary disease [31,32]. Under chronic hypoxia conditions, the oxidative capacity of muscle fibers is reduced, leading to muscle atrophy [33,34] due to promoted catabolic activities and impaired regeneration [35]. Likewise, cultivating neural crest cells under hypoxic condition resulted in increased cell proliferation and differentiation, as well as reduced cell death [36]. A study found that a 3–6% O2 concentration not only improved the proliferation and myogenic differentiation of MDSCs, but also it reduced the apoptotic activities and inhibited the accumulation of reactive oxygen species [28,37,38]. Previous studies have reported the effect of hypoxia on cell division. One study found that hypoxia condition promotes cell cycle progression and inactivates cell cycle inhibitors [37]. However, hypoxia can also inhibit differentiation, as evidenced by the downregulation of MRFs and the reduction in myotube formation in muscle cells [39,40]. In addition, hypoxia has been found to inhibit the final stage of myogenic differentiation by reducing MyoD expression [39,41]. In the same context, studies have found that hypoxia inhibits protein synthesis by interfering with Akt/mTOR signaling [41,42,43]. Conversely, hypoxia stimulates the quiescence and self-renewal of primary myoblasts by activating the Notch signaling pathway [44,45]. Studies have found that primary satellite cells and myoblasts have an increased multipotency under hypoxia, leading to adipogenic and osteogenic fate [40,46]. Hypoxia-inducible factor-1 alpha (HIF-1α) is a well-established master regulator of oxygen homeostasis that activates angiogenesis by upregulating vascular endothelial growth factor (VEGF) expression [29,47]. This improves the regeneration of ischemic lesions [48]. Neuronal nitric oxide synthase (nNOS/NOS1) is mainly expressed in skeletal muscle and appears to play an important role under hypoxia [49,50]. To determine the optimal microenvironment for myogenic differentiation of MDSCs, the present study evaluates the effects of various models of mechanical fluid shear stress, including cyclic and periodic stress, as well as modulated oxygen concentration, on the physiological parameters and differentiation capacity of muscle stem cells. To achieve our goal, we evaluated cell viability, cell number, and differentiation parameters using standard biological assays, immunohistochemical analysis, morphometric measurement, and the quantification of the relative gene expression. The results provide evidence of enhanced myogenic differentiation capacity under mechanical FSS, suggesting that optimized mechanical FSS stress could improve cell performance and their regenerative potential for clinical applications. Although enhanced angiogenesis and NO production occur under hypoxia, the data suggest that the myogenic differentiation of MDSCs is impaired under hypoxia. This highlights the importance of suitable oxygen concentrations for muscle differentiation.

2. Materials and Methods

2.1. Cell Culture

The C2C12 mouse myoblast cell line is a well-established immortalized satellite cell-derived myoblast. These cells were isolated from the thigh muscles of two-month-old female CH3 mice at 70 h after a crush injury [51]. Myoblasts were cultured in T-75 cell culture flasks under standard incubation conditions at 37 °C and 5% CO2 in 4.5g/L Dulbecco’s modified Eagle’s medium (DMEM, Gibco, Life Technologies, Darmstadt, Germany) supplemented with 10% fetal calf serum (FCS, Capricorn, Ebsdorfergrund, Germany) and 1% penicillin/streptomycin (P/S, Gibco, Life Technologies, Darmstadt, Germany). The medium was changed every two days. At 60% confluency, the cells were washed with 5 mL of prewarmed phosphate-buffered saline (PBS, Gibco, Life Technologies, Darmstadt, Germany). Subsequently, they were trypsinized with TrypLE (Gibco, Life Technologies, Darmstadt, Germany) for five minutes. Cell detachment was confirmed using a phase contrast microscope, and the reaction was inhibited by adding an equal volume of growth medium. The cell suspension was centrifuged at 240× g for five minutes at room temperature. The resulting cell pellet was then resuspended in fresh growth medium. The cell count was determined using a hemocytometer. Subsequently, the cells were subcultivated in 24-well culture plates for further experiments. Only cells from passages 13–15 were used for all experiments.

2.2. Myogenic Differentiation

C2C12 were cultivated at 1 × 10⁴ cells per well in culture plates (VWR, Darmstadt, Germany), which were precoated with 0.1% collagen in 0.1 M acetic acid. After 48 h, the growth medium was replaced with myogenic differentiation medium (MD), which consisted of DMEM-LG, supplemented with 2% horse serum (HS, Millipore, Darmstadt, Germany). The plates were divided into three groups: static, periodic fluid shear stress (PFSS), and cyclic fluid shear stress (CFSS) conditions. They were then incubated for up to seven days with a regular medium which was changed twice per week. FSS was induced by incubating the culture plates on a horizontal rocking system previously established in the cell culture incubator with a rocking angle of 10°. The rocking frequency was determined to be 10 cycles per min with an optimized force that kept the cells covered with the medium throughout the entire rocking period. The liquid viscosity was assumed to be 10−3 Pa s, and the FSS was calculated using the following previously reported formula [52].
τ = π μ θ max 2 δ 2 T
  • τ = FSS (Pa)
  • µ = Fluid viscosity (Pa s)
  • θmax = Maximum rocking angle (rad)
  • δ = Liquid depth/length-ratio (h0/(2R))
  • h0 = Liquid depth (mm)
  • R = Radius of the cultivation plate (mm)
  • T = Rocking period, duration of one cycle (s)
Briefly, cells were exposed to two different types of fluid shear stress: (1) CFSS, which was applied in a 24-well culture plate with a base area of 1.93 cm2. To achieve a liquid depth of 2.59 mm, the medium was reduced to 500 µL per well. Based on the formula, the FSS on the bottom of the culture plate was calculated to be 1.68 mPa; (2) PFSS, which was applied for only 1 h per day in 12-well culture plates with a base area of 3.85 cm2. The volumes of reagents and media, as well as the number of cells seeded, were adjusted accordingly. A medium volume of 1205 µL per well was chosen to expose the cells to the FSS, corresponding to a liquid depth of 3.13 mm. The FSS on the bottom of the culture plate was calculated to be 2.3 mPa. The cells were provided with fresh medium twice a week. Cells were also cultivated in parallel under static conditions, serving as controls. The effects of CFSS and PFSS on cell viability and proliferation capacity were assessed at 3 h, 24 h, and 72 h. Meanwhile, MD capacity was evaluated at 3 h, 3 d, and 7 d post-induction. The cells were fixed in 4% paraformaldehyde (PFA, Carl Roth, Karlsruhe, Germany) stored in PBS at 4 °C until further use.

2.3. Hypoxia Induction

To examine the effects of hypoxic conditions on the proliferation and differentiation of C2C12 myoblasts, the cells were differentiated under hypoxia in an O2-controlled incubator with a 3% O2 concentration compared to normoxia (21% O2) for 3 h, 3 d, and 7 d.

2.4. Colony Formation Unit Assay

The colony-forming unit (CFU) assay can be used to determine the colony-forming efficiency of cells and thus their stemness potential. Myoblasts were seeded at concentrations of 1 × 10², 5 × 10², and 1 × 10³ cells per flask in 8 mL of growth medium in T-25 culture flasks and incubated for seven days under either mechanical FSS or hypoxic conditions. Prior to FSS being carried out, the medium was optimized to 4 mL with a medium change every 2–3 days. On the seventh day, the medium was removed, and the cells were washed with prewarmed PBS. Subsequently, they were fixed with 4% PFA for 20 min and stored in PBS at 4 °C until further use. Before staining, the cells were washed with distilled water for 5 min and then incubated with 4 mL of a crystal violet solution (Carl Roth, Karlsruhe, Germany) per culture flask for 8 min at room temperature. Finally, the cells were washed with distilled water for 3 min to remove any unbound staining. The culture flasks were dried overnight at room temperature. The cell colonies were identified using violet staining and an inverted light microscope equipped with a Leica MC170 HD camera (Leica Microsystems, Wetzlar, Germany) and operated with LAS V4.4 software (Leica, Wetzlar, Germany). The number and area of the colonies were quantified using ImageJ 1.53a software (Wayne Rasband, National Institutes of Health, Bethesda, MD, USA).

2.5. MTT Assay

The MTT (3-(4,5-dimethylthiazol-2-yl)-2,5-diphenyltetrazolium bromide) assay is a biochemical method used to measure cell viability based on metabolic activity in cell cultures. Myoblasts were seeded at a density of 1 × 10⁴ cells/well for 3 h, 24 h, and 72 h in a growth medium in 24-well plates under both FSS and hypoxic conditions. After discarding the medium, the cells were incubated with 300 μL of growth medium containing 0.5 mg/mL MTT per well at 37 °C and 5% CO2 for 2 h. The cells were incubated with 200 μL of dimethylsulfoxide per well for an additional 10 min at room temperature. Afterward, the supernatant was discarded and, the solution was transferred in triplicates into a 96-well microplate. The intensity of the blueness of the formazan solution was determined photometrically by measuring the optical density at 570 nm absorbance using a microplate reader equipped with Magellan TM Data Analysis V2.30 Software (Tecan, Männedorf, Switzerland).

2.6. Sulforhodamine B Assay

The sulforhodamine B (SRB) assay was used to determine the total protein content for the cell population, which can be used to indirectly measure the cell number, as previously reported [53]. Cells at a population of 1 × 10⁴ were cultivated in a growth medium in 24-well culture plates under respective stress conditions for 3 h, 24 h, and 72 h. Afterward, the cells were washed with warm PBS, and then were fixed with 4% PFA for 10 min. After three washing steps for 2 min with distilled water, the cells were incubated with a solution of 0.4% SRB sodium salt (Sigma-Aldrich, Taufkirchen, Germany) diluted with 1% acetic acid (Merck, Darmstadt, Germany) for 10 min at room temperature. The cells were then washed five times for 5 min each using 1% acetic acid to remove any unbound staining. A volume of approximately 500 µL of 10 mM unbuffered TRIS solution was added to the cells per well, and then was incubated for 30 min at room temperature. For each experimental condition, 200 μL of the solution was pipetted in triplicate into a 96-well microplate. To semi-quantify the SRB-cell solution, the optical density was measured at 565 nm absorbance using a microplate reader equipped with Magellan TM Data Analysis V2.30 Software (Tecan, Männedorf, Switzerland).

2.7. Immunocytochemistry

Immunofluorescence staining was used to assess the myogenic regulatory factors using specific antibodies. The myoblasts were cultivated at a density of 1 × 10⁴ cells per well on sterile coverslips in 24-well culture plates under the respective stress conditions. The proliferation markers were evaluated by fixing the cells after 3 h, 24 h, and 3 d in the growth medium. To examine the differentiation markers, the cells were cultivated in the myogenic differentiation medium for up to 7 d. The cells were then washed with prewarmed PBS and then fixed with 4% PFA for 20 min. After three-minute washes with PBS, the cells were permeabilized in a buffer consisting of 20 mM Hepes (Biochrom, Berlin, Germany), 300 mM sucrose, 50 mM NaCl, 3 mM MgCl2 (Carl Roth, Karlsruhe, Germany), and 0.5% TritonTM X-100 (pH 7, Calbiochem GmbH, Sandhausen, Germany) for 15 min. The non-specific bindings were blocked with 5% FCS diluted in PBS and supplemented with 0.05% TritonTM X-100 for 30 min. The cells were then incubated with primary antibodies diluted in the blocking buffer at 4 °C overnight. The primary antibodies used were anti-mouse MyoD (1:100, BD Bioscience, Heidelberg, Germany), myogenin (1:100, Santa Cruz, Biotechnology, Heidelberg, Germany), and myosin heavy chain 1 F-59 (MHC1 1:200, Santa Cruz, Biotechnology, Heidelberg, Germany). After five washes of 5 min each, the primary antibodies were detected by incubating the cells with Cy3-Goat anti-mouse IgG secondary antibody (diluted 1:200, Dianova, Hamburg, Germany) in the dark at room temperature for 1 h. The cell nuclei were counterstained using 4, 6-diamidino-2-phenylindole dihydrochloride (DAPI, ThermoFisher, Waltham, MA, USA). Cells were also processed in parallel without the addition of primary antibodies, serving as negative controls. The coverslips were mounted with DABCO-Mowiol (Carl Roth, Karlsruhe, Germany). The staining was examined and photographed using a fluorescence microscope equipped with the “AxioCam MRm Rev.3” camera and the “AxioVision Image Analysis 4.8.2” software. The images were quantified by using ImageJ software. To quantify the number of MyoD- and myogenin-positive cells, ten random microscopic field images were photographed, then the total number of nuclei and the number of MyoD- or myogenin-positive cells were counted. The number of MyoD- and myogenin-positive cells was presented as a relative percentage of the total number of nuclei in the microscopic field. Morphometric analysis of myotubes was performed on day 7 of myogenic differentiation. For all experimental groups, ten random microscopic fields were photographed, and then MHC-positive myotubes with a minimum of two nuclei were evaluated using ImageJ. Morphometric parameters including the number, length, width, and size of the myotubes were assessed. The nuclei/cytoplasm ratio (N/C) per myotube was determined by dividing the area of the myotube by the number of nuclei for the same tube. An additional differentiation parameter, the fusion index, was obtained by dividing the number of nuclei in myotubes by the total number of nuclei in the microscopic field.

2.8. Phalloidin Staining

Phalloidin staining was used to visualize the cytoskeleton, which plays a central role in cell movement. The myoblasts were cultured at a density of 1 × 10⁴ cells/well on sterile coverslips in 24-well plates under different stress conditions compared to standard conditions for 3 h, 24 h, 3 d and 7 d. At each time point, the cells were washed with prewarmed PBS, were fixed with 4% PFA for 20 min, and then were washed twice with PBS for 3 min each time. The cells were incubated with phalloidin solution (Sigma-Aldrich, Taufkirchen, Germany) that was diluted at 1:40 in PBS and kept in the dark for 30 min. After that, the cells were washed three times with PBS for 3 min. The nuclei were counterstained with DAPI, followed by two additional washing steps with PBS for 3 min each. Finally, the coverslips were mounted on slides using DABCO-Mowiol (Carl Roth, Karlsruhe, Germany) and left to dry overnight at 4 °C. The cells were then observed under a fluorescence microscope.

2.9. DAF-FM Staining

Nitric oxide detection and quantification were performed using DAF-FM (4-amino-5-methylamino-2′, 7′-difluororescein) diacetate (Cayman Chemicals, Ann Arbor, MI, USA). DAF-FM diacetate is a non-fluorescent reagent that reacts with NO to form a detectable fluorescent benzotriazole at 495/515 nm under a fluorescence microscope. The myoblasts were cultured at a density of 1 × 10⁴ cells/well in 24-well culture plates under both hypoxia and normoxia for 3 h, 24 h, 3 d, and 7 d using the respective medium. To avoid any potential background interference, a phenol red-free medium was used. The cells were washed twice with warm PBS, and then 500 µL per well of prewarmed Hank’s Balanced Salt Solution (HBSS, Capricorn Scientific, Ebsdorfergrund, Germany) was added. After 30 min of incubation with HBSS, the cells were incubated in the dark with 5 µM DAF-FM in HBSS for 1 h at 37 °C. As a negative control, cells were incubated in parallel without DAF-FM. Finally, the cells were washed in HBSS and then were incubated for an additional 30 min to ensure complete ester cleavage of the intracellular diacetate. The cells were observed under a fluorescence microscope equipped with the ‘AxioCam MRm Rev.3′ camera and the ‘AxioVision Image Analysis 4.8.2′ software. Approximately ten random microscopic fields were photographed per experimental group, and the intensity of nitric oxide (NO) was quantified using ImageJ. The intensity of NO was estimated using the following formula: final mean field intensity for cells minus the mean field intensity of the background.

2.10. RT-qPCR

After successful cultivation under either FSS or hypoxic conditions for up to 7 days, the cells were lysed, and the total RNA was extracted using the GenElute Mammalian RNA Miniprep Kit (Sigma-Aldrich, Taufkirchen, Germany) following the manufacturer’s guidelines. The RNA was quantified by means of optical density measurement using nanodrop (Thermo Fisher Scientific, Dreieich, Germany). Approximately 1 μg of RNA for each experimental group was digested with 1.2 units of recombinant DNase I (Sigma-Aldrich, Taufkirchen, Germany) at 37 °C for 30 min. The RNA was then reverse transcribed using a mixture of MultiScribe™ Reverse Transcriptase (Thermo Fisher Scientific, Dreieich, Germany) and Random Hexamer Primer N6 (Genaxxon, Ulm, Germany) following the manufacturer’s instructions. The resulting cDNA was used for either qualitative or quantitative gene expression analysis. The primers used in the present study were listed in Table 1. For qualitative PCR, a volume of 2.5 μL of cDNA was added to a PCR mix in a thermal cycler according to the following protocol: 95 °C for 5 min, 94 °C for 30 s, 60 °C for 30 s, 72 °C for 30 s, and 72 °C for 1 min. Real-time PCR was performed by adding cDNA in triplicate with GoTaq® qPCR Master Mix (Promega, Walldorf, Germany) and the primers listed into a CFX96 Touch Real-Time PCR Detection System (Biorad, Feldkirchen, Germany). The gene expression levels of MyoD, myogenin, myosin heavy chain 1 (MHC1), myosin heavy chain 7 (MHC7), mammalian target of rapamycin (mTOR), vascular endothelial growth factor (VEGF), hypoxia-inducible factor 1 alpha (HIF1α) and nitric oxide synthase 1 (NOS1) were quantified using RT-qPCR and analyzed using the 2−ΔΔCt method as described in [54]. The data present gene expression relative to an endogenous reference 18S gene in the target sample compared to a control.

2.11. Statistical Analysis

The present study evaluates the effect of mechanical stress (CFSS and PFSS vs. static culture) and the effect of oxygen concentration (hypoxia vs. normoxia) at 3 h, 3 d, and 7 d time points. The data produced by the MTT, SRB, CFU assays, morphometric analysis, DAF-FM staining, and quantification of relative marker expression were analyzed using a two-way ANOVA. The RT-qPCR data of the differentiation experiments were statistically evaluated using a one-way ANOVA. The analysis of the immunofluorescence data for MyoD-, myogenin-, and MHC-positive cells was carried out using a two-tailed t-test. The Tukey test served as a post hoc test. The data analysis was presented as mean ± SEM and p values ≤ 0.05 were considered statistically significant. The data were collected in Microsoft Excel Version 16.64, were analyzed using SigmaStat Version 4.0, and graphs were created by using GraphPad Prism Version 9.2.0 software.

3. Results

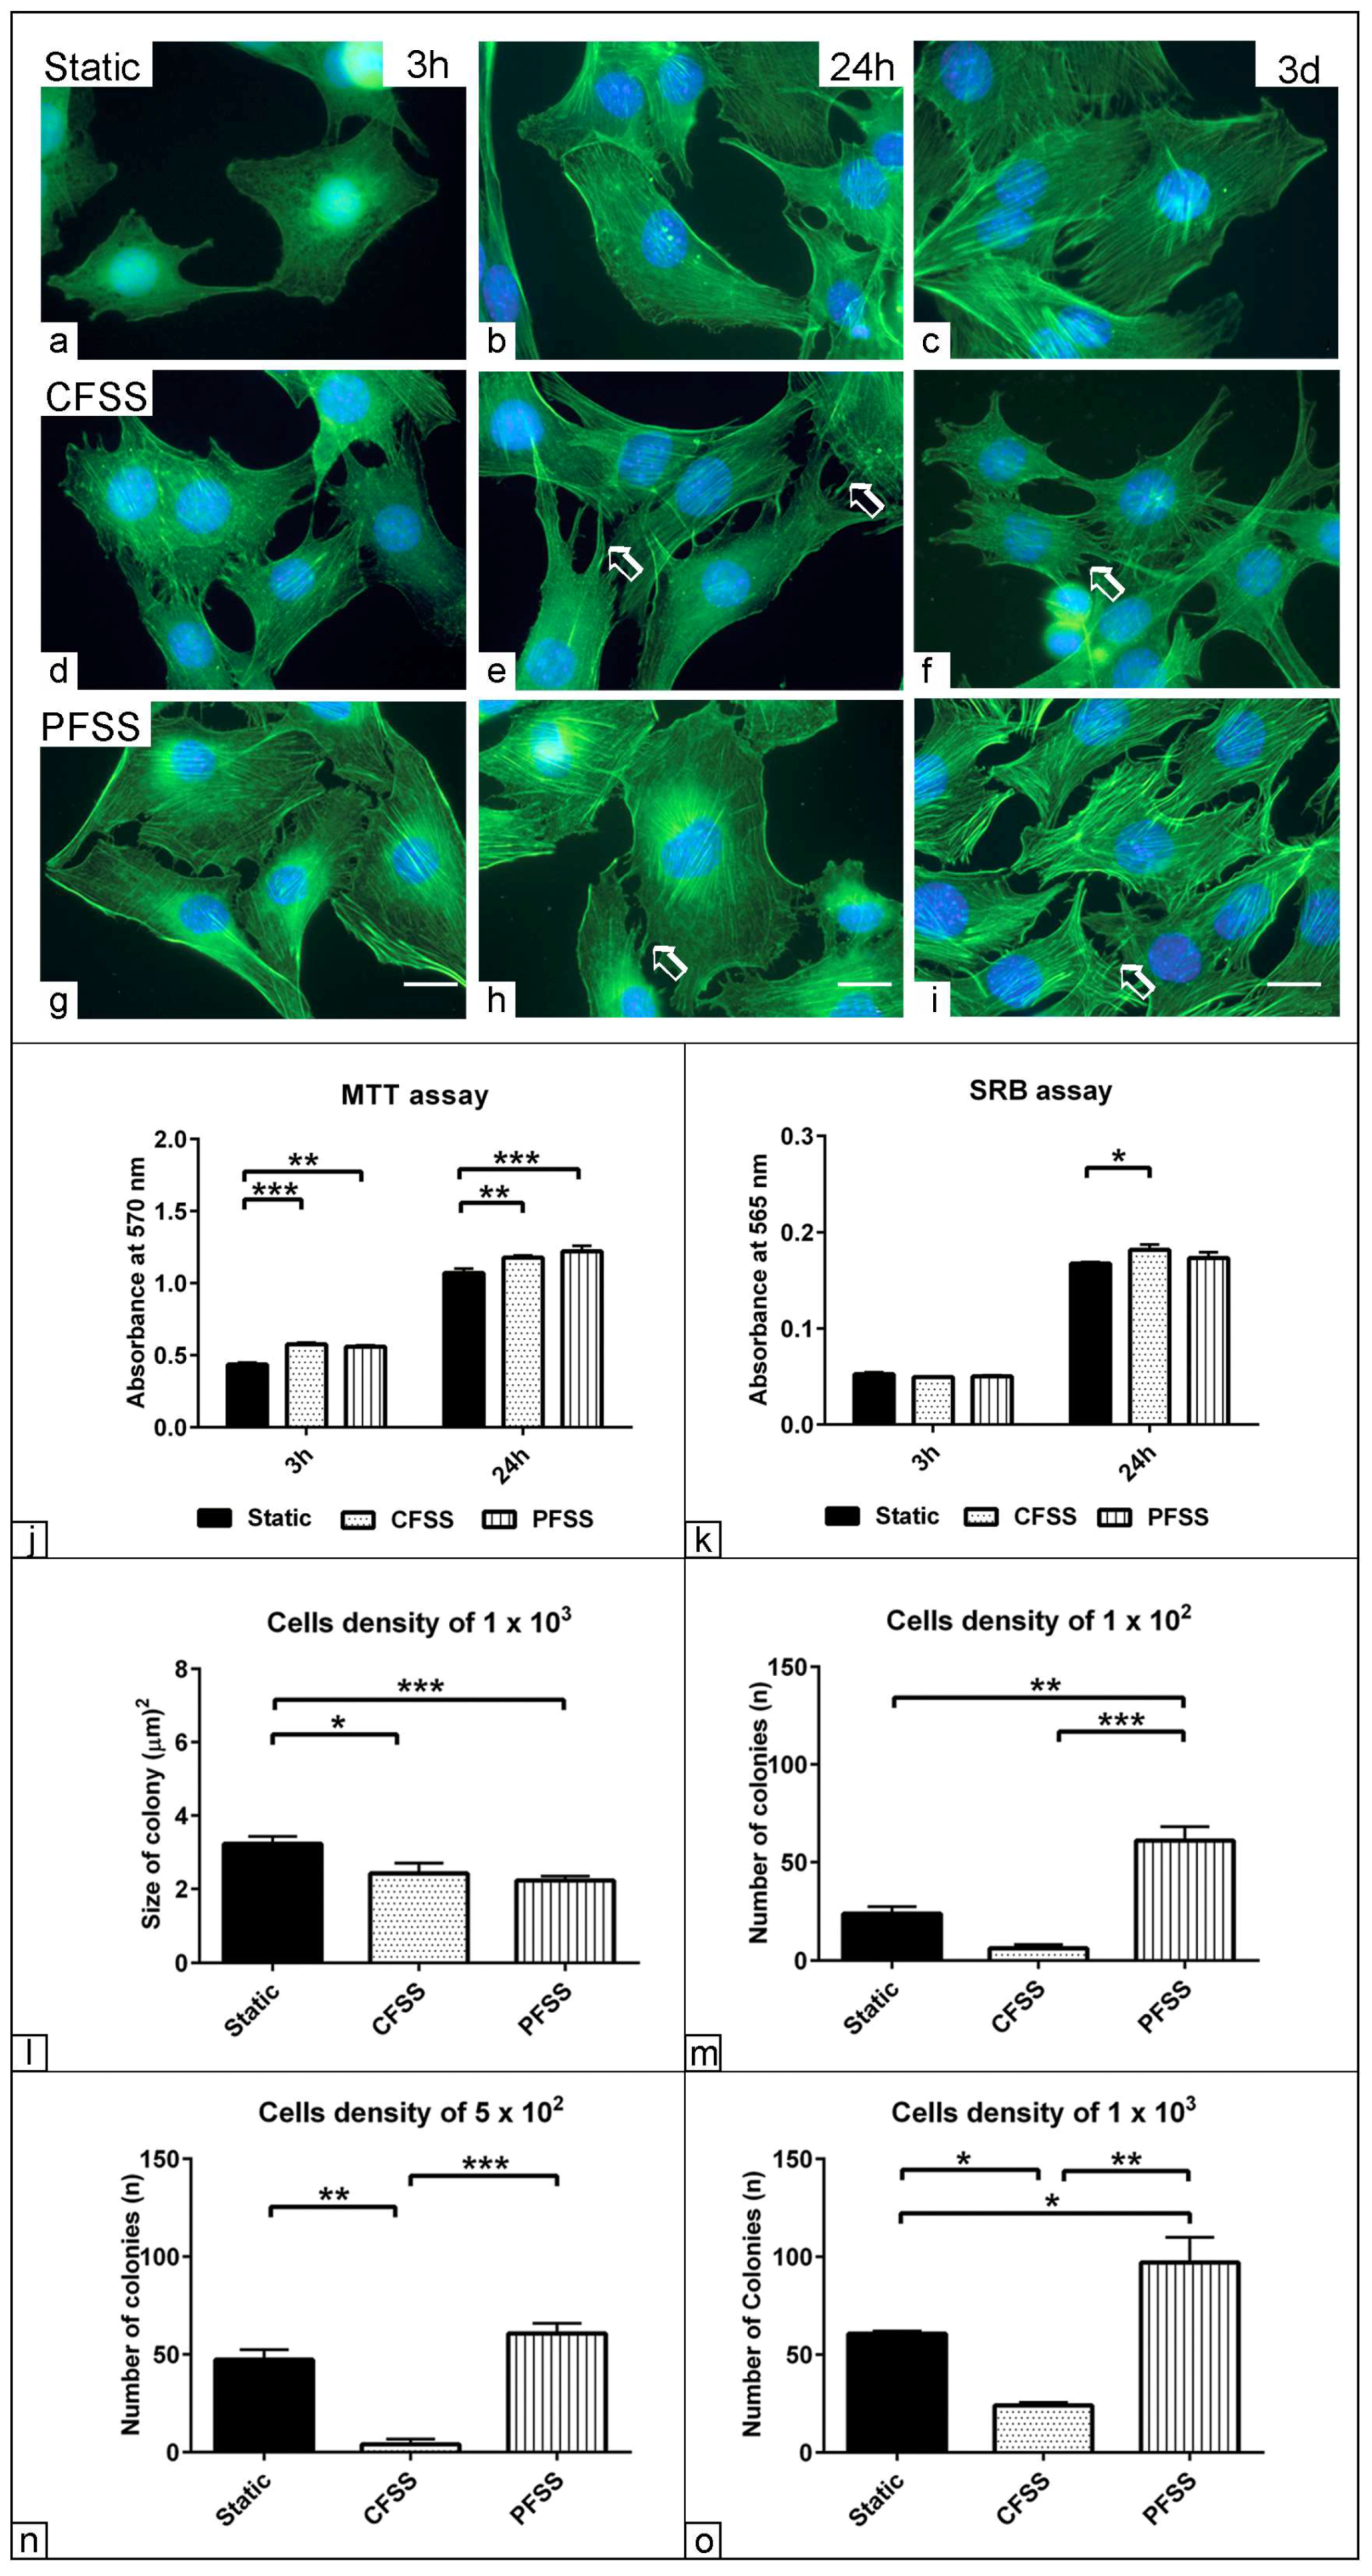
3.1. Effect of Optimized Mechanical Fluid Shear Stress on the Cell Viability

Skeletal muscle myoblasts exhibited a typical stem cell-like morphology for up to three days under static conditions. The cells had broad, spindle-shaped bodies with cytoplasmic processes (Figure 1a–c). In contrast, CFSS showed a small, elongated cell body with numerous long and short cytoplasmic processes (Figure 1d–f). Under PFSS, the cell body appeared wider without obvious cytoplasmic processes for up to 24 h, then marked increases in cell processes with a smaller body size were observed at day 3 compared to static culture (Figure 1g–i). To examine the effect of mechanical FSS on the physiological parameters of muscle cells, the MTT and SRB assays were carried out. The data analysis revealed increased cell viability under both CFSS and PFSS (p < 0.001 and p < 0.01) compared to static conditions after 3 h. A similar observation was found under CFSS and PFSS up to 24 h (p < 0.01 and p < 0.001) compared to the matched static culture (Figure 1j). By analyzing the total protein contents for all experimental groups, an increased cell number was observed only under CFSS after 24 h compared to the matched static condition (Figure 1j). To assess the colony-forming potential of the myoblasts under both FSS and static cultures indicative of stemness capacity, the CFU assay was performed using three different cell concentrations: 1 × 10², 5 × 10², and 1 × 10³ cells/25 cm2. The data analysis showed a decrease in the size of the cell colony under both CFSS and PFSS (p < 0.05 and p < 0.001) compared to the static culture at a cell density of 1 × 10³, respectively (Figure 1l). An increase in the number of cell colonies at 1 × 10² in the PFSS condition (p < 0.001 and p < 0.01) compared to the CFSS and static culture conditions (Figure 1m) was observed. Similar increases in the number of cell colonies were observed at 5 × 10² and 1 × 10³ cell densities under PFSS (p < 0.001 and p < 0.01) compared to the CFSS condition (Figure 1n,o). Surprisingly, the data showed a marked reduction in the number of colonies under CFSS (p < 0.01 and p < 0.05) compared with the control cells under static conditions at both 5 × 10² and 1 × 10³ cell densities (Figure 1n,o).

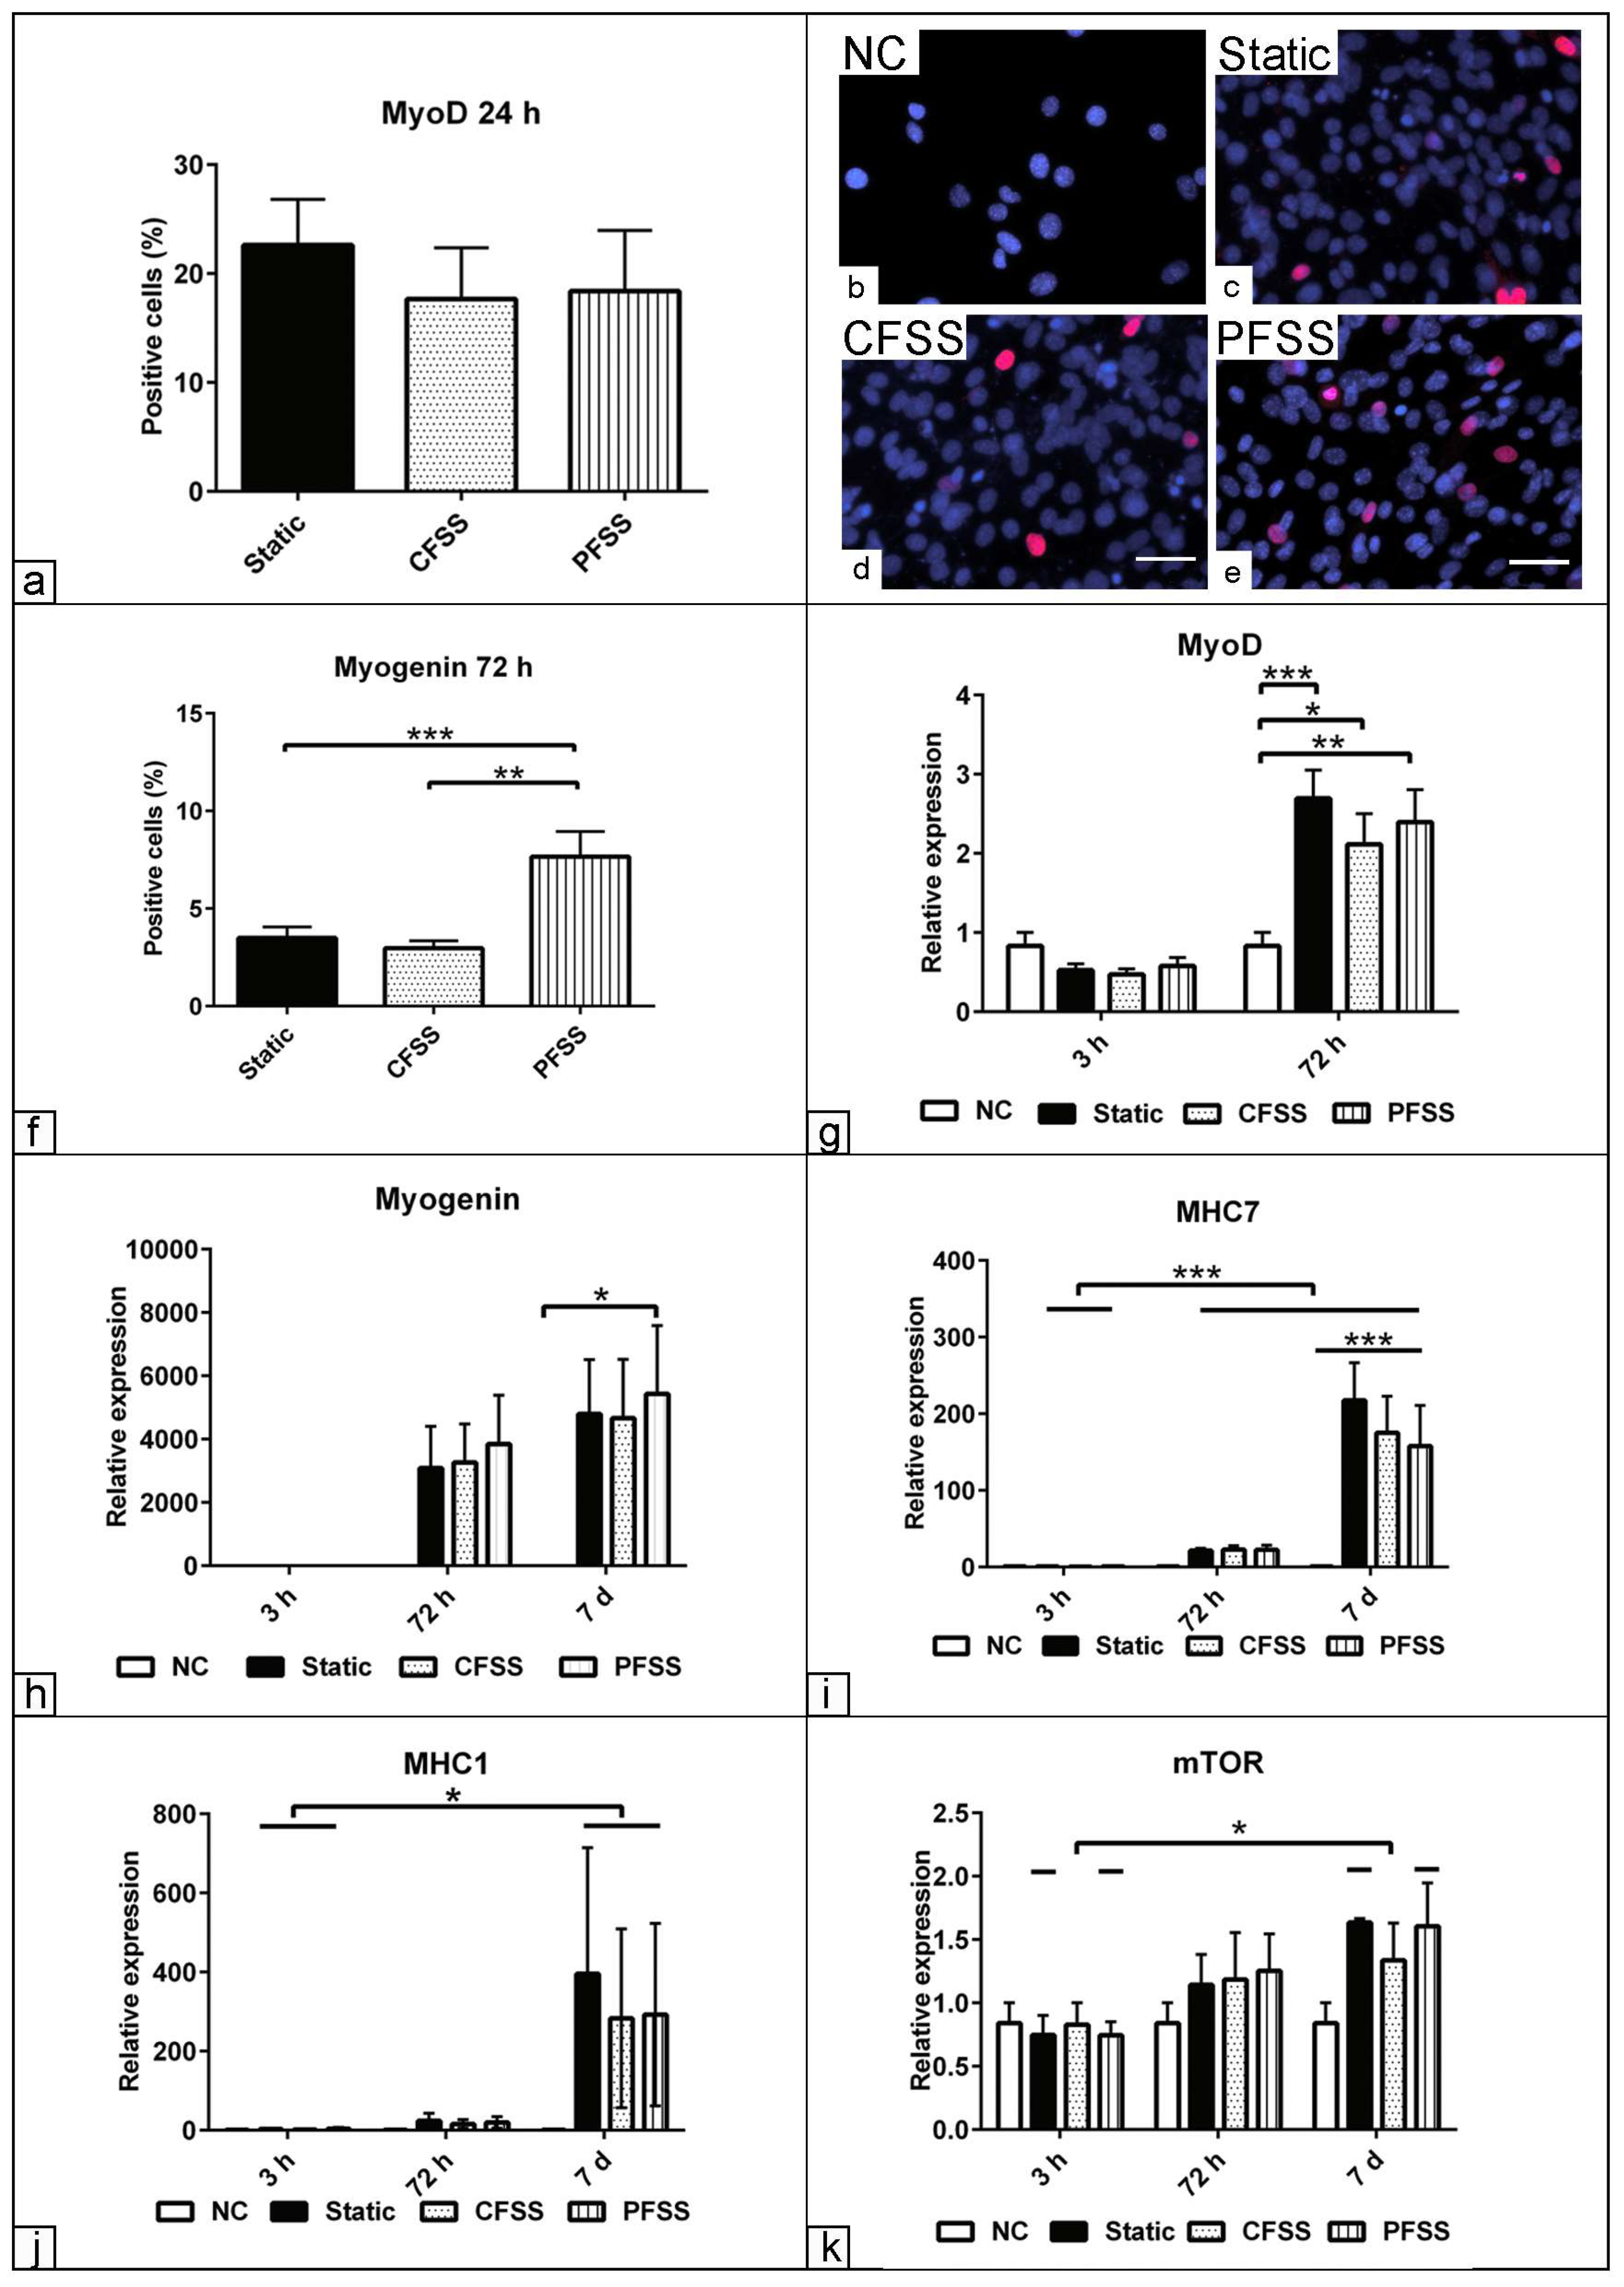
3.2. Effect of Optimized Mechanical Fluid Shear Stress on Myogenic Differentiation

Immunofluorescence was used to detect myogenic markers and examine whether FSS promotes myogenic differentiation (MD). After 24 h, a slight reduction in the number of MyoD-positive cells was observed compared to the static culture condition, but this was not statistically significant (Figure 2a). However, at 72 h, the number of myogenin-positive cells showed a significant increase under the PFSS condition compared to both static (p < 0.001) and CFSS (p < 0.01) conditions (Figure 2b–f). To confirm our data, we evaluated the expression of the myogenic markers up to day 7 post-induction. The data analysis revealed upregulated MyD expression for cells cultivated under static, CFSS, and PFSS conditions (p < 0.001, p < 0.05, and p < 0.01) compared to non-myogenic induced cells, respectively (Figure 2g). The data showed an upregulated myogenin expression for all experimental groups at 72 h (p < 0.05) and day 7 (p < 0.001) compared to 3 h post-induction. The data analysis indicates a significant upregulation of myogenin for those cells under static, CFSS, and PFSS conditions compared to the non-induced cells at day 7 post-induction (Figure 2h). Additionally, the data showed an upregulated MHC7 expression for all differentiated groups at 72 h and day 7 regardless of FSS (p < 0.001) compared to early induction at 3 h. Furthermore, there was an enhanced MHC7 expression for all treated groups at day 7 (p < 0.001) compared to non-induced cells in the control medium (Figure 2i). Similarly, an upregulated MHC1 expression was detected for all differentiated groups regardless of FSS at day 7 (p < 0.05) compared to early induction at 3 h (Figure 2j). To examine whether FSS influences protein synthesis, the expression level of mTOR was quantified. The data analysis demonstrated an upregulation of mTOR in cells under both static and PFSS conditions at day 7 (p < 0.05) compared to matched groups after 3 h induction (Figure 2k).

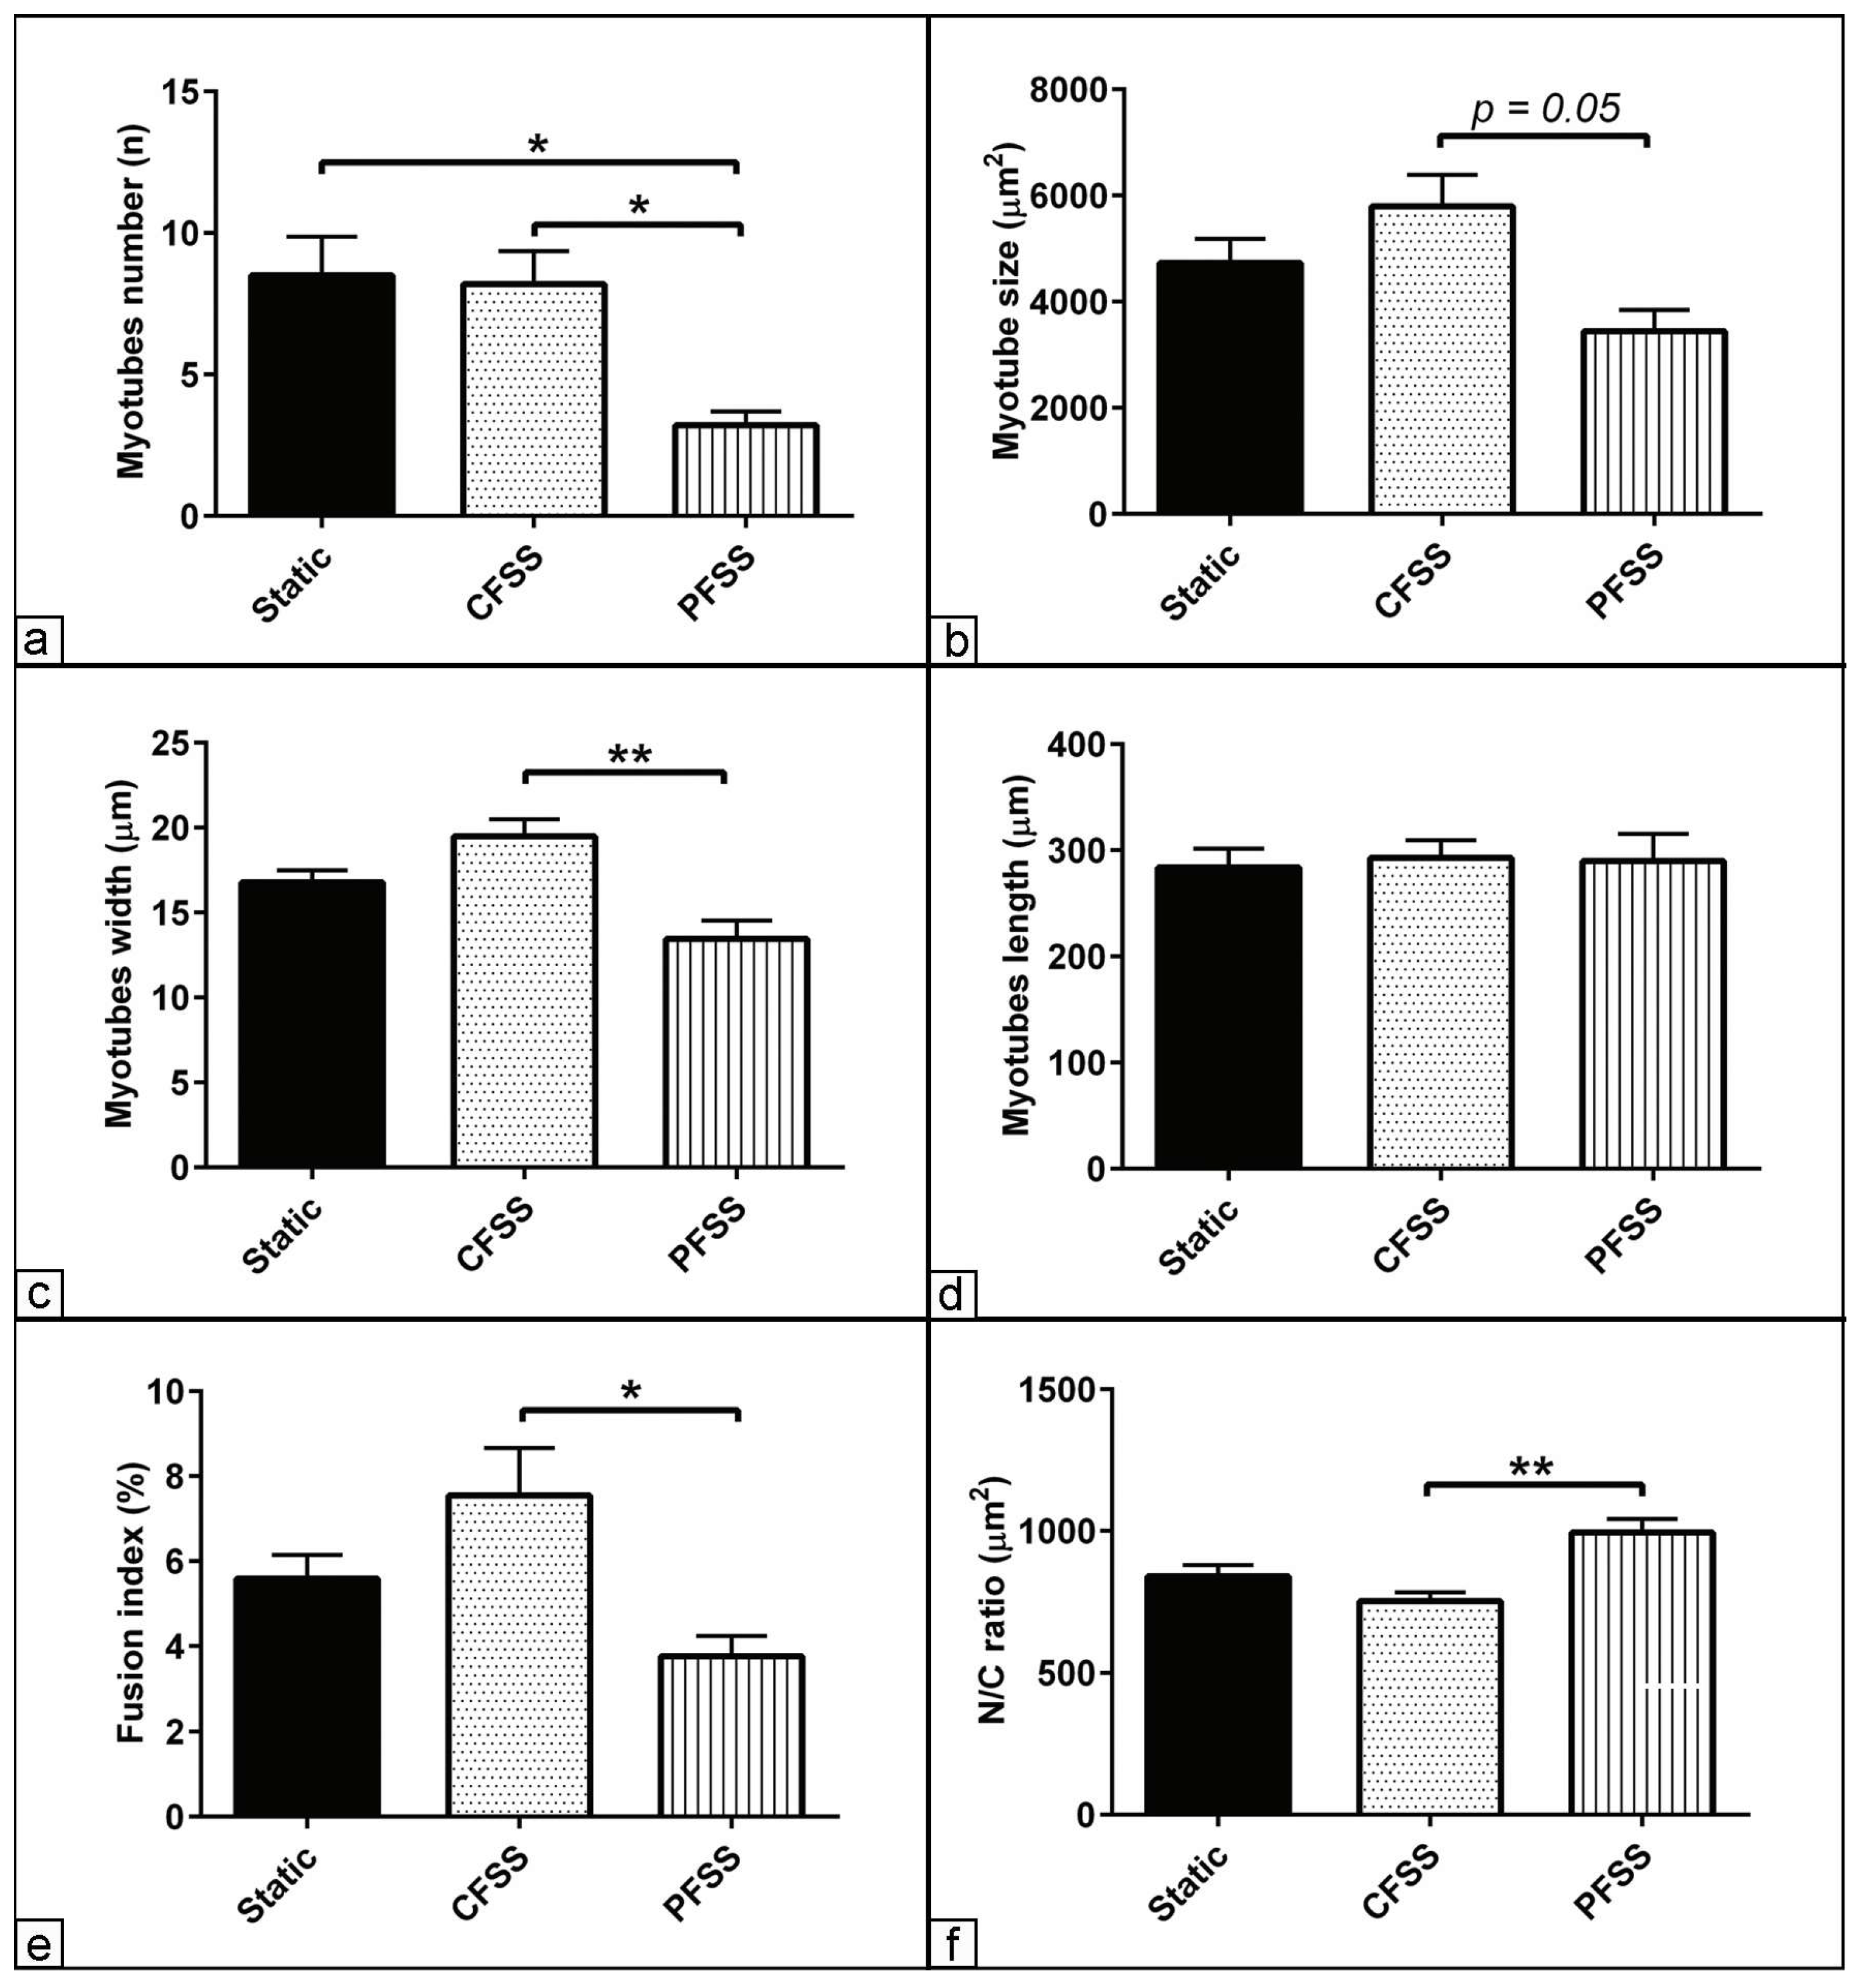
3.3. Morphometric Assessment of Myogenic Differentiation under Mechanical Fluid Shear Stress

To evaluate myogenic differentiation, the morphometric analysis of myotube formation indicative of myogenic differentiation capacity was carried out. After 7 days of differentiation, we observed tubular multinucleated tubes, referred to as myotubes, under both culture conditions. The data analysis demonstrated a reduction in the number of myotubes under PFSS (p < 0.05) compared to both static and CFSS conditions (Figure 3a). The morphometric analysis showed a decrease in the size (μm2) and width (μm) of the individual myotubes under PFSS (p = 0.05 and p < 0.01) compared to CFSS conditions (Figure 3b,c). The analysis demonstrated no alteration in the length of the myotubes (μm) for all experimental groups (Figure 3d). To assess the myoblast fusion capacities, the percentage of nuclei per myotube relative to the total number of nuclei in the same microscopic field was calculated and referred to as the fusion index. The analysis revealed a reduced myotube fusion index in the PFSS (p < 0.05) compared to the CFSS conditions (Figure 3e). To examine the cytoplasmic area covered by each myonucleus that is directly indicative of protein synthesis, the nuclear–cytoplasmic ratio (N/C) was analyzed. The data demonstrated an increased N/C ratio under PFSS (p < 0.01) compared to CFSS, confirming the data analysis of the fusion index (Figure 3f).

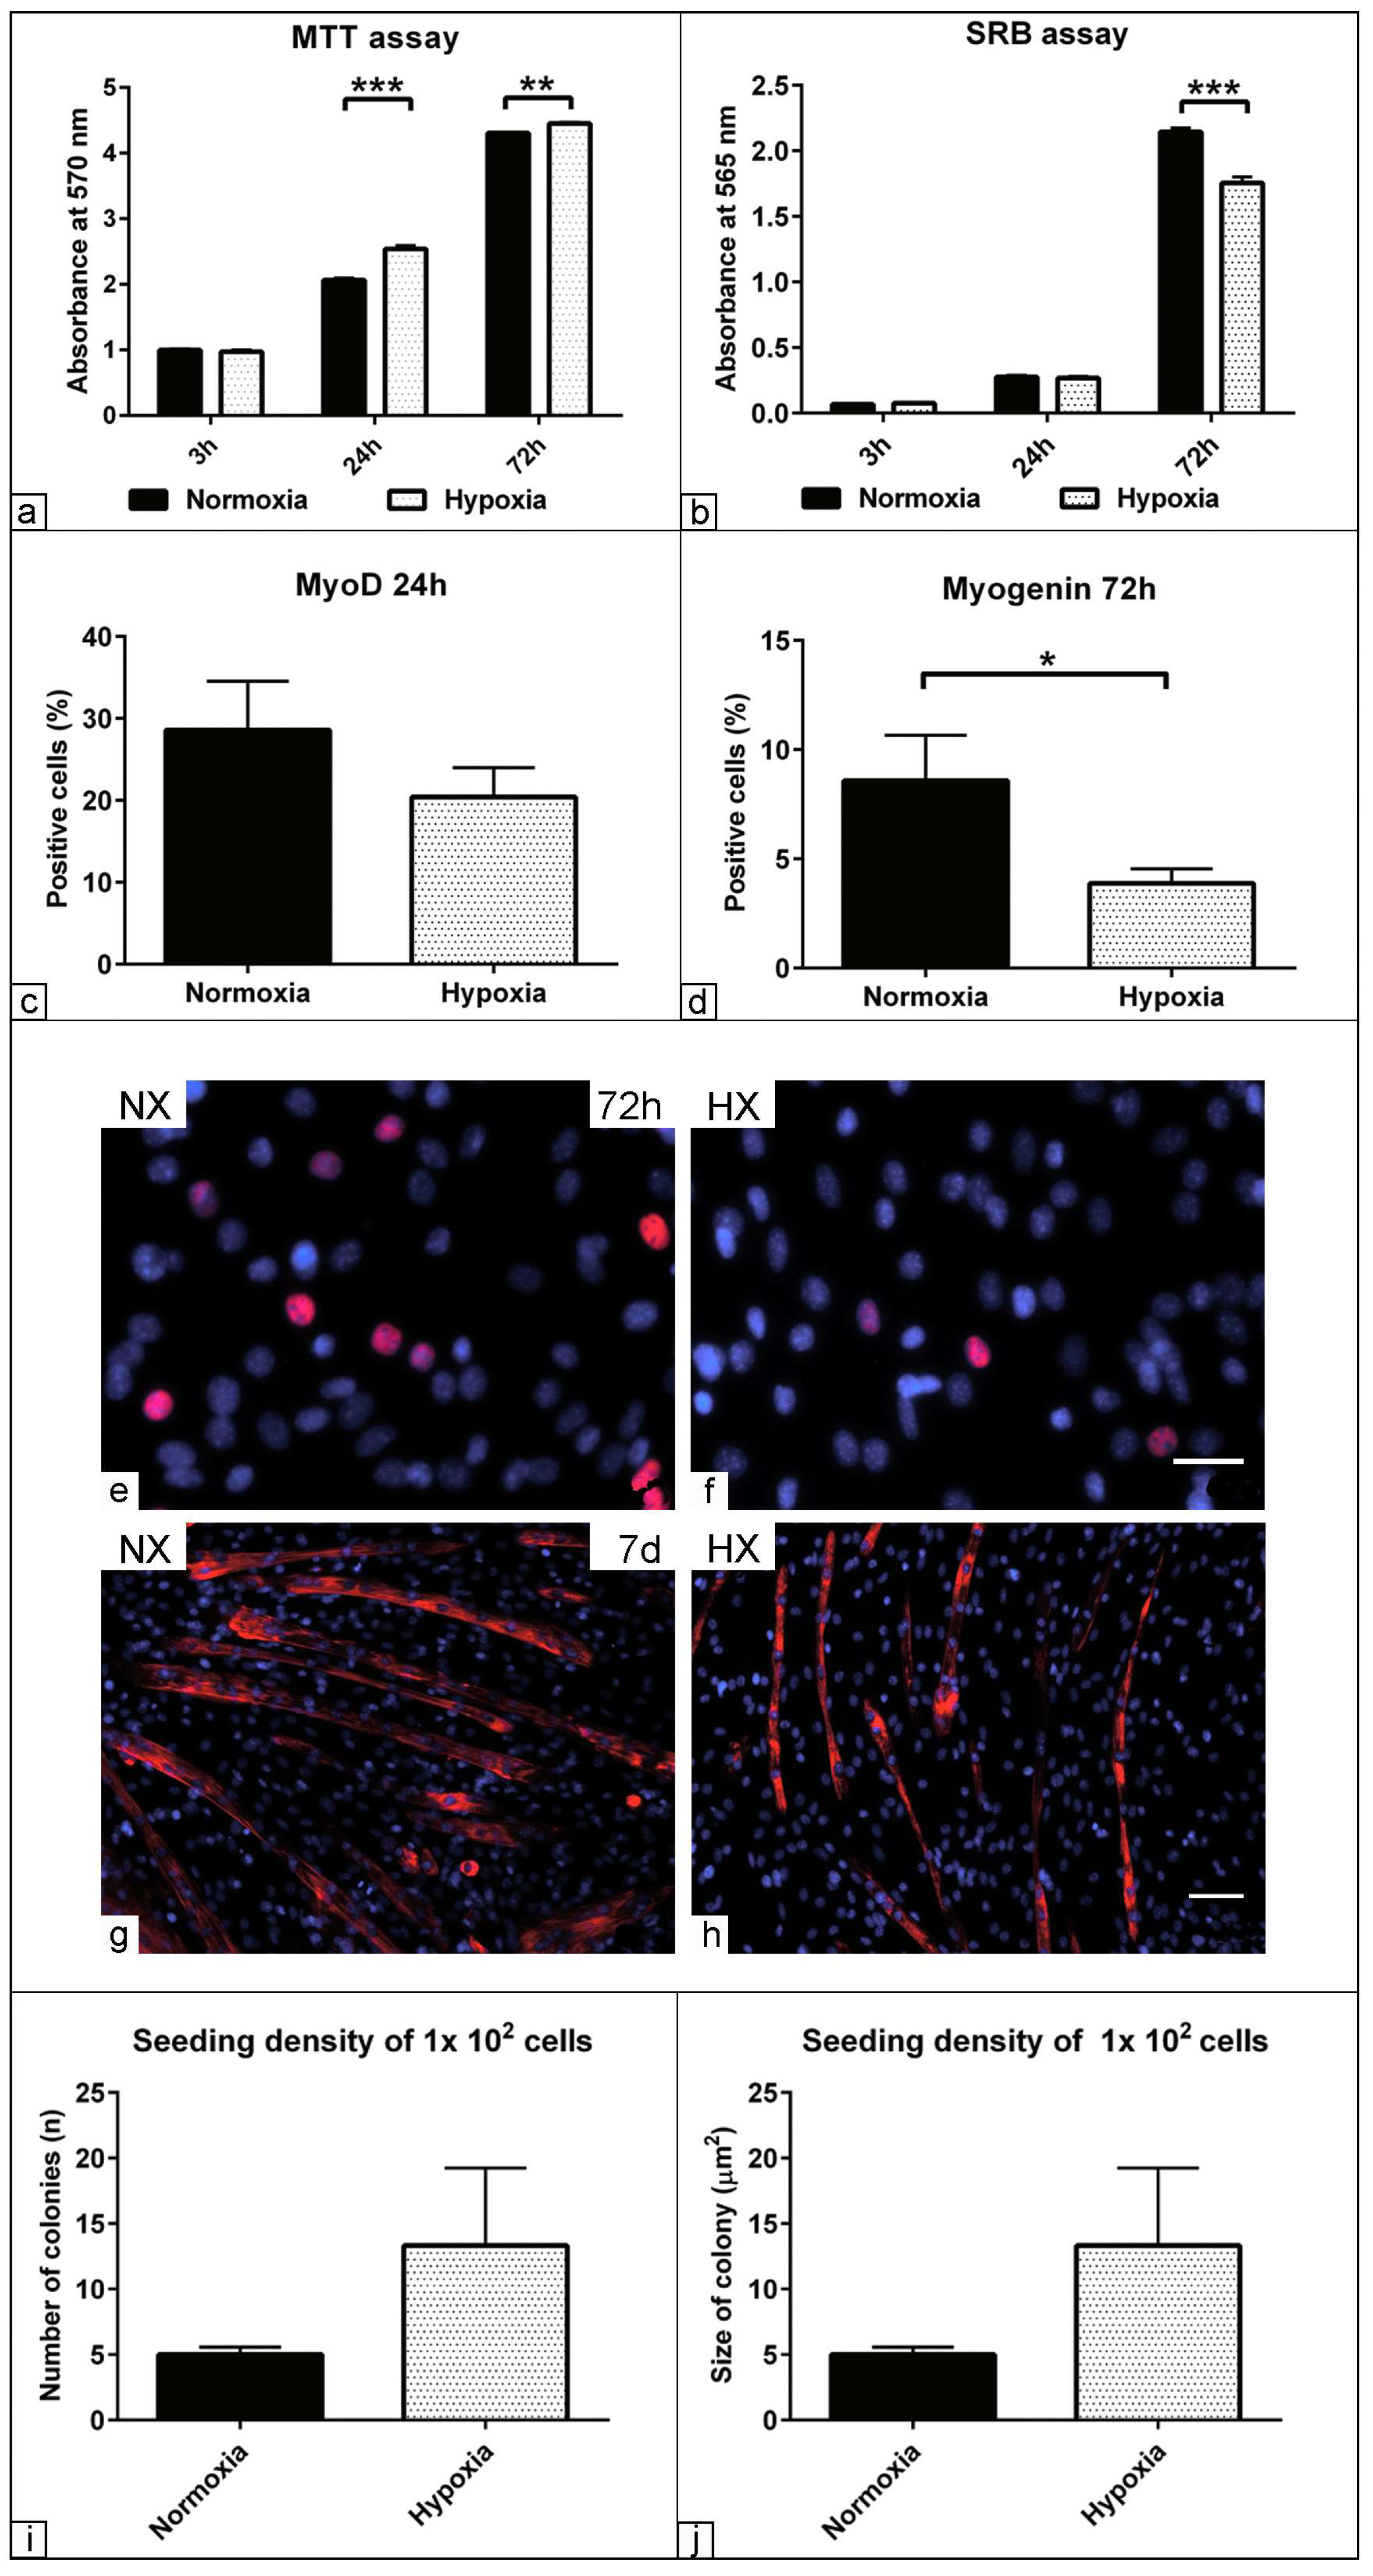
3.4. Effect of Low Oxygen Concentration on the Physiological Parameters of Muscle Precursors

We examined whether changes in the extracellular oxygen concentration can mimic the physiological stem cell microenvironment. The data analysis demonstrated that cell viability was enhanced after 24 h and 72 h under a low oxygen concentration (hypoxia 3% O2) (p < 0.001 and (p < 0.01) compared to the atmospheric oxygen concentration (normoxia 21% O2), respectively (Figure 4a). To confirm the data analysis, the total cellular protein content, indicative of cell number, was quantified. The data exhibited a reduction in the cell count after 72 h under hypoxia (p < 0.001) compared to normoxia (Figure 4b). The analysis of myogenic-positive cells through immunofluorescence indicated a tendency for fewer MyoD-positive cells after 24 h under hypoxia, but this was not statistically significant (Figure 4c). In contrast, there was a significant reduction in the number of myogenin-positive cells after 72 h under hypoxia (p < 0.05) compared to normoxic conditions (Figure 4d–h). By evaluating the CFU capacity, the data analysis revealed a slight increase in the number and size of cell colonies under hypoxic conditions, especially at 1 × 10² cells cultivation density (Figure 4i,j).

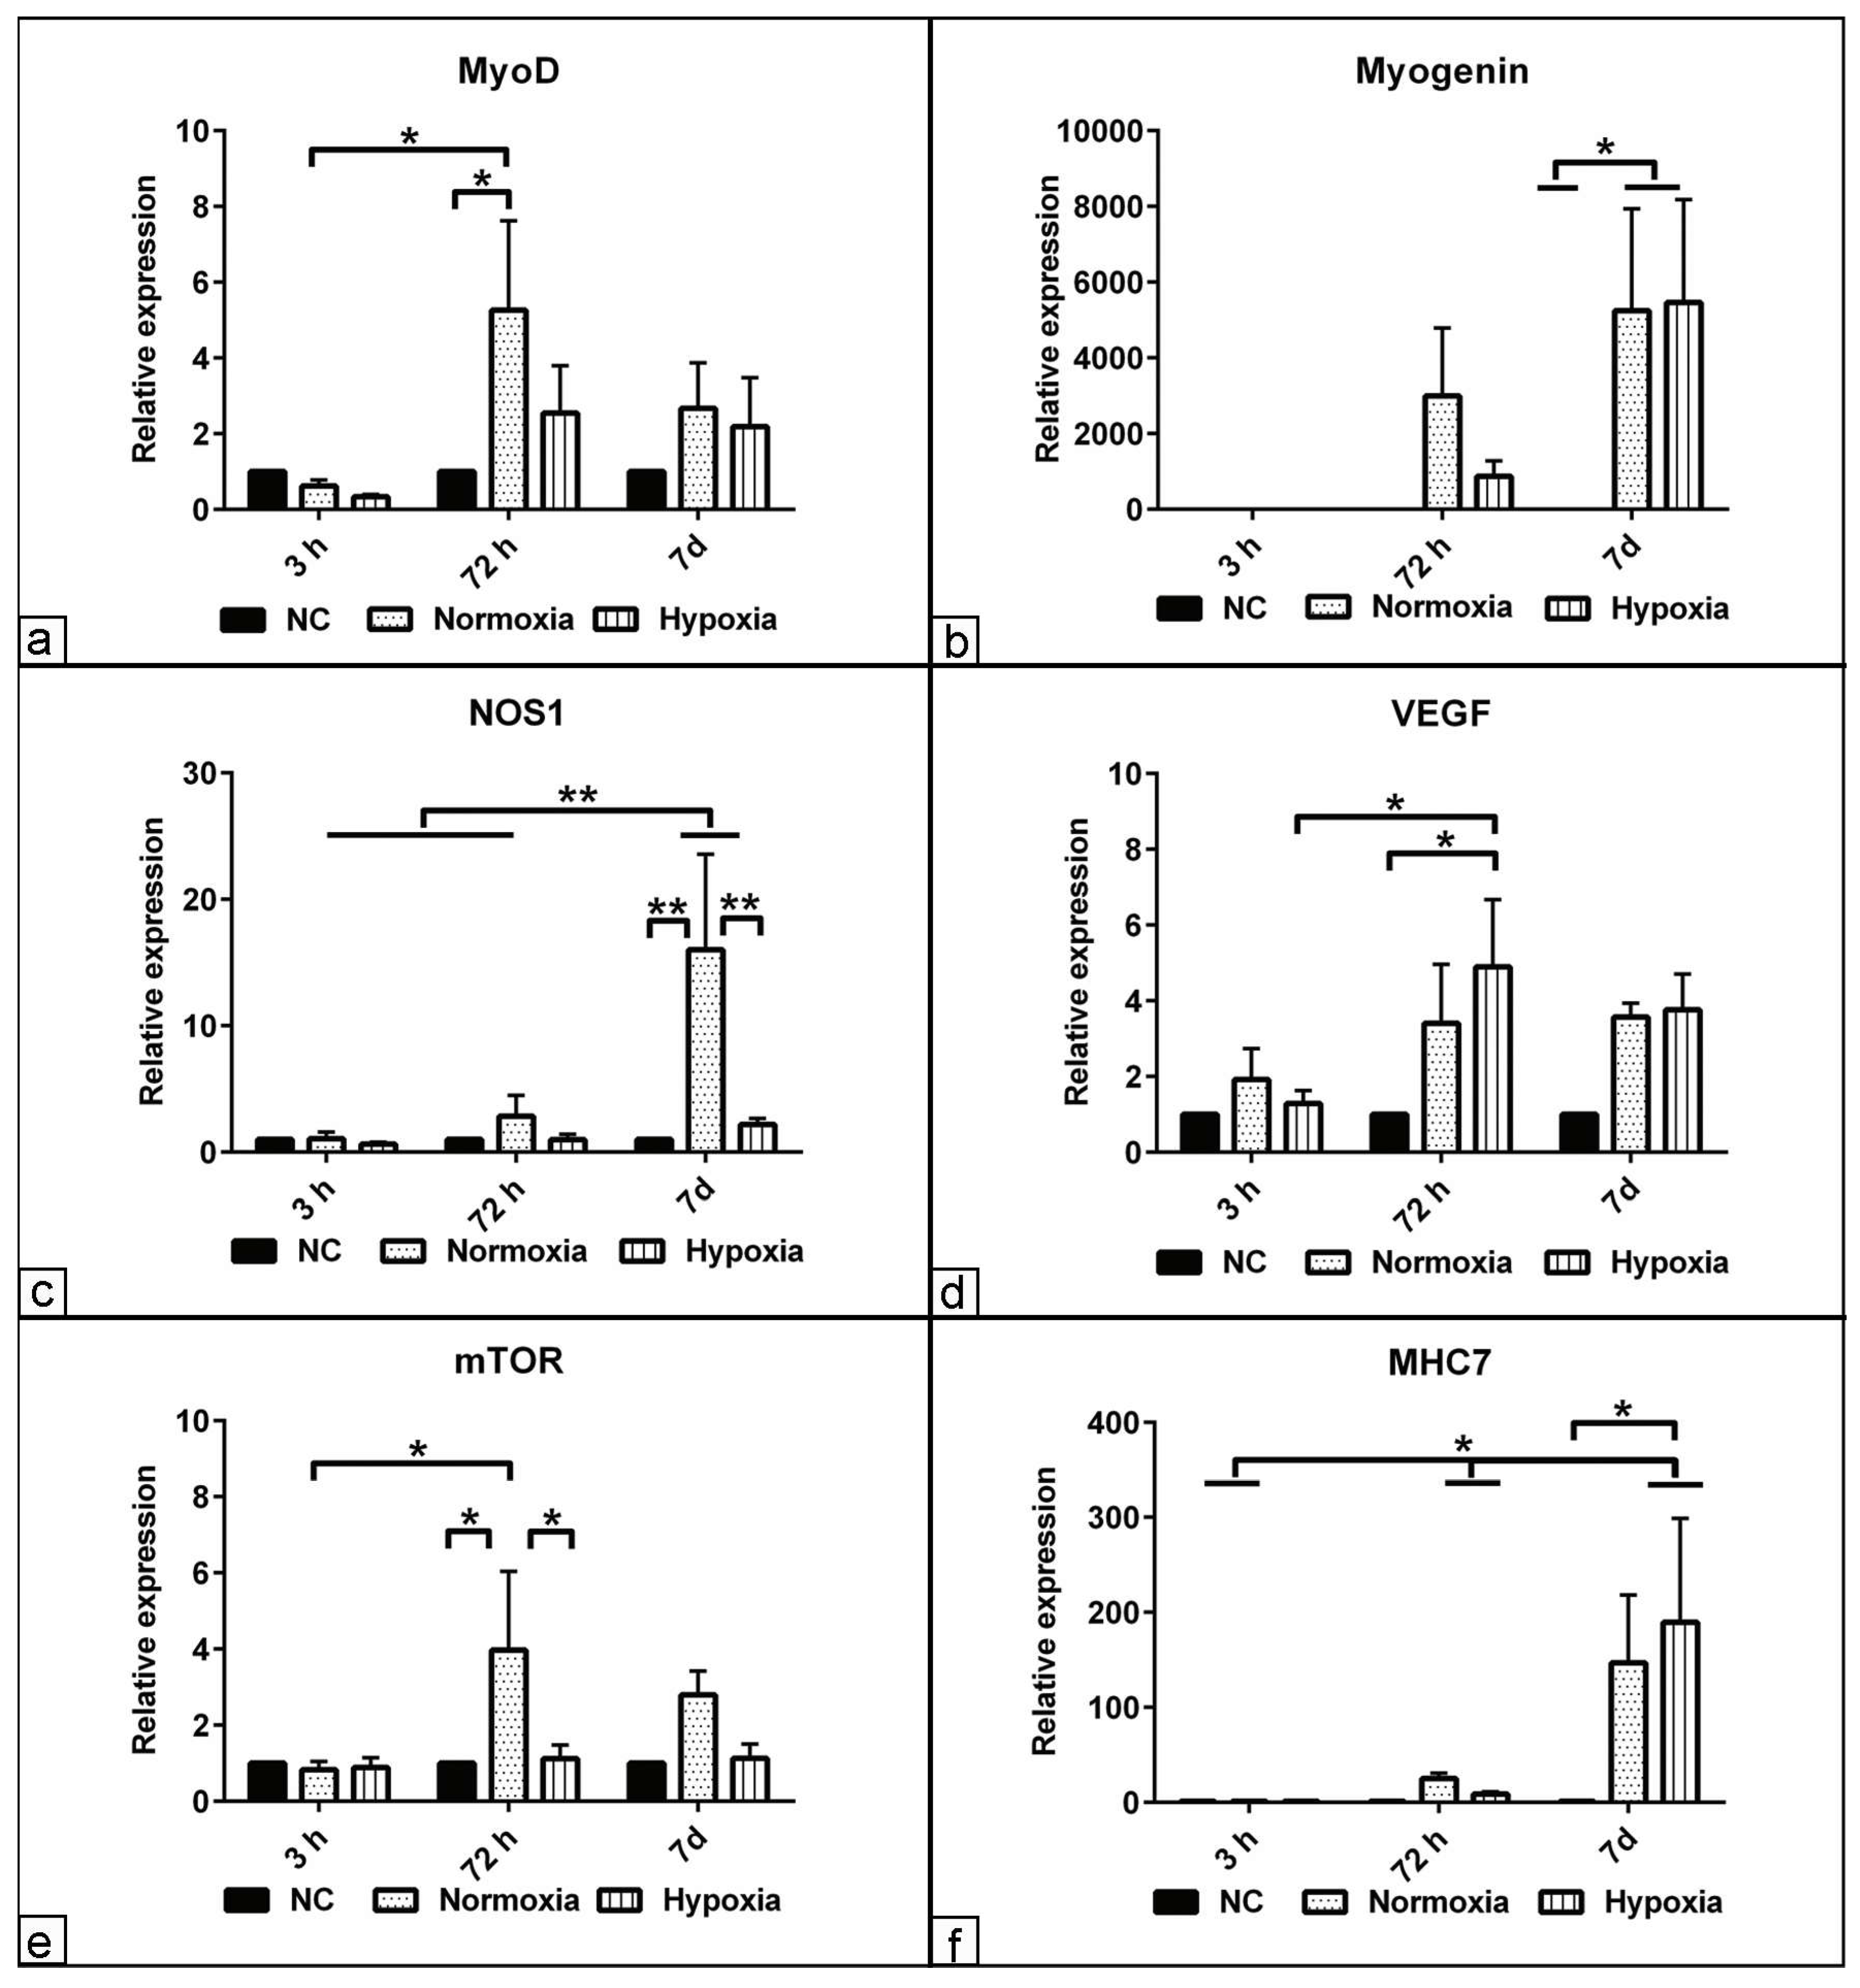
3.5. The Effect of Hypoxia on Myogenic Relative Markers Expression

Having demonstrated that hypoxia enhances cell viability even under low cell numbers, in order to examine whether hypoxia modulates the myogenic differentiation, the expression of MyoD, myogenin, NOS1, VEGF, mTOR and MHC7 was quantified after 3 h, 72 h, and 7 days of differentiation. The data analysis revealed that MyoD expression was upregulated at 72 h under normoxia (p < 0.05) compared to both the non-induced cells in basal medium (p < 0.05) and matched condition after 3 h (Figure 5a). Additionally, the quantification of the differentiation markers showed an upregulated myogenin expression at day 7 (p < 0.05) compared to non-induced cells for both experimental groups regardless of the effect of hypoxia (Figure 5b). The data analysis demonstrated an upregulated NOS1 at day 7 under normoxia (p < 0.01) compared to matched conditions at 3 h and 72 h. Moreover, the data showed an upregulated NOS1 expression at day 7 under normoxia (p < 0.01) compared to the cells cultivated under hypoxia and non-induced cells at the same time point (Figure 5c). It is well established that ischemic conditions stimulate an alternative vascularization, and thus we examined whether in vitro hypoxia induction modulates angiogenesis. Indeed, the data analysis exhibited an upregulated VEGF expression after 72 h under hypoxia compared to non-induced cells in basal medium (p < 0.05). Additionally, enhanced VEGF expression was observed (p < 0.05) when comparing 72 h with matched conditions after 3 h (Figure 5d). To examine whether hypoxia modulates the late myogenic markers relative to myotube maturation, the relative expression of mTOR, MHC7, and MHC1 was quantified. The data analysis showed that mTOR expression was upregulated after 72 h under normoxia (p < 0.05) compared to both the non-induced cells in the basal medium and the cells cultivated under hypoxia. Similarly, mTOR expression was upregulated after 72 h under normoxia (p < 0.05) compared to the matched condition after 3 h (Figure 5e). The data analysis revealed a late upregulation of MHC7 expression after day 7 under hypoxia (p < 0.05) compared to either non-induced cells in basal medium or the early time point after 3 h (Figure 5f). Surprisingly, the expression of HIF1α showed a discrepancy between 3 h, 72 h, and day 7 for cells cultivated under normoxia and hypoxia that was not statistically identified.

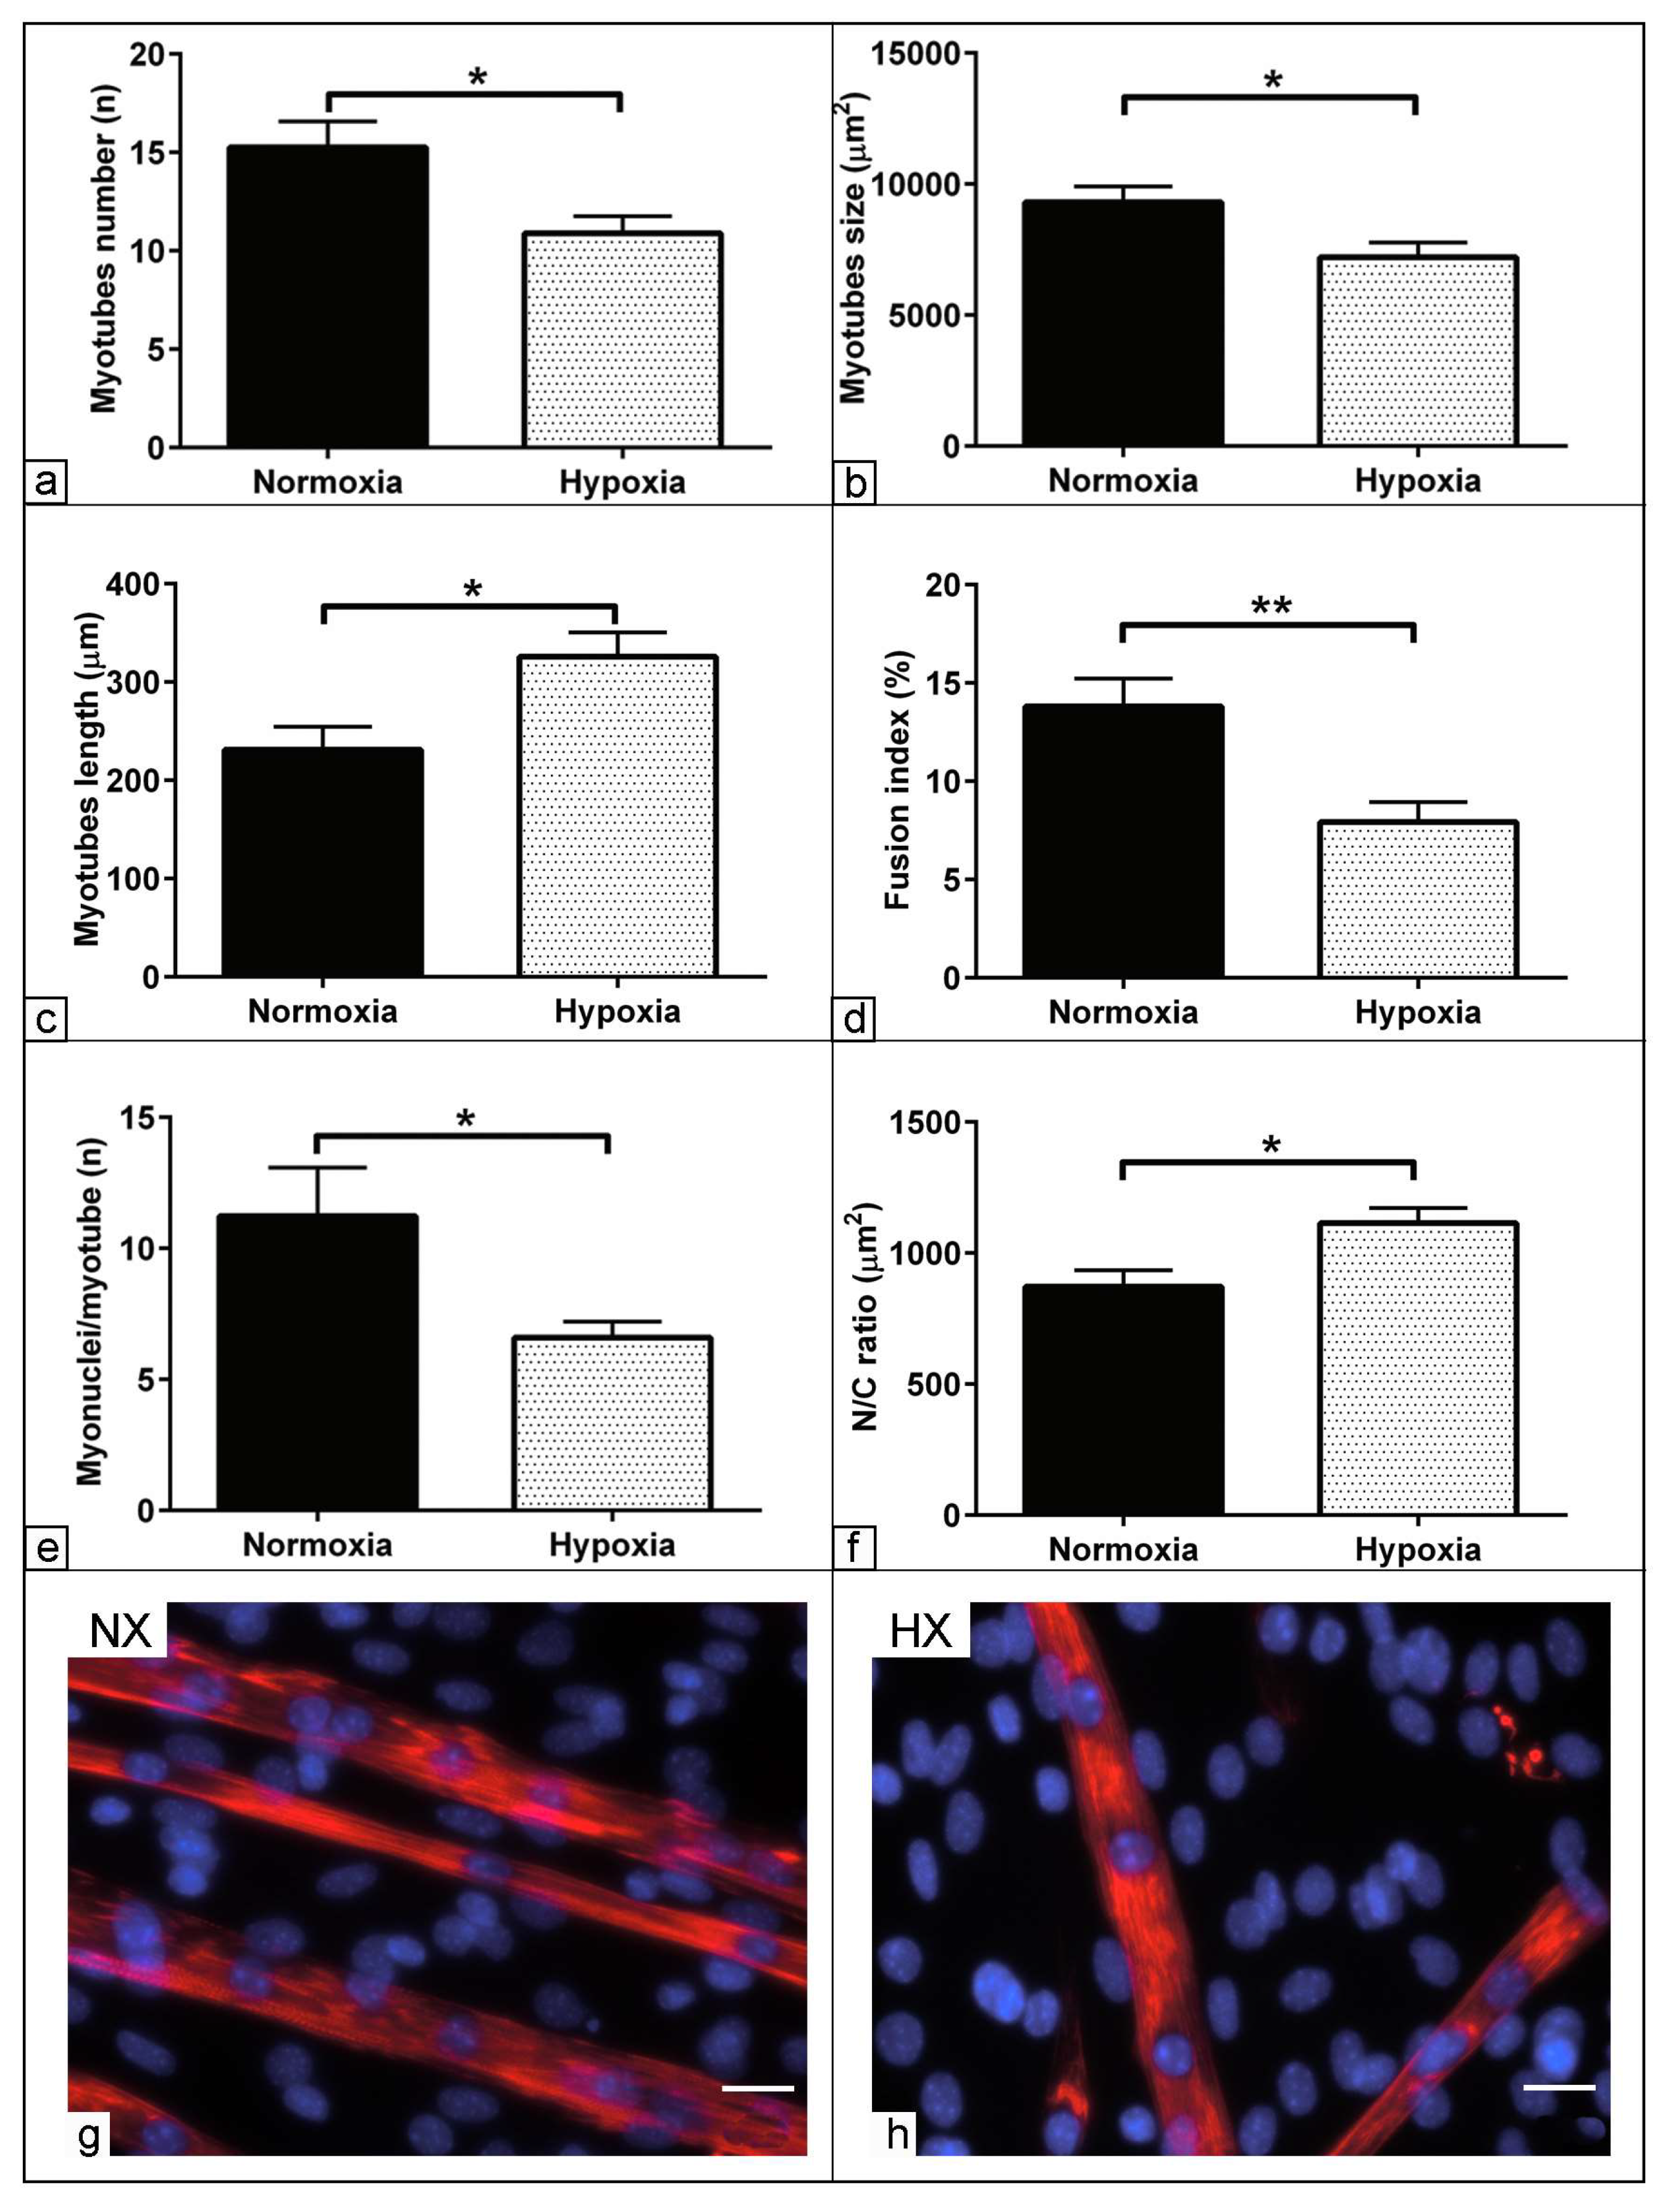
3.6. Morphometric Assessment of Myogenic Differentiation under Hypoxia

Under both culture conditions, an incipient formation of myotubes indicative of myogenic differentiation could be detected. The initial observation demonstrated fewer small myotubes being visible under hypoxic conditions compared to predominantly short and wide myotubes under normoxia. To evaluate whether a low O2 concentration modulates myotube formation, morphometric measurements of the myotubes after day 7 were carried out. The data analysis showed a reduction in the count and the size (μm2) of the myotubes under hypoxia (p < 0.05) compared to the cells cultivated in normoxic conditions (Figure 6a,b,g,h). In contrast, by measuring the length of the individual myotubes, the data showed increases in the length of the myotubes under hypoxia (p < 0.05) compared to normoxic conditions (Figure 6c). To assess the fusion capacity of myoblasts, the percentage of nuclei within the myotubes relative to the total nuclei in the microscopic field was quantified and referred to as the fusion index. The data analysis revealed a decrease in the fusion index of the myotubes under hypoxia (p < 0.01) compared to the same measurement under normoxia (Figure 6d). Similarly, a reduction in the number of nuclei per myotube (n) was observed under hypoxia compared to normoxia (Figure 6e). The analysis of the nuclear to cytoplasmic ratio (N/C) for the individual myotubes by dividing the myotube size (μm2) by the number of nuclei within the myotube was performed. The analysis revealed increases in these values under hypoxia (p < 0.01) compared to normoxic conditions (Figure 6f–h). It is demonstrated that differentiation under hypoxia reduces the fusion index as well as increasing the nuclear–cytoplasmic ratio compared to cells under normoxia.

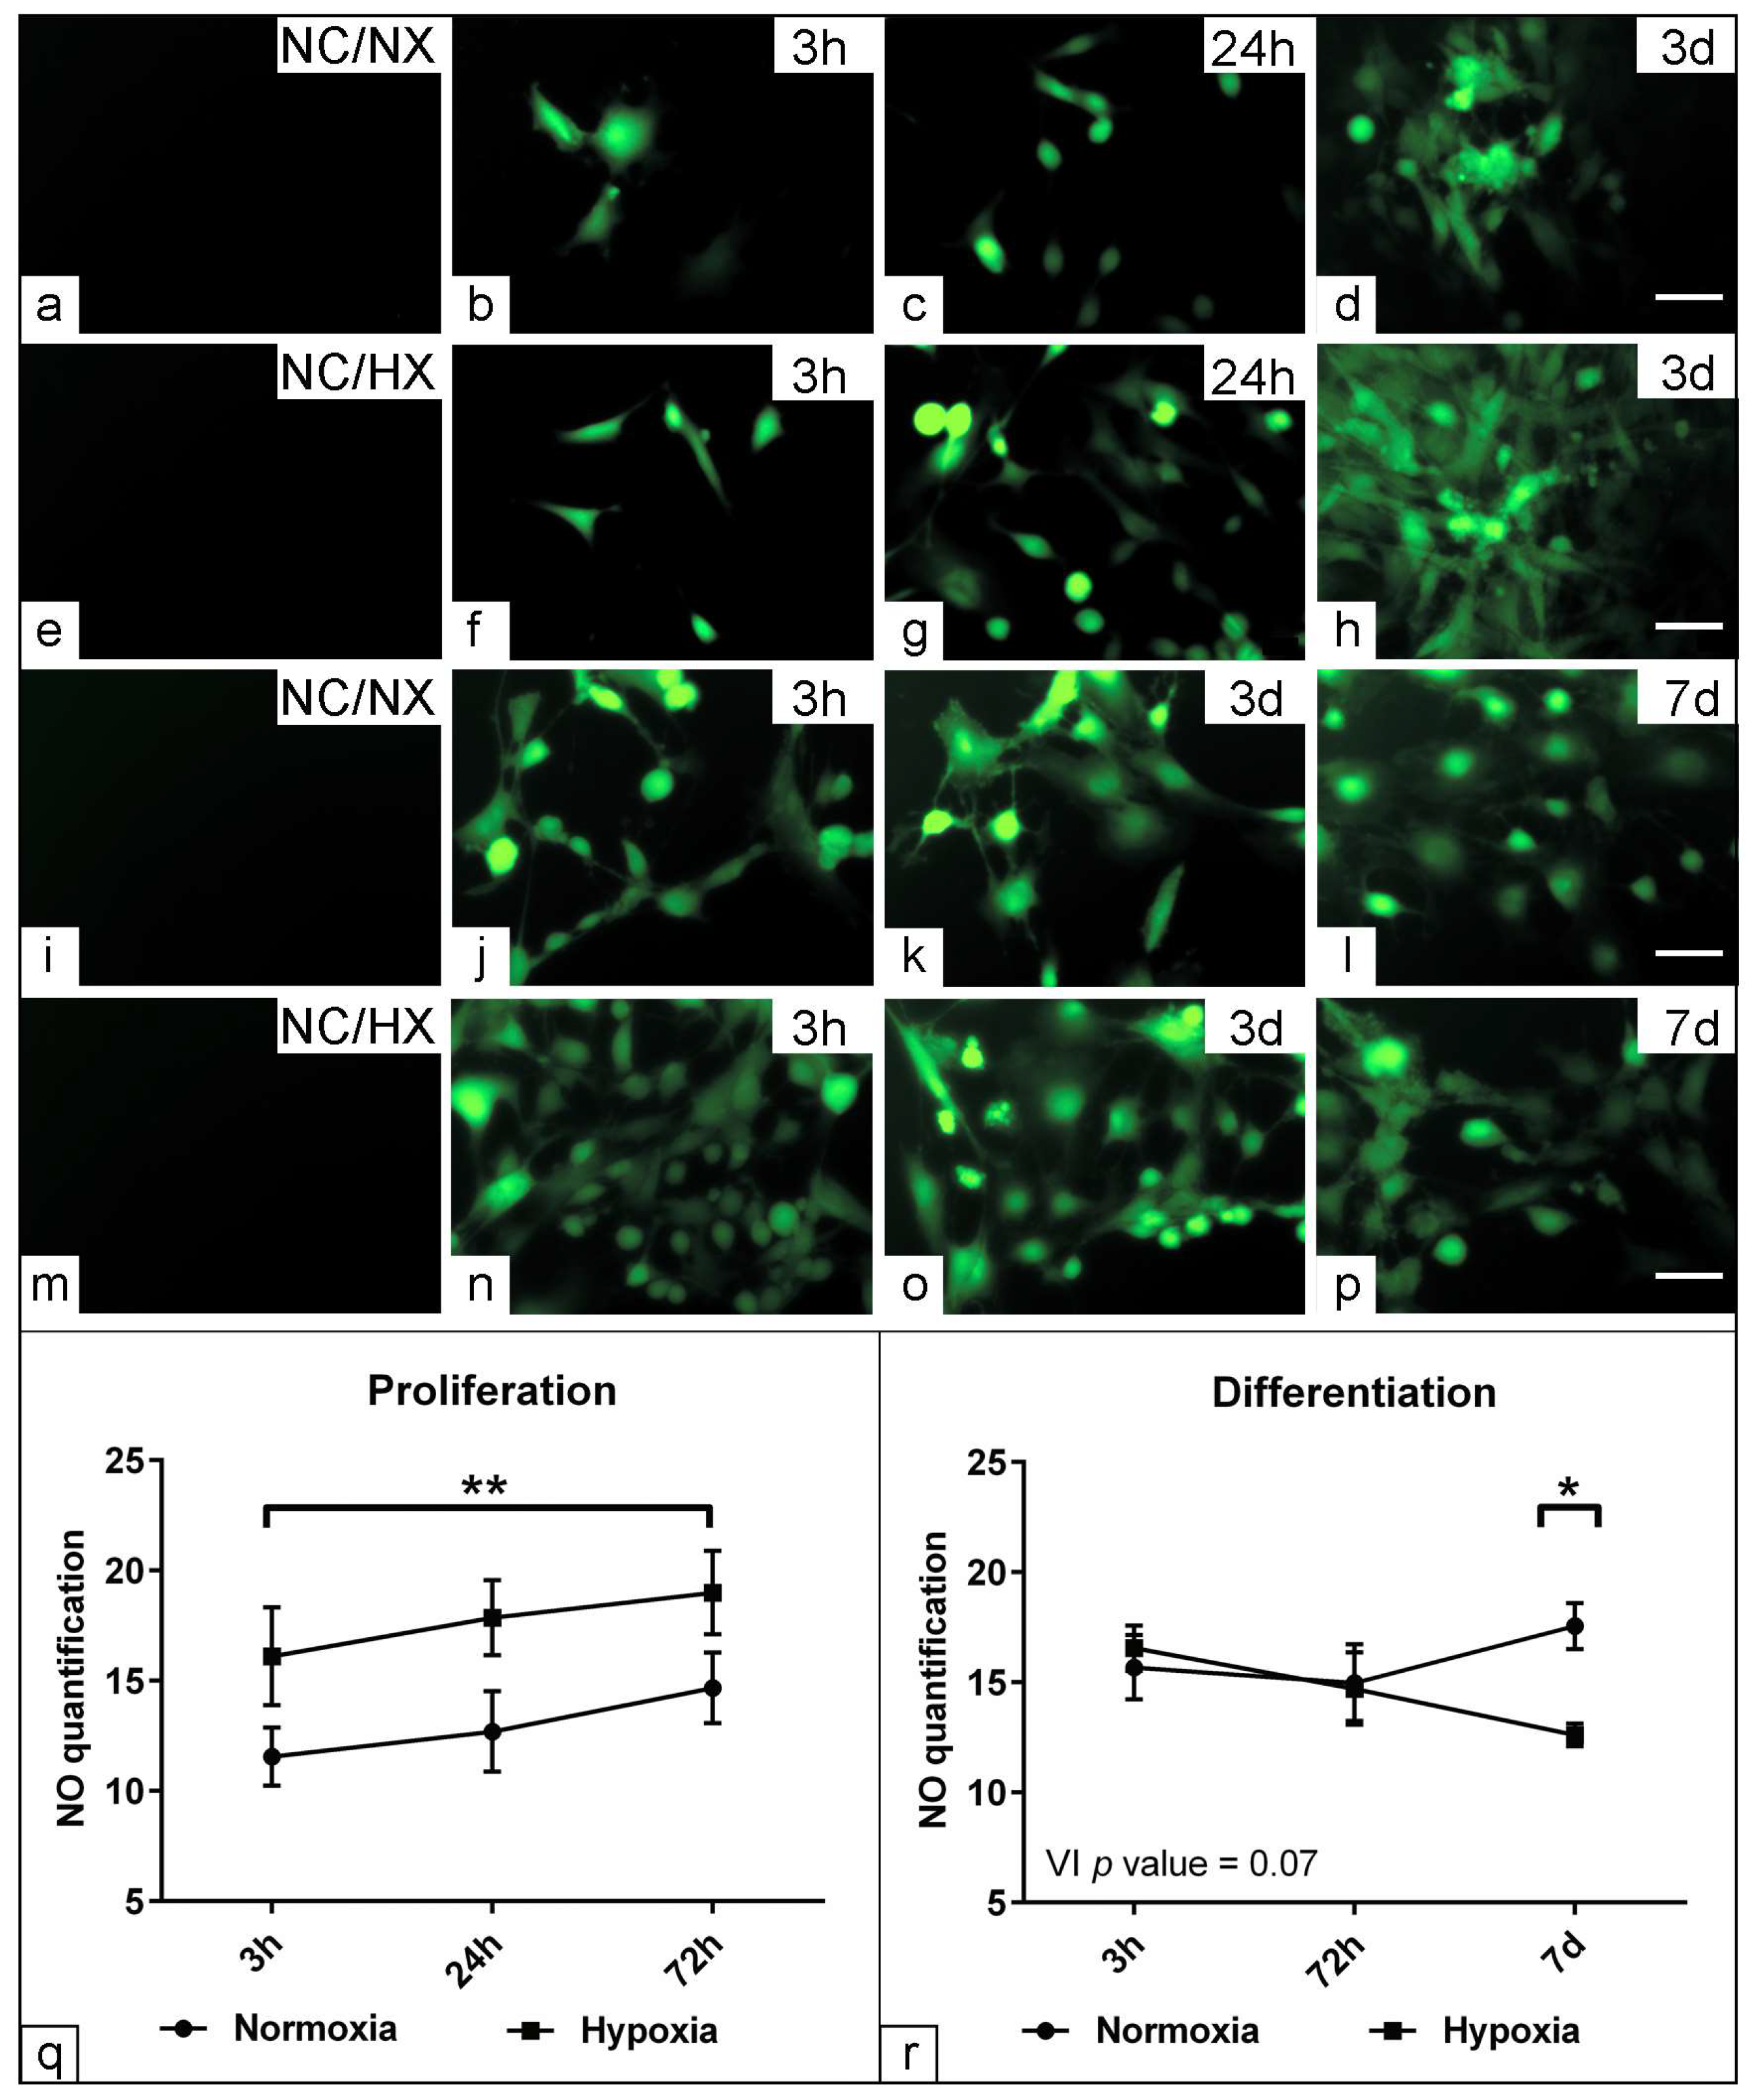
3.7. Assessment the Effect of Hypoxia on Nitric Oxide Production

To examine whether hypoxic conditions promote nitric oxide production, DAF-FM staining in the course of myogenic differentiation as an indicative parameter for nitric oxide synthase activity was carried out. The data observation demonstrated a gradual increase in NO staining intensity up to 3 days in the growth medium compared to the early time point after 3 h. Under hypoxia induction, there was a marked increase in NO staining at all time points compared to the cells cultivated under normoxia (Figure 7a–h). In the myogenic differentiation medium, NO staining was weaker on day 7 for both experimental conditions compared to day 3 (Figure 7i–p). To confirm this observation, quantification of the NO staining was performed. The data analysis revealed a significant increase in NO production in the proliferating cells under hypoxia (p < 0.01) compared to cells cultured under normoxic conditions (Figure 7q). After differentiation induction, a significant decrease in NO production was detected at day 7 under hypoxia (p < 0.05) compared to those cells cultivated under normoxia. The analysis revealed a tendency for variable interaction (p = 0.07), indicating that hypoxia modulates the reduction in the NO production (Figure 7r).

4. Discussion

Cellular microenvironment parameters, such as mechanical FSS and hypoxia, play a central role in the physiological performance and the regenerative capacity of stem cells. Investigation of the cell niche is essential to gain insights into the physiological microenvironment, to optimize protocols for cell cultivation and differentiation in vitro, and to improve the therapeutic use of muscle stem cells for tissue regeneration. Muscle stem cells are a promising candidate for the treatment of musculoskeletal diseases, but their reduced regenerative potential after cultivation and low viability after transplantation are challenging aspects. To our knowledge, several mechanical stress protocols have been previously described, but there is no standard method for applying shear stress, making it difficult to compare the results of the different groups. Furthermore, little is known about the effect of long-term cultivation under either cyclic or intermittent FSS for muscle stem cells. In the present study, a dynamically oscillating FSS at a level between 1.68 and 2.3 mPa was applied either continuously or periodically for one hour per day for up to 7 days using a controlled mechanical rocking generator.
A variety of different FSS delivery protocols have been extensively studied. These protocols vary in the form, strength, and duration of the FSS applied, as well as the total duration of the experiment. In the present study, a low FSS in the range of 1.68–2.3 mPa was applied to mimic the in vivo interstitial fluid flow in skeletal muscle as previously reported [24,52,55]. Oscillating FSS mimics in vivo conditions and is more appropriate due to the dynamic nature of interstitial fluid flow compared to a unidirectional flow [56]. It was found that a parallel plate flow chamber was used to create a laminar pulsating flow with an average shear stress between 0.4 and 1.4 Pa and a frequency of 1 Hz for 1 h [23]. Intermittent FSS could be applied using an FSS of 0.094 Pa for three cycles consisting of a 10 min stimulation followed by a 10 min pause with a 15 min pause between each cycle using a microfluidic system [57]. On the other hand, a continuous laminar FSS between 3 and 42 mPa for 5 d in conjunction with spatial confinement has also been documented using a microfluidic system [24]. In addition, a pulsed flow FSS between 0 and 1.2 Pa and a pulse frequency of 1 Hz for 1 h have been reported [58].
The present data showed an alteration in cell morphology under both CFSS and PFSS protocols, including a small, elongated cell body with numerous long and short cytoplasmic processes compared to a static culture. The data suggest that cells adapt their cytoskeletal components to minimize the effect of shear forces and establish a stable adhesion. In the same line, it has been documented that the actin cytoskeleton is a mechanosensitive component, and its integrity plays a critical role in the resistance to fluid-induced shear force [59]. Under chronic FSS, morphological changes including changes from a polygonal shape to a spindle shape, aligned with the direction of flow by establishing actin stress fibers, were observed in endothelial cells [58]. Consistent with our data, an investigation of the effect of FSS on renal epithelial cells showed a reorganization of the actin cytoskeleton from parallel F-actin bundles to peripheral bundles combined with an increase in the formation of cell junctions [60]. As a cellular response to FSS, one study observed the short-term contraction of cells followed by combined expansion and orientation to fluid flow, and the homogeneous distribution of F-actin. Consistent with our data, a study concluded that cells changed to a rounded morphology with multiple cytoplasmic processes to enhance their adhesion to overcome mechanical stress [61]. The level of shear force could affect the cell response, and one study showed no alignment of C2C12 myoblasts after 0.07–0.13 Pa of FSS for 6 h [62]. These data suggest that the cell type, level, and type of FSS are critical parameters for inducing mechanical FSS. In contrast to unidirectional FSS, a study found that oscillating FSS resulted in delayed or no reorganization of actin filaments in osteoblasts or osteocytes [56].
The data showed that mechanical FSS promoted cell viability and cell number up to 24 h under both CFSS and PFSS. Although the cell colony size was decreased under both mechanical FSS protocols, the colony distribution as indicated by the colony number was increased only under PFSS. The results suggest that the applied stress enhances cell viability; however, the resting period of 1 h as shown in PFSS was sufficient to facilitate colony distribution. Such performance improves the stemness as well as the regenerative ability of stem cells. In contrast, the area of colonies tended to be smaller in both FSS culture conditions to minimize the area exposed to FSS and establish balanced adhesion. The results demonstrate that the duration of FSS applied has a central influence on the function of myoblasts. Previous studies have shown that intermittent mechanical stimulation allows cells to recover and establish adhesion by modulating their cytoskeleton [63]. Consistent with our data, previous studies showed improved cell proliferation under FSS compared to the static culture condition. One possible interpretation is that FSS may enhance stem cell division. It has been observed that pulsed FSS activates cell cycle progression through the upregulation of proliferation gene expression and the activation of signaling pathways including ERK ½, p38, MAPK, and cyclin-dependent kinase 4 expression in primary satellite cells [58]. A similar study showed an enhanced cell proliferation in C2C12 under dynamic FSS culture conditions [24]. This enhancement of cell viability and cell number has previously been documented in human and equine MSCs under oscillating or pulsating FSS by our group and others [21,64]. The potential for colony formation, and thus the ability for self-renewal, is considered to be a characteristic feature of stem cells [65]. Consistent with our data, a study demonstrated an increase in MSCs migration capacity under very low FSS (~0.001 Pa) comparable to the interstitial fluid flow in vivo [66], which could interpret the increased colony count under PFSS as presented in our data. The effect of FSS on MSC migration was relatively dependent on the strength of the applied FSS. Similar to our data, meanwhile, a low FSS of 0.2 Pa promoted cell migration, whereas a higher FSS of >2 Pa initiated an inhibitory effect on cell migration [67]. In the same line, the pulsating FSS increased the expression of stem cell markers, including SOX2 and Nanog, indicating enhanced stemness properties under mechanical stress [68].
The data showed that myogenic differentiation upregulated MyoD expression in all experimental groups, regardless of the effect of FSS. Although FSS promotes cell viability and colony number, it might delay cells’ commitment to their myogenic fate. In the same line, it was reported that FSS increased the expression of the cyclic cell division in primary myoblasts and enhanced the expression of C-Fos is a subunit of the transcription factor activator protein 1, which inhibits the transcription of MyoD by binding to its promoter, thus maintaining cell proliferation and blocking the cell differentiation [58,69]. Consistent with our results, a study investigating the influence of mechanical stretch on proliferating myoblasts demonstrated a reduced expression of MyoD under mechanical stimulation [70]. Interestingly, the present data showed an increased number of myogenin-positive cells at 72 h only under PFSS conditions, as well as an upregulated mTOR expression in the cells under static and PFSS conditions. The data suggest that under PFSS, the resting period was sufficient to establish cell adhesion and overcome the effect of mechanical FSS by upregulating mTOR and MHC expression. In contrast, the enhanced osteogenic differentiation under CFSS as previously reported for MSCs in equines [21] suggests that either cell type or the differentiation fate might play a role in cell response to the FSS induction. In agreement with our data, a study revealed that intermittent FSS was able to promote osteogenic differentiation more effectively compared to CFSS, which enables a recovery period and enhances the sensitivity to mechanical stimulation [63].
Morphometric evaluation of myotubes, indicative of cell differentiation capacity, showed a reduction in myonuclear fusion and myotube formation under PFSS compared to CFSS. The data suggest improved cell differentiation under CFSS; however, more shear stress should be applied to achieve significant differentiation induction. In agreement with our data, another study demonstrated that an FSS of 16 mPa effectively induced myogenic differentiation in C2C12 cells characterized by the formation of long myotubes aligned with the direction of flow together with an elongation of the cell nuclei. In contrast, an FSS of 3 mPa was less able to trigger myogenic differentiation parameters [24]. In the present work, neither an orientation of the myotubes nor an elongation of the cell nucleus could be detected, possibly due to the different values of the FSS, as well as the different forms of the applied FSS in terms of a laminar flow compared to an oscillating FSS in the present study. A similar study using pulsating FSS reported no differences in MyoD and myogenin expression in primary murine myoblasts compared to static conditions [58].
Like mechanical FSS, oxygen concentration plays an important role in the performance of stem cells. It is well established that oxygen concentration in the muscle is lower than the atmospheric O2, suggesting that the standard in vitro cultivation might provide inaccurate parameters about the in vivo stem cell response. The present results demonstrated an improved cell viability up to 72 h under 3% O2 compared to 21% O2, which was confirmed by a parallel increase in cell count. Interestingly, however, a reduction in the cell count after 72 h was combined with no changes in cell viability under hypoxia. The data suggest that hypoxia promoted cell viability even with a low cell number. Similar results have previously been reported by our group for up to 7 days of cultivation under hypoxia [40]. Consistent with these results, hypoxic conditions enhance the proliferation of primary satellite cells isolated from mice, rats, bovine, and humans [14,37,38,71]. The data suggest that hypoxia activates cell cyclic progression, intracellular regulators, and signaling pathways that promote cell viability. In agreement with this, another study revealed that a 3% oxygen concentration activates G1/S cyclins and cyclin-dependent kinases, while it inhibits cell cycle inhibitor p27 and phosphorylation of Akt, which induces enhanced cell proliferation [37]. In the same line as previous results, an increase in the number of colonies was detected under hypoxia. Similar reports have concluded that the combined high number of colonies under hypoxia condition was a result of increased metabolic activity and the high doubling capacity [37,40].
Our data exhibited a reduction in the number of MyoD-positive cells after 24 h and myogenin-positive cells after 72 h under hypoxia. Moreover, MyoD was upregulated at 72 h under normoxia while myogenin expression was upregulated at day 7 for both experimental groups, regardless of the effect of hypoxia. Taken altogether, these data suggest that hypoxia impairs the myogenic precursor’s commitment to the myogenic direction. In the same line, another study demonstrated inhibition of myogenic differentiation at day 3 under 0.5% O2; in contrast, an irreversible impairment cell differentiation was detected after day 6 [72]. In addition, hypoxic conditions promote the quiescence of primary mouse myoblasts through the upregulation of Pax7 and the downregulation of MyoD and myogenin [45]. The data indicate that under hypoxia, a failure of cell withdrawal from the cell cycle results in a reduction in the cell population committed for terminal differentiation. Consistent with our data, previous studies showed inhibited myogenic differentiation under physiological to severe hypoxia (≤3% O2) for C2C12 myoblasts as well as primary murine satellite cells [39,40,41,72]. Cell cycle withdrawal plays an important role in terminal differentiation [39]. In the same line, the morphometric analysis results followed a common trend in terms of the reduction in the myotube formation parameters under hypoxia indicative of terminal differentiation, suggesting impaired myogenic differentiation. One possible interpretation is that differentiation under hypoxia reduces the number of myoblasts committed to cell fusion and myotube formation. Another justification of our data is that hypoxia causes a short-term deacetylation of histones related to MyoD promoters, leading to decreased MyoD expression and delayed myogenin expression, with a subsequent reduction in MHC production and myotube formation [72]. Along this line, it was reported that hypoxia activates the transcription factor Bhlhe40 via the p53 signaling pathway, which reduces the binding capacity between MyoD and myogenin, resulting in an inhibition of myogenin expression [41]. A recent study demonstrated that hypoxia suppresses myoblast function through an epigenetic modulation of autophagy as well as the activation of histone deacetylase 9, resulting in an inactivation of canonical Wnt signaling, which impairs MyoD and myogenin expression [43].
The analysis revealed upregulated VEGF expression in the myogenic differentiated cells under hypoxia compared to non-induced cells, suggesting the induction of an angiogenic response to compensate for the low O2 concentration. A similar report showed increased VEGF mRNA expression under hypoxia [46,73,74]. In contrast to hypoxia, an upregulated mTOR expression was detected under normoxia, indicative of increased protein synthesis and justifying the impaired myotube formation shown under hypoxia. Unexpectedly, the upregulation of MHC1 and MHC7 was detected after day 7 under hypoxia without an increase in mTOR expression, suggesting impaired myogenic differentiation. In agreement with our results, a study revealed that hypoxia converts the myogenic potential of insulin growth factors (IGFs) into a mitogenic effect by suppressing the IGF-induced Akt/mTOR and p38 signaling pathway [42]. The inhibition of the Akt/mTOR signaling pathway was referred to as a hypoxia-related reduction in IGF-1 receptor sensitivity [75]. Similarly, it was found that the activation of HIF1α under hypoxia suppresses myogenic differentiation, on the one hand by activating the Notch signaling pathway and on the other hand by inhibiting the canonical Wnt signaling pathway [44,76].
The transcription factor HIF1α plays for a crucial role in maintaining oxygen homeostasis and regulating cellular adaptations under hypoxia [29]. Our results indicate that there was a variability in HIF1α expression for both experimental conditions at 3 h, 72 h, and day 7, but this was not statistically significant. The data suggest that the inconsistency in HIF1α expression may be due to its short lifespan and rapid adjustment of mRNA expression. Consistent with previous studies, our results demonstrate that the gene expression of HIF1α remains unchanged or even reduced under 1% O2 concentration in myoblasts [46,73,74]. Similarly, a study found that the increase in HIF1α expression in vivo under hypoxia is only temporary or non-existent in many cell lines [29]. On the other hand, HIF1α seems to play a role in myogenic differentiation under normoxic conditions, and it was reported that under normoxic conditions, constant HIF1α expression was observed in regenerating myotubes during the course of myogenic differentiation [77,78]. Additionally, similarly large amounts of HIF1α protein were detected in skeletal muscles under both hypoxic and normoxic conditions [79].
It is well established that nitric oxide plays an important role in cellular perception and contributes to oxygen homeostasis [49]. The present study showed a significant increase in NO production early during cell proliferation under hypoxic conditions; in contrast, a reduction in NO production was detected at late differentiation. The analysis suggests that hypoxia modulates NOS1 activity, leading to enhanced cell proliferation in the early myogenesis. Another study reported enhanced NOS1 expression in adult muscle fibers, as well as during myogenesis, indicating that NO has important physiological functions [80]. In the same line, a study found increased NOS1 protein and mRNA levels in various tissues, including skeletal muscle, after hypoxic exercise [81,82,83]. In contrast, a study reported no differences in NOS1 expression or NO production in primary mouse myoblasts between cultivation under 6% O2 and 20% O2 [84]. This is consistent with other studies reporting increasing NOS1 protein levels during myogenic differentiation under normoxia [85,86]. Furthermore, NO was found to play an important role in the fusion process of differentiating myotubes [87]. In addition, it was documented that the expression of NOS1 was increased by muscle activity [88]. The finding that NOS1 expression was downregulated in differentiating myoblasts could be due to the fact that a low oxygen concentration impairs cell differentiation and NOS1 activity requires a sufficient O2 concentration, as the present data shows under normoxia. Thus, the data provide evidence that NOS1 expression is essential for the maturation of myotubes and terminal myogenic differentiation.

5. Conclusions

The current study shows that muscle stem cells exhibit various responses under both mechanical FSS protocols, as well as under hypoxia, regarding cell viability and differentiation parameters. Although both stressors induced a positive effect on cell viability and colony distribution, the differentiation capacity was different. In contrast to hypoxia, the application of cyclic FSS promoted myogenic differentiation by upregulating myogenic markers expression, enhancing myotube formation and protein synthesis, as indicated by activation of mTOR signaling. We provide evidence of impaired cell differentiation under hypoxia, suggesting that a sufficient oxygen concentration is critical for muscle precursors’ commitment into myogenic lineage. The data provide evidence of enhanced angiogenesis under hypoxia to compensate for the low O2 concentration. Taken together, the data highlight the cell response to ectopic stressors in their microenvironment including mechanical FSS and hypoxic conditions. By considering and optimizing these parameters during in vitro cultivation, we could potentially improve cell transplantation and enhance the regenerative potential of stem cells in the context of cell-based therapies.

Author Contributions

Conceptualization, M.I.E. and S.A.; methodology, P.H. and M.I.E.; software, M.C.K.; validation, P.H., M.I.E. and A.E.; formal analysis, M.I.E. and M.C.K.; investigation, P.H.; resources, A.E.; data curation, P.H., M.I.E. and A.E.; writing—original draft preparation, P.H.; writing—review and editing, M.I.E., S.W. and S.A.; visualization, S.W. and S.A.; supervision, S.W., M.I.E. and S.A.; project administration, M.I.E.; funding acquisition, S.A. and S.W. All authors have read and agreed to the published version of the manuscript.

Funding

This research received no external funding.

Institutional Review Board Statement

The study was conducted by Justus-Liebig-University of Giessen institutional ethics committee Nr. V 54-19 c 20 15 h 02 GI 18/1 kTV 1/2018 and the Regierungspräsidium Giessen (approval code: GI 20/10 Nr. 105/2014).

Informed Consent Statement

Not applicable.

Data Availability Statement

The data presented in this study are available upon reasonable request from the corresponding author. The data are not publicly available due to privacy reasons.

Acknowledgments

The authors thank Manuela Heimann and Eva Kammer for their technical support.

Conflicts of Interest

The authors declare no conflicts of interest.

References

  1. Armand, A.-S.; Launay, T.; Della Gaspera, B.; Charbonnier, F.; Gallien, C.L.; Chanoine, C. Effects of eccentric treadmill running on mouse soleus: Degeneration/regeneration studied with Myf-5 and MyoD probes. Acta Physiol. Scand. 2003, 179, 75–84. [Google Scholar] [CrossRef] [PubMed]
  2. Serrano, A.L.; Mann, C.J.; Vidal, B.; Ardite, E.; Perdiguero, E.; Muñoz-Cánoves, P. Cellular and molecular mechanisms regulating fibrosis in skeletal muscle repair and disease. Curr. Top. Dev. Biol. 2011, 96, 167–201. [Google Scholar] [CrossRef] [PubMed]
  3. Cooper, R.N.; Tajbakhsh, S.; Mouly, V.; Cossu, G.; Buckingham, M.; Butler-Browne, G.S. In vivo satellite cell activation via Myf5 and MyoD in regenerating mouse skeletal muscle. J. Cell Sci. 1999, 112 Pt 17, 2895–2901. [Google Scholar] [CrossRef] [PubMed]
  4. Zammit, P.S.; Golding, J.P.; Nagata, Y.; Hudon, V.; Partridge, T.A.; Beauchamp, J.R. Muscle satellite cells adopt divergent fates: A mechanism for self-renewal? J. Cell Biol. 2004, 166, 347–357. [Google Scholar] [CrossRef] [PubMed]
  5. Hernández-Hernández, J.M.; García-González, E.G.; Brun, C.E.; Rudnicki, M.A. The myogenic regulatory factors, determinants of muscle development, cell identity and regeneration. Semin. Cell Dev. Biol. 2017, 72, 10–18. [Google Scholar] [CrossRef]
  6. Zhou, Z.; Bornemann, A. MRF4 protein expression in regenerating rat muscle. J. Muscle Res. Cell Motil. 2001, 22, 311–316. [Google Scholar] [CrossRef]
  7. Boers, H.E.; Haroon, M.; Le Grand, F.; Bakker, A.D.; Klein-Nulend, J.; Jaspers, R.T. Mechanosensitivity of aged muscle stem cells. J. Orthop. Res. 2018, 36, 632–641. [Google Scholar] [CrossRef]
  8. Park, J.-H.; Ushida, T.; Akimoto, T. Control of cell differentiation by mechanical stress. JPFSM 2013, 2, 49–62. [Google Scholar] [CrossRef]
  9. Li, E.W.; McKee-Muir, O.C.; Gilbert, P.M. Cellular Biomechanics in Skeletal Muscle Regeneration. Curr. Top. Dev. Biol. 2018, 126, 125–176. [Google Scholar] [CrossRef]
  10. McCullen, S.D.; Haslauer, C.M.; Loboa, E.G. Musculoskeletal mechanobiology: Interpretation by external force and engineered substratum. J. Biomech. 2010, 43, 119–127. [Google Scholar] [CrossRef]
  11. Simmons, C.A.; Matlis, S.; Thornton, A.J.; Chen, S.; Wang, C.Y.; Mooney, D.J. Cyclic strain enhances matrix mineralization by adult human mesenchymal stem cells via the extracellular signal-regulated kinase (ERK1/2) signaling pathway. J. Biomech. 2003, 36, 1087–1096. [Google Scholar] [CrossRef]
  12. Sen, B.; Xie, Z.; Case, N.; Ma, M.; Rubin, C.; Rubin, J. Mechanical strain inhibits adipogenesis in mesenchymal stem cells by stimulating a durable beta-catenin signal. Endocrinology 2008, 149, 6065–6075. [Google Scholar] [CrossRef] [PubMed]
  13. Vandenburgh, H.; Kaufman, S. In vitro model for stretch-induced hypertrophy of skeletal muscle. Science 1979, 203, 265–268. [Google Scholar] [CrossRef]
  14. Kook, S.-H.; Son, Y.-O.; Lee, K.-Y.; Lee, H.-J.; Chung, W.-T.; Choi, K.-C.; Lee, J.-C. Hypoxia affects positively the proliferation of bovine satellite cells and their myogenic differentiation through up-regulation of MyoD. Cell Biol. Int. 2008, 32, 871–878. [Google Scholar] [CrossRef]
  15. Tatsumi, R. Mechano-biology of skeletal muscle hypertrophy and regeneration: Possible mechanism of stretch-induced activation of resident myogenic stem cells. Anim. Sci. J. 2010, 81, 11–20. [Google Scholar] [CrossRef] [PubMed]
  16. Grodzinsky, A.J.; Levenston, M.E.; Jin, M.; Frank, E.H. Cartilage tissue remodeling in response to mechanical forces. Annu. Rev. Biomed. Eng. 2000, 2, 691–713. [Google Scholar] [CrossRef] [PubMed]
  17. Rath, B.; Nam, J.; Knobloch, T.J.; Lannutti, J.J.; Agarwal, S. Compressive forces induce osteogenic gene expression in calvarial osteoblasts. J. Biomech. 2008, 41, 1095–1103. [Google Scholar] [CrossRef]
  18. Cezar, C.A.; Roche, E.T.; Vandenburgh, H.H.; Duda, G.N.; Walsh, C.J.; Mooney, D.J. Biologic-free mechanically induced muscle regeneration. Proc. Natl. Acad. Sci. USA 2016, 113, 1534–1539. [Google Scholar] [CrossRef]
  19. Arora, S.; Srinivasan, A.; Leung, C.M.; Toh, Y.-C. Bio-mimicking Shear Stress Environments for Enhancing Mesenchymal Stem Cell Differentiation. Curr. Stem Cell Res. Ther. 2020, 15, 414–427. [Google Scholar] [CrossRef]
  20. Kim, H.W.; Lim, J.; Rhie, J.W.; Kim, D.S. Investigation of effective shear stress on endothelial differentiation of human adipose-derived stem cells with microfluidic screening device. Microelectron. Eng. 2017, 174, 24–27. [Google Scholar] [CrossRef]
  21. Elashry, M.I.; Gegnaw, S.T.; Klymiuk, M.C.; Wenisch, S.; Arnhold, S. Influence of mechanical fluid shear stress on the osteogenic differentiation protocols for Equine adipose tissue-derived mesenchymal stem cells. Acta Histochem. 2019, 121, 344–353. [Google Scholar] [CrossRef]
  22. Evertz, L.Q.; Greising, S.M.; Morrow, D.A.; Sieck, G.C.; Kaufman, K.R. Analysis of fluid movement in skeletal muscle using fluorescent microspheres. Muscle Nerve 2016, 54, 444–450. [Google Scholar] [CrossRef] [PubMed]
  23. Juffer, P.; Bakker, A.D.; Klein-Nulend, J.; Jaspers, R.T. Mechanical loading by fluid shear stress of myotube glycocalyx stimulates growth factor expression and nitric oxide production. Cell Biochem. Biophys. 2014, 69, 411–419. [Google Scholar] [CrossRef]
  24. Naskar, S.; Kumaran, V.; Basu, B. On The Origin of Shear Stress Induced Myogenesis Using PMMA Based Lab-on-Chip. ACS Biomater. Sci. Eng. 2017, 3, 1154–1171. [Google Scholar] [CrossRef]
  25. Haroon, M.; Boers, H.E.; Bakker, A.D.; Bloks, N.G.C.; Hoogaars, W.M.H.; Giordani, L.; Musters, R.J.P.; Deldicque, L.; Koppo, K.; Le Grand, F.; et al. Reduced growth rate of aged muscle stem cells is associated with impaired mechanosensitivity. Aging 2022, 14, 28–53. [Google Scholar] [CrossRef]
  26. Beaudry, M.; Hidalgo, M.; Launay, T.; Bello, V.; Darribère, T. Regulation of myogenesis by environmental hypoxia. J. Cell Sci. 2016, 129, 2887–2896. [Google Scholar] [CrossRef]
  27. Chaillou, T.; Lanner, J.T. Regulation of myogenesis and skeletal muscle regeneration: Effects of oxygen levels on satellite cell activity. FASEB J. 2016, 30, 3929–3941. [Google Scholar] [CrossRef] [PubMed]
  28. Csete, M. Oxygen in the cultivation of stem cells. Ann. N. Y. Acad. Sci. 2005, 1049, 1–8. [Google Scholar] [CrossRef] [PubMed]
  29. Semenza, G.L. Oxygen homeostasis. Wiley Interdiscip. Rev. Syst. Biol. Med. 2010, 2, 336–361. [Google Scholar] [CrossRef]
  30. Jash, S.; Adhya, S. Effects of Transient Hypoxia versus Prolonged Hypoxia on Satellite Cell Proliferation and Differentiation In Vivo. Stem Cells Int. 2015, 2015, 961307. [Google Scholar] [CrossRef]
  31. Matsubara, Y.; Matsumoto, T.; Aoyagi, Y.; Tanaka, S.; Okadome, J.; Morisaki, K.; Shirabe, K.; Maehara, Y. Sarcopenia is a prognostic factor for overall survival in patients with critical limb ischemia. J. Vasc. Surg. 2015, 61, 945–950. [Google Scholar] [CrossRef]
  32. de Theije, C.; Costes, F.; Langen, R.C.; Pison, C.; Gosker, H.R. Hypoxia and muscle maintenance regulation: Implications for chronic respiratory disease. Curr. Opin. Clin. Nutr. Metab. Care 2011, 14, 548–553. [Google Scholar] [CrossRef]
  33. Chaillou, T.; Koulmann, N.; Meunier, A.; Pugnière, P.; McCarthy, J.J.; Beaudry, M.; Bigard, X. Ambient hypoxia enhances the loss of muscle mass after extensive injury. Pflugers Arch. 2014, 466, 587–598. [Google Scholar] [CrossRef] [PubMed]
  34. Favier, F.B.; Costes, F.; Defour, A.; Bonnefoy, R.; Lefai, E.; Baugé, S.; Peinnequin, A.; Benoit, H.; Freyssenet, D. Downregulation of Akt/mammalian target of rapamycin pathway in skeletal muscle is associated with increased REDD1 expression in response to chronic hypoxia. Am. J. Physiol. Regul. Integr. Comp. Physiol. 2010, 298, R1659–R1666. [Google Scholar] [CrossRef] [PubMed]
  35. Chaillou, T.; Koulmann, N.; Meunier, A.; Chapot, R.; Serrurier, B.; Beaudry, M.; Bigard, X. Effect of hypoxia exposure on the recovery of skeletal muscle phenotype during regeneration. Mol. Cell. Biochem. 2014, 390, 31–40. [Google Scholar] [CrossRef] [PubMed]
  36. Morrison, S.J.; Csete, M.; Groves, A.K.; Melega, W.; Wold, B.; Anderson, D.J. Culture in reduced levels of oxygen promotes clonogenic sympathoadrenal differentiation by isolated neural crest stem cells. J. Neurosci. 2000, 20, 7370–7376. [Google Scholar] [CrossRef]
  37. Chakravarthy, M.V.; Spangenburg, E.E.; Booth, F.W. Culture in low levels of oxygen enhances in vitro proliferation potential of satellite cells from old skeletal muscles. Cell. Mol. Life Sci. 2001, 58, 1150–1158. [Google Scholar] [CrossRef]
  38. Csete, M.; Walikonis, J.; Slawny, N.; Wei, Y.; Korsnes, S.; Doyle, J.C.; Wold, B. Oxygen-mediated regulation of skeletal muscle satellite cell proliferation and adipogenesis in culture. J. Cell. Physiol. 2001, 189, 189–196. [Google Scholar] [CrossRef]
  39. Di Carlo, A.; de Mori, R.; Martelli, F.; Pompilio, G.; Capogrossi, M.C.; Germani, A. Hypoxia inhibits myogenic differentiation through accelerated MyoD degradation. J. Biol. Chem. 2004, 279, 16332–16338. [Google Scholar] [CrossRef]
  40. Elashry, M.I.; Kinde, M.; Klymiuk, M.C.; Eldaey, A.; Wenisch, S.; Arnhold, S. The effect of hypoxia on myogenic differentiation and multipotency of the skeletal muscle-derived stem cells in mice. Stem Cell Res. Ther. 2022, 13, 56. [Google Scholar] [CrossRef]
  41. Wang, C.; Liu, W.; Liu, Z.; Chen, L.; Liu, X.; Kuang, S. Hypoxia Inhibits Myogenic Differentiation through p53 Protein-dependent Induction of Bhlhe40 Protein. J. Biol. Chem. 2015, 290, 29707–29716. [Google Scholar] [CrossRef] [PubMed]
  42. Ren, H.; Accili, D.; Duan, C. Hypoxia converts the myogenic action of insulin-like growth factors into mitogenic action by differentially regulating multiple signaling pathways. Proc. Natl. Acad. Sci. USA 2010, 107, 5857–5862. [Google Scholar] [CrossRef]
  43. Zhang, Z.; Zhang, L.; Zhou, Y.; Li, L.; Zhao, J.; Qin, W.; Jin, Z.; Liu, W. Increase in HDAC9 suppresses myoblast differentiation via epigenetic regulation of autophagy in hypoxia. Cell Death Dis. 2019, 10, 552. [Google Scholar] [CrossRef] [PubMed]
  44. Gustafsson, M.V.; Zheng, X.; Pereira, T.; Gradin, K.; Jin, S.; Lundkvist, J.; Ruas, J.L.; Poellinger, L.; Lendahl, U.; Bondesson, M. Hypoxia requires notch signaling to maintain the undifferentiated cell state. Dev. Cell 2005, 9, 617–628. [Google Scholar] [CrossRef] [PubMed]
  45. Liu, W.; Wen, Y.; Bi, P.; Lai, X.; Liu, X.S.; Liu, X.; Kuang, S. Hypoxia promotes satellite cell self-renewal and enhances the efficiency of myoblast transplantation. Development 2012, 139, 2857–2865. [Google Scholar] [CrossRef] [PubMed]
  46. Itoigawa, Y.; Kishimoto, K.N.; Okuno, H.; Sano, H.; Kaneko, K.; Itoi, E. Hypoxia induces adipogenic differentitation of myoblastic cell lines. Biochem. Biophys. Res. Commun. 2010, 399, 721–726. [Google Scholar] [CrossRef] [PubMed]
  47. Forsythe, J.A.; Jiang, B.H.; Iyer, N.V.; Agani, F.; Leung, S.W.; Koos, R.D.; Semenza, G.L. Activation of vascular endothelial growth factor gene transcription by hypoxia-inducible factor 1. Mol. Cell. Biol. 1996, 16, 4604–4613. [Google Scholar] [CrossRef] [PubMed]
  48. Rissanen, T.T.; Vajanto, I.; Ylä-Herttuala, S. Gene therapy for therapeutic angiogenesis in critically ischaemic lower limb—On the way to the clinic. Eur. J. Clin. Investig. 2001, 31, 651–666. [Google Scholar] [CrossRef] [PubMed]
  49. Jeffrey Man, H.S.; Tsui, A.K.Y.; Marsden, P.A. Nitric oxide and hypoxia signaling. Vitam. Horm. 2014, 96, 161–192. [Google Scholar] [CrossRef]
  50. Michel, T.; Feron, O. Nitric oxide synthases: Which, where, how, and why? J. Clin. Investig. 1997, 100, 2146–2152. [Google Scholar] [CrossRef]
  51. Blau, H.M.; Pavlath, G.K.; Hardeman, E.C.; Chiu, C.P.; Silberstein, L.; Webster, S.G.; Miller, S.C.; Webster, C. Plasticity of the differentiated state. Science 1985, 230, 758–766. [Google Scholar] [CrossRef] [PubMed]
  52. Zhou, X.; Liu, D.; You, L.; Wang, L. Quantifying fluid shear stress in a rocking culture dish. J. Biomech. 2010, 43, 1598–1602. [Google Scholar] [CrossRef] [PubMed]
  53. Orellana, E.A.; Kasinski, A.L. Sulforhodamine B (SRB) Assay in Cell Culture to Investigate Cell Proliferation. Bio-Protocol 2016, 6, e1984. [Google Scholar] [CrossRef] [PubMed]
  54. Schmittgen, T.D.; Livak, K.J. Analyzing real-time PCR data by the comparative CT method. Nat. Protoc. 2008, 3, 1101–1108. [Google Scholar] [CrossRef]
  55. Wang, Q.; Pei, S.; Lu, X.L.; Wang, L.; Wu, Q. On the characterization of interstitial fluid flow in the skeletal muscle endomysium. J. Mech. Behav. Biomed. Mater. 2020, 102, 103504. [Google Scholar] [CrossRef] [PubMed]
  56. Ponik, S.M.; Triplett, J.W.; Pavalko, F.M. Osteoblasts and osteocytes respond differently to oscillatory and unidirectional fluid flow profiles. J. Cell. Biochem. 2007, 100, 794–807. [Google Scholar] [CrossRef] [PubMed]
  57. Kurth, F.; Franco-Obregón, A.; Casarosa, M.; Küster, S.K.; Wuertz-Kozak, K.; Dittrich, P.S. Transient receptor potential vanilloid 2-mediated shear-stress responses in C2C12 myoblasts are regulated by serum and extracellular matrix. FASEB J. 2015, 29, 4726–4737. [Google Scholar] [CrossRef] [PubMed]
  58. Haroon, M.; Klein-Nulend, J.; Bakker, A.D.; Jin, J.; Seddiqi, H.; Offringa, C.; de Wit, G.M.J.; Le Grand, F.; Giordani, L.; Liu, K.J.; et al. Myofiber stretch induces tensile and shear deformation of muscle stem cells in their native niche. Biophys. J. 2021, 120, 2665–2678. [Google Scholar] [CrossRef]
  59. Malek, A.M.; Izumo, S. Mechanism of endothelial cell shape change and cytoskeletal remodeling in response to fluid shear stress. J. Cell Sci. 1996, 109 Pt 4, 713–726. [Google Scholar] [CrossRef]
  60. Verma, D.; Ye, N.; Meng, F.; Sachs, F.; Rahimzadeh, J.; Hua, S.Z. Interplay between cytoskeletal stresses and cell adaptation under chronic flow. PLoS ONE 2012, 7, e44167. [Google Scholar] [CrossRef]
  61. Xu, H.; Duan, J.; Ren, L.; Yang, P.; Yang, R.; Li, W.; Zhao, D.; Shang, P.; Jiang, J.X. Impact of flow shear stress on morphology of osteoblast-like IDG-SW3 cells. J. Bone Miner. Metab. 2018, 36, 529–536. [Google Scholar] [CrossRef] [PubMed]
  62. Sinha, R.; Le Gac, S.; Verdonschot, N.; van den Berg, A.; Koopman, B.; Rouwkema, J. A medium throughput device to study the effects of combinations of surface strains and fluid-flow shear stresses on cells. Lab Chip 2015, 15, 429–439. [Google Scholar] [CrossRef] [PubMed]
  63. Liu, L.; Yu, B.; Chen, J.; Tang, Z.; Zong, C.; Shen, D.; Zheng, Q.; Tong, X.; Gao, C.; Wang, J. Different effects of intermittent and continuous fluid shear stresses on osteogenic differentiation of human mesenchymal stem cells. Biomech. Model. Mechanobiol. 2012, 11, 391–401. [Google Scholar] [CrossRef] [PubMed]
  64. Riddle, R.C.; Taylor, A.F.; Genetos, D.C.; Donahue, H.J. MAP kinase and calcium signaling mediate fluid flow-induced human mesenchymal stem cell proliferation. Am. J. Physiol. Cell Physiol. 2006, 290, C776–C784. [Google Scholar] [CrossRef] [PubMed]
  65. Pochampally, R. Colony forming unit assays for MSCs. Methods Mol. Biol. 2008, 449, 83–91. [Google Scholar] [CrossRef] [PubMed]
  66. Gao, X.; Zhang, X.; Xu, H.; Zhou, B.; Wen, W.; Qin, J. Regulation of cell migration and osteogenic differentiation in mesenchymal stem cells under extremely low fluidic shear stress. Biomicrofluidics 2014, 8, 052008. [Google Scholar] [CrossRef]
  67. Yuan, L.; Sakamoto, N.; Song, G.; Sato, M. Migration of human mesenchymal stem cells under low shear stress mediated by mitogen-activated protein kinase signaling. Stem Cells Dev. 2012, 21, 2520–2530. [Google Scholar] [CrossRef]
  68. Kuo, Y.-C.; Chang, T.-H.; Hsu, W.-T.; Zhou, J.; Lee, H.-H.; Hui-Chun Ho, J.; Chien, S.; Lee, O.K.-S. Oscillatory shear stress mediates directional reorganization of actin cytoskeleton and alters differentiation propensity of mesenchymal stem cells. Stem Cells 2015, 33, 429–442. [Google Scholar] [CrossRef]
  69. Pedraza-Alva, G.; Zingg, J.M.; Jost, J.P. AP-1 binds to a putative cAMP response element of the MyoD1 promoter and negatively modulates MyoD1 expression in dividing myoblasts. J. Biol. Chem. 1994, 269, 6978–6985. [Google Scholar] [CrossRef]
  70. Akimoto, T.; Ushida, T.; Miyaki, S.; Tateishi, T.; Fukubayashi, T. Mechanical stretch is a down-regulatory signal for differentiation of C2C12 myogenic cells. Mater. Sci. Eng. C 2001, 17, 75–78. [Google Scholar] [CrossRef]
  71. Koning, M.; Werker, P.M.N.; van Luyn, M.J.A.; Harmsen, M.C. Hypoxia promotes proliferation of human myogenic satellite cells: A potential benefactor in tissue engineering of skeletal muscle. Tissue Eng. Part A 2011, 17, 1747–1758. [Google Scholar] [CrossRef] [PubMed]
  72. Yun, Z.; Lin, Q.; Giaccia, A.J. Adaptive myogenesis under hypoxia. Mol. Cell. Biol. 2005, 25, 3040–3055. [Google Scholar] [CrossRef] [PubMed]
  73. Cirillo, F.; Resmini, G.; Ghiroldi, A.; Piccoli, M.; Bergante, S.; Tettamanti, G.; Anastasia, L. Activation of the hypoxia-inducible factor 1α promotes myogenesis through the noncanonical Wnt pathway, leading to hypertrophic myotubes. FASEB J. 2017, 31, 2146–2156. [Google Scholar] [CrossRef]
  74. Sellathurai, J.; Nielsen, J.; Hejbøl, E.K.; Jørgensen, L.H.; Dhawan, J.; Nielsen, M.F.B.; Schrøder, H.D. Low Oxygen Tension Enhances Expression of Myogenic Genes When Human Myoblasts Are Activated from G0 Arrest. PLoS ONE 2016, 11, e0158860. [Google Scholar] [CrossRef]
  75. Majmundar, A.J.; Skuli, N.; Mesquita, R.C.; Kim, M.N.; Yodh, A.G.; Nguyen-McCarty, M.; Simon, M.C. O2 regulates skeletal muscle progenitor differentiation through phosphatidylinositol 3-kinase/AKT signaling. Mol. Cell. Biol. 2012, 32, 36–49. [Google Scholar] [CrossRef] [PubMed]
  76. Majmundar, A.J.; Lee, D.S.M.; Skuli, N.; Mesquita, R.C.; Kim, M.N.; Yodh, A.G.; Nguyen-McCarty, M.; Li, B.; Simon, M.C. HIF modulation of Wnt signaling regulates skeletal myogenesis in vivo. Development 2015, 142, 2405–2412. [Google Scholar] [CrossRef]
  77. Ono, Y.; Sensui, H.; Sakamoto, Y.; Nagatomi, R. Knockdown of hypoxia-inducible factor-1alpha by siRNA inhibits C2C12 myoblast differentiation. J. Cell. Biochem. 2006, 98, 642–649. [Google Scholar] [CrossRef] [PubMed]
  78. Wagatsuma, A.; Kotake, N.; Yamada, S. Spatial and temporal expression of hypoxia-inducible factor-1α during myogenesis in vivo and in vitro. Mol. Cell. Biochem. 2011, 347, 145–155. [Google Scholar] [CrossRef]
  79. Stroka, D.M.; Burkhardt, T.; Desbaillets, I.; Wenger, R.H.; Neil, D.A.H.; Bauer, C.; Gassmann, M.A.X.; Candinas, D. HIF-1 is expressed in normoxic tissue and displays an organ-specific regulation under systemic hypoxia. FASEB J. 2001, 15, 2445–2453. [Google Scholar] [CrossRef]
  80. Kobzik, L.; Reid, M.B.; Bredt, D.S.; Stamler, J.S. Nitric oxide in skeletal muscle. Nature 1994, 372, 546–548. [Google Scholar] [CrossRef]
  81. Javeshghani, D.; Sakkal, D.; Mori, M.; Hussain, S.N. Regulation of diaphragmatic nitric oxide synthase expression during hypobaric hypoxia. Am. J. Physiol. Lung Cell. Mol. Physiol. 2000, 279, L520–L527. [Google Scholar] [CrossRef] [PubMed]
  82. Nagahisa, H.; Miyata, H. Influence of hypoxic stimulation on angiogenesis and satellite cells in mouse skeletal muscle. PLoS ONE 2018, 13, e0207040. [Google Scholar] [CrossRef] [PubMed]
  83. Ward, M.E.; Toporsian, M.; Scott, J.A.; Teoh, H.; Govindaraju, V.; Quan, A.; Wener, A.D.; Wang, G.; Bevan, S.C.; Newton, D.C.; et al. Hypoxia induces a functionally significant and translationally efficient neuronal NO synthase mRNA variant. J. Clin. Investig. 2005, 115, 3128–3139. [Google Scholar] [CrossRef] [PubMed]
  84. McCormick, R.; Pearson, T.; Vasilaki, A. Manipulation of environmental oxygen modifies reactive oxygen and nitrogen species generation during myogenesis. Redox Biol. 2016, 8, 243–251. [Google Scholar] [CrossRef] [PubMed]
  85. Abdelmoity, A.; Padre, R.C.; Burzynski, K.E.; Stull, J.T.; Lau, K.S. Neuronal nitric oxide synthase localizes through multiple structural motifs to the sarcolemma in mouse myotubes. FEBS Lett. 2000, 482, 65–70. [Google Scholar] [CrossRef] [PubMed]
  86. Montagna, C.; Rizza, S.; Cirotti, C.; Maiani, E.; Muscaritoli, M.; Musarò, A.; Carrí, M.T.; Ferraro, E.; Cecconi, F.; Filomeni, G. nNOS/GSNOR interaction contributes to skeletal muscle differentiation and homeostasis. Cell Death Dis. 2019, 10, 354. [Google Scholar] [CrossRef]
  87. de Palma, C.; Clementi, E. Nitric oxide in myogenesis and therapeutic muscle repair. Mol. Neurobiol. 2012, 46, 682–692. [Google Scholar] [CrossRef]
  88. Balon, T.W.; Nadler, J.L. Evidence that nitric oxide increases glucose transport in skeletal muscle. J. Appl. Physiol. (1985) 1997, 82, 359–363. [Google Scholar] [CrossRef]
Figure 1. Effect of optimized mechanical fluid shear stress on the cell viability. (ai) Phalloidin staining (green) of C2C12 cultivated under both cyclic fluid shear stress (CFSS) and periodic fluid shear stress (PFSS) in a growth medium after 3 h, 24 h, and 3 d. Cells cultivated in parallel under static condition served as a negative control. Morphologic alterations combined with numerous cellular processes under CFSS (arrow) were observed. (j) Semi-quantitative analysis of cell viability (n = 6) at 570 nm absorbance using MTT assay. (k) Semi-quantitative analysis of cell count (n = 6) at 565 nm absorbance using the sulforhodamine B assay (SRB). (lo) Colony formation unit assay for C2C12 cultivated under CFSS, PFSS and static conditions at various seeding densities: 1 × 10², 5 × 10², and 1 × 10³ cells per flask in a growth medium for 7 days (n = 6). (l) Average colony size (μm2) at 1 × 10³ cell density. (m) Number of colonies at 1 × 10² cell density. (n) Number of colonies at 5 × 10² cell density. (o) Number of colonies at 1 × 10³ cell density. Data are presented as means ± SEM. * = p < 0.05, ** = p < 0.01, *** = p < 0.001. DAPI was used as a nuclear stain (blue). Scale bar = 10 µM.
Applsci 14 03047 g001
Figure 2. Effect of optimized mechanical fluid shear stress on the myogenic differentiation capacity of C2C12 under static, CFSS, and PFSS conditions at 3 h, 72 h and 7 days. Non-induced cells cultivated in basal medium served as a negative control. (a) Percentage of MyoD-positive cells after 24 h. (be) Immunofluorescence shows myogenin-positive cells (red) after 72 h under static, CFSS and PFSS conditions. Cells processed in parallel without adding a primary antibody served as a negative control ((b), NC). (f) Percentage of myogenin-positive cells after 72 h. (g) Relative MyoD expression at 3 h and 72 h. (h) Relative myogenin expression at 3 h and 72 h. (i) Relative myosin heavy chain 7 (MHC7) expression up to 7 days. (j) Relative myosin heavy chain 1 (MHC1) expression up to 7 days. (k) Relative mTOR expression up to 7 days. Data are presented as means ± SEM. * = p < 0.05, ** = p < 0.01, *** = p < 0.001. DAPI was used as a nuclear stain (blue). Scale bar = 10 µM.
Applsci 14 03047 g002
Figure 3. Morphometric assessment of C2C12 following myogenic differentiation under static, CFSS, and PFSS conditions. (a) Number of myotubes (n). (b) Size of myotubes (μm2). (c) Myotube width (μm). (d) Myotube length (μm). (e) Myoblast fusion index (%). The number of nuclei in myotubes was divided by the total number of nuclei within a microscopic field. (f) Quantification of nuclear to cytoplasmic ratio (N/C). The area of the myotubes was divided by the number of nuclei within the myotubes. Data are presented as means ± SEM. * = p < 0.05, ** = p < 0.01.
Applsci 14 03047 g003
Figure 4. Effect of low oxygen concentration on the physiological parameters of muscle precursors after 3h, 24 h, and 72 h under normoxic (NX) and hypoxic conditions (HX). (a) Semi-quantitative analysis of cell viability (n = 6) at 570 nm absorbance using the MTT assay. (b) Semi-quantitative analysis of total cell protein contents indicative of cell number (n = 6) at 565 nm absorbance using SRB assay. (c) Percentage of MyoD-positive cells after 24 h. (d) Percentage of myogenin-positive cells after 72 h. (eh) Immunofluorescence shows myogenin-positive cells (red) after 72 h and (e,f) myosin heavy chain-positive myotubes after 7 days (g,h) under NX and HX conditions. (i,j) Colony formation unit assay for C2C12 cultivated under normoxic and hypoxic conditions in a growth medium for 7 days (n = 6). (i) Number of colonies (n) at 1 × 10² cell density. (j) Average colony size (μm2) at 1 × 10² cell density. Data are presented as means ± SEM. * = p < 0.05, ** = p < 0.01, *** = p < 0.001. DAPI was used as a nuclear stain (blue). Scale bar = 10 µM.
Applsci 14 03047 g004
Figure 5. The effect of hypoxia on myogenic relative markers expression after 3 h, 72 h and 7 days under normoxic (NX) and hypoxic (HX) conditions. (a) Relative MyoD expression. (b) Relative myogenin expression. (c) Relative nitric oxide synthase 1 (NOS1) expression. (d) Relative vascular endothelial growth factor (VEGF) expression. (e) Relative mammalian target of rapamycin (mTOR) expression (f) Relative myosin heavy chain 7 (MHC7) expression. Non-induced cells processed in parallel in basal medium served as a negative control (NC). Data are presented as means ± SEM. * = p < 0.05, ** = p < 0.01.
Applsci 14 03047 g005
Figure 6. Morphometric assessment of myogenic differentiation under hypoxic (HX) compared to normoxic (NX) conditions (n = 6). (a) Number of myotubes. (b) Size of myotubes (μm2). (c) Length of myotube (μm). (d) Myoblast fusion index (%). The number of nuclei in myotubes was divided by the total number of nuclei within a microscopic field. (e) Number of nuclei per individual myotube. (f) Quantification of nuclear to cytoplasmic ratio (N/C). The area of the myotube was divided by the number of nuclei within the myotube. (g,h) Immunofluorescence shows myosin heavy chain-positive myotubes (red) after 7 days under NX and HX conditions, respectively. Data are presented as means ± SEM. * = p < 0.05, ** = p < 0.01. DAPI (blue) was used to visualize the nuclei. Scale bar = 20 µM.
Applsci 14 03047 g006
Figure 7. (ar) Assessment of the effect of hypoxia on nitric oxide (NO) production indicative of nitric oxide synthase (NOS) activity in the C2C12 cells under normoxic and hypoxic conditions. (ah) DAF-FM-stained images show NO-positive cells (green) after cultivation in the growth medium for 3 h, 24 h, and 72 h under hypoxic (HX) compared to normoxic (NX) conditions. (ip) DAF-FM-stained images demonstrate NO-positive cells (green) after cultivation in myogenic differentiation medium for 3 h, 3 d and 7 days under HX compared to NX conditions. Cells processed in parallel without staining served as a negative control (NC). (q) Quantification of NO in proliferating cells (n = 6) under NX and HX conditions. (r) Quantification of NOS in differentiating cells (n = 6) under NX and HX conditions. Data are presented as means ± SEM. * = p < 0.05, ** = p < 0.01. Variable interaction (VI). Scale bar = 20 μm.
Applsci 14 03047 g007
Table 1. Primer sequences used for RT-qPCR.
GeneForwardReverseSize (bp)
18sATGCGGCGGCGTTATTCCGCTATCAATCTGTCAATCCTGTCC204 bp
MyoDGTGAATGAGGCCTTCGAGACGAGCCTGCAGACCTTCGATG115 bp
MyogeninGAAGAAAAGGGACTGGGGACTCTTGAGCCTGCGCTTCTCC136 bp
MHC1TCTTGAGCCTGCGCTTCTCCGCCACCAGACTCTGCTTCC141 bp
MHC7ACTATGCTGGAGCTGATGCCCTCTGTGCAGAGCAGACAC89 bp
mTORCGGCACACATTTGAAGAAGCTCCATGCTGCTGATACGAAC130 bp
VEGFAGATCATGCGGATCAAACCTGACCCTTTCCCTTTCCTC139 bp
HIF1αGTGCTGATTTGTGAACCCATTCAAGTTCTTCCGGCTCATAACC150 bp
NOS1TGGGCGATCCAGCTAATGTGGGGATCTGAAAGAGTTCAGGGTC131 bp
Disclaimer/Publisher’s Note: The statements, opinions and data contained in all publications are solely those of the individual author(s) and contributor(s) and not of MDPI and/or the editor(s). MDPI and/or the editor(s) disclaim responsibility for any injury to people or property resulting from any ideas, methods, instructions or products referred to in the content.

