1. Introduction
Polypropylene (PP) is a widely used linear hydrocarbon polymer with good physical and chemical properties that can be adjusted using different additives. It is characterised by moderate elasticity, good hardness and fatigue resistance, and resistance to chemicals and heat. In the production of all commercial types of PP, additives are used to protect the polymer during the production process and improve the final product’s properties. Additives can also be utilised to solve the problem of degradation and destruction of macromolecules when PP is exposed to UV radiation.
PP is a recyclable and reusable material, so its life cycle does not end with producing a final product [
1,
2]. When subjected to tension, recycled PP exhibits similar mechanical characteristics (elastic limit and elastic modulus) as transparent virgin PP, and therefore, it can be used as widely as any non-recycled material, and even has certain advantages such as lower cost and a contribution to environmental protection [
3,
4,
5]. Polypropylene has high chemical resistance and excellent resistance (no attack) to most acid solutions, alcohols, bases and mineral oils [
6,
7,
8,
9,
10,
11].
The exceptional adaptability and various applications of PP, as well as the previously mentioned advantages, indicate a continuous broadening of the product spectrum where PP could be used. This growing trend started in 1957 when the commercial application of PP was recorded for the first time. PP is one of the most commonly used materials in the production of plastic items. It is widely used in the packaging and automotive industry as well as in the production of consumer products and products for the industry. Synthetic PP fibres are cheaper than fibres made of other materials, which is why they are often used in the textile industry.
A significant number of papers investigate factors affecting the mechanical characteristics of PP. Zhou and Mallick [
12] showed that the mechanical characteristics of both talc-filled and unfilled PP samples depend on temperature and strain rate. The stress–strain curves were nonlinear in both cases, even at relatively small strains. Both samples’ elastic modulus and yield strength values decreased with a temperature rise and increased with higher deformation rates [
12]. Similar results were obtained by Sahin and Yayla [
13]. During tensioning, the mechanical properties of PP are pretty sensitive to the deformation rate. Properties such as yield stress, elastic modulus, and yield strain increase with strain rate [
13]. Applying strain rates ranging from 0.8 to 200 s
−1, Zrida et al. [
14] determined that tensile strength and elastic modulus increase with strain rate. The behaviour of materials depending on the strain rate can be described using the phenomenological Hyperelasto-Visco-Hysteresis model (HVH model). Observing the fracture surface under a microscope showed that the roughness of the surface increases with an increase in the strain rate [
8]. PP’s mechanical characteristics are tested on conventional test samples and in compliance with established standards [
15,
16,
17,
18].
PP is a component of many nano- to macro-composites due to its convenient mechanical and thermal properties. Polymer composites are also popular because of their simple production and low prices (PP belongs to the family of relatively cheap high-volume thermoplastics). The PP matrix can be combined with reinforcement and used for various raw materials, semi-finished products, or textile fabrics. [
19,
20,
21,
22,
23,
24,
25]. Rocher et al. [
26] investigated the tensile behaviour of a 3D polypropylene/glass fabric at different test speeds. Wacharawichanant and Siripattanasak [
27] studied the mechanical and morphological properties of polypropylene (PP)/polyoxymethylene (POM) blends, where the content of PP ranged from 10% to 90%. A decrease in the elastic modulus and tensile strength of POM/PP blends was associated with a PP content rise from 10% to 30%, but their values increased again as the content of PP continued to rise. The strain at the moment of breaking of the samples increased when PP content ranged from 70% to 90%, implying that higher proportions of PP improve the blend’s mechanical characteristics [
27]. The improvement of materials’ characteristics by adding the baling twine fibres was also investigated. The ability of the composite to absorb transient overloads was achieved by using a polypropylene film in a cement matrix [
28]. Ash et al. [
29] studied six full-scale plastered straw bale wall assemblies. They concluded that wall assemblies with polypropylene reinforcing mesh exhibited better inelastic behaviour than those obtained using other materials and levels of detailing.
Another aspect of studying the twines is the influence of knots on the rupturing of twine during baling. Li et al. [
30] summarised the working conditions and requirements of the Chinese knotters and designed an innovative knotter for square balers with high knotting rates, achieving improved knotting performance. McAfee et al. [
31] investigated the importance of twine strength in maintaining bale integrity and reducing harvesting costs. They focused on the tension of the top strands when baling is performed with a large square baler. Results suggest that tension is highest when the bale exits the chamber, but its value typically remains below 60% of the twine’s knot strength. This indicates the potential for design changes to reduce tension and improve knot strength recommendations, ultimately lowering baling costs. Meng et al. [
32] introduced a novel rope knotting method and corresponding knotter design. With a high success rate of 98.4% in physical tests, the method demonstrates reliability, meeting the requirements for structure, posture, and coordination during knotting. Also, some detailed studies on the types and purposes of knots describe safe and reliable tying methods that prevent the rupturing of twine [
33,
34,
35,
36].
Only a few results regarding tensile tests on 100% PP baling twine can be found in the literature. Baling twine made of 100% PP is not affected by moisture, does not rot or mould, and shows resistance to most chemicals and acids.
Until recently, baling twines were not included in the standards, so consumers had to trust the manufacturers “at their word” that they would receive a product with the appropriate characteristics. The American Society of Agricultural and Biological Engineers (ASABE) has adopted standards for the quality, testing, labelling, performance and country of origin of agricultural baling twines. The standards include actual length and tensile strength specifications and require a uniform cross-section, stable weatherability, and UV protection characteristics for baling twines. Also, quality control must be carried out in accredited laboratories.
Used baling twine is usually disposed of in landfills, becoming a waste instead of a potential resource. For example, it could serve as a low-cost reinforcement in the concrete industry [
37], but only after examining its mechanical characteristics.
A series of individual fibres, twisted or braided together, form a twine of a certain thickness (diameter). Most twines are made of smaller strands of twisted or braided fibres. In braided twines, there is an outer braided layer and a core of a certain number of parallel fibres. Twisted twine is usually made of three bundles of different numbers of fibres. Thin strands connected in a mesh structure, creating baling twine, are obtained by fibrillation.
The PP baling twine’s geometry, structure and behaviour under tensile load are complex. Twisting can result in both strengthening and weakening the twine [
38]. At small surface helix angles, the radial stress in the twisted twine increases, leading to a faster recovery from the external tensile stress along the fibres, further leading to the twine’s overall strengthening. At larger surface helix angles, the sum of all stress components decreases. However, the twine’s resistance to external stress decreases as well. Due to these two opposing effects, there is a level of twisting called optimal twisting, at which the maximum strength of the twine is achieved [
39]. Porwal et al. [
40,
41] explain that not all filaments break simultaneously under tensile load. They also considered the effect of friction and pressure, where maximum tensile strength is achieved at the optimal twist angle. Twisting induces friction between the fibres and thus improves the twine’s ability to resist external forces. Twisting also affects the transfer of stress between the fibres within the twine and, therefore, affects the twine’s strength and failure mechanism [
42,
43]. How does twisting affect the twine’s tensile strength and deformation? The twisting process positively affects the friction between the fibres, improving the twine’s strength, but only up to a certain level of twisting. Afterwards, the effects of fibre obliquity become substantial, causing a decrease in the twine’s strength.
PP is often investigated as a base material or part of a composite when the aim is to determine and improve its mechanical characteristics in working conditions. Tests are usually performed on samples of standard shapes using conventional testing devices. Also, many researchers investigate the mechanism of load transfer in the fibres of twines and fabrics based on polymer materials to determine the influencing factors and thus improve the material’s characteristics.
In contrast to previous studies, in this paper, the conclusions on the behaviour of PP baling twines under tensile load are based on testing both non-prestressed samples and samples prestressed by being twisted before the test. The effects of friction between the fibres and the influence of changes in the twist angle on the material’s tensile strength were investigated experimentally.
2. Materials and Methods
The tested PP baling twine is of type T-800. Its structure is shown in
Figure 1. As guaranteed by the manufacturer, the mass of the twine package is 1 kg, the twine length is 800 ± 64 m, and the linear mass density is 1250 tex (approximately 11,250 den). The twine is made of 100% polypropylene. The essential physical characteristics of the used material are the melting range of 140–165 °C, white colour, closed cup flash point of about 400 °C, ignition temperature of about 450 °C, and density of 0.89–0.91 g/cm
3. Thermal decomposition starts at approximately 300 °C.
Figure 1 indicates that the tested PP baling twine has a complex structure. The fibres of non-standard thickness extend in different directions and form a complex geometrical shape (net). During manufacturing, the net must be twisted to form a twine. The twisting changes the planar chaotic arrangement of the fibres, forcing them to assume a more complex, spatial, and chaotic orientation. As hard as it would be to predict and define the specific nature of the contact between the fibres or the size and shape of the contact surfaces, generating a mathematical model for theoretical and numerical analyses of the described material would be even more challenging. Therefore, laboratory testing is necessary for determining and analysing the relevant mechanical characteristics of the described material.
The twine was tested on a small laboratory device developed for testing the characteristics of metallic and non-metallic materials by tension (
Figure 2). The drive system applies a tensioning force to the mobile grips, which move along the tension axis as the test sample elongates. When the steel samples are tested on that particular device, the mean value of the uncertainty in the elastic modulus measurement is 1.56% [
44,
45]. At approximately equal tension force, the strain of PP baling twines is greater than the strain of steel samples, so the expected measurement uncertainty is less than 1.56%.
Tensile tests were executed on non-prestressed twine samples (series 1) and samples prestressed by twisting around the longitudinal axis (series 2). Free ends of the twine were fixed in the clamping grips by tying the so-called Hangman’s Knot. Considering the type and structure of the material, the diameter of the sample, and the deformation speed, the aforementioned particular tying technique [
33,
34,
35,
36] provides the best results regarding the compliance and stress concentration in the knot and ensures that the rupture occurs within the gauge length. The mean initial gauge length of the twine samples was 145.3 mm in the first series of tests and 146.5 mm in the second. Due to the different initial lengths of the samples, the resulting elongation is considered through relative deformation.
The baling twines are not being lubricated in exploitation. However, lubricated twine samples, i.e., samples immersed in oil, were also tested, as the research aimed to deepen the analysis of the effects of friction between the fibres. Those tests were carried out on samples not subjected to prestress (series 3) and on prestressed samples (series 4) that exhibited the largest increase in tensile strength during the second series of tests. The samples from series 3 were immersed in oil before the tensile testing, while the samples from series 4 were immersed in oil, twisted along their longitudinal axes and then subjected to tension load. The mean length of test samples was 145.8 mm in series 3 and 146.3 mm in series 4.
Each test within the four series was repeated 30 times.
Figure 3 shows the sample from series 4, prepared for the test, i.e., immersed in oil, prestressed by twisting and fixed. PP is a hydrophobic material with low oil-sorption capacity [
46]. After brief contact with oil, the fibre of PP baler twine does not change its volume and chemical composition [
6,
7,
8,
9,
10,
11,
47]. However, the twine’s complex, net-like structure absorbs a certain amount of oil. Due to prestressing and tensioning, which increases all-around pressure in the material, a considerable amount of oil drains out, so the change in the diameter of the twine samples can be neglected.
The universal mineral oil SAE 15W-40 used in experiments has a density of 0.879 g/cm3 at 15 °C, kinematic viscosity at 100 °C of 15 mm2/s, index viscosity of 135, total base number of 6 mgKOH/g, and pour point −24 °C. The oil was randomly chosen because the aim was not to determine the lubricant properties. The samples were immersed in oil to examine the friction between layers or fibres with different strain rates. The relative motion of adjacent fibres occurs due to the fibres’ different stress states across the twine’s diameter. As a rule, tensile stresses caused by prestressing are the smallest along the sample’s longitudinal axis and increase as the distance from the axis increases.
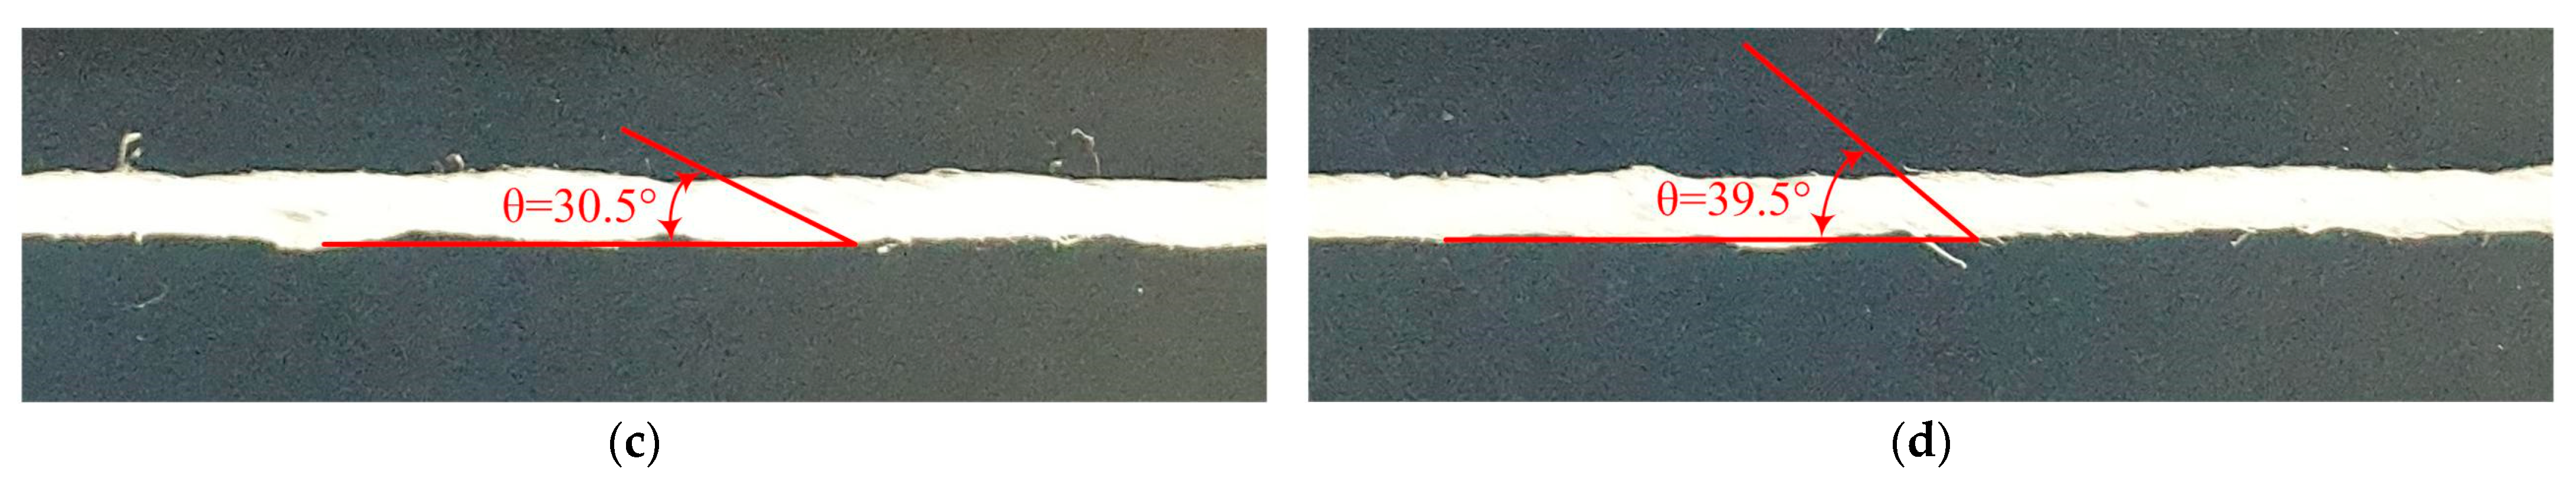
The twine was twisted by fixing one end in the stationary grip and rotating the other end around the axis of tension, whereas the number of twists was predetermined. The number of twists, denoted by N, represents the number of 360° turns around the longitudinal axis. In the second series of tests, N ranged from 1 to 26, meaning that the tests were performed with 26 different twist angles. The measurement of gauge length, diameter and twisting angle is performed under the effect of a tensile force of 10 N, achieved by the kinetic system (and tracked by the measurement system) of the device, which was necessary for reducing the influence of internal stresses caused by twisting (i.e., prestressing) on geometric characteristics of samples. The twist angle was determined by processing the photographs of the samples tensed with a force of 10 N. Due to the tested material’s complex structure, fibres have different orientations, which leads to a large dispersion of the twist angle measurement results. Therefore, ten angles of randomly selected strands were measured on each sample. As tests were repeated 30 times in each series, the adopted values of twist angles represent the mean value of 300 measurements. Due to the large amount of data and for the transparency of the results’ presentation, only the test results at the characteristic twist angles (N = 4, N = 8, N = 14, N = 20, and N = 26) are further discussed. The twist angles for N = 8, N = 14, N = 20, and N = 26 are provided in
Figure 4.
The cross-sectional area of the samples used in all four series was determined based on the twine’s diameter. The diameter was calculated based on Equation (1), using the known deniers and density of the PP twine (0.9 g/cm
3), where m, ρ and l are the twine’s mass, density and length, respectively.
The twist angle depends on the twine’s diameter and the number of turns per unit length [
43,
48]; therefore, the results can be compared regardless of the device used for tensile testing.
The experiments were conducted in controlled microclimatic conditions according to the ISO standard [
16] and manufacturer’s recommendations (temperature of 23 ± 2 °C and relative humidity of 50 ± 10%). The tensioning speed was 2.5 mm/min in all series and test repetitions.
3. Results
In the first series, twine samples were taken off the rolls, cut to the appropriate length and tested without prestressing. In the second series, all twine samples were twisted by performing an equal number of turns (from N = 1 to N = 26) around their longitudinal axis. As already mentioned, due to the large amount of data, only characteristic tension diagrams are presented in this paper. Based on those diagrams, it is possible to determine the maximum tensile strength that can be achieved by changing the twist angle. Diagrams also indicate which angle value is related to the maximum increase in tensile strength and how the twine’s tensile strength changes with a further increase in the surface helix angle.
An analysis of
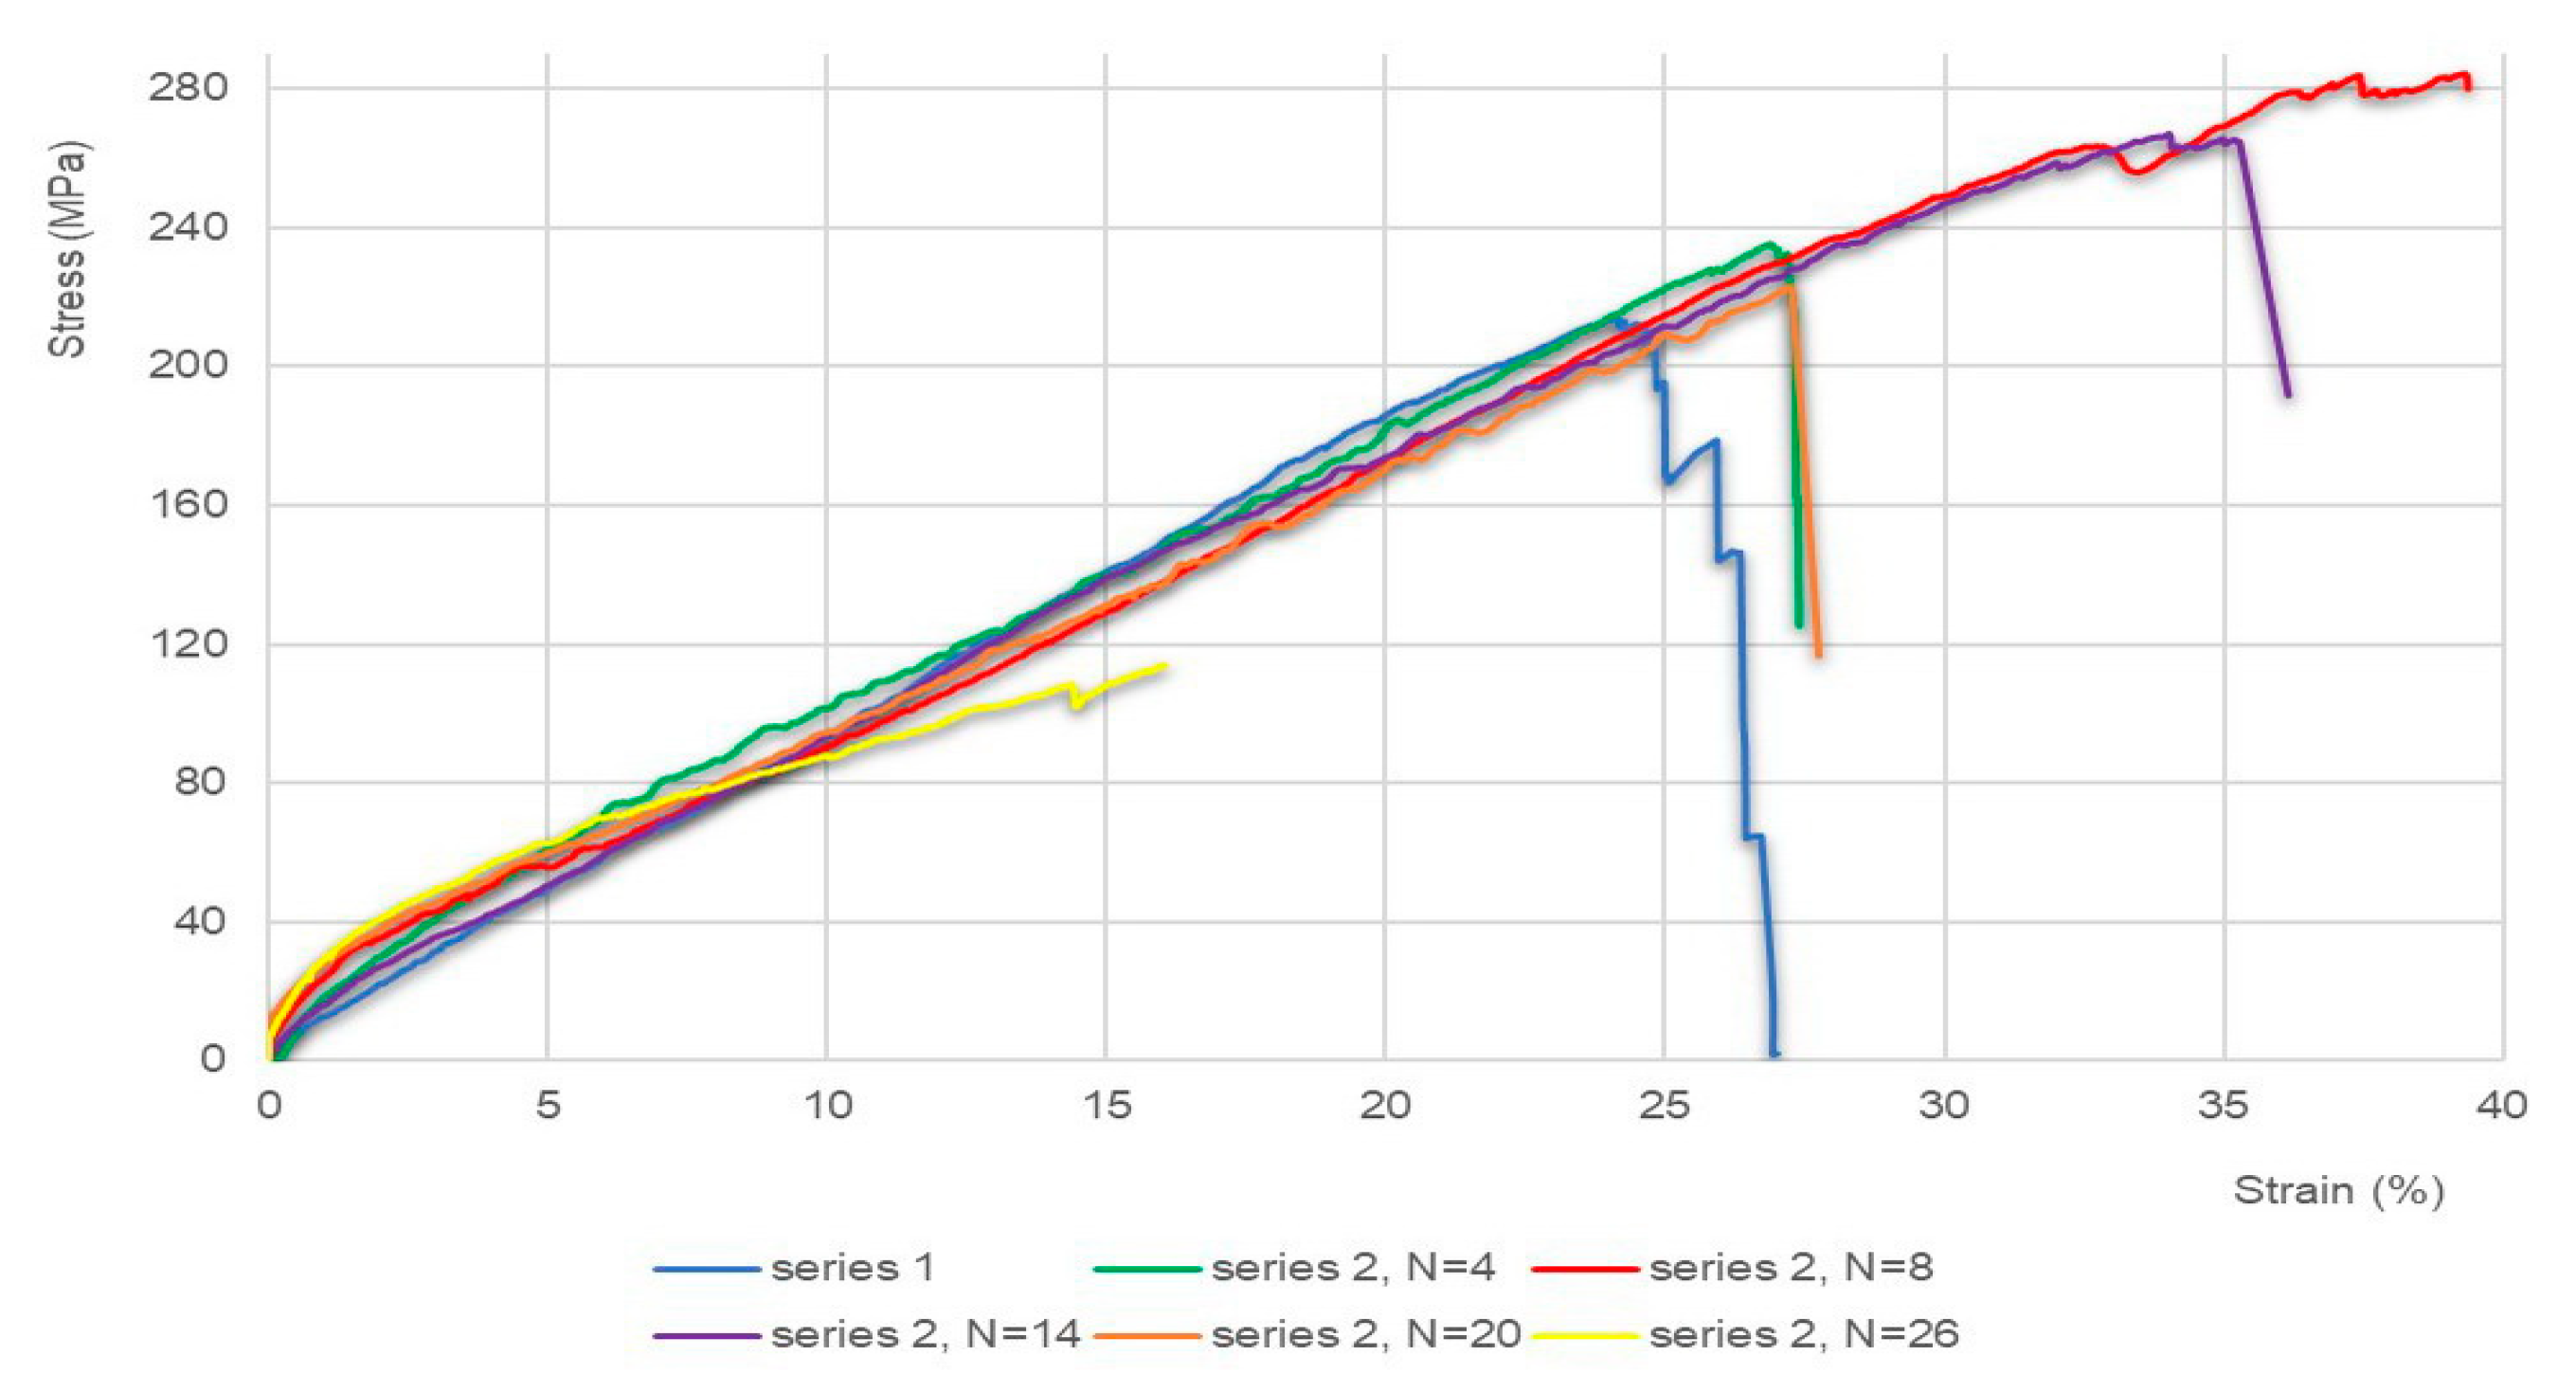
Figure 5 and
Figure 6 enables a comparison between the first test series’ tension diagrams and the second series’ characteristic diagrams (N = 4, N = 8, N = 14, N = 20, and N = 26). The curves in the diagrams represent the mean values of experimentally obtained results for 30 samples from each series.
The force–elongation diagram in
Figure 5 indicates that the maximum tensile force values in the twine samples that were twisted from 4 to 20 times are higher than those obtained by testing the non-prestressed samples. The changes in the elongation during the test indicate an increase in the deformation properties of the samples that were twisted 8, 14 and 20 times, differing from the results obtained on non-prestressed samples. When N = 26, a decrease in both force and elongation is evident.
Compared to the non-prestressed samples, the prestressed samples show a greater increase in tensile strength and relative deformation following the rise in the twist angle up to N = 20 (
Figure 6). The greatest changes in tensile strength and strain are at N = 8. A further increase in the helix angle, up to N = 20, is followed by a decrease in tensile strength and relative deformations. When N = 26, there is a noticeable drop in the tensile strength and deformation of the prestressed samples.
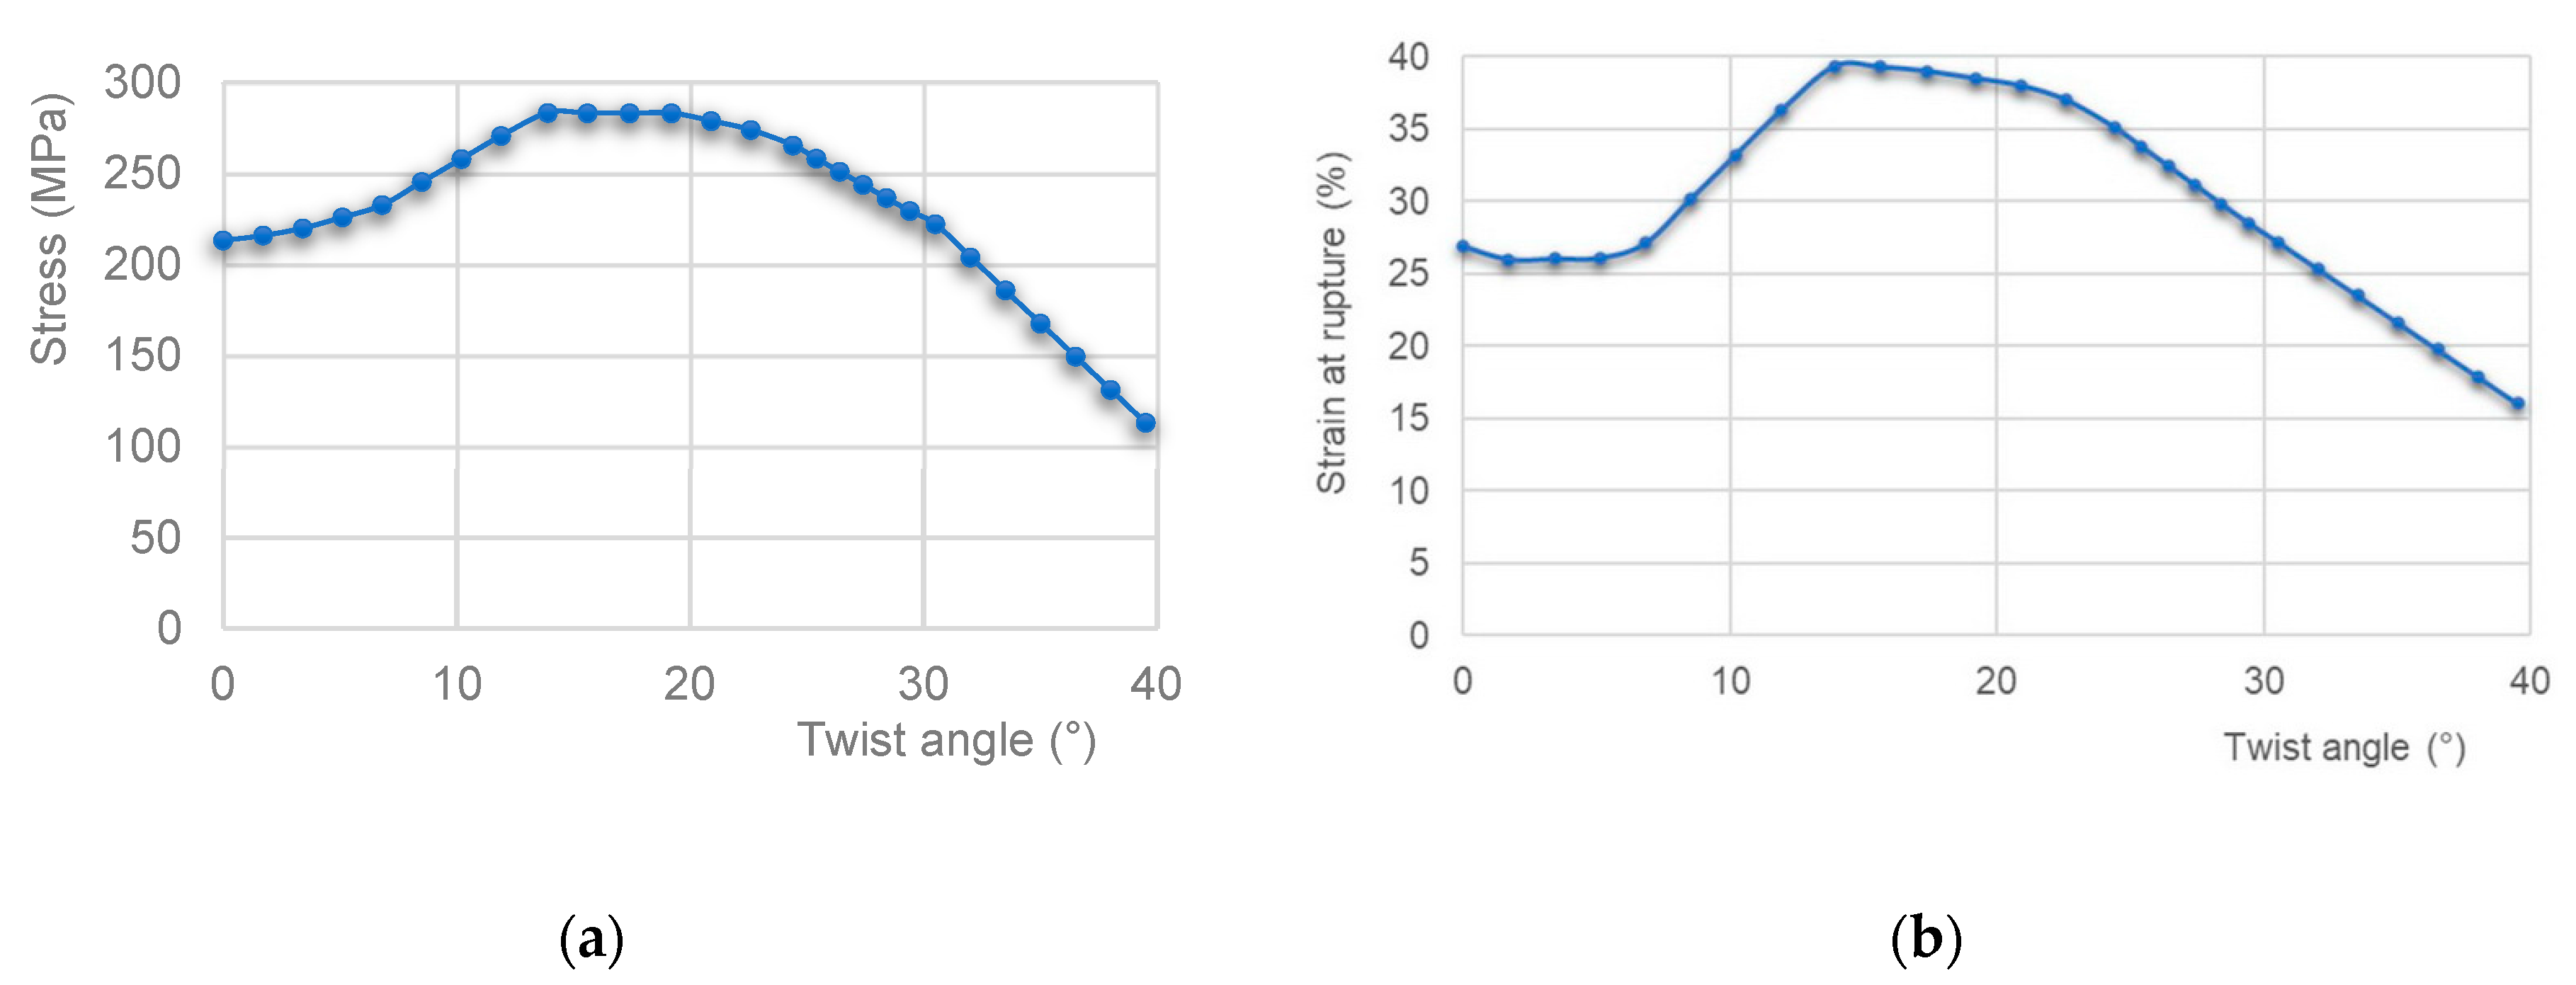
The diagram of the change in tensile strength as a function of the angle of twist (i.e., the number of twists) is provided in
Figure 7a.
Figure 7b illustrates the dependence of the relative deformation on the twisting angle (i.e., the number of twists).
The breaking points on the diagrams in
Figure 7 are at helix angles of 6.8° (N = 4), 13.9° (N = 8), 24.4° (N = 14), 30.5° (N = 20) and 39.5° (N = 26).
Figure 7a indicates the growth of tensile strength at helix angles from 6.8° (N = 4) to 13.9° (N = 8). The maximum tensile strength value is reached at 13.9° (N = 8), followed by its decline until the angle reaches 39.5° (N = 26). So, tensile strength decreases as N rises from 8 to 26. In
Figure 7b, there is a slight decrease in the strain at the rupture of the prestressed samples up to N = 4, after which the strain at rupture increases and reaches a maximum value at N = 8, indicating the difference in the behaviour between the prestressed and non-prestressed samples. After that, the deformation values decrease with the increase in the angle of twist up to N = 26.
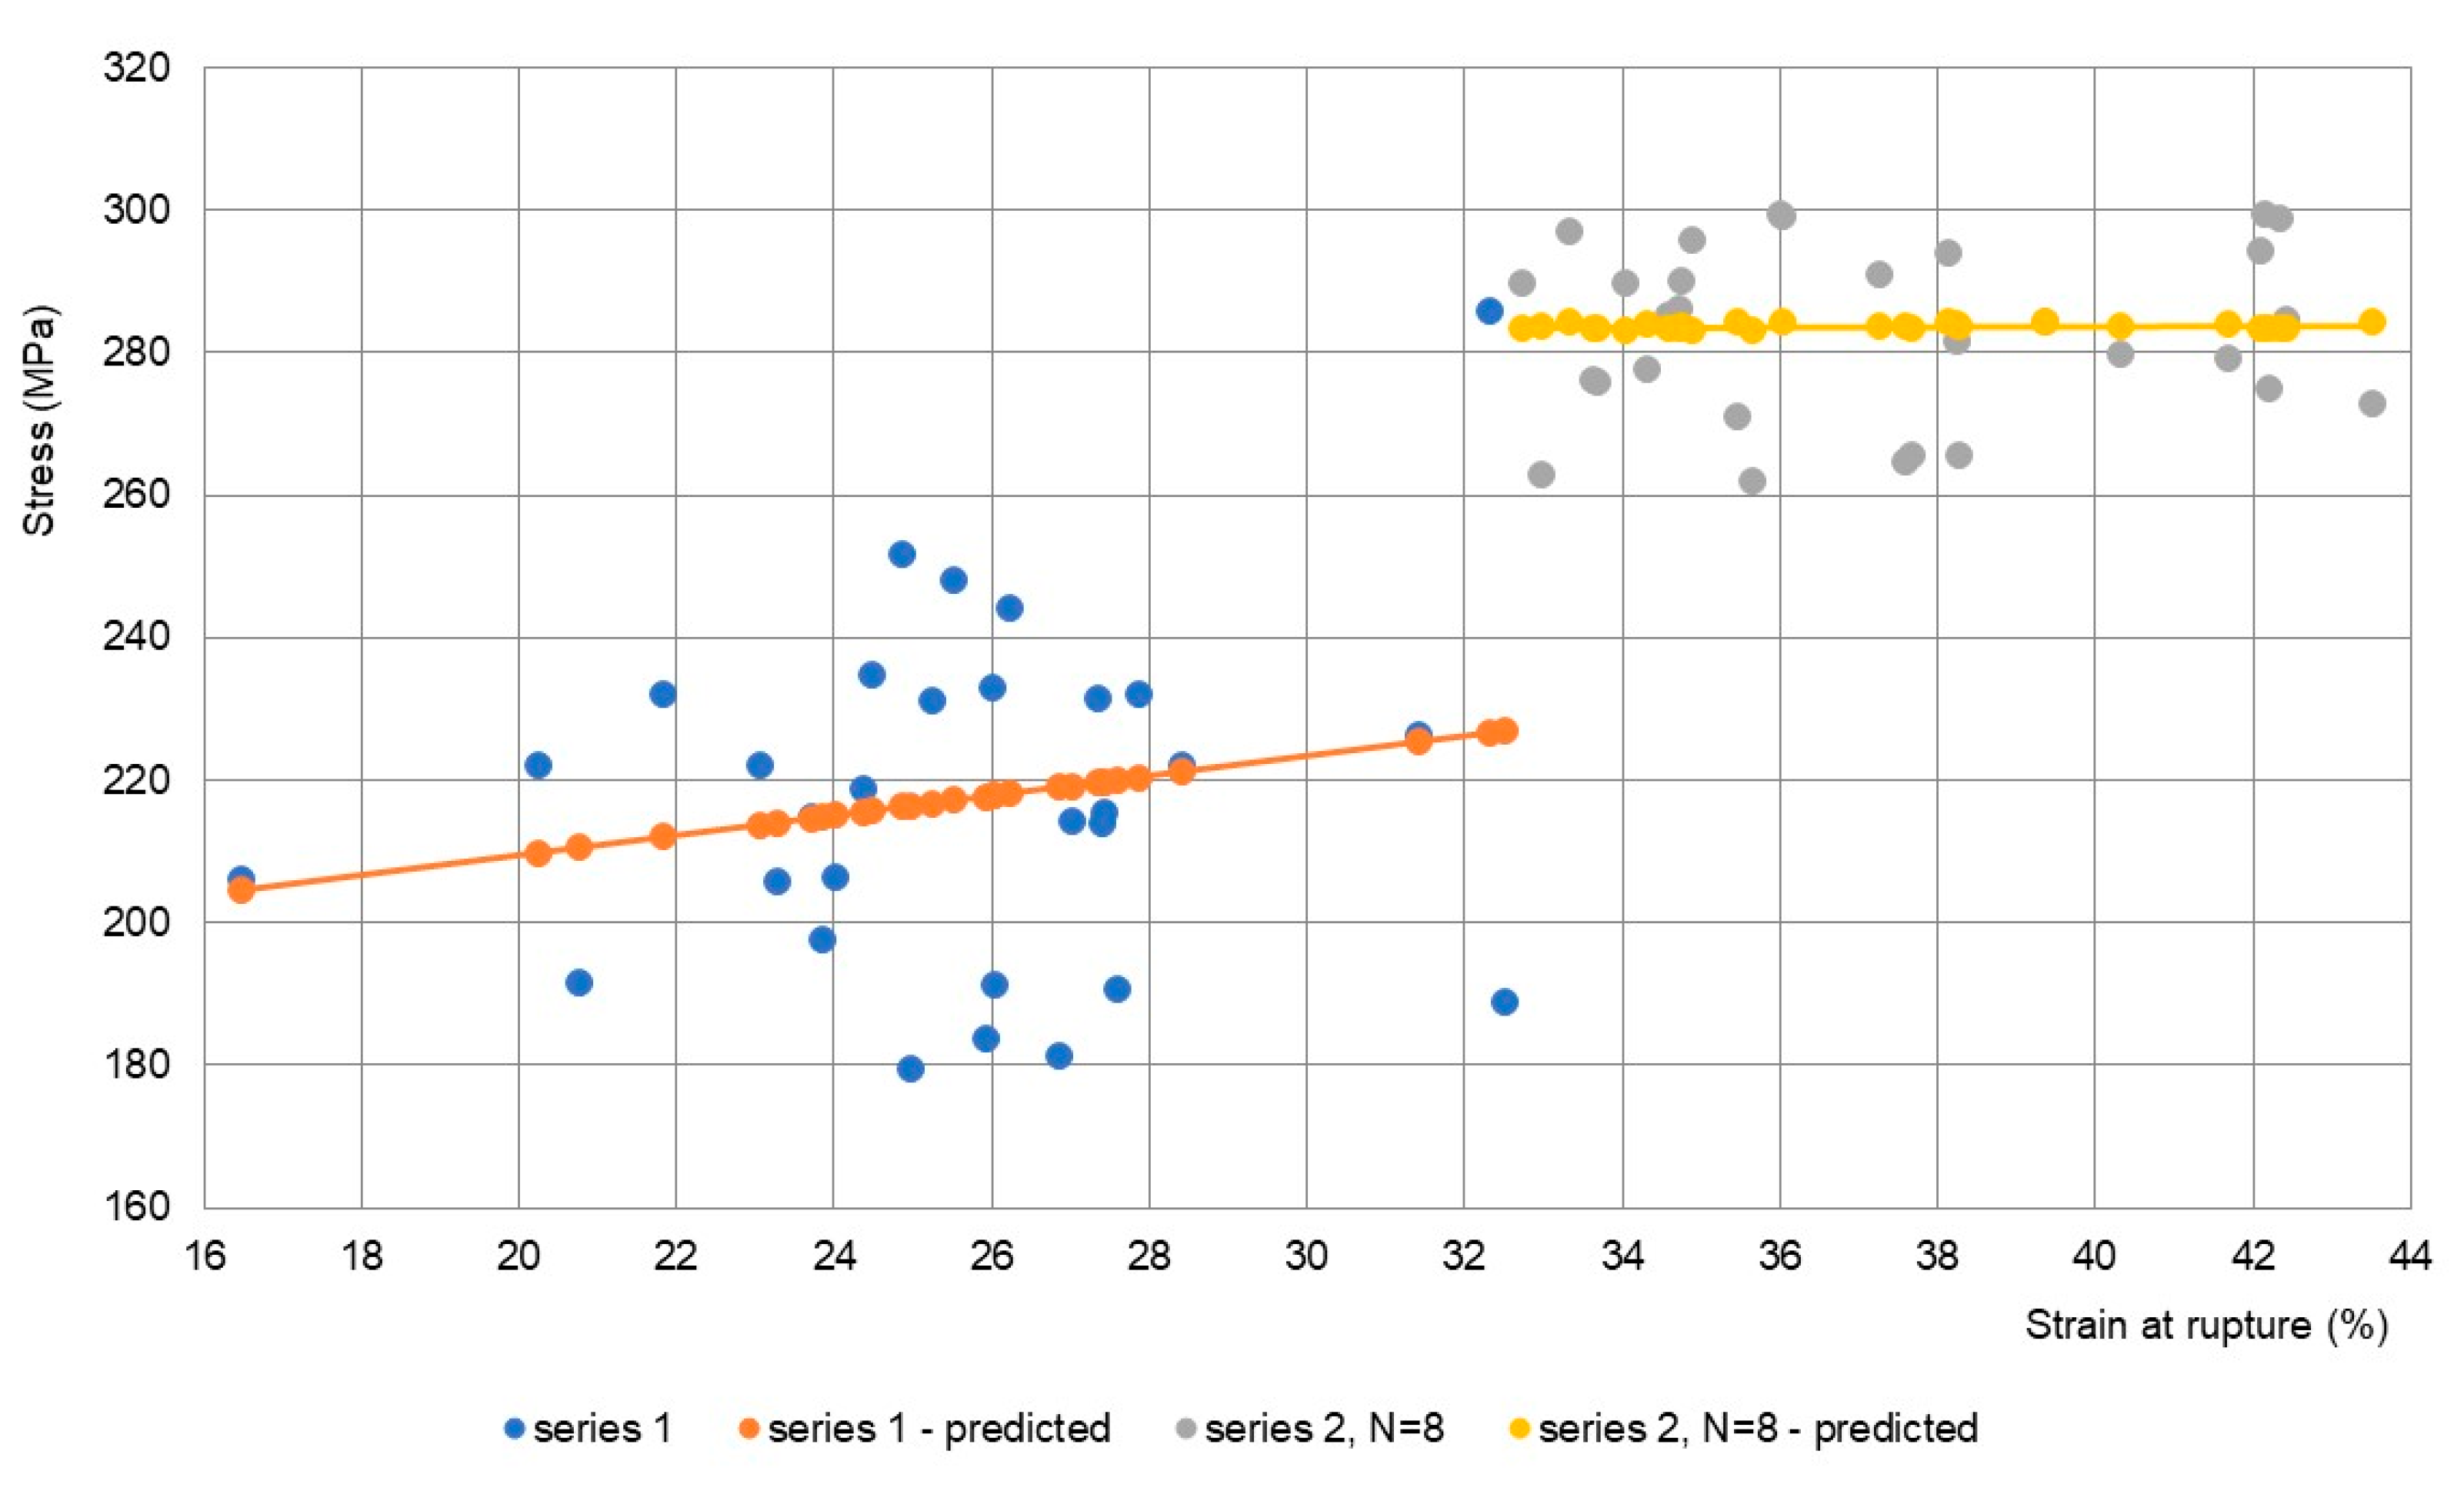
Figure 8 shows the results related to all 30 samples from series 1 to 2. The prediction lines obtained using the least square method emphasise a more uniform behaviour of samples from series 2 at N = 8 (i.e., less scattering of experimental data around the arithmetic mean) compared to series 1. The samples from series 1 exhibit a larger dispersion of the experimentally obtained stress and strain values at rupture. The difference in the tensile strength’s average values between series 1 and 2 at N = 8 indicates that twisting increases the twine’s tensile strength.
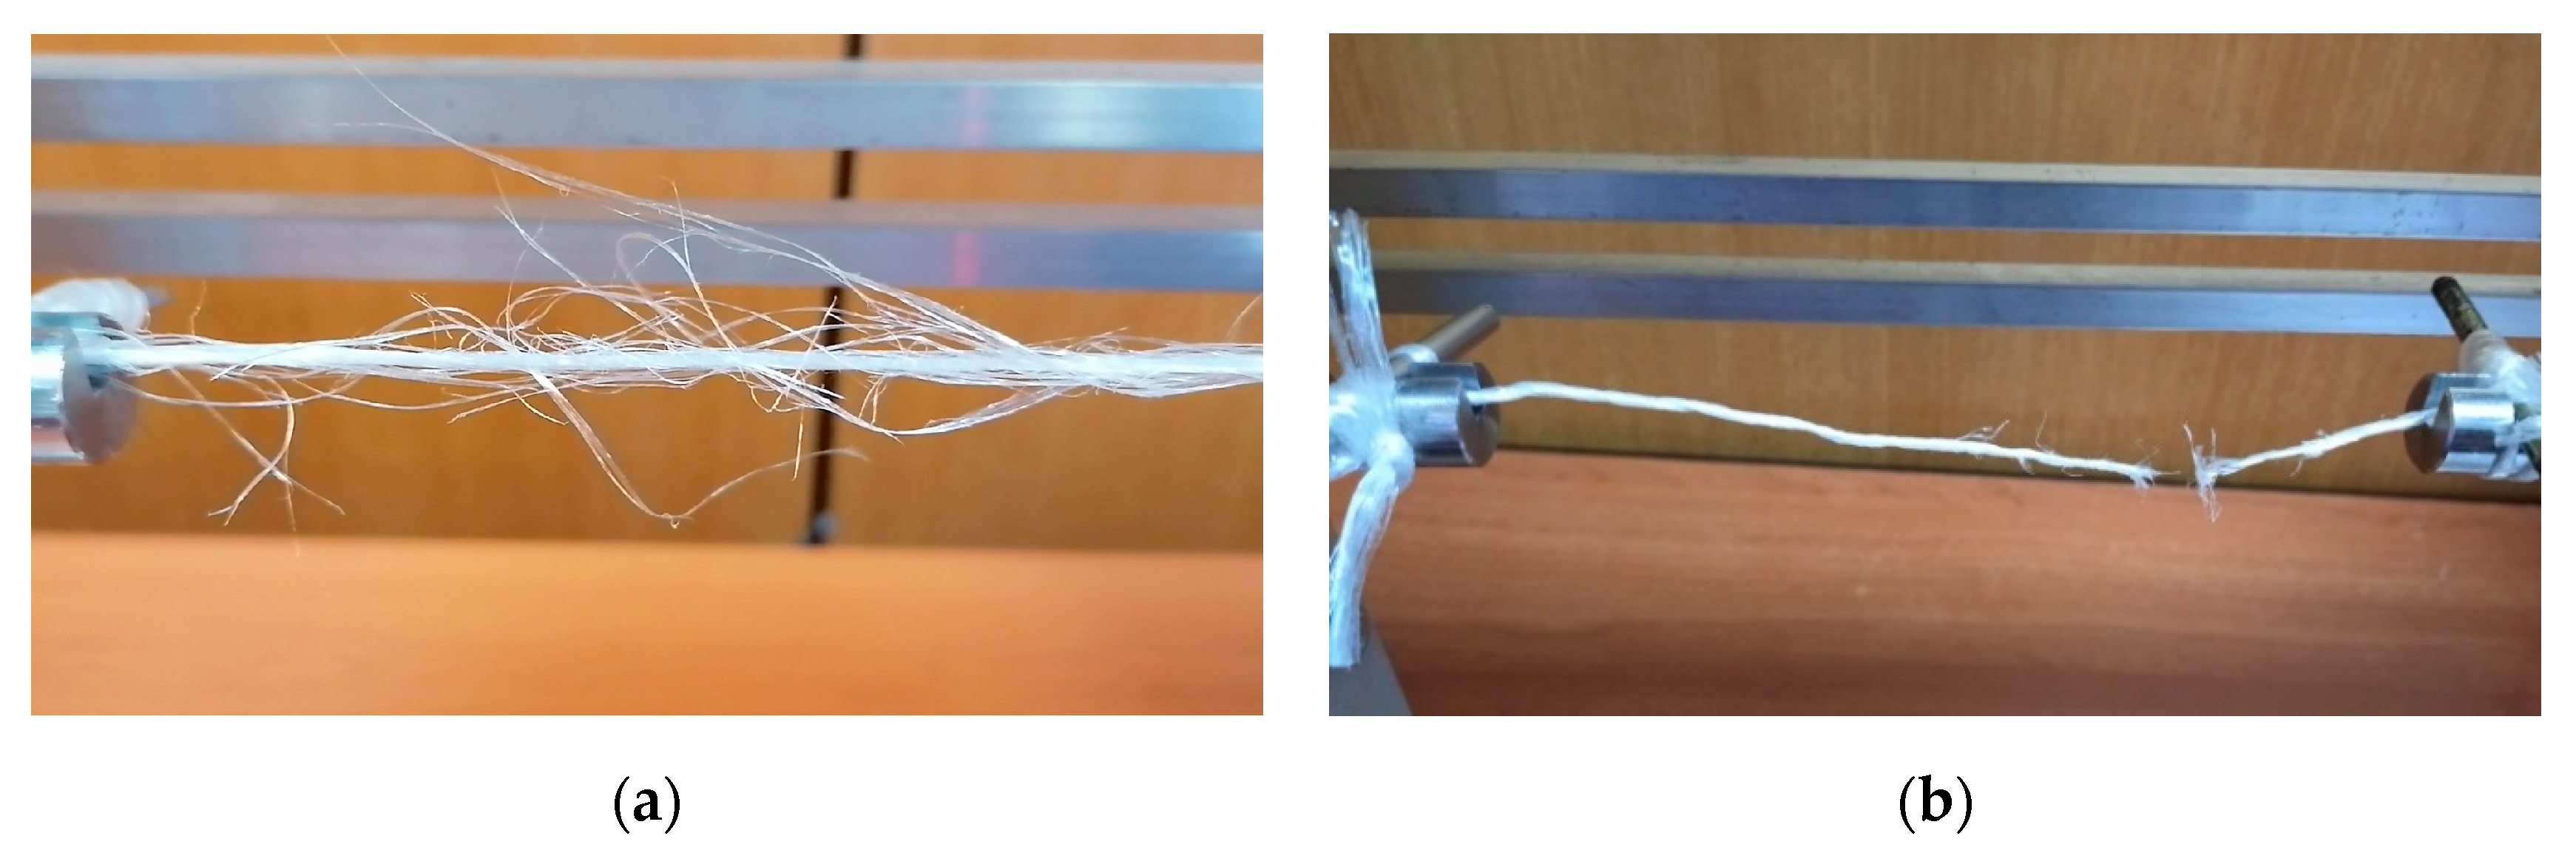
The appearance of and damages on a non-prestressed test sample from series 1 (
Figure 9a) and a prestressed sample from series 2 at N = 26 (
Figure 9b) illustrate the difference in the behaviour between the samples that were tested without prior twisting and those prestressed with the maximum number of twists.
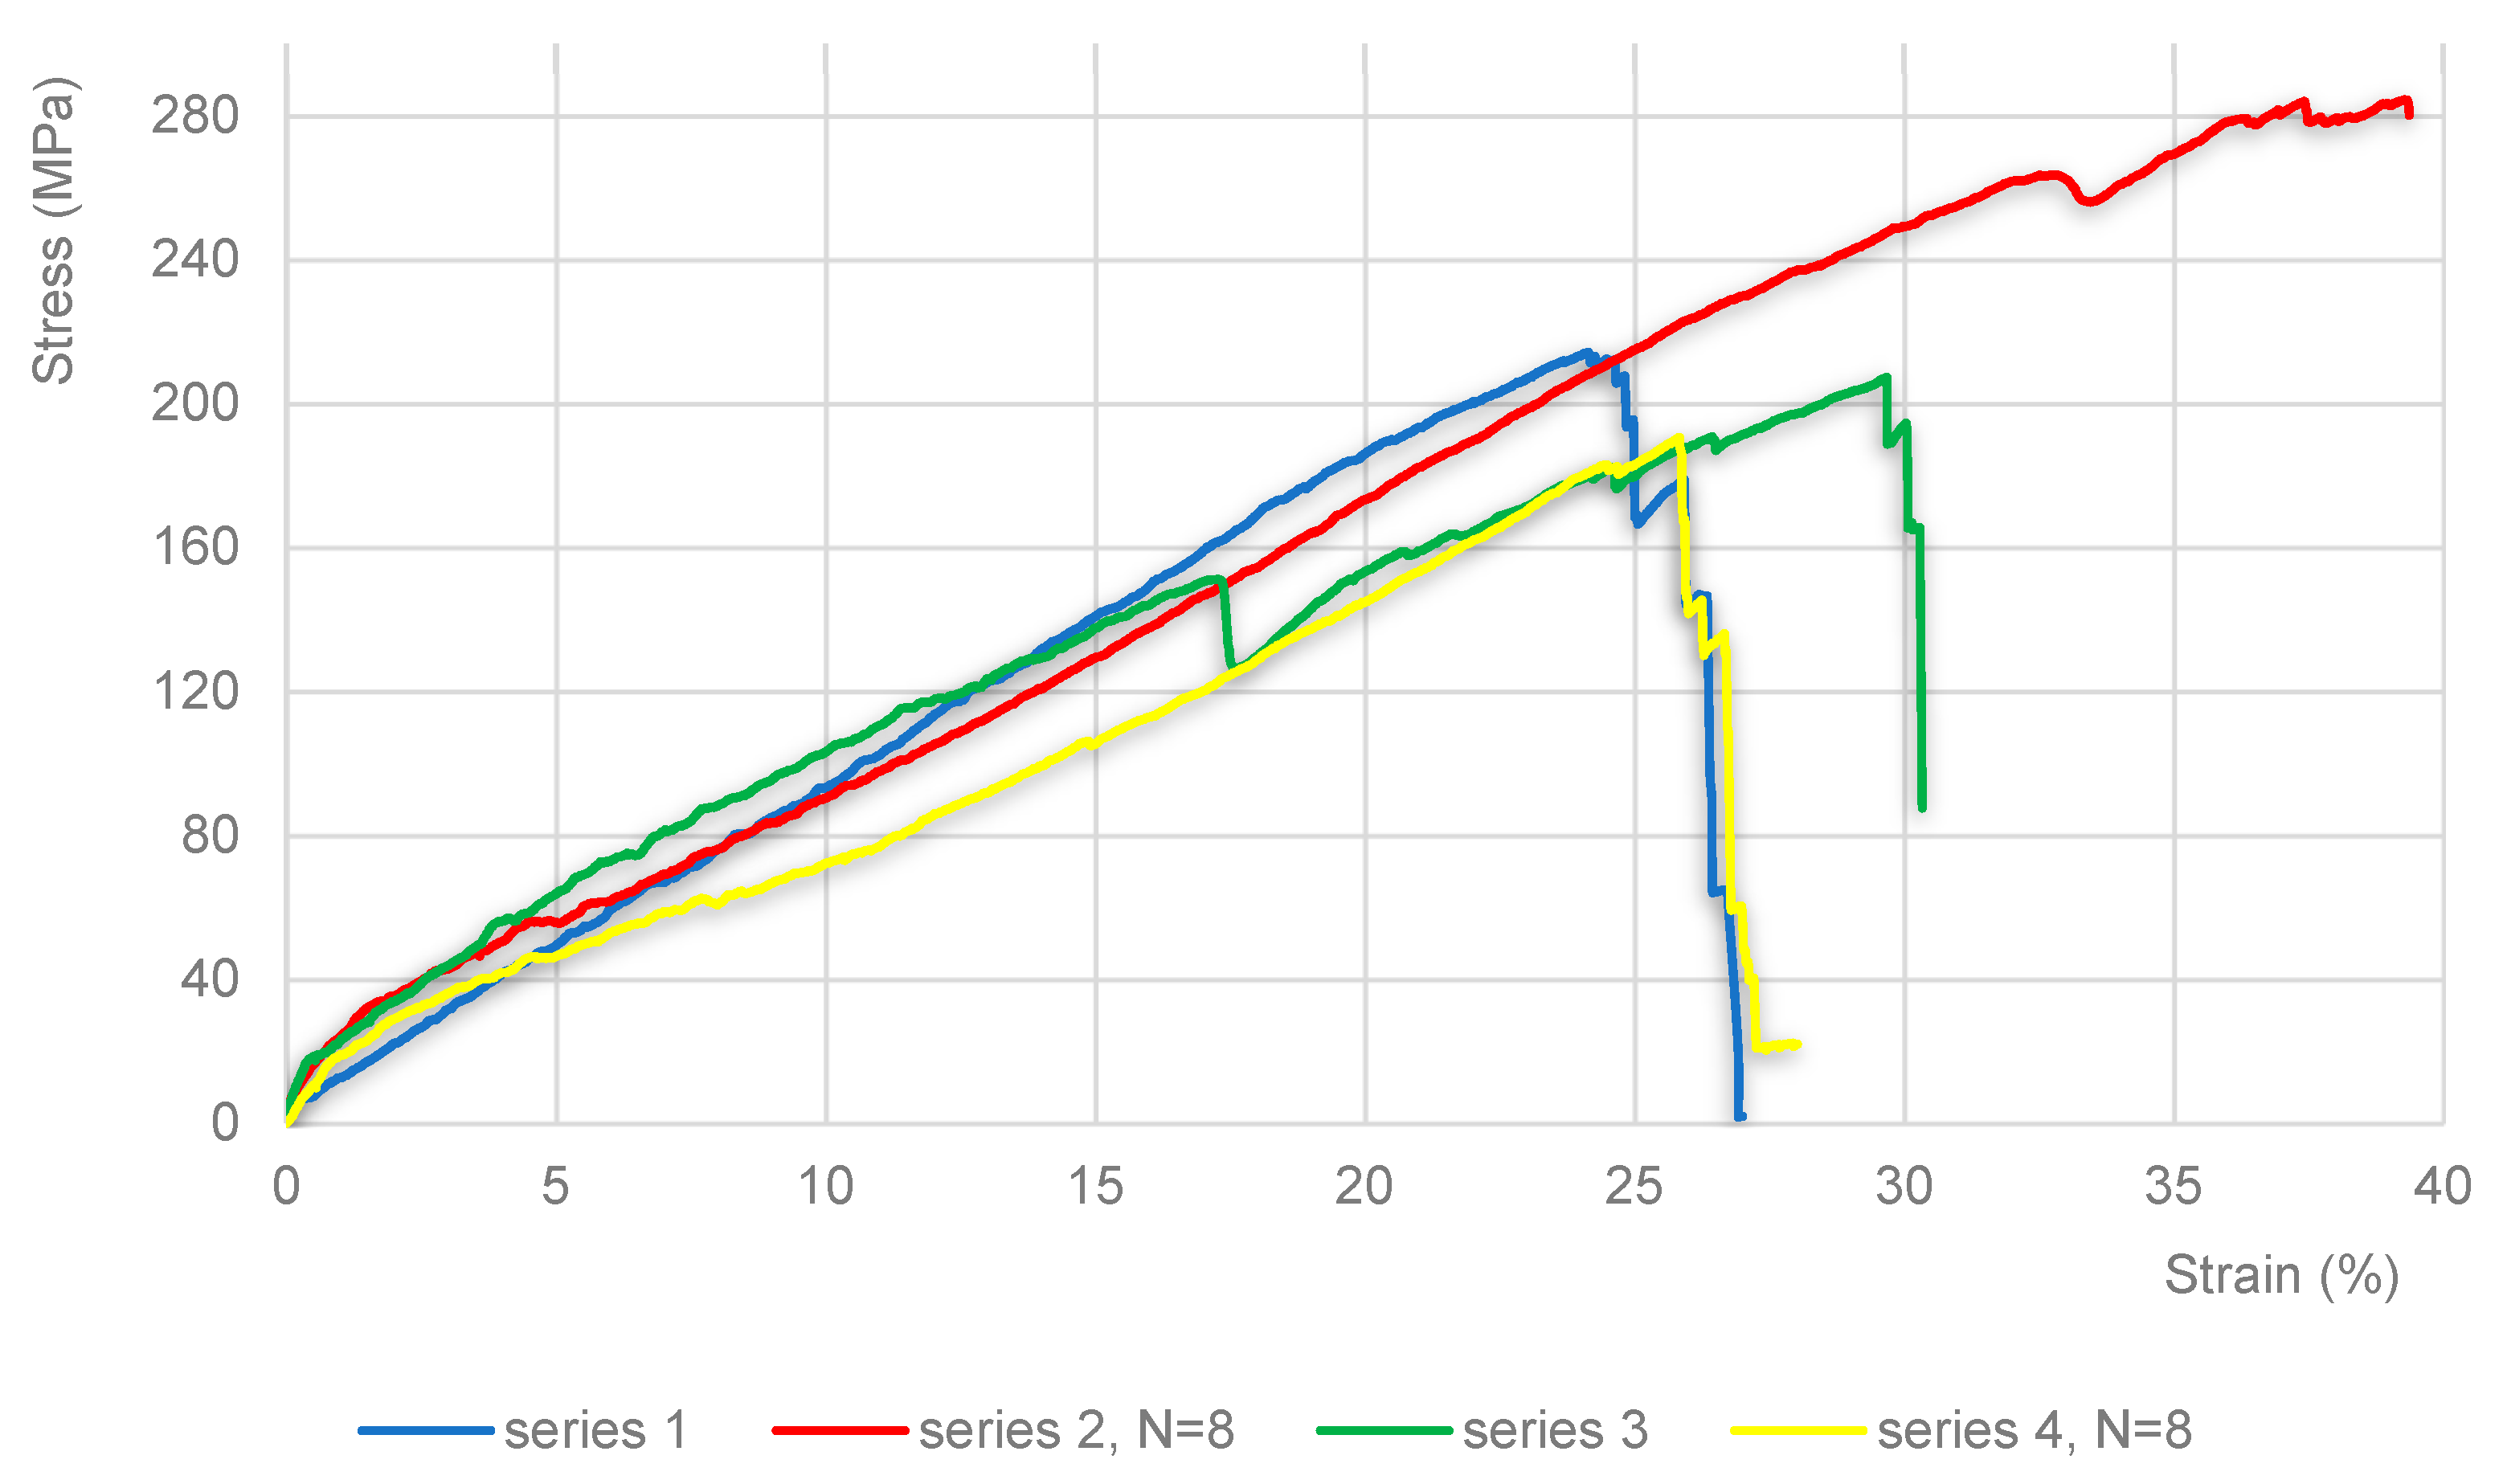
An additional experiment was carried out to explore what causes the increase in the prestressed samples’ tensile strength. The twine samples of series 3 and 4 were immersed in oil before testing. Tensile testing was repeated for non-prestressed (series 3) and prestressed twine, where N = 8 was chosen as the number of twists at which the tensile strength increases the most (series 4). The results are provided in
Figure 10.
Figure 10 illustrates the differences in the tensile strength values between series 1 and series 3 samples (non-prestressed twine samples, immersed and not immersed in oil), as well as between series 2 and series 4 samples (prestressed by twisting, where N = 8, immersed and not immersed in oil). The tensile strength of the twine immersed in oil decreased due to the smaller coefficient of friction between the fibres. The decrease in the friction coefficient is caused by a layer of oil between the fibres in relative motion.
4. Discussion
The crucial mechanical characteristic of PP twine, considering its field of application, is tensile strength. The aim of this research is to analyse the possibility of increasing the tensile strength of PP baling twine by changing the helix angle. The stress–strain diagram,
Figure 6, shows the change in tensile strength with the change in the number of twists, i.e., the change in the helix angle. The mean stress values indicate a trend of tensile strength growth up to N = 8, i.e., up to an angle of 13.9°, at which the maximum tensile strength values are reached, which is not the case with non-prestressed samples. The change in stress from 213.3 MPa to 283.4 MPa (
Figure 7a) represents an increase of approximately 33%. As the number of twists (i.e., the helix angle) rises, the tensile strength decreases (
Figure 7a). The influence of the surface helix angle on the relative elongation is shown in
Figure 7b. By comparing the diagrams in
Figure 7a,b, it can be concluded that the increase in tensile strength is accompanied by an increase in strain and vice versa.
Figure 5 and
Figure 6 indicate that the behaviour of tested twine samples depends on the helix angle. The tearing of the non-prestressed twine is gradual, and the stress–strain curve resembles a “sawtooth”. The fibres that suffer the highest stress are ruptured first, after which the stress decreases and elongation increases, while the adjacent undamaged fibres resist the tensile force. The process is repeated until the test sample is ruptured. Due to the complex structure of the material, the plane in which the rupturing occurs has a complex geometry, and its shape and direction cannot be predicted (
Figure 9a). With the increase in the surface helix angle of the prestressed sample, the breaking process slows down, i.e., the time interval between the breaking of the first and the last fibre decreases. Thus, at the maximum helix angle, all fibres are broken in a very short time interval (
Figure 9b).
The tensile strength increases because the fibres change directions, so the tensile force is partially spent on a rising mutual pressure between them. Consequently, the contact area between the fibres increases as well. Due to the complex structure of the twine, the level of prestress in fibres is unequal, so some of them are more tensed than others, especially those that are furthest from the twine’s longitudinal axis. Different levels of prestress cause some fibres to deform faster than others. The velocity of fibres’ relative motion causes friction between the fibres in contact. So, the increase in tensile strength of the twisted twine is induced by the force of friction between the fibres in relative motion. As fibres are numerous and their orientation is hectic, the effect of friction forces on tensile strength is amplified. Friction forces appear in all directions of the hectically aligned fibres, and their resulting force represents a sum of their projections on the tension axis. Its direction is opposite that of a tension force, which causes changes in tensile strength. The effect of friction between the fibres in relative motion on the tension strength can be easily discerned from
Figure 8. When the mean value of the surface helix angle was 13.9° (N = 8), prestressed (i.e., twisted) twine samples not immersed in oil had a mean tensile strength of 283.4 MPa, while the mean tensile strength of prestressed samples that were immersed in oil before being tested was 187 MPa. Therefore, the use of oil caused a decrease in tensile strength of 96.4 MPa, or approximately 34%, which proves the assumption that higher friction between the fibres increases the tensile strength of the twine.
In non-prestressed samples, the decrease in tensile strength caused by the use of oil was also present but considerably smaller, approximately 6% (
Figure 10). The effect of friction force on the tensile strength of non-prestressed samples is lesser due to the more uniform deformation of fibres. Since fewer fibres move relative to each other, the influence of oil application on the reduction in friction force (and, thus, the tensile strength) is small.
Although never lubricated in exploitation, in conducted experiments, the baling twine was immersed in oil in order to test its tensile strength depending on the prestress level. The experiments enabled the influence of friction to be quantified based on the change in the baling twine’s tensile strength.


 ,
, 


