Abstract
A properly designed and manufactured autonomous lighting system has an impact on reducing the amount of conflicts between pedestrians and drivers. For pedestrian crossings located outside of urban areas, one of the utilized solutions is PV installations with an electrochemical energy storage bank. So, the question should be asked: is it possible to maintain proper energy and lighting parameters throughout the year? This depends on the technical parameters of the installation, insolation, operating time, and the number and power of lighting luminaires directly prescribed by formal regulations. The purpose of this article is to present a method for evaluating the performance of a lighting installation at isolated pedestrian crossings based on annual power generation data obtained from a photovoltaic installation. This article presents lighting requirements for pedestrian crossing lighting. Based on the developed five lighting scenarios and energy calculations, year-round operation was simulated. Problems and risks that may affect the availability and performance of the lighting system were introduced. Directions for further research on the application of photovoltaic installations in road infrastructure were identified.
1. Introduction
Improving the safety of unprotected road users is one of the priorities of European and national road safety programs [1]. The pedestrian, as a vulnerable road traffic participant, is particularly exposed to the risk of an accident, injury, or death. Compared to European countries, Poland has recorded a very low level of safety for many years. Multidirectional corrective actions taken in 2020 improved this state.
Last year, Poland achieved a significant positive impact in that field, representing a satisfactory average level of safety of vulnerable road users [2]. However, vision zero has still not been achieved [3]. To prevent traffic hazards, road infrastructure inspections and audits were carried out [4]. Numerous research studies are being performed to implement the results of pedestrian safety improvement [5,6,7].
Figure 1 shows a view of pedestrian crossings with an autonomous lighting system containing two LED luminaires, four PV panels, and four batteries.
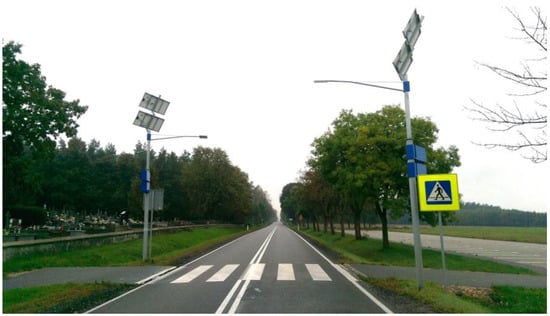
Figure 1.
View of a pedestrian crossing with an autonomous lighting system.
Depending on the formal requirements and the size of the pedestrian crossing, the volume of vehicle traffic, and the number of pedestrians, a lighting system containing different numbers of PV panels, batteries, and luminaires, manufactured with LED technology should be designed.
1.1. Relevance of the Subject Matter
According to the annual road accident reports [8], in 2022 in Poland, about 18% of all road accident victims were pedestrians. There were 2693 accidents at pedestrian crossings (12.6% of overall), and 161 people were killed and 2709 were injured. In previous years, the highest number of pedestrian accidents and the most tragic consequences of such accidents were recorded in the autumn and winter months (from October to December). This is due to climatic conditions, in particular poor visibility in the early hours of dusk. Most often, road users were killed in traffic accidents outside of urban areas. In one of five such incidents, a person was killed, while in a city area, a person was killed in one of twenty. Therefore, proper lighting conditions at pedestrian crossings located outside urban areas is one of the elements that can improve pedestrian safety.
The main aim of this research is to analyze proper lighting conditions at and around pedestrian crossings [4]. The important parameter for the driver’s ability to recognize the pedestrian is the proper value of the luminance contrast of the pedestrian silhouette opposite the background [9,10], which indirectly defines the illuminance values that should be achieved at a pedestrian crossing. In 2018, the Ministry of Infrastructure [11] took steps to standardize the lighting solutions used at pedestrian crossings in Poland. The technical solutions used in the illuminated area are possible to implement when an installation is supplied to power the grid and fulfil required lighting levels in the proposed lighting scenarios.
There is a certain group of pedestrian crossings where it is not economically or technically possible to supply electric energy via the power grid [12]. These crossings are equipped with island power solutions [13,14,15]. Ref. [16] presents an autonomous street lighting system containing photovoltaic panels, batteries, and luminaires with energy-efficient LED light sources. The system is designed for locations such as roads and cross-roads where supplying the lighting system from the power grid is not technically or economically possible.
One of the tasks of this project was to develop a dedicated LED luminaire which takes into account the response of the human eye under scotopic conditions. The luminaire was designed as a replacement for an existing luminaire containing a 70 W HPS high-pressure sodium lamp. The developed lighting system is characterized by high energy conversion efficiency, where each component of the electrical system is powered by direct current (DC). Furthermore, Ref. [17] discusses similar issues of illuminating a roadway with an LED lighting system, such as module design, efficiency, and economic feasibility of the system.
Ref. [17] describes an intelligent light intensity control system for street lighting based on the power electronic Triac element. Triac allows one to regulate the intensity of a streetlight by adjusting the switching angle (ignition) of the RMS supply voltage value.
In addition, the system is switched on and off according to sunrise and sunset times obtained from the Internet. The usage of Internet of Things (IoT) systems and a lighting intensity control system creates a fully autonomous system that reduces the electricity consumption for street lighting.
Issues of improving the efficiency of classical light sources are also being developed. In article [18], a comparison of a metal halide discharge (HID) lamp emitting white light using an electromagnetic ballast operating at a 50 Hz main frequency and an electronic ballast operating at 100 kHz was presented. This solution makes it possible to increase the emitted luminous energy and reduce light pulsation. These parameters have a particular impact on increasing the overall energy efficiency of a lighting system containing an HID lamp.
An intelligent energy-efficient street-lighting system with a dedicated predictive control algorithm is presented in [19]. Based on an internet weather forecast, the algorithm predicts the energy consumption and operating time for several days ahead.
Streetlights are equipped with PV panels and single-axis solar trackers for proper orientation relative to the sun. In addition, the system contains batteries, motion mechanisms, and light intensity sensors. The control system is equipped with an XBee3 wireless module, enabling communication, monitoring, and control of several streetlights simultaneously. This type of system is under tests by many researchers worldwide [20,21,22].
A simulation model of a dedicated street lighting system using LED light sources, powered by PV panels and batteries, is also described in [23]. This autonomous lighting system is presented from the electrical point of view. The authors focused on studying the time waveforms of voltages and currents occurring in the system as a function of available solar energy and battery capacity. The research was performed using a simulation model developed in Matlab. The analyses concerned the response of the system to the efficiency of the PV converter under varying values of load power and sunlight intensity.
Ref. [24] presents the integration of a solar system with road lighting based on the nano-grid concept, an improvement of traditional road lighting using LED technology and PV. The power quality of the proposed nano-grid is tested and analyzed in different modes: stand-alone and grid-connected, using an experimental test stand. The authors concluded that the integration of a PV power system into a road lighting system, based on the nano-grid concept, offers high economic efficiency for investment.
Autonomous installations at pedestrian crossings are also used to supply power for traffic lighting systems [25] where photovoltaic panels and piezoelectric transducers are used. The system proposed in the article collects energy from sunlight and vibrations at the roadway crossing and converts it into electric energy.
The concept of combining photovoltaic and thermal technology is also being used to achieve higher efficiency for energy production [26]. According to European recommendations [27], these solutions can also be used to supply power to road lighting installations.
Solar street lighting is a key technology that can be a part of a country’s sustainable development, especially in high sunlight emission regions [28]. According to the authors, the implementation of innovative solutions requires a critical approach to the used technologies. Alternative power solutions can also be used on roundabouts [29]. The installation of photovoltaic panels on the road surface is considered in [30].
An extremely important issue related to extending the lifetime of light sources is the reduction in their operating temperature. In [31], four different ways of powering discharge light sources (HID) and their influence on the temperature of the plasma channel and emission of the luminous flux are presented. The study investigates the supply power of the discharge lamp using an electromagnetic ballast operating at a main frequency of 50 Hz and an electronic ballast, allowing the generation of different time waveforms of HID lamp currents. It effectively communicates the idea that applying the appropriate current waveform to the discharge lamp can reduce the temperature of the plasma channel, leading to an increased operating lifespan for this type of light source.
Control algorithms for lighting infrastructures [22] are becoming a critical component of a Smart City [32]. A smart LED street lighting system with the Internet of Things (IoT) has become an alternative to conventional illumination systems. The presented solution makes it possible to control the intensity of the light and monitor luminaire parameters. Such information is important from a maintenance point of view. In particular, the correct operation, active and reactive power consumption, and the temperatures obtained by crucial elements are important to the end user. These issues have a direct influence on the quality of operations and financial issues. Ref. [33] presents a 2.022 mW real-time intelligent management system. The system is powered by a 66 mW solar cell with additional supercapacitor energy bank, which uses LoRaWAN technology with real conditions ranging at the level of 761 m. The authors of the article performed evaluation of the performance of this communication system in real operational conditions.
The article [34] presents a lead acid battery monitoring system that uses an embedded web server which sends information on the battery charge status over Ethernet. It was created for PV-powered lighting systems with a MPPT charge controller. The system allows for the fast interpretation of a system’s technical faults by reporting critical operating conditions.
An interesting implementation of neural networks to predict energy production and consumption is presented in [35]. The research carried out analyzes the cooperation of the PV farm with an electric load in terms of the timing of the on and off switching of the load in order to minimize the energy flow outside the local power system.
1.2. Description of the Research Problem
This paper presents key features of the design and performance. The technical solution of the lighting system must fulfill the illumination requirements and should be maintenance-free and economically acceptable. This paper examines the problem of supplying power for a pedestrian-crossing lighting installation under Polish climatic conditions, using an electricity storage bank and PV installation.
Depending on the year and season, the availability of solar radiation changes significantly and has a direct impact on the operating time of the lighting system. In the summer, the amount of solar radiation is sufficient to provide enough energy to fulfill illumination requirements of the system. In wintertime, battery discharging time increases and PV energy production decreases. In addition, the ambient temperature reaches negative values, which reduces the availability of energy in the energy bank. These factors are crucial for the proper operation of the lighting system.
After reviewing the most interesting literature positions, authors concluded that the appropriate selection of the parameters of autonomous lighting system is possible.
Authors hypothesize that improving lighting conditions, particularly in the autumn and winter, will directly affect the safety of pedestrian crossings, resulting greater pedestrian visibility and a smaller number of accidents.
The authors of this article performed research on issues related to street lighting, pedestrian safety, light sources’ energy-efficient power supply, electric energy storage systems and control algorithms. In collaboration with the Ministry of Infrastructure of the Republic of Poland, a new standards of traffic safety regulations turned into legal requirements and existing laws were developed.
Scientists analyzed data accidents at pedestrian crossings and concluded that it is advisable to undertake research to verify the reasons for autonomous lighting systems’ incorrect operation during periods of low solar radiation.
The main purpose of this article is the verification of the possibility of autonomous lighting system operation throughout the year for different power levels of LED luminaires.
2. Materials and Methods
2.1. Lighting Formal Requirements
In the current Polish law regulations [11,36,37], the illumination of pedestrian crossings located outside illuminated areas should be realized by means of a dedicated lighting solution, used jointly with transition zones to ensure the driver’s eyesight is properly adapted to the night conditions. The luminaires in use at pedestrian crossings are characterized by the double asymmetry of the light beam. Figure 2 shows an example of the light distribution curve of dedicated luminaires used to illuminate pedestrian crossings.
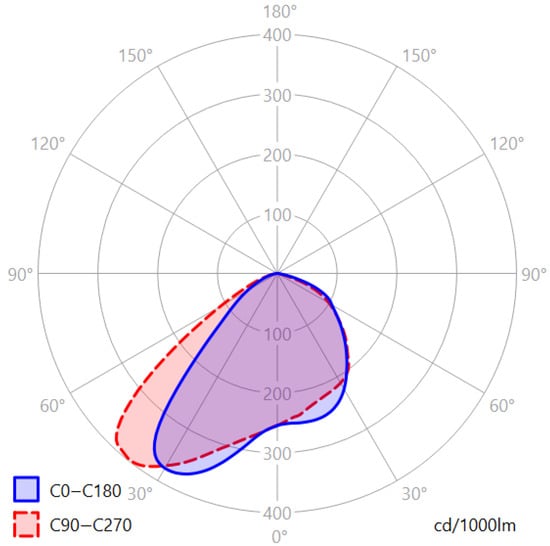
Figure 2.
Example of light distribution curve of dedicated luminaire used to illuminate pedestrian crossings.
On a typical single carriageway, two-lane road with one lane in each direction, two luminaires are installed individually for each direction, in the arrangement presented in Figure 3.

Figure 3.
Location of dedicated luminaires in relation to geometry of the pedestrian crossing.
By adhering to the specified requirements in terms of beam distribution, installation geometry and required lighting parameters, it is possible to realize pedestrian silhouette lighting in positive contrast [11]. The required illuminance parameters at pedestrian crossing with asymmetrical light distribution luminaries for carriageways illuminated in Class C are defined in Table 1.

Table 1.
Required illumination parameters at pedestrian crossings using luminaires with asymmetric distribution (dedicated lighting) for roadways illuminated in Class C (illumination intensity) [11].
The quantitative requirements for the lighting performed at the pedestrian crossing corresponding to the requirements in Table 1 refer to the measuring points located at the pedestrian crossing in the following planes: vertical (Figure 4) and horizontal (Figure 5) and control points (A, B, C, D, E, F). Points 31 ÷ 40, 51 ÷ 60, 71 ÷ 80 denote the locations for measuring the luminous intensities in the vertical plane Ev for the first direction of observation. Points 41 ÷ 50, 61 ÷ 70, 81 ÷ 90 denote the locations for measuring the luminous intensities in the vertical plane Ev for the second direction of observation. qwPoints A, B, C, E, F are the extreme pedestrian crossing points for which luminous intensities measurements in the vertical plane Ev at a height of 1 m need to be conducted for each direction of traffic. Points 1 ÷ 30 denote the locations for measuring the luminous intensities in the horizontal plane [Eh] at the pedestrian crossing.
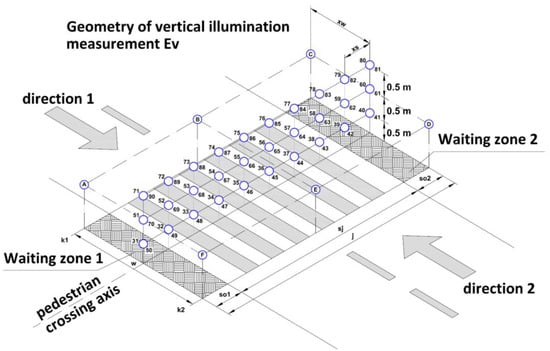
Figure 4.
Example of a grid for vertical measurements of luminous intensities (Ev) at a pedestrian crossing.
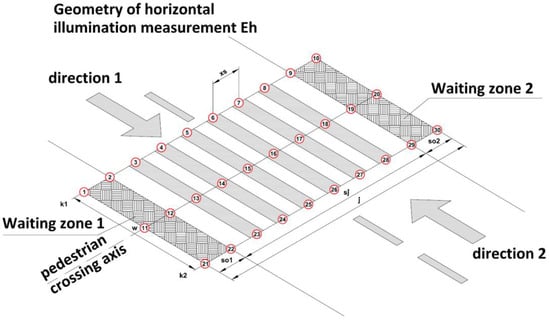
Figure 5.
Example of a grid for horizontal measurements of luminous intensity (Eh) at a pedestrian crossing.
A pedestrian crossing located in an unlit area requires a transition zone with a length proportional to the speed limit at the pedestrian crossing. Usage of the transition zone ensures that the right conditions for the driver’s night-vision adaptation are created. The speed limit for pedestrian crossings is 70 km/h. Therefore, the length of the transition zone is 100 m behind the illuminated pedestrian crossing (Table 2).
Table 2.
Required length of the transition zone behind the pedestrian crossing [11].
Figure 6 presents a diagram of the transition zone in the pedestrian crossing area, illuminated by a dedicated solution, together with an illustration of the principle of setting the level in classes PC and C3. According to the guidelines, the basic lighting level at the pedestrian crossing is set to class PC 4 and can be changed according to accident risk analysis results [11].
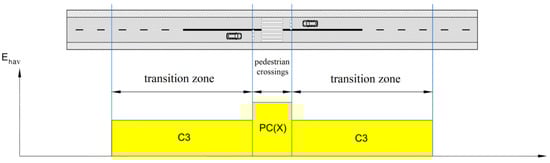
Figure 6.
Diagram of the transition zone in the unlit area.
Together with lighting installed at the pedestrian crossing, this condition creates a minimum 200 m of illuminated area. The transition zone is implemented using road lighting luminaires with a light distribution curve (Figure 7) matched to the road cross-section (Figure 8). Light distribution curves specify in what direction and with what intensity a luminaire emits light. The luminous intensity value in candela (cd) for a given luminaire is obtained by multiplying the value in cd/klm read from the diagram by the total luminous flux in kilolumens (klm) of the lamps used in the luminaire. The distribution curves (Figure 7) show the beam angles in two main sections: along the road (blue line curve in plane C 0°–C 180°) and w across the road (red line curve in plane C 90–C 270°).
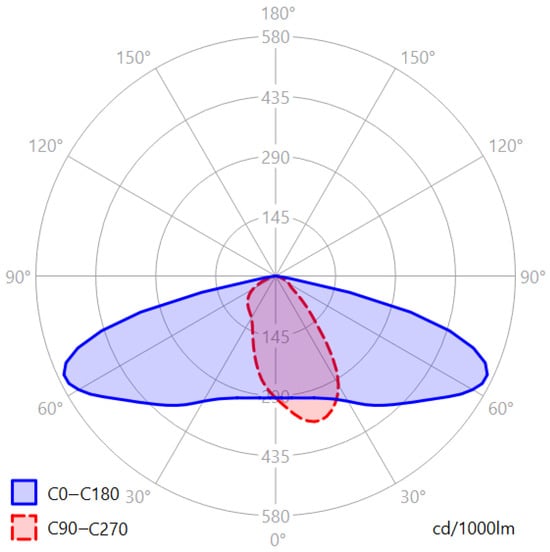
Figure 7.
Example of light distribution curve of a road luminaire.
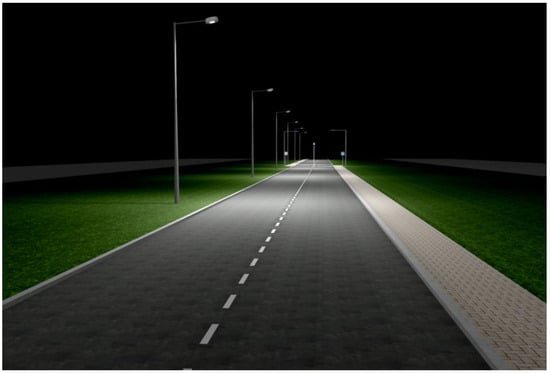
Figure 8.
Basic lighting solution used outside the illuminated area.
Figure 8 presents a view of the basic lighting solution used outside the illuminated area, designed according to the guideline requirements [11].
2.2. Pedestrian Crossing Lighting Scenarios
The demand for electric energy results from two factors, i.e., from requirements of the lighting levels at pedestrian crossing (carriageway and footway), determining the power of the luminaires (with well-known luminous efficacy), and the operating time of installation throughout the year.
In order to confirm the feasibility of the assumed lighting conditions throughout the year, five variants of lighting scenarios were developed on the basis on computer simulation in Dialux software (DIALux 4.13). Luminaire light emission data are obtained from luminaire manufacturers, and simulations were performed for a typical road cross-section of 2 × 3.5 m. Lighting and energy calculations were made for each scenario.
In the first basic scenario (Figure 9), the lighting requirements presented in the guidelines [11] were assumed to be achieved by implementing class PC4 in the pedestrian crossing area, class C3 in the transition zone on the distance of 100 m from the pedestrian crossing exit, and for class P1 on the pavements.
Figure 9.
Basic lighting scenario 1.
Scenario 2 (Figure 10) assumes a reduction in the lighting class at the pedestrian crossing to the PC5 level, according to the guidelines in [11]. The remaining lighting parameters remain unchanged.
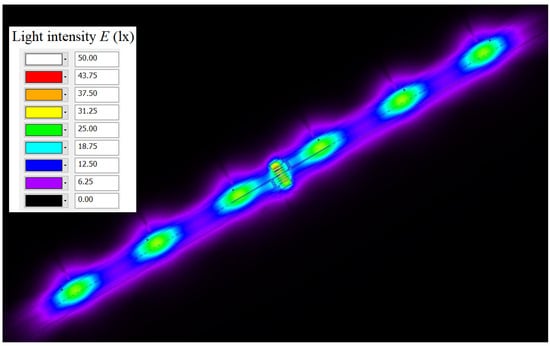
Figure 10.
Lighting scenario 2.
The authors carried out an additional variant analysis for the other pedestrian crossing lighting methods. The following scenarios were carried out in deviation from the requirements presented in [11]. They were simulated variant by variant to achieve the required power supply for lighting solutions.
In scenario 3 (Figure 11), the transition zone is shortened to 35 m using a single luminaire on the street, retaining class C3 and lighting class PC4 at the pedestrian crossing and class P1 on the pavement.
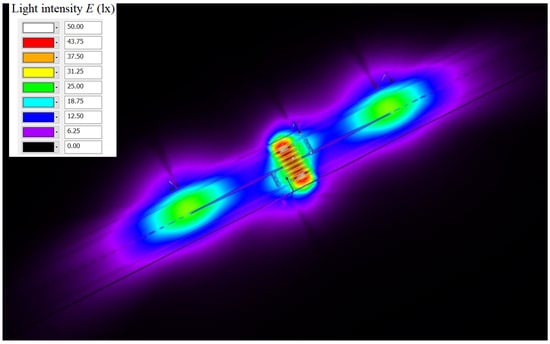
Figure 11.
Lighting scenario 3.
Scenario 4 (Figure 12) assumes that the transition zone can be abandoned, with pedestrian crossing lighting in class PC4 and pavement lighting being implemented for 25 m behind and in front of the crossing in class P1.
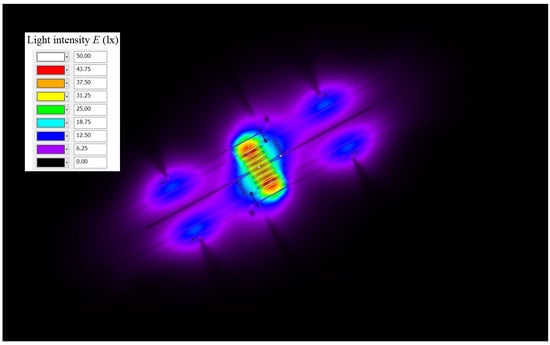
Figure 12.
Lighting scenario 4.
The final scenario, Scenario 5 (Figure 13), entails the solution of reducing the lighting levels to the minimum requirements of the lighting classes described by the requirements in [38] and the guidelines in [11,36]. A similar scenario has been adopted, consisting of lighting the pedestrian crossing in class PC5 and pavements over a distance of 25 m behind and in front of the crossing in class P3, while abandoning the implementation of the transition zone.
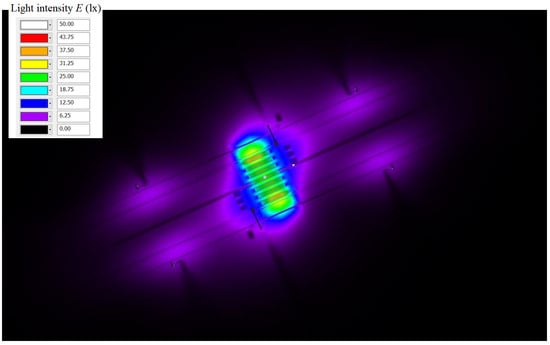
Figure 13.
Lighting scenario 5.
Table 3 presents the lighting classes and the total electrical power required for the described scenarios.
Table 3.
Overview of lighting scenarios.
2.3. Description of the Autonomous Lighting System
Figure 14 shows a schematic diagram of the power supply system for the autonomous lighting system. The installation consists of eight photovoltaic panels, labelled PV1 to PV8, and two MPPT battery charge controllers. The proposed components of the PV system are presented in a configuration that can be mounted on light poles. The key components of the system are the four batteries, labelled B1 to B4, installed to store the electric energy produced in the PV panels and to supply power to the LED luminaires and control electronics.
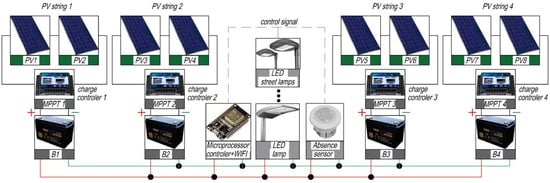
Figure 14.
Schematic diagram of an autonomous lighting system.
An outdoor battery installation has an influence on low-temperature operation and deep discharges, leading to irreversible damage. Therefore, the manufacturing technology of the batteries must be chosen appropriately such that the operating conditions do not damage energy banks before the end of the lifespan declared by manufacturer.
The operating conditions of the installation require a special control algorithm to meet the lighting requirements and to store a sufficient amount of electric energy during periods of reduced solar radiation. These two requirements are quite difficult to meet, so the aim of this article is to indicate the possibilities of fulfilling these requirements.
According to the exploitation experience of autonomous lighting systems, maintaining their efficiency during the winter period can be problematic. The main problem is discharged batteries, and with the comparison to the low availability of PV energy, it makes it impossible to supply power to the LED luminaires. Consequently, such systems do not provide adequate time or an adequate level of illumination, and therefore, safety for pedestrians crossing in the permitted area is limited. This situation can cause road accidents.
An important element of the system is the pedestrian presence sensor in the waiting area, which detects a person planning to cross the street. The sensor signal is transmitted to the control system, which increases the luminous flux generated by the LED luminaire from a minimum level to a level that ensures the illumination of the crossing according to the required standards. This solution makes it possible to meet two criteria: minimizing energy consumption when there is no pedestrian at the crossing, and illuminating the crossing in the required moment when a pedestrian appears. The final element of the system is a microprocessor controller, which allows for the realization a control algorithm to ensure the correct operation of the entire system. An extra component of the controller is a WiFi modem, which makes it possible to control the parameters of the entire lighting system. That issue is important from an operational and system maintenance point of view.
2.4. Overview of the Selected Electric Energy Storage Technologies
A key component of autonomous lighting systems is the battery, which stores energy from the PV during the day and supplies LED luminaires after dark. Several energy storage technologies are currently available on the market, characterized by a number of features, e.g., Li-ion batteries allow fast charging and have a high capacity, while at temperatures below 0 °C, their charging is difficult. In addition, at negative temperatures, only part of the capacity is available due to the reduced mobility of the energy carriers in the electrolyte. This phenomenon is particularly evident in electric vehicles that operate in negative temperatures. Consequently, battery heating in winter is used in electric vehicles to improve battery efficiency.
Unfortunately, heating cannot be applied to an autonomous lighting system because of the small amount of energy gained from photovoltaics. In wintertime, energy could be used entirely for heating the battery rather than powering the lighting. The selection of a suitable energy storage technology that is resistant to subzero temperatures and deep discharges is crucial for achieving the efficient operation of the entire system. Table 4 provides an overview of the currently available energy storage technologies and their selected performance characteristics. Parameters were obtained from References [39,40,41,42].
Table 4.
Parameters of batteries available on the market (LiFePO4–lithium ferrophosphate battery, NMC—nickel-mangan-cobalt battery, NiMH—nickel-metal hydrate, GEL—gel battery, AGM—absorbent glass mat battery, NiCD—nickiel-cadium battery, Lead Carbon—lead-carbon battery).
According to the presented application, two battery parameters are crucial, i.e., operating temperature range and number of battery cycles. These criteria are fulfilled only by two technologies, i.e., Ni-Cd and lead–carbon batteries.
When analyzing the parameters of a Ni-Cd battery, it is noticeable that it is characterized by a “memory effect”. This is a negative feature of the battery’s capacity reduction during partial discharges, which ‘remembers’ the depth of discharge, making the remaining capacity unavailable to the user. It is extremely important that batteries of this type must be discharged to the end. Unfortunately, discharging the battery to the end is tantamount to terminating the lighting system because of lack of energy, and this type of battery cannot be used in this application.
The available capacity of the battery used in the model can be calculated according to the equations given in articles [43,44,45]. This parameter depends on the type of construction, electrolyte temperature and load current, shown in Equation (1):
where:
- KC, ε, δ—Constants determined on the basis of battery design data [-];
- C0—Battery capacity [Ah];
- Te—Electrolyte temperature [°C];
- Tf—Electrolyte freezing temperature [°C];
- I—Battery load current [A];
- In—Battery rated current [A].
An important issue of battery exploitation is the efficiency of the charging process, which is specified in [46]. This parameter is crucial for charging process during low charging current taken from PV, as shown in Equation (2):
where:
- SOC—State of charge [-];
- Ibat—Battery charging current [A];
- I10—Nominal battery current given by the manufacturer [A].
The voltage value at the battery terminals (Equation (3)) can be determined from the following relationship given in [46].
where:
- Vbat—Battery voltage [V];
- nb—Number of cells in series [pcs.];
- Eb—Electromotive force of the battery cell [V];
- Rbat—Battery internal resistance [Ω];
- Ibat—Battery current [A].
The proposed solution is a lead–carbon battery, which has parameters that do not limit the operation of the lighting system, despite harsh working conditions. It allows for charging and discharging processes to be carried out at temperatures from −20 °C to 65 °C and to achieve 2000 duty cycles with a discharge limit of 50% capacity, enabling a minimum of 5.5 years of operation. These assumptions were placed in simulation model.
2.5. PV Power Data
The only source of electric energy in the autonomous lighting system is the PV installation. Therefore, energy production data from the PV are crucial to ensure correct operation of the system. For this purpose, actual energy data from a 1.55 kWp research photovoltaic installation connected to the Warsaw electricity power grid was used; a view of the installation is shown in Figure 15.
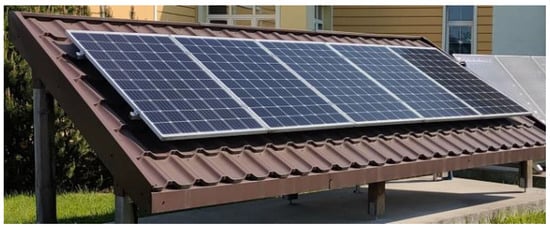
Figure 15.
1.55 kWp research PV installation.
Figure 16 (PV Energy) shows actual measurements of the energy available from the PV installation. A characteristic in this figure is the interval of constant energy availability between 130,000 and 390,000 min of the year, i.e., between 70 and 270 days of the year. The authors use the minutes of the year in this paper since the simulation energy analysis is carried out for the whole year with a step of 1 min.
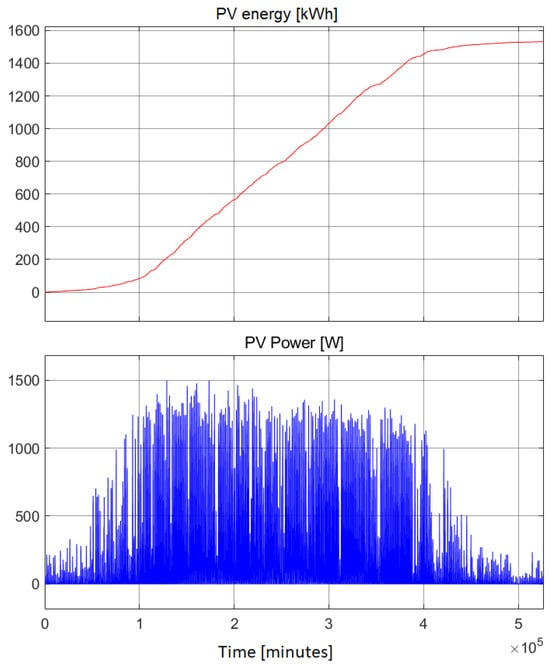
Figure 16.
Calculated energy produced by a PV installation for a whole year and the value of the power produced by a 1.55 kWp PV installation every 15 min for a whole year.
Figure 16 (PV Power) shows the measurements of the power output to the electricity grid, taken at 15 min intervals throughout the year, which were placed into the simulation model. Based on these data, the final value of the PV installation power used in the system was selected.
2.6. Description of Mathematical and Simulation Models
In order to perform an energy analysis of the autonomous lighting system, the following mathematical model is proposed.
where:
- Epv—Energy generated by the installation PV [J];
- Eled—Energy consumed by the luminaire LED [J];
- Ebatt—Energy stored in the battery [J].
Formula (4) shows the calculation of the amount of electric energy produced by the photovoltaic installation. Formula (5) presents the amount of energy consumed by the LED luminaire, and Formula (6) indicates the amount of energy stored in the battery; Matlab-Simulink software (Matlab-Simulink R2022b) was used to perform the energy analysis. A view of the model is shown below (Figure 17).
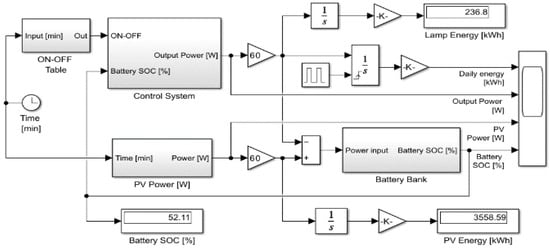
Figure 17.
View of the simulation model in Matlab-Simulink.
The primary variable of the simulation model is “Time [min],” which is the input signal for two blocks. The first block, “ON-OFF Table”, contains a table with street lighting ON and OFF times in each day of the year. The second block, “PV Power [W]”, contains a table with values of PV energy production described in a previous chapter of this article. The “Control System” block contains a set of security features to keep a minimum battery charge at the level of min. SOC = 50%. Such a requirement allows for the safe operation of the battery storage bank in harsh frost. In addition, in the case of Scenario 5, the block regulates the power supply to the luminaires depending on the presence of a pedestrian at the zebra crossing. The next step is to calculate the difference between the power produced by the PV system and that consumed by the luminaire. In the case of excess power during the day, the energy is stored in the battery, while at night, the energy is taken from the storage bank. For this purpose, “Battery Bank” block is determined to calculate the battery State Of Charge (SOC) level. The main tasks in the simulation model research were the analysis of key parameters of the lighting system. The relationship between power, daily energy consumption of the LED luminaires, required operating time, capacity of the batteries, PV power production and changes in light intensity were crucial for the research results.
2.7. Components of Autonomous Lighting System and Operational Scenarios
Table 5 presents the parameters of the components of the autonomous lighting system used in the simulations. In particular, this is the power of the PV panels, the capacity of the batteries, and the power of the MPPT controllers.
Table 5.
Parameters of the components adopted for the simulation.
2.8. Power Supply Scenarios
Table 6 presents five power supply scenarios. They are characterized by different powers of the LED luminaires, obtained from the lighting analysis presented in one of the previous chapters of this article and related to the lighting scenarios presented in Table 3. Scenarios 1 to 4 are characterized by constant LED power, whereas in Scenario 5, power consumption changes.
Table 6.
Description of the scenarios adopted in the analysis.
All scenarios take into account the on-and-off switching of the luminaire according to the specified timetable, which are synchronized with sunrise and sunset. This solution is characterized by changes in the energy consumed by the luminaire and are presented in the simulation results.
3. Simulation Results for Lighting Scenarios
The presented waveforms show the dependencies of the analyzed parameters as a function of time during the period of solar radiation availability. The parameters are Consumed Daily Energy, which is the energy consumed by the LED luminaire; Output Power, which is the value of the power transferred to the LED luminaire; PV Power, which is the power generated by the PV installation; and Battery SOC, which is battery state of charge level.
The simulations were performed over the entire calendar year (from 1 January to 31 December) in steps of 1 min. Figure 18 shows the results of the analysis for Scenario 1.
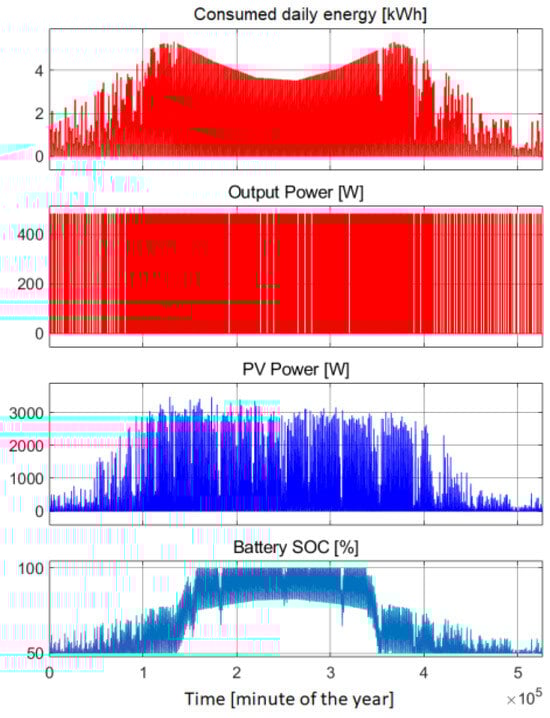
Figure 18.
Selected results over a full calendar year for Scenario 1.
The amount of energy consumed by the luminaire during the longest day of the year is 7.8 kWh, and the shortest is 3.52 kWh. By analyzing the waveforms in Figure 18 (Daily Energy and SOC Battery), it was found that the lighting system cannot operate as intended during the beginning and last weeks of the year. During these periods, there is a higher energy demand than production of energy, which is characterized by a reduction in operating hours. Requirements are not possible to fulfill. Figure 19 and Figure 20 show the detailed results of the analysis during the beginning and final periods of the year.
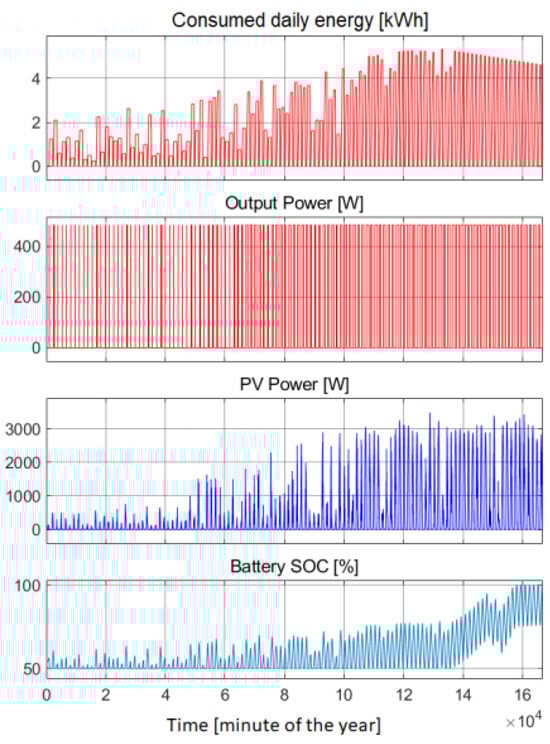
Figure 19.
Results of the analysis for Scenario 1 (beginning of the year).
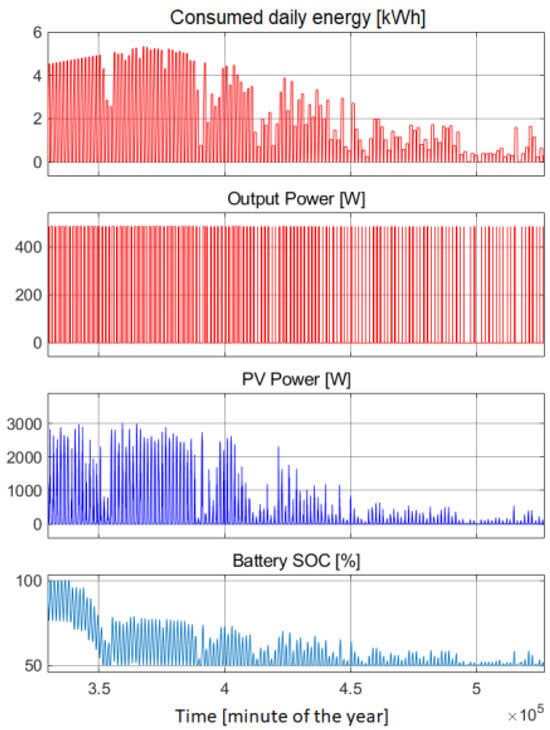
Figure 20.
Results of the analysis for Scenario 1 (end of year).
According to the analysis results for Scenario 1 (483.6 W), the correct operation of the lighting system can be achieved only between 97th and 243th day of the year. On the other days of the year, the system operates in an unstable manner. Figure 21 shows the results of the analysis for Scenario 2.
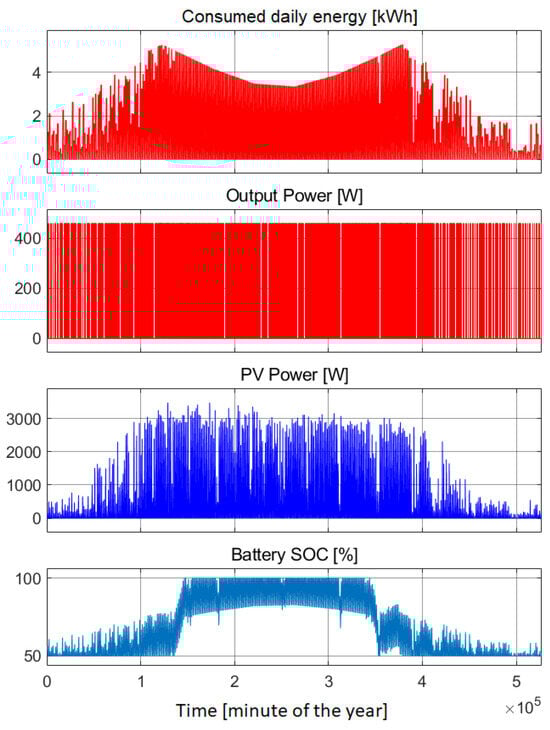
Figure 21.
Selected results over a full calendar year for Scenario 2.
The amount of energy consumed by the luminaire during the longest day of the year is 7.4 kWh, and the shortest is 3.35 kWh. By analyzing the waveforms of Figure 21 (Daily Energy and SOC Battery), it was found that the lighting system cannot operate as intended during the beginning and last weeks of the year. During these periods, there is a higher energy demand than production of energy, which is characterized by a reduction in operating hours. The illumination requirements are not possible to fulfill.
Figure 22 and Figure 23 shows the detailed results of the analysis during the beginning and final periods of the year for Scenario 2.
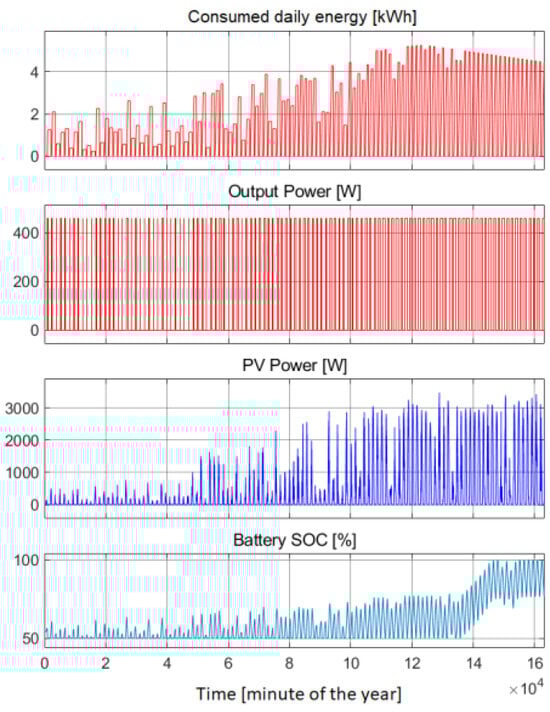
Figure 22.
Results of the analysis for Scenario 2 (beginning of the year).
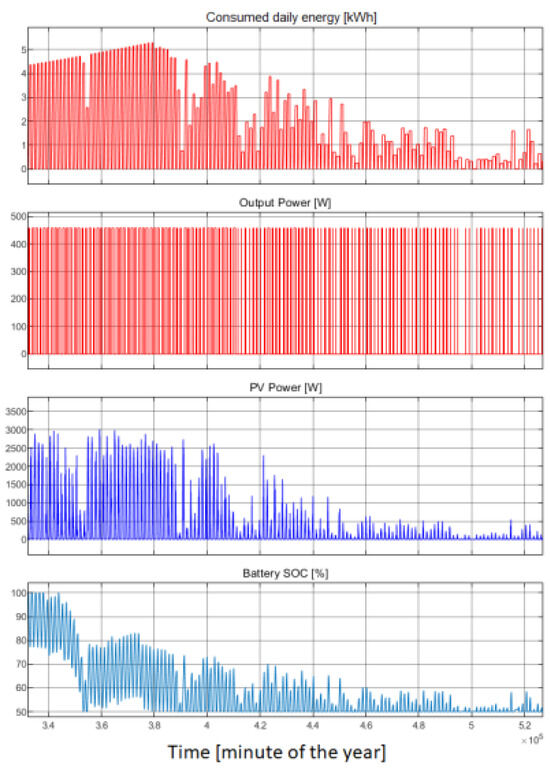
Figure 23.
Results of the analysis for Scenario 2 (end of year).
According to the analysis results for Scenario 2 (459.84 W), the correct operation of the lighting system is only feasible between 95 and 267 days of the year. For the other days of the year, the system operates in an unstable manner. Figure 24 shows the results of the analysis for Scenario 3.
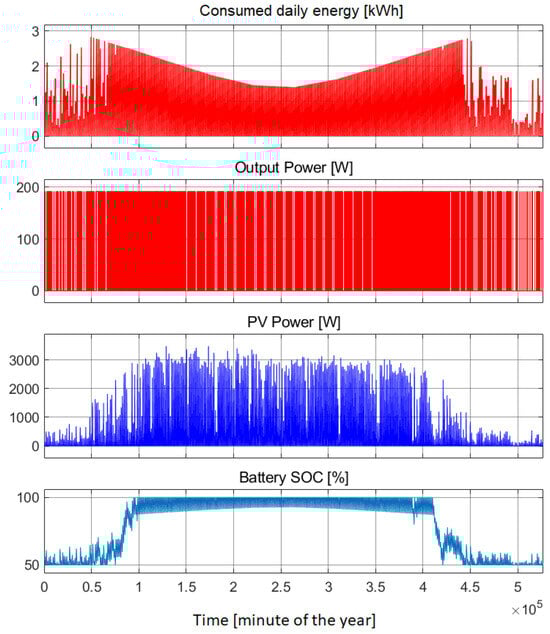
Figure 24.
Selected results over a full calendar year for Scenario 3.
The amount of energy consumed by the luminaire during the longest day of the year is 3.1 kWh, and the shortest is 1.4 kWh. By analyzing the waveforms in Figure 24 (Daily Energy and SOC Battery), the lighting system cannot operate as intended during the beginning and final weeks of the year. During these periods, there is a higher energy demand than production of energy, which is characterized by a reduction in operating hours. The illumination requirements are not possible to fulfill.
Figure 25 and Figure 26 shows the disruption of the lighting system during the early and late periods of the year for Scenario 3.
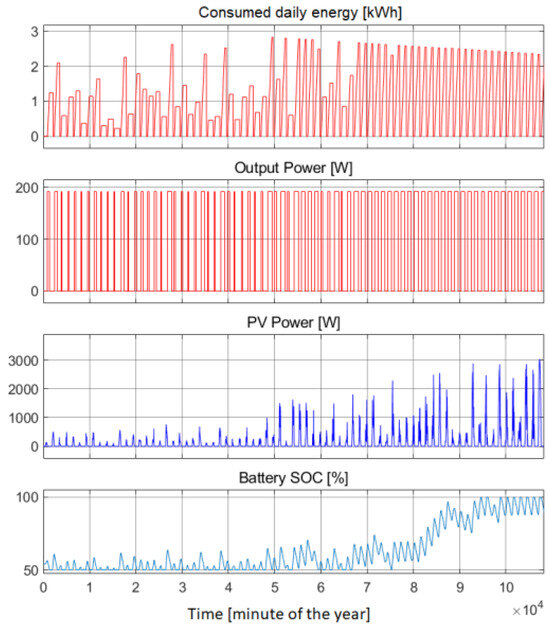
Figure 25.
Results of the analysis for Scenario 3 (beginning of the year).
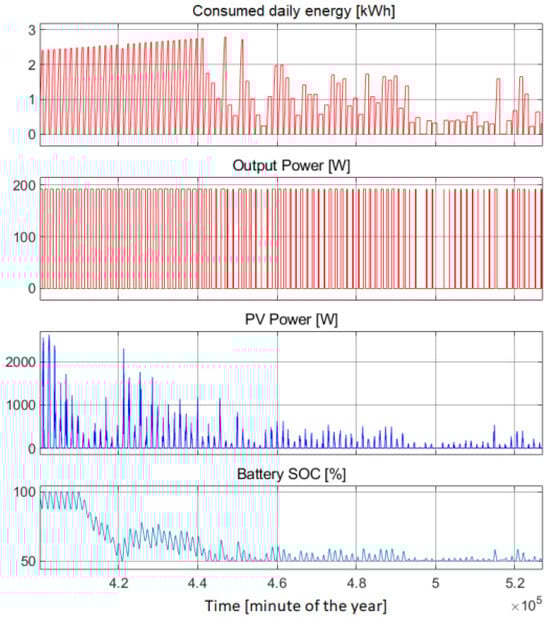
Figure 26.
Results of the analysis for Scenario 3 (end of year).
According to the results of the analysis for the 191.56 W lamp, the correct operation of the lighting system is feasible only between 48 and 305 days of the year. On the other days of the year, the system operates in an unstable manner. Figure 27 shows the results of the analysis for Scenario 4.
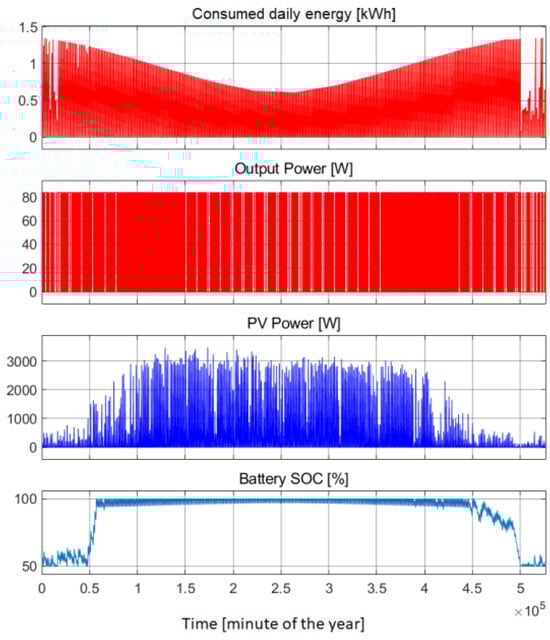
Figure 27.
Selected results over a full calendar year for Scenario 4.
The amount of energy the luminaire should consume during the longest day of the year is 1.35 kWh, and that for the shortest day is 0.61 kWh. Analyzing the waveforms of Figure 27 (Daily Energy and SOC Battery), during the beginning and final weeks of the year, the lighting system is not able to operate as intended. During these periods, there is a higher energy demand than production of energy, which is characterized by a reduction in operating hours. The illumination requirements are not possible to fulfill.
Figure 28 and Figure 29 show the disruption of the operation of the lighting system at the beginning and end of the year for Scenario 4.
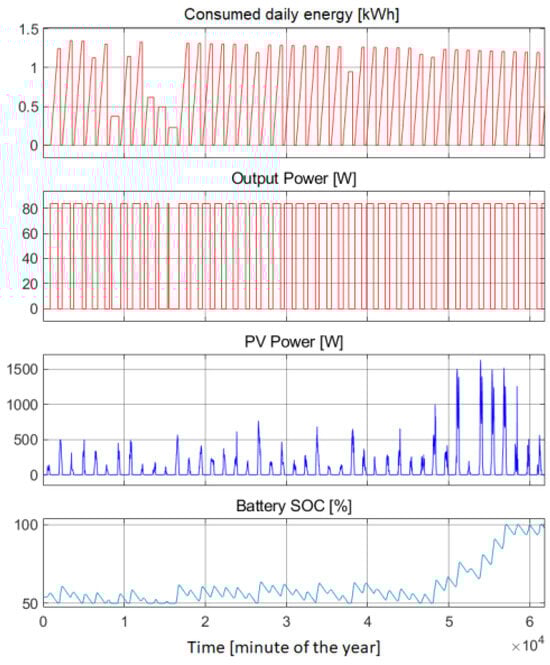
Figure 28.
Results of the analysis for Scenario 4 (beginning of the year).
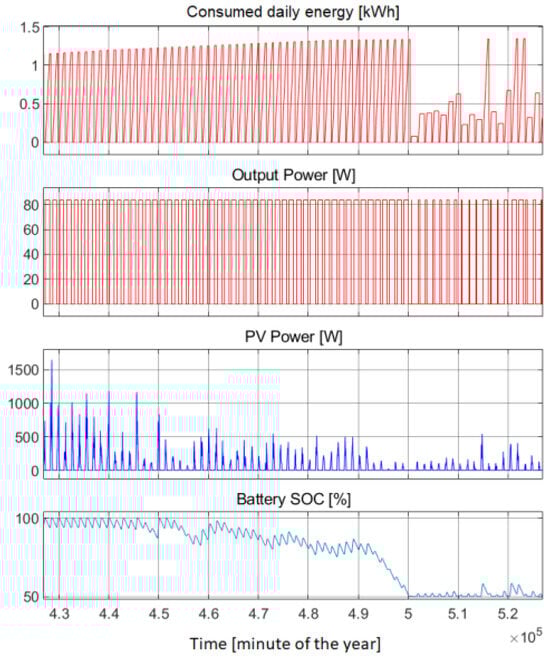
Figure 29.
Results of the analysis for Scenario 4 (end of year).
According to the results analysis for 83.56 W, the LED lamp’s correct system operation is feasible only between 34 and 347 days of the year. For the other days of the year, the system operates in an unstable manner.
After simulation studies for the four scenarios, it was realized that it is not possible to provide the required amount of energy and lighting parameters for the entire year’s operation.
In the next step, Scenario 5 was simulated. A series of time waveforms of selected parameters were obtained. The figures present the interaction of an autonomous lighting system operation equipped with a power control function.
Figure 30 shows selected results between the 129th and 131st day of the year during the availability of solar radiation, i.e., the first week of April. Following lighting simulations of the pedestrian crossing, required luminous flux was determined to achieve a 83.6 W luminaire power. However, when the zebra crossing was empty, the luminaire reduced the power to 47.7 W. This significantly minimizes amount of energy taken from the batteries.
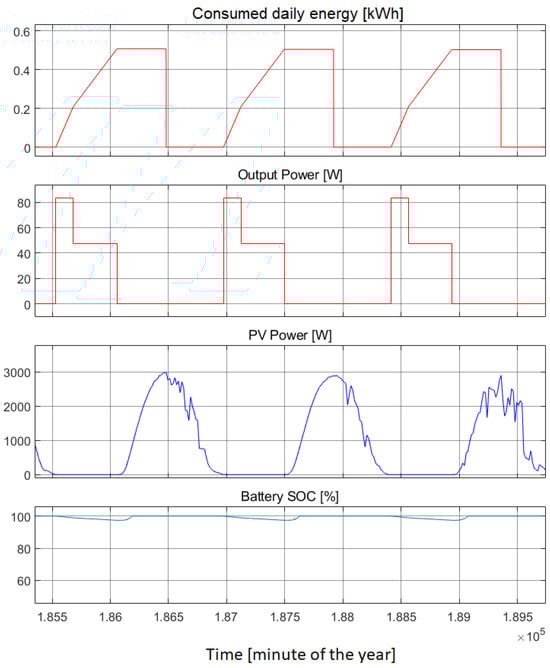
Figure 30.
Selected results for the 129th, 130th, 131st day of the year.
The change in power values is presented Figure 30 (Output Power), where all daily crossing times of the highway have been added into one common block. From the energy calculations point of view it is irrelevant whether 200 crossings of 45 s or one common lighting block of 9000 s per day are used. The final energy consumption values per day are the same, while this simplifies the implementation of the simulation model.
The result of the analysis during solar radiation availability, is the lighting system operates correctly, and the battery charge level varies between 97 and 100%.
Figure 31 shows selected results between days 322 and 365 of the year, during the period of reduced solar radiation availability, i.e., the last six weeks of the year. Reduction in battery state of charge level (Battery SOC) starts at 491,000 min, that is, the 341st of the year, and continues until 515,000 min (the 357th day of the year). The SOC battery level is 55%.
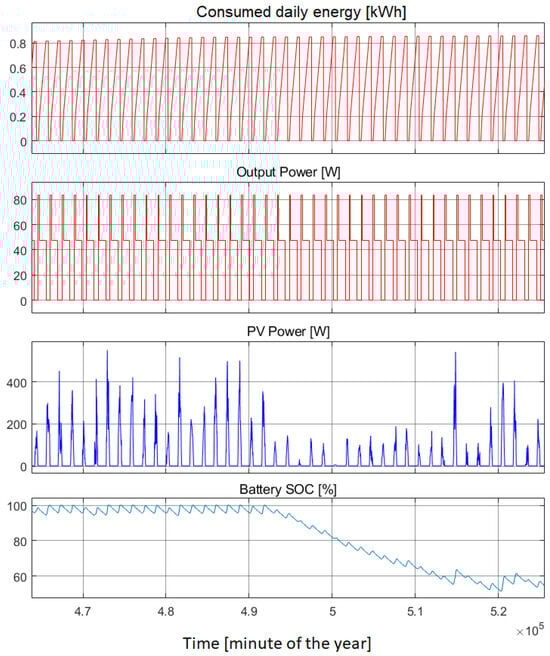
Figure 31.
Selected results for the period of solar radiation availability between days 129 and 131 of the year.
The conclusion of this case is that the most difficult period of the year for an autonomous lighting system is the second and third week of December, when the amount of solar radiation is insufficient to charge the batteries. The operation of the system during this period relies on the proper selection of the energy storage technology, the battery capacity and the way the power luminaire is controlled.
During the fourth week of December, the amount of energy increases slightly, allowing the battery charge level to remain constant. The simulation results are in line with the general knowledge that the day lengthens after 21 December, which is evident in the results of this energy analysis.
Figure 32 shows the results of the analysis throughout the year. The first waveform (Daily Energy) shows the variation in the energy values consumed by the LED lighting, depending on the current day length. It can be seen from the graph that the energy varies from 0.86 kWh for the longest day of the year to 0.44 kWh for the shortest day of the year.
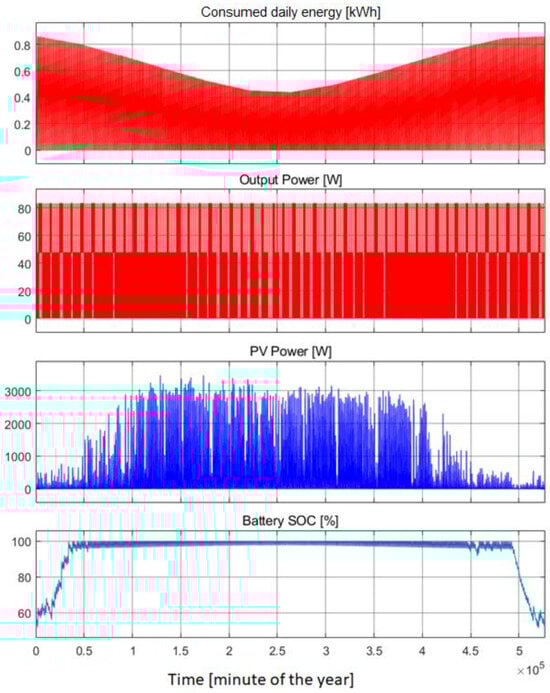
Figure 32.
Selected results for the full calendar year.
Figure 32 (Battery SOC) shows the waveform of battery charge levels throughout the year. The parameters of the components of the lighting installation are chosen correctly to illuminate the pedestrian crossing in such a way as to guarantee minimum energy performance throughout the year. During the entire year, battery charge level (SOC) does not drop below a level that could result in the unavailability of energy to supply power to the LED luminaires. Therefore, the fifth lighting scenario is possible to achieve.
4. Discussion
In the authors opinion, only a holistic and comprehensive approach to an energy analysis can answer the question of proper operation in a specific location. Table 7 summarizes the results obtained for the correct operating time of the autonomous lighting system.
Table 7.
Summary of simulation results for the correct operating time of a stand-alone lighting installation.
During summer, when solar radiation is available, batteries are charged at the level SOC = 97–100%. Therefore, it can be assumed that the energy storage bank is not operating in a daily deep discharge cycle. The impossibility of meeting the lighting levels throughout the year should be a counterindication to the use of solutions based on photovoltaic installations at pedestrian crossings outside built-up areas. The existence of the installation may contribute to a misunderstanding of the lighting situation by drivers and pedestrians. Users may be under the impression that the lighting consideration used achieves the intended technical parameters. As presented in this article during the month of December, this is problematic and may contribute to impairing the driver’s ability to recognize the pedestrian, leading to a conflict or accident.
The most critical component of the installation is the battery. During periods of reduced solar radiation availability, the battery charge level decreases when maintaining the required minimum SOC of 50%. It can be noticed that with such a cycle, it will operate at a minimum of 5 years, and with a good perspective even more; unfortunately, it is difficult to determine exactly what the period is. It is worth mentioning that the operation of lead–carbon batteries is specified by the manufacturer to be approximately 15 years. However, this applies to favorable operating conditions, such as positive operating temperatures. So, there will certainly be a shorter period of time.
It should be mentioned that the PV installation energy production data used in the analysis was appropriately illuminated by sun, and there were no trees that were growing in the area to cause shade on the PV panels. This is quite an important issue, as it requires the lighting systems to be installed in the same way.
The reliability analysis of pedestrian crossing lighting powered by photovoltaic panels includes an assessment of various technical, environmental, and economic factors that may affect the operation and performance of the lighting system. Below is presented a summary of factors that should be taken into consideration in the design process of an autonomous lighting system:
- Energy efficiency of the PV panels. Analysis of the performance of PV panels is crucial to assess their ability to generate required electric energy for the LEDs.
- Weather conditions. Local weather conditions, such as sunshine, rainfall, snow, fog, and the variability of weather conditions throughout the year, can affect the availability of the energy from PV panels.
- System durability: System components, such as photovoltaic panels, batteries, charge controllers, etc., must be durable and resistant to weather and other external conditions.
- Energy consumption. An accurate assessment of the energy consumption of a lighting system under different conditions, such as day and night, time of year, and pedestrian traffic in a given location, is important to determine the overall power requirements of the system.
- Safety. Proper illumination of pedestrian crossings is crucial for road safety. If the lighting system fails, there is a risk of serious accidents. Therefore, the reliability of the system is crucial to ensure lighting continuity.
- Maintenance and costs of the lighting system, such as repairs, battery replacement, cleaning of photovoltaic panels, etc.
- Alternative power sources. In some cases, it may also be necessary to consider alternative power sources, such petrol engine generators.
- Control technologies can influence and extend operating time.
- Monitoring technologies. The monitoring and diagnostic systems allow us to improve the performance and condition of the system.
5. Conclusions
According to the presented results, the possibility of continuous operation of the autonomous lighting installation throughout the year is only possible for Scenario 5. In any other case, the amount of available energy is too low to meet the lighting requirements. It should be mentioned that Scenario 5 is not recommended for implementation according to the formal requirements [11].
This paper assumes the operation of the installation under the climatic conditions in Poland, with the consequence of thermal and insolation requirements. The luminaire power system with photovoltaic panels and an electricity storage bank operates as a day–night energy buffer. This ensures that fully autonomous operation with PV panels as the only source of power, under Polish climatic conditions, should always lead to optimized parameters of the PV installation. Additionally, selecting the proper technology for the energy storage bank [47] to cope with the lack of electricity during periods of low solar radiation should be taken into consideration. The practical approach to the problem is to accept energy deficits, leading to a problematic operation of the installation at night during periods of low solar radiation.
This requires the determination of the duty cycles of the storage bank through the availability of energy from photovoltaic panels. Knowledge of energy deficits is a key factor in the design of installation parameters for pedestrian crossing lighting. It is assumed that the designed lighting levels are maintained for the whole year and, as the analyses show, it is not possible to meet this assumption for the amount of lighting required by Polish regulations [11]. Only for selected, power-limited cases does the installation provide enough energy to maintain the lighting conditions.
An analysis of the specific local conditions and user needs is crucial for the successful operation of a lighting system with PV and energy storage. The first step in new zebra crossing location analysis is the estimation of the energy production by the PV panels.
Installation of the pedestrian crossing in a shaded location will result in solar energy being inaccessible and will also result in the incorrect operation of the system. Therefore, any analyses for the placement of this type of lighting should be performed on year-round measurements of solar radiation and ambient temperature, in 1 h steps.
In conclusion, the reliability analysis of pedestrian crossing lighting systems powered by PV panels requires various technical, economic [48], and environmental factors. In terms of future research, we plan to perform a reliability analysis of the detection elements [49] and occupancy of the pedestrian crossing, and we also plan to determine these values for operating conditions. At the same time, pedestrian and vehicular traffic will be studied at selected locations.
Author Contributions
Conceptualization, P.T. and K.T.; methodology, K.T., P.T. and M.C.; software, K.T. and P.T.; validation, K.T., P.T. and M.C.; formal analysis, K.T., P.T. and M.C.; investigation, K.T.; resources, P.T.; data curation, K.T., P.T. and M.C.; writing—original draft preparation, K.T. and P.T.; writing—review and editing, K.T., P.T. and M.C.; visualization, P.T.; supervision, K.T. and P.T.; project administration, P.T.; funding acquisition, P.T. All authors have read and agreed to the published version of the manuscript.
Funding
This paper was co-financed under the research grant of the Warsaw University of Technology supporting scientific activities in the discipline of Civil Engineering, Geodesy and Transport.
Institutional Review Board Statement
Not applicable.
Informed Consent Statement
Not applicable.
Data Availability Statement
All data generated or analyzed to support the findings of the present study are included in this article. The raw data can be obtained from the authors, upon reasonable request.
Conflicts of Interest
The authors declare no conflicts of interest.
References
- Program Realizacyjny 2022–2023 Do Narodowego Programu Bezpieczeństwa Ruchu Drogowego 2021–2030; Krajowa Rada Bezpieczeństwa Ruchu Drogowego: Warsaw, Poland, 2020.
- European Commission. National Road Safety Profile Poland (2022); European Commission: Brussels, Belgium, 2023. [Google Scholar]
- Budzynski, M.; Jamroz, K.; Antoniuk, M. Effect of the Road Environment on Road Safety in Poland. In Proceedings of the IOP Conference Series: Materials Science and Engineering; IOP Publishing: Bristol, UK, 2017; Volume 245. [Google Scholar]
- Budzynski, M.; Guminska, L.; Jamroz, K.; Mackun, T.; Tomczuk, P. Effects of Road Infrastructure on Pedestrian Safety. IOP Conf. Ser. Mater. Sci. Eng. 2019, 603, 042052. [Google Scholar] [CrossRef]
- Mackun, T.; Jamroz, K.; Budzyński, M.; Kustra, W.; Ryś, A.; Słowy, J.; Tomczuk, P.; Chrzanowicz, M.; Jaskowski, P.; Wytrykowska, A.; et al. Audyt Bezpieczeństwa Przejść Dla Pieszych—Bemowo, Praga Północ, Wawer, Włochy, Żoliborz; Ministry of Infrastructure of the Republic of Poland: Warsaw, Poland, 2019.
- Mackun, T.; Jamroz, K.; Budzyński, M.; Kustra, W.; Ryś, A.; Słowy, J.; Tomczuk, P.; Chrzanowicz, M.; Jaskowski, P.; Wytrykowska, A.; et al. Audyt Bezpieczeństwa Przejść Dla Pieszych—Białołęka, Rembertów, Ursus, Wesoła, Wilanów, Wola; Ministry of Infrastructure of the Republic of Poland: Warsaw, Poland, 2020.
- Mackun, T.; Jamroz, K.; Budzyński, M.; Kustra, W.; Ryś, A.; Słowy, J.; Tomczuk, P.; Chrzanowicz, M.; Jaskowski, P.; Wytrykowska, A.; et al. Audyt Bezpieczeństwa Przejść Dla Pieszych—Targówek, Mokotów, Ursynów, Bielany; Ministry of Infrastructure of the Republic of Poland: Warsaw, Poland, 2017.
- Symon, E.; Rzepka, P. Wypadki Drogowe w Polsce w 2022 Roku; Ministry of Infrastructure of the Republic of Poland: Warsaw, Poland, 2023.
- Bhagavathula, R.; Gibbons, R.B. Lighting Strategies to Increase Nighttime Pedestrian Visibility at Midblock Crosswalks. Sustainability 2023, 15, 1455. [Google Scholar] [CrossRef]
- Tomczuk, P.; Wytrykowska, A.; Chrzanowicz, M. Analysis of Luminance Contrast Values at Illuminated Pedestrian Crossings in Urban Conditions. Energies 2023, 16, 8031. [Google Scholar] [CrossRef]
- Jamroz, K.; Tomczuk, P.; Mackun, T.; Chrzanowicz, M. WR-D-41-4 Wytyczne Projektowania Infrastruktury Dla Pieszych. Część 4: Projektowanie Oświetlenia Przejść Dla Pieszych; Ministry of Infrastructure of the Republic of Poland: Warsaw, Poland, 2018.
- Allery, T.A.; Martino, A.; Begay, S. Solar Street Lighting: Using Renewable Energy for Safety for the Turtle Mountain Band of Chippewa; Sandia National Lab. (SNL-NM): Albuquerque, NM, USA, 2018. [Google Scholar] [CrossRef]
- J.D. Inżynieria Ruchu Technical Documentation: Solar Road Lighting System. Available online: https://www.inzynieria-ruchu.pl/solarny-system-oswietlenia-drog/ (accessed on 7 February 2024).
- RMS Polska Technical Documentation: LED Lamps—Solar and Hybrid. Available online: https://www.rms.com.pl/oferta/oswietlenie/lampy-solarne-i-lampy-hybrydowe/lampy-led-solarne-i-hybrydowe/ (accessed on 8 February 2024).
- BrasiT Technical Documentation: Active Safe Crossing with Hybrid Lighting + Active Sign D6. Available online: https://www.brasit.pl/aktywne-bezpieczne-przejscie-z-oswietleniem-hybrydowym-znak-aktywny-d6/ (accessed on 13 February 2024).
- Costa, M.A.D.; Schuch, L.; Michels, L.; Rech, C.; Pinheiro, J.R.; Costa, G.H. Autonomous Street Lighting System Based on Solar Energy and LEDs. In Proceedings of the 2010 IEEE International Conference on Industrial Technology, Vina del Mar, Chile, 14–17 March 2017; IEEE: Piscataway, NJ, USA, 2010; pp. 1143–1148. [Google Scholar]
- Rudrawar, O.; Daga, S.; Chadha, J.R.; Kulkami, P.S. Smart Street Lighting System with Light Intensity Control Using Power Electronics. In Proceedings of the 2018 Technologies for Smart-City Energy Security and Power (ICSESP), Bhubaneswar, India, 28–30 March 2018; IEEE: Piscataway, NJ, USA, 2018; pp. 1–5. [Google Scholar]
- Tomczuk, K. The Laboratory Model of 400 W Halide Lamp Power Supply, Used to Illumination of Vegetable Crops. Prz. Elektrotechniczny 2012, 88, 134–137. [Google Scholar]
- Tukymbekov, D.; Saymbetov, A.; Nurgaliyev, M.; Kuttybay, N.; Nalibayev, Y.; Dosymbetova, G. Intelligent Energy Efficient Street Lighting System with Predictive Energy Consumption. In Proceedings of the 2019 International Conference on Smart Energy Systems and Technologies (SEST), Porto, Portugal, 9–11 September 2017; IEEE: Piscataway, NJ, USA, 2019; pp. 1–5. [Google Scholar]
- Jagadeesh, Y.M.; Akilesh, S.; Karthik, S. Prasanth Intelligent Street Lights. Procedia Technol. 2015, 21, 547–551. [Google Scholar] [CrossRef]
- Wojnicki, I.; Kotulski, L. Improving Control Efficiency of Dynamic Street Lighting by Utilizing the Dual Graph Grammar Concept. Energies 2018, 11, 402. [Google Scholar] [CrossRef]
- Agramelal, F.; Sadik, M.; Moubarak, Y.; Abouzahir, S. Smart Street Light Control: A Review on Methods, Innovations, and Extended Applications. Energies 2023, 16, 7415. [Google Scholar] [CrossRef]
- Martyanov, A.S.; Korobatov, D.V.; Solomin, E.V. Simulation Model of Public Street Lighting Provided by a Photovoltaic Converter and Battery Storage. In Proceedings of the 2017 International Conference on Industrial Engineering, Applications and Manufacturing (ICIEAM), Saint Petersburg, Russia, 16–19 May 2017; IEEE: Piscataway, NJ, USA, 2017; pp. 1–5. [Google Scholar]
- Yoomak, S.; Ngaopitakkul, A. Development of Sustainable Nanogrid Road Lighting Systems. IEEE Trans. Intell. Transp. Syst. 2021, 22, 6682–6699. [Google Scholar] [CrossRef]
- Mahmud, M.N.; Baharom, M.N.R. Development of UPS for Pedestrian Traffic Light Using Solar- Piezo and Grid Power Supplies. Evol. Electr. Electron. Eng. 2022, 3, 477–489. [Google Scholar]
- Zhou, B.; Pei, J.; Nasir, D.M.; Zhang, J. A Review on Solar Pavement and Photovoltaic/Thermal (PV/T) System. Transp. Res. Part D Transp. Environ. 2021, 93, 102753. [Google Scholar] [CrossRef]
- UE Directive (EU) 2018/2001 of the European Parliament and of the Council of 11 December 2018 on the Promotion of the Use of Energy from Renewable Sources. Available online: https://eur-lex.europa.eu/legal-content/PL/TXT/?uri=celex%3A32018L2001 (accessed on 2 February 2024).
- Ciriminna, R.; Meneguzzo, F.; Albanese, L.; Pagliaro, M. Solar Street Lighting: A Key Technology En Route to Sustainability. Wiley Interdiscip. Rev. Energy Environ. 2017, 6, e218. [Google Scholar] [CrossRef]
- Leonardi, S.; Tina, G.M.; Distefano, N. Photovoltaic Roundabouts for Enhancement of Self-Sufficiency and Resiliency. Appl. Syst. Innov. 2022, 5, 46. [Google Scholar] [CrossRef]
- Rahman, M.; Mabrouk, G.; Dessouky, S. Development of a Photovoltaic-Based Module for Harvesting Solar Energy from Pavement: A Lab and Field Assessment. Energies 2023, 16, 3338. [Google Scholar] [CrossRef]
- Tomczuk, K.; Mazurek, P.; Hemka, L.; Kasprowicz, A.; Błażejczyk, T. Investigation of HID-Lamp Light Emission Differences for Different Power Supply Methods. Bull. Pol. Acad. Sci. Tech. Sci. 2016, 64, 915–923. [Google Scholar] [CrossRef][Green Version]
- El-Faouri, F.S.; Sharaiha, M.; Bargouth, D.; Faza, A. A Smart Street Lighting System Using Solar Energy. In Proceedings of the 2016 IEEE PES Innovative Smart Grid Technologies Conference Europe (ISGT-Europe), Ljubljana, Slovenia, 9–12 October 2016; IEEE: Piscataway, NJ, USA, 2016; pp. 1–6. [Google Scholar]
- Mohanty, P.; Pati, U.C.; Mahapatra, K.; Mohanty, S.P. BSlight: Battery-Less Energy Autonomous Street Light Management System for Smart City. IEEE Trans. Sustain. Comput. 2023, 9, 100–114. [Google Scholar] [CrossRef]
- Lenord Melvix, J.S.M.; Sundararamabalasubramanian, K.; Madhan, M.G. Development of Intelligent Battery Monitoring System for Solar Powered Lighting Applications. In Proceedings of the 2014 IEEE International Conference on Computational Intelligence and Computing Research, Coimbatore, India, 18–20 December 2014; IEEE: Piscataway, NJ, USA, 2014; pp. 1–5. [Google Scholar]
- Capizzi, G.; Lo Sciuto, G.; Napoli, C.; Tramontana, E. Advanced and Adaptive Dispatch for Smart Grids by Means of Predictive Models. IEEE Trans. Smart Grid 2018, 9, 6684–6691. [Google Scholar] [CrossRef]
- Gaca, S.; Tomczuk, P.; Chrzanowicz, M.; Mackun, T.; Jamroz, K.; Krukowicz, T.; Kurkowski, M.; Moczyński, H.; Salejko, M.; Żółtowska, J. WR-D-72-1 Wytyczne Projektowania Urządzeń Do Oświetlenia Dróg Zamiejskich i Ulic. Część 1: Wymagania Podstawowe i Szczegółowe; Ministry of Infrastructure of the Republic of Poland: Warsaw, Poland, 2022.
- Gaca, S.; Tomczuk, P.; Chrzanowicz, M.; Mackun, T.; Jamroz, K.; Krukowicz, T.; Kurkowski, M.; Moczyński, H.; Salejko, M.; Żółtowska, J. WR-D-72-2 Wytyczne Projektowania Urządzeń Do Oświetlenia Dróg Zamiejskich i Ulic. Część 2: Katalog Typowych Rozwiązań; Ministry of Infrastructure of the Republic of Poland: Warsaw, Poland, 2022.
- PN-EN 13201:2016; “Oświetlenie Dróg”, Polski Komitet Normalizacyjny. European Standard: Warsaw, Poland, 2016.
- Townsend, A.; Gouws, R. A Comparative Review of Lead-Acid, Lithium-Ion and Ultra-Capacitor Technologies and Their Degradation Mechanisms. Energies 2022, 15, 4930. [Google Scholar] [CrossRef]
- Townsend, A.; Jiya, I.N.; Martinson, C.; Bessarabov, D.; Gouws, R. A Comprehensive Review of Energy Sources for Unmanned Aerial Vehicles, Their Shortfalls and Opportunities for Improvements. Heliyon 2020, 6, e05285. [Google Scholar] [CrossRef] [PubMed]
- Wagner, F.T.; Lakshmanan, B.; Mathias, M.F. Electrochemistry and the Future of the Automobile. J. Phys. Chem. Lett. 2010, 1, 2204–2219. [Google Scholar] [CrossRef]
- Łebkowski, A. Temperature, Overcharge and Short-Circuit Studies of Batteries Used in Electric Vehicles. Przegląd Elektrotechniczny 2017, 5, 67–73. [Google Scholar] [CrossRef]
- Kasprzyk, L.; Burzyński, D. Modelowanie Zachowania Się Akumulatora Kwasowo-Ołowiowego Podczas Jazdy Samochodu Elektrycznego z Wykorzystaniem Środowiska MATLAB. Pozn. Univ. Technol. Acad. J. Electr. Eng. 2016, 86, 255–265. [Google Scholar]
- Ceraolo, M. New Dynamical Models of Lead-Acid Batteries. IEEE Trans. Power Syst. 2000, 15, 1184–1190. [Google Scholar] [CrossRef] [PubMed]
- Barsali, S.; Ceraolo, M. Dynamical Models of Lead-Acid Batteries: Implementation Issues. IEEE Trans. Energy Convers. 2002, 17, 16–23. [Google Scholar] [CrossRef]
- El Mehdi, L.; El Filali, A.; Zazi, M.; El Ballouti, A. Comparative Study of Lead Acid Battery Modelling. J. Eng. Appl. Sci. 2018, 13, 4448–4452. [Google Scholar]
- Marańda, W.; Marciniak, P.; Kotas, R.; Sakowicz, B.; Tylman, A.; Sztoch, P.; Droz, M. Forecasting Interruptions in Power Supply Using Photovoltaics in Poland—Case Study of Safe Pedestrian Crossing. In Proceedings of the 2019 MIXDES—26th International Conference “Mixed Design of Integrated Circuits and Systems”, Rzeszów, Poland, 27–29 June 2019; IEEE: Piscataway, NJ, USA, 2019; pp. 113–118. [Google Scholar]
- Aleksiejuk-Gawron, J.; Milčiuvienė, S.; Kiršienė, J.; Doheijo, E.; Garzon, D.; Urbonas, R.; Milčius, D. Net-Metering Compared to Battery-Based Electricity Storage in a Single-Case PV Application Study Considering the Lithuanian Context. Energies 2020, 13, 2286. [Google Scholar] [CrossRef]
- Sui, T. Pedestrian Crossing Light Assistance System. In Proceedings of the EEI 2022: 4th International Conference on Electronic Engineering and Informatics, Guiyang, China, 24–26 June 2022; VDE: Berlin, Germany, 2022; pp. 1–5. [Google Scholar]


Disclaimer/Publisher’s Note: The statements, opinions and data contained in all publications are solely those of the individual author(s) and contributor(s) and not of MDPI and/or the editor(s). MDPI and/or the editor(s) disclaim responsibility for any injury to people or property resulting from any ideas, methods, instructions or products referred to in the content. |
© 2024 by the authors. Licensee MDPI, Basel, Switzerland. This article is an open access article distributed under the terms and conditions of the Creative Commons Attribution (CC BY) license (https://creativecommons.org/licenses/by/4.0/).