1. Introduction
With the rapid development of science and technology, data exploration techniques can now be applied to different levels of knowledge. The increasing sophistication of machine learning models enables the simulation of a growing array of phonetic changes, therefore mirroring real-world linguistic shifts. For example, the study conducted by [
1] employs an agent-based model (ABM) methodology to investigate speech stability and change by utilizing authentic speech data from a cohort of speakers. The analysis encompasses two distinct speech databases, with the initial dataset comprising recordings of individuals across different age groups speaking Standard Southern British English (SSBE). By employing an ABM facilitated by unsupervised machine learning algorithms, the research identifies a progressive phonetic shift concerning the /
u/ vowel sound. However, no significant phonological reclassification of any vowels was observed. These findings suggest a tendency towards phonetic alteration while maintaining phonological stability. Furthermore, the ABM approach was extended to examine diphthongs in New Zealand English over the preceding five decades, particularly focusing on the merger of /
eə/ into /
ıə/. This exploration delves into the principles of exemplar theory to elucidate the dynamics of phonetic change within the context of language evolution. As machine learning methodologies effectively capture these transformations, researchers in phonetics and phonology can leverage such simulations to scrutinize and refine existing theoretical frameworks of phonetic change. This comparative analysis serves to elucidate specific theories pertaining to the mechanisms underlying phonetic evolution. In complement to micro-level analyses of speech evolution, the macroscopic observation of historical linguistic changes represents another realm where machine learning methodologies can offer substantial contributions.
In parallel, the history of sound changes in a language seems to be being investigated, but this has rarely been found in previous studies. One of the related fields is machine transliteration, which involves the phonetic conversion of words from a source language into the words of a target language. Positioned as a subset of machine translation, it encompasses diverse methodological approaches aimed at addressing the intricacies of transliteration tasks. In that sense, utilizing a novel corpus automatic detection method could potentially bridge existing gaps by facilitating a comparative analysis between model-generated predictions and the derivational sequence of sound development. This parallel examination holds promise for enhancing our understanding of phonetic evolution and the predictive capabilities of computational models in phonological research.
Indeed, a targeted approach involves leveraging established models to translate a given word from one contemporary pronunciation to another. By systematically analyzing the accurately generated words from such models in juxtaposition with the sound acquisition sequence observed in human beings, which typically progresses from unmarked features to marked ones, valuable insights into phonetic evolution and model performance can be gleaned.
On the other hand, the evolution of the Chaoshan dialect within historical linguistic contexts underscores its origins and development into the contemporary dialect spoken today. Scholars such as [
2,
3] assert that the Chaoshan dialect is part of the Southern Min dialect, which itself belongs to the broader Min dialect family. Historically, Min dialects have exhibited close linguistic ties with other Chinese dialects, yet they have also maintained a distinctiveness, rendering Min among the most conservative of all Chinese dialect groups [
4]: p. 216). The Chaoshan dialect’s formation can be traced back to around the Song Dynasty. Evidence provided by scholars ([
2]: p. 124; [
3]: p. 97–99) suggests that during the Tang and Song Dynasties, the Chaozhou and Fujian dialects exhibited only regional differences without any fundamental distinctions. It was not until the Yuan and Ming dynasties that the Chaoshan dialect gradually diverged from the Fujian dialect and began to assimilate various aspects of Cantonese, including pronunciation, vocabulary, and grammar ([
5]: p. 17, p. 52–56).
Thus, this section will introduce Chaoshan phonology, with two meticulously preserved Chaoshan dictionaries employed as the case study. Subsequently, we focus on the sequential emergence of vowels, consonants, and tones in children’s acquisition processes. The anticipated outcomes predicted by models for the Chaoshan dictionaries include a parallel assessment of children’s speech sound acquisition processes. Such analysis is poised to augment our comprehension of the predictive efficacy inherent in computational models within the domain of speech research.
1.1. Chaoshan Phonology
According to [
6], the Chaoshan dialect has 18 initials, /
p, t, k, ph, th, kh, b, g, ts, tsh, s, z, m, n, ŋ, l, h, and ø/; six vowels /
i, e, a, o, and u, ɰ/; and eight tones, T1 = 33, T2 = 52, T3 = 213, T4 = 2, T5 = 55, T6 = 35, T7 = 11, and T8 = 4, with respect to the five-scale tonal description of [
7]. The syllable structure is reported to be CGVE, where C is a [+consonantal] segment; G is a glide; V is the vowel nucleus; and E is either a nasal or a glide. According to the two dictionaries, Chaoshan has systematically lost the mostly unmarked
[t] and
[n] at the end of the rhyme after more than 100 years. This evaluation was replicated in the perception and production experiments conducted by [
8,
9,
10].
1.2. The Acquisition of Vowels, Consonants, and Tones by Children in Terms of Their Order of Emergence
Concerning the development and acquisition of languages by children, several different studies have been undertaken in relation to the Sino-Tibetan language family, including Mandarin Chinese, Taiwan Southern Min (TSM), and Cantonese. Consonant, vowel, and tone acquisition have been discussed based on different Sino-Tibetan languages. In consonant acquisition, with regards to the manner of articulation (MOA), stops have been found to be acquired earlier than fricatives and following affricates [
11,
12] for Mandarin Chinese in Taiwan, [
13], for TSM, [
14], and for Cantonese). As for the place of articulation (POA), it has been found that consonants articulated in the anterior part of the mouth are usually acquired earlier than consonants in the posterior part of the mouth [
15]. This is supported by [
11,
12] for Mandarin Chinese in Taiwan and [
13] for TSM. However, ref. [
14] assert that coronals are acquired earlier than labials in Cantonese. As for voiced features, voiced consonants are usually acquired earlier in English [
16], TSM [
13], and Cantonese [
14], compared to Mandarin Chinese in Taiwan [
11,
12]. As for aspirated features, unaspirated consonants are acquired first, followed by their aspirated counterparts in Taiwan Mandarin Chinese [
11,
12], in TSM, [
13], and in Cantonese, [
14]. Overall, the order of consonant acquisition in Taiwan Mandarin Chinese, TSM, and Cantonese pretty consistently goes from unmarked to marked features according to Jakobson’s definition.
In vowel acquisition, most studies have demonstrated that children acquire vowels earlier than consonants. Regarding the nature of the vowels,
[a] seems to be acquired first, then
[i] and
[u], followed by the mid-vowels and others. In Mandarin Chinese in Taiwan, ref. [
11] not only demonstrated the same pattern but also reported that the CV structure is dominant at the first stage, followed by CVC, CVV, and the rest of the complex syllabic structures. Moreover, oral vowels are acquired earlier than nasalized vowels, and single vowels are acquired first, compound vowels second, and triple vowels last in TSM [
13]. For vowel acquisition by children in Mandarin, Jakobson’s mature theory, i.e., from unmarked to marked feature acquisition, seems to hold.
Finally, the subject of tone acquisition appears to have drawn the most attention from scholars. It has been established that level tones are acquired earlier than contour tones ([
11,
12] for Mandarin Chinese in Taiwan; [
13] for TSM; [
14] for Cantonese). For TSM, Hsu (1989) [
13] reported that high initial tones (high-level, high-falling, and high-rising) were acquired first, followed by the low-falling tones, and then the mid-level tones. The low, entering tone,
yin-ru, was acquired last because the high, entering tone,
yang-ru, merged into the mid-level tone, yielding a total of six tones. In addition, an unchecked tone is acquired earlier than a checked tone.
To summarize, the development and acquisition of Mandarin Chinese in Taiwan, Taiwan Southern Min (TSM), and Cantonese among children is in line with that proposed by [
15]. Regarding acquisition by children, ref. [
15] proposed a prototype of ‘maturational theory’, whereby the biological programming in human beings determines the structure of language acquisition. Based on Jakobson’s hierarchy of development at the word level, each component can be assigned as a subset of binary distinctive features (DFs) underlying the phonemes of the world’s languages. The higher the hierarchy where the phoneme is located, the easier/earlier it can be produced by a child. This sequence/order of the emergence of sounds usually indicates a shift from unmarked to marked features, which, due to being harder, are acquired later by children. Maturational theory implies that phones may be acquired in the same order all over the world. In addition, quantitatively speaking, the number of sounds with unmarked features is always more than or equal to those with marked features. For example, ref. [
17] documented sound distributions in more than 300 languages. They found that when compared to unmarked sounds, infrequent sounds are marked, and the domain could be either within one language, usually referring to the phoneme level, or exist across languages. Furthermore, simple-articulated sounds are more frequent than complex-articulated sounds. The vowel
[a] offers a good example, as it appears in all languages, whereas the vowel
[ë] is relatively rare. It is well known that
[i, a, and u] are canonical vowels, meaning all languages have them. As such, it is no wonder that these canonical vowels are easier models to learn. As for consonants, with respect to the MOA and POA, it is clear that stops are more consonant-like compared to other consonants (and fricatives are more easily articulated than affricates), while coronals represent the default/unmarked POA. As for tones, previous studies on the unchecked tones acquired by children were reviewed because the checked tones are seldom reported. For Mandarin Chinese, ref. [
18] proposed that the high-level and falling tones are acquired before the rising and dipping tones, meaning the level tones are likely easier than the contour tones. In this case, the former maintains a consistent frequency in pitch, while the latter needs to change the pitch level at least once. Yip (2001) postulated a similar argument. In addition to contour vs. level tones, she also proposed that rising tones are more marked than falling tones, while high-level tones are more marked than low-level tones. Her theory of tone thus predicts that all the unmarked tones are acquired earlier than the marked tones.
2. Related Work
In computational linguistics, automated models focusing on language evolution primarily concentrate on detecting cognates among different related languages [
19,
20,
21,
22,
23] and inferring phonological correspondences [
24]. These efforts aim to construct phylogenetic trees representing the relationships between languages. However, the objective is to identify the rules of sound change rather than to actually build a model capable of predicting the historical evolution of language sounds. A similar task is found in machine transliteration, which phonetically converts the words of a source language into the words of a target language. Machine transliteration can be regarded as a subtask of machine translation. Many different approaches to machine translation have been adopted to solve the task of machine transliteration. Early approaches were based on dictionaries or lexicons to map the phonemes between the source and target languages [
25,
26]. Later, statistical machine learning methods were adopted to learn the mapping from the source to the target languages [
27,
28].
Statistical machine learning constitutes a foundational framework for the domain of machine learning, deriving its principles from the disciplines of statistics and functional analysis. This theoretical construct is primarily concerned with the challenge of statistical inference, specifically the derivation of a predictive function from a given dataset. The implementation of statistical learning theory has precipitated significant advancements across a variety of domains, including but not limited to computer vision, speech recognition, and bioinformatics. Through its rigorous approach to understanding and modeling the underlying patterns within data, statistical learning theory has played a pivotal role in the development and enhancement of algorithms that facilitate complex decision-making and predictive analyses in these fields.
Ref. [
27] proposed a statistical machine learning framework that facilitates direct orthographical mapping (DOM) between two distinct languages via a joint source-channel model, herein referred to as the n-gram Transliteration Model (TM). The n-gram TM model streamlines the orthographic alignment process by automatically generating aligned transliteration units from a bilingual dictionary. Employing the n-gram TM within the DOM framework significantly diminishes the effort required for system development and achieves a substantial enhancement in transliteration accuracy, surpassing the performance of contemporary state-of-the-art machine learning algorithms. The efficacy of this modeling framework is corroborated through a series of experimental validations focusing on the transliteration between the English and Chinese language pair.
Ref. [
28] utilized conditional random field (CRF) models to formulate transliteration as a sequence-labeling problem. The many-to-many (m2m) aligner was used to generate character mappings between English and Arabic, and then a CRF model was trained based on the alignment results to label each English input character with a sequence of Arabic characters. CRFs are a class of statistical modeling methods often applied in pattern recognition and machine learning and are used for structured prediction. Diverging from traditional classifiers, which determine labels for individual samples in isolation, CRFs are designed to incorporate contextual information, considering the interdependencies among adjacent samples. This contextual consideration is operationalized through the formulation of a graphical model, encapsulating the dependencies among predictions. The architecture of the graph utilized is contingent upon the specific requirements of the application at hand.
In recent decades, deep learning-based models have been widely adopted for machine transliteration. Deep learning is the subset of machine learning methods based on artificial neural networks (ANNs) with representation learning. The adjective “deep” refers to the use of multiple layers in the network. The methods used can be either supervised, semi-supervised, or unsupervised. Artificial neural networks (ANNs) draw inspiration from the paradigms of information processing and the distributed communication observed within biological systems. Despite this inspiration, ANNs exhibit several fundamental distinctions from biological brains. Notably, ANNs typically manifest as static and symbolic constructs, which is in contrast to the dynamic (plastic) and analog nature inherent to the biological brains of most living organisms. Consequently, ANNs are often regarded as rudimentary or low-fidelity models when it comes to accurately replicating the complex functionalities and adaptive capabilities of the brain.
Ref. [
29] proposed a neural network model combining a convolutional neural network (CNN) and a recurrent neural network (RNN) for English-Chinese transliteration. A CNN is a type of feedforward neural network, the neurons of which can respond to a subset of the surrounding units within a certain coverage range, demonstrating outstanding performance in large-scale image processing. Composed of one or more convolutional layers atop fully connected layers (akin to classical neural networks), CNNs also incorporate pooling layers along with associated weights. This architecture allows CNNs to leverage the two-dimensional structure of input data. Compared to other deep learning structures, CNNs yield superior results in image and speech recognition tasks. Moreover, this model can be trained using the backpropagation algorithm. With fewer parameters to consider compared to other deep, feedforward neural networks, CNNs represent an attractive deep learning architecture. Moreover, RNNs represent one of the primary categories of ANNs, distinguished by the bi-directional flow of information across its layers. Unlike unidirectional feedforward neural networks, RNNs facilitate a feedback loop within their architecture, allowing outputs from certain nodes to influence the subsequent inputs to those same nodes. This distinctive feature endows RNNs with the capacity to maintain an internal state or memory, therefore enabling the processing of sequences of inputs of arbitrary lengths. This capability renders RNNs particularly suited for applications in tasks that involve sequential data, such as unsegmented, connected handwriting recognition or speech recognition. The terminology “recurrent“ neural network specifically applies to networks classified by an infinite impulse response, which is in contrast to “convolutional” neural networks, which are characterized by a finite impulse response. Both types of networks demonstrate temporal dynamic behavior, which is crucial for processing time-dependent data. A network with a finite impulse response can be conceptualized as a directed acyclic graph, which permits unfolding into an equivalent strictly feedforward neural network. Conversely, a network with an infinite impulse response, due to its cyclical graph structure, cannot be unfolded in this manner, reflecting its inherent capacity for modeling complex temporal dynamics.
Ref. [
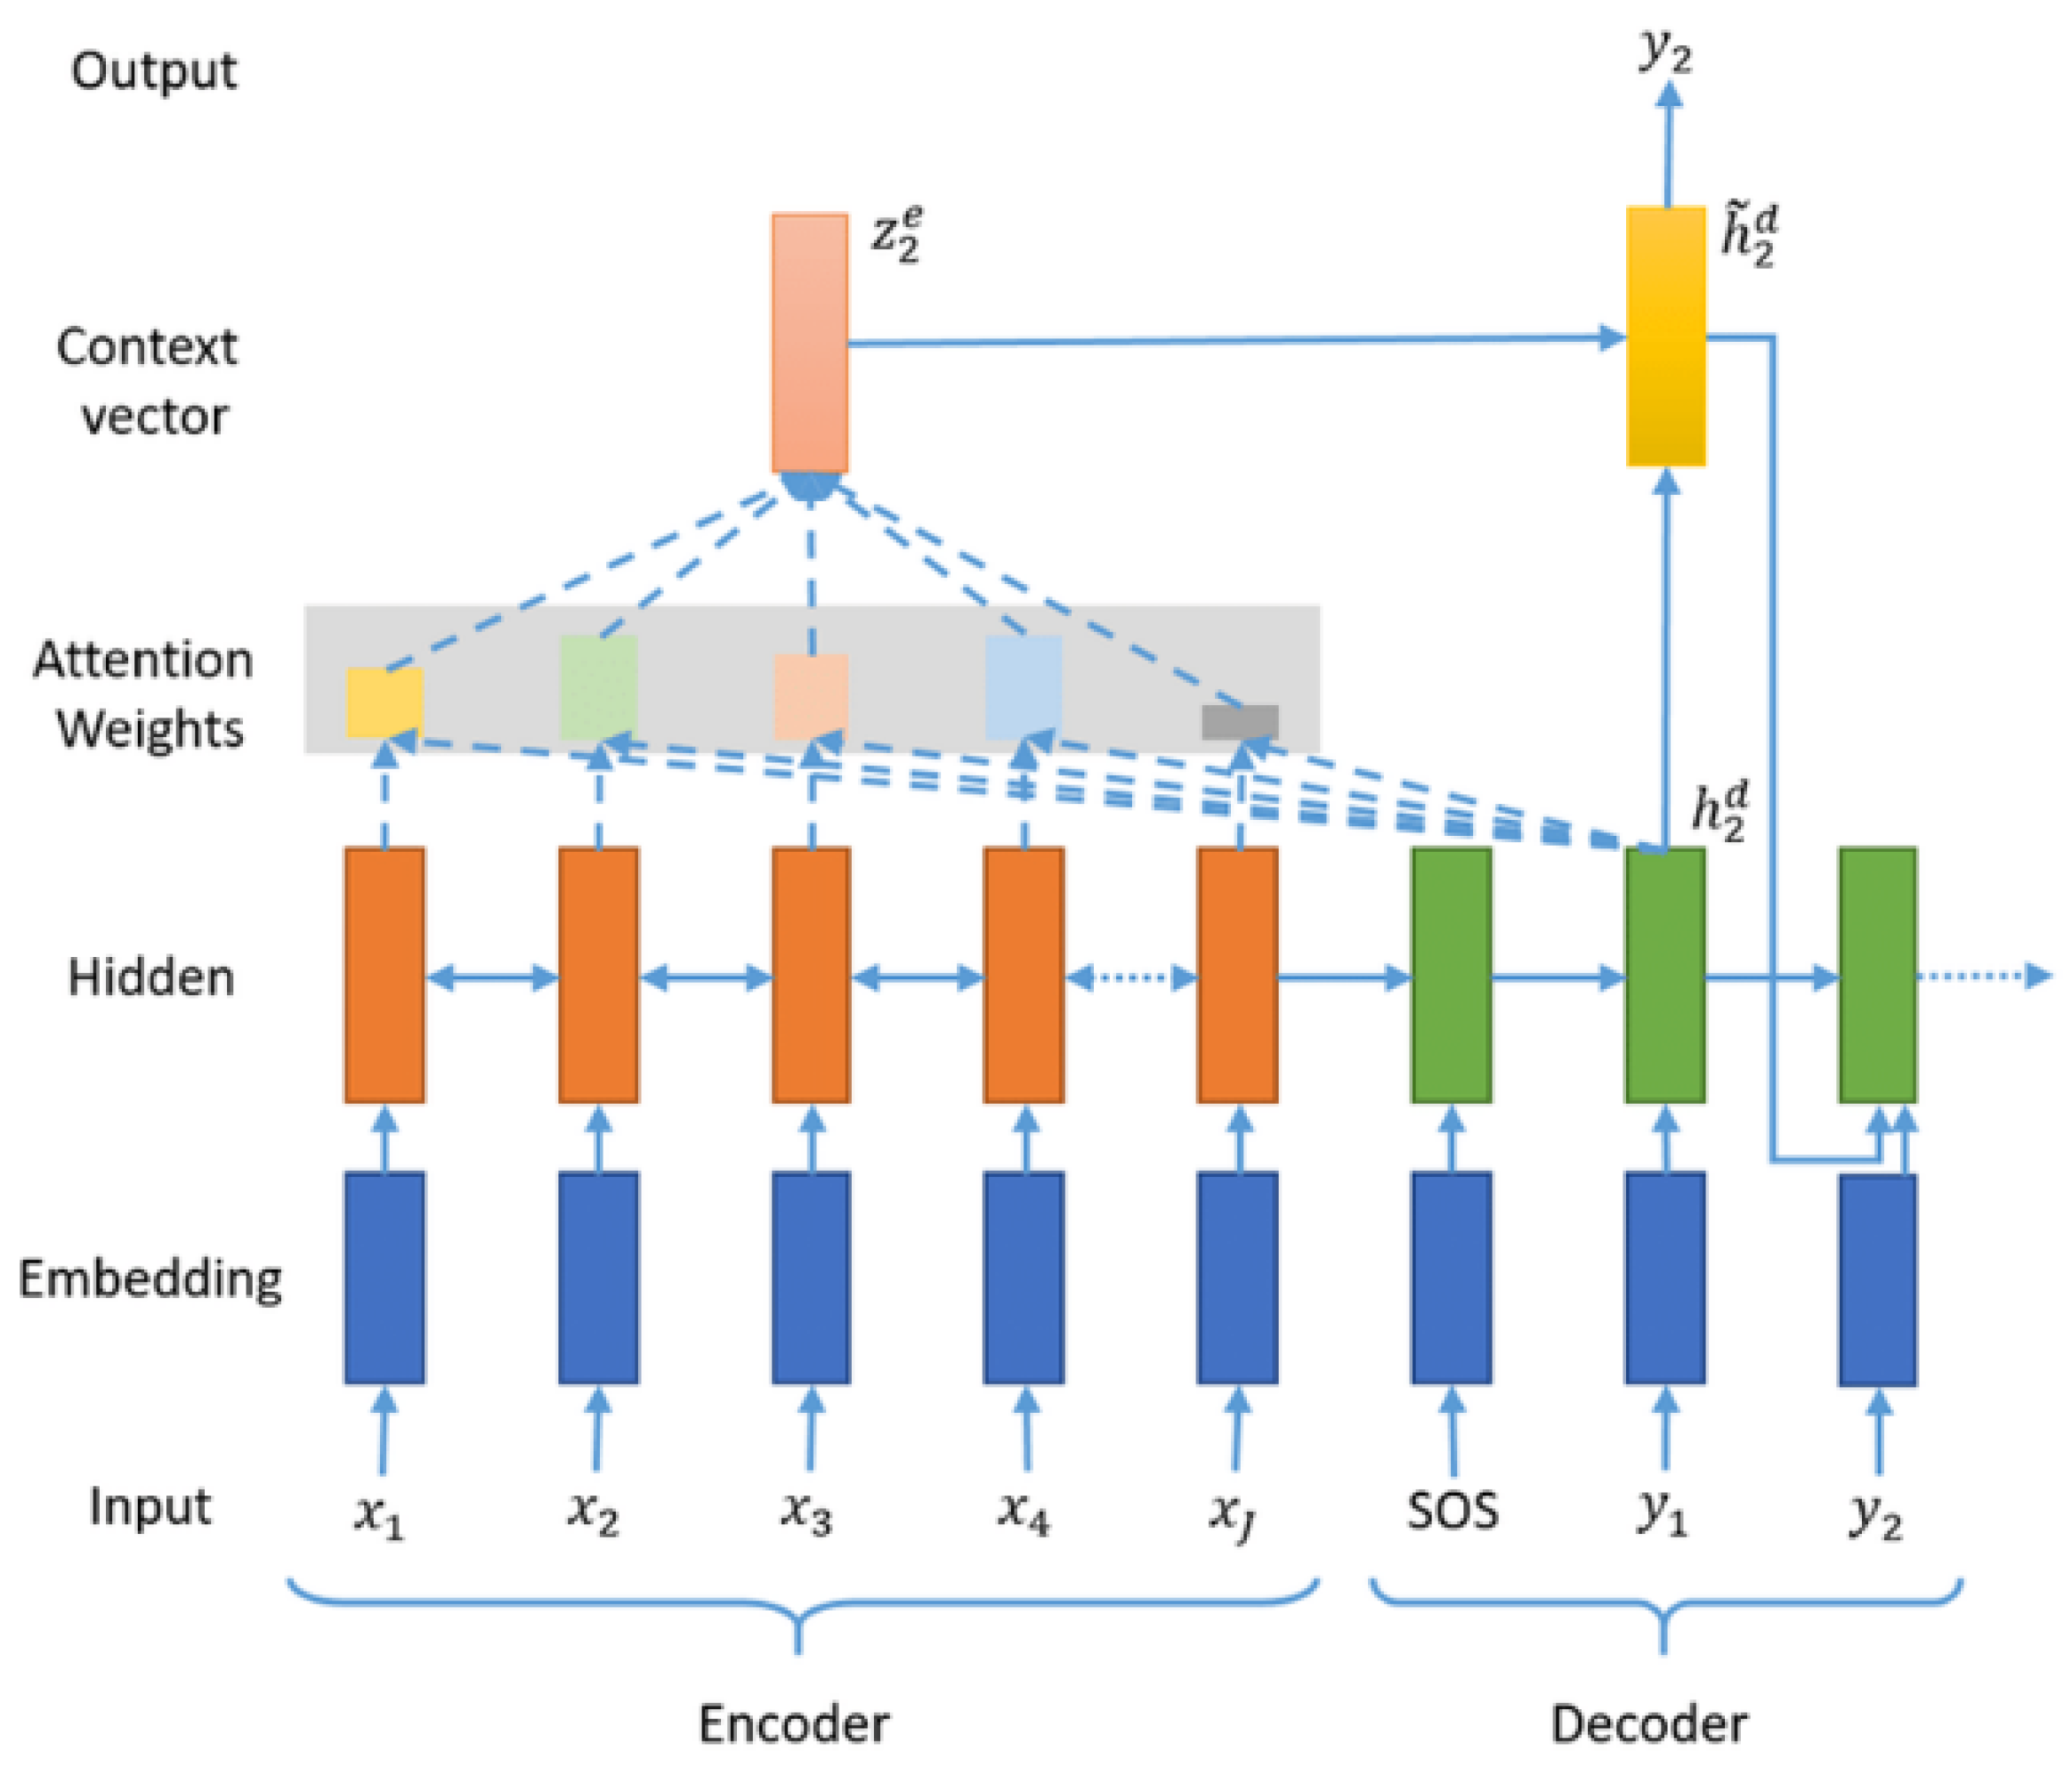
30] used an attentional sequence-to-sequence (seq2seq) model for Arabic-English transliteration. The seq2seq model transforms input sequences into output sequences. It avoids the problem of vanishing gradients by utilizing RNNs or, more commonly, networks based on LSTM (long short-term memory) or GRU (gated recurrent unit) architectures. The content of a current item always stems from the output of the previous step. The seq2seq model is primarily composed of an encoder and a decoder. The encoder converts the input into a hidden state vector, which encapsulates the content of the input items. Conversely, the decoder performs the reverse process, transforming the vector back into an output sequence, and uses the output from the previous step as the input for the next step. This model was initially developed to enhance machine translation technology, allowing machines to discover and learn how to map a sentence from one language to its corresponding sentence in another language.
The Named Entity Workshop (NEWS) was established in Singapore in 2009 by the Agency for Science, Technology, and Research (A*STAR) to develop machine transliteration techniques. The NEWS compiles high-quality multilingual datasets for machine transliteration and defines metrics to evaluate performance. In this study, we have attempted to adopt statistical and deep learning machine transliteration methods to train models for sound changes in the Chaoshan dialect and utilize the metrics from the NEWS to evaluate their performance.
Typologically, linguists collected data to extract shared innovative features, which were judged to have the same/different ancient languages. Take the implementation of Chinese languages as an example; Refs. [
31,
32,
33,
34] have carried out a series of studies on the relationships between Chinese dialects. In [
32]’s work, Pearson’s correlation coefficients are employed within the statistical analysis to compute the presence of vocabulary and phonetic forms, categorized by the existence of sounds, rhymes, and tones. The significance of quantitative calculation methodologies in language classification resides in their establishment of a framework for gauging dialectical proximity, therefore offering a systematic approach to delineating dialect groupings. Additionally, phonological characteristics were scrutinized across 17 dialects, focusing on initial consonants
[p, ph, and b], tracing their descent from Middle Chinese. This examination encompassed considerations of nucleus (vowels), lips (rounded/unrounded), and mouths (open/closed), elucidating the classification of rimes. Tonal aspects were analyzed based on the four tones of flat, rising, falling, and entering, alongside three distinct categories of initial consonants: voiceless consonants, voiced stops and sibilants, and sonorants. It is acknowledged that the voiced or voiceless nature of the initial consonant influences the tonal pattern, a phenomenon rooted in ancient Chinese phonology. Most phonologists concur that the characteristics of the initial consonant interact with tonal variations. As a result, ref. [
32] reported that Min languages exhibit greater mutual affinity compared to Hakka and Gan languages. Concerning the tones, ref. [
31] observes a quantitative correlation between the pitch characteristics of yin and yang tones and the phonetic attributes of initial consonants. In an inventory encompassing 3433 dialects within 737 distinct linguistic variations, it was revealed that high tones predominate in most dialects. The falling tones are the most prevalent contour tone, while bi-directional tones are comparatively rare, which is categorized by [
35] as a more marked tone. There is an observed trend wherein the dialects situated further south tend to exhibit a greater diversity of tones, whereas those located farther north tend to possess fewer tones [
31].
Ref. [
34] conducted a comparative analysis of vowel rhyme structures between calculated representations and the contemporary Beijing dialect. This analysis employed the notion of “communication degree” as a criterion for evaluating phonological historical constructs. For two dialects, A and B, the communication degree was determined by examining cognate words in A and B, with A serving as the source and B as the target, utilizing the “one-way communication degree” criterion. Each phonetic element, including initial consonants, glides, vowels, endings, and tones, is assigned a basic weight of one out of five, with positive (informational) and negative (noisy) values attributed accordingly. By multiplying these weights, the one-way communication degree is computed, enabling a comparison of the relative relationships between dialects. The ultimate finding indicates that in terms of communicative proficiency, the Beijing dialect holds the third position, trailing behind the Chengdu and Hankou dialects. Furthermore, ref. [
34] inferred that the maximum mutual intelligibility between old and young generations, based on the index derived by [
33], was typically 0.92, suggesting a generational discrepancy of up to 0.08. This discrepancy serves as a benchmark for mutual intelligibility. Moreover, the formula is extended to assess intelligibility among different dialects, where a high index indicates seamless communication and a lower index signifies potential communication barriers. For example, when the mutual intelligibility between Chengdu and Hankou reaches the highest level at 0.795, communication between speakers of these dialects poses no significant challenges. However, a decrease in mutual intelligibility to 0.475 between Beijing and Guangzhou dialects indicates potential communication difficulties [
34]. By combining the findings of [
33,
34], and if the life expectancy difference between two generations is about 100 years, the study extrapolates a mutual intelligibility loss of 0.08 per century, offering insights into historical language dynamics. Notably, this research contributes to our understanding of mid-phonological changes and dialectical relationships.
Ref. [
36] proposed and implemented a method for the study of historical phonetics. The main idea is that the speech database requires native speakers to provide a corpus, especially in cases where there has been a gradual decline in native speakers. We are left with a question: Without fieldwork, can a prediction by a model be used to fill in unknown pronunciations? Furthermore, can this help preserve cultural heritage in the future? They applied the method to the seven major Chinese languages of the Sino-Tibetan language family: Mandarin, Wu, Cantonese, Xiang, Hakka, Gan, and Fujian. Ref. [
36] translated the pronunciation of each Chinese character into IPA and marked eight phonological characteristics: tonal category, tonal value, initials, mediations, vowels, diphthongs, nasalization, and final rhymes. They proposed a new generative model, which imported hidden random variables and mapped each phonological feature to the hidden random variables. The probability distribution of the random variables produced the various possible characters for each Chinese character using a Markov chain Monte Carlo method. Finally, they used the voice data as reference data to solve the actual value of the random variable in the generative model. This method can simultaneously use material from the middle-ancient rhyme book and the possibly incomplete dialect phonetic data to explore the superlingual rhymes. This research made three contributions: (1) in addition to the rhyme data, the dialect data are very helpful for predicting the phonetics of another dialect; (2) this generative model is more effective at predicting closely related dialect data; and (3) filling out the voice data through the proposed model can improve accuracy in predicting new dialect voices.
Many previous studies have proposed adding missing speech [
36] or constructing the phonetic forms of ancestral language [
37]. However, while the models constructed by these methods can predict possible voice forms, they find it difficult to interpret and explore phonetic evolution. The objective of this investigation is to simulate the linguistic transformations within the Chaoshan region over the preceding century. This endeavor utilizes two dictionaries, one published in 1883 and the other in 2015, to elucidate the contemporary pronunciation dynamics during these periods. Employing the pronunciation data from 1883 as the source language and those from 2015 as the target language, the model extrapolates predicted pronunciations based on the 1883 dataset. Subsequently, a comparative analysis is conducted between these projected pronunciations and the actual phonetic changes observed in 2015, therefore simulating the linguistic evolution within the Chaoshan area over the past 100 years. As such, the questions of interest in this study were the following:
Do the vocalic and consonantal phones and tones generated by the three stated models (attention-based seq2seq, DirecTL+, and Sequitur) have any relationship to the patterns of vowel, consonant, and tone distribution observed in this study?
Do the vocalic and consonantal phones and tones generated by the three models resemble the developmental patterns of language learning by infants and, thus, reflect underlying universal constraints?
In the following parts,
Section 3 introduces the methods used in this study, and
Section 4 presents the primary results.
Section 5 compares the results for the distribution of the data and the sequence of sound emergence in human beings. In the concluding remarks, the major findings are summarized, and potential areas of further research are noted.
4. Evaluation
4.1. Settings
In the seq2seq model, both the input and output consist of characters from orthographic sequences represented in dictionaries. In the encoder, the maximum length of input was set to 10. The output dimension of the Embedding layer was fixed at 100, and the hidden layer was constructed using LSTM cells, where the latent dimension of each cell is set to 256. During the training of the seq2seq model, the Adam optimizer was employed, with the loss function being categorical entropy. The number of epochs was set to 100, and an early stopping mechanism was utilized.
In the DirecTL+ approach, within the m2m aligner, the maximum limit for the correspondence between the input and output sequences was set to 2. This is because, in the orthography of both Chaoshan dictionaries, a single phoneme is represented by, at most, two characters. Regarding the configuration for training the DirecTL+ model, the context size was set to 3, the number of training iterations was established at 10, and the n-Best setting was also fixed at 10.
For the Sequitur model, we utilized the implementation provided in its official GitHub repository (
https://github.com/sequitur-g2p/sequitur-g2p, accessed on 22 June 2023). The training of the Sequitur model is incremental; we employed a training procedure that progresses from Uni-gram to 4-gram, resulting in the final model.
4.2. Experimental Results
In this section, the results of the attention-based sequence-to-sequence method, DirecTL+, and Sequitur are reported. In order to further analyze the results, we separated the predicted accuracy of the sounds into three categories: onset, rhyme, and tone.
After manually deleting inconsistencies, we adopted the attention-based sequence-to-sequence method, DirecTL+, and Sequitur to train the model. We employed a dataset consisting of 5523 of the same words with known pronunciations in both dictionaries. The pronunciations from 1883 instances were utilized as input, and the three models were trained accordingly. Subsequently, the predicted words from the models were compared with those also present in the 2005 dataset to assess the accuracy of the models. The accuracy rates of the three models, the attention-based sequence-to-sequence method, DirecTL+, and Sequitur, are presented in
Table 1. Additionally, the results for the evaluation were categorized into three groups: accuracy with tones, accuracy without tones, and F1-score. In the evaluation, we employed the commonly used metrics in machine transliteration: Accuracy, Recall, Precision, and F1-score. The definition of accuracy is as follows:
where
N represents the number of data in the test dataset,
is the phoneme string predicted by the model, and
is the correct phoneme string. An
indicates that all model predictions match the actual dictionary answers perfectly, whereas
indicates that none of the predictions match the dictionary answers. The definitions of Recall, Precision, and F1-score are estimated based on the longest common subsequence (LCS) of string comparisons. The definition of LCS is as follows:
where
is the “string edit distance”, which measures how many insertions, deletions, or substitutions are required to transform one string into another. It is a common method for estimating the similarity between two strings. The definitions of Precision, Recall, and F1-score are as follows:
Five-fold cross-validation was used for evaluation, and the accuracy of our model was up to 68%.
Generally speaking, speech flow can be dissected into several syllables, with the segments constituting the fundamental elements. Apart from segments, supra-segmentals provide another perspective on the analysis of speech flow. Upon further examination of the segments, they can be subdivided into vowels and consonants, and supra-segmentals encompass aspects such as tone, duration, stress, and intonation. Consequently, our dataset was scrutinized in terms of syllables, vowels, consonants, and tones.
Syllables, the basic units of speech, typically consist of consonants (C) and vowels (V), with common constructions being CV, CVC, and so forth, though specifics vary across languages. Vowels are characterized by tongue height, tongue backness, and lip rounding. Additionally, consonants exhibit features such as POA, MOA, and voicing (or not). In Chinese, aspiration (or not) can serve as a distinctive feature.
Tones, which are fundamental components of speech in tonal languages such as Chinese, include level tones and contour tones. Elements such as tonal register and contour are analyzed to understand tone patterns. The interaction between tone and consonants in final positions can lead to checked tones characterized by shorter duration. Accordingly, the subsequent analysis of the results will be conducted based on these delineated elements, encompassing syllables, vowels, consonants, and tones, to provide a comprehensive understanding of the dataset.
Table 2 shows the sounds predicted by the model compared to those found in the 2015 Chaoshan dictionary, using the same characters as the 1883 Chaoshan dictionary as inputs. In terms of accuracy, the following syllable structures were predicted (going from high to low): CVE > CV > CṼ > CṼṼ, with the nature of the vowels playing a role. This means that if the vowel is nasalized, a simple syllable structure, CṼ, is more accurately predicted than a complex one, such as CṼṼ. However, if the vowel is plain, the accuracy of CVE—where E could be either a consonant or vowel—is greater than that of CV. The syllabified consonants
[m] and
[ŋ] are the least accurate. Thus, we can further examine the distribution of different vowels when following the sonorant sequence of CGVE, where V stands for the peak of the syllable. The results showed that regardless of the vowel’s nature, the prediction of nasalized vowels was less accurate than for oral vowels. More specifically, the front vowels were easier to correctly predict than the back vowels. One should also note the performance of
ê[ɯ] and
ên[ẽ], with approximately the same accuracy of 54%, and
[õ], with no accuracy.
The consonants were analyzed based on their MOA and POA, whether they were voiced or not, and whether they were aspirated or not. Overall, we found no significant difference in terms of accuracy in these four different aspects. Regarding the MOA, the accuracy varied from 61% to 56%. One should note that stops, which are usually considered to be acquired first in children, showed the lowest accuracy. As for the POA, the accuracy rates varied from 60% to 57%. One should note that coronal unmarked features are considered to be acquired first or with the least restriction on their combination with the lowest rate of accuracy. Voiced consonants were easier to predict correctly compared to voiceless ones; in contrast, the aspirated consonants were harder to predict correctly. The difference between the voiced/voiceless and aspirated/unaspirated consonants was the smallest, with a value of 3–4%.
Finally, tonal accuracy was analyzed in terms of tone contour, register, and duration. The accuracy of the prediction of level tones was found to be higher than for contour tones, indicating no significant difference. However, the predicted value for the H initial tone, at 3 on the five-point Chao scale, was higher than that of the L initial tonal value (65% vs. 49%). The checked tone accuracy (64%) was higher than the unchecked tone accuracy (57%); the former is always acquired later by children.
To sum up, the predicted sounds made by the machine learning models displayed very different phenomena compared to human language learning. The differences between the model-generated sounds and the human-acquired sounds were, thus, compared.
In machine learning tasks, training a complicated neural network model such as seq2seq requires a substantial amount of data to establish an effective model. However, due to the limited number of entries in the two Chaoshan dictionaries currently available, only 5523 data items were available for training and testing. Although this quantity may seem somewhat insufficient for training a seq2seq model, it is quite adequate for traditional machine learning models such as DirecTL+ and Sequitur, especially for machine transliteration tasks. The experimental results indicate that the performance of seq2seq models still surpasses that of DirecTL+ and Sequitur. Therefore, the issue of having fewer data should be considered negligible.
5. Discussion
5.1. The Sounds Generated by the Models Are Governed by the Sequence
We found that the accuracy of the Chaoshan dictionary, as generated by the three models—attention-based seq2seq, DirecTL+, and Sequitur—highlights, to some degree, what machine learning can achieve. However, their performance was not found to be at the same level as the process of human language learning, i.e., proceeding from unmarked features to marked ones.
More specifically, strong consonants are defined as more obstruent when airflow passes the oral cavity, i.e., they are more consonant-like. In this definition, aspirated, stop, and voiceless consonants are strong compared to their unaspirated, lateral, and voiced counterparts. According to this definition, the consonants generated by the models are weak consonants rather than being more consonant-like.
Table 3 shows the accuracy of the model-generated sounds and the distribution of the vowels following different consonants with respect to the MOA. For example, the distribution of vowels occurring after the stops was about 39% among the 5523 items, ranking first. As such, because there was a greater chance for different vowels to follow stops, the prediction made by the three models offered the lowest accuracy, with a value of 56%, ranking sixth. On the contrary, if the MOA was lateral, the prediction made by the three models achieved its highest value at 61%. However, the possibility of candidate vowels following a lateral gave the lowest value at 7%. Even though the ranking order varies according to the model accuracy and the distribution of vowels following each subcategory’s consonants, the tendency is clear: the more following candidate vowels, the lower the chance that the three models can predict the consonants according to their MOA.
Table 4 shows the accuracy of the model-generated speech and the distribution of the vowels following different consonants with respect to the POA. For example, the distribution of vowels occurring after a coronal is about 47% (5523 items), ranking first. As such, because there was a greater chance of different vowels following the coronal, the prediction of the three models gave the lowest value at 56%, ranking fifth. On the contrary, if the POA was glottal, the prediction made by the three models achieved its highest value at 60%. However, the prediction of the possible candidate vowels following a glottal gave the lowest value at 10%. Even though the ranking order varies between the model accuracy and the distribution of the vowels following each subcategory’s consonants, the tendency is not particularly clear. For zero onset, both the prediction of the three models (57%) and the distribution of the following vowels (10%) ranked last. The argument that the more following vowel candidates there are, the less chance the three models can predict the consonants when divided with respect to their place of articulation only holds for the first subcategory.
Table 5 shows the accuracy of the model-generated speech and the distribution of vowels following different consonants with respect to being voiced. For example, the distribution of vowels occurring after a voiceless consonant was about 71% (5523 items), ranking first. As such, because there is a greater chance for different vowels to follow voiceless consonants, the prediction made by the three models gave the lowest value at 57%, ranking second. In contrast, if the consonant was specified as being voiced, the prediction made by the three models achieved its highest value at 60%. However, the prediction of possible vowel candidates following a voiced consonant gave the lowest value at 19%. Even though the ranking order varied between the model accuracy and the distribution of vowels following each subcategory’s consonant, the tendency is clear. For zero onset, the prediction made by the three models (57%) and the distribution of following vowels (10%) both ranked last. The argument that the more following vowel candidates there are, the smaller the chance the three models can predict the consonant when divided with respect to their voiced feature still holds.
Table 6 shows the accuracy of the model-generated speech and the distribution of vowels following different consonants with respect to the aspired feature. For example, the distribution of vowels occurring after an unaspirated consonant was about 30% (5523 items), ranking first. In contrast to the MOA, POA, and voiced feature, the greater the chance of different vowels following an unaspirated consonant, the higher the prediction value made by the three models, with 58%, also ranking first. This means the same pattern was found both for the model accuracy and the following vowel distributions.
To sum up, a similar pattern was revealed both in the prediction made by the three models and the distribution of the following vowels, showing that the behaviors of the major features—the MOA, POA, and voicing—differ from those of the minor and aspirated features.
One may speculate that the onset prediction of the three models and the distribution of the following vowels may be related to the sonority sequence. If we postulate that the sonority hierarchy is essentially uniform across languages, once a word has a legal syllable structure in one particular language, meaning that its minimal sonority distance in this language is met, it partially fulfills the phonotactic constraint. If so, the reason why some syllable combinations are less common is probably due to a preference for making the sonority distance as large as possible. Thus, when selecting the onset in Chaoshan, for example, a stop is preferred to a nasal and then a liquid because the following component is either a glide or a vowel, which are always ranked as the most sonorant. This regulation of phonotactic constraint in Chaoshan determines the word combination.
Concerning feature geometry, if the aspirated consonant is described as [+/− spread glottis] under the supervision of the laryngeal and [+/− consonant; +/− sonorant], we may wonder about how the behaviors of consonants with aspirated features fit with the MOA, POA, and voicing. This brings us to the next question: Why are aspirated consonants synchronized with the distribution of the following? However, only MOA, POA, and voiced features manifest a similar pattern. One might postulate that POA, MOA, and voicing are major features with which to describe consonants, whereas aspirated features are not. Of course, more research is needed to investigate this issue more fully.
Table 7 shows the accuracy of the model-generated speech and the distribution of the consonants preceding different types of vowels. We may take VN as an example. The consonants preceding the VN type constitute about 34% (5523 items), ranking first, whereas the accuracy of VN is 59%, ranking second. In contrast, in relation to the accuracy of consonants and the distribution of the following vowels, consonants (the left-to-right sequence) indicate sufficient prediction accuracy; vowels (the right-to-left sequence) do not have such prediction. The sequence determines the accuracy of the models and the one (consonants in this study) on the left-hand side with fewer possible following sounds, where we can see the higher accuracy of this consonant (L → R). However, if the vowel is the pivot, no such phenomenon can be observed.
Table 8 shows the accuracy of the model-generated speech and the distribution of the consonants preceding vowels of different natures. For example, the consonants preceding the V-i type account for about 35% (5523 items), ranking first, whereas the accuracy of V-i is 62%, ranking third. If the vowel is the pivot, the prediction is insufficiently accurate. This means that consonants (the left-to-right sequence) work, but this is not the case for vowels (the right-to-left sequence).
To sum up, the accuracy of the prediction of consonants is negatively correlated with the distribution of the following vowels, whereas that of vowels is not.
As for tones,
Table 9 shows the tone accuracy of the models and the distribution of each tone (5523 items). Taking T5 (55) as an example, the tone distribution was about 20%, ranking first, whereas the accuracy of T5 (55) was 67%, ranking first as well. We generalize this by saying that there is a partially positive correlation between the tones and their distribution, meaning the greater the distribution of the tone, the better chance it can be correctly predicted. The odd one out is T8 (4), for which the distribution was pretty low, ranking seventh, but the accuracy of which was high, ranking second.
Table 10 shows the accuracy of the tones generated by the models in terms of tone contour, register, duration, and their distributions (5523 items). When looking at the level tones, including T1 (33), T5 (55), and T7 (11), the distribution of this type of tone was about 45%, ranking first, and the accuracy of its prediction was 57%, ranking first as well. We can generalize that there is a partially positive correlation between the prediction of the tones and their distribution, meaning the greater the distribution of the tone, the better the chance of it being correctly predicted. In relation to different tonal durations for unchecked vs. checked tones, even though the checked tones have far smaller distributions than the unchecked versions (16% vs. 84%), the accuracy of tone prediction for the checked tones was greater at 64%.
5.2. Different Mechanism for the Sounds Generated by the Models and for Those Acquired by Human Beings
[
15] claims that “the relative chronological order of development remains everywhere and at all times the same”. This means that the pace of development in children may vary, but the order in which the sounds are acquired seems universal. Our study reveals a general pattern for the order in which sounds emerge in children: stops are acquired before affricates, and velars are acquired later, while level tones are acquired earlier than contour tones. However, the sounds correctly generated by the three models display approximately the opposite relationship. Ref. [
15] also claims that “only those sounds which are common to all the languages of the world, while those phonemes which distinguish the mother tongue from the other languages of the world appear only later”. He also suggests that identical laws operate in the phonological development of language in children and the synchronic structure of the world’s languages. As such, unmarked sounds are acquired earlier than marked sounds since unmarked sounds appear in most languages of the world, and the acquisition of some sounds presupposes the acquisition of other sounds. Ref. [
15] also provides evidence to show the mirror image of the developmental sequence of language acquisition in the study of aphasia, which is, to some degree, in line with our model-generated sounds. In this sense, we would further argue that model-generated sounds are determined by the sequence of word combinations from left to right. Only the onsets generated by the models present a mirror image of the sequence of children’s language acquisition because the phonotactic constraints of word combinations restrict their appearance. The more common this onset is, the more variety is found in its following unit, which is either a glide or a vowel. This means that the more unmarked the onset, the better the chance/probability that it can be preceded by other units. If this is the case, it shows why the prediction achieved by our model is less accurate, resulting in lower accuracy in relation to onset production.
At first glance, hearing-impaired children seem to be affected by their physiological disorder, for example, with reduced ability to hear high-frequency sounds such as stops. However, Ref. [
40] found that the English allophone
[z] may have three different meanings when combined with other morphemes. Take the word “cook” as an example, where (a) ‘cooks’ is the plural form, (b) ‘cook’s hat’ is the possessive case, and (c) ‘mummy cooks’ is the inflectional form of the verb, ‘cook’. The acquisition sequence in children goes from (a) to (c). In the case of a patient with aphasia, the sequence of loss was as follows: first, the suffix of the verb, (c), then the suffix of the possessive, (b), and finally, the suffix of the plural noun, (a). The order of aphasic loss went from the sentence level (c) to the phrasal level (b) and then the word level (a), i.e., from the most complex form to a simple form. The results generated by the three models, to some degree, reveal a similar phenomenon.
Therefore, this means that, under the legal syllable structure/word condition, the more specific the feature the onset contains, the more easily the models can predict it. This is the same as the ability of the aphasia patient. By considering the constraints on markedness, the sounds that are acquired last by humans (because of their markedness) parallel the accuracy of the predictions made by the models, i.e., these are also predicted last due to the large number of potential follow-up units.
To sum up, while the acquisition process in children is determined by frequency, we did find some parallels between the machine learning models and the human acquisition process regarding minor features, such as aspiration. However, the major features MOA and POA, demonstrate the opposite. When taken together, the machine-generated sounds, governed by the distribution of following units from left to right, are applied to onsets only. In addition, part of the results parallel the human acquisition of sounds, primarily determined by the input frequency as a holistic lexicon learning process.
Notably, not all the sounds generated by the models reveal the same marked hypothesis. The nasalized vowels provide an example. They are rarer than oral vowels, and their presence within a system presupposes that of oral vowels. According to [
17], the set of nasal vowels is never larger than the set of oral vowels, fulfilling the definition of the markedness category.
6. Conclusions and Further Research
We compared the sounds predicted by the models and found that the accuracy rate (from high to low) regarding the model-generated sounds and the process of learning sounds in human beings is very different. The accuracy of the model-generated sounds is based on the amount of input, i.e., the greater the input, the better the performance. The successive emergence of sounds reported by different scholars is quite different across languages. In language acquisition, the process of moving from unmarked sounds to marked sounds in terms of their features, POA, MOA, and level tones is not some descriptive linguistic phenomenon. This reflects the real-world functions of this mechanism, where frequency is the key to acquiring a language. However, the opposite phenomenon related to the sounds generated by the models when moving from the highest to the lowest accuracy is clear. This means the mechanism used by the models is totally different from the one used by human beings. The distribution or input frequency really plays a role in the models. However, this distribution may not be the primary key to language acquisition in human beings. People present another set of mechanisms: learning by unmarked vs. marked incidence of a single tone (slot), so it will be the opposite.
More specifically, the left-to-right sequence (consonants) indicates sufficient prediction accuracy, whereas the right-to-left sequence (vowels) will not yield such accurate predictions. The accuracy is partially related to the distribution, and only consonants can indicate what follows. Vowels manifest such a pattern, whereas the sequence of the words has nothing to do with children’s language acquisition. As such, there are significant differences between the machine-generated sounds and the human-acquired sounds.
This pilot study of adapting computational methods to sound model generation and human acquisition did not successfully demonstrate a positive correlation. Certainly, advancing our comprehension of speech models remains a significant endeavor worthy of continued pursuit. The simulation of speech models may not always align perfectly with the process of language acquisition in humans. Therefore, striving for a more effective interpretation of the speech models in production remains a crucial objective for future efforts.
On the other hand, we are aware that the literary and colloquial readings are not inevitable, especially in the Min languages. The stratum between the two readings is not clear-cut, and understanding how to label a one-to-one correspondence for literary and colloquial readings of the same character is the key to this study. Uncovering the use of the super-stratum and the substratum is the goal of further research.


