
Development Characteristics and Reactivation Mechanism of a Large-Scale Ancient Landslide in Reservoir Area


Abstract
:1. Introduction
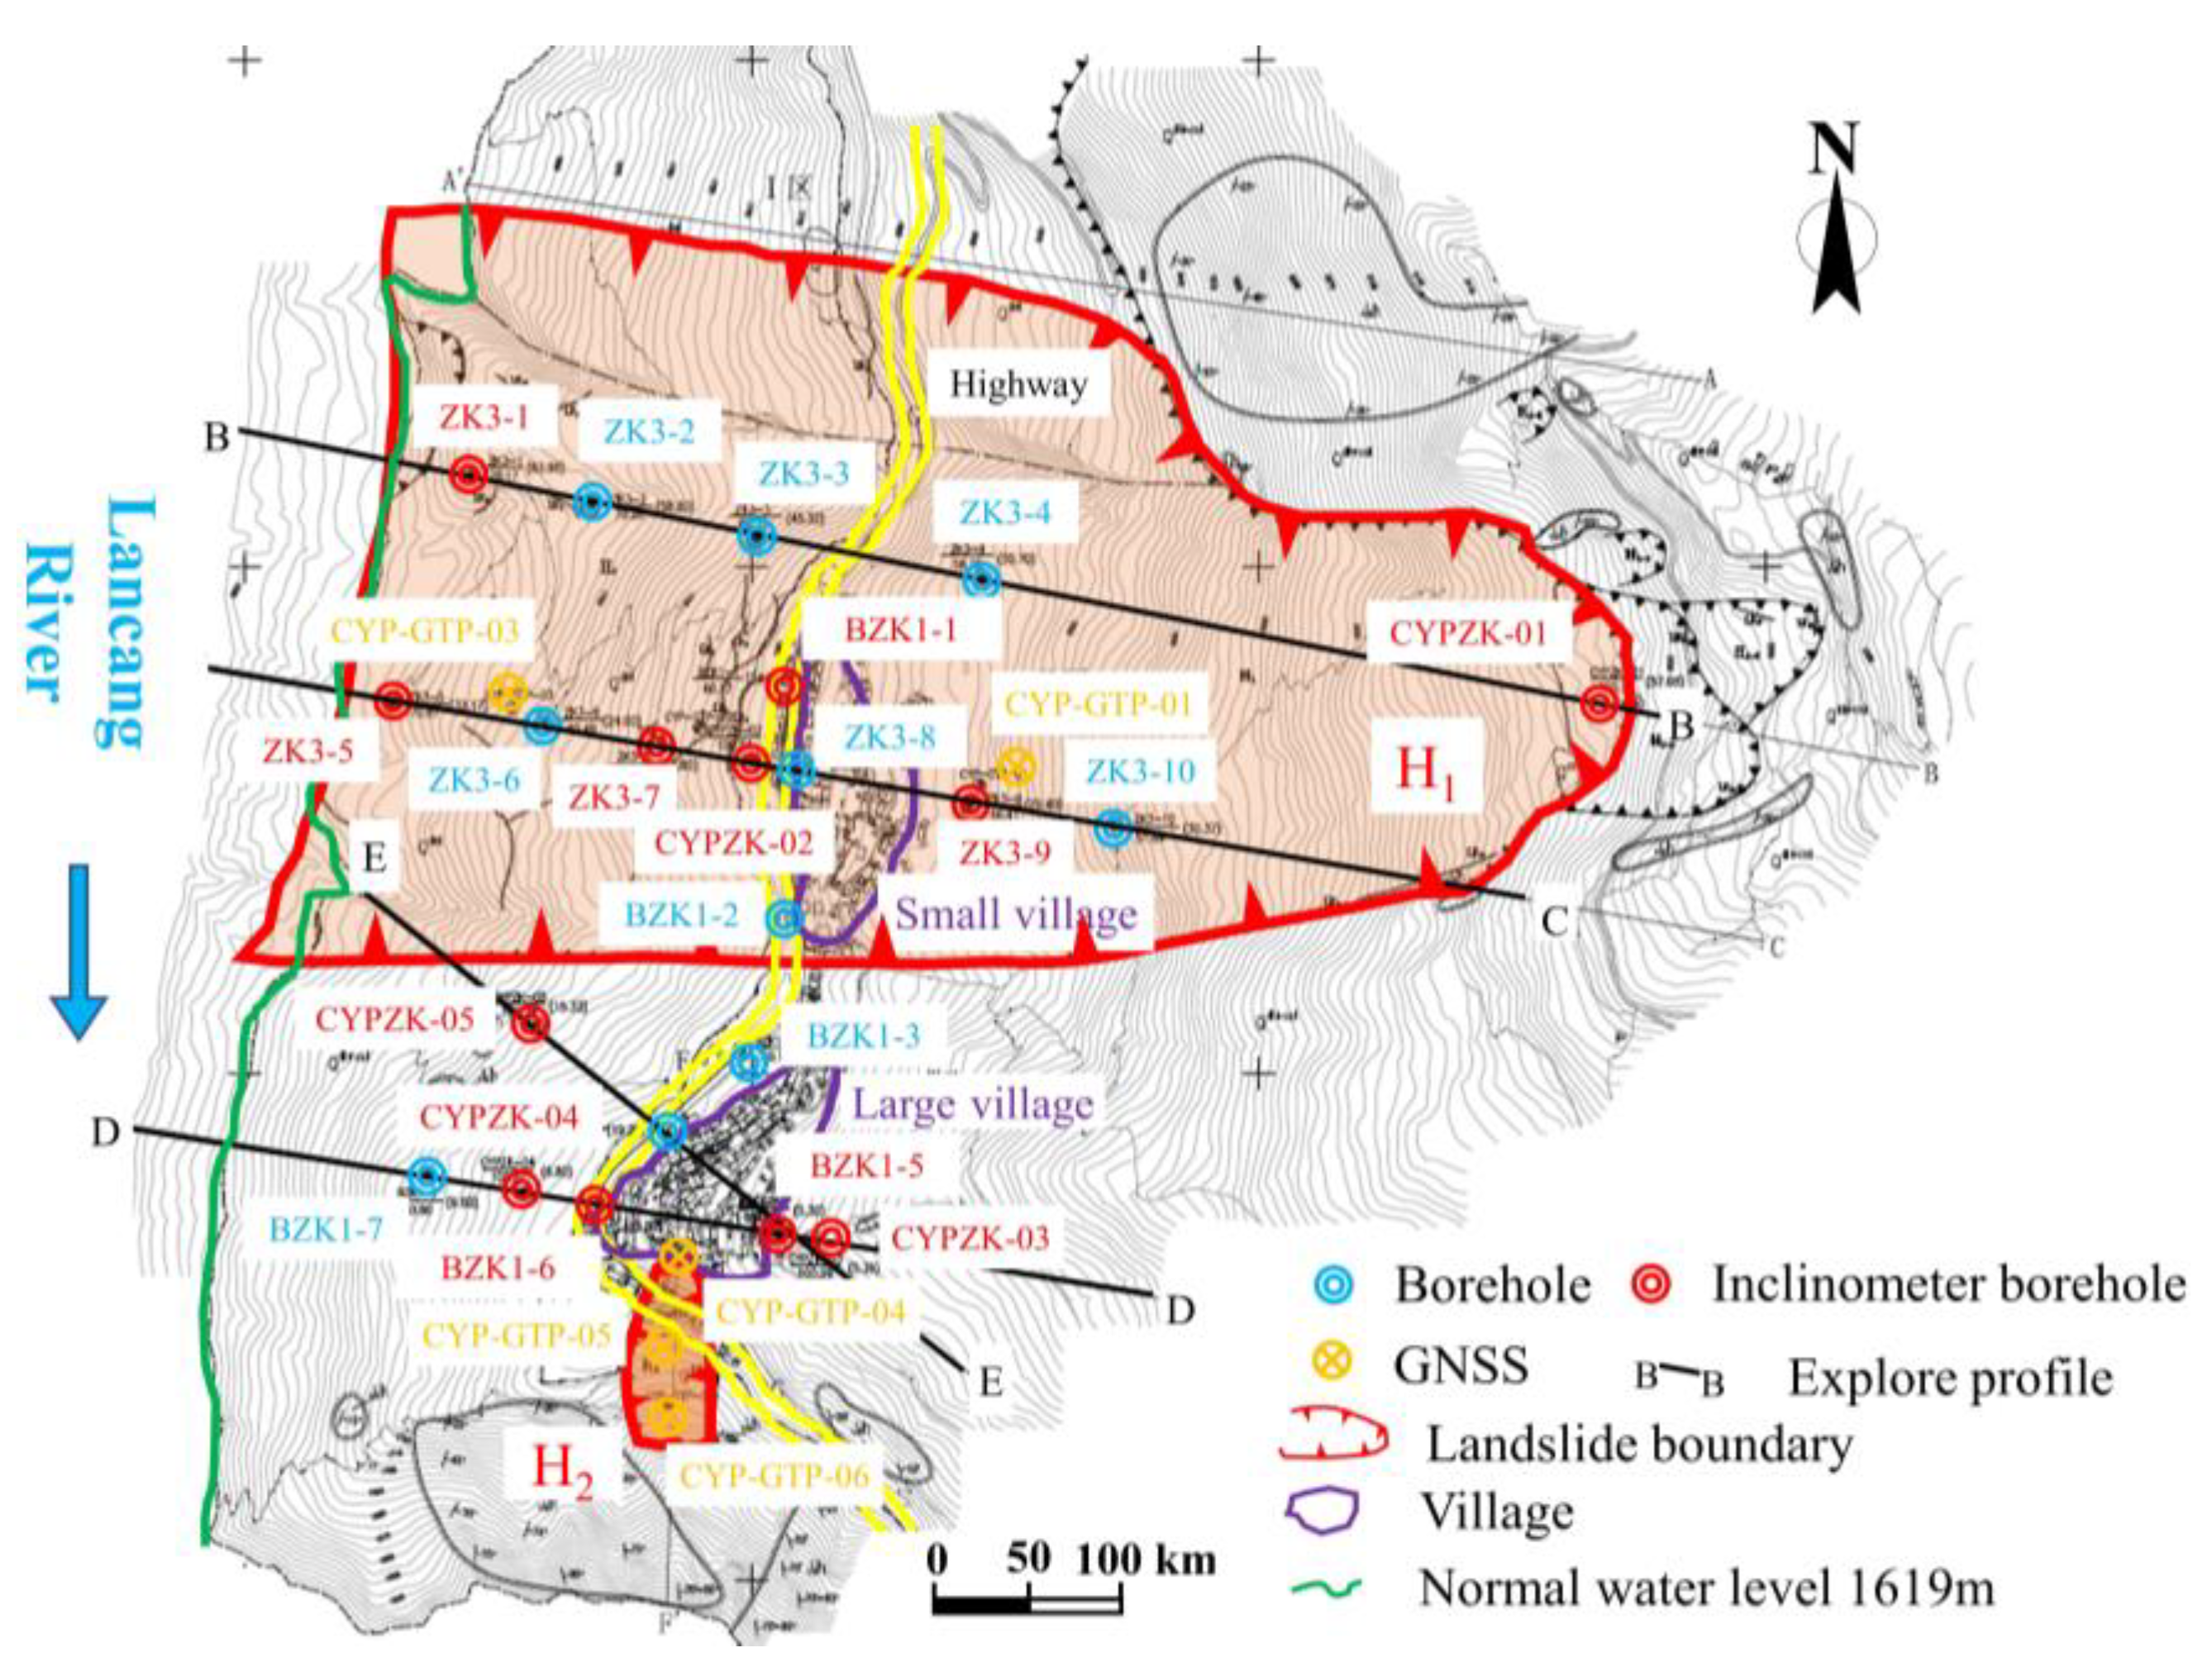
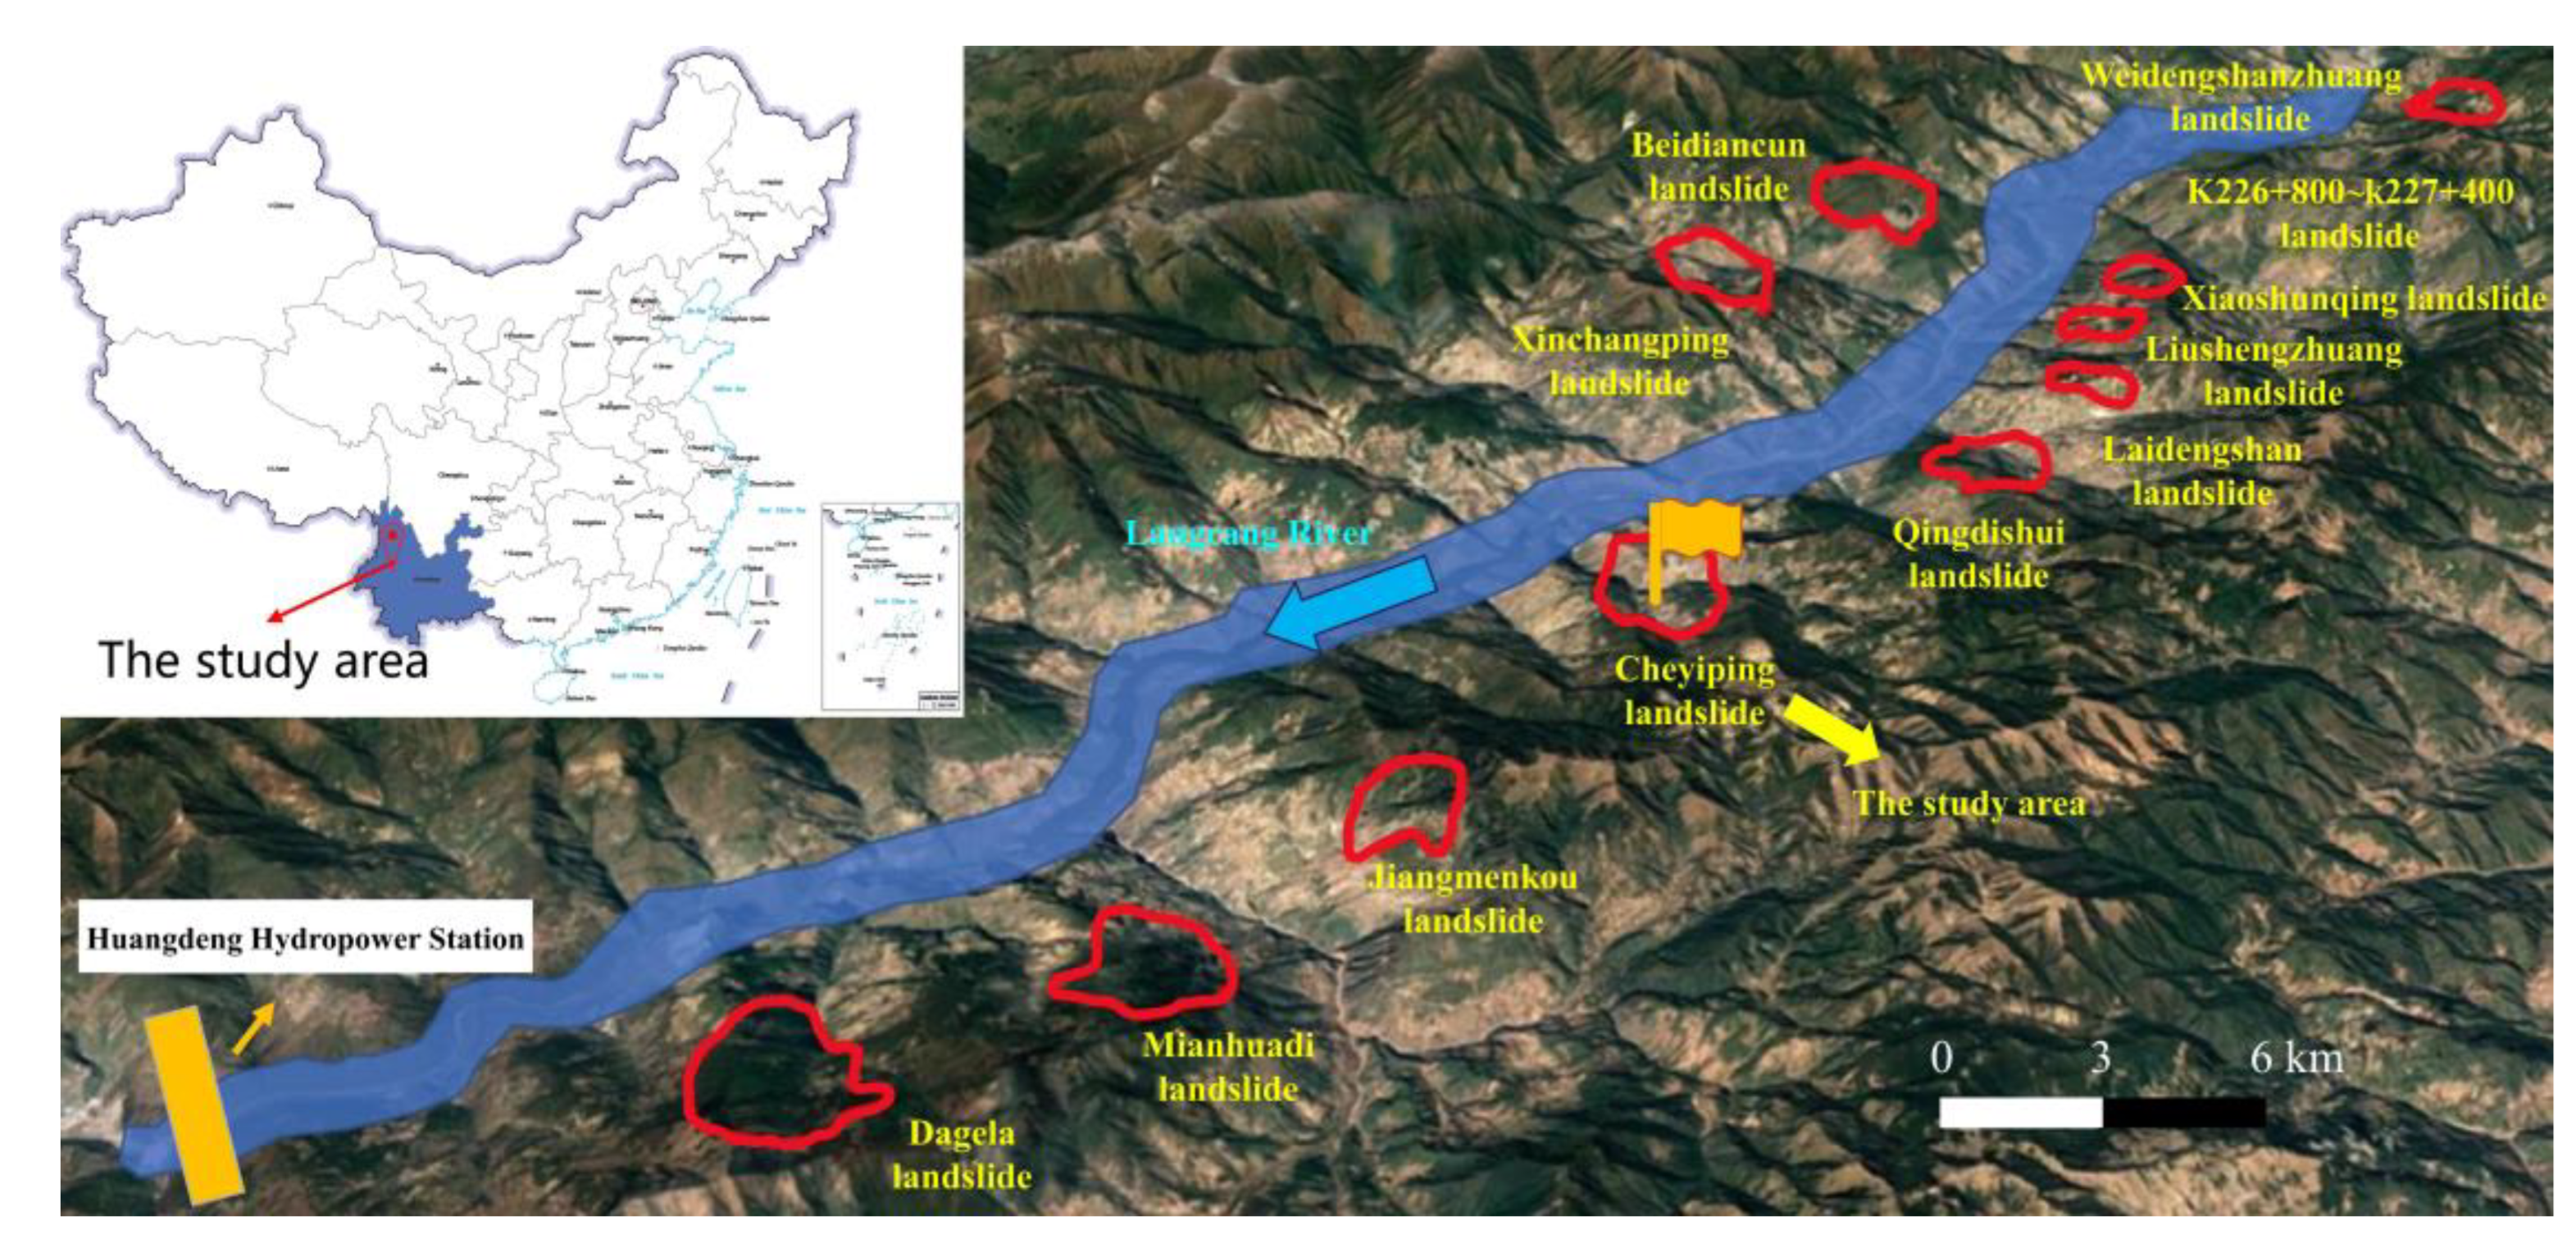
2. Study Area
2.1. Study Area Setting
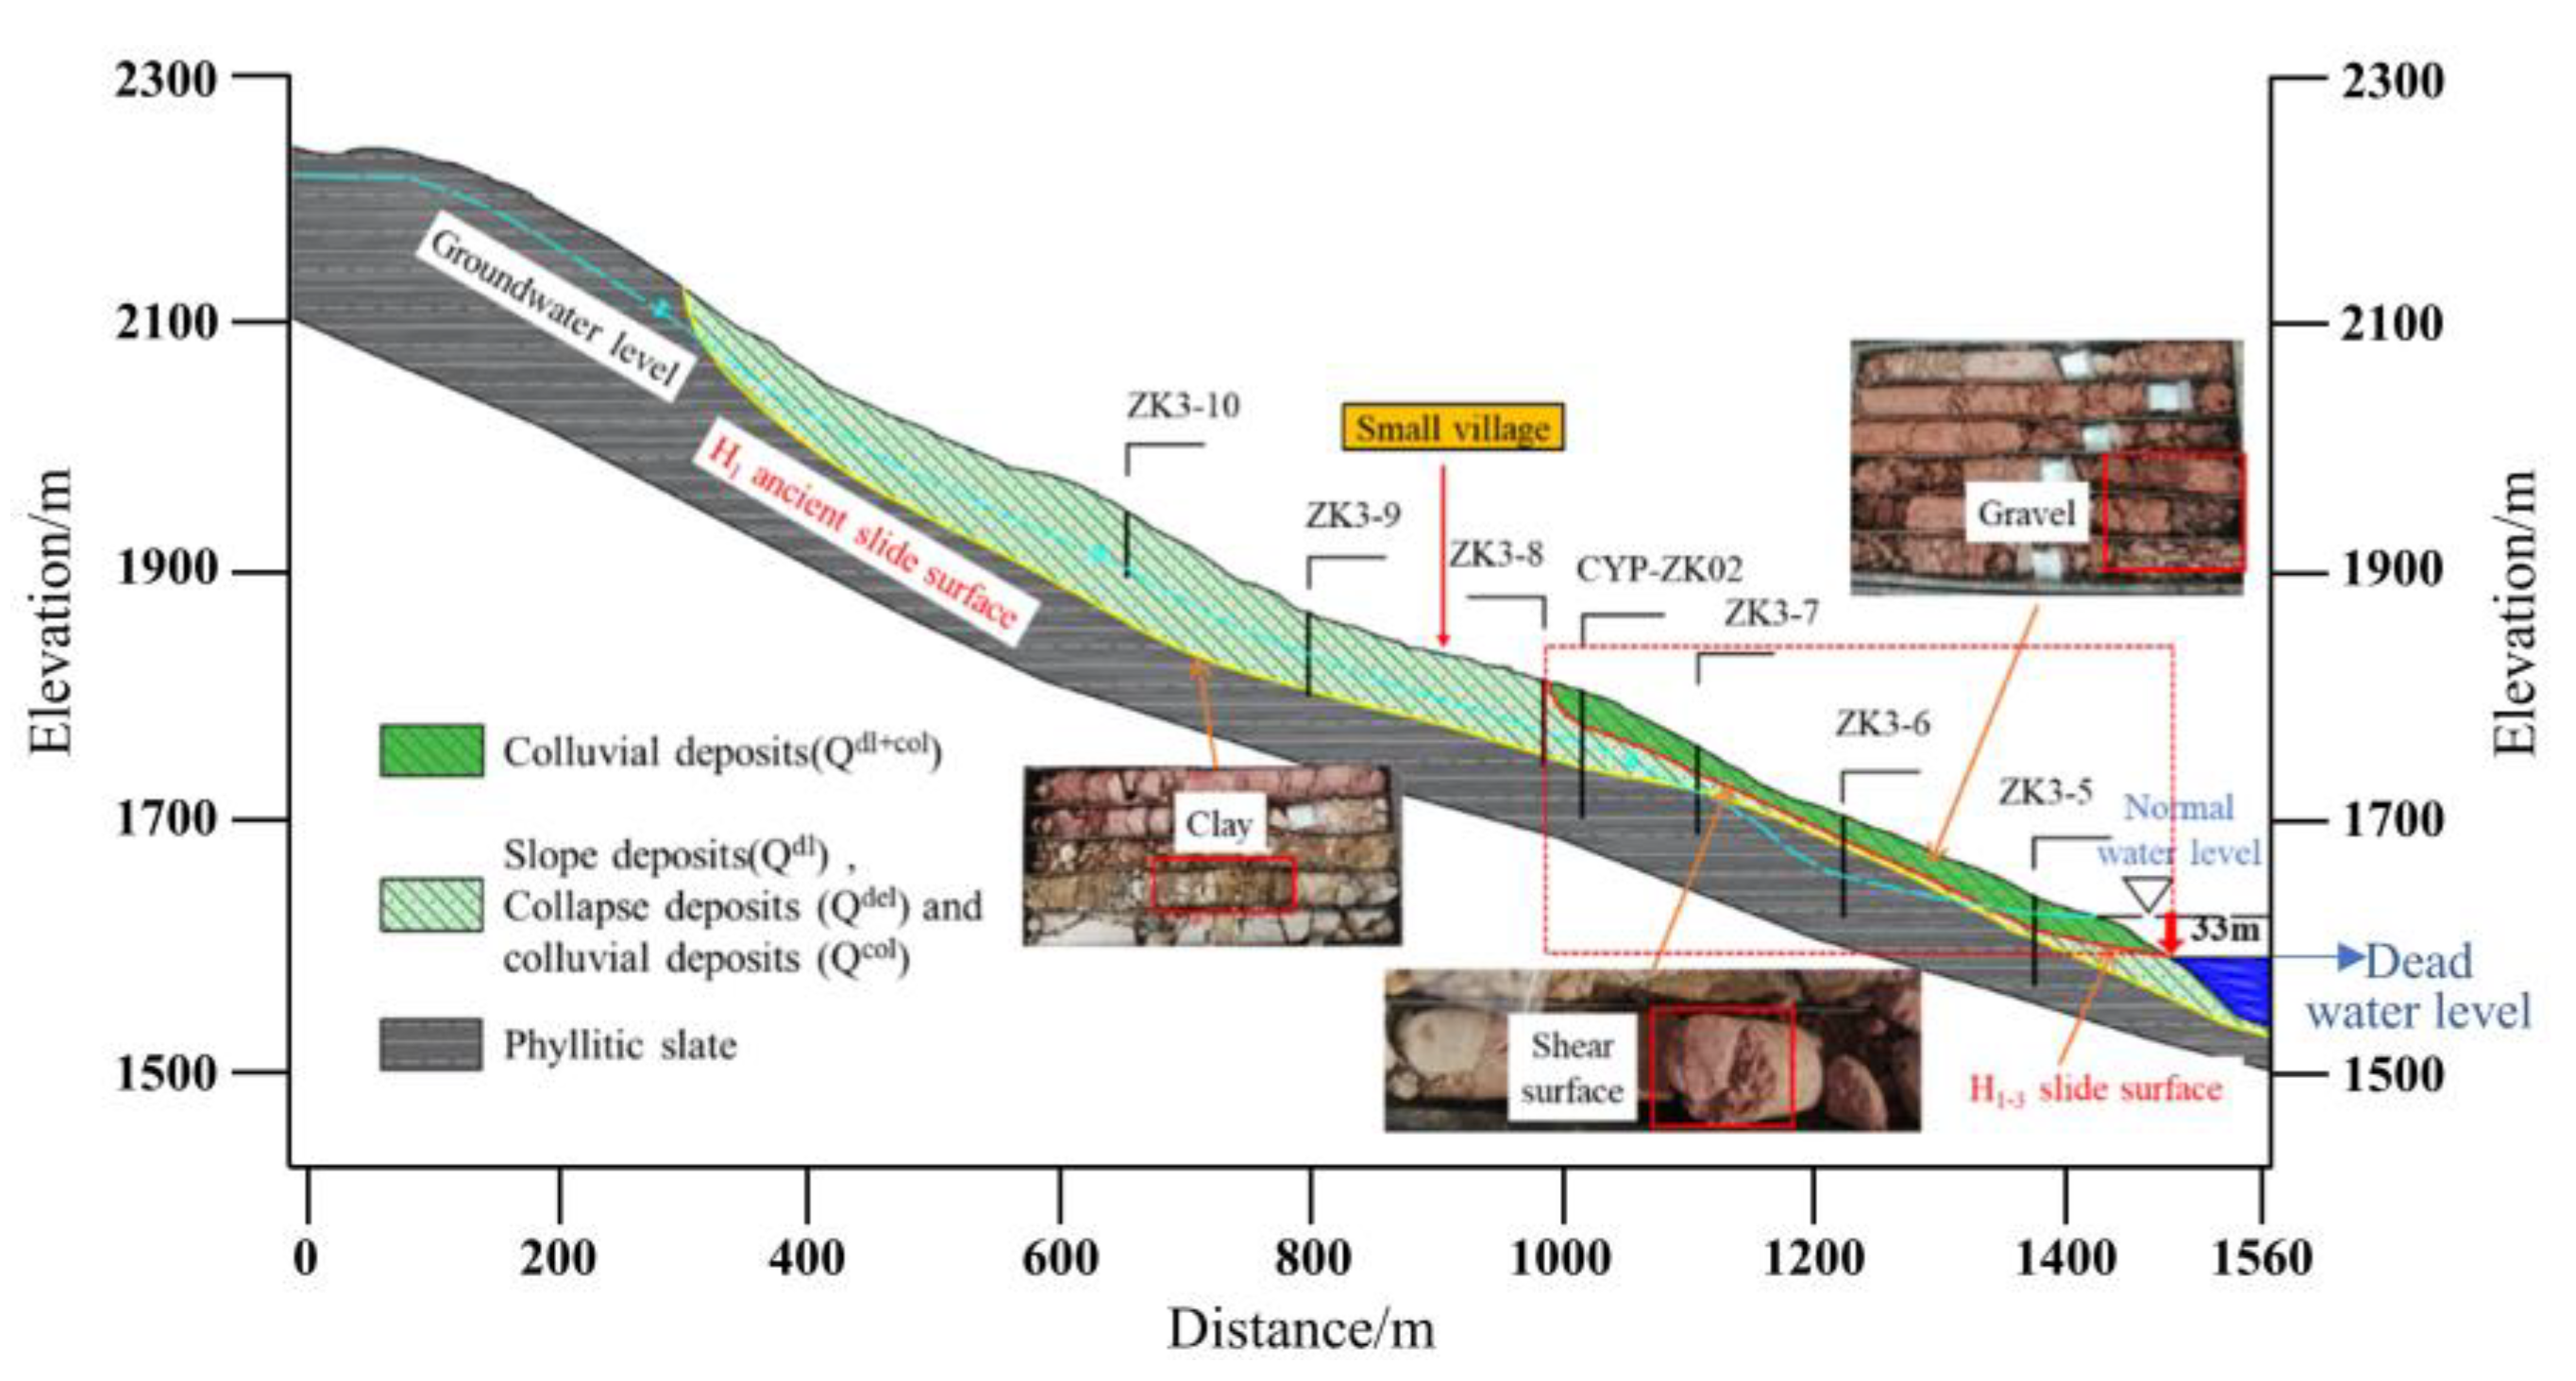
2.1.1. Geological Structure
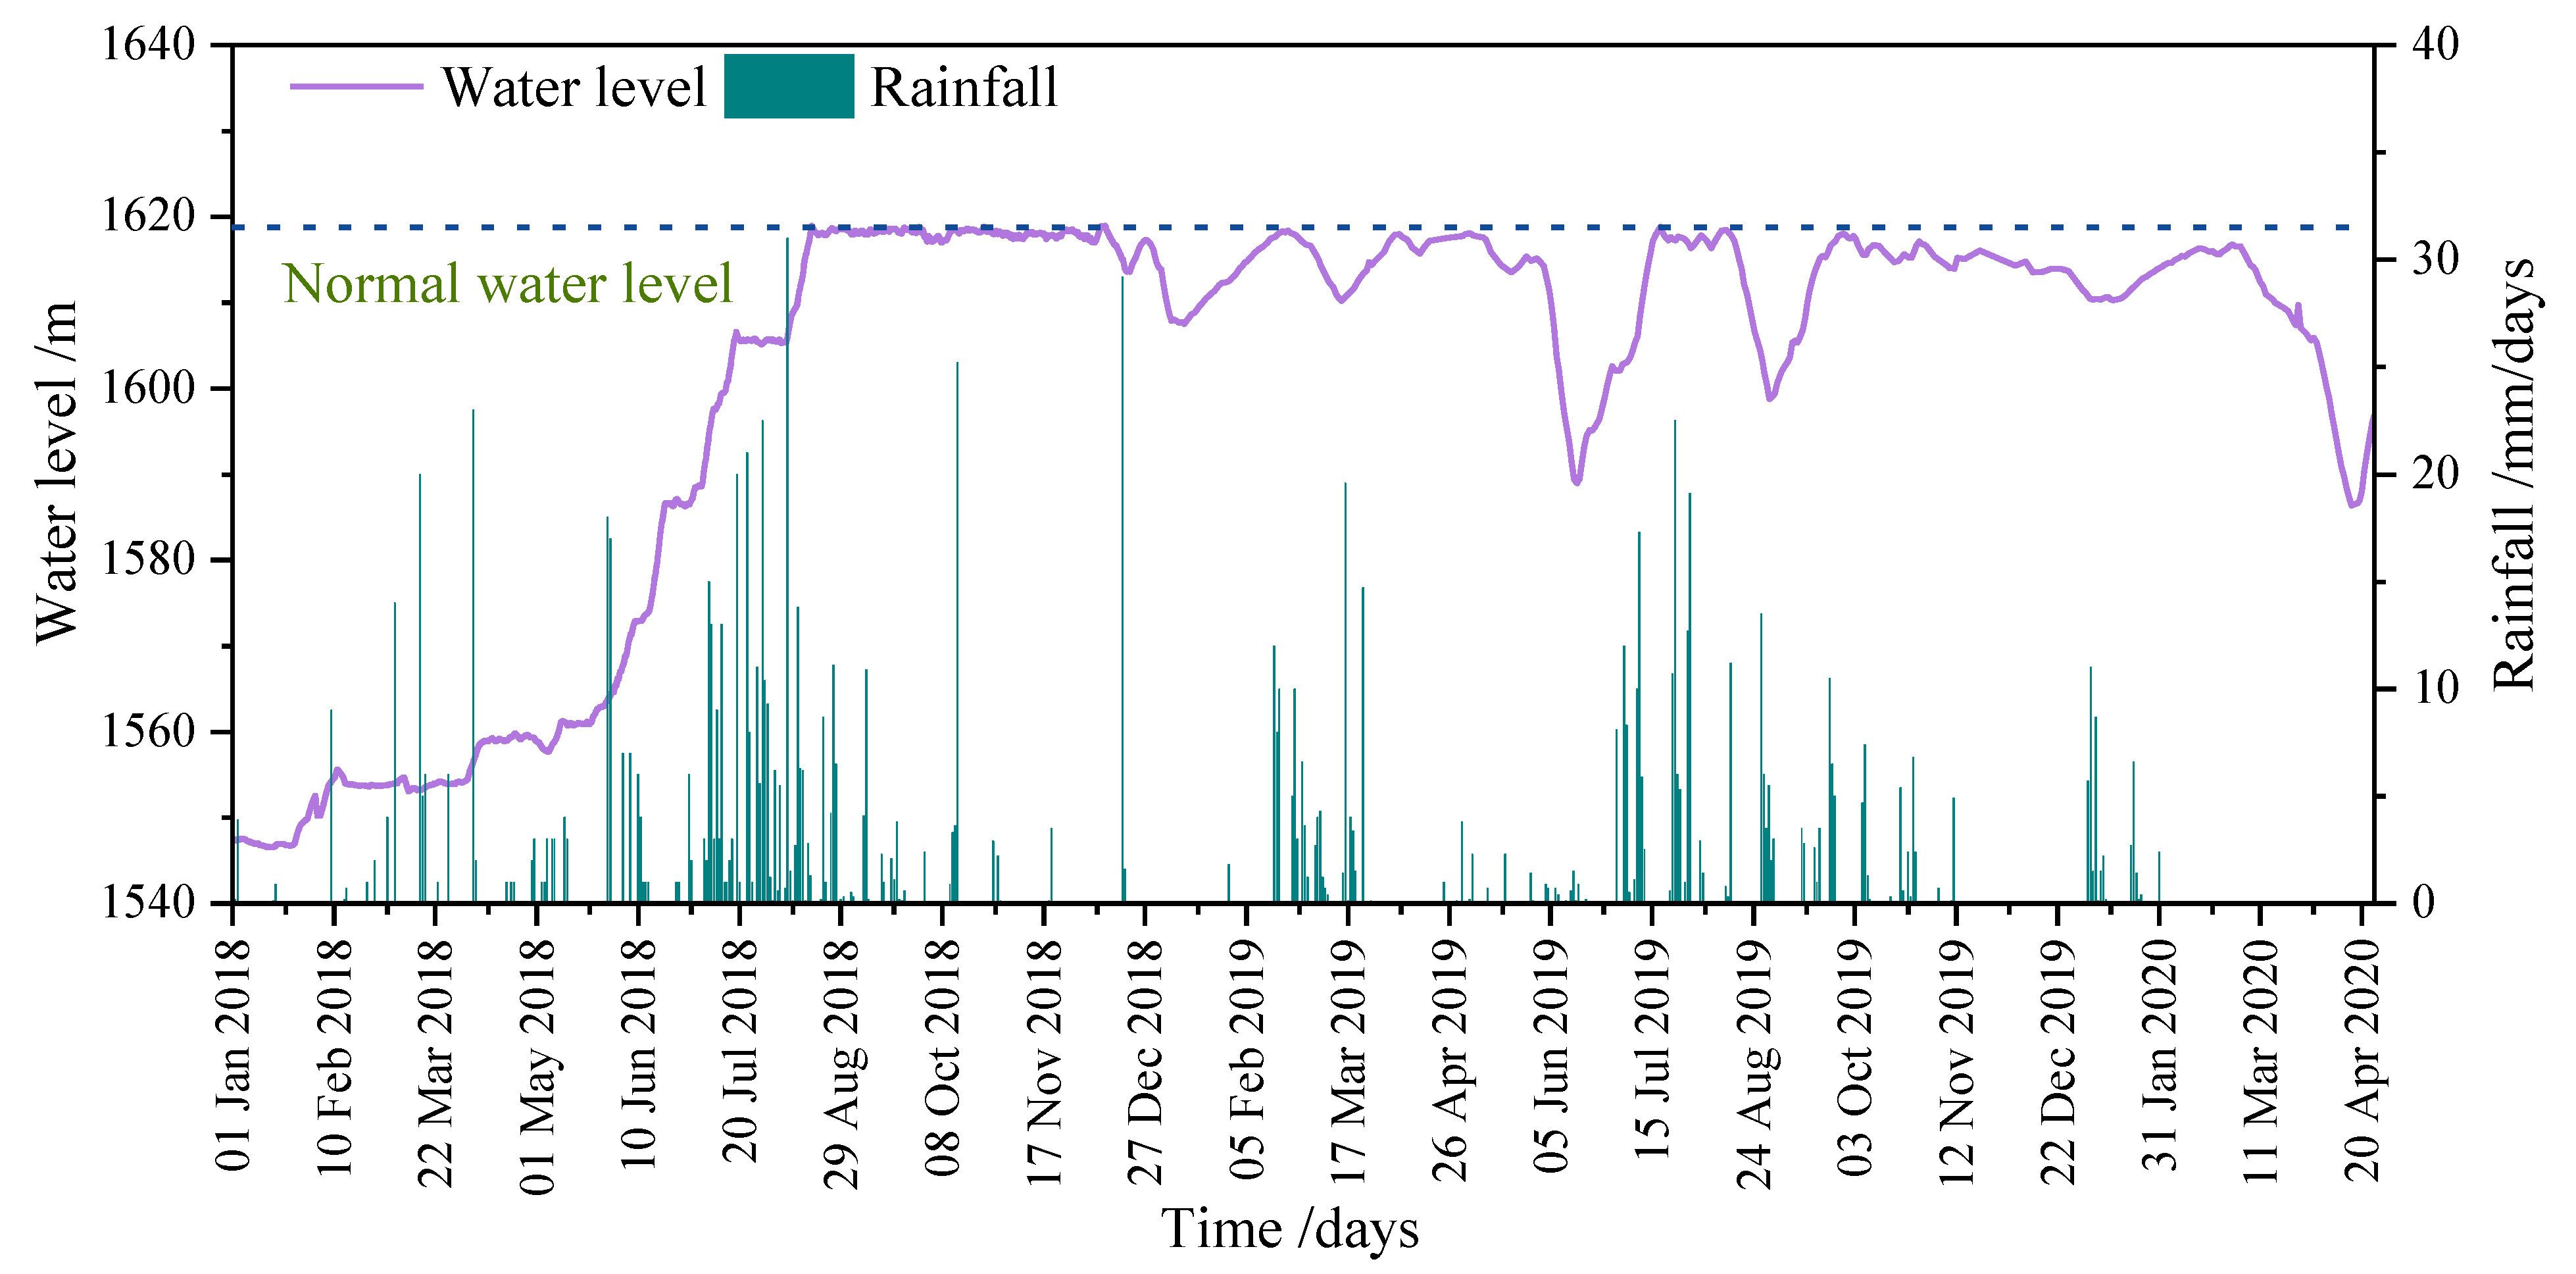
2.1.2. Hydrogeological Conditions
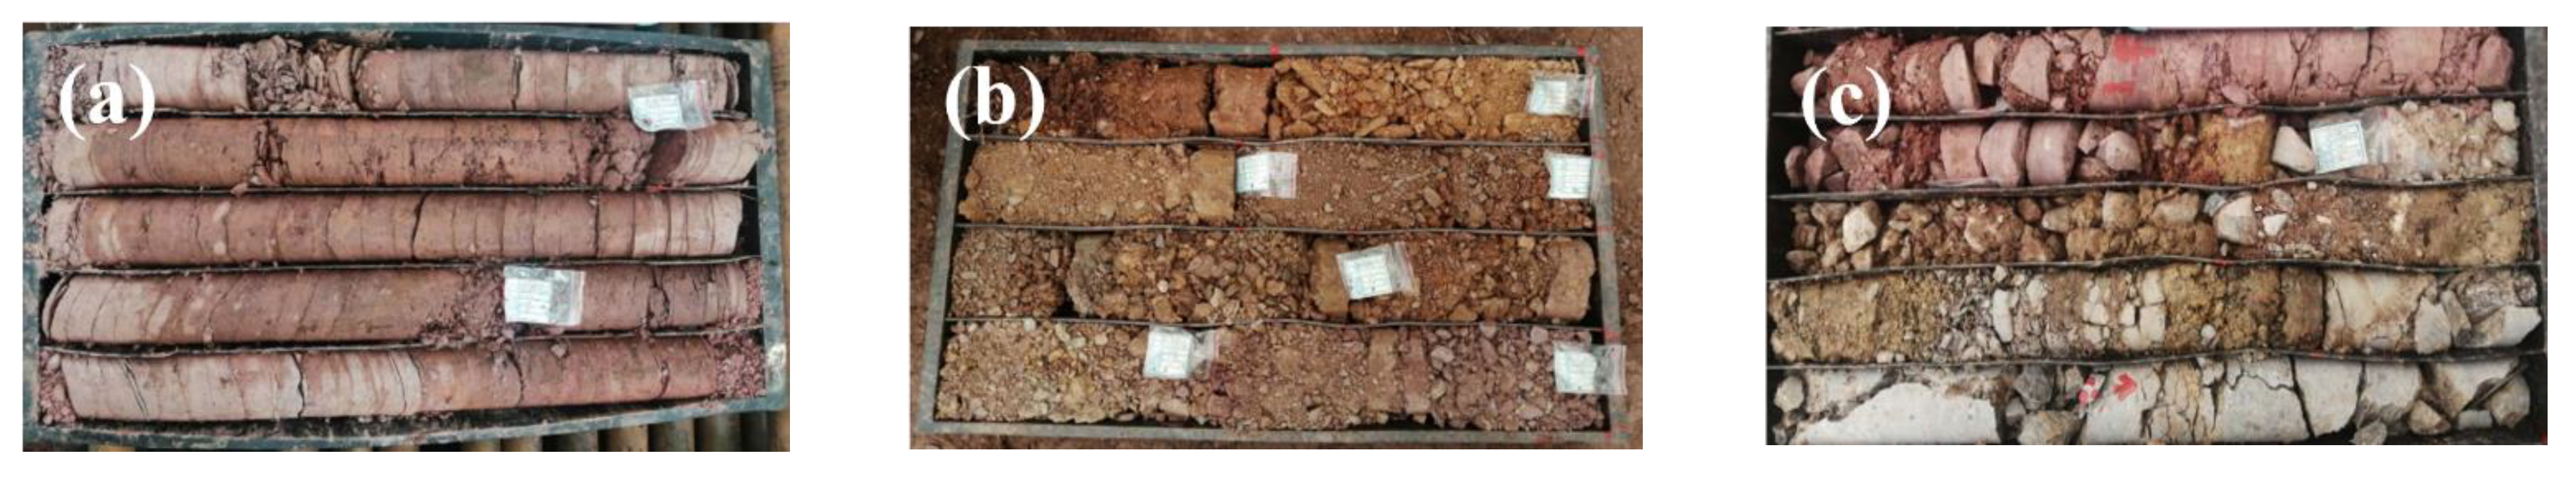
2.1.3. Physical and Mechanical Properties of Landslide Materials
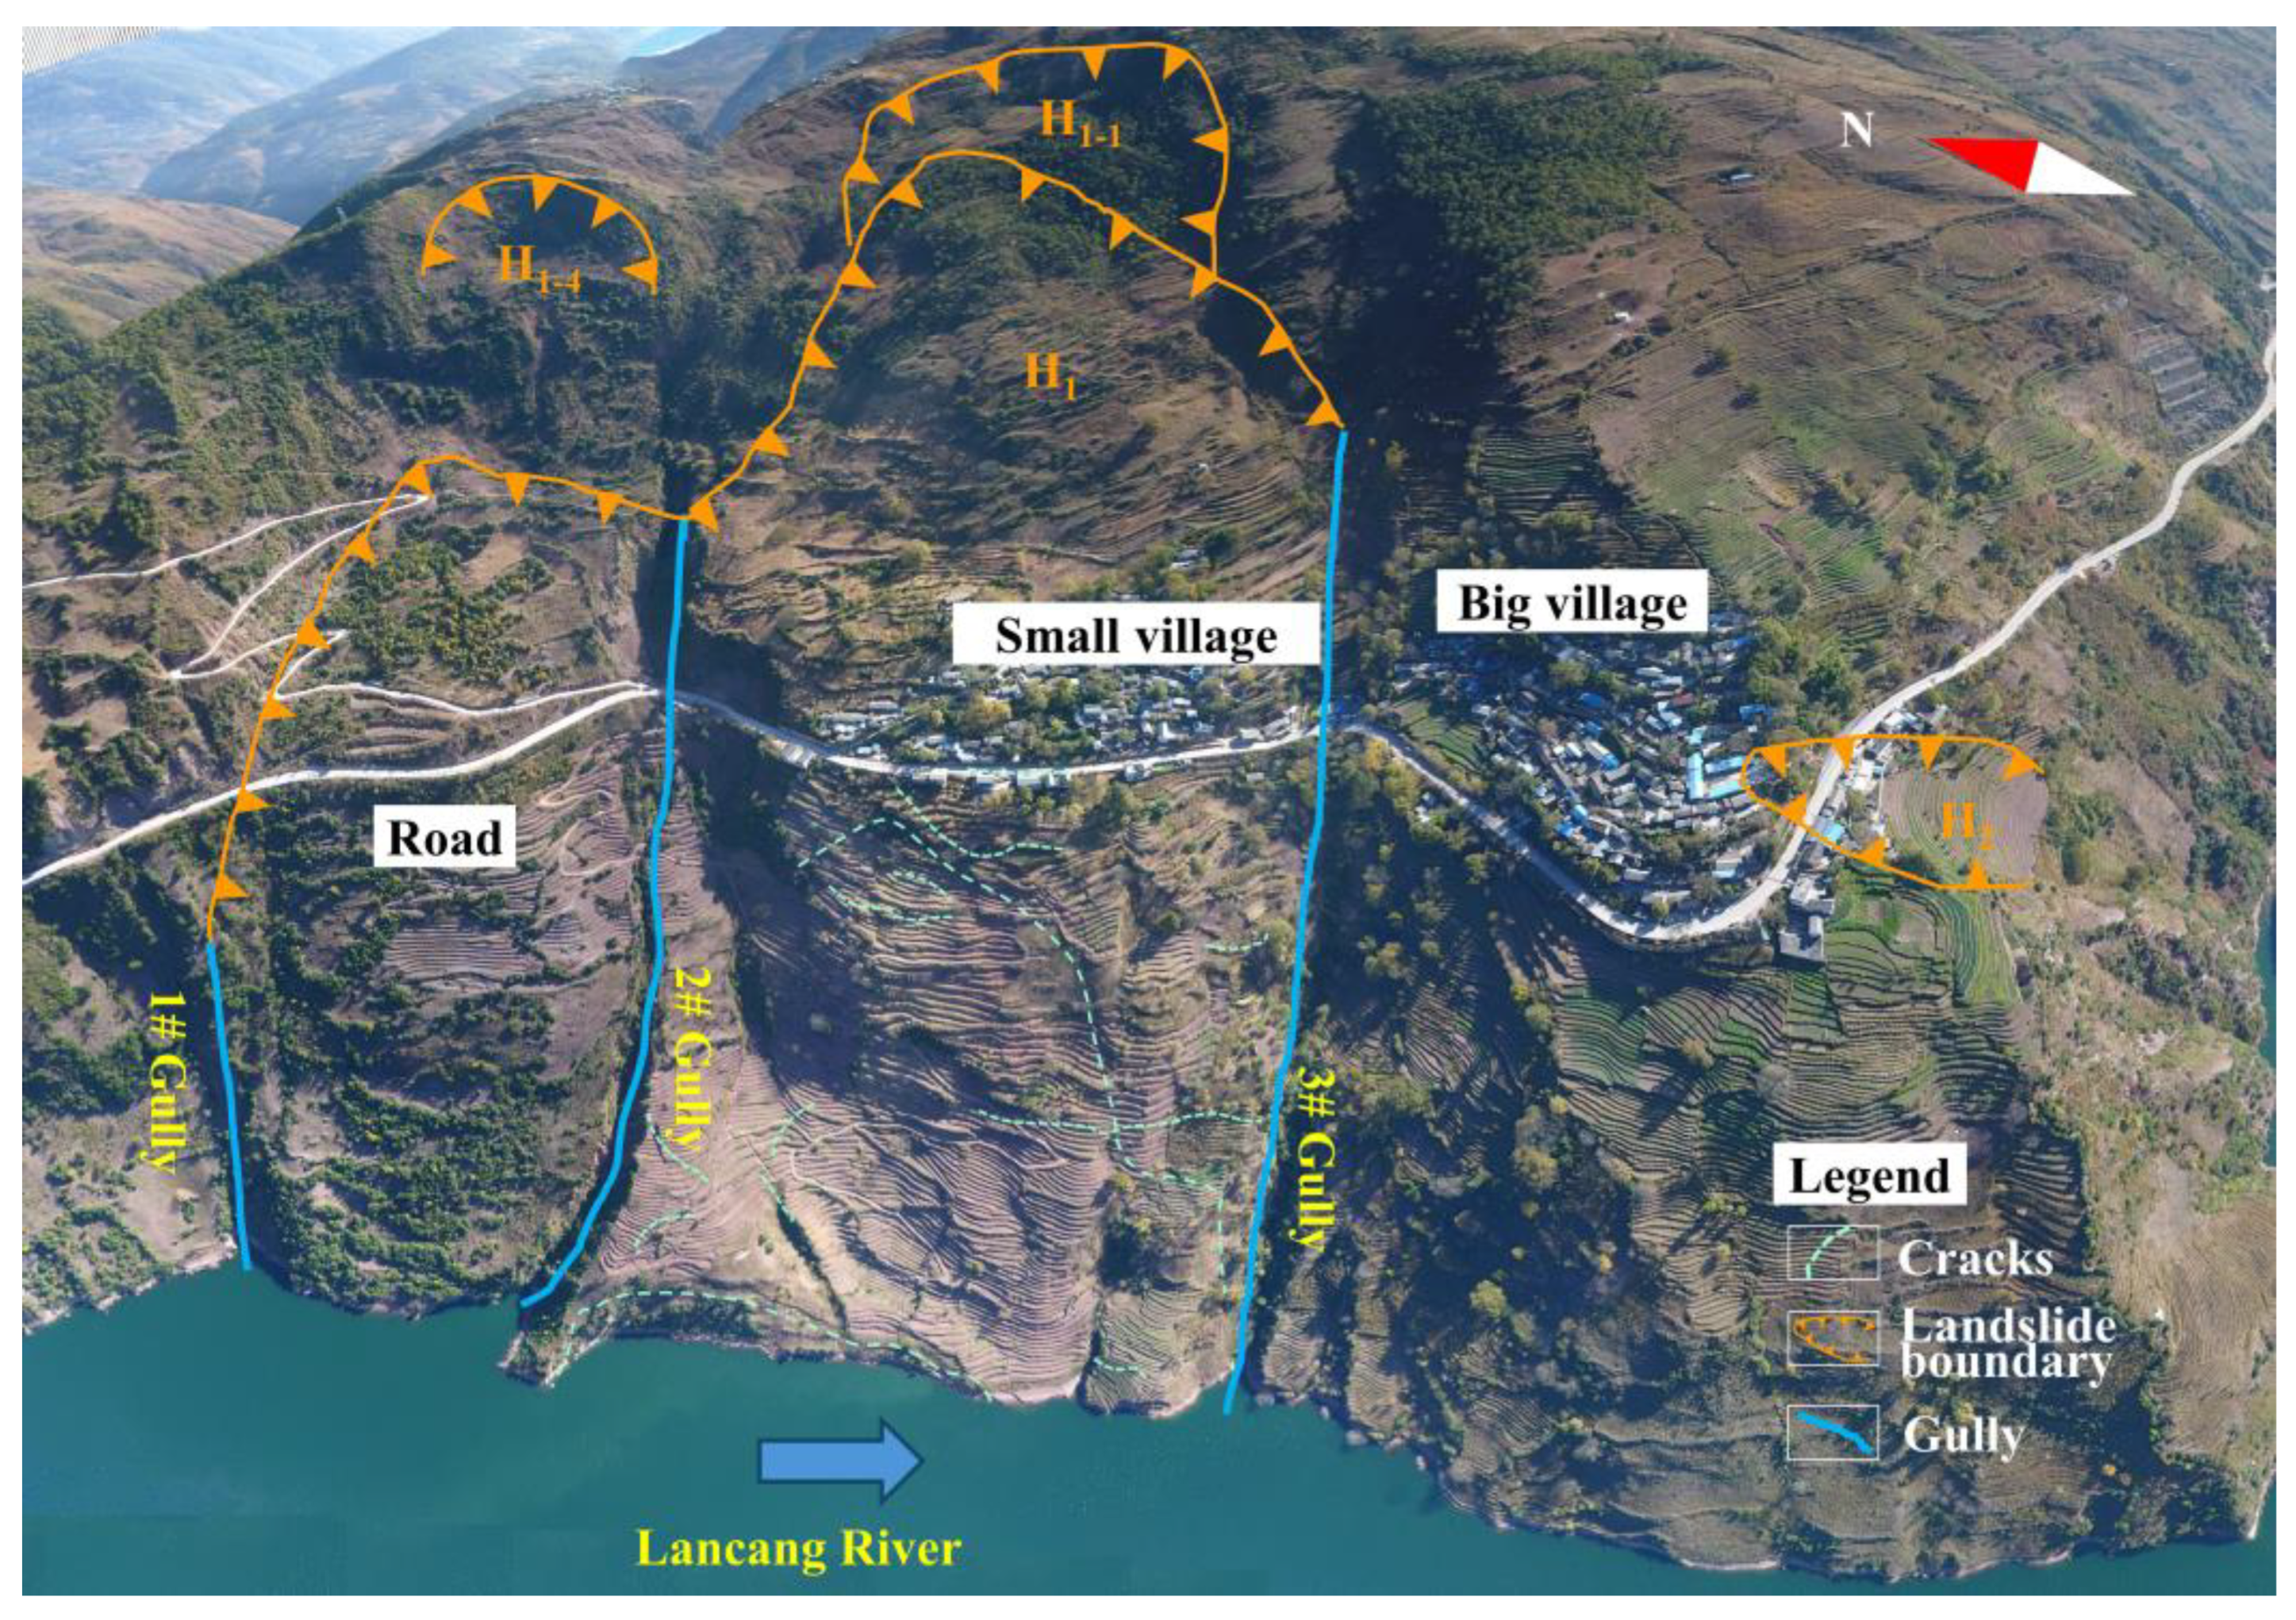
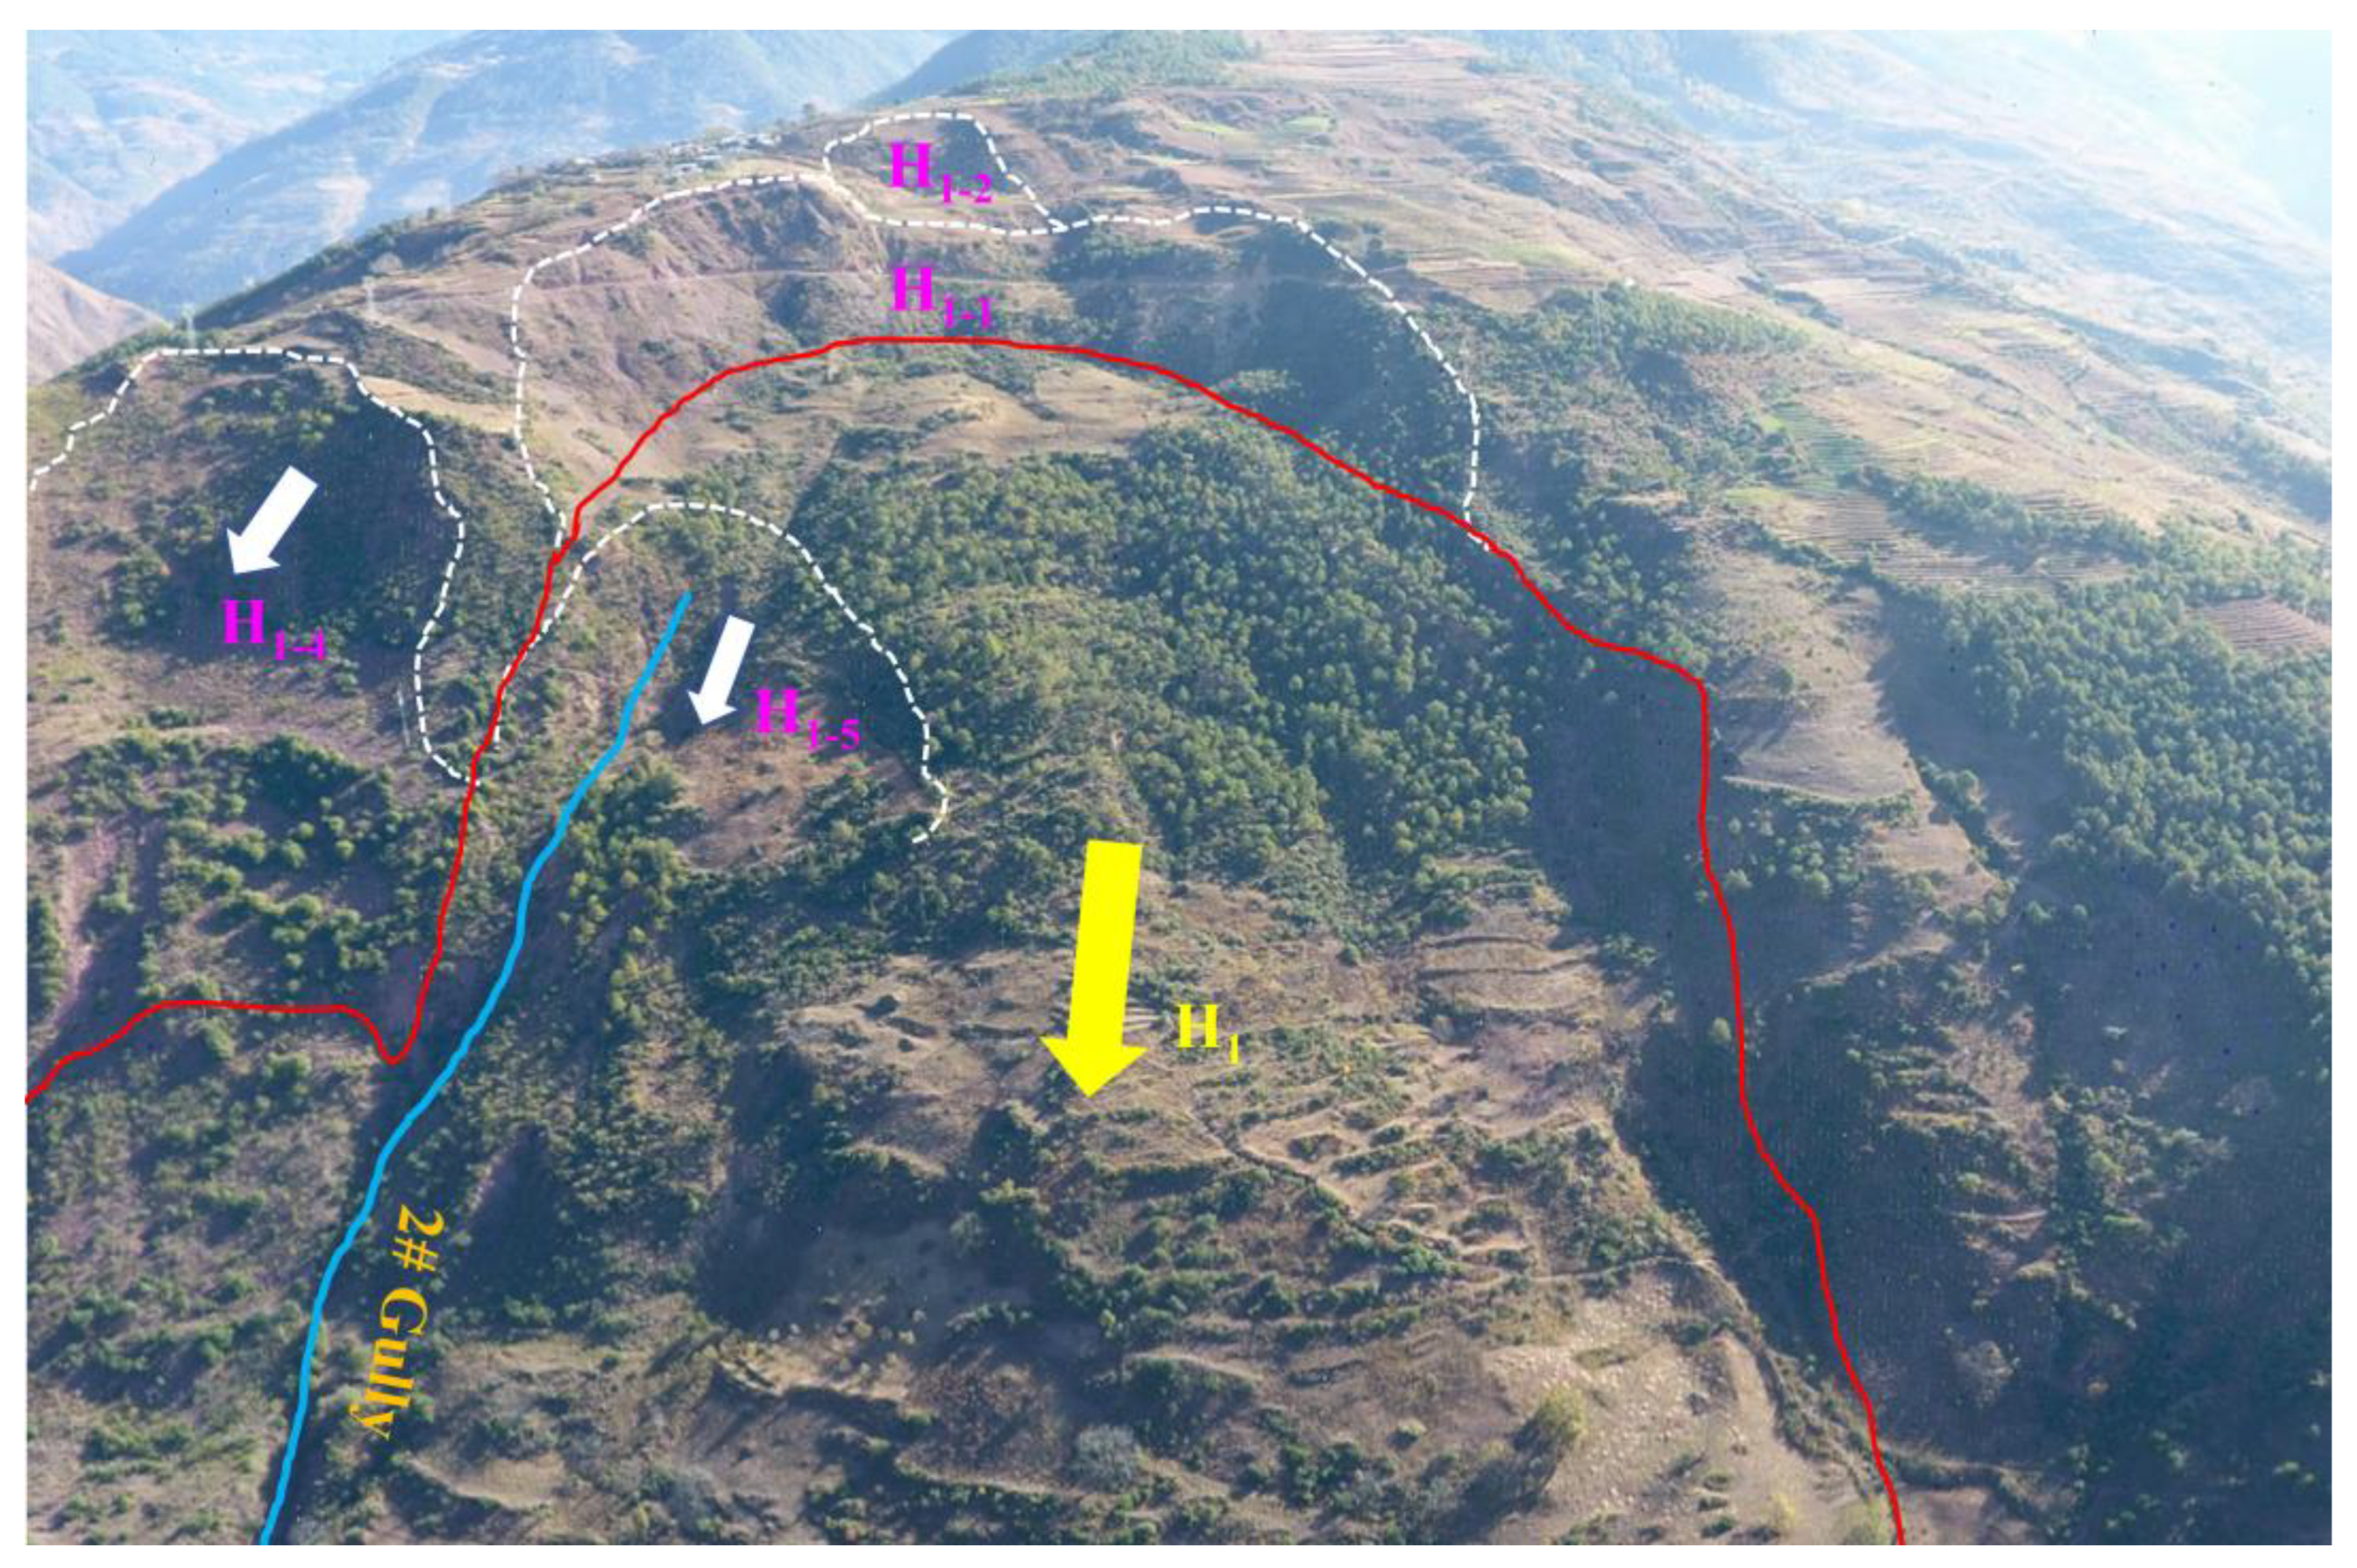
2.2. Characteristics of the Landslide
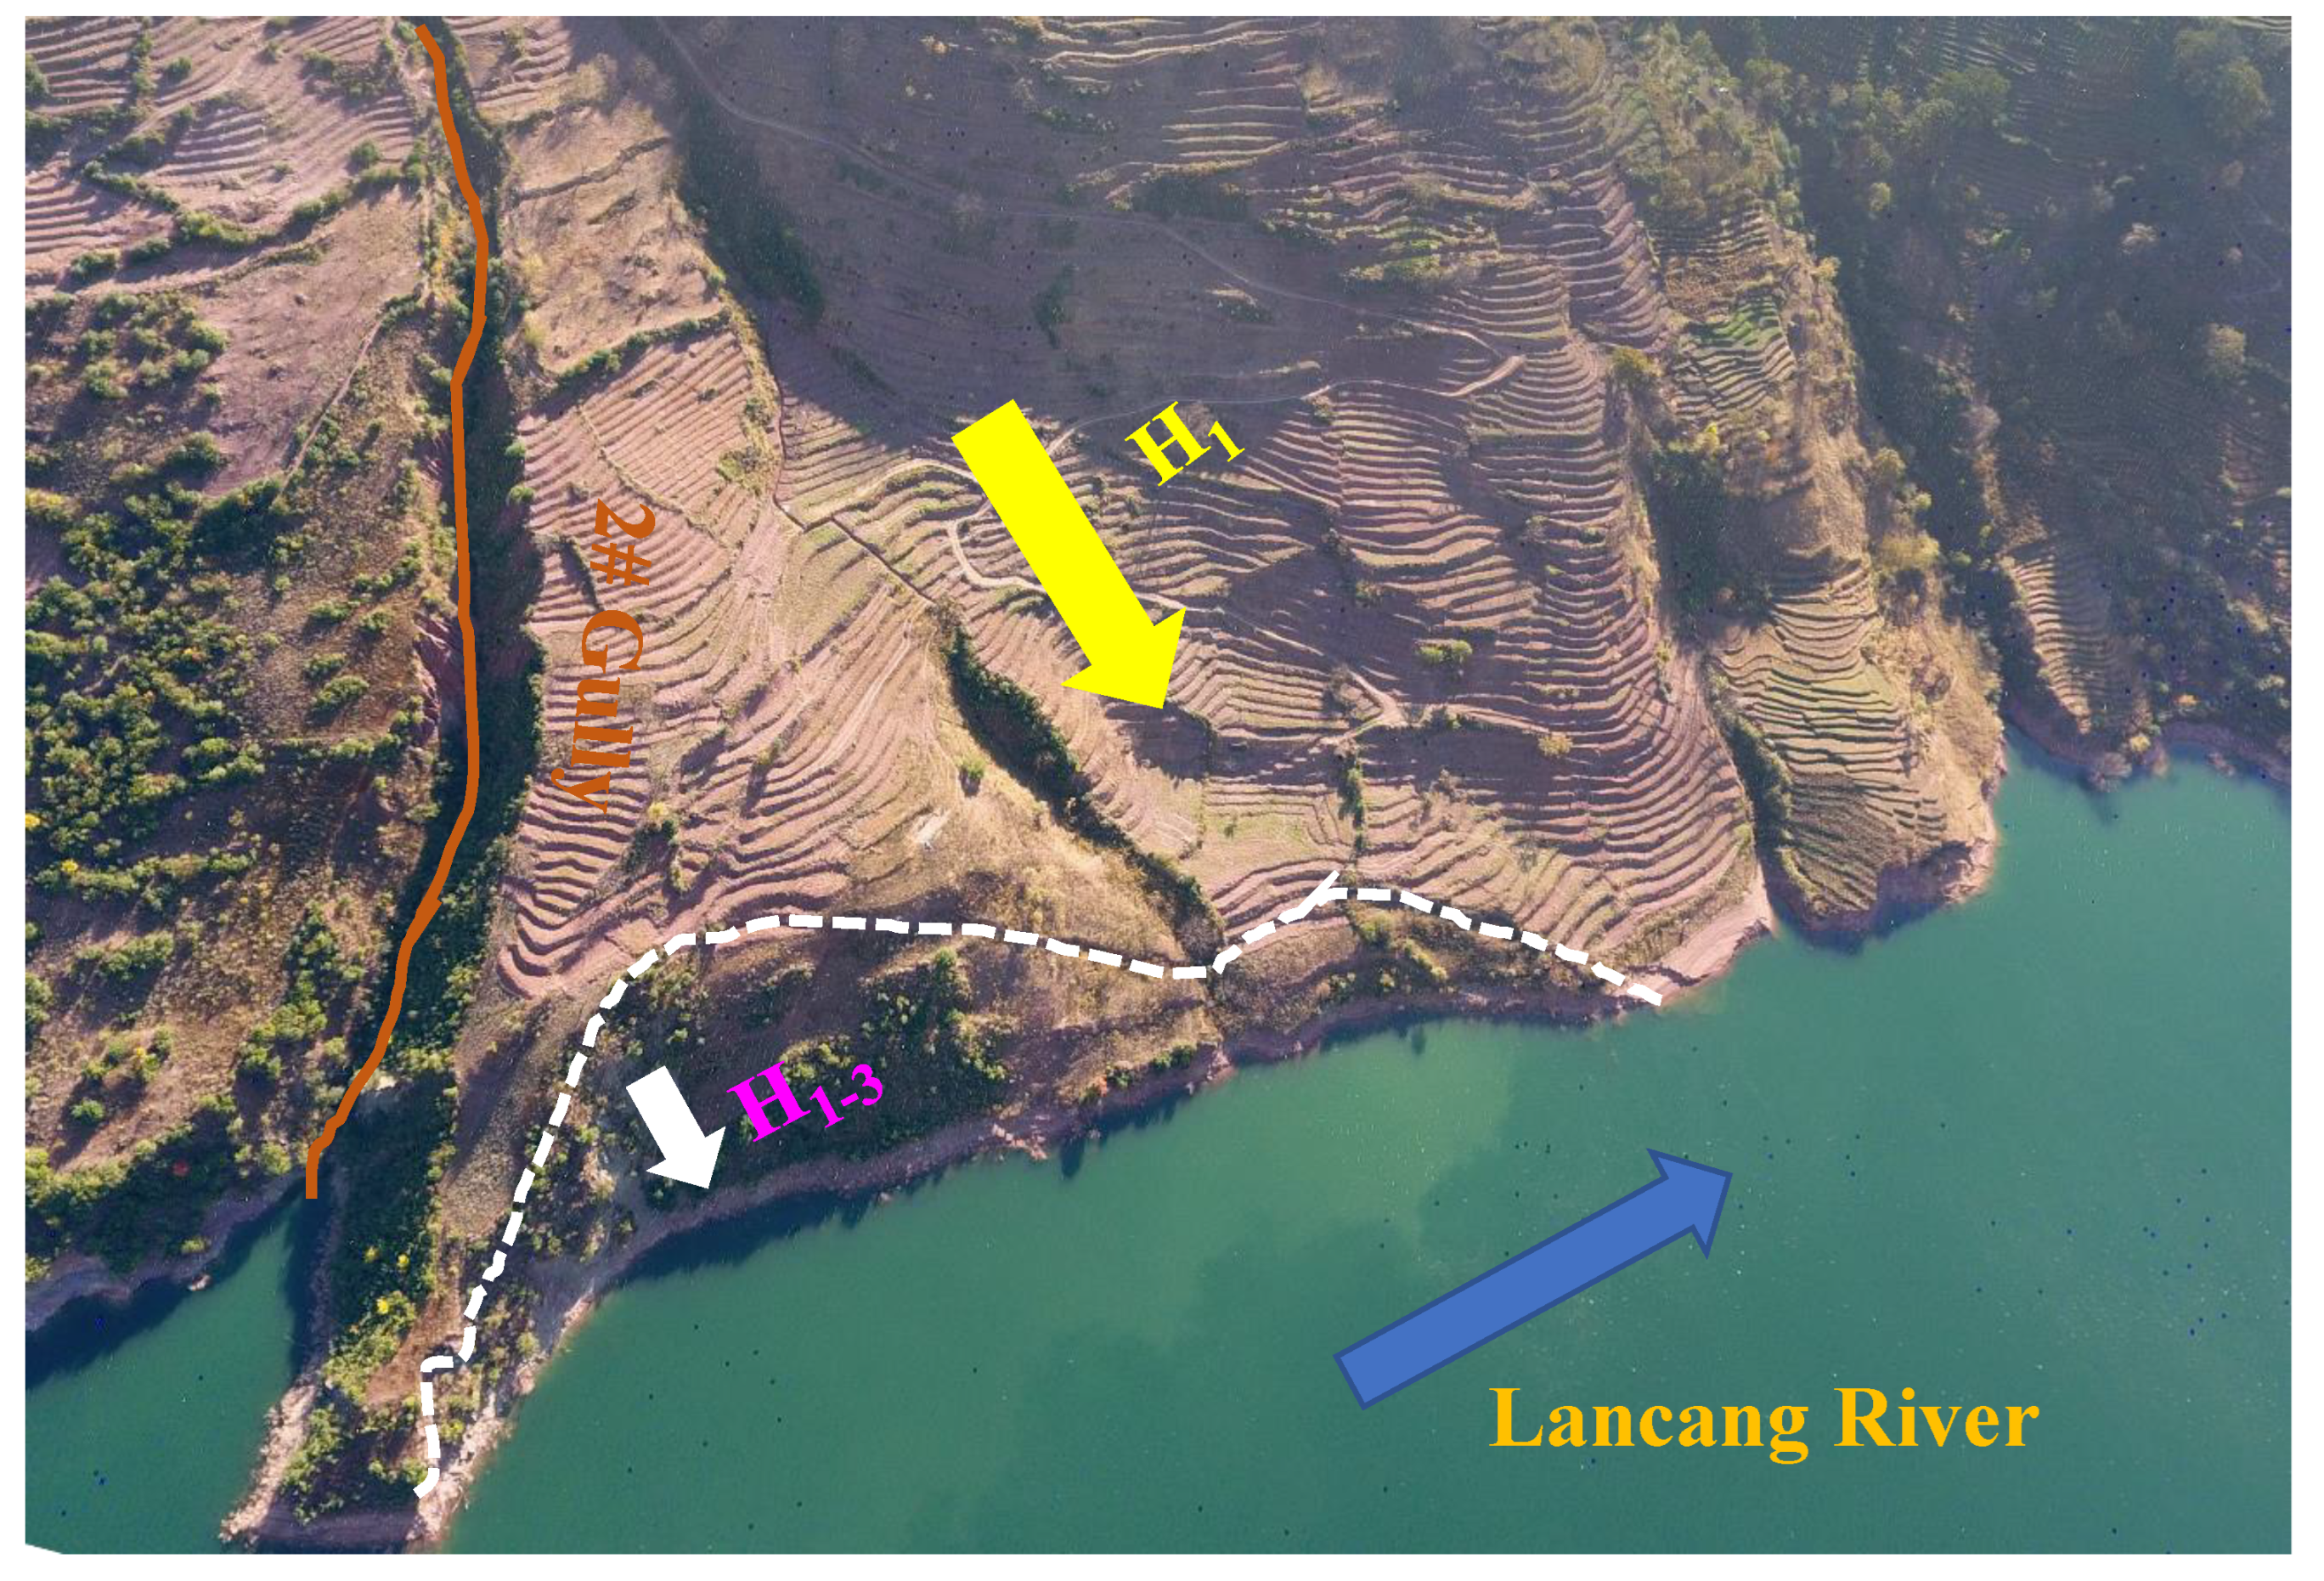
2.2.1. Historical Reactivation
2.2.2. Reactivations after Reservoir Impoundment
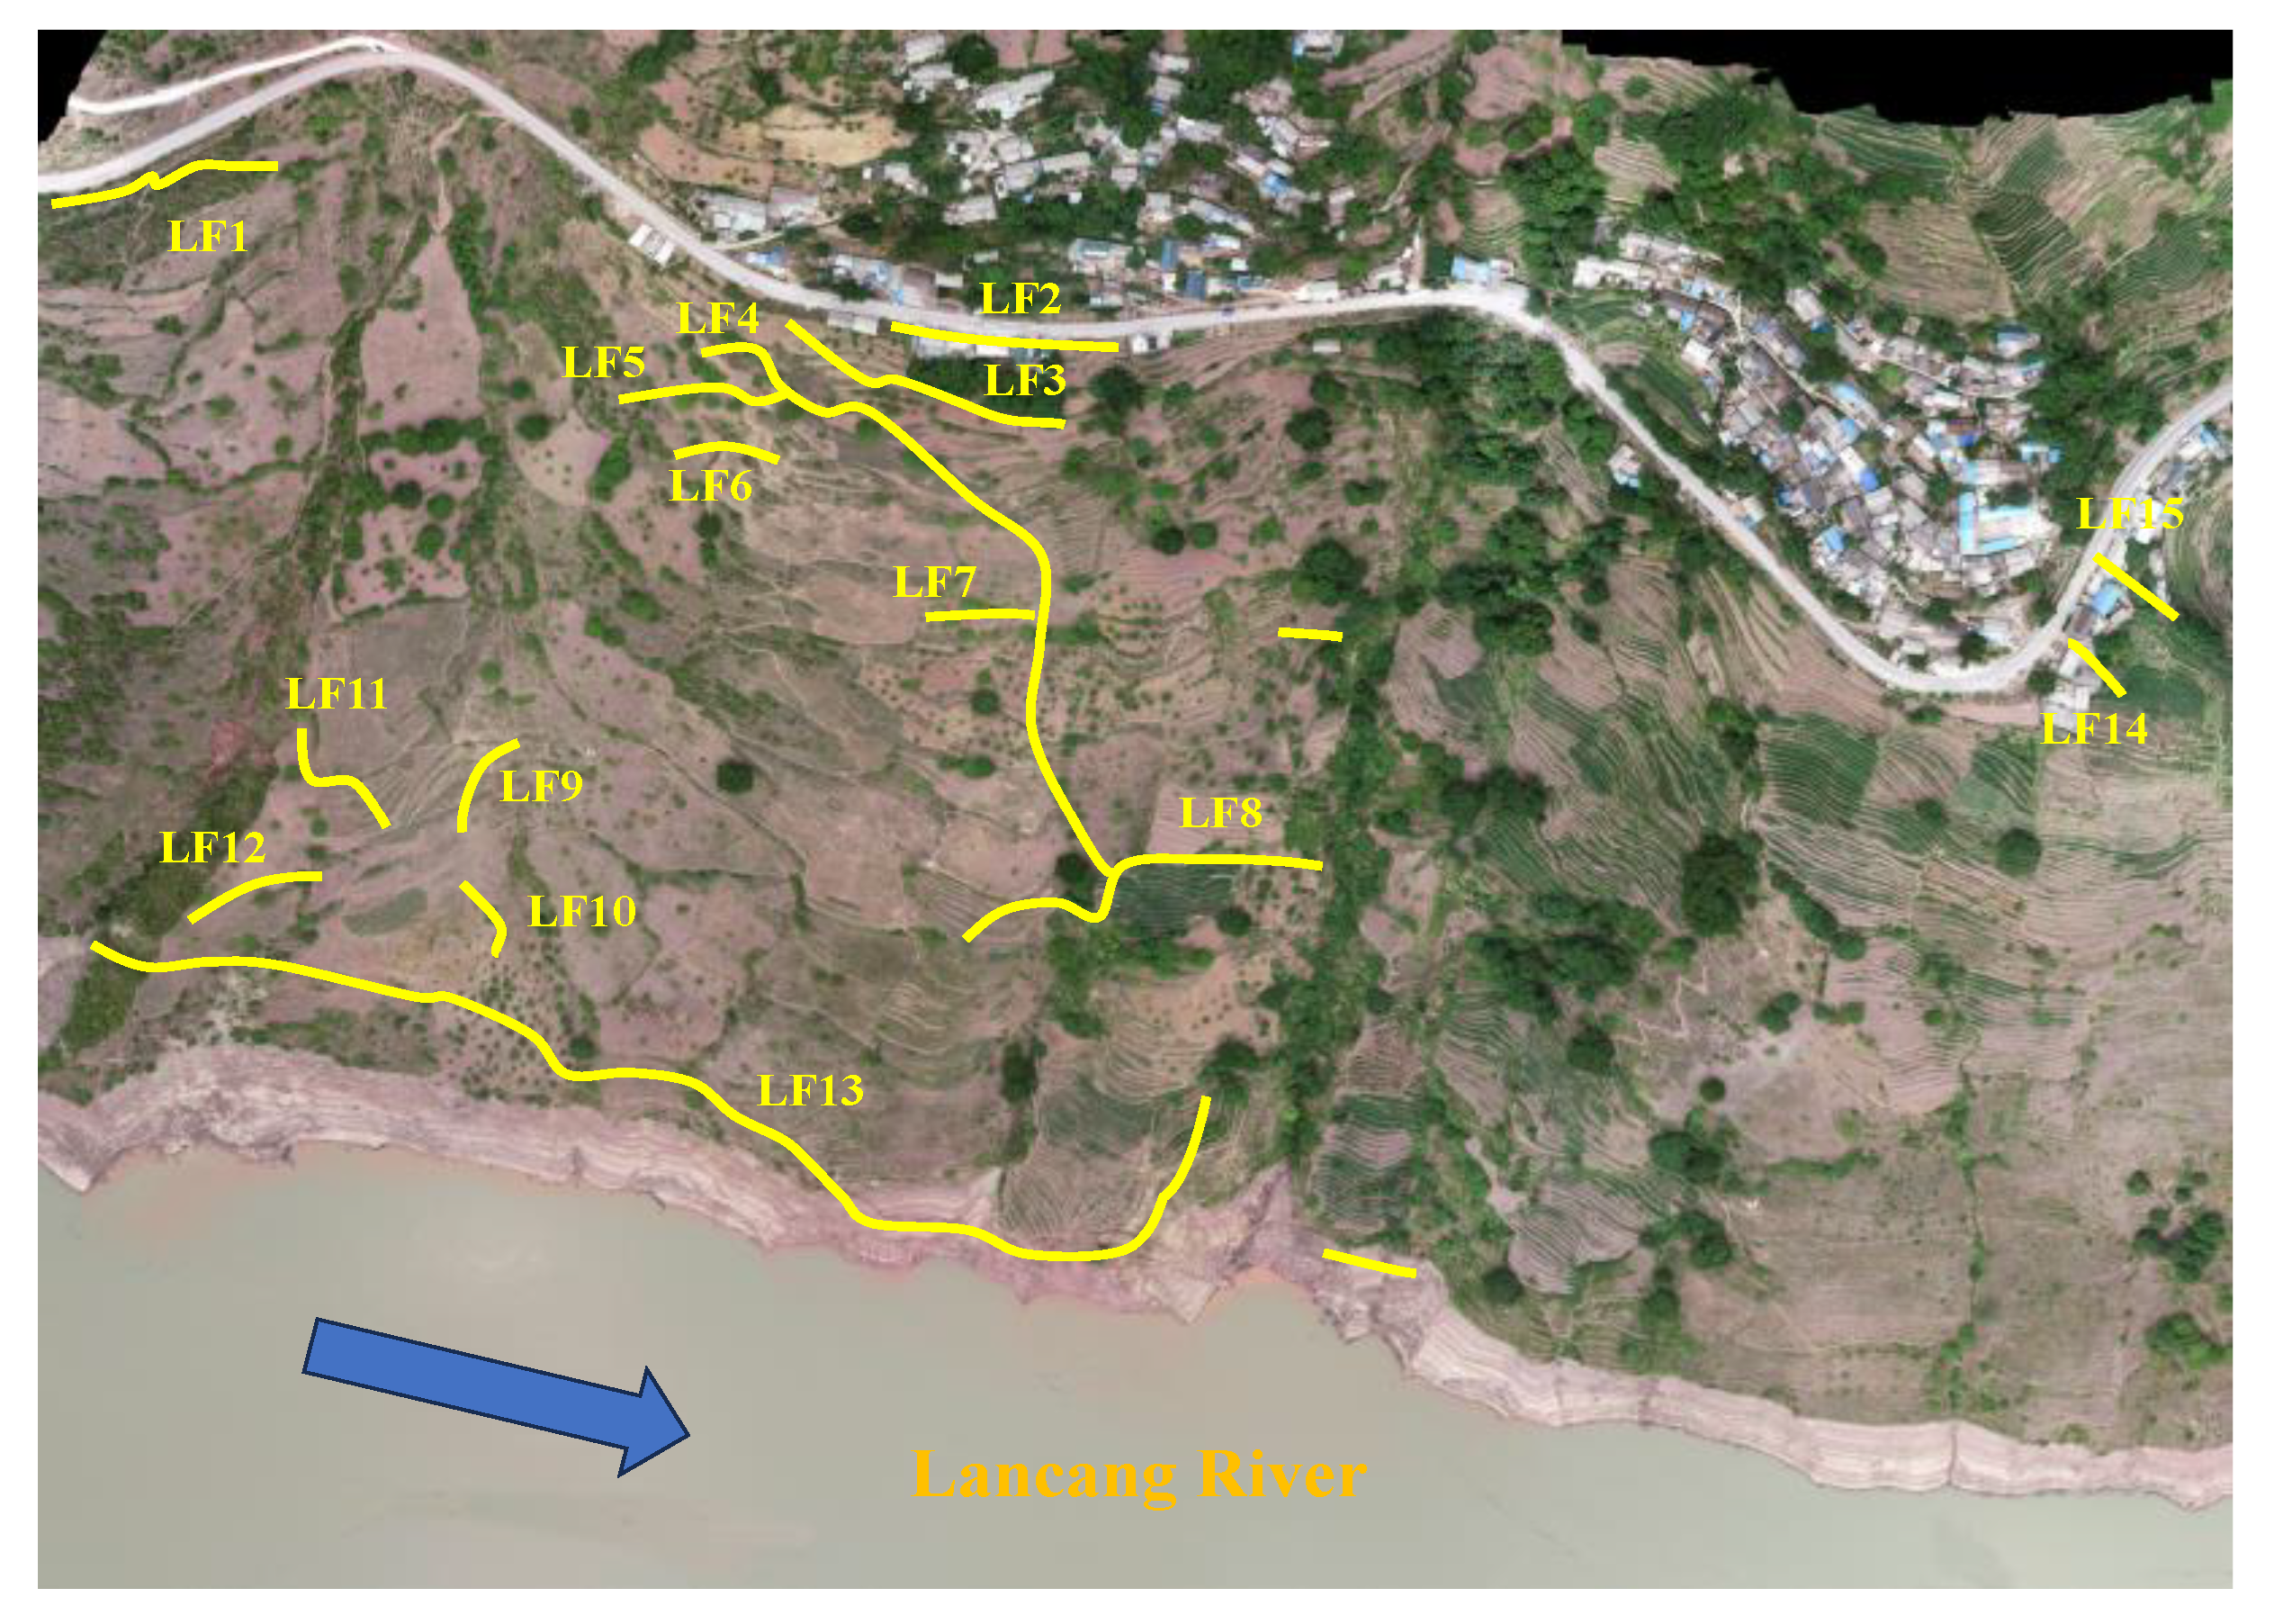
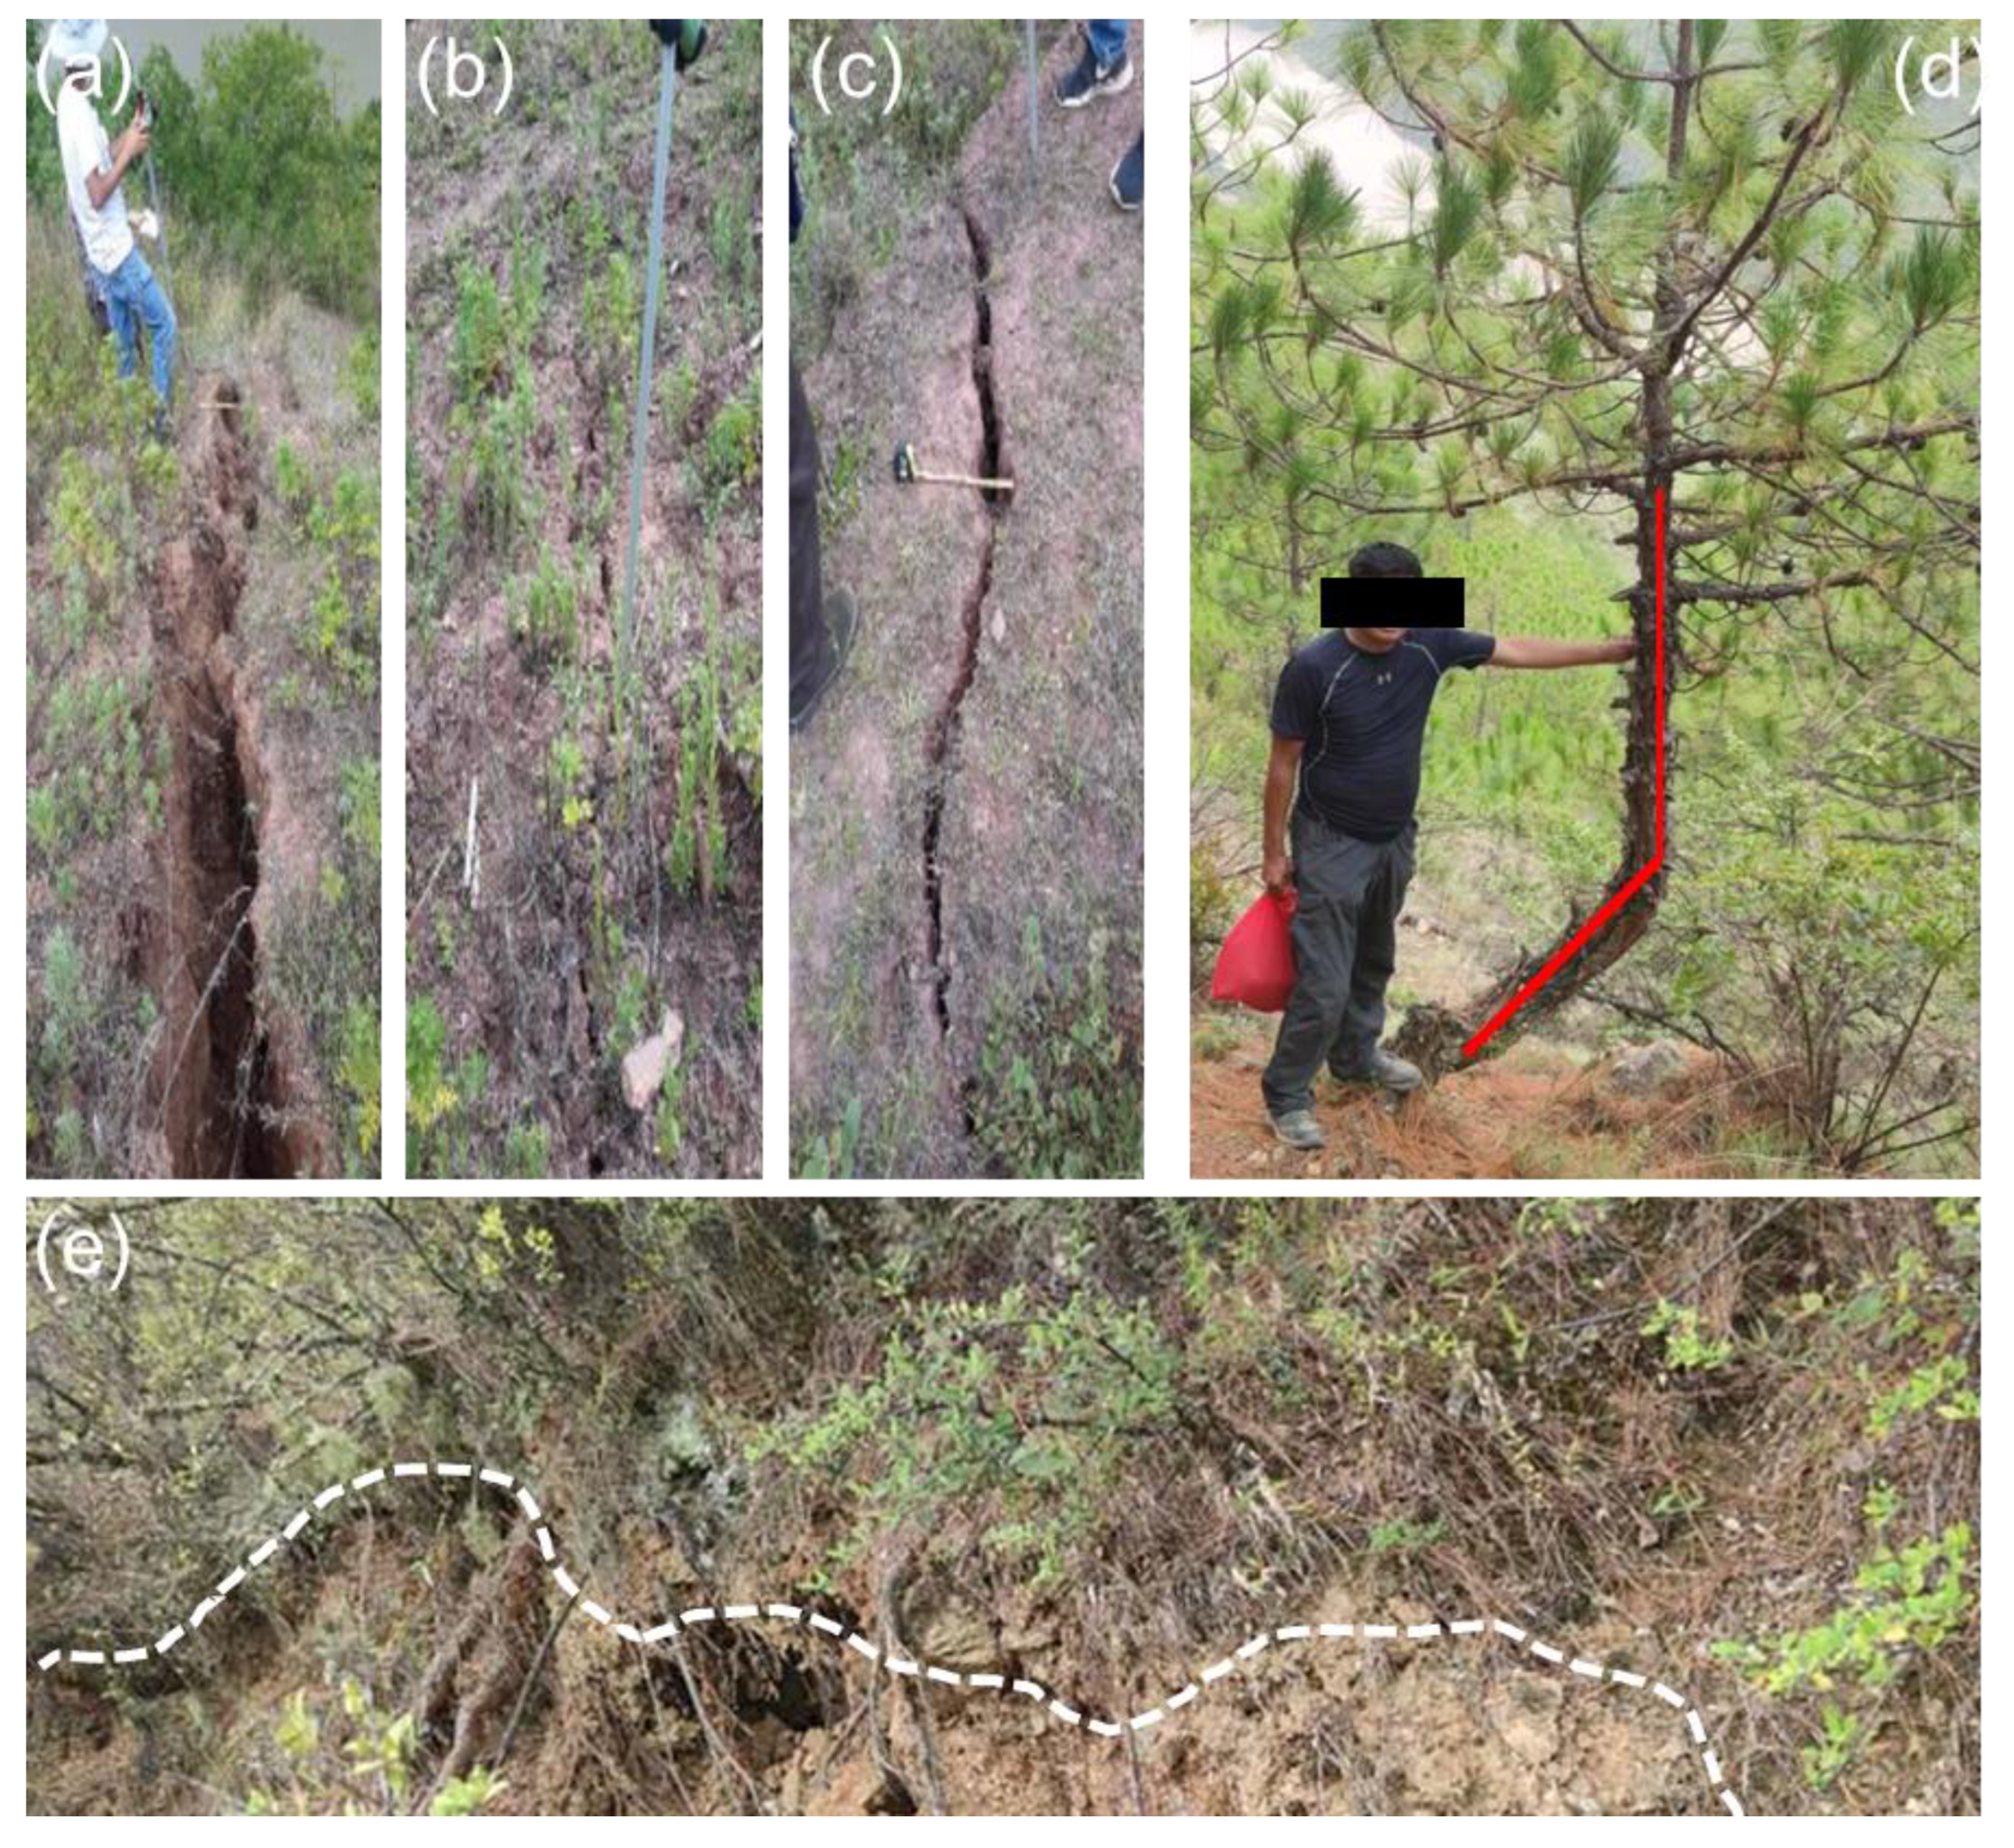
2.3. Characteristics of Crack Development
2.3.1. Historical Reactivation
2.3.2. Reactivations after Reservoir Impoundment
3. Research Methods
3.1. Landslide Surface Deformation Measurements
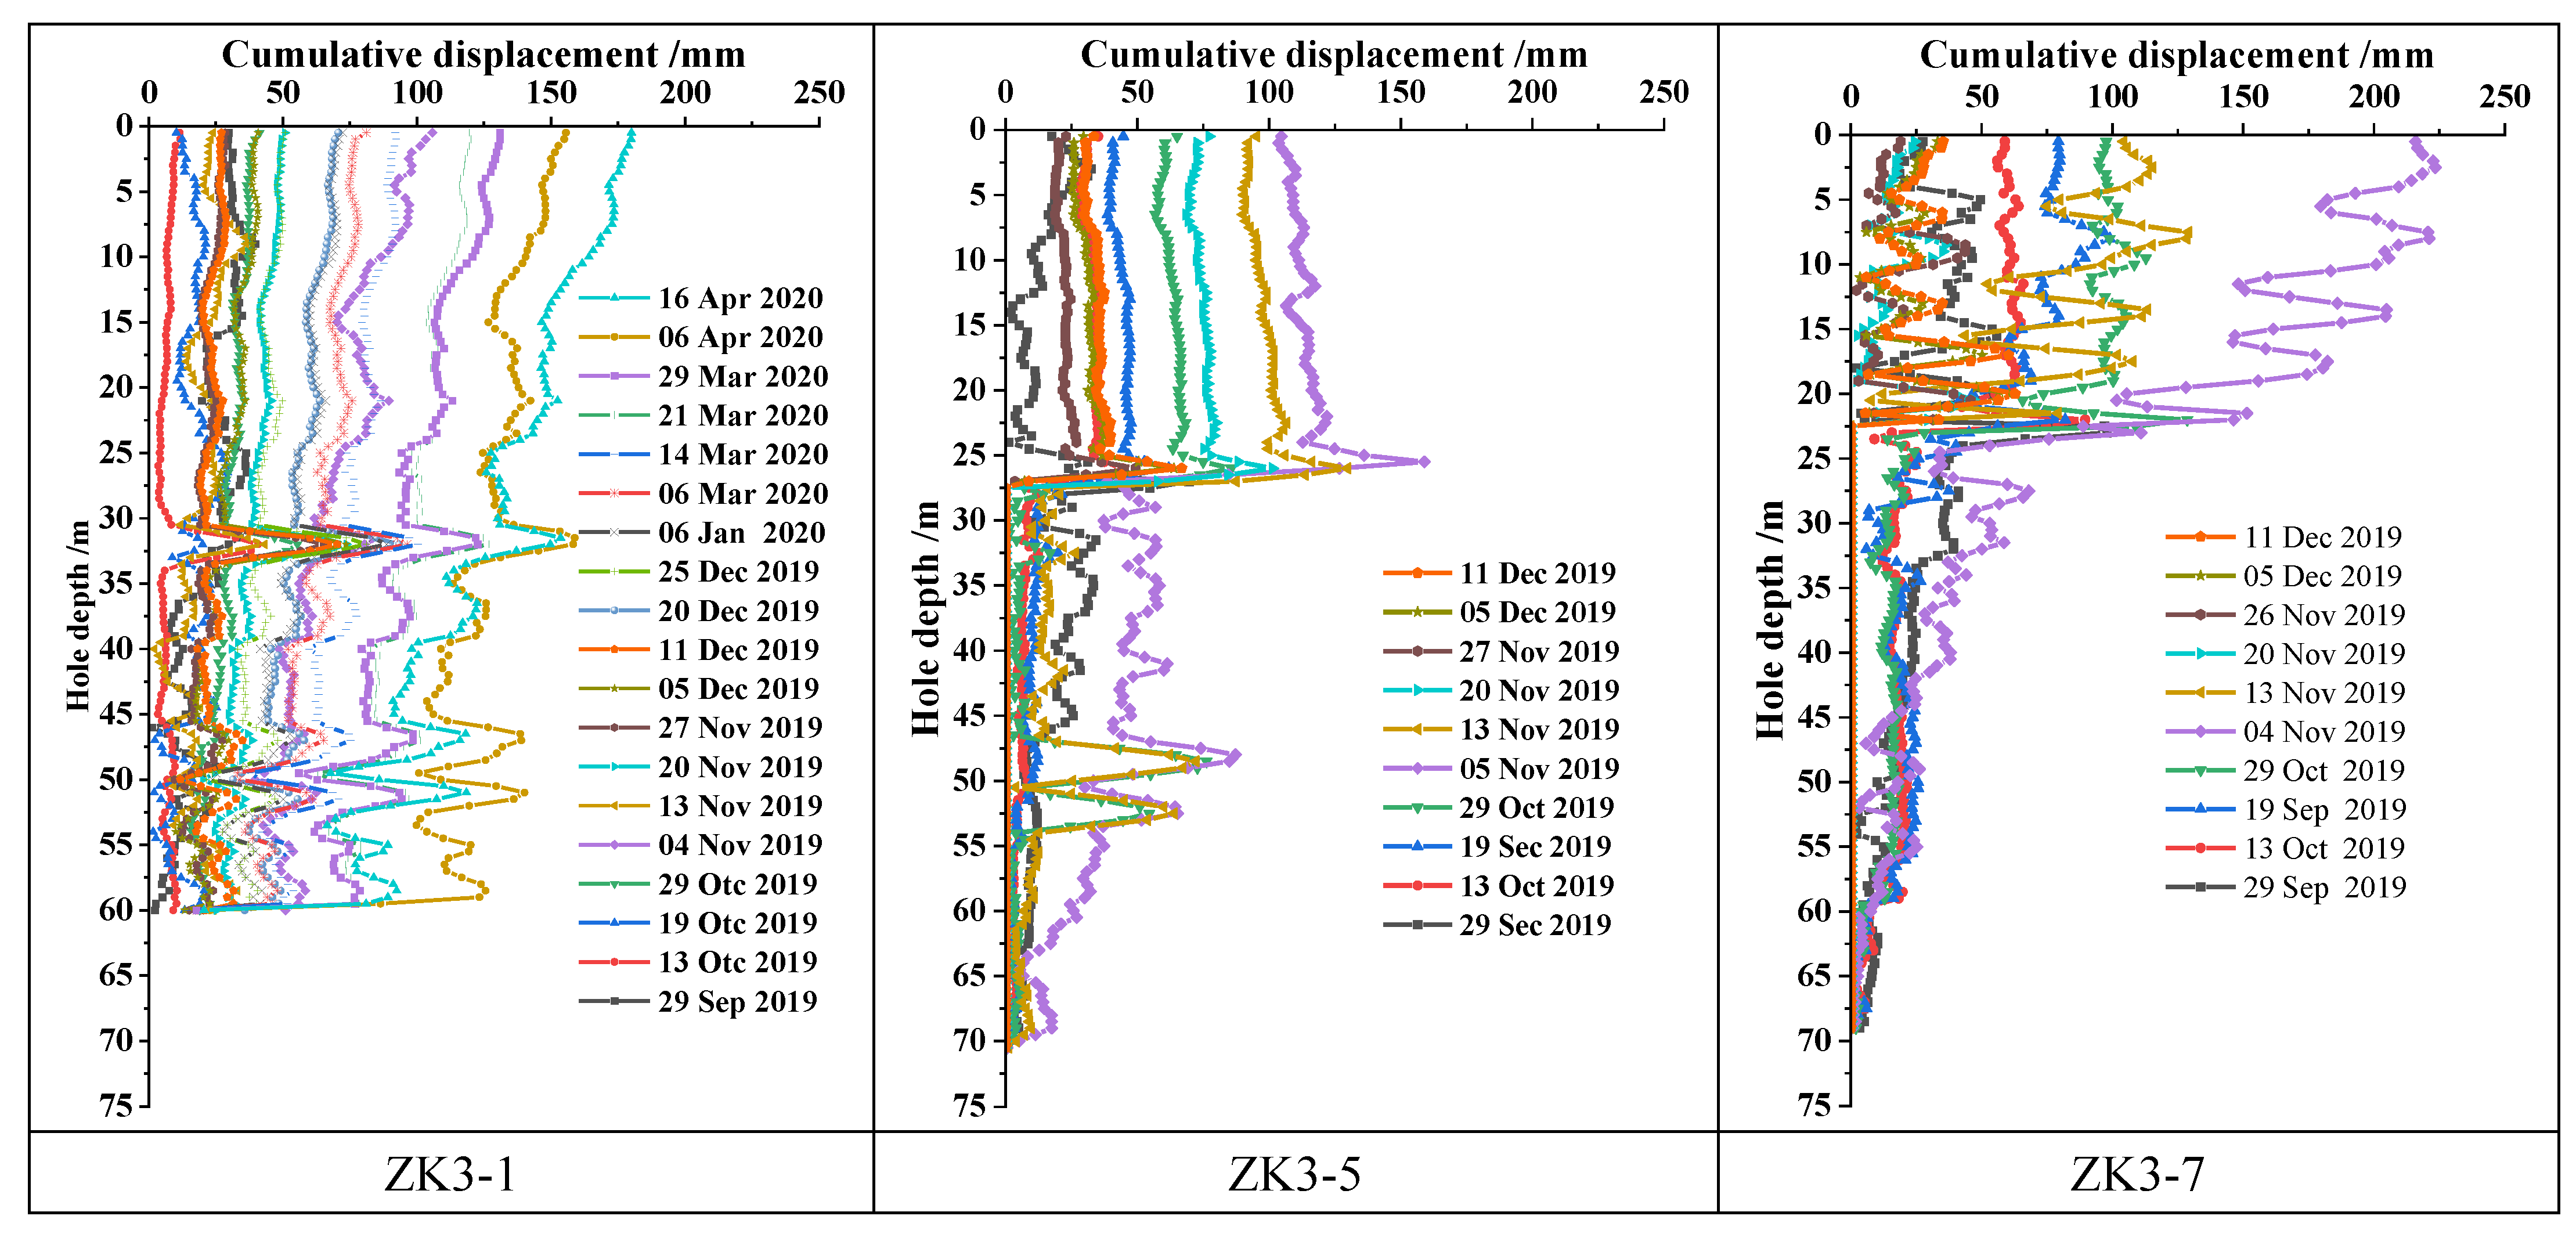
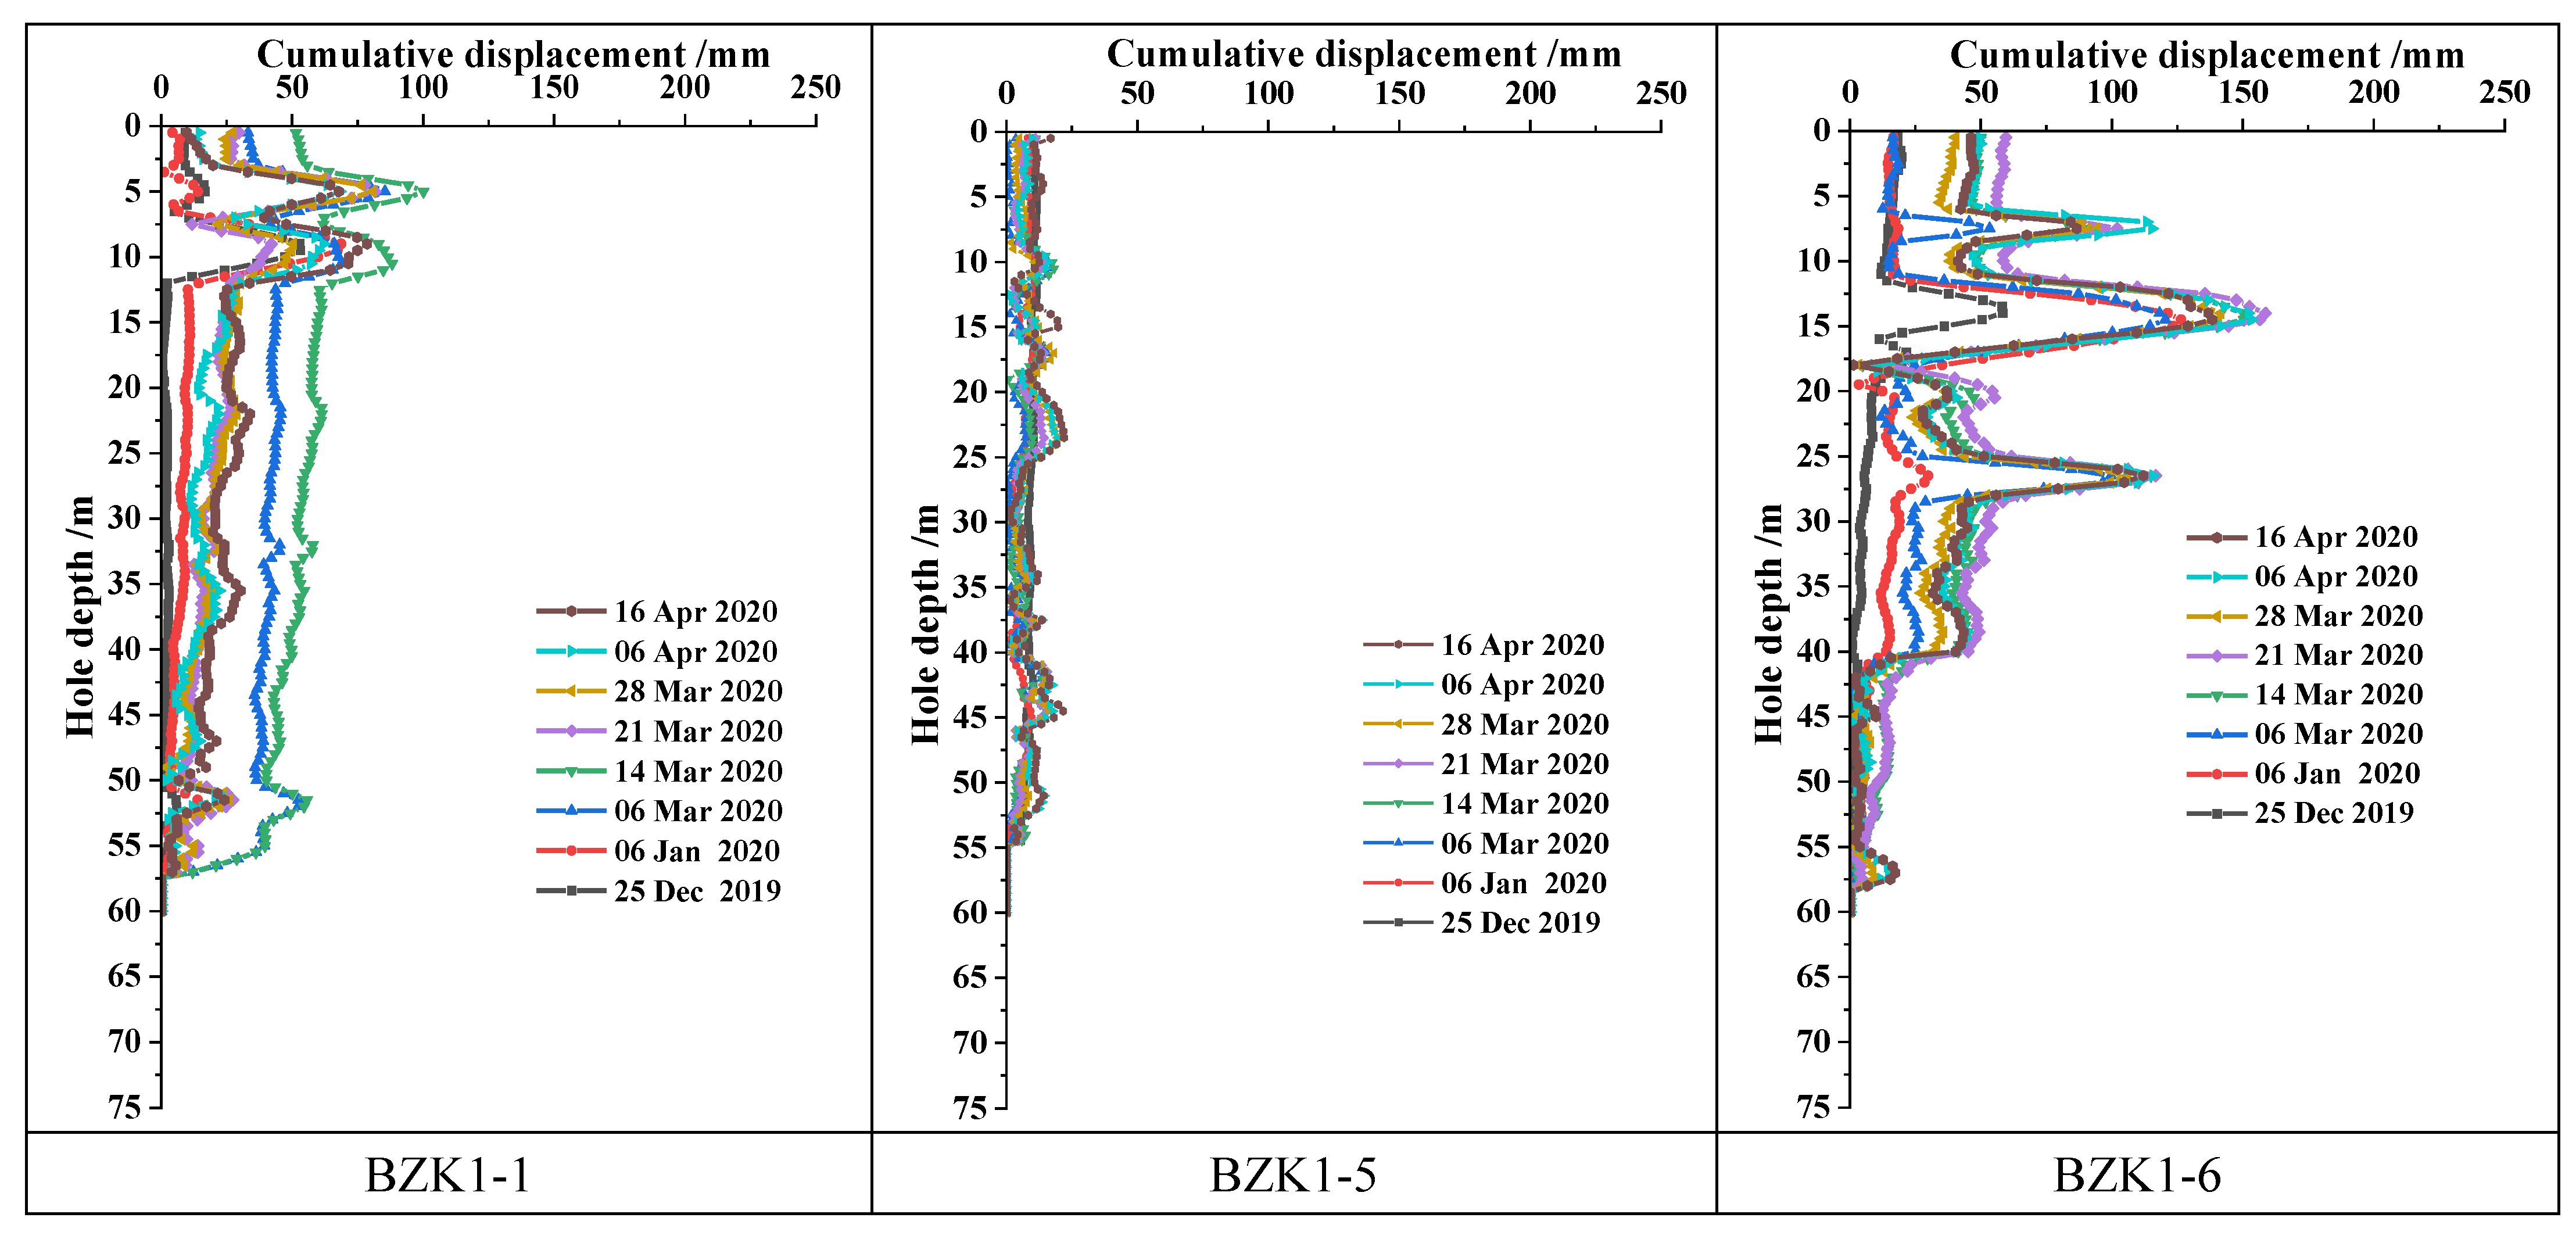
3.2. Measurement of Subsurface Deformation of Landslide
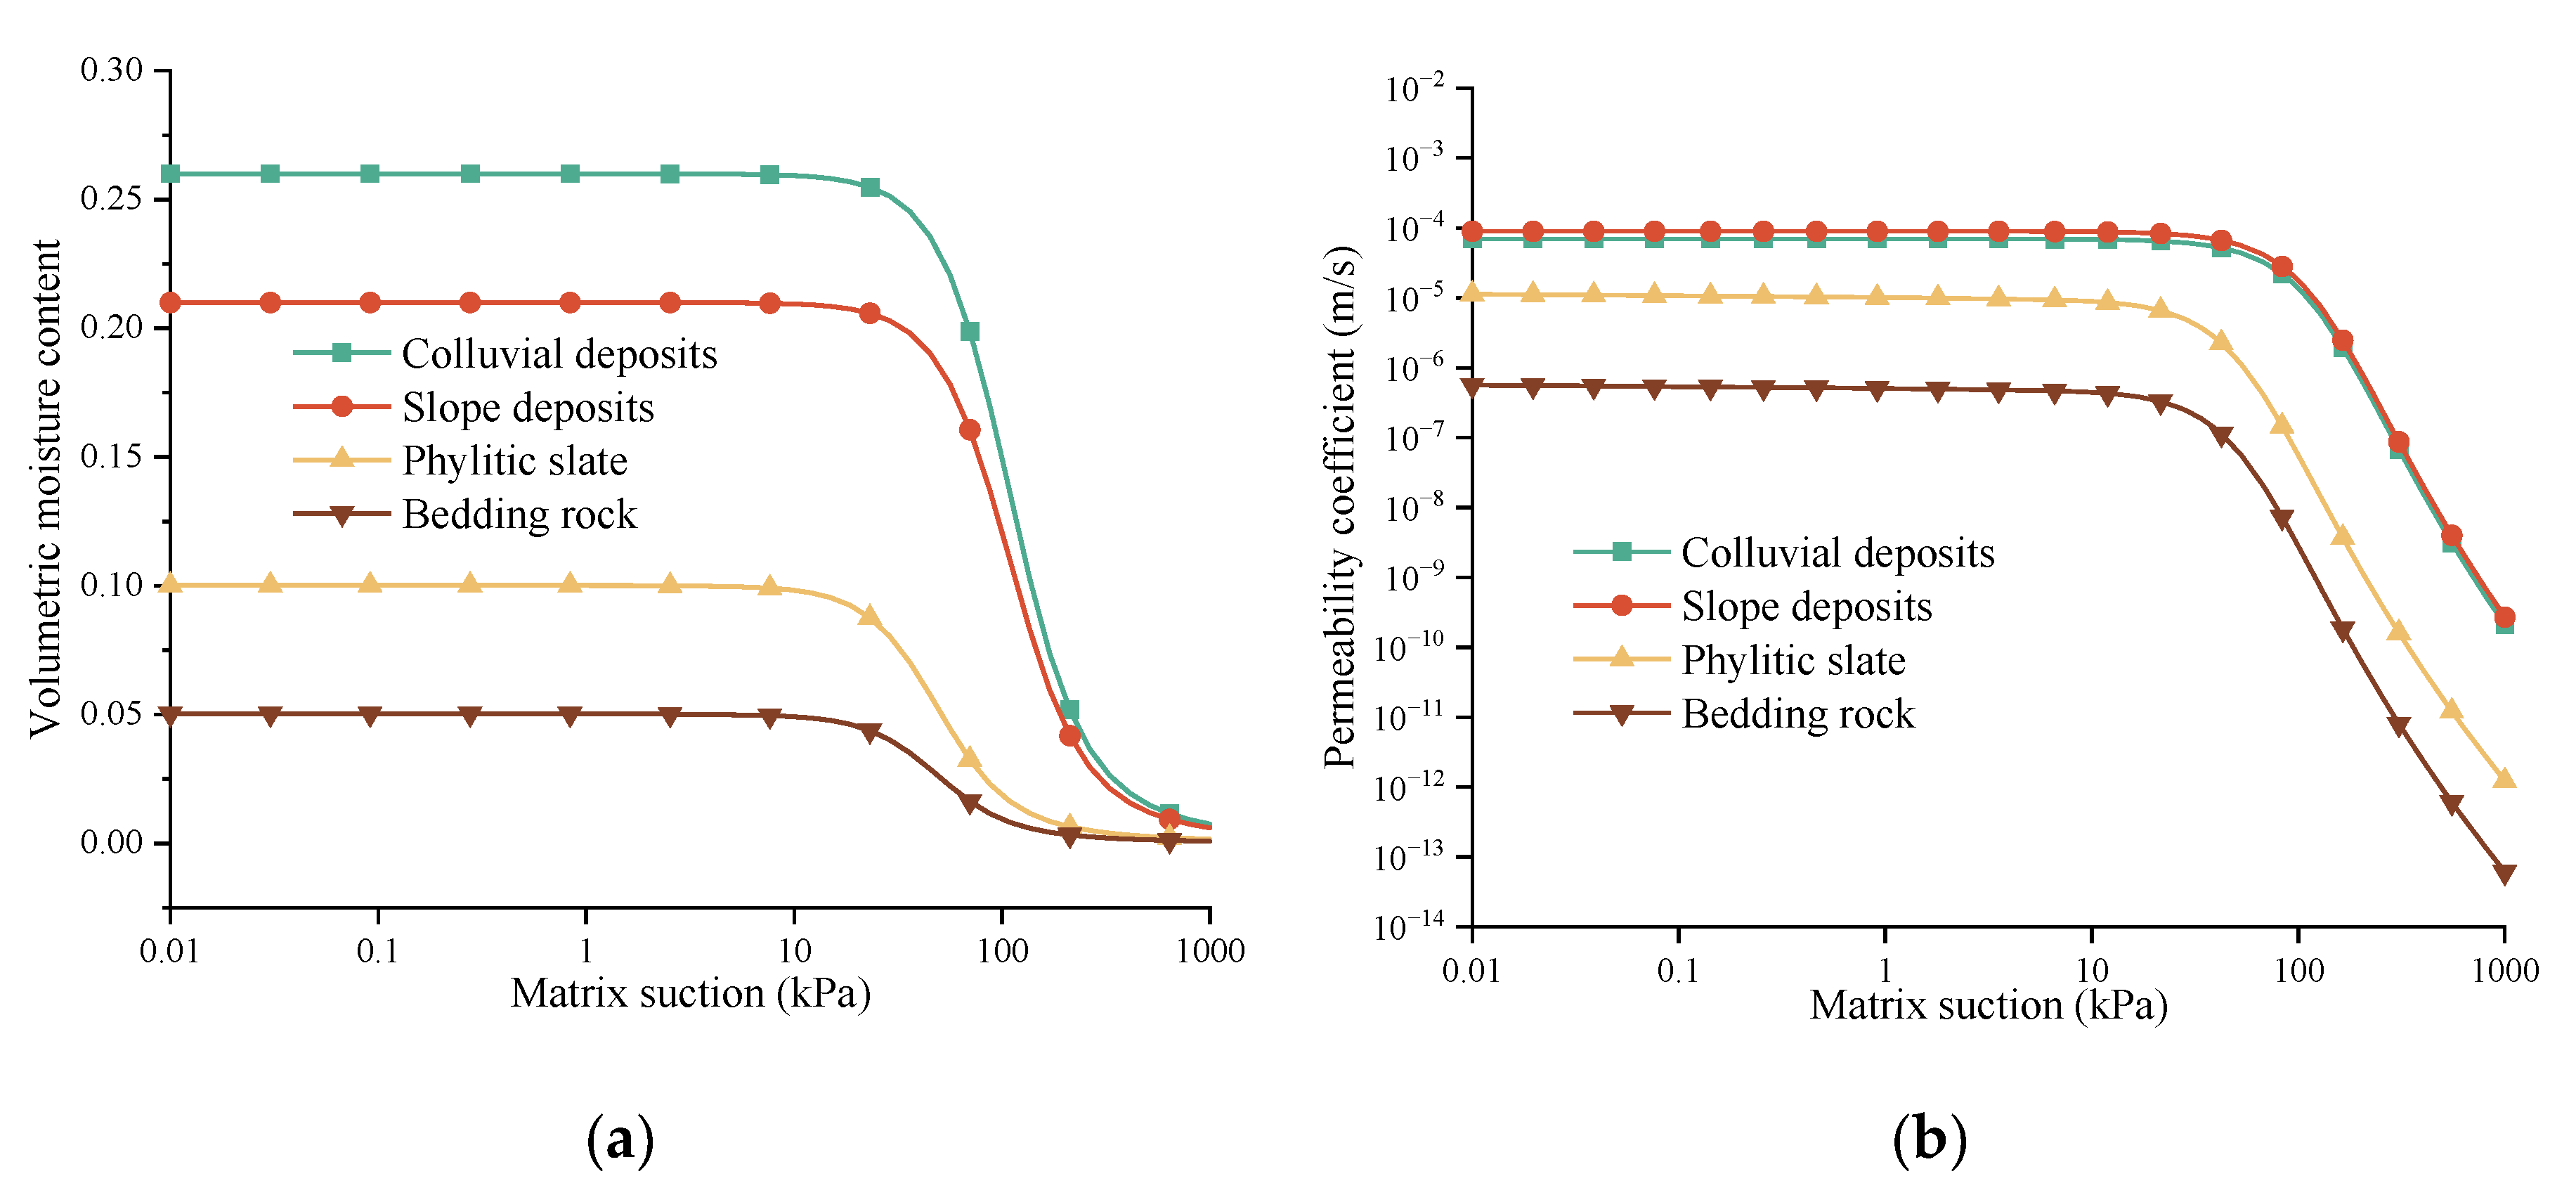
3.3. Testing of Physical and Mechanical Properties of Landslide Materials
3.4. Correlation Analysis
3.4.1. Pearson Correlation Analysis
3.4.2. Net Correlation Analysis
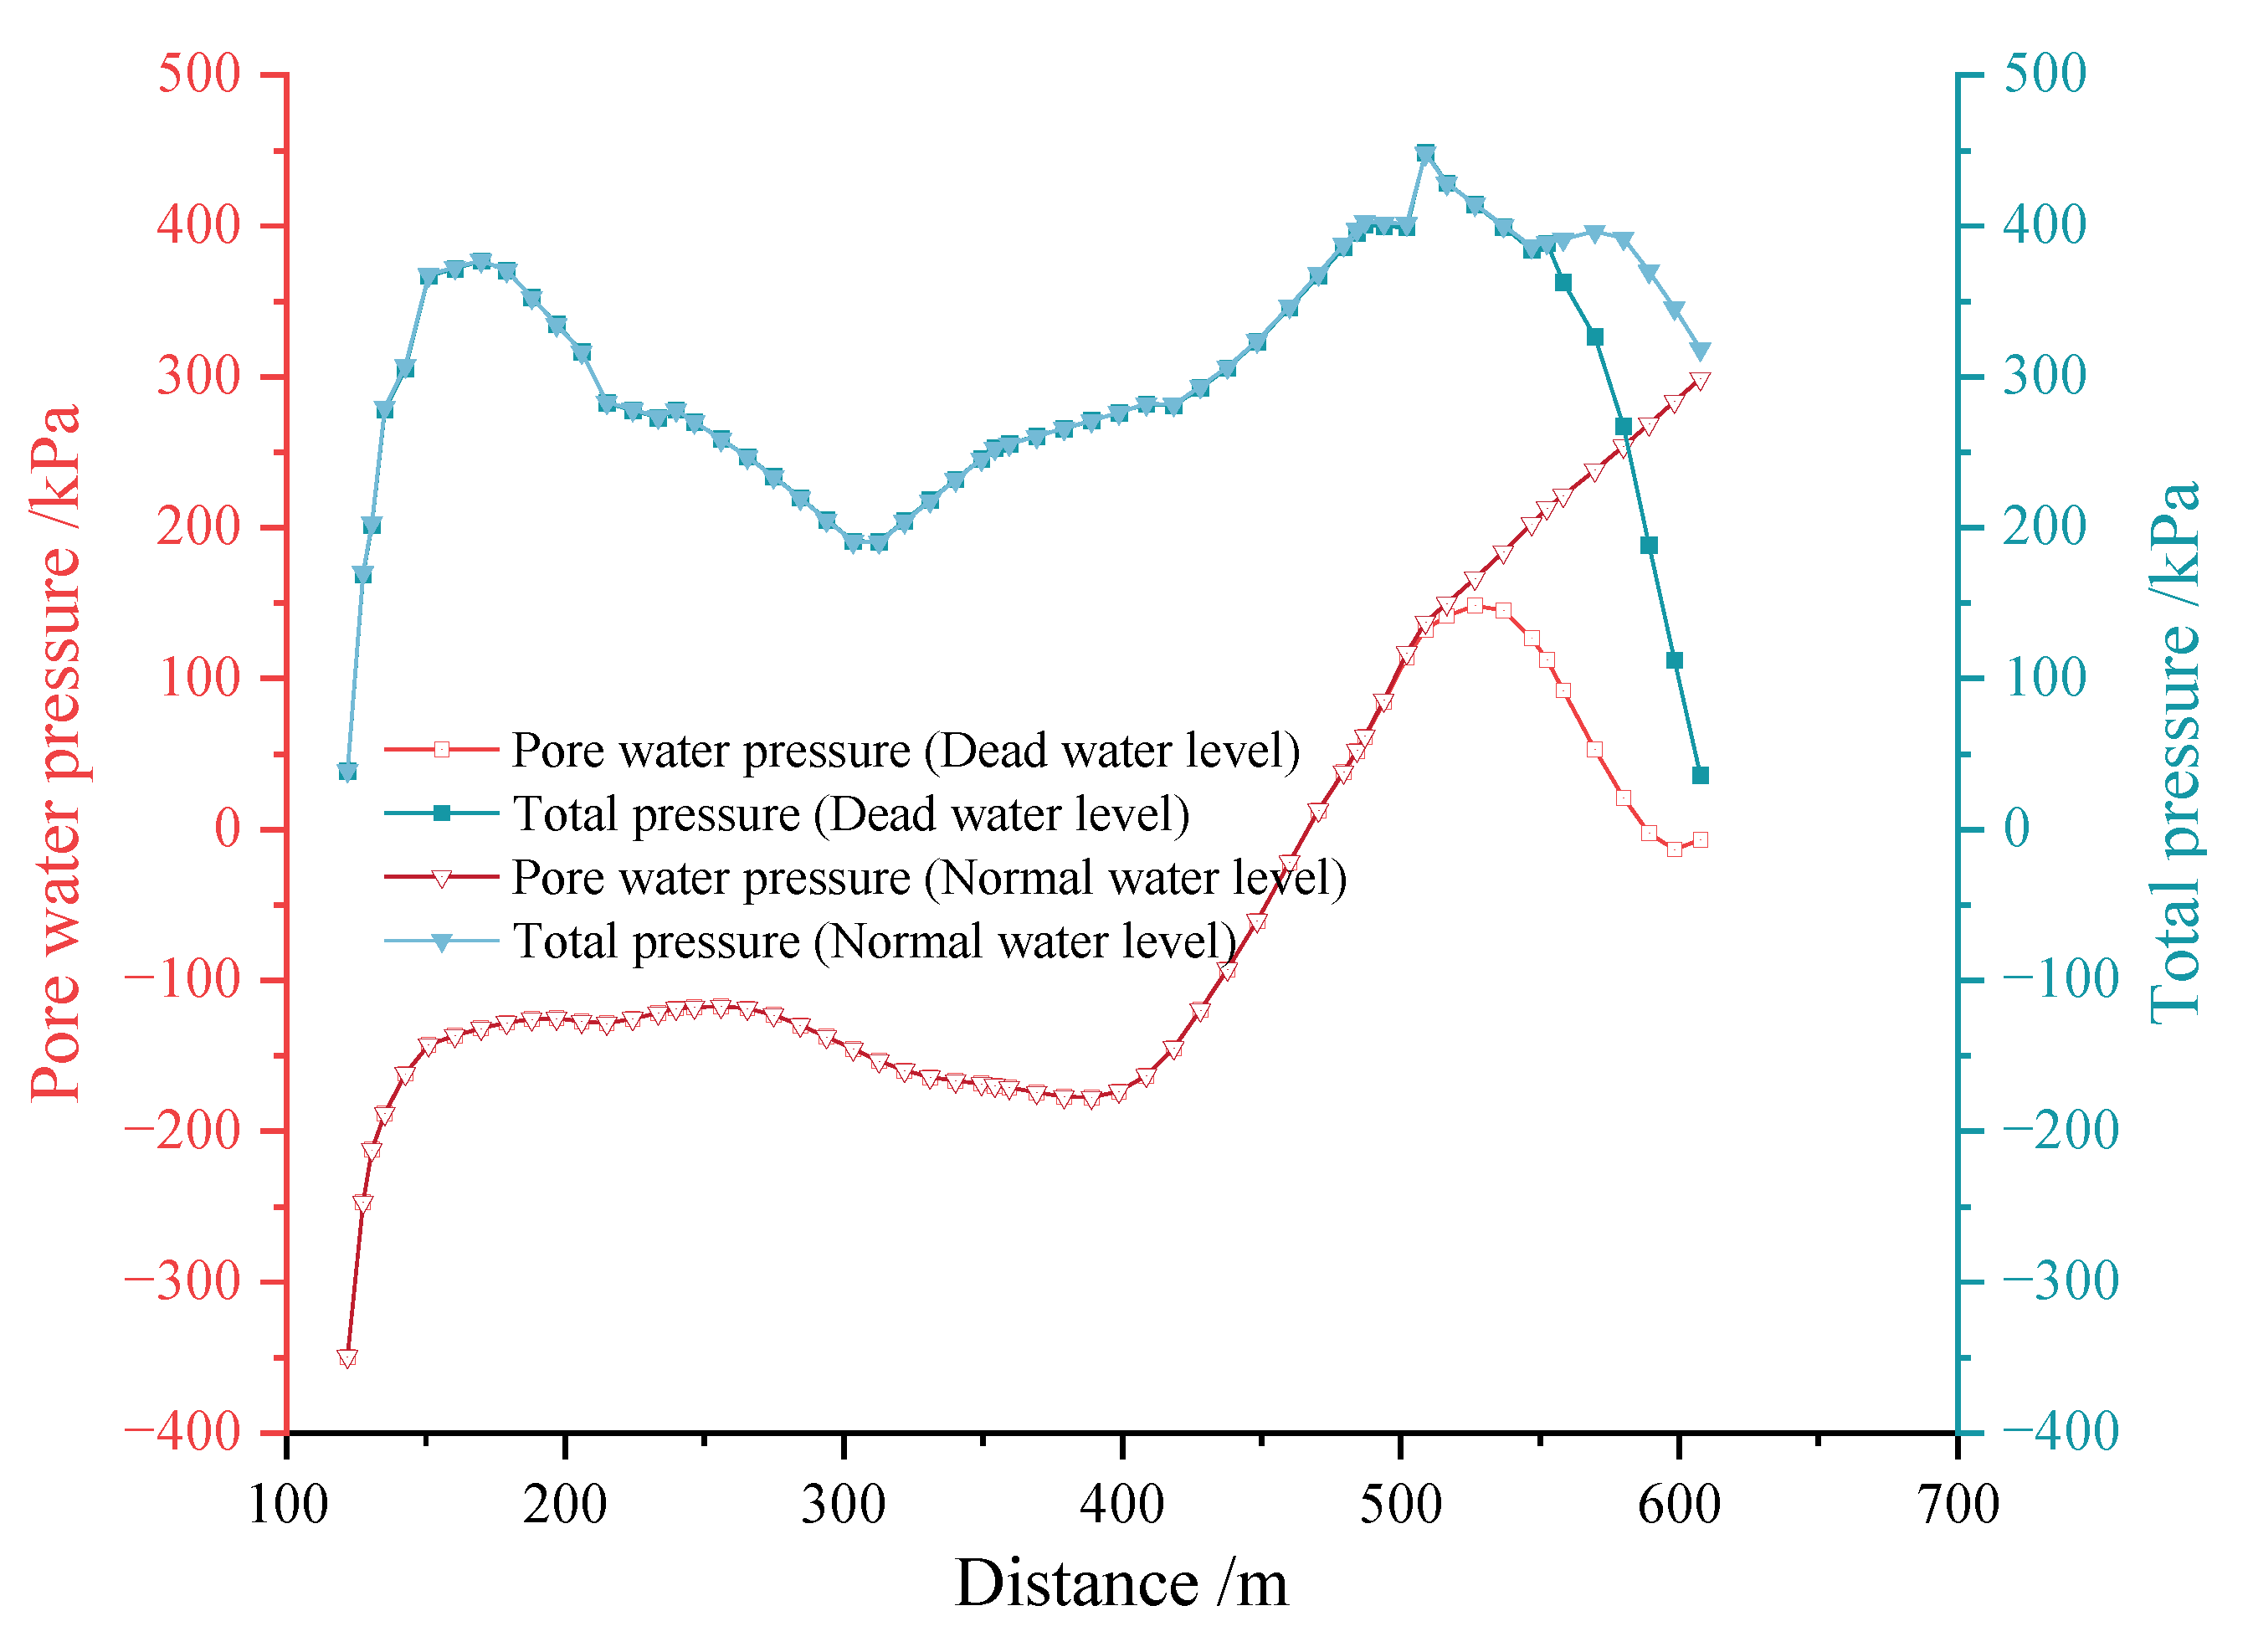
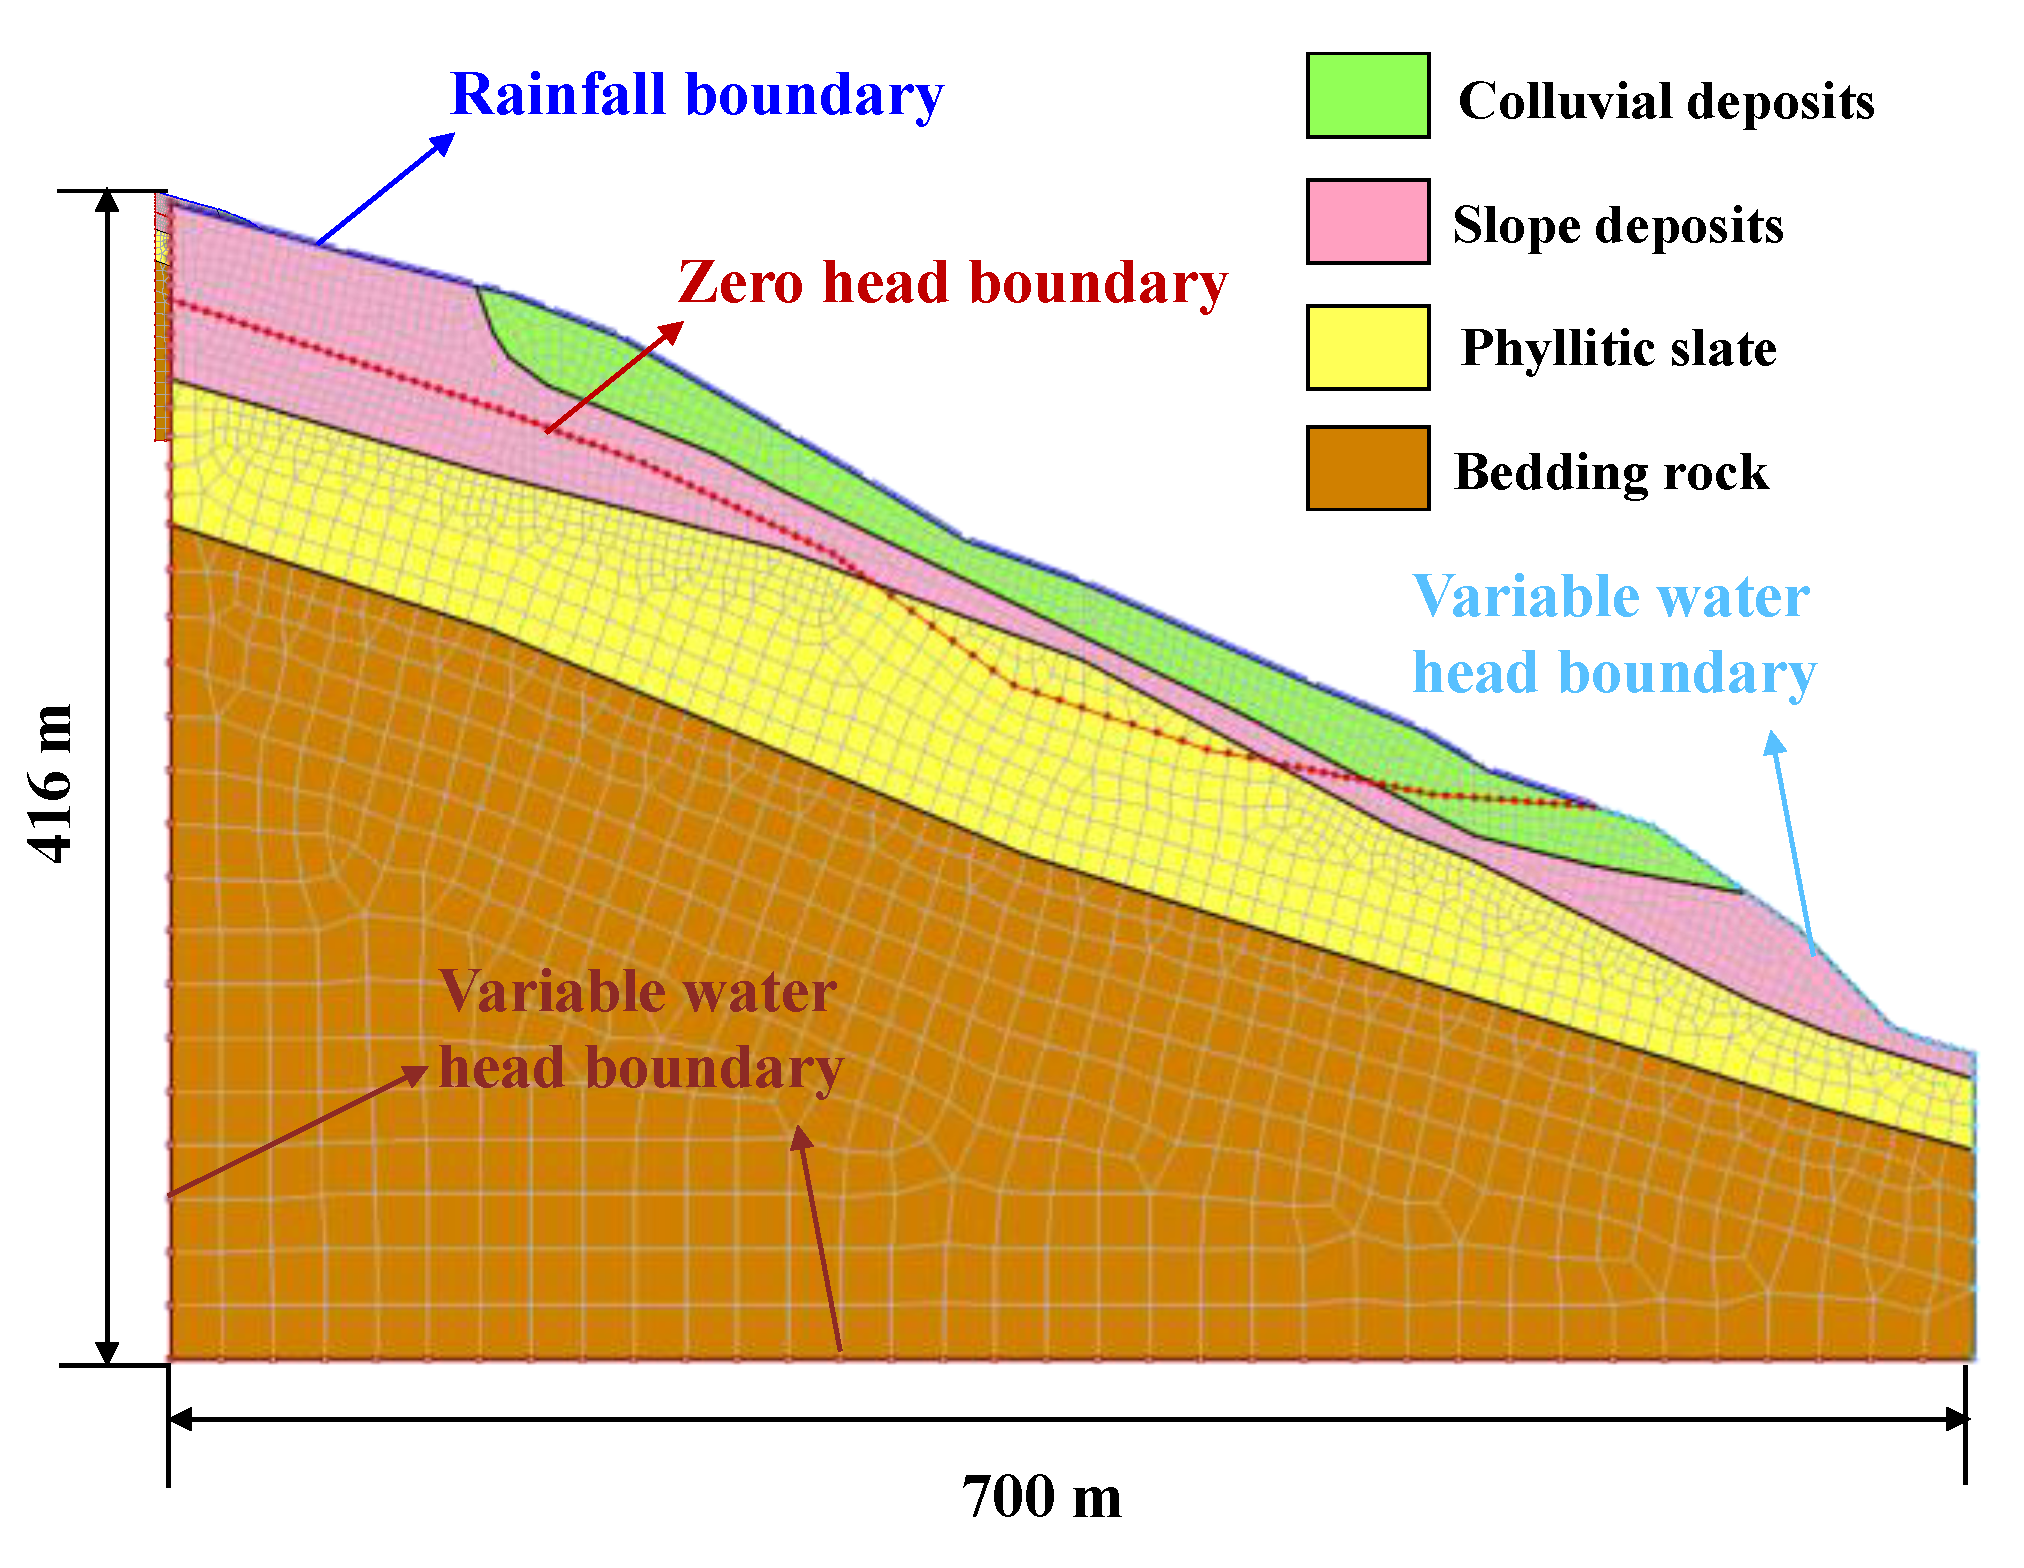
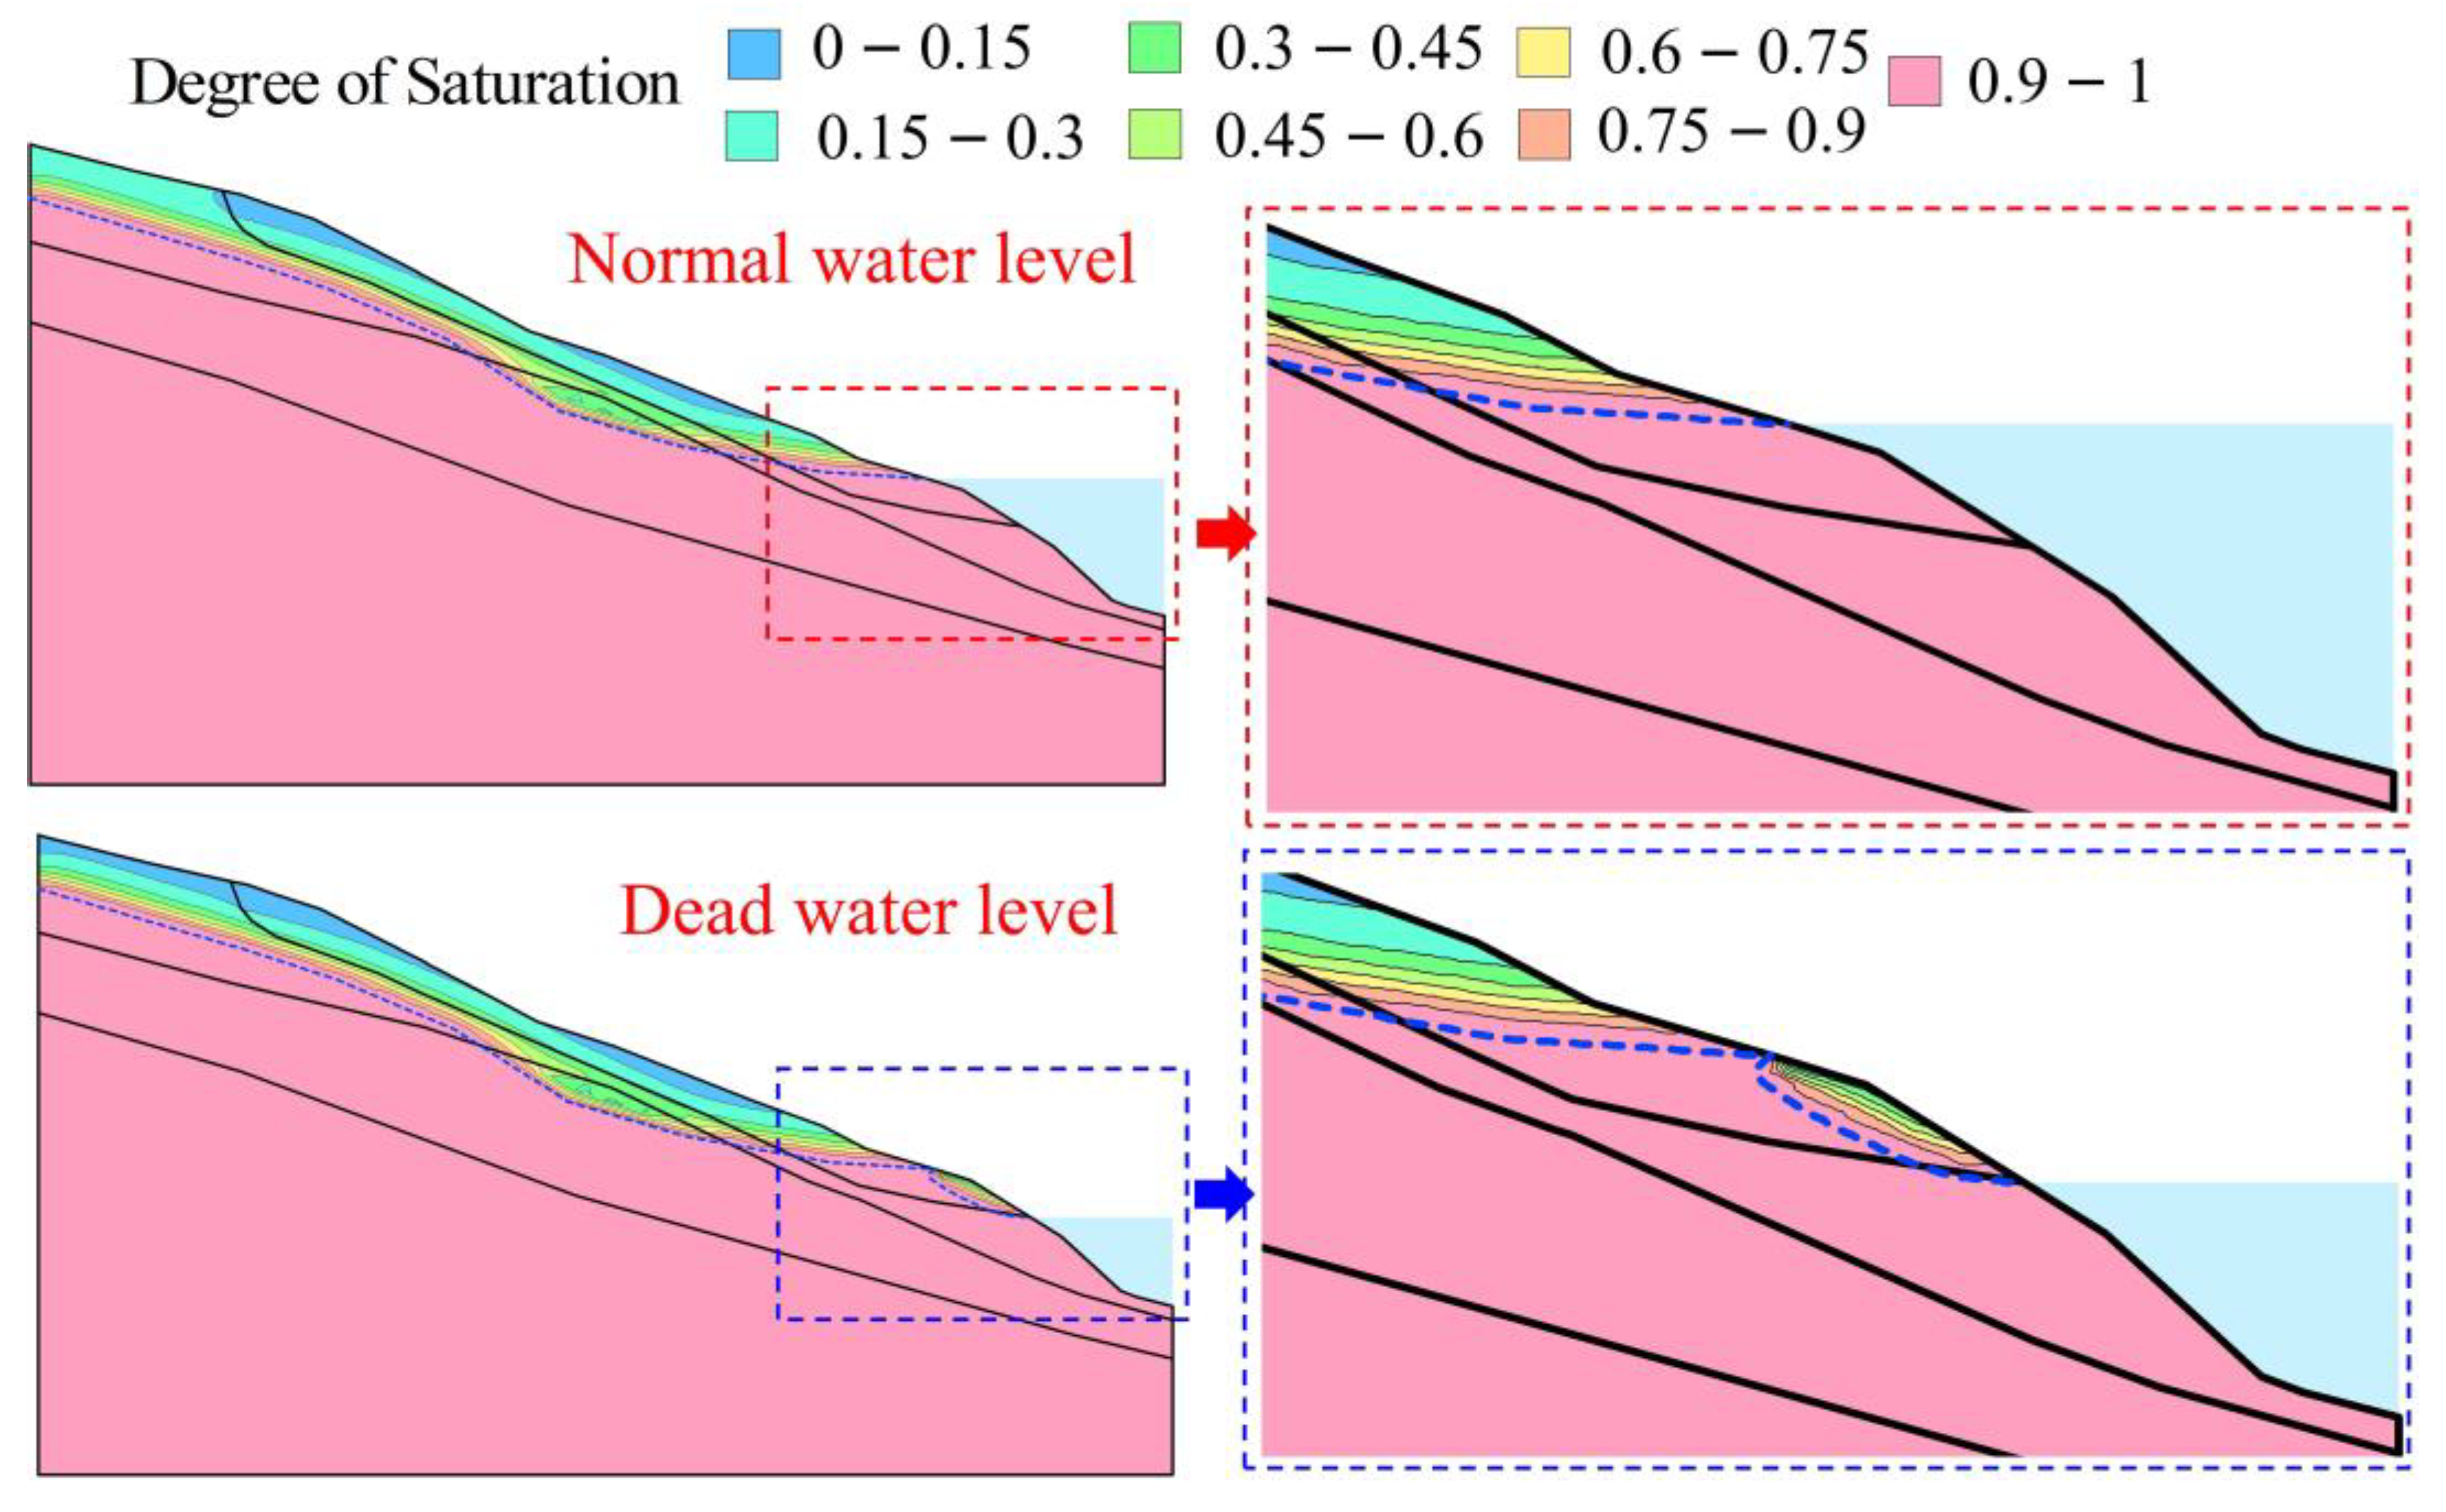
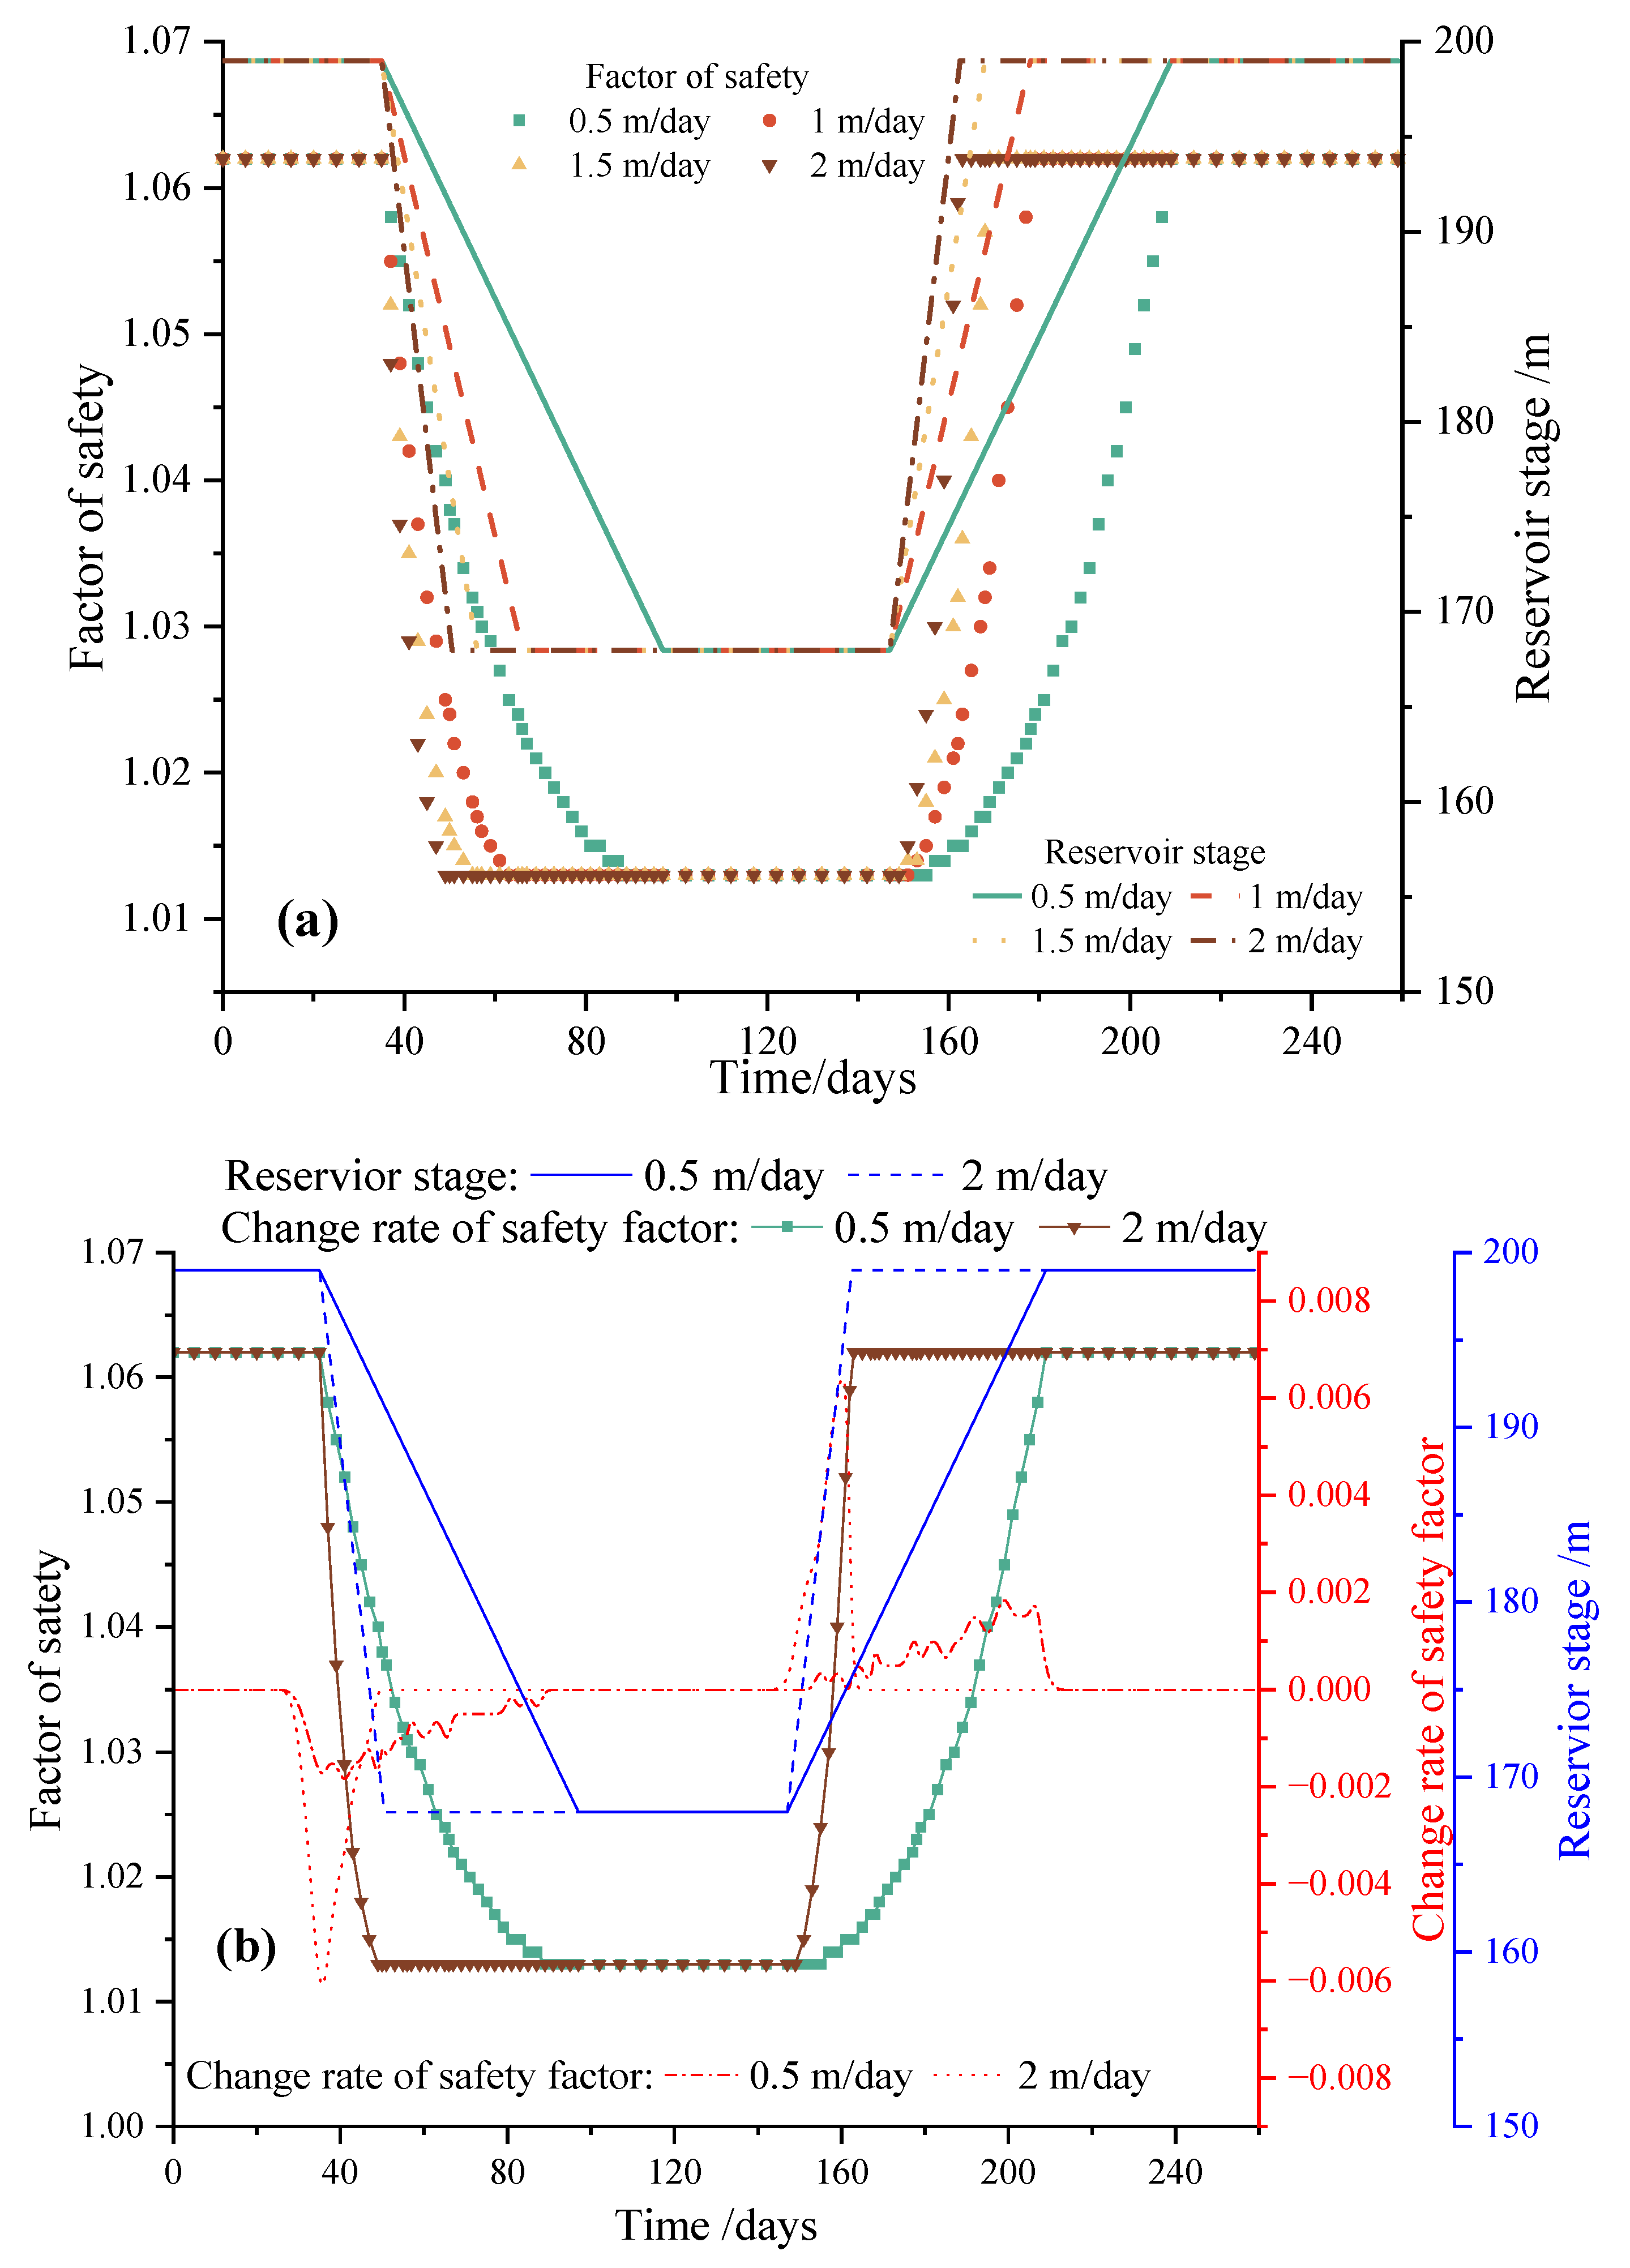
3.5. Stability Analysis of the Landslide
4. Result
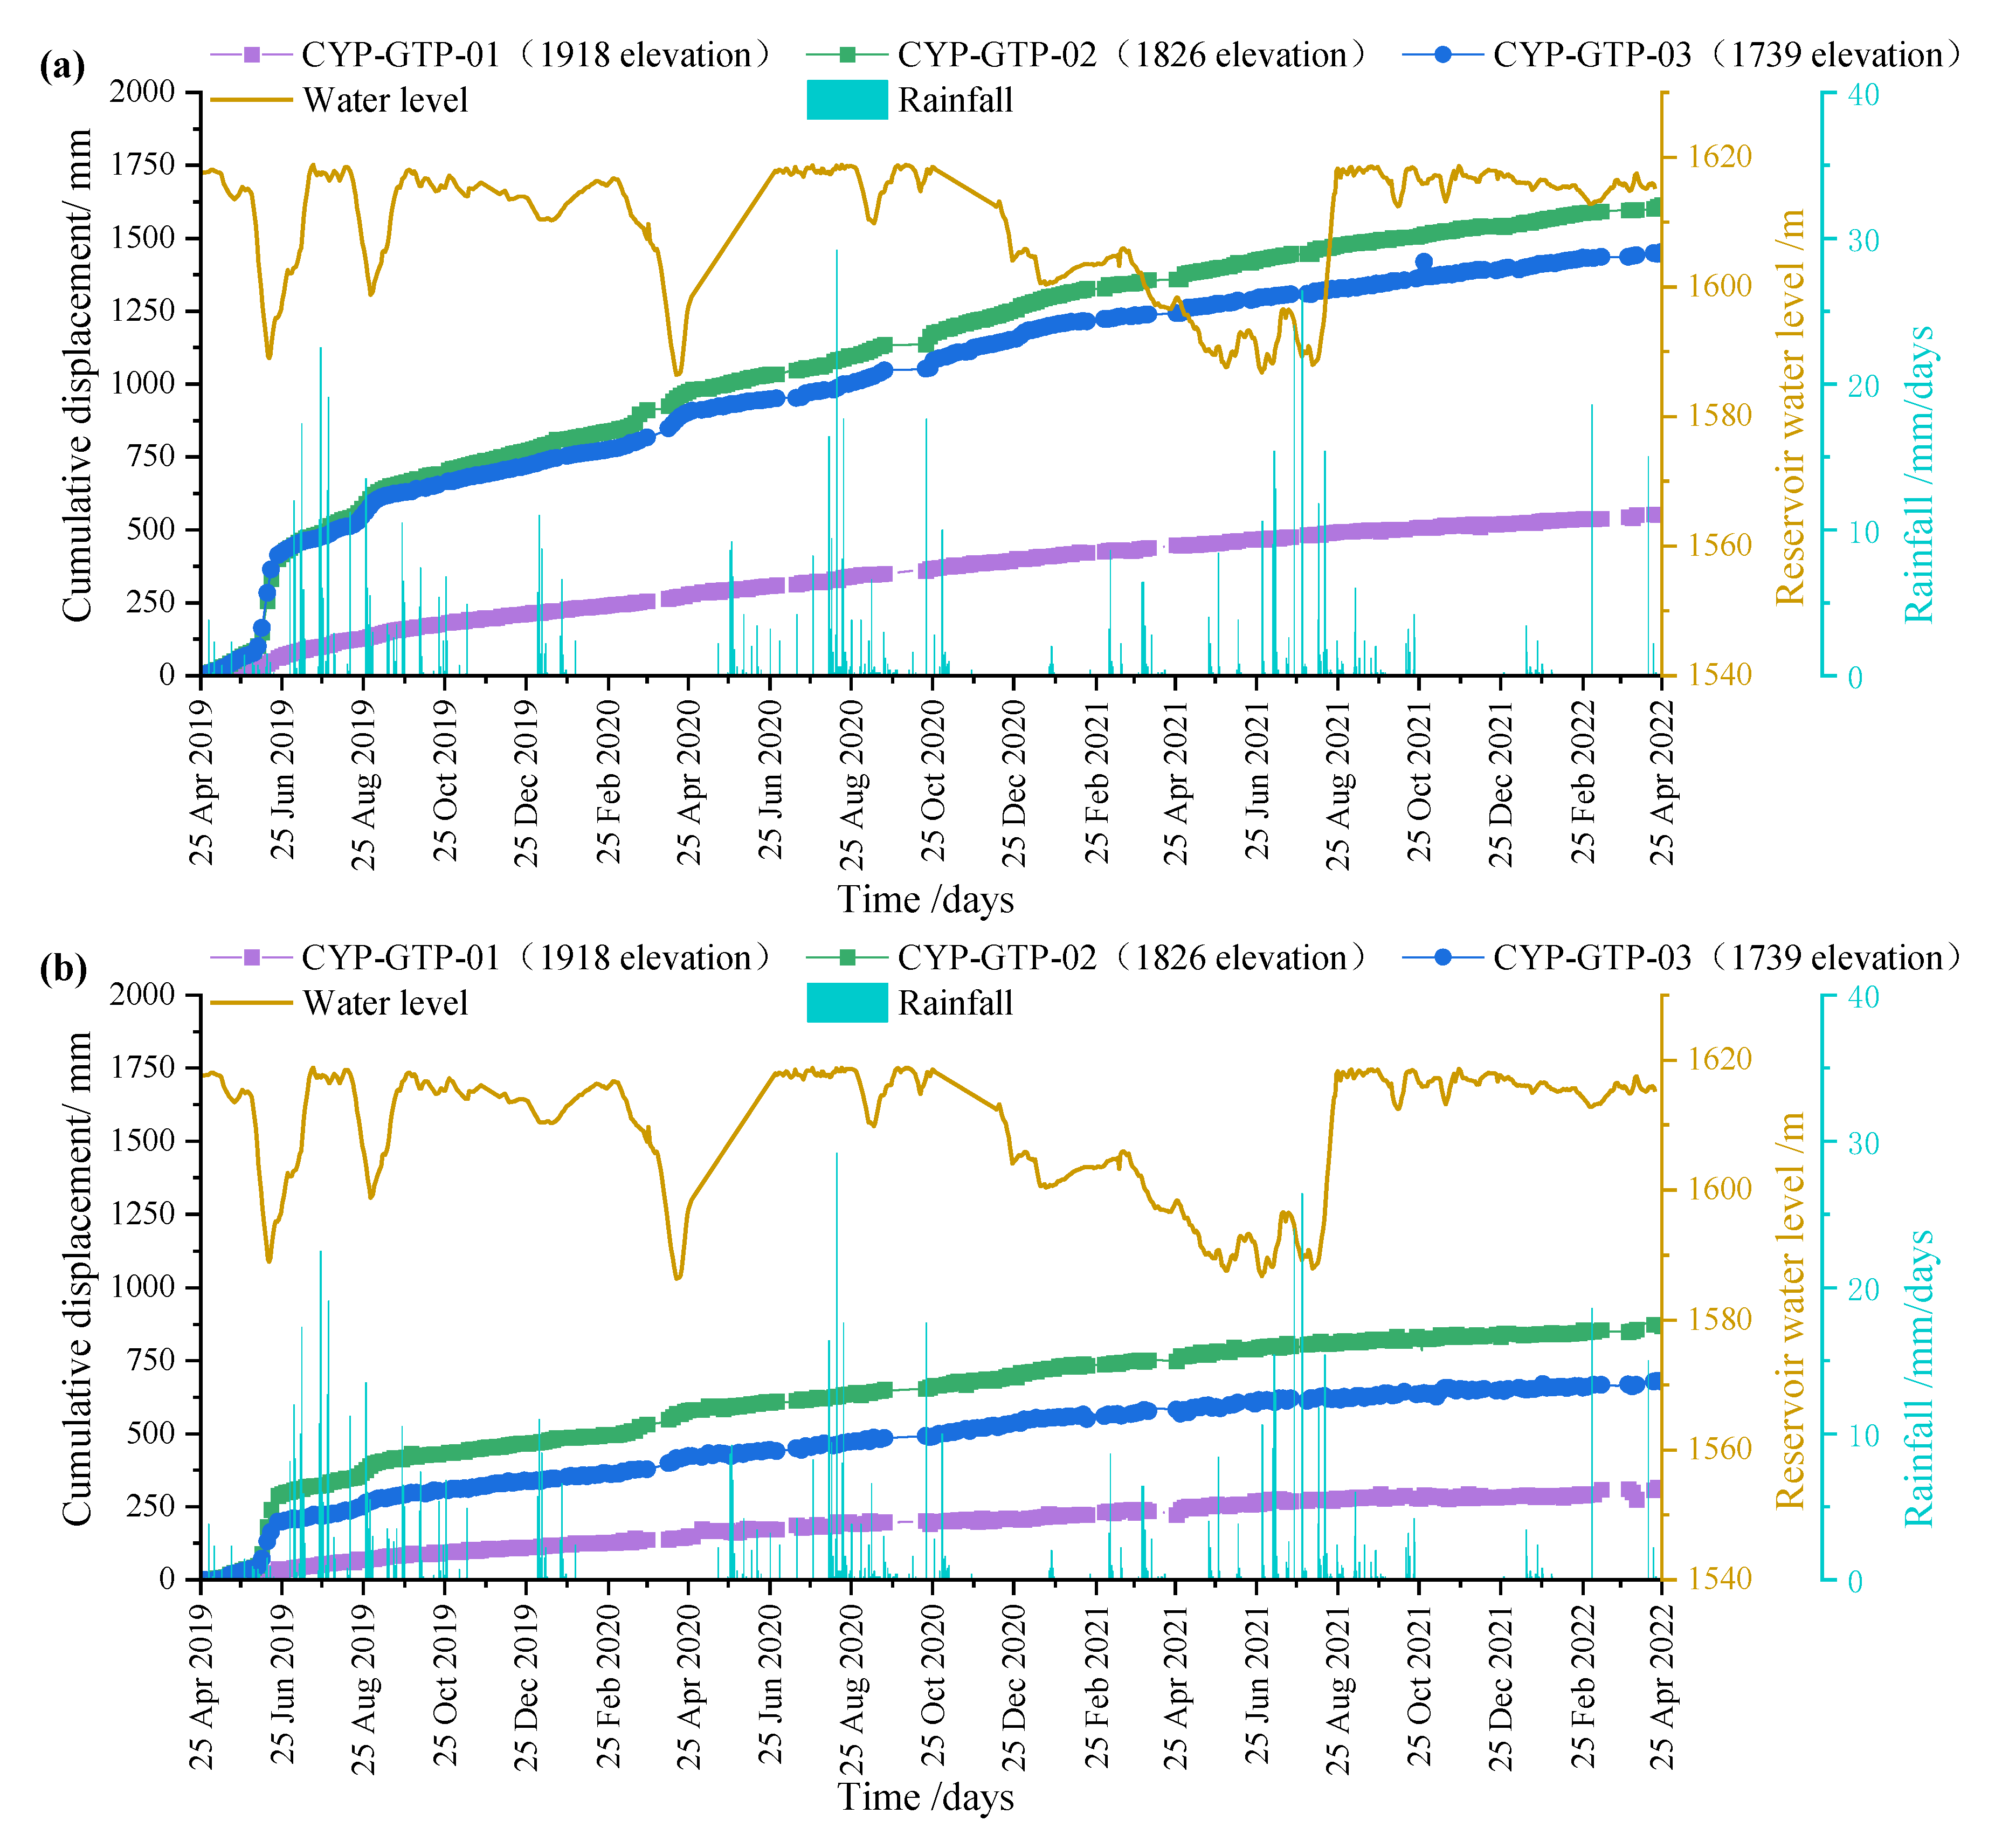
4.1. GNSS-Based Monitoring Data
4.2. Results of Underground Deformation Characterization
4.3. Correlation between Water-Level Fluctuations and the Reactivation
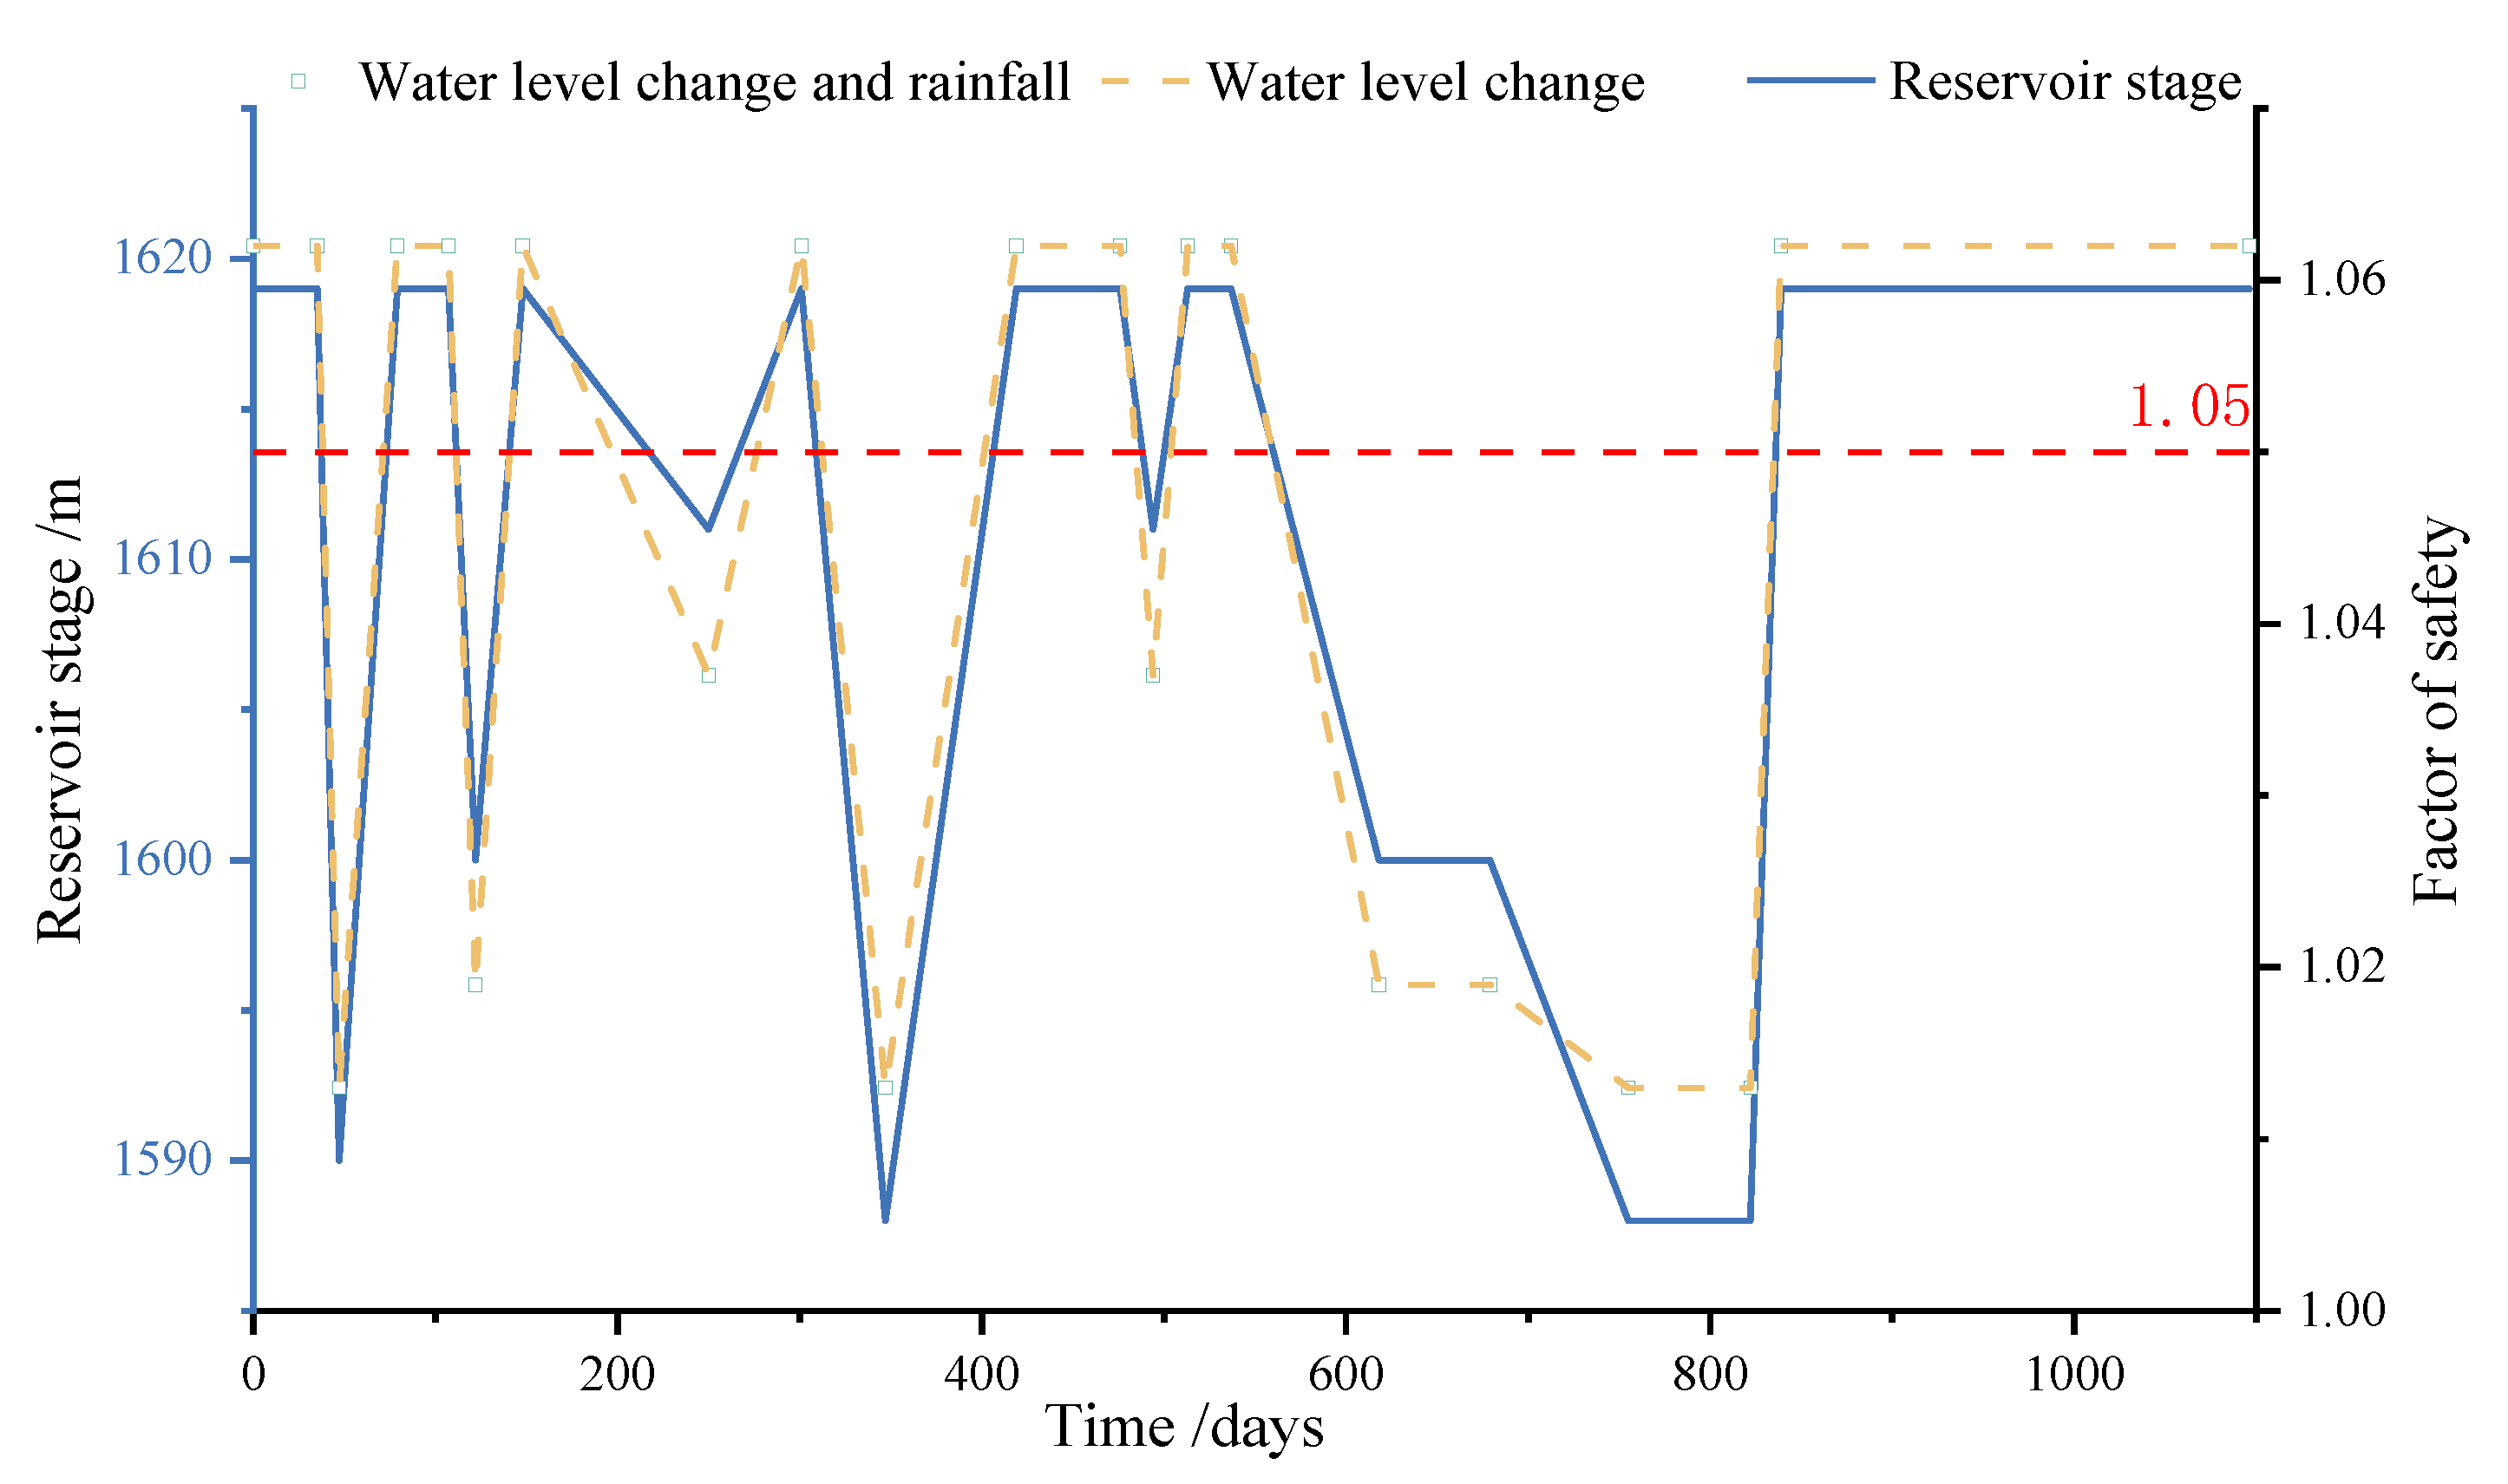
4.4. Stability of the Landslide
5. Revival Mechanism
5.1. Causes of Ancient Landslide Revival
5.2. Characteristics of Ancient Landslide Reactivation and Destruction
6. Conclusions
Author Contributions
Funding
Institutional Review Board Statement
Informed Consent Statement
Data Availability Statement
Conflicts of Interest
References
- GB T 32864–2016; Code for Geological Investigation of Landslide Prevention. China Standardization Press: Beijing, China, 2016.
- Nilsen, T.H.; Turner, B.L. Influence of Rainfall and Ancient Landslide Deposits on Recent Landslides (1950–71) in Urban Areas of Contra Costa County, California; U.S. Government Printing Office: Sacramento, CA, USA, 1975.
- Di Maio, C.; Vassallo, R.; Vallario, M.; Pascale, S.; Sdao, F. Structure and kinematics of a landslide in a complex clayey formation of the Italian Southern Apennines. Eng. Geol. 2010, 116, 311–322. [Google Scholar] [CrossRef]
- Dykes, A.P.; Bromhead, E.N. The Vaiont landslide: Re-assessment of the evidence leads to rejection of the consensus. Landslides 2018, 15, 1815–1832. [Google Scholar] [CrossRef]
- Polemio, M.; Sdao, F. The role of rainfall in the landslide hazard: The case of the Avigliano urban area (Southern Apennines, Italy). Eng. Geol. 1999, 53, 297–309. [Google Scholar] [CrossRef]
- Voight, B.; Faust, C. Frictional heat and strength loss in some rapid landslides: Error correction and affirmation of mechanism for the Vaiont landslide. Geotechnique 1992, 42, 641–643. [Google Scholar] [CrossRef]
- Superchi, L.; Floris, M.; Ghirotti, M.; Genevois, R.; Jaboyedoff, M.; Stead, D. Implementation of a geodatabase of published and unpublished data on the catastrophic Vaiont landslide. Nat. Hazards Earth Syst. Sci. 2010, 10, 865–873. [Google Scholar] [CrossRef]
- Del Ventisette, C.; Gigli, G.; Bonini, M.; Corti, G.; Montanari, D.; Santoro, S.; Sani, F.; Fanti, R.; Casagli, N. Insights from analogue modelling into the deformation mechanism of the Vaiont landslide. Geomorphology 2015, 228, 52–59. [Google Scholar] [CrossRef]
- Zhu, D. Revival Mechanism and Deformation Prediction of Typical Accumulative Landslide in the Three Gorges Reservoir. Master’s Thesis, China University of Geoscience, Wuhan, China, 2010. [Google Scholar]
- Tang, H.; Wasowski, J.; Juang, C.H. Geohazards in the three Gorges Reservoir Area, China–Lessons learned from decades of research. Eng. Geol. 2019, 261, 105267. [Google Scholar] [CrossRef]
- Yin, Y.-p.; Huang, B.; Chen, X.; Liu, G.; Wang, S. Numerical analysis on wave generated by the Qianjiangping landslide in Three Gorges Reservoir, China. Landslides 2015, 12, 355–364. [Google Scholar] [CrossRef]
- Wang, J.; Wang, S.; Su, A.; Xiang, W.; Xiong, C.; Blum, P. Simulating landslide-induced tsunamis in the Yangtze River at the Three Gorges in China. Acta Geotech. 2021, 16, 2487–2503. [Google Scholar] [CrossRef]
- Dong, Y.; Liao, Z.; Wang, J.; Liu, Q.; Cui, L. Potential failure patterns of a large landslide complex in the Three Gorges Reservoir area. Bull. Eng. Geol. Environ. 2023, 82, 41. [Google Scholar] [CrossRef]
- Jia, C.; Chen, F.; Zhang, Q.; GU, J.; Hu, J.; Chen, H.; Cheng, W. Centrifuge modeling and numerical analysis of reservoir bank landslides triggered by a fast two-step drop in water level. Bull. Eng. Geol. Environ. 2023, 82, 465. [Google Scholar] [CrossRef]
- Rana, N.M.; Ghahramani, N.; Evans, S.G.; Small, A.; Skermer, N.; McDougall, S.; Take, W.A. Global magnitude-frequency statistics of the failures and impacts of large water-retention dams and mine tailings impoundments. Earth-Sci. Rev. 2022, 232, 104144. [Google Scholar] [CrossRef]
- Wang, L.; Zhang, Z.; Huang, B.; Hu, M.; Zhang, C. Triggering mechanism and possible evolution process of the ancient Qingshi landslide in the Three Gorges Reservoir. Geomat. Nat. Hazards Risk 2021, 12, 3160–3174. [Google Scholar] [CrossRef]
- Huang, B.; Yin, Y.; Tan, J. Risk assessment for landslide-induced impulse waves in the Three Gorges Reservoir, China. Landslides 2019, 16, 585–596. [Google Scholar] [CrossRef]
- GB 50287–2016; Code for Hydropower Engineering Geological Investigation. China Standardization Press: Beijing, China, 2016.
- Rahadian, H.; Bandong, S.; Widyotriatmo, A.; Joelianto, E. Image encoding selection based on Pearson correlation coefficient for time series anomaly detection. Alex. Eng. J. 2023, 82, 304–322. [Google Scholar] [CrossRef]
- Gao, H.X.; Yin, K.L. Discuss on the correlations between landslides and rainfall and threshold for landslide early-warning and prediction. Rock Soil Mech. 2007, 28, 1055–1060. [Google Scholar]
- Van Aert, R.C.; Goos, C. A critical reflection on computing the sampling variance of the partial correlation coefficient. Res. Synth. Methods 2023, 14, 520–525. [Google Scholar] [CrossRef]
- Shang, M.; Liao, F.; Ma, R.; Liu, Y. Quantitative correlation analysis on deformation of Baijiabao landslide between rainfall and reservoir water leve. J. Eng. Geol. 2021, 29, 9. [Google Scholar]
- Fredlund, D.G.; Xing, A.; Fredlund, M.; Barbour, S. The relationship of the unsaturated soil shear strength to the soil-water characteristic curve. Can. Geotech. J. 1996, 33, 440–448. [Google Scholar] [CrossRef]
- Chen, M.L.; Lv, P.F.; Zhang, S.L.; Chen, X.Z.; Zhou, J.W. Time evolution and spatial accumulation of progressive failure for Xinhua slope in the Dagangshan reservoir, Southwest China. Landslides 2018, 15, 565–580. [Google Scholar] [CrossRef]
- Zhou, J.-w.; Lu, P.-y.; Yang, Y.-c. Reservoir landslides and its hazard effects for the hydropower station: A case study. In Advancing Culture of Living with Landslides: Volume 2 Advances in Landslide Science; Springer: Berlin/Heidelberg, Germany, 2017; pp. 699–706. [Google Scholar]
- Jiang, J.-w.; Xiang, W.; Rohn, J.; Zeng, W.; Schleier, M. Research on water–rock (soil) interaction by dynamic tracing method for Huangtupo landslide, Three Gorges Reservoir, PR China. Environ. Earth Sci. 2015, 74, 557–571. [Google Scholar] [CrossRef]
- Belew, A.Z.; Tenagashaw, D.Y.; Ayele, W.T.; Andualem, T.G. Coupled analysis of seepage and slope stability: A case study of ribb embankment dam, Ethiopia. Water Conserv. Sci. Eng. 2022, 7, 293–314. [Google Scholar] [CrossRef]
- Zhou, J.; Chen, M.; Li, H.; Xu, N.; Xiao, M.; Yang, X.; Sun, H.; QI, S. Formation and Movement Mechanisms of Water-Induced Landslides and Hazard Prevention And Mitigation Techologies. J. Eng. Geol. 2019, 27, 1131–1145. [Google Scholar]
- Xiang, J.; Tang, H. Failure Mechanism Study for Fairy-River Shore Slope in the Three Gorges Reservoir Caused by Water-Impoundment. J. Chongoing Jiaotong Univ. (Nat. Sci.) 2011, 30 (Suppl. S1), 700–704. [Google Scholar]
- Chen, C.; Yang, J.; Liu, Z. Mechanism of Reservoir Bank Deformation and Failure in Jinping I Hydropower Project after Impoundment. Chin. J. Undergr. Space Eng. 2019, 15, 622–628. [Google Scholar]
- Pajalić, S.; Peranić, J.; Maksimović, S.; Čeh, N.; Jagodnik, V.; Arbanas, Ž. Monitoring and Data Analysis in Small-Scale Landslide Physical Model. Appl. Sci. 2021, 11, 5040. [Google Scholar] [CrossRef]
- Zhang, Z.; Zeng, R.; Meng, X.; Zhao, S.; Wang, S.; Ma, J.; Wang, H. Effects of changes in soil properties caused by progressive infiltration of rainwater on rainfall-induced landslides. Catena 2023, 233, 107475. [Google Scholar] [CrossRef]
- Zhang, Y.; Wu, R.; Ren, S. Influence of rainfall preponderance infiltration path on reactivation of ancient landslides. Chin. J. Rock Mech. Eng. 2021, 40, 777–789. [Google Scholar]
- Li, S.; Xu, Q.; Tang, M.; Zhu, D. Study on Spatial Distribution and Key Influencing Factors of Landslides in Three Gorges Reservoir Area. Earth Sci. 2020, 45, 341–354. [Google Scholar]
- Zhang, C.; Yin, Y.; Dai, Z.; Huang, B.; Zhang, Z.; Jiang, X.; Tan, W.; Wang, L. Reactivation mechanism of a large-scale ancient landslide. Landslides 2021, 18, 397–407. [Google Scholar] [CrossRef]
- Yang, H.; Song, K.; Chen, L.; Qu, L. Hysteresis effect and seasonal step-like creep deformation of the Jiuxianping landslide in the Three Gorges Reservoir region. Eng. Geol. 2023, 317, 107089. [Google Scholar] [CrossRef]
- Zhang, C.; Yin, Y.; Yan, H.; Li, H.; Dai, Z.; Zhang, N. Reactivation characteristics and hydrological inducing factors of a massive ancient landslide in the three Gorges Reservoir, China. Eng. Geol. 2021, 292, 106273. [Google Scholar] [CrossRef]


| Materials | Porosity (%) | Water Content (%) | Natural | Saturated | Cohesion (kPa) | Frictional Angle (°) | Saturated | |
|---|---|---|---|---|---|---|---|---|
| Unit Weight (kN/m3) | Cohesion (kPa) | Frictional Angle (°) | ||||||
| Sliding body | 12 | 12.7 | 19 | 20 | 16 | 24 | 15 | 23 |
| Slip belt | 14 | 13 | 18 | 19 | 23 | 25 | 21 | 23 |
| Bedding rock | 8 | 9 | 25 | 26 | 650 | 41 | 550 | 39 |
| No. | ID | Elevation (m) | Location | Date | Strike | Length (m) | Width (cm) | Dislocation (cm) | Crack Type |
|---|---|---|---|---|---|---|---|---|---|
| LF1 | CYP04 | 1807 | Small village upstream Below the road | June 2019 | N30° W | 120 | 5 | 0.3 | Tensile |
| CYP05 | 1804 | N35° E | 21 | 10 | Tensile | ||||
| CYP06 | 1800 | N5° E | 16 | 9 | Tensile | ||||
| LF2 | CYP08 | 1807 | Road foundation | June 2019 | N50° E | 95 | 2.5 | 1.5 | Tensile |
| CYP30 | 1807 | N14° E | 3 | 0.75 | Tensile | ||||
| LF3 | CYP09 | 1800 | Below the road | June 2019 | N50° E | 120 | 20 | 1.5 | Tensile |
| LF4 | CYP10 | 1795 | H1-3 trailing edge | June 2019 | N56° E | 360 | 25 | 5 | Tensile |
| CYP11 | 1785 | N5° W | 1.5 | 0.75 | Tensile | ||||
| CYP16 | 1773 | N56° E | 50 | 70 | Tensile | ||||
| CYP17 | 1759 | N59° E | 40 | 40 | Tensile | ||||
| LF5 | CYP12 | 1779 | H1-3 trailing edge | June 2019 | N21° E | 90 | 12 | 3.5 | Tensile |
| CYP13 | 1774 | N40° E | 9 | 15 | Tensile | ||||
| CYP14 | 1768 | N15° E | 4 | 2.5 | Tensile | ||||
| LF6 | CYP15 | 1768 | H1-3 trailing edge | June 2019 | N13° E | 40 | 30 | 7.5 | Tensile |
| LF7 | CYP18 | 1750 | H1-3 trailing edge | April 2020 | N30° E | 50 | 11 | 2.5 | Tensile |
| LF8 | CYP25 | 1674 | H1-3 middle part | June 2019 | NW | 195 | 6 | 1.5 | Tensile |
| CYP26 | 1684 | SN | 60 | 20 | Tensile | ||||
| CYP27 | 1693 | N6° W | 30 | 50 | Tensile | ||||
| CYP28 | 1694 | N34° E | 40 | 20 | Tensile | ||||
| LF9 | CYP19 | 1679 | H1-3 front edge | June 2019 | N50° W | 50 | 3 | 1.5 | Tensile |
| LF10 | CYP24 | 1657 | H1-3 front edge | June 2019 | N14° E | 40 | 25 | 1.5 | Tensile |
| LF11 | CYP20 | 1683 | N10° W | 80 | 10 | 1.5 | Tensile | ||
| CYP21 | 1688 | N70° W | 1.5 | 2 | Tensile | ||||
| LF12 | CYP22 | 1676 | H1-3 front edge | June 2019 | N45° W | 50 | 10 | 2 | Tensile |
| LF13 | CYP23 | 1656 | H1-3 front edge | June 2019 | N39° W | 450 | 3.5 | 1.5 | Tensile |
| LF14 | CYP31 | 1805 | Retaining wall of road | April 2020 | N46° E | 25 | 7.5 | 2 | Tensile |
| LF15 | CYP32 | 1807 | Road surface | April 2020 | N30° E | 70 | 23 | 7.5 | Tensile |
| LF21 | - | 2278 | H1 trailing edge | April 2020 | SN | 30 | 15 | 20 | Tensile |
| LF22 | - | 2256 | H1 side edge | 1992 | N74° W | 40 | 10 | 5 | Shear |
| LF24 | - | 2240 | H1 side edge | 1992 | N58° E | 50 | 5 | 1.5 | Shear |
| LF26 | - | 2113 | H1 side edge | 1956 | - | 70 | 35 | 35 | Shear |
| LF27 | - | 2080 | H1 side edge | 1956 | - | 90 | 20 | 100 | Shear |
| Materials | Permeability Coefficient (m/s) | Unit Weight (kN/m3) | Cohesion (kPa) | Frictional Angle (°) | Saturated Volumetric Moisture Content |
|---|---|---|---|---|---|
| Colluvial deposits | 7.0 × 10⁻⁵ | 18 | 16 | 22 | 0.26 |
| Landslide deposits | 8.98 × 10⁻⁵ | 19 | 23 | 25 | 0.21 |
| Phyllitic slate | 1.16 × 10⁻⁵ | 20 | 30 | 27 | 0.10 |
| Bedding rock | 5.79 × 10⁻⁷ | 25 | 650 | 41 | 0.05 |
| Stages (Reservoir Water Level) | Time | Change in Reservoir Water Level (m) |
|---|---|---|
| Fluctuating | 25 April 2019–30 May 2019 | 1617–1615 |
| Descending | 2 June 2019–19 June 2019 | 1614–1589 |
| Ascending | 19 June 2019–18 July 2019 | 1589–1618 |
| Fluctuating | 19 July 2019–13 August 2019 | 1618 |
| Descending | 14 August 2019–30 August 2019 | 1617–1598 |
| Ascending | 31 August 2019–28 September 2019 | 1598–1618 |
| Fluctuating | 29 September 2019–16 January 2020 | 1618–1610 |
| Ascending | 17 January 2020–29 February 2020 | 1610–1616 |
| Descending | 1 March 2020–15 April 2020 | 1616–1586 |
| Ascending | 17 April 2020–29 June 2020 | 1586–1617 |
| Fluctuating | 30 June 2020–28 August 2020 | 1617–1618 |
| Scheme | Time | Pearson Correlation Coefficients between Landslide Cumulative Displacement and Reservoir Water Level | ||
|---|---|---|---|---|
| CYP-GTP-01 | CYP-GTP-02 | CYP-GTP-03 | ||
| Fluctuating | 25 April 2019–30 May 2019 | 0.0289 | −0.02736 | −0.0480 |
| Descending | 2 June 2019–19 June 2019 | −0.7185 | −0.5056 | 0.0574 |
| Ascending | 19 June 2019–18 July 2019 | −0.0614 | −0.2178 | −0.3409 |
| Fluctuating | 19 July 2019–13 August 2019 | 0.0320 | 0.0616 | 0.2167 |
| Descending | 14 August 2019–30 August 2019 | −0.1932 | −0.7105 | −0.6748 |
| Ascending | 31 August 2019–28 September 2019 | 0.2430 | −0.0899 | 0.0433 |
| Fluctuating | 29 September 2019–16 January 2020 | 0.03529 | −0.06132 | 0.0386 |
| Ascending | 17 January 2020–29 February 2020 | 0.1039 | −0.1146 | 0.0318 |
| Descending | 1 March 2020–15 April 2020 | −0.7891 | 0.2331 | −0.8977 |
| Ascending | 17 April 2020–29 June 2020 | 0.0567 | 0.1740 | 0.2039 |
| Fluctuating | 30 June 2020–28 August 2020 | 0.1524 | 0.1410 | −0.2441 |
| Stages (Reservoir Water Level) | Time | Net Correlation Coefficients between Landslide Cumulative Displacement and Reservoir Water Level | ||
|---|---|---|---|---|
| GTP-01 | GTP-02 | GTP-03 | ||
| Fluctuating | 25 April 2019–30 May 2019 | 0.0386 | −0.0279 | −0.0513 |
| Descending | 2 June 2019–19 June 2019 | −0.7085 | −0.5015 | 0.0578 |
| Ascending | 19 June 2019–18 July 2019 | −0.0900 | −0.1983 | −0.3195 |
| Fluctuating | 19 July 2019–13 August 2019 | −0.0140 | 0.0926 | 0.2071 |
| Descending | 14 August 2019–30 August 2019 | −0.1918 | −0.7201 | −0.6813 |
| Ascending | 31 August 2019–28 September 2019 | 0.2411 | −0.0907 | 0.0370 |
| Fluctuating | 29 September 2019–16 January 2020 | 0.0303 | −0.0667 | 0.0319 |
| Ascending | 17 January 2020–29 February 2020 | 0.0652 | −0.0803 | −0.0222 |
| Descending | 1 March 2020–15 April 2020 | −0.9656 | −0.8039 | −0.8593 |
| Ascending | 17 April 2020–29 June 2020 | 0.0194 | 0.1793 | 0.2114 |
| Fluctuating | 30 June 2020–28 August 2020 | 0.1159 | 0.1217 | −0.2484 |
| Water Level Status | Groundwater + Reservoir Level | Groundwater + Reservoir Level + Rainfall |
|---|---|---|
| Normal water level | 1.062 | 1.062 |
| Dead water level | 1.048 | 1.048 |
Disclaimer/Publisher’s Note: The statements, opinions and data contained in all publications are solely those of the individual author(s) and contributor(s) and not of MDPI and/or the editor(s). MDPI and/or the editor(s) disclaim responsibility for any injury to people or property resulting from any ideas, methods, instructions or products referred to in the content. |
© 2024 by the authors. Licensee MDPI, Basel, Switzerland. This article is an open access article distributed under the terms and conditions of the Creative Commons Attribution (CC BY) license (https://creativecommons.org/licenses/by/4.0/).
Share and Cite
Dai, L.; Jia, C.; Chen, L.; Zhang, Q.; Chen, W. Development Characteristics and Reactivation Mechanism of a Large-Scale Ancient Landslide in Reservoir Area. Appl. Sci. 2024, 14, 3107. https://doi.org/10.3390/app14073107
Dai L, Jia C, Chen L, Zhang Q, Chen W. Development Characteristics and Reactivation Mechanism of a Large-Scale Ancient Landslide in Reservoir Area. Applied Sciences. 2024; 14(7):3107. https://doi.org/10.3390/app14073107
Chicago/Turabian StyleDai, Liang, Chaojun Jia, Lei Chen, Qiang Zhang, and Wei Chen. 2024. "Development Characteristics and Reactivation Mechanism of a Large-Scale Ancient Landslide in Reservoir Area" Applied Sciences 14, no. 7: 3107. https://doi.org/10.3390/app14073107