

High-Temperature Oxidation of the 304/6061 Welding–Brazing Joint and Its Effects on Corrosion Characteristics
1
Key Laboratory of Advanced Technologies of Materials, Ministry of Education, School of Materials Science and Engineering, Southwest Jiaotong University, Chengdu 610031, China
2
School of Aeronautical Manufacturing Industry, Chengdu Aeronautic Polytechnic, Chengdu 610100, China
*
Author to whom correspondence should be addressed.
Appl. Sci. 2024, 14(7), 3131; https://doi.org/10.3390/app14073131
Submission received: 22 March 2024
/
Revised: 2 April 2024
/
Accepted: 5 April 2024
/
Published: 8 April 2024
(This article belongs to the Special Issue Advances in High-Strength Materials Processing: Machining, Surface Integrity Management, and Operational Properties)
Abstract
:Laser–MIG hybrid welding–brazing was used to weld 304 stainless steel and 6061-T6 aluminum alloy with a thickness of 2 mm. The microstructure, morphology, chemical composition and corrosion behavior of the samples after high-temperature oxidation were investigated. The results reveal that the 304/6061 dissimilar joint had a thicker intermetallic compound layer (7–8 μm) during high-temperature oxidation (HTO) treatment than the sample without HTO treatment (2–3 μm). The oxide film thickness of the 6061 side of the weld joint treated by HTO (2401 nm) increased compared to the samples (181.1 nm) without HTO treatment. Unlike other metals treated by high-temperature oxidation, the high-temperature treatment process in this paper can reduce the corrosion resistance of the base metal and dissimilar joints, and the sequence of the corrosion current density was weld (HTO) >weld>6061 (HTO) >6061>304 (HTO) >304.
1. Introduction
Developing lightweight joints with fuel efficiency and light weight in the automobile industry, shipbuilding and transportation [1,2] has been widely researched, and dissimilar aluminum–steel materials are regarded among the lightweight joints. The different metals can undergo galvanic corrosion in the corrosion environment. In addition, the corrosiveness of the dissimilar metal weld joint at high temperature should be considered due to the influence of the high working temperature, such as in the aerospace and energy industries. Although some scholars [3,4,5,6] have studied the galvanic corrosion behavior of dissimilar aluminum–steel joints, the effect of high-temperature oxidation (HTO) treatment on the corrosion resistance of the aluminum–steel joints has not yet been reported.
In this work, laser–MIG (metal inert gas) hybrid welding–brazing [7,8] was chosen to weld aluminum and steel, which is one of the processes that can inhibit the growth of intermetallic compounds to obtain aluminum and steel joints. Then, the laser weld-brazed samples were cut into small samples and put into the heat treatment furnace for high-temperature oxidation treatment. The microstructure, chemical and corrosion behavior of the 304/6061 dissimilar metal welded joint with HTO treatment were investigated. The effect of high-temperature oxidation treatment on the microstructure, morphology and chemical constituents of the HTO film was examined by scanning electron microscopy (SEM) and energy-dispersive spectroscopy (EDS). The corrosion behavior was assessed by potentiodynamic polarization and electrochemical noise (EN). The current focus of work is on the adverse effects of HTO treatment on metal corrosion resistance, rather than enhancing corrosion resistance [9], which has received less attention in other studies. The authors believe that this study will contribute to providing a reference for the corrosion prevention scheme for 304/6061 joints in the future.
2. Materials and Methods
2.1. Materials
SUS304 stainless steel and 6061-T6 aluminum alloy (each 2 mm thick) sheets (hereinafter called 304 and 6061) were used as base materials, and ER4043 (Al-Si5) with a 1.2 mm diameter was utilized as the filler wire. The main chemical compositions of the base metals and filler wire are listed in Table 1.
2.2. Experimental Method
The base materials (size 100 × 100 × 2 mm) were welded by laser–MIG hybrid welding–brazing, and the welding parameters were as follows: laser power, 900 W; welding speed, 5 mm/s; wire feed rate, 4.5 m/min; and MIG voltage, 14.3 V. The shielding gas was high-purity argon (99.999%) with a flow of 25 L/min. Before welding, the plates needed to be polished to remove surface oil and stains. Then, Nocolok flux was dissolved in alcohol and evenly coated on the steel surface to a thickness of 0 to 0.3 mm.
After welding, the weld plates were cut into several small pieces 20 × 20 mm in size, and then the samples were polished to a mirror-like surface before the high-temperature oxidation treatment. The device used for high-temperature oxidation was an MFLGK 310-12 KL-120 type tubular muffle furnace, and the main parameters of the high-temperature oxidation (HTO) process, i.e., temperature and time, were 500 °C and 10 h, respectively. Then, the samples were cooled down to room temperature with the furnace.
Then, the surface and cross-sectional microstructure as well as the elemental composition were examined through scanning electron microscopy (SEM, Zeiss Sigma 300 brand, with a recorded signal of SE2 and accelerating voltage of 15 KV) equipped with an energy-dispersive spectrometer (EDS). The corrosion resistance of the specimens was evaluated by potentiodynamic polarization (approximately 20 °C) and electrochemical noise (approximately 30 °C) in NaCl solution (3.5% mass fraction, pH 6.5–7.2). A typical three-electrode cell system was used: a saturated calomel electrode (SCE, ESCE = 0.244 V) as the reference electrode, a platinum plate as the counter electrode and the specimen as the working electrode. The potentiodynamic polarization test (Zahner electrochemical workstation) was carried out at a potential sweep of 1 mV/s from −0.6 V to 0.2 V. The galvanic corrosion technique was chosen to record both potential and current versus time without any applied external signals. An SCE reference electrode and a pair of nominal identical samples with an exposure surface of 1 cm2 immersed in corrosive solution were used as the working electrode. Current and potential were recorded every 0.2 s for 72,000 s by an electrochemical workstation CS310. The anti-aliasing filter was set at 5 Hz.
3. Results
3.1. Microstructure of the Weld Joint
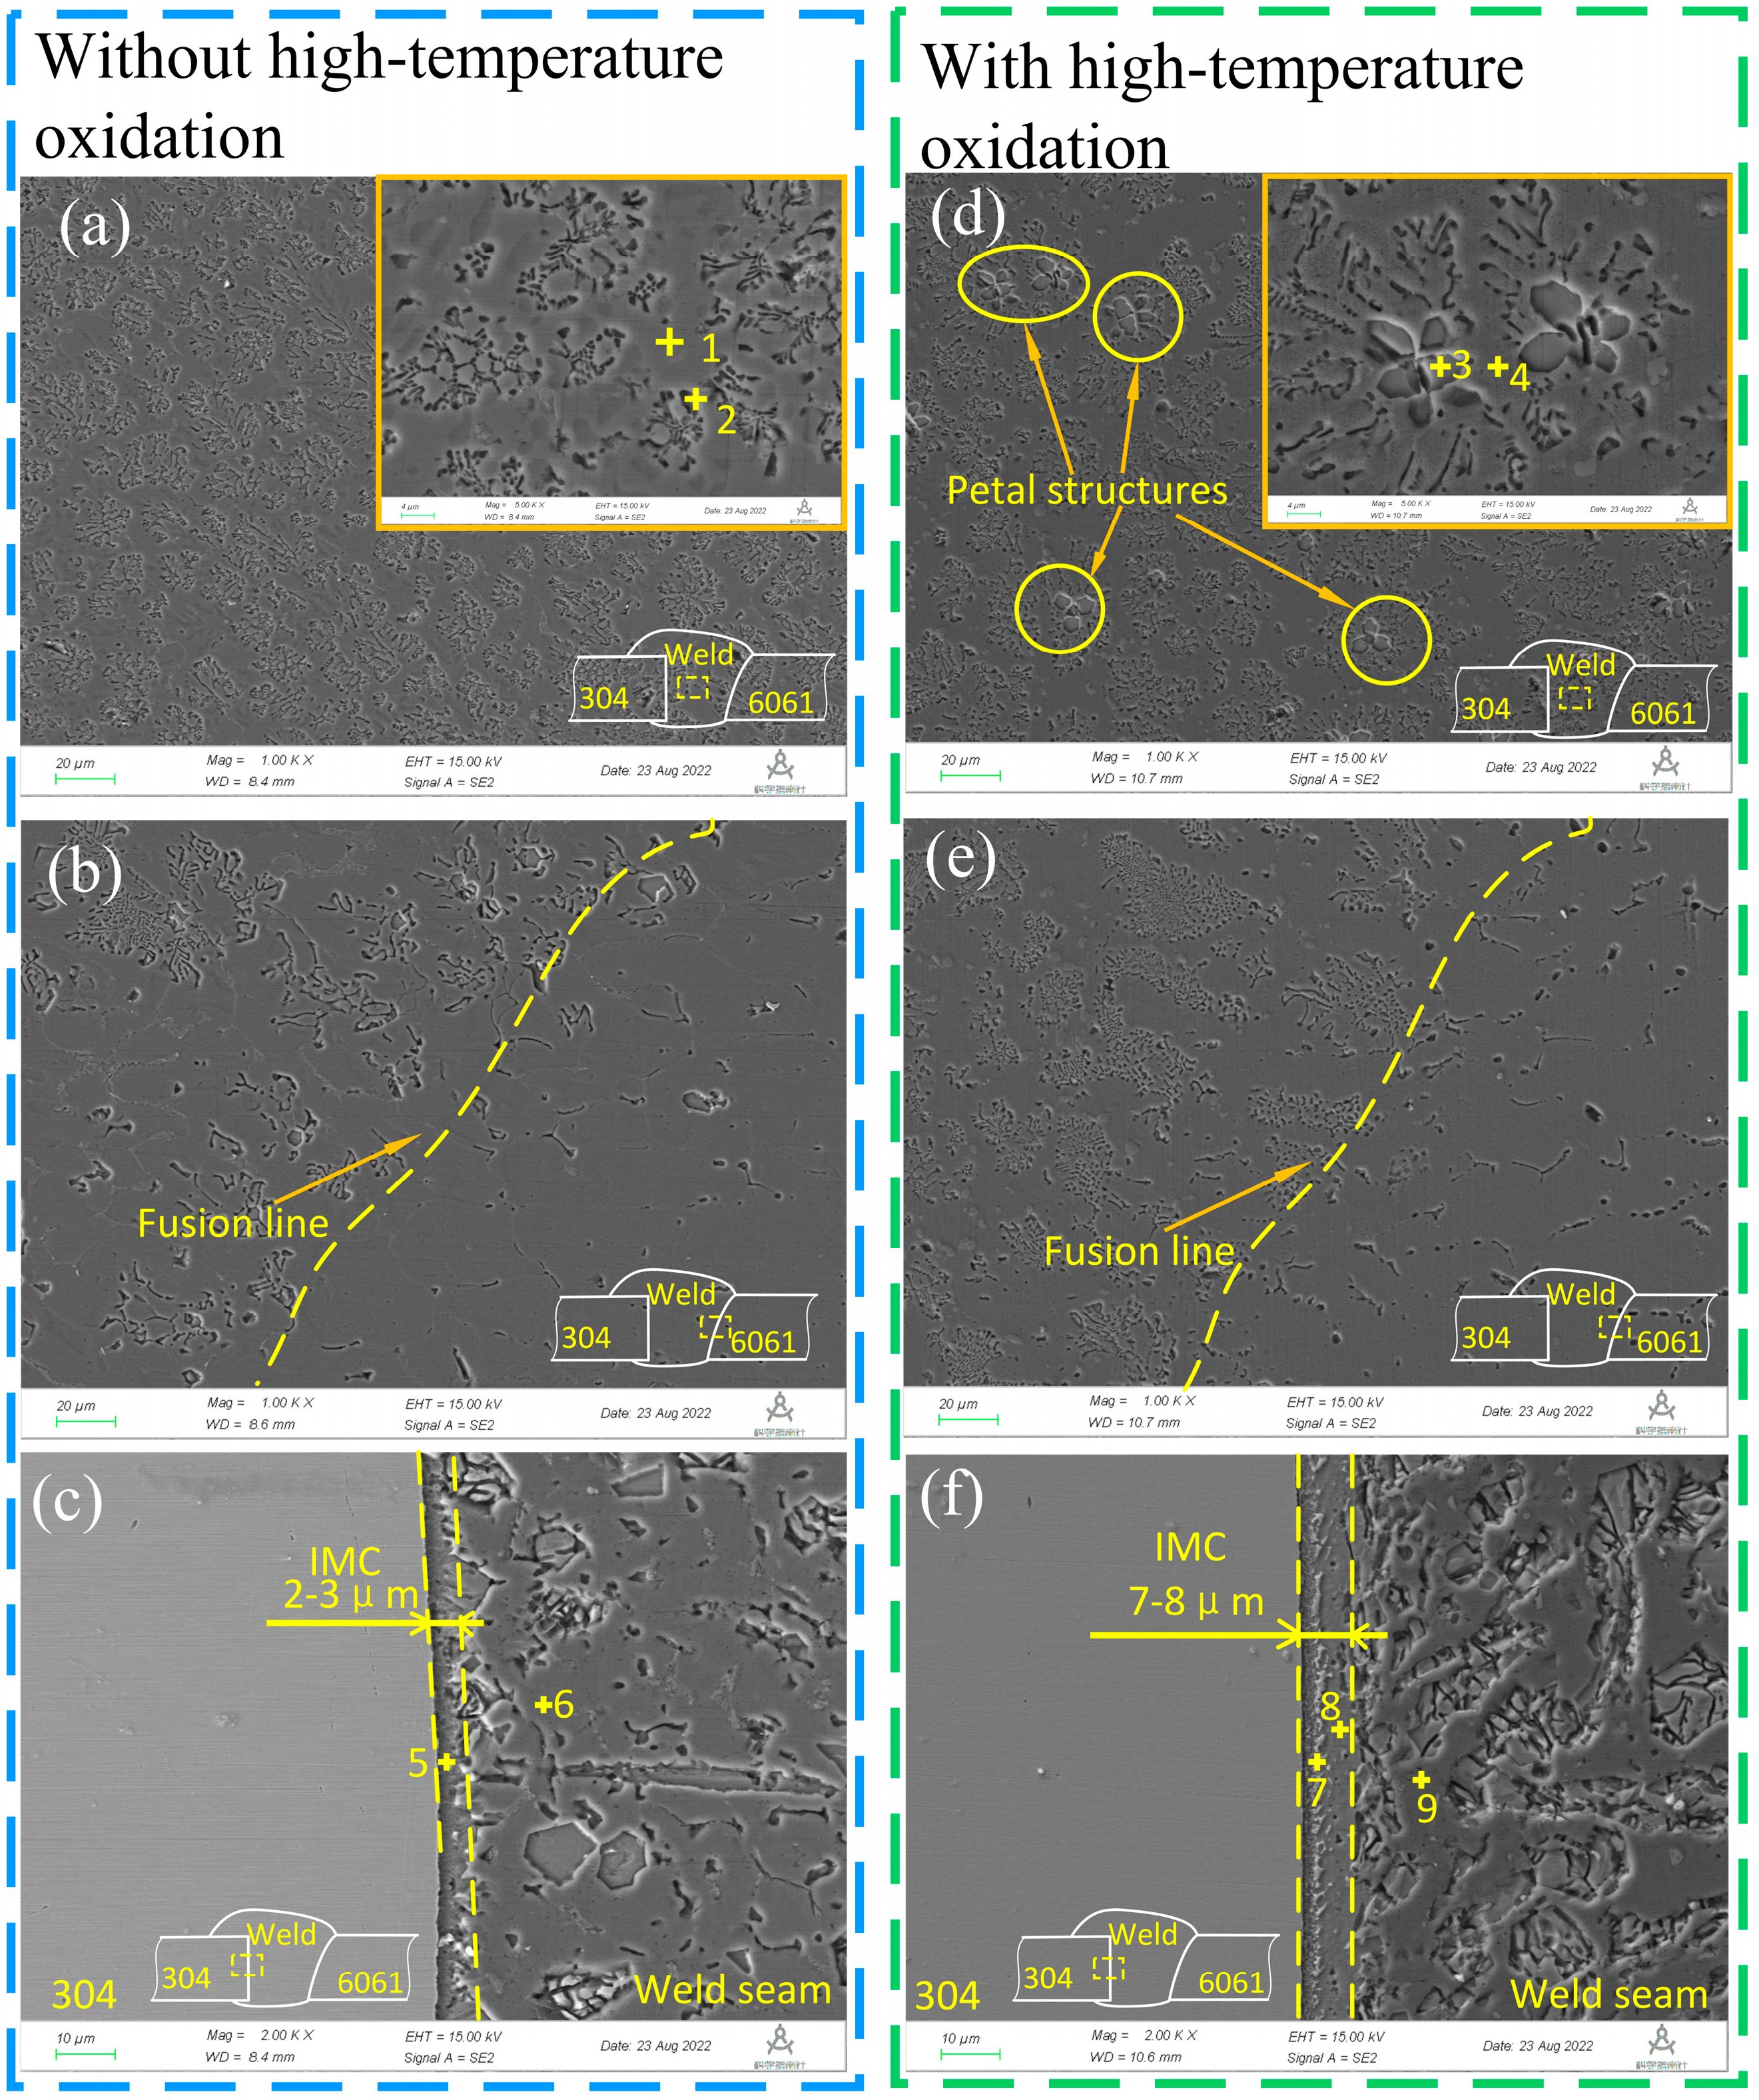
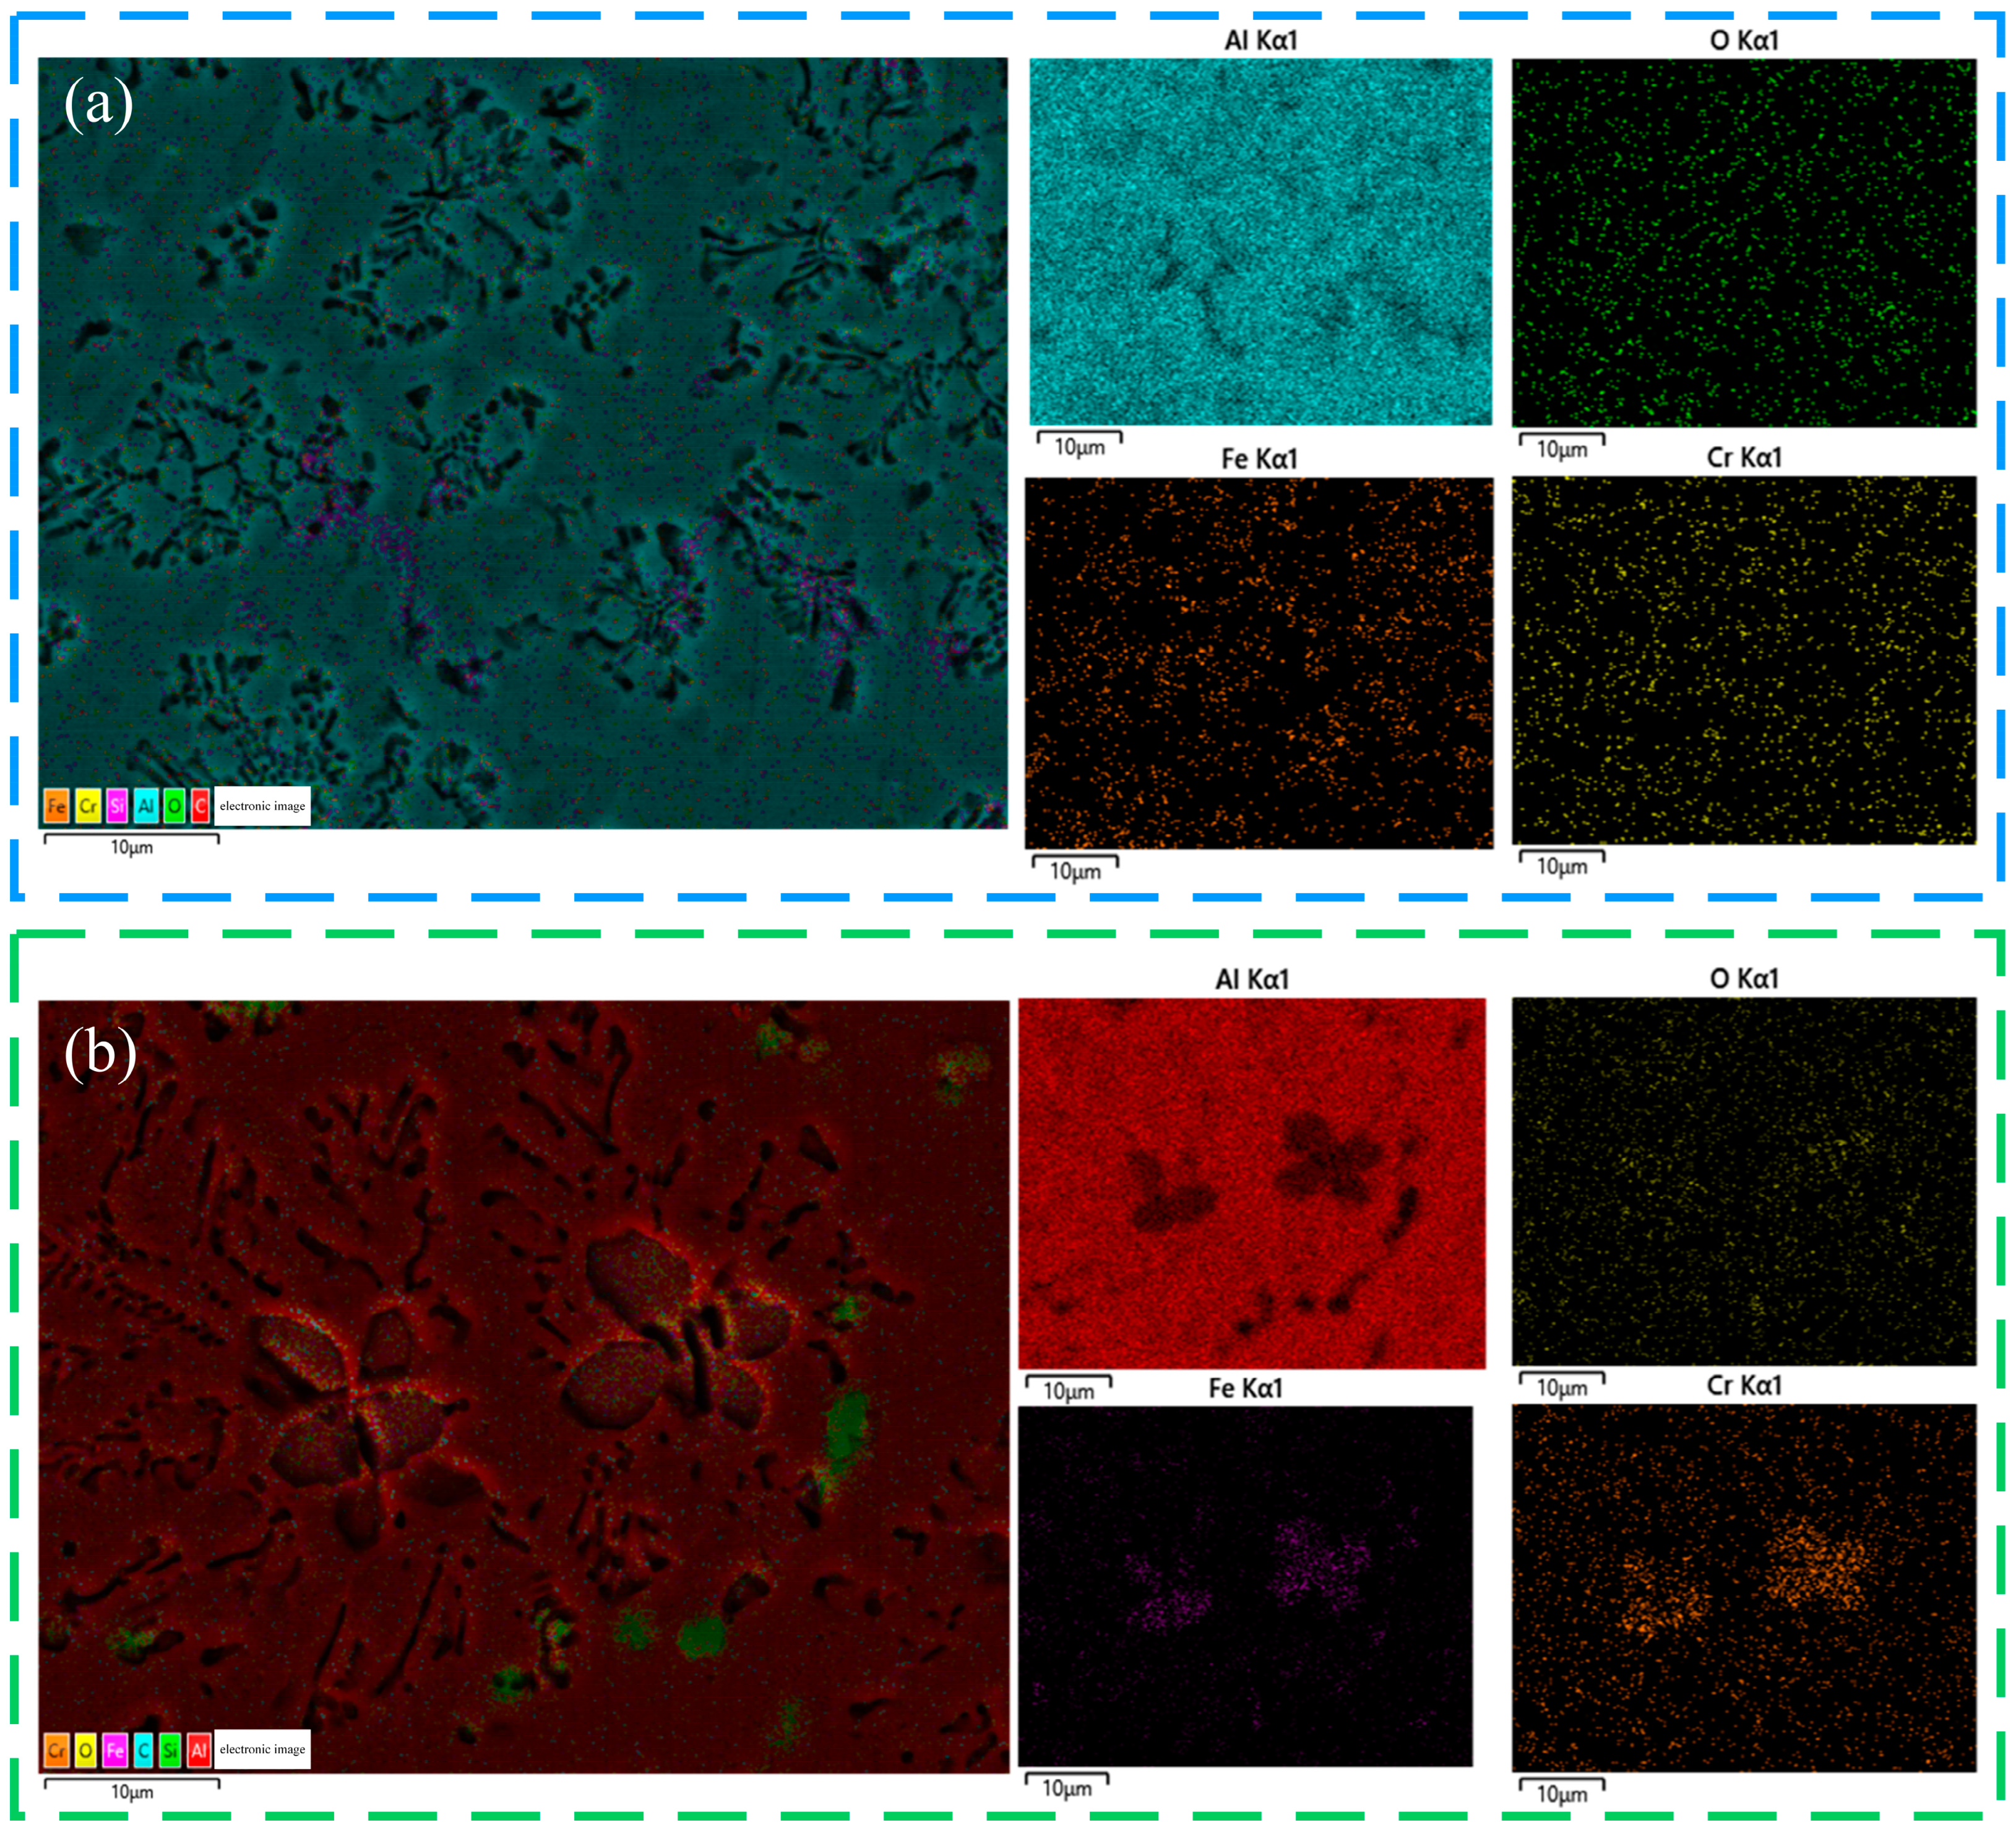
Three locations (weld center, aluminum weld heat-affected zone and steel-aluminum interface) were selected to analyze the microstructure of the weld joint obtained by SEM, as shown in Figure 1, where Figure 1a–c represent the micromorphology of the different positions of the welding joint without high-temperature oxidation, and Figure 1d–f show the micromorphology of the different positions of the welding joint with high-temperature oxidation. The weld microstructure is mainly composed of α-Al solid solution and Al-Si eutectic phases in Figure 1a,d. However, petal structures are sparsely distributed in the weld center after high-temperature oxidation treatment, as shown in the yellow circle in Figure 1d. Figure 2 and Table 2 show the surface scan and point scan results of the local magnified view in the upper right corner of Figure 1a,d, respectively. The EDS analysis of point 1 and point 4 showed that the composition in this area was mainly composed of aluminum substrate; point 2 indicates that the area is mainly Al-Si eutectic phases, and point 3 indicates that iron forms a petal-like compound with aluminum, which may be caused by the diffusion of iron in steel into the weld at high temperature. The results of weld surface scanning in Figure 2 show that iron diffuses to the central structure of the weld after high-temperature oxidation compared with that without high-temperature oxidation. The microstructure of the weld heat-affected zone is similar in Figure 1b,e, indicating that high-temperature oxidation has no obvious effect on this area. Figure 1c,f show the structure at the interface between steel and aluminum. There are intermetallic compounds (IMCs) due to the physical diffusion and chemical reaction between different elements at the interface [10]. The width of the intermetallic compounds at the interface of the sample after high-temperature oxidation treatment was wider (approximately 7–8 μm) than that of the sample (2–3 μm) without high-temperature oxidation treatment. This result indicated that the IMCs at the interface obtained heat energy and further grew during HTO treatment, which means that the thickness of the IMCs is related to the heat input (as reported by Honggang Dong et al. [11]).
3.2. Morphology of High-Temperature Oxidation (HTO) Film
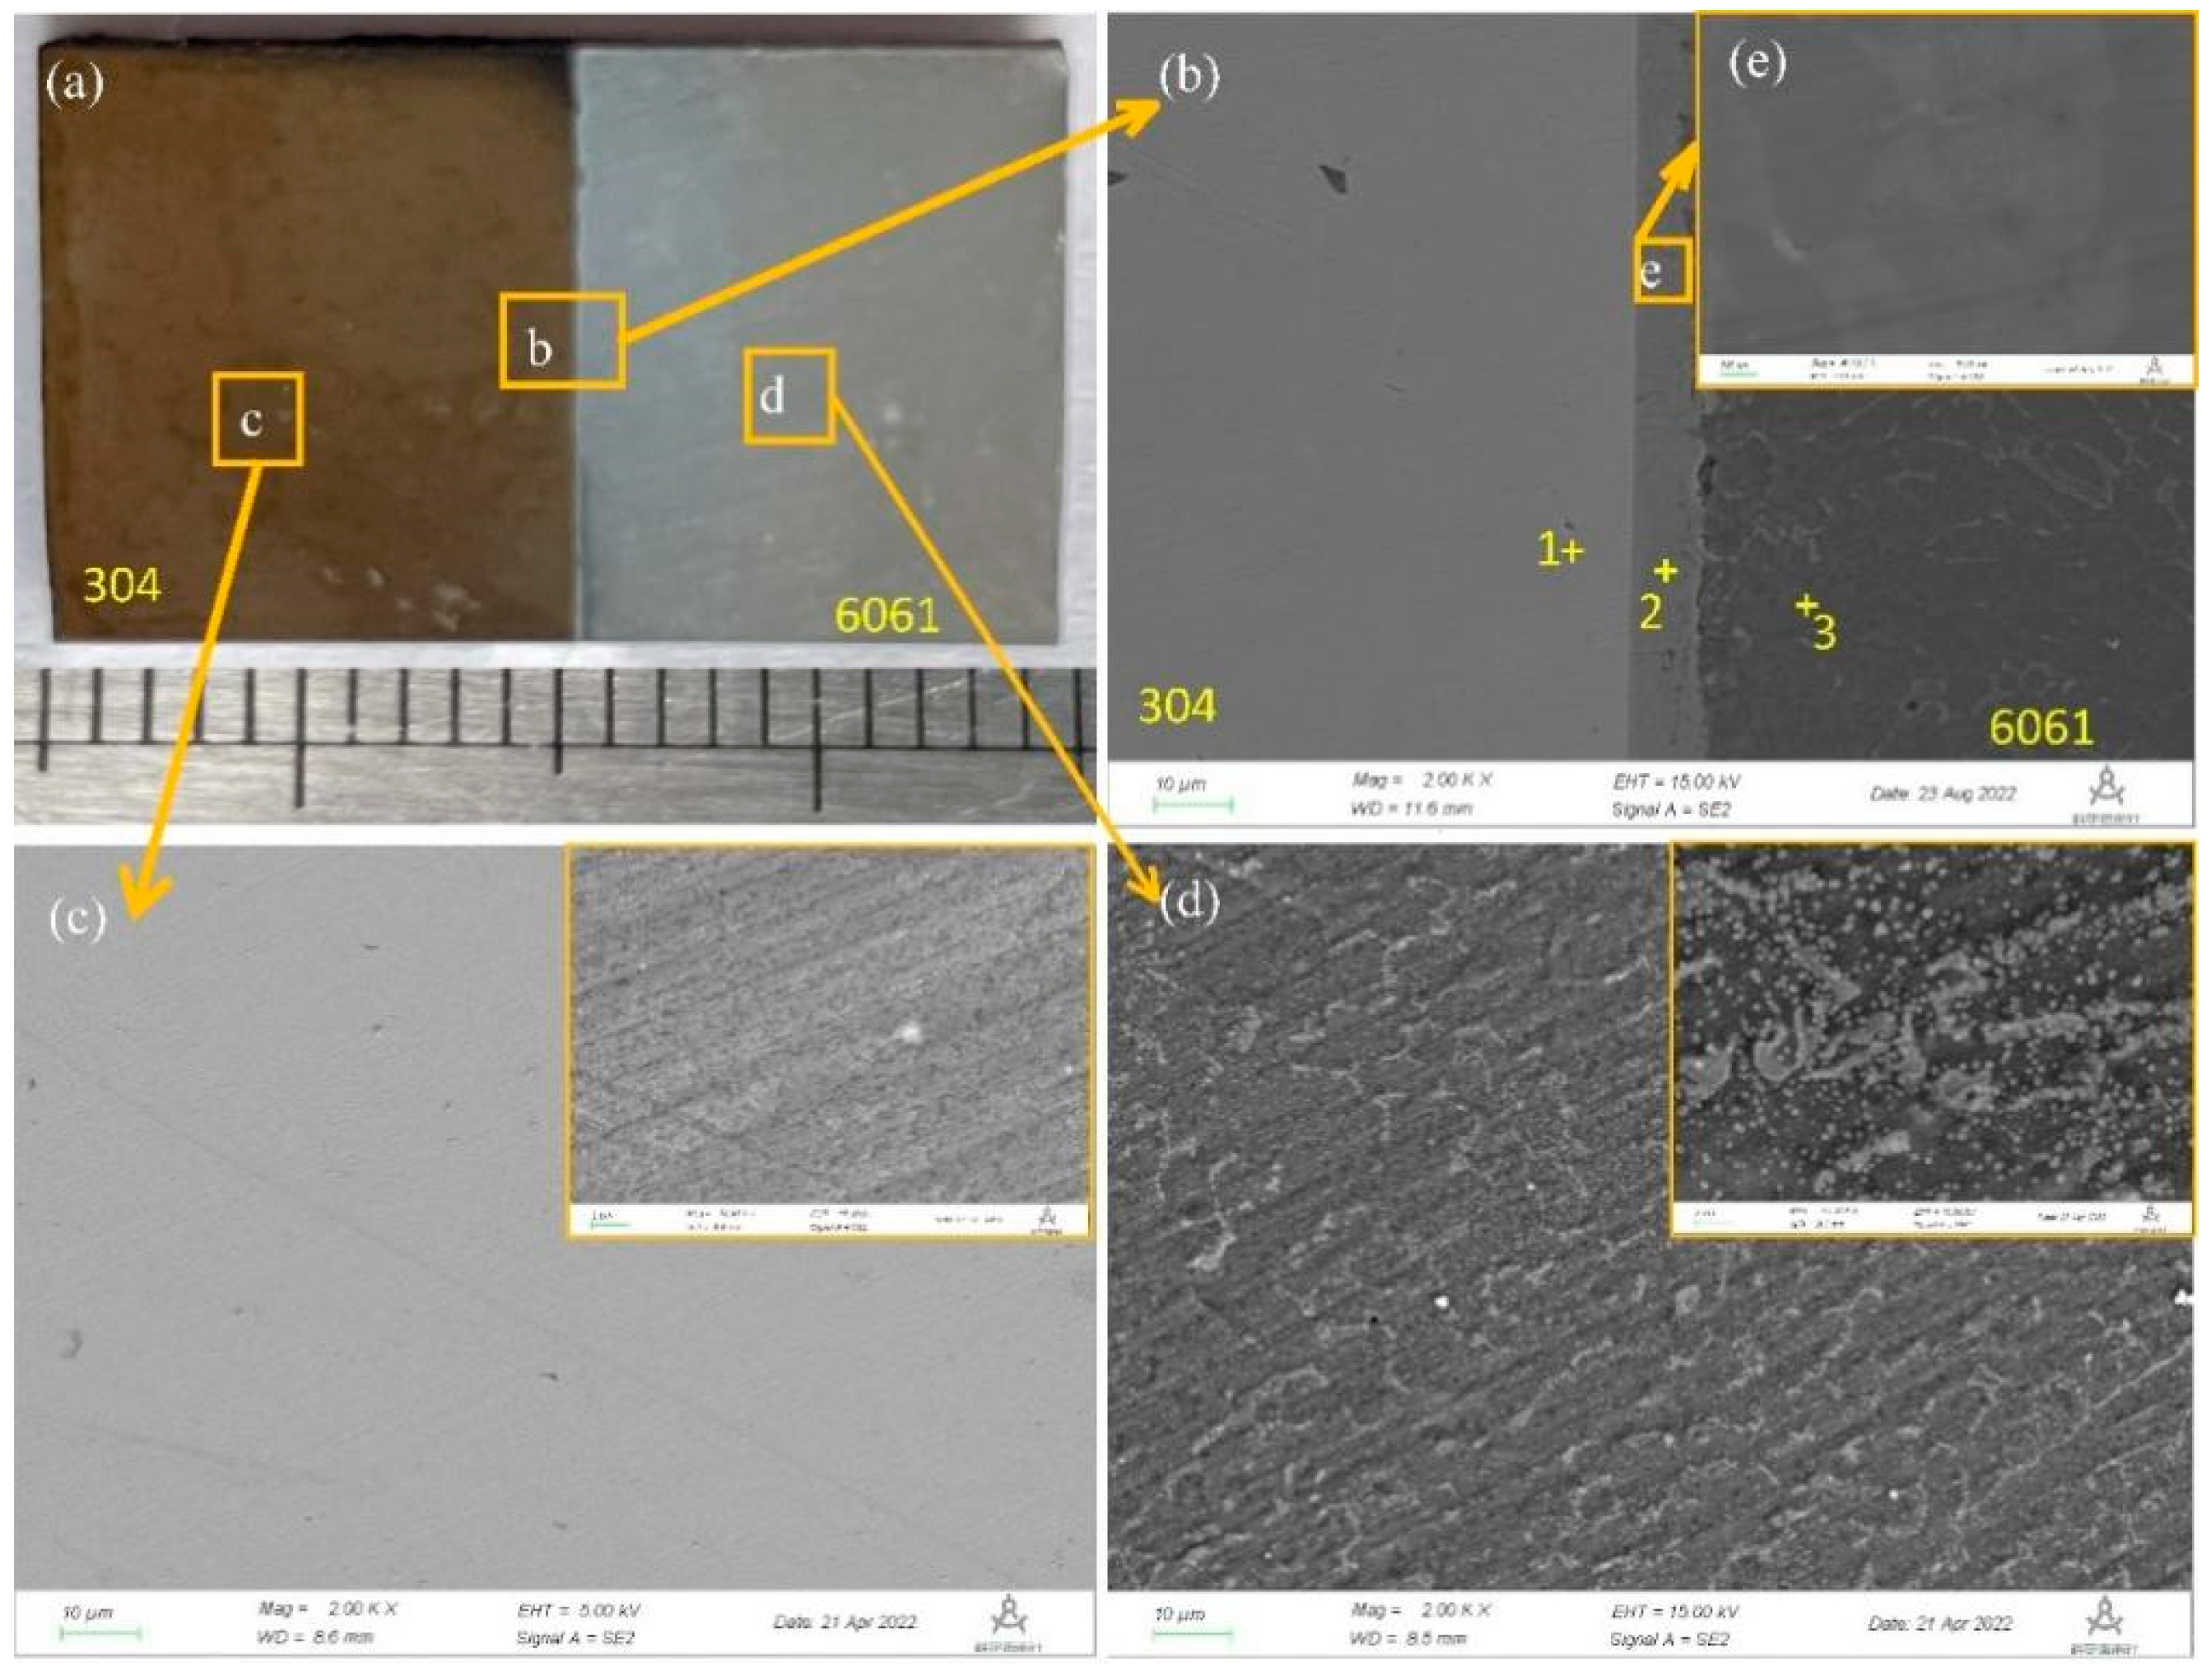
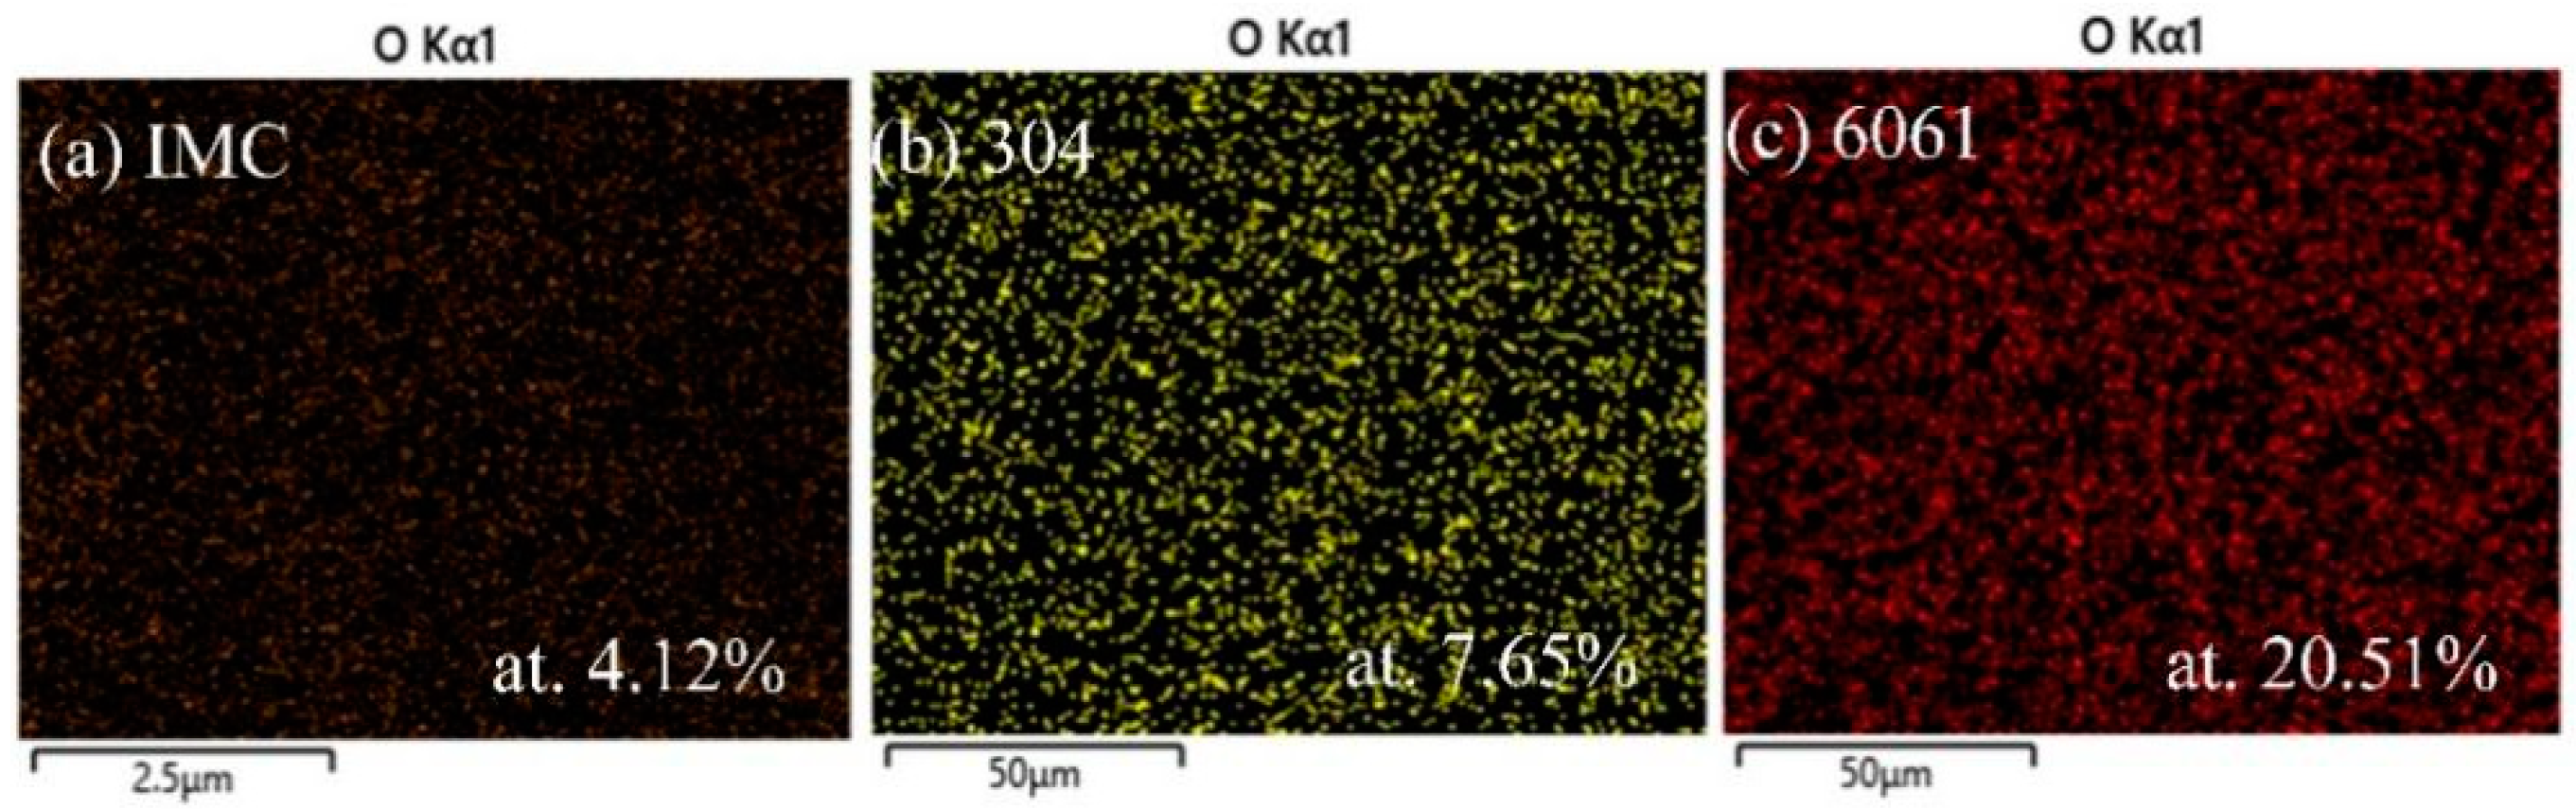
Figure 3a depicts the surface macroscopic morphology of the HTO film of the weld joint. It can be seen from the figure that the 304 stainless steel side is yellow, and no metallic luster can be seen on the side of the weld and 6061 aluminum alloy. Three locations were selected as shown in Figure 3a to analyze the microstructure of the HTO film by SEM, as shown in Figure 3b–d, in which the upper right corners are partially enlarged views. Figure 3b shows that the surface of the IMC side is smooth without an obvious oxidation film, the metal surface of 304 is smooth at a magnification of 2000× and there is an obvious discontinuous oxidation film at a magnification of 10,000×. Some oxide convex and concave areas can be clearly observed on the surface of the 6061 side at 2000× or 10,000×. EDS surface scanning analysis was carried out, as shown in Figure 3c–e, and the analysis results are shown in Figure 4. It was found that there were oxygen-containing compounds in these three surface scans (IMC, 304 and 6061) or in the three EDS point scans, indicating that the sample substrate was covered with the high-temperature oxidation film, and their atomic percentages of oxygen from the surface scan results were 4.12%, 7.65% and 20.51%. Fe and Cr oxides were mainly formed on the side of 304 as well as Al oxides on the side of 6061 during the oxidation process, as shown in Table 3. According to the EDS surface scanning analysis (Table 3), more oxygen elements were found on the 6061 aluminum alloy side of the welded joint compared with the side of IMC and 304 which underwent high-temperature oxidation treatment at a temperature of 500 °C because at the same temperature, the Gibbs free energy of the Al2O3 is lower than the Cr2O3, and the ability of aluminum to reduce oxygen is stronger. In short, the driving force for the formation of Al2O3 is greater than that of Cr2O3, as demonstrated in the diagrams of ∆Gv⊝of the formation of oxides [12]. At the same time, Chenglong Yu et al. [13] found that the oxidation initiates at 140 °C for aluminum, and the oxidation resistance of austenitic stainless steel is still very good at 900 °C, according to the oxide thickness scale for oxidation of 304 [14].
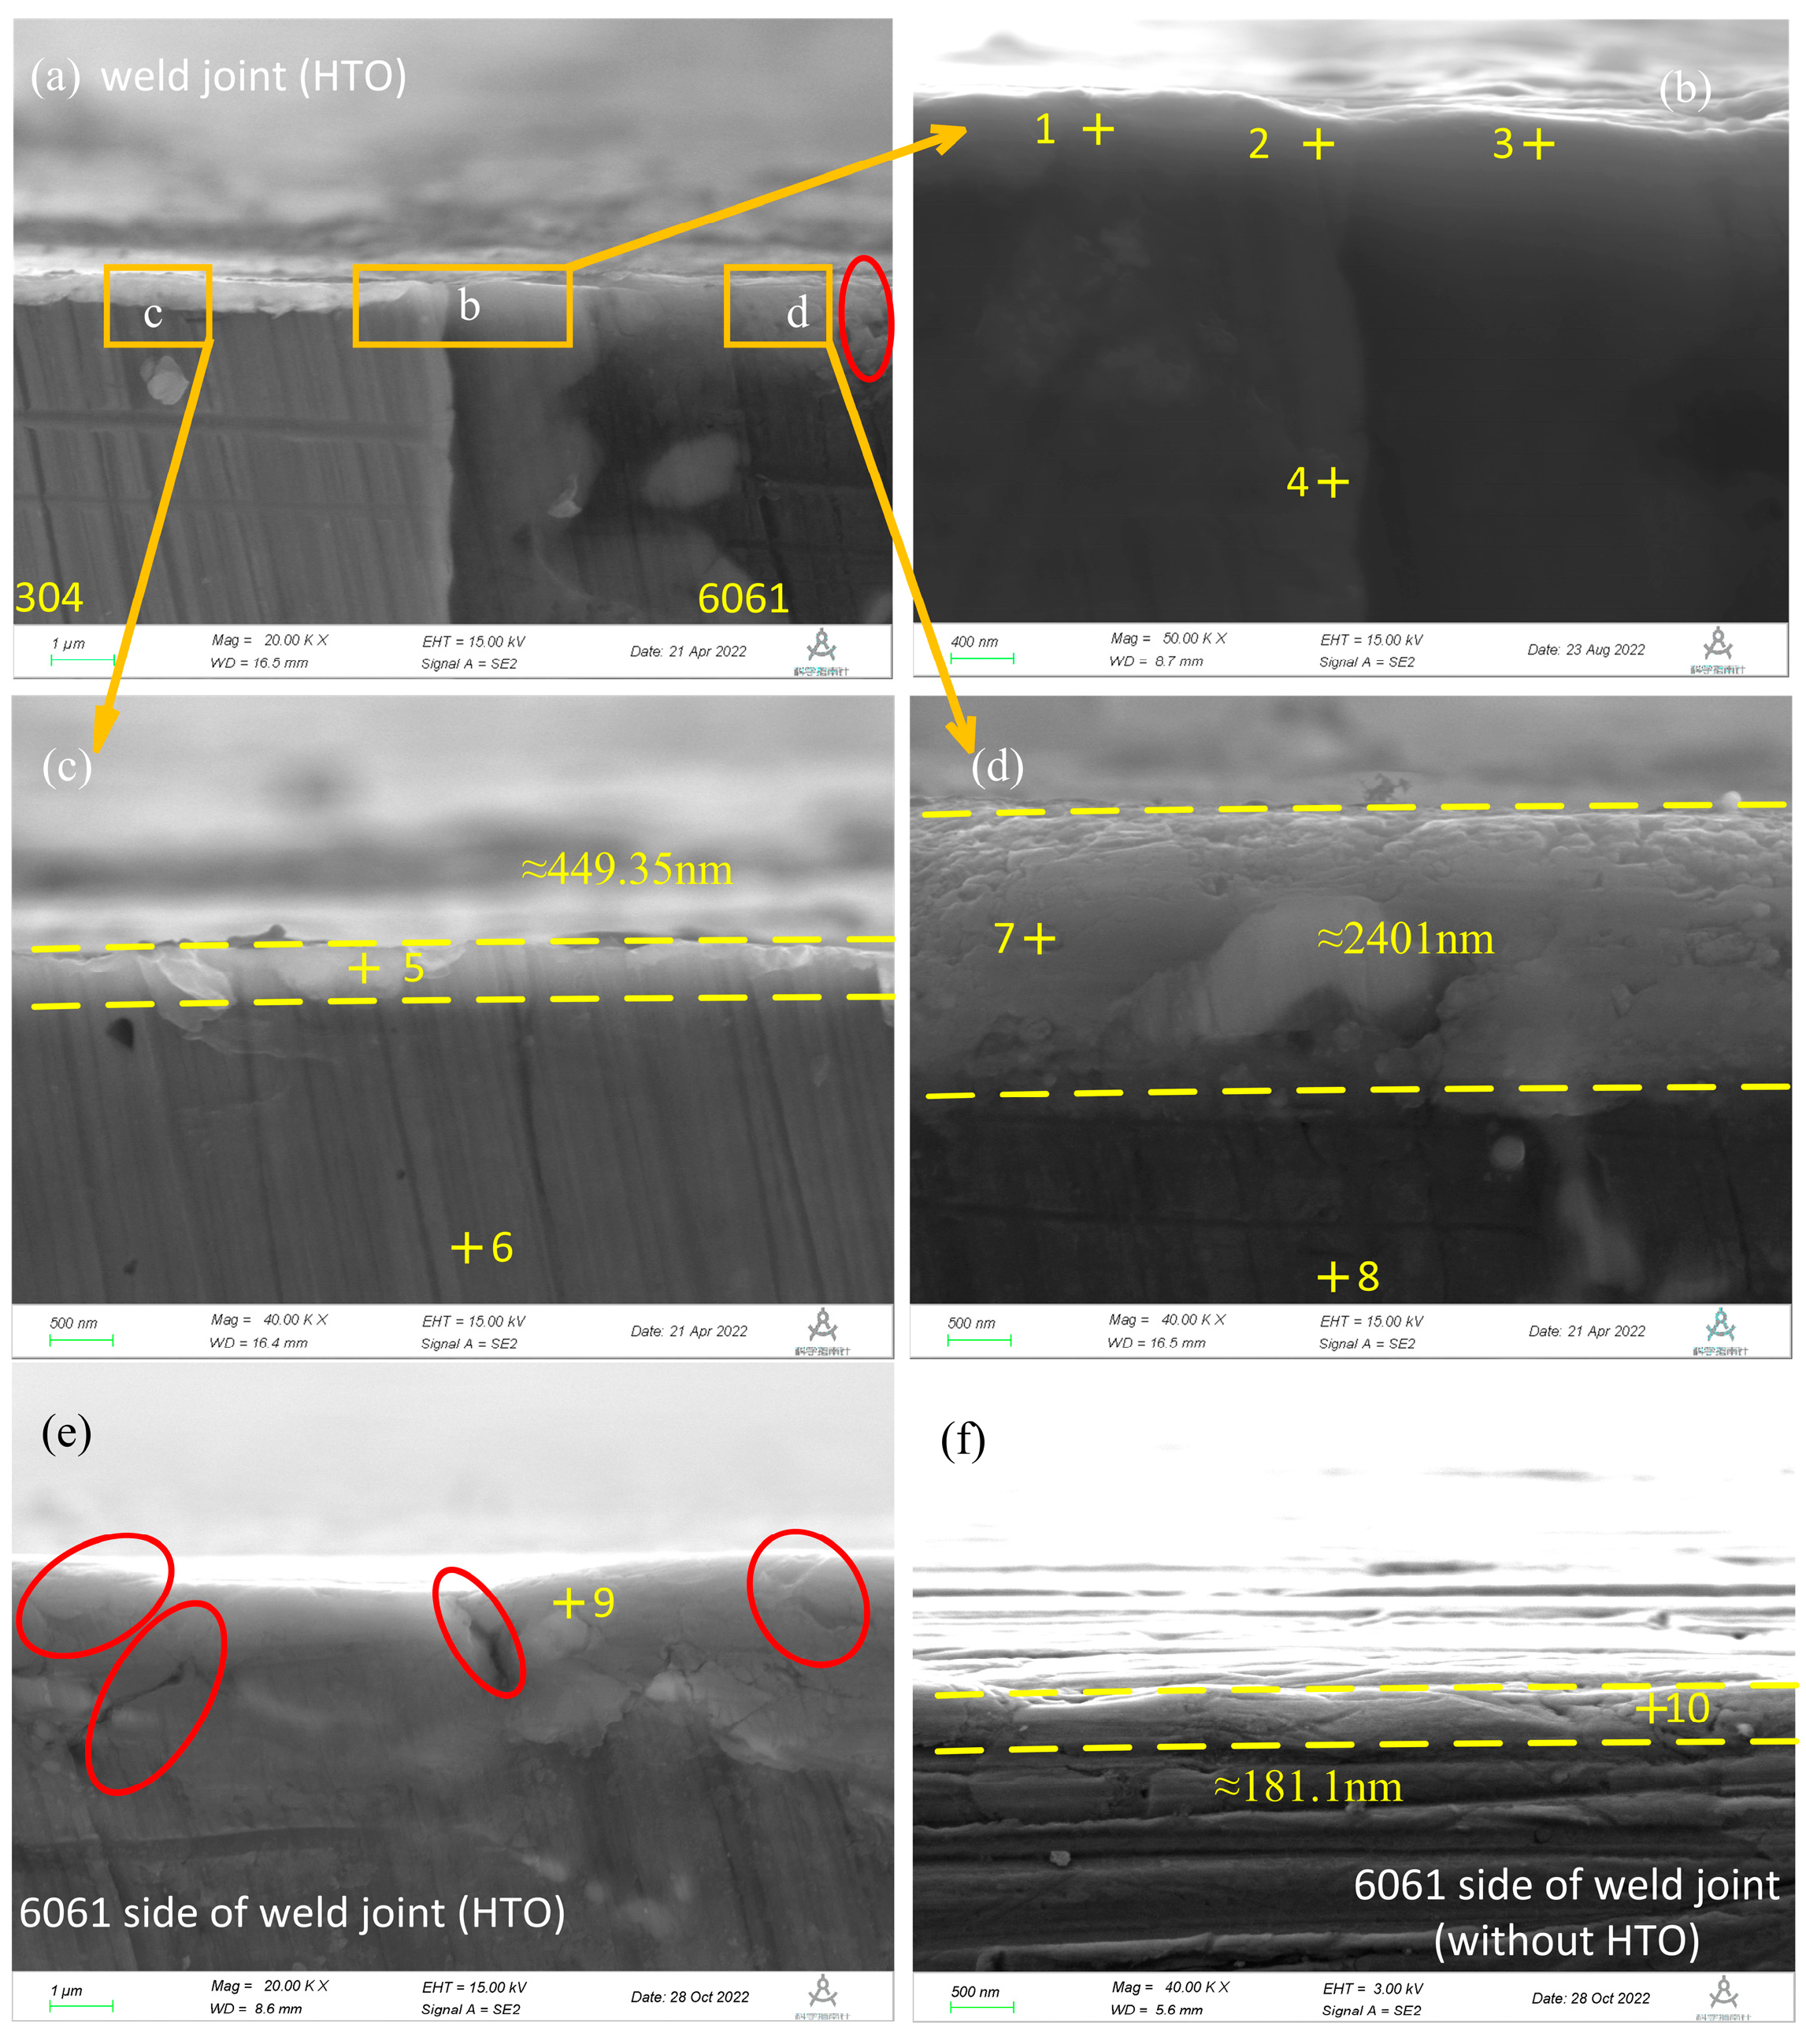
Figure 5a depicts the cross-section SEM image of the HTO film of the weld joint. Three locations were selected as shown in Figure 5a to analyze the microstructure of the weld joint, as shown in Figure 5b–d. Figure 5e is the cross-section SEM image of the 6061 side of the weld joint, which is the same sample as in Figure 5a. Figure 5f is the cross-section SEM image of the 6061 side of the weld joint without HTO treatment. The thicknesses of the HTO film on the 304 and 6061 sides are 449.35 nm and 2401 nm, respectively, while the thickness of the 6061 side of the weld joint without HTO treatment is 181.1 nm. That is, the film thickness of the sample increases after HTO treatment. At the same time, we found that there were cracks in some parts of the oxide film on the 6061 side of the weld joint, as shown in the red circle in Figure 5a,e.
Based on the EDS point scanning analysis results from Table 4, the oxygen content on the surface of the interface intermetallic compound is 4.29 at.% (point 2), and the oxygen content of the substrate is 1.92 at.% (point 4); the oxygen content on the surface of the 304 side is 6.00 at.% (point 5), while the substrate is 1.61 at.% (point 6); the oxygen content on the surface of the 6061 side is 9.82 at.% (point 7) and 7.04 at.% (point 9), while the substrate is 1.69 at.% (point 8). The oxygen content at point 10 is 7.45 at.%, which is similar to that of the sample oxidized at high temperature. Therefore, it can be inferred from the EDS point scanning results that different parts of the 304/6061 dissimilar metal welding–brazing joint treated by HTO can react with oxygen to generate oxides.
3.3. Corrosion Resistance of the HTO-Treated 304/6061 Joint
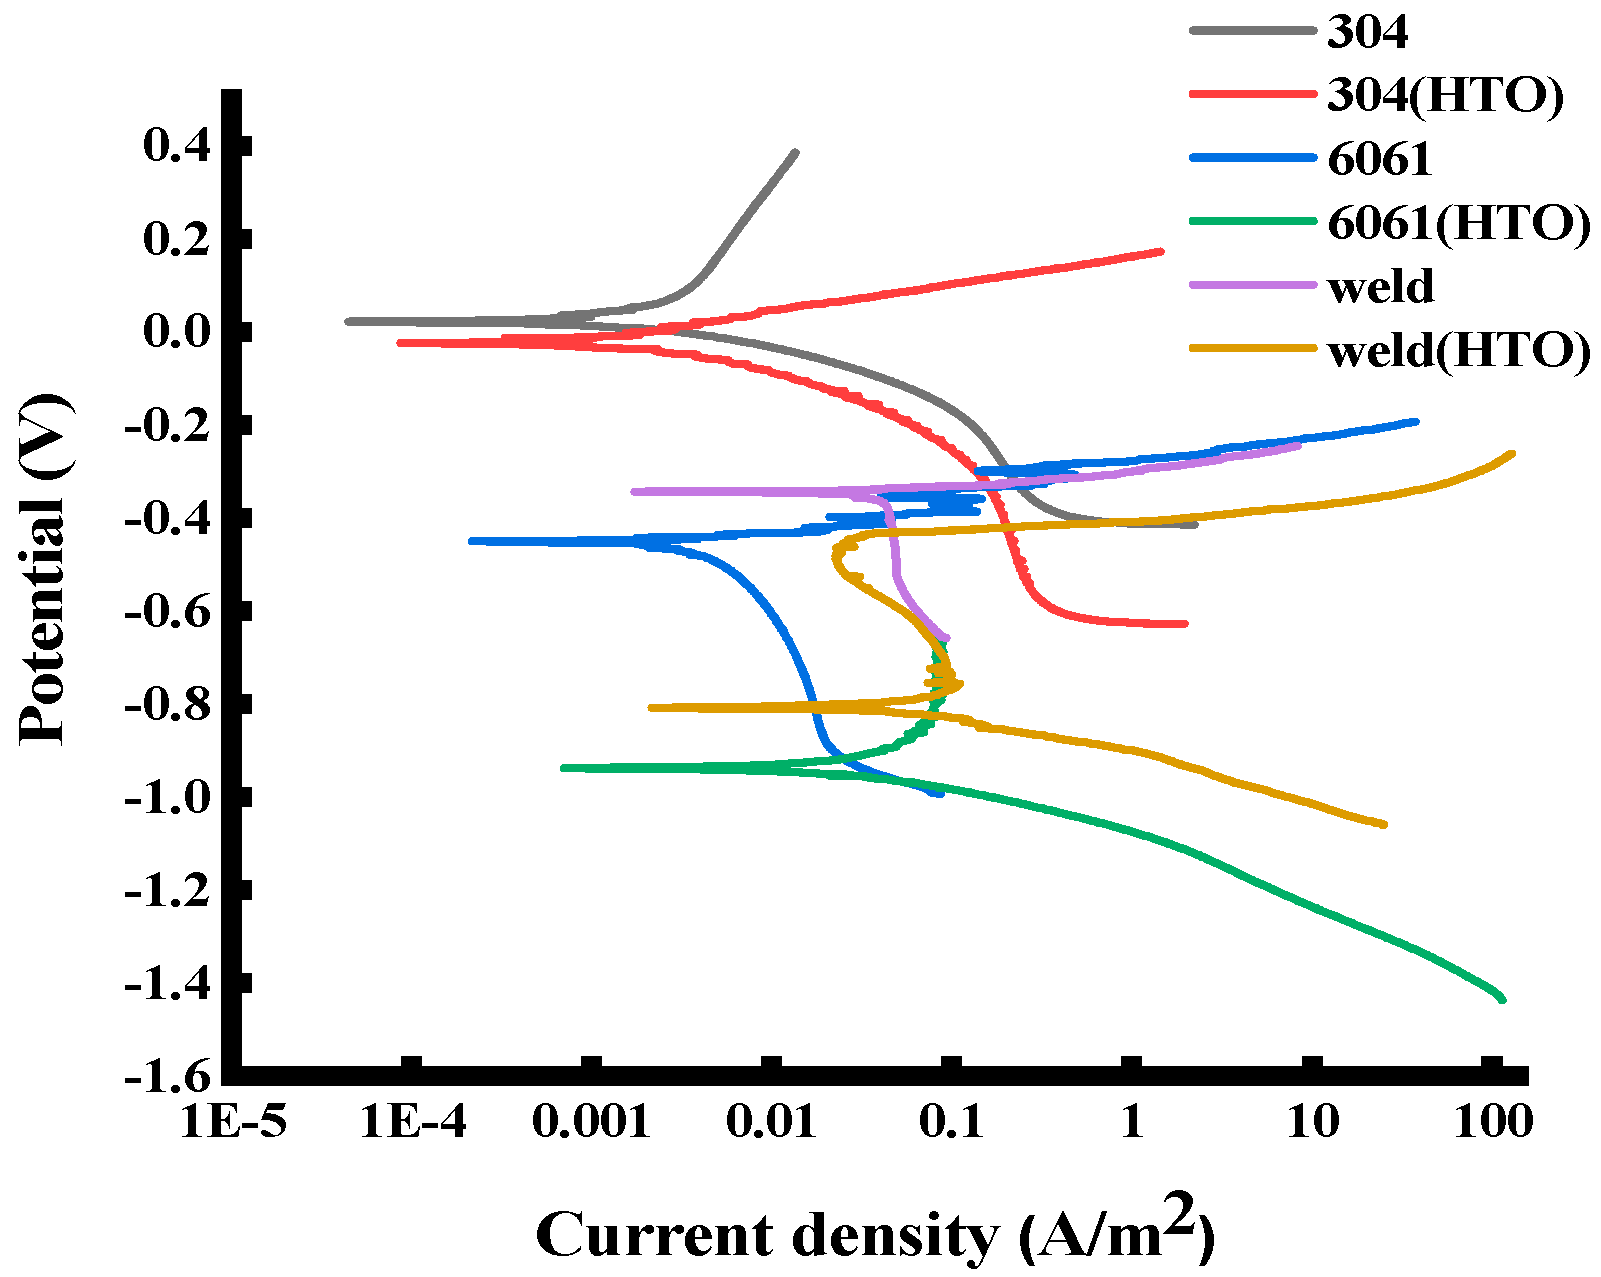
To investigate corrosion properties such as corrosion potential, potentiodynamic polarization tests were conducted, as shown in Figure 6. The corrosion potential (Ecorr) and corrosion current density (Icorr), which were obtained from the potentiodynamic polarization curves, are summarized in Table 5. The corrosion resistance of samples with HTO treatment was lower than that of samples without HTO treatment. Whether oxidized at high temperature or not, the corrosion potential of the welding samples was situated between those of the two base materials. This result can be explained by the mix potential theory [15], where a new potential is determined by the intersection of the anodic reaction (6061) and cathodic reaction (304) of the unjoined metals, which is similar to the report by Bosung Seo et al. [3]. The sequence of the corrosion current density was weld (HTO) >weld>6061 (HTO) >6061>304 (HTO) >304. The higher the corrosion current density is, the worse the corrosion resistance of the materials. Furthermore, from Figure 6 (the purple curve), it is seen that the anodic and cathodic processes for the weld sample are both under activation control. Nevertheless, a short active–passive transition for the weld (HTO) sample (the yellow curve), which is evidenced with a decrease in corrosion current density as potential increased from −0.8 V to −0.5 V vs. SCE, indicates the occurrence of a passivation process that is related to the formation of the protective layer [16,17] on the surface of the weld (HTO) sample.
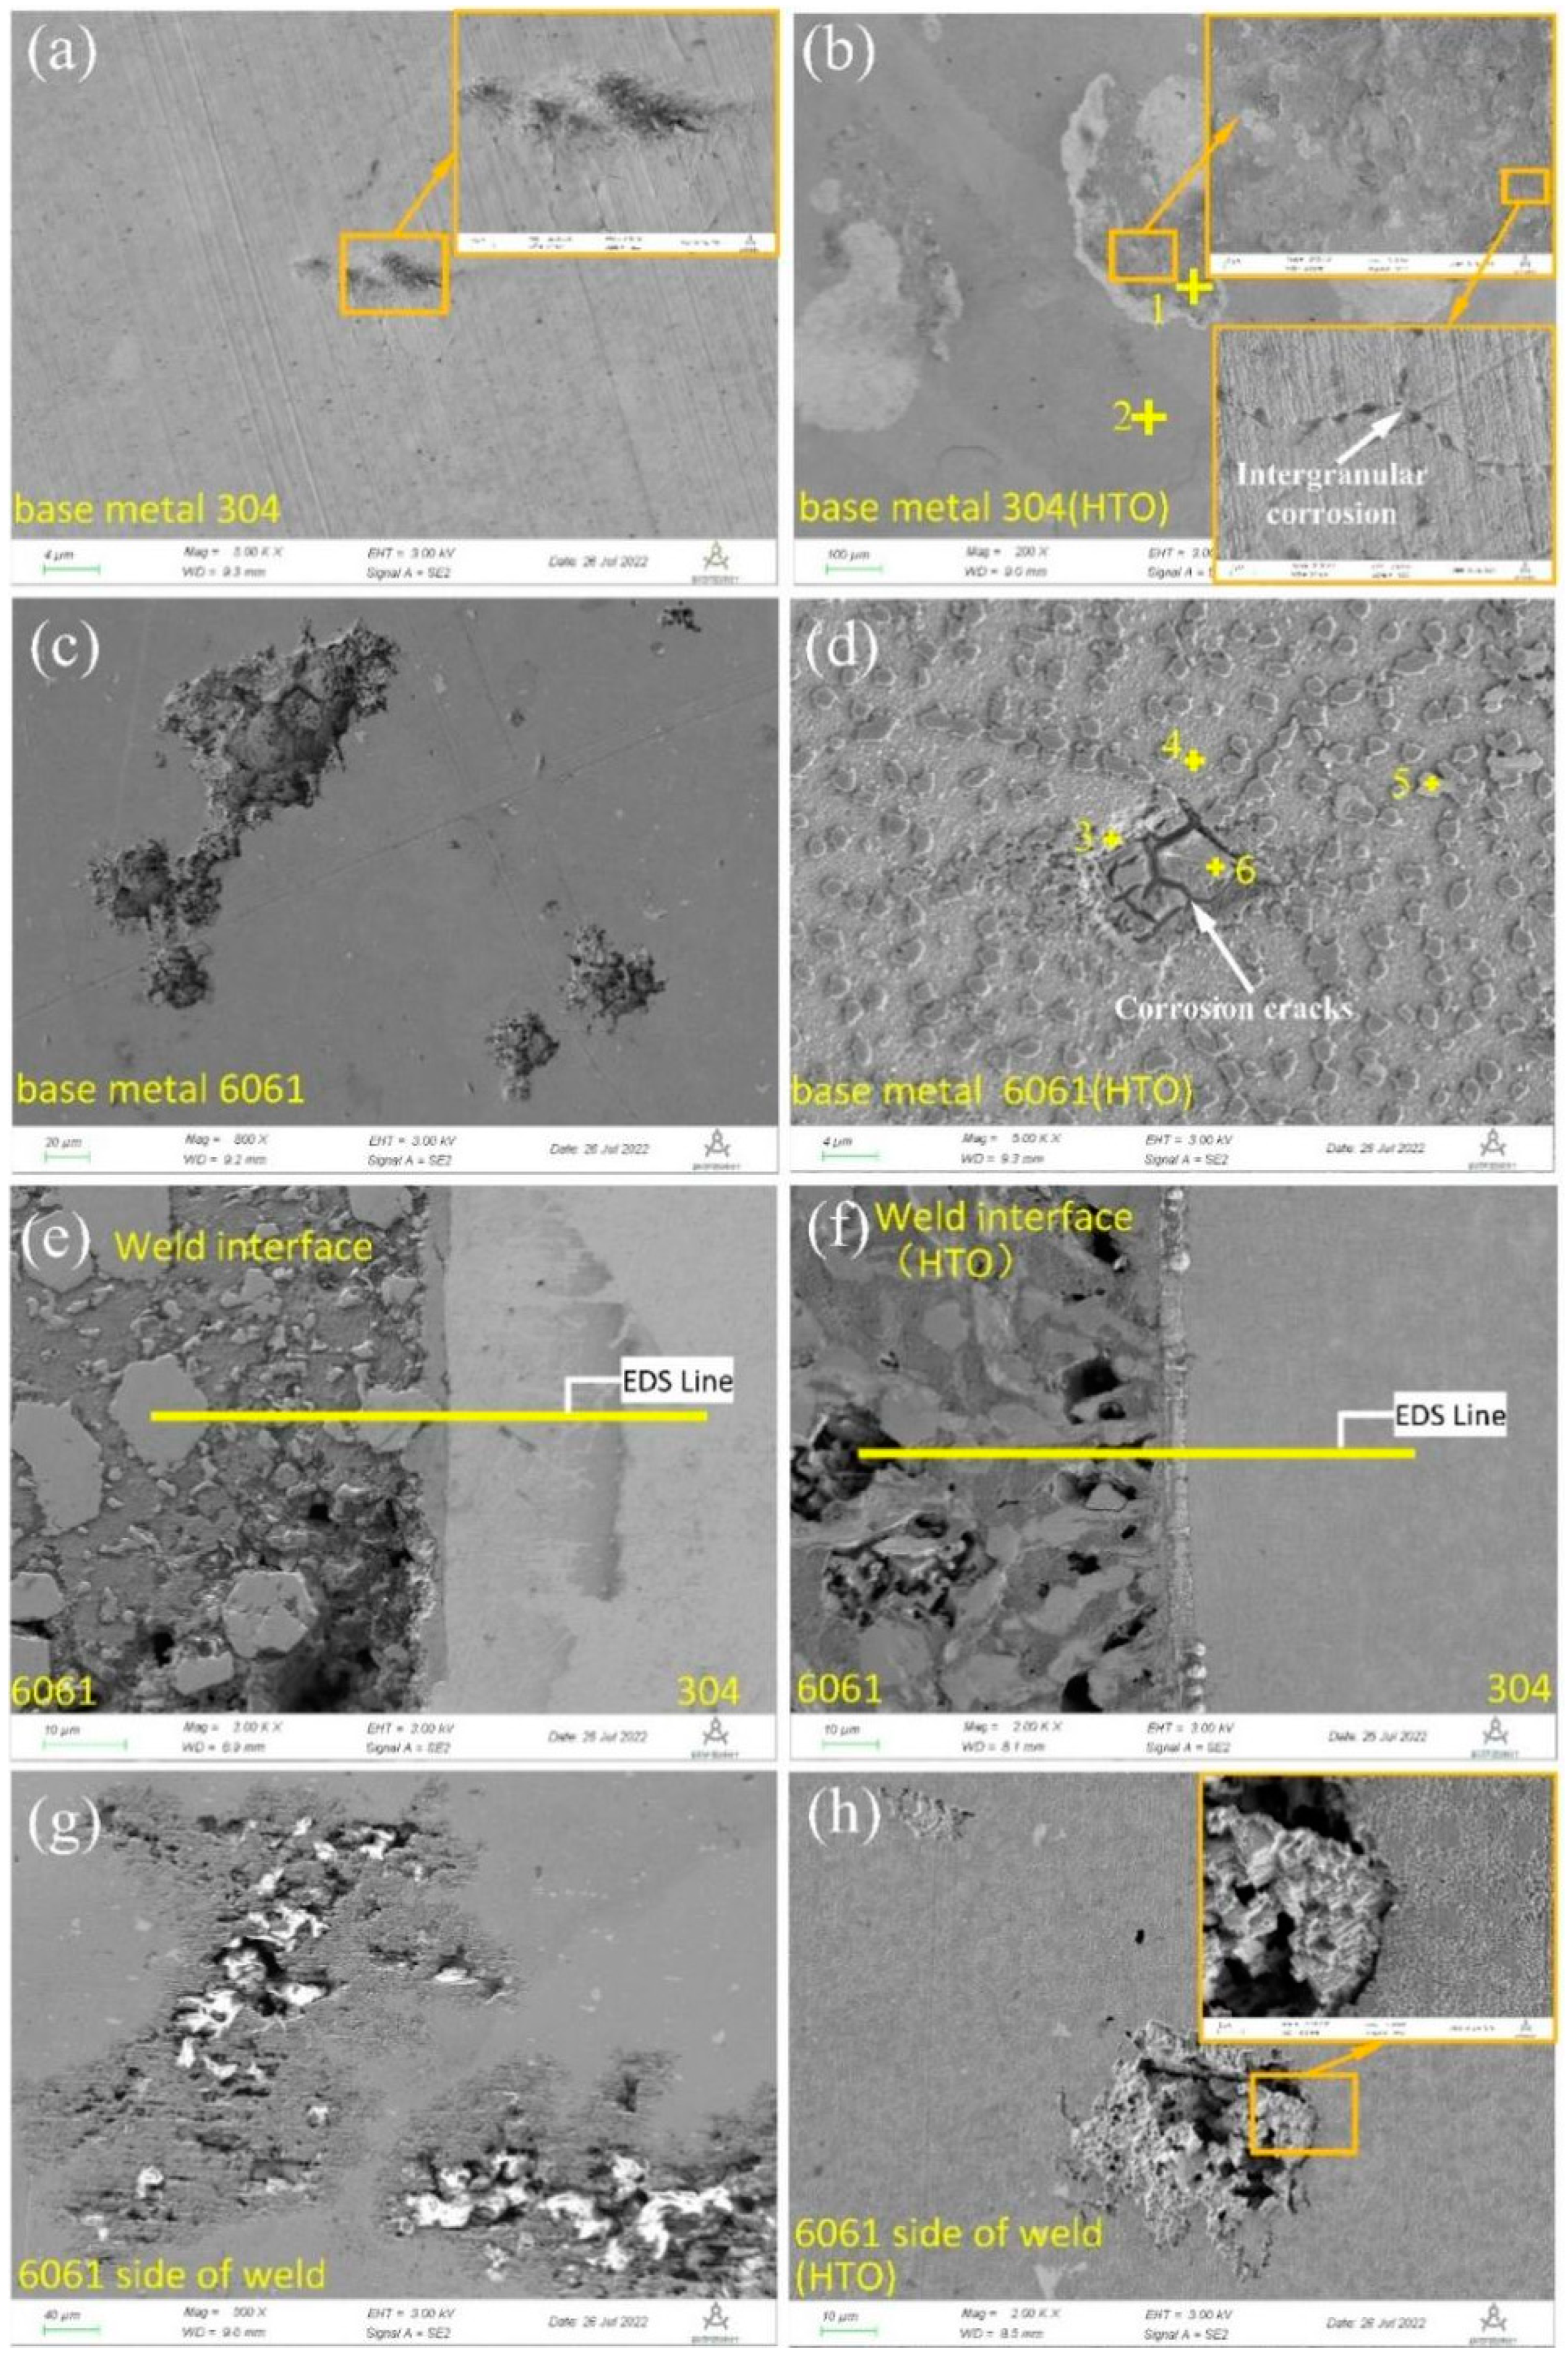
The corrosion morphologies after polarization are shown in Figure 7. Some deep corrosion pits were observed in the base metals without HTO treatment as well as the base metals with HTO treatment corroded in a large area. There was intergranular corrosion (Figure 7b) in 304 stainless steel (HTO). This is because sensitization occurred in 304 stainless steels during oxidation treatment at 500 °C. Sensitization is a deleterious phenomenon for austenitic stainless steel when they are heated to a certain temperature around 500 and 800 °C [18]. During the exposure of austenitic stainless steel in this high temperature range, chromium carbides precipitate near the grain boundary, resulting in chromium deficiency [19,20]. According to the EDS spot scanning results in Table 6, the Cr element in point 1 (10.63 at.% or 14.45 wt.%) of the severely corroded area is slightly lower than that in point 2 of the non-corroded area, and the Cr element content in point 2 (17.52 at.% or 18.03 wt.%) is similar to that of the base material (17.51 wt.%). Due to reduced Cr, the corrosion resistance of the grain boundaries was reduced. Then, intergranular corrosion will occur when they are exposed to corrosive media. Corrosion cracks were found in the 6061 alloy (Figure 7d). Figure 7e,f show the corrosion morphology of the interface after polarization of the weld joint, while Figure 7g,h show the corrosion morphology of the 6061 side of the weld after polarization. Obvious galvanic corrosion was found in the 304/6061 joints (whether HTO treated or not). The 6061 aluminum alloy and weld were corroded as anodes, while 304 stainless steel was protected as cathodes. In addition, the corrosion of the sample after high-temperature oxidation was more serious than that of the weld joint sample without high-temperature oxidation. The corrosion phenomenon is similar to that of a single base metal; there were some local corrosion pits on the welded joint sample without the HTO film (Figure 7g), while large corrosion areas and local corrosion pits were found on the welded joint sample with the HTO film (Figure 7h). The above phenomena indicate that the HTO treatment will reduce the corrosion resistance or even accelerate the corrosion of the base metals and weld joints. Because there were tiny cracks in the oxide film (Figure 5a,e), the corrosion solution was immersed in it and reacted with the base metal to corrode the metal.
The composition of the base metals treated by HTO was measured by an EDS point scan and is listed in Table 6. Point 1 has an atomic composition of 39.23% Fe, 10.63% Cr and 41.04% O, while point 2 has an atomic composition of 62.66% Fe, 17.52% Cr and 11.43% O. The results of point 4 show that it is an aluminum matrix, and the results of points 3, 5 and 6 show that it is aluminum oxide. From the results of the EDS point scan, it is confirmed that the corrosion products of the 304 stainless steel base metal are mainly iron and chromium oxides, while the corrosion products of the aluminum alloy base metal are mainly aluminum oxides.
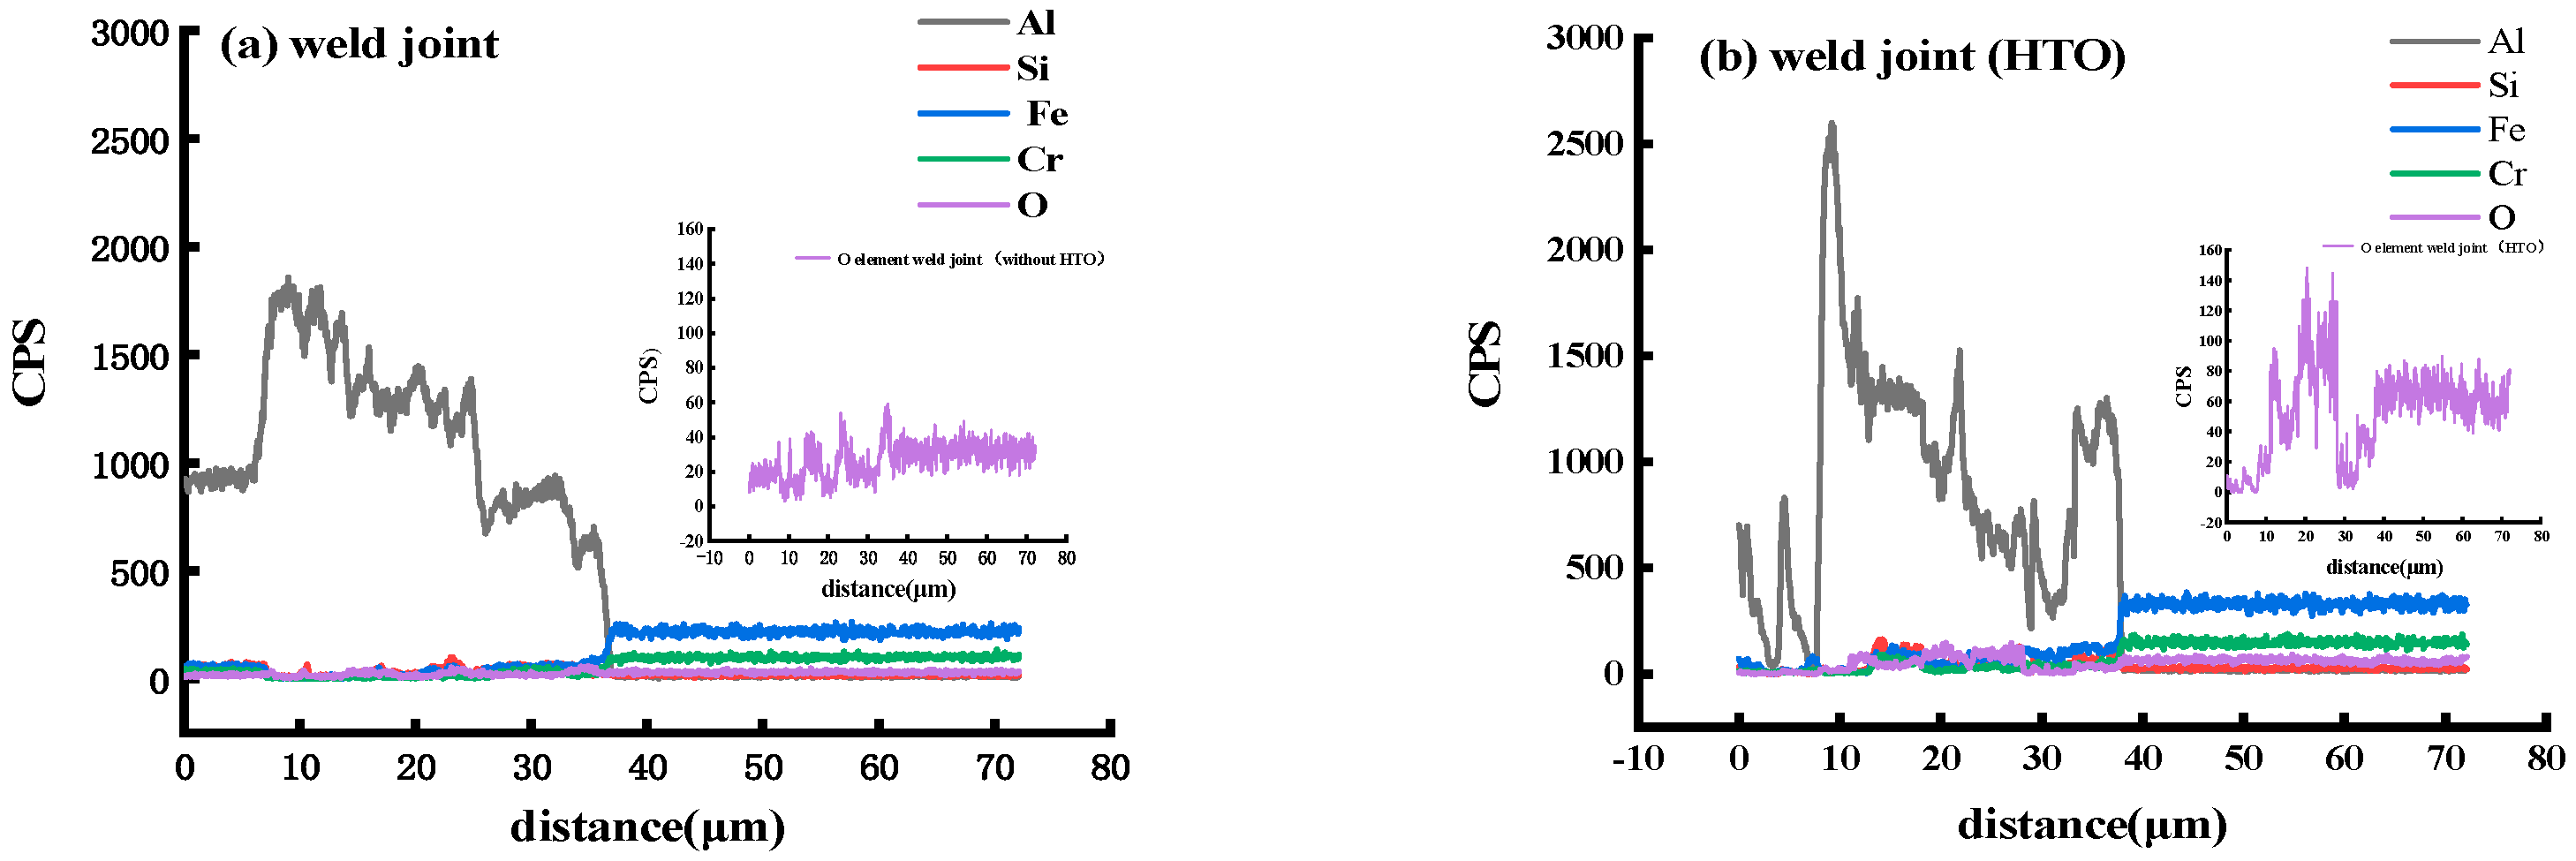
Variations in the aluminum, iron and oxygen contents at the interface of the weld joint were measured by an EDS line scan along the yellow line marked in Figure 7e,f, as shown in Figure 8. This change indicates that the oxygen element distribution on the aluminum side of the weld treated by HTO is uneven, and its fluctuation is larger than that of the sample without HTO treatment. The uniformity of the oxide distribution is related to the corrosion resistance of the sample; the more uneven its distribution is, the worse its corrosion resistance is.
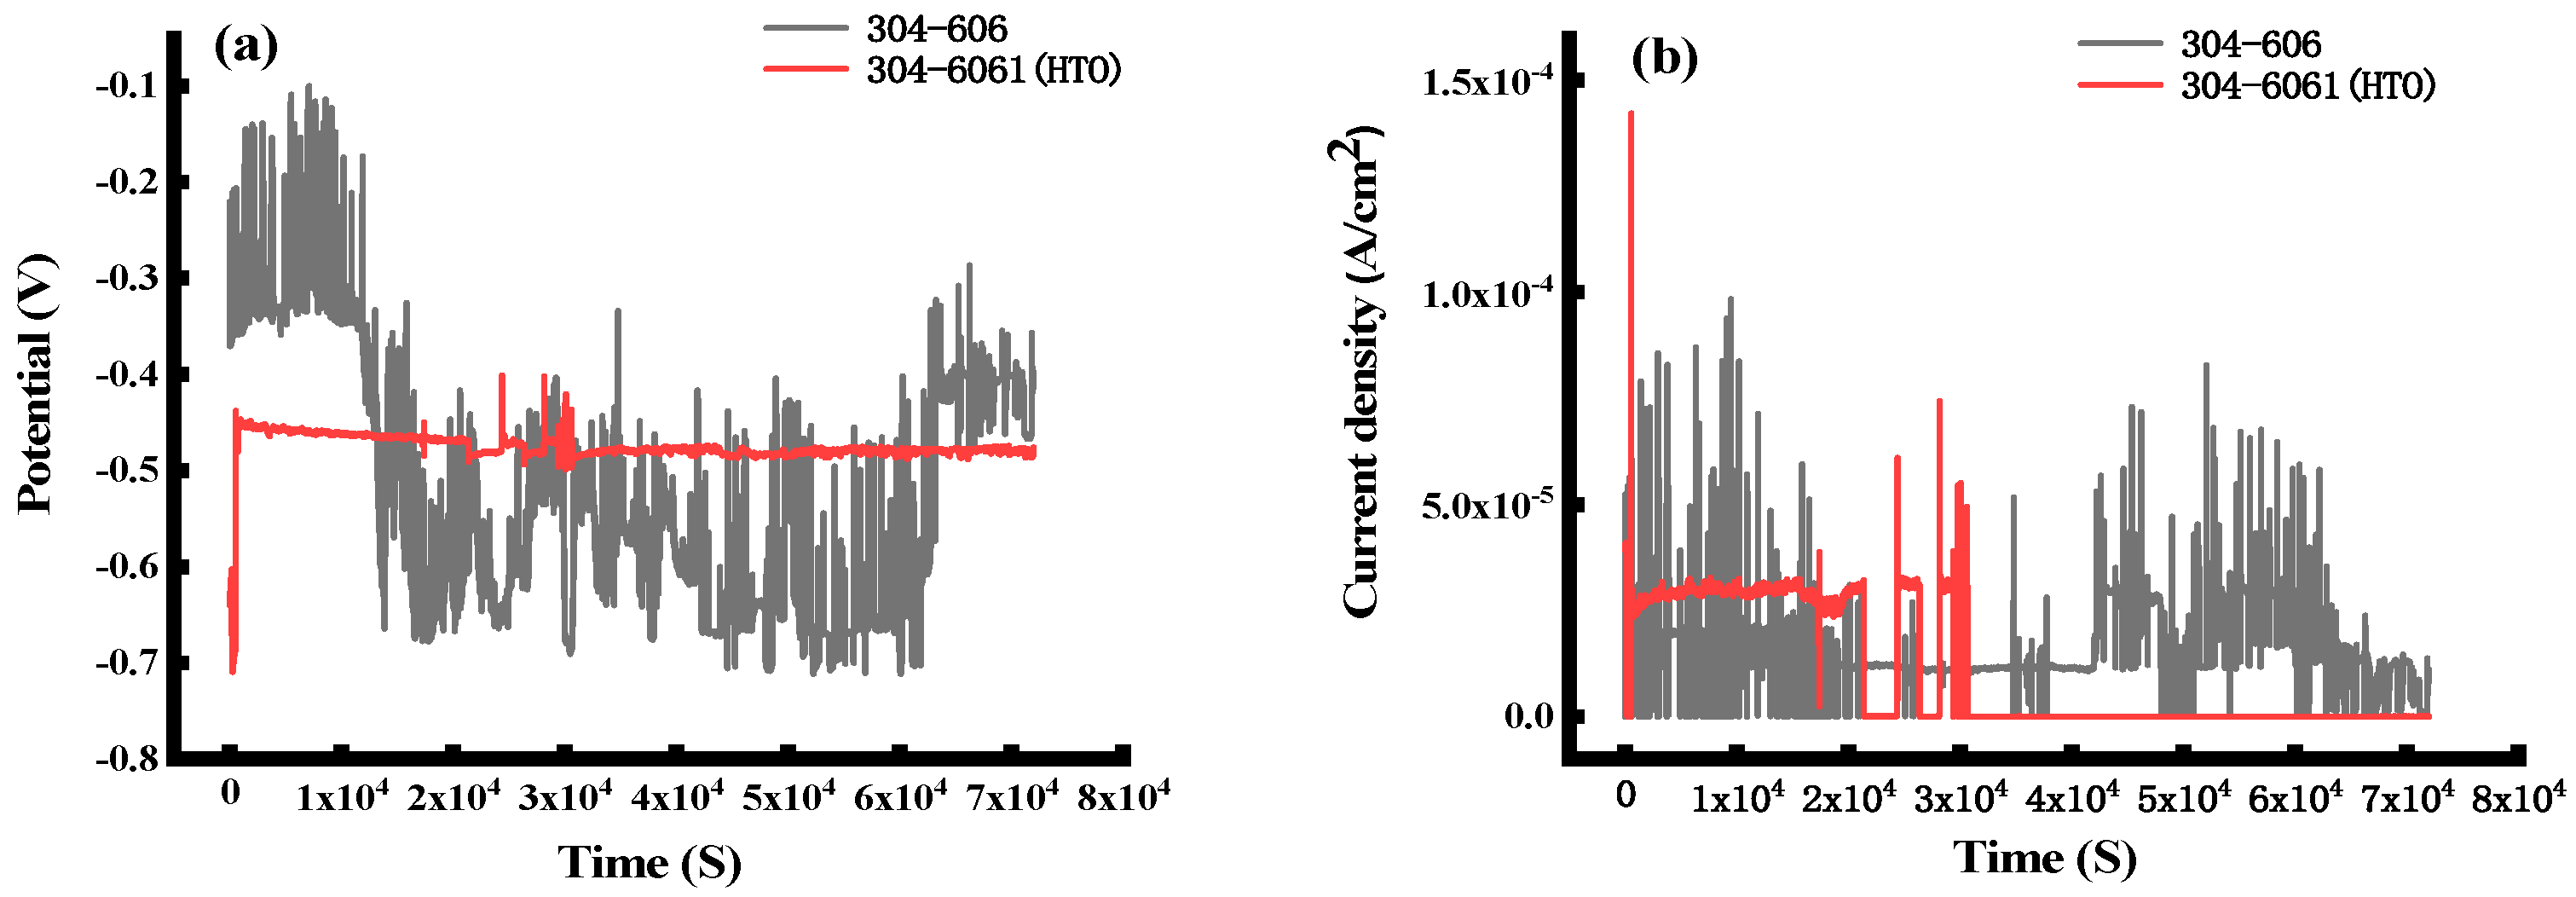
A total of 360,000 data points were obtained through electrochemical noise measurements both in current and potential vs. time. Figure 9 displays the time dependence of the galvanic potential (a) and current density (b) for the 304-6061 and 304-6061 (HTO) couples in 3.5 wt.%NaCl solution. From these plots, both the galvanic potential and current density of the 304-6061 couple oscillate sharply; the maximum amplitude for potential is 0.6 V, while that for current density is 0.32 × 10⁻⁶ A/cm2. The galvanic potential of the 304-6061 (HTO) couple has no obvious fluctuation, except that the potential fluctuation amplitude is approximately 0.01 V between 24,374 s and 31,254 s. High frequency fluctuation is observed for the galvanic current density of the 304-6061 (HTO) couple after 30,000 s and then trends toward stable. From the above analysis, it can be inferred that the galvanic corrosion of the 304-6061 couple was more active than that of the 304-6061 (HTO) couple. The average galvanic current density of the 304-6061 couple (1.571 × 10⁻⁵ A/cm2) is slightly higher than that of the 304-6061 (HTO) couple (1.044 × 10⁻⁵ A/cm2), which means that the samples after HTO treatment have a lower tendency of galvanic corrosion. However, according to the data analysis after polarization corrosion (Figure 6 and Figure 7), the samples with HTO treatment have more serious corrosion, which may be due to the following two reasons: on the one hand, the HTO treatment is carried out in air, and the oxygen content is not sufficient, resulting in an uneven oxide film (Figure 3). On the other hand, there were small cracks in local areas of the surface oxide film (Figure 5), easily leading to local corrosion. The samples with HTO treatment are more prone to many local pits, thus increasing the corrosion rate, as shown in Figure 6 and Figure 7.
4. Conclusions
(1) Compared with the sample without HTO treatment, petal-shaped Fe-Al compounds were sparsely distributed in the weld center after high-temperature oxidation treatment. The width of the IMCs at the interface after HTO treatment is approximately 7–8 μm, and the width of the IMCs at the interface without HTO treatment is approximately 2–3 μm.
(2) The oxide film thickness (2401 nm) of the 6061 side of the dissimilar metal welded joint treated by HTO was thicker than that (181.1 nm) of the 6061 side of the weld joint without HTO treatment.
(3) The order of the corrosion current density was weld (HTO) >weld>6061 (HTO) >6061>304 (HTO) >304.
(4) The high-temperature oxidation treatment method mentioned in the article will reduce the corrosion resistance of the base metal and weld joints.
Author Contributions
Methodology, investigation, data curation, formal analysis, original draft, R.L.; Welding experiment, investigation, Y.L. (Yunqi Liu); Welding experiment, investigation, H.L.; Supervision, funding acquisition, Y.L. (Yuanxing Li); Funding acquisition, H.C.; Conceptualization, supervision, review and editing, funding acquisition, Z.Z. All authors have read and agreed to the published version of the manuscript.
Funding
This research was funded by the National Natural Science Foundation of China (No. 52275384, U2167216 and 52275385) and Key Research & Development Projects of Sichuan Province in China (No. 2022YFG0086).
Institutional Review Board Statement
Not applicable.
Informed Consent Statement
Not applicable.
Data Availability Statement
The original contributions presented in the study are included in the article, further inquires can be directed to the corresponding author.
Conflicts of Interest
The authors declare no conflicts of interest.
References
- Singh, P.; Deepark, D.; Brar, G.S. Optical micrograph and micro-hardness behavior of dissimilar welded joints of aluminum (Al 6061-T6) and stainless steel (SS 304) with friction crush welding. Mater. Today Proc. 2021, 44, 1000–1004. [Google Scholar] [CrossRef]
- Hu, C.; Yan, F.; Xu, Y.; Zhu, Z.; Chai, F.; Tao, J.; Xiao, Z.; Wang, C. Effect of alternating magnetic field on microstructure and performance for dissimilar welding-brazing of galvanized steel to 6061 aluminum alloy in an overlapping configuration. Opt. Laser Technol. 2022, 155, 108423. [Google Scholar] [CrossRef]
- Seo, B.; Song, K.H.; Park, K. Corrosion properties of dissimilar friction stir welded 6061 aluminium and HT590 steel. Met. Mater. Int. 2018, 24, 1232–1240. [Google Scholar] [CrossRef]
- Lim, Y.; Squires, L.; Pan, T.; Miles, M.; Keum, J.K.; Song, G.L.; Wang, Y.; Feng, Z. Corrosion behaviour of friction-bit-joined and weld-bonded AA7075-T6/galvannealed DP980. Sci. Technol. Weld. Join. 2017, 22, 455–464. [Google Scholar] [CrossRef]
- Narsimhachary, D.; Rai, P.K.; Shariff, S.M.; Padmanabham, G.; Mondal, K.; Basu, A. Corrosion behavior of Laser-Brazed surface made by joining of AA6082 and galvanized steel. J. Mater. Eng. Perform. 2019, 28, 2115–2127. [Google Scholar] [CrossRef]
- Ma, H.; Qin, G.; Geng, P.; Ao, Z.; Chen, Y. Effect of intermetallic compounds on the mechanical property and corrosion behavior of aluminum alloy/steel hybrid fusion-brazed welded structure. J. Manuf. Process. 2022, 75, 170–180. [Google Scholar] [CrossRef]
- Fan, C.; Yang, S.L.; Duan, C.F.; Zhu, M.Q.; Bai, Y.S. Microstructure mechanical properities of 6061 aluminum alloy laser-MIG hybrid welding joint. J. Cent. South Univ. 2022, 29, 898–911. [Google Scholar] [CrossRef]
- Huang, H.; Zhang, P.; Yan, H.; Liu, Z.; Yu, Z.; Wu, D.; Shi, H.; Tian, Y. Research on weld formation mechanism of laser-MIG arc hybrid welding with butt gap. Opt. Laser Technol. 2021, 133, 106530. [Google Scholar] [CrossRef]
- Yavuz, A.; Yilmaz, N.F.; Kalkan, M.F. Enhancement in the Corrosion Resistance of Nickel Metal Via a Straightforward Thermal Oxidation Method. J. Bio Tribo-Corros. 2023, 9, 22. [Google Scholar] [CrossRef]
- Mei, S.W.; Gao, M.; Yan, J.; Zhang, C.; Li, G.; Zeng, X.Y. Interface Properties and Thermodynamic Analysis of Laser-arc Hybrid Welded Al/Steel Joint. Sci. Technol. Weld. Join. 2013, 18, 293–300. [Google Scholar] [CrossRef]
- Dong, H.; Liao, C.; Yan, L.; Dong, C. Effects of post-weld heat treatment on dissimilar metal joint between aluminum alloy and stainless steel. Mater. Sci. Eng. A 2012, 550, 423–428. [Google Scholar] [CrossRef]
- Li, Z.; He, Y.; Qi, H.; Gao, W. Diagrams on the standard free energy change per unit volume for the formation of oxide (Sulifide, Carbide, Nitride). Chin. J. Nonferrous Met. 1998, 8, 55–60. [Google Scholar]
- Yu, C.-L.; Shen, Q.; Jiang, H.-T.; Wang, L.-L. Transformation and Morphology of the Surface Oxides during High-temperature Oxidation of Aluminium. J. Synth. Cryst. 2010, 39, 1308–1312. [Google Scholar]
- Ishida, T.; Harayama, Y.; Yaguchi, S. Oxid. 304 Stainl. Steel HighTemperature Steam. J. Nucl. Mater. 1986, 140, 74–84. [Google Scholar]
- Ahmad, Z. Principles of Corrosion Engineering and Corrosion Control; Elsevier: New York, NY, USA, 2006; pp. 75–83. [Google Scholar]
- Anaman, S.Y.; Cho, H.H.; Das, H.; Lee, J.S.; Hong, S.T. Microsturcture and mechanical/electrochemical properties of friction stir butt welded joint of dissimilar aluminum and steel alloys. Mater. Charact. 2019, 154, 67–79. [Google Scholar] [CrossRef]
- Okonkwo, B.O.; Ming, H.; Wang, J.; Han, E.H.; Rahimi, E.; Davoodi, A.; Hosseinpour, S. A new method to determine the synergistic effects of area ratio and microstructure on the galvanic corrosion pf LAS A508/306L/308L SS dissimilar metals weld. J. Mater. Sci. Technol. 2021, 78, 38–50. [Google Scholar] [CrossRef]
- Tedmon, C.S., Jr.; Vermilyea, D.A.; Rosolowski, J.H. Intergranular Corrosion of Austenitic Stainless Steel. J. Electrochem. Soc. 1971, 118, 192–201. [Google Scholar] [CrossRef]
- Devine, T.M. The mechanism of sensitization of austenitic stainless steel. Corros. Sci. 1990, 30, 135–151. [Google Scholar] [CrossRef]
- Singh, R.; Slathia, R.S. Effect of Cryogenic Treatment on Sensitization of 304 Stainless Steel in TIG Welding. J. Inst. Eng. India Ser. C 2016, 97, 127–130. [Google Scholar] [CrossRef]
Figure 1.
Micrographs of the dissimilar weld-brazed joint. ((a,d) weld center, (b,e) aluminum weld heat-affected zone, (c,f) steel-aluminum interface).
Figure 1.
Micrographs of the dissimilar weld-brazed joint. ((a,d) weld center, (b,e) aluminum weld heat-affected zone, (c,f) steel-aluminum interface).

Figure 2.
EDS surface scan of the partially enlarged view in Figure 1a,b: (a) without high-temperature oxidation, (b) with high-temperature oxidation.
Figure 2.
EDS surface scan of the partially enlarged view in Figure 1a,b: (a) without high-temperature oxidation, (b) with high-temperature oxidation.

Figure 3.
Surface image of the HTO-treated specimen: macromorphology for the image (a), microstructure for the remaining images, (b–d) partial enlarged images of the interface, stainless steel and aluminum alloy, respectively(the upper right corner is a partially enlarged view), (e) partial enlarged images of the IMCs.

Figure 4.
EDS micrograph analyses of the HTO-treated specimen shown in Figure 3, (a–c): the oxygen content on the surfaces of the IMCs, 304 and 6061 respectively (The number in the bottom right corner of the image is the atomic concentration).
Figure 4.
EDS micrograph analyses of the HTO-treated specimen shown in Figure 3, (a–c): the oxygen content on the surfaces of the IMCs, 304 and 6061 respectively (The number in the bottom right corner of the image is the atomic concentration).

Figure 5.
SEM cross-section images of the HTO-treated specimen ((a–e) with HTO treatment, (f) 6061 side of the weld joint without HTO treatment).
Figure 5.
SEM cross-section images of the HTO-treated specimen ((a–e) with HTO treatment, (f) 6061 side of the weld joint without HTO treatment).

Figure 6.
Potentiodynamic polarization curves of the specimens in 3.5 wt.% NaCl solution.

Figure 7.
Corrosion morphology after polarization.the left images (a,c,e,g): the microstructure of the poparized samples, the right images (b,d,f,h): the microstructure of the polarized samples after HTO treatment.
Figure 7.
Corrosion morphology after polarization.the left images (a,c,e,g): the microstructure of the poparized samples, the right images (b,d,f,h): the microstructure of the polarized samples after HTO treatment.

Figure 8.
EDS line scan analyses of the specimens yellow line marked in Figure 7e,f. (a) weld joint; (b) weld joint (HTO).
Figure 8.
EDS line scan analyses of the specimens yellow line marked in Figure 7e,f. (a) weld joint; (b) weld joint (HTO).

Figure 9.
Electrochemical noise records of 304-6061 and 304-6061(HTO) during 72,000 s in 3.5%NaCl solution. (a) Potential of 304-6061 and 304-6061(HTO) during 72,000 s in 3.5%NaCl solution; (b) Current density of 304-6061 and 304-6061(HTO) during 72,000 s in 3.5%NaCl solution.
Figure 9.
Electrochemical noise records of 304-6061 and 304-6061(HTO) during 72,000 s in 3.5%NaCl solution. (a) Potential of 304-6061 and 304-6061(HTO) during 72,000 s in 3.5%NaCl solution; (b) Current density of 304-6061 and 304-6061(HTO) during 72,000 s in 3.5%NaCl solution.


Table 1.
The main chemical composition of the base metals and filler wire (wt.%).
| Materials | Al | Fe | Si | Cr | Ni | Mg | Mn |
|---|---|---|---|---|---|---|---|
| SUS304 | - | Bal. | 0.57 | 17.51 | 8.02 | - | 1.53 |
| 6061-T6 | Bal. | 0.7 | 0.4–0.8 | 0.04–0.35 | - | 0.8–1.2 | 0.15 |
| ER4043 | Bal. | ≤0.6 | 4.5–6.0 | - | - | ≤0.05 | ≤0.05 |
Table 2.
EDS analysis in Figure 1.
Table 2.
EDS analysis in Figure 1.
| Point No. | at.% | Remarks | ||||
|---|---|---|---|---|---|---|
| Al | Fe | Si | Cr | O | ||
| 1 | 90.50 | - | 0.68 | - | 0.66 | spot scan |
| 2 | 74.24 | 2.85 | 7.82 | 0.75 | 2.03 | spot scan |
| 3 | 59.68 | 10.03 | 8.62 | 3.86 | 2.73 | spot scan |
| 4 | 86.62 | 0.13 | - | - | 0.63 | spot scan |
| 5 | 24.56 | 45.99 | 1.13 | 10.79 | 1.93 | spot scan |
| 6 | 77.07 | - | 0.45 | - | 1.67 | spot scan |
| 7 | 41.16 | 15.5 | 5.37 | 8.73 | 2.73 | spot scan |
| 8 | 60.28 | 18.03 | 2.30 | 2.00 | - | spot scan |
| 9 | 83.29 | 0.29 | - | - | 1.31 | spot scan |
| Figure 1a | 78.68 | 0.65 | 1.45 | 0.27 | 1.3 | surface scan |
| Figure 1d | 79.37 | 1.15 | 2.39 | 0.4 | 1.73 | surface scan |
Table 3.
EDS analysis in Figure 3.
Table 3.
EDS analysis in Figure 3.
| Point No. | at.% | Remarks | ||||
|---|---|---|---|---|---|---|
| Al | Fe | Si | Cr | O | ||
| 1 | 0.35 | 67.12 | 0.75 | 18.71 | 5.99 | spot scan |
| 2 | 63.35 | 19.5 | 3.56 | 5.73 | 4.41 | spot scan |
| 3 | 74.71 | - | 3.11 | - | 8.61 | spot scan |
| IMC | 56.05 | 16.32 | 3.81 | 4.89 | 4.12 | surface scan |
| 304 | - | 57.12 | 0.87 | 15.75 | 7.65 | surface scan |
| 6061 | 61.52 | 0.61 | 2.71 | 0.31 | 20.51 | surface scan |
Table 4.
EDS analysis performed at the points shown in Figure 5.
Table 4.
EDS analysis performed at the points shown in Figure 5.
| Point No. | at.% | Remarks | ||||
|---|---|---|---|---|---|---|
| Al | Fe | Si | Cr | O | ||
| 1 | 0.39 | 82.26 | 0.40 | 7.26 | 5.47 | spot scan |
| 2 | 6.91 | 75.51 | 1.37 | 8.43 | 4.29 | spot scan |
| 3 | 75.58 | 11.91 | 5.18 | 1.41 | 5.11 | spot scan |
| 4 | 8.79 | 71.06 | 1.7 | 12.05 | 1.92 | spot scan |
| 5 | 0.30 | 75.01 | 0.69 | 13.02 | 6.00 | spot scan |
| 6 | 0.36 | 76.6 | 0.56 | 14.59 | 1.61 | spot scan |
| 7 | 71.95 | 0.65 | 11.72 | 0.27 | 9.82 | spot scan |
| 8 | 78.21 | - | - | - | 1.69 | spot scan |
| 9 | 89.22 | 0.30 | 2.22 | - | 7.04 | spot scan |
| 10 | 83.36 | 0.45 | 3.48 | - | 7.45 | spot scan |
Table 5.
Results of potentiodynamic polarization tests in 3.5 wt.% NaCl solution.
| Samples | Ecorr, V | Icorr, A/m2 × 10−3 |
|---|---|---|
| 304 | 0.057 | 0.241 |
| 304 (HTO) | −0.020 | 1.07 |
| 6061 | −0.447 | 1.4 |
| 6061 (HTO) | −0.946 | 11.4 |
| weld | −0.341 | 25.3 |
| weld (HTO) | −0.813 | 34.4 |
Table 6.
EDS analysis in Figure 7.
Table 6.
EDS analysis in Figure 7.
| Point No. | at.% | Remarks | ||||
|---|---|---|---|---|---|---|
| Al | Fe | Si | Cr | O | ||
| 1 | - | 39.23 | 0.97 | 10.63 | 41.04 | spot scan |
| 2 | - | 62.66 | 0.97 | 17.52 | 11.43 | spot scan |
| 3 | 64.97 | - | 3.01 | 0.07 | 10.48 | spot scan |
| 4 | 98.07 | 0.03 | 0.24 | 0.06 | 1.60 | spot scan |
| 5 | 84.18 | 3.11 | 3.48 | 0.54 | 4.95 | spot scan |
| 6 | 47.32 | - | 20.56 | - | 30.49 | spot scan |
Disclaimer/Publisher’s Note: The statements, opinions and data contained in all publications are solely those of the individual author(s) and contributor(s) and not of MDPI and/or the editor(s). MDPI and/or the editor(s) disclaim responsibility for any injury to people or property resulting from any ideas, methods, instructions or products referred to in the content. |
© 2024 by the authors. Licensee MDPI, Basel, Switzerland. This article is an open access article distributed under the terms and conditions of the Creative Commons Attribution (CC BY) license (https://creativecommons.org/licenses/by/4.0/).
Share and Cite
MDPI and ACS Style
Liu, R.; Liu, Y.; Liu, H.; Li, Y.; Chen, H.; Zhu, Z. High-Temperature Oxidation of the 304/6061 Welding–Brazing Joint and Its Effects on Corrosion Characteristics. Appl. Sci. 2024, 14, 3131. https://doi.org/10.3390/app14073131
AMA Style
Liu R, Liu Y, Liu H, Li Y, Chen H, Zhu Z. High-Temperature Oxidation of the 304/6061 Welding–Brazing Joint and Its Effects on Corrosion Characteristics. Applied Sciences. 2024; 14(7):3131. https://doi.org/10.3390/app14073131
Chicago/Turabian StyleLiu, Ruilin, Yunqi Liu, Hongming Liu, Yuanxing Li, Hui Chen, and Zongtao Zhu. 2024. "High-Temperature Oxidation of the 304/6061 Welding–Brazing Joint and Its Effects on Corrosion Characteristics" Applied Sciences 14, no. 7: 3131. https://doi.org/10.3390/app14073131
Note that from the first issue of 2016, this journal uses article numbers instead of page numbers. See further details here.