Abstract
With the development of vehicle-road network technologies, the future traffic flow will appear in the form of hybrid network traffic flow for a long time. Due to the change in traffic characteristics, the current hard shoulder running strategy based on traditional traffic characteristics cannot effectively serve the hybrid network traffic flow scenario, and will even lead to the further deterioration of traffic congestion. In order to propose a hard shoulder running strategy suitable for a hybrid network environment, a traffic breakdown prediction method based on a hidden Markov model was established. Secondly, the characteristics of traffic breakdown in a hybrid network environment were analyzed. Finally, based on the traffic breakdown characteristics in a hybrid network environment, a dynamic hard shoulder running method based on the hidden Markov model was proposed. The effectiveness of HMMD-HSR was verified by simulation and comparison with HMM-HSR, LMD-HSR, and N-HSR. The simulation results show that the HMMD-HSR proposed in this paper can improve operation efficiency and reduce travel time in a congested expressway.
1. Introduction
1.1. Background
Due to the rapid development of vehicular networking technology, regular human-driven traffic flow is gradually evolving into a mixed traffic flow where human-driven vehicles (HVs) and connected-automated vehicles (CAVs) coexist. Previous studies have reported that the deployment of CAVs is a long-term process, with heterogeneous traffic flow as a required stage [1,2]. The fast-growing trend of intelligent transportation systems (ITS) including active traffic management (ATM) [3] brings new opportunities and challenges to traffic management. ATM generally takes freeways and expressways as research objects, employing various management and control strategies to tackle regular and occasional congestion issues based on the present and expected traffic circumstances [4]. As one of the ATM systems, hard shoulder running (HSR) [5] has received considerable critical attention since it utilizes existing physical infrastructure and significantly reduces the cost of reconstruction [6].
Initially, the hard shoulder was primarily intended for safety [7]. It provides a safe temporary parking spot for malfunctioning vehicles on a freeway with high volumes and speeds, ensuring driving safety while not interfering with normal traffic. According to recent research, temporarily opening hard shoulders as additional lanes can successfully ease congestion [8,9,10,11,12]. Existing studies of HSR strategies usually focus on traditional road scenarios [13,14,15,16,17]. For example, Ma et al. [12] proposed dynamic hard shoulder running (D-HSR) and applied different D-HSR strategies to study accident management using micro-simulation. He suggested that only the shoulder 0.5 miles upstream and downstream of the accident location needed to be opened, and that the D-HSR strategy was more appropriate for property damage only (PDO) events. A hybrid hard shoulder running operation system (H-HSROS) proposed by Hussein et al. [18] enables transit departments to operate HSR safely and efficiently. Li et al. [6] employed the cellular transmission model to conduct linear programming modeling of the hard shoulder running, ramp metering, and speed coordination control measures and took the minimum total delay as the optimization goal. The researcher modified the optimization goal to include a safety factor based on the frequency of shoulder changes, allowing the objective function to represent trade-offs between efficiency and safety. Arora et al. [19] applied model predictive control (MPC) to introduce a new dynamic control strategy based on variable speed limit (VSL) and hard shoulder running (HSR), and discovered that the combined effect of various intelligent transportation system (ITS) strategies was far greater than the effect of a single strategy through experiments. Zhou et al. [20] proposed a VSL and HSR joint control strategy based on reinforcement Q-Learning, which established a connection between traffic flow data and the ATM control strategy during the self-learning process. Despite several studies on HSR, with the rapid rise of CAV market penetration, few researchers have investigated HSR in a hybrid network environment. Most of the earlier research focused on other ATM strategies in a hybrid network environment [21,22,23,24,25,26,27].
Numerous studies have demonstrated that the addition of CAVs will modify the headway and speed of traffic flow, resulting in changes in road capacity [28,29,30]. Therefore, current HSR research in traditional traffic scenarios cannot meet these requirements. To develop a hard shoulder opening approach that is more suitable for a hybrid network environment, this paper analyzed the features of traffic speed breakdown in the hybrid network environment and proposed a dynamic hard shoulder opening strategy based on a hidden Markov model (HMM). The remaining sections of this article are organized as follows. Section 2 describes the freeway scenario and hybrid traffic flow while Section 3 introduces a traffic breakdown prediction model and a hard shoulder dynamic opening strategy. Section 4 analyzes the traffic breakdown characteristics of the hybrid network scenario and verifies the effectiveness of dynamic hard shoulder running based on HMM (HMMD-HSR) by comparing it to hard shoulder running based on HMM (HMM-HSR), dynamic hard shoulder running based on logistic model (LMD-HSR), and no hard shoulder running (N-HSR). Finally, Section 5 summarizes the research results. The main contribution of this paper is as follows:
- (1)
- Modeling a mixed traffic flow expressway scenario and proposing a traffic breakdown prediction method based on a hidden Markov model;
- (2)
- Analyzing the characteristics of traffic breakdown in a hybrid network environment by comparing them with the logistic model-based prediction method;
- (3)
- Proposing a dynamic hard shoulder running method (HMMD-HSR) based on the traffic breakdown characteristics and verifying its effectiveness through a combined simulation of SUMO (1.9.2) and MATLAB (R2019b).
1.2. Literature Review
The existing research on the HSR strategy have focused on identifying the key indicators that determine the opening and closing of the hard shoulder. The following categories of indicators are commonly considered:
- (1)
- Traffic flow: Urban highway congestion is primarily caused by the traffic flow exceeding road capacity during peak hours. Therefore, many scholars consider traffic flow to be the key index for implementing the HSR strategy, which temporarily expands the road capacity by opening the hard shoulder. Carlson et al. [31] found that opening the hard shoulder when traffic exceeded a certain threshold helped alleviate congestion caused by heavy traffic flow. Cohen [32] also explored the effect of the dynamic opening of the hard shoulder on road bottlenecks, using traffic flow as a starting point. The hard shoulder increases the traffic capacity of bottleneck sections.
- (2)
- Safety: Extensive studies have been conducted on the safety impact of opening the hard shoulder [5,33,34,35,36], and the primary purpose of the hard shoulder is to serve as an emergency lane for vehicles that have broken down. If the goal is to maximize highway capacity, the hard shoulder will be in use throughout the simulation. However, it is important to consider the needs of accidents and not overuse the hard shoulder. In that case, Li et al. [6] introduced a safety weight to incorporate safety factors into the design of the hard shoulder open strategy. Other researchers believe that HSR can be used as a supplementary measure to VSL. The hard shoulder is only opened when VSL is unable to handle excessive traffic [19,20] in order to balance the negative impact on safety indicators.
- (3)
- Speed: Some researchers have explored the possibility of the open threshold of the hard shoulder from the angle of speed change characteristics. Ma et al. [37] introduced the concept of traffic breakdown as a threshold for hard shoulder opening. Chen et al. [38] argued that breakdown occurs when traffic flow switches from free to congested, which is frequently accompanied by continuous oscillation, resulting in large-scale congestion. Consequently, it becomes necessary to identify traffic breakdowns and manage them in advance. The definition of traffic breakdown has not been uniformly quantified. Many researchers have different definitions of breakdown based on the changing characteristics of road sections from free to congested, establishing a speed drop threshold or a density rise threshold [39,40]. Ma et al. [37] defined the critical vehicle speed and provided a method for calculating the drop threshold. However, most traffic breakdown studies have only focused on traditional human-driving scenarios, and it appears that few studies have examined mixed traffic flow scenarios.
As different users place different emphasis on safety indicators and traffic, there are many possible weighting relationships between safety indicators and traffic, which will also have a great impact on the hard shoulder opening policy. Considering that the speed characteristics of the road section can reflect the change in traffic flow and the possibility of accidents, this paper mainly considered the speed factor when designing the dynamic HSR strategy.
2. Hybrid Network Expressway Scene Modeling
2.1. Dynamic Expressway Hard Shoulders Opening
The expressway hard shoulder refers to the pavement area with a certain strength adjacent to the carriageway. Various countries place differing emphasis on the shoulder-setting. In typical countries such as the United Kingdom and the Netherlands, both the right and left hard shoulders can be utilized for HSR. According to the Federal Highway Administration (FHWA), expressway use is increasing at a rate of roughly 2% per year, and this trend is expected to continue. The survey also highlighted that traffic congestion has not only increased, but has also become more unstable over the past 20 years [41]. Relevant research has shown that in congested road sections during peak hours, temporarily allowing traffic to run on hard shoulders and implementing coordinated speed control can increase the traffic capacity by 15% to 30% without the need for road expansion [42,43,44], thereby alleviating regular traffic congestion problems.
According to the relevant standards, the hard shoulder will only be opened when it is safe and with no obstructions. Drivers must obey the signs and speed limits to ensure their own safety as well as that of other road users, and the hard shoulder is applied as an extra lane only when it is declared open. If there is no effective signal on the hard shoulder, drivers should not use it as it is illegal and unsafe, and whether an accident occurs on the original road or the open hard shoulder, all hard shoulders should be closed to avoid affecting emergency vehicles. Due to the increasing popularity of CAVs, the composition of expressway traffic flow is expected to change in the future [45]. As shown in Figure 1, while considering setting up a hard shoulder opening strategy, it is also vital to fully consider the characteristics of connected vehicles and non-connected vehicles.
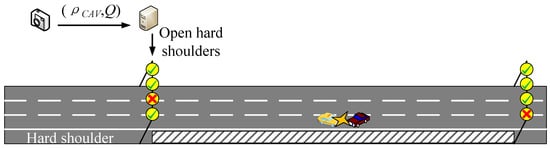
Figure 1.
An expressway with hard shoulder opening applies.
2.2. Hybrid Network Traffic Flow Modeling
HVs are often not very capable of obtaining road instructions. This has been reflected in many studies on the acquisition rate of expressway road instruction [41,46]. While connected autonomous vehicles are frequently equipped with on-board units (OBUs) that can be integrated into any car or used as a vehicle simulator in the absence of actual traffic, allowing real-time information exchange between the vehicle and the infrastructure [47] and ensuring full access to road indication. Therefore, in the subsequent work, we assumed that CAVs can obtain all road information indicated by variable message signs (VMSs). Considering that hard shoulder opening messages are often displayed on VMSs, which are similar to expressway routing instructions, the information acquisition rate of human-driving vehicles on expressway hard shoulders conforms to the Logit utility model.
is the probability that HV accepts VMS information. This is affected by two factors: w1 is the driver’s driving experience, and w2 is the driver’s personality. a, b, and c are the fitting parameters, respectively.
In a mixed traffic flow randomly composed of CAVs and HVs, we defined () as the penetration rate of CAVs. When the front vehicle of the CAV has a vehicle-to-vehicle communication function, these CAVs will adopt collaborative adaptive cruise control (CACC) mode, known as CACC vehicles [48,49,50]; otherwise, they will follow with adaptive cruise control (ACC), known as ACC vehicles, as shown in Figure 2 [51,52]. Currently, the most common forms of car-following are:
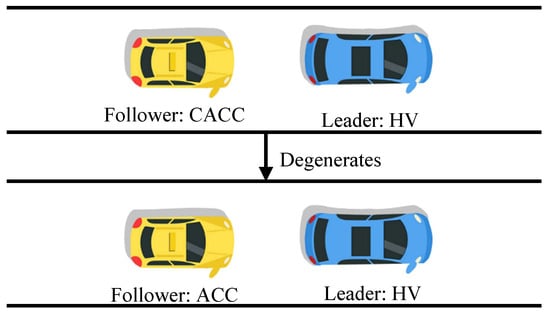
Figure 2.
Changes in the CAV follower model.
- (1)
- HDV follows HDV.
When the vehicles are both human-driven cars, and the driving behavior or speed of the front vehicle suddenly changes, the rear car needs a certain amount of reaction time to make a judgment and then adjust its driving behavior. Since the proportion of HDV is 1 − ρ, the theoretical proportion of this following mode is .
- (2)
- HDV follows CAV.
P2 is when the front automobile is connected and automated and the car behind is human-driven. When the status of the front vehicle changes, the vehicle behind still requires some reaction time to adjust. Therefore, it is the same as the first following mode with a proportion of .
- (3)
- CAV follows HDV.
When the front car is human-driven and the car behind is connected and automated, the car behind is outfitted with relevant sensing equipment (such as cameras, etc.). Therefore, when the lead car abruptly accelerates or decelerates, the on-board sensors of the following car precisely capture the behavior in front and make quick decisions. Compared with Formulas (1) and (2), the expected headway is shorter. The proportion of this following mode is .
- (4)
- CAV follows CAV.
When the vehicles are both connected and automated, they can share real-time road information and driving behaviors, achieving “vehicle-to-vehicle communication”. For instance, if the front vehicle decides to speed up and slow down, the following vehicle can receive that at the same moment, allowing the corresponding decision to be made promptly. In this car-following mode, the front and rear vehicles can be treated as a whole, and the expected headway is the shortest. According to the analysis, the proportion of this car-following mode is .
3. Dynamic Hard Shoulder Running Strategy Based on Hidden Markov Model
Considering the difference between the ability of the CAV and the HV to obtain traffic information in mixed traffic flow, it was assumed that the VMSs were evenly distributed on the road sections. The main basis for HSR in this paper is the traffic breakdown, as shown in Figure 3, which occurs when the average speed in a road section suddenly drops and does not recover for a long period of time. As mentioned in Section 2.2, there are variations in car-following models for mixed traffic flows with CAVs, and existing research has indicated that the traffic capacity differs across different penetration rates. Consequently, there are also differences in the phenomena of traffic breakdown at varying penetration rates. The unchanged traffic breakdown prediction method (with a penetration rate of 0) cannot accurately predict traffic breakdown in mixed traffic flows with CAVs. Therefore, hereinafter, we will propose a traffic breakdown prediction method in mixed traffic flows with CAVs as well as investigate the impact of different penetration rates on traffic breakdown in mixed traffic flows with CAVs, ultimately constructing HSR strategies in such situations. It is worth noting that the scenario in this paper is an ideal scenario that does not consider weather and other factors, and only discusses the impact of the traffic characteristics of CAVs and HVs.
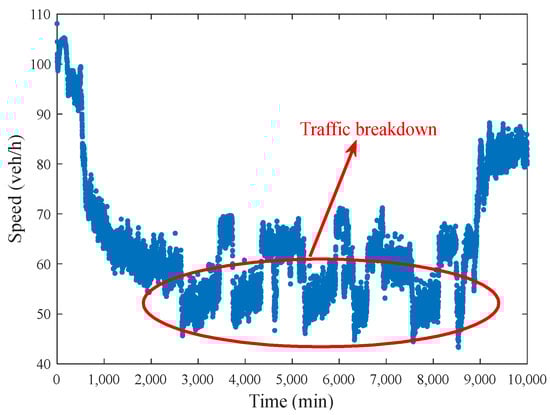
Figure 3.
Traffic breakdown diagram.
3.1. Traffic Breakdown Probability Calculation
In order to detect traffic breakdown incidents, the specific manifestation of traffic breakdown must first be defined. The breakdown state can be defined as an abrupt drop in vehicle speed that fails to recover above a critical speed over a period of time. To address the differences in the characteristics of traffic flow on different lanes, the paper adopted the cross-sectional speed detection method to define the breakdown state of a roadway in a hierarchical manner. A road’s breakdown situation must be clear and definite before defining its breakdown state. Define the breakdown as a state in which the vehicle speed is less than the critical speed (km/h) and does not recover above for (min), where is the critical speed. The limit of is to prevent misjudging transient deceleration as a traffic breakdown.
The physical meaning of is that a breakdown is considered to have occurred when the speed is less than that value. Intuitively, if the speed is close to , a rapid and widespread deceleration is likely to occur, leading to a breakdown in the traffic flow. Therefore, the confirmation of is to find a speed point at which a significant fluctuation occurs when the vehicle speed reaches this value.
Therefore, can be determined through the following three steps:
- (1)
- Calculate the average speed for a continuous period of time (min);
- (2)
- Calculate the standard deviation of the speed in ;
- (3)
- Repeat the previous two steps to calculate the standard deviation of all average speeds , respectively. The critical speed is the corresponding to the greatest value of . The formulas for each parameter are as follows:where is the flow rate at moment ; is the average speed on the road at moment ; is the weighted average speed during period (min) starting at moment , and the weights are the traffic flow at the corresponding moments; is the weighted standard deviation of the speeds during period starting at moment , and the weights are .
According to the setting method of and the definition of single-lane breakdown, single-lane breakdown incidents can be detected from the raw data, which can be carried out through the changes in the speed of each lane in the studied road section.
3.2. Traffic Breakdown Predict Model under Hybrid Network
The traffic breakdown state cannot be directly detected by the detector, however, it is closely related to traffic flow parameters such as density and speed. Furthermore, the CAV penetration rate is also regarded as a factor, given the characteristics of mixed traffic flows with CAVs. Considering the memorylessness of both traffic breakdown and traffic flow parameters, this paper modeled the evolution process of traffic breakdown using the hidden Markov model (HMM).
HMM extends the concepts of the Markov process and the Markov model, the complexity of which lies in the fact that the signals that occur in state transitions in the model cannot be directly detected, and those that cannot be directly detected are referred to as hidden states. Changes in hidden states can lead to changes in display states, which can be detected directly. HMM can be used to solve three categories of problems: evaluation problems, decoding problems, and learning problems. The traffic breakdown state is regarded as a hidden state in this research, whereas the detectable upstream vehicle density and CAV penetration rate are display states, thus establishing HMM.
HMM can be constructed with the following six parameters:
Number of hidden state types . All hidden states constitute the set , where represents the hidden state of moment t, and the hidden state type is defined as the breakdown type, which can be denoted as ;
Number of display state types . All display states constitute the set . The display state is expressed by the upstream vehicle density and the CAV penetration rate, with the upstream vehicle density ranging from 0 to the historical maximum values, and the CAV penetration rate ranging from 0 to 1.
The initial hidden state distribution vector , , where is the probability that the hidden state is when ;
Hidden state transition probability matrix , , where is the probability of a hidden state transitioning from at moment to at moment , that is, ;
Observation probability matrix , , where is the probability of generating the observation under the condition that the hidden state is at moment .
Two-state corresponding probability matrix describes the correspondence between the display state and the hidden state, where .
Learning the existing traffic data parameters is required after the establishment of the HMM. A segment with three lanes is chosen in the HMM developed in this paper. The hidden state type is defined as the breakdown type, and the number of hidden states . Different display state division granularities might be chosen based on the precision of the prediction demand. The lower the division granularity, the higher the prediction accuracy, but it will also result in a significant increase in computer storage and computation. The learning methods for three parameters in HMM—the initial hidden state distribution vector , the hidden state transition probability matrix , and the two-state corresponding probability matrix —are as follows:
- (1)
- Learning of hidden state transition probability matrix A:
This method is similar to that described in Section 2, in which the traffic breakdown types can be identified from raw data. That is, with the sampling interval set to minutes, the raw data can be used to compute the one-step transition probability matrix of the breakdown states. The one-step transition probability here refers to the probability of transitioning from the current state to the state after minutes. Assuming that there are moments where the breakdown state transitions from state i to state j across all samples, we can estimate the hidden state transition probability matrix based on these frequencies.
- (2)
- Learning of two-state corresponding probability matrix B:
Similar to the estimation of the hidden state transition probability matrix , the frequency is estimated by recording the number of occurrences of each display state (upstream density and penetration rate) under each hidden state (traffic breakdown type). The two-state corresponding probability matrix is a large and sparse matrix with a size of .
- (3)
- Learning of initial hidden state distribution:
This model assumes prior knowledge of the hidden state at the initial moment and does not require parameter learning. If the breakdown state at the initial moment is denoted as , then only the th bit of the initial hidden state distribution vector is set to 1, while all other bits are set to 0.
3.3. Viterbi Algorithm Prediction
The proposed freeway HSR strategy in mixed traffic flows with CAVs in this research was mainly based on the traffic breakdown prediction based on the hidden Markov model in Section 3.2. The road detector detects the traffic density of a road segment as well as the corresponding CAV penetration rate and the average vehicle speed per minutes. Therefore, the breakdown state variables , , and can be obtained at the current moment .
In order to predict the road traffic state in the next minutes, the display state sequence with a length of is obtained by first estimating , after minutes based on the road segment density and CAV penetration rate transition matrix and the current traffic observations. Since the breakdown state of the past minutes is known, the breakdown state before minutes is defined as the initial value of the hidden state, which corresponds to the initial hidden state distribution vector . Then, the Viterbi algorithm is used to predict the traffic breakdown state after minutes based on the display state sequence and the initial hidden state distribution vector as well as the hidden state transition probability matrix and the two-state corresponding probability matrix . The prediction process is as shown in Figure 4.
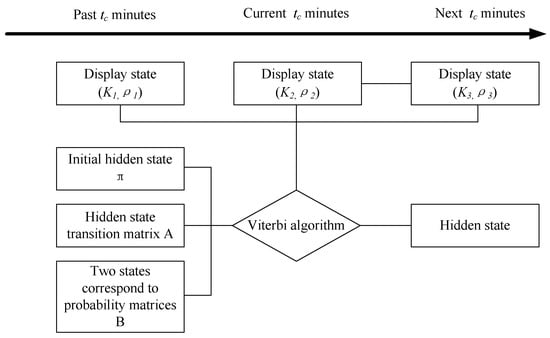
Figure 4.
Viterbi algorithm process.
Since the final result of the Viterbi algorithm is the probability of an event occurring, in order to specify the traffic state and provide a basis for HSR, the maximum event probability obtained for each operation is defined as , that is, the breakdown state of the road section at moment is most likely to be .
3.4. Control Process
The HSR strategy proposed in this paper is shown in Figure 5. After obtaining the traffic state of the road section in future minutes, the Freeway Control Center, as shown in Figure 1, opens the roadside hard shoulder in advance to mitigate any impending future traffic breakdown. In addition, since the hard shoulder is primarily used as an emergency lane for vehicles with emergency needs, the strategy proposed in this paper will determine whether the hard shoulder needs to be closed after opening for to avoid affecting the normal use of the hard shoulder. After opening the hard shoulder for , the future traffic state is predicted based on the observed traffic data, and if the road remains in a breakdown state in the next minutes, keep opening the hard shoulder; otherwise, close the hard shoulder. The specific control steps are as follows:
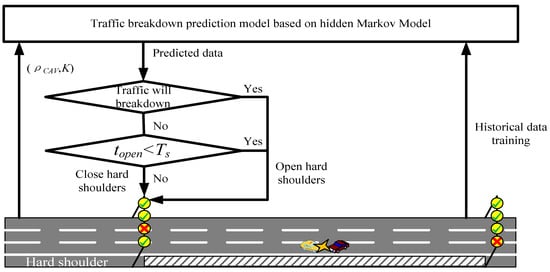
Figure 5.
HSR scheme.
Step 1: Obtain , as well as minutes ago and , at the current moment;
Step 2: Predict the traffic state for the next minutes with the Viterbi algorithm and if a traffic breakdown occurs, open the hard shoulder; otherwise go to Step 3;
Step 3: At this time, if the hard shoulder has been opened and the opening time is longer than , or if the hard shoulder has not been opened yet, skip to Step 4. Otherwise, continue to open the hard shoulder
Step 4: Close the hard shoulder and start the next loop.
4. Numerical Results and Discussion
4.1. Scene Introduction
4.1.1. Scene Characterization
In this section, we analyze the effectiveness of the traffic breakdown prediction model and the hard shoulder opening strategy in the context of the hybrid network traffic flow described above. The experiment was carried out through the secondary development of SUMO and MATLAB, and the studied scenario is shown in Figure 6. The experimental scenario was selected from the basic section of the motorway, length = 5500 m, the number of lanes in the section was 3, and the speed limit value of the section was 110 km/h. The length of the hard shoulder was 400 m, and the speed limit value was 80 km/h (ref. [13] showed that the speed of vehicles on the hard shoulder tends to be lower than 80 km when the hard shoulder is open). The basic characteristics of the traffic flow in the simulation scenario at different penetration rates are shown in Figure 7. The basic plots of density versus traffic flow of the road section at different penetration rates are presented in Figure 7a,b, from which it can be seen that the capacity of the road section gradually increases with the increase in the CAV penetration rate. The speed versus roadway density and speed versus roadway flow for different penetration rates are shown in Figure 7c,d. From Figure 7c,d, as the CAV penetration rate increases, the road section density and flow rate increase at the same speed.
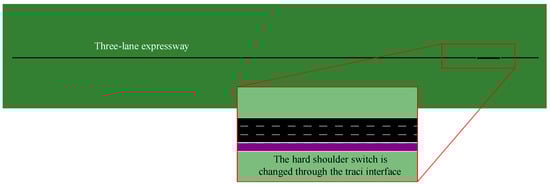
Figure 6.
Simulation scene construction.
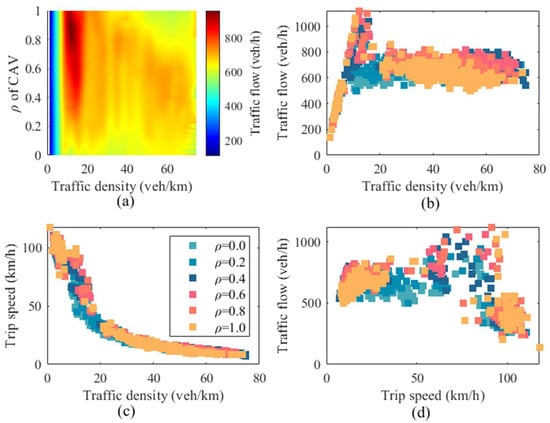
Figure 7.
Basic characteristics of motorway traffic flow: (a) Density flow relationship at each ; (b) Density-flow diagram; (c) Density-velocity diagram; (d) Velocity-flow diagram.
In addition, the historical data were processed to calculate the average speed and the standard deviation of the corresponding speed within the road section every 5 min, as shown in Figure 8a. Since the speed crash corresponds to the time period when the speed shows a sharp decrease, the average speed corresponding to the time period with the largest standard deviation is defined as , the crash speed. In this experiment, the permeability was selected as 0, 0.2, …, 1, and the corresponding crash speed of the road section was analyzed as shown in Figure 8b, from which it can be seen that as the penetration rate increased, the crash speed of the road network also showed the above trend.
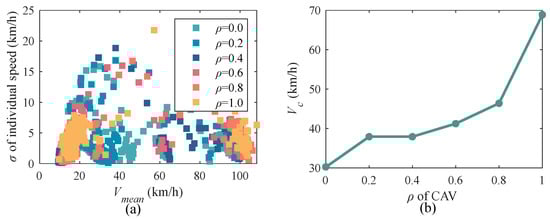
Figure 8.
Breakdown speed characteristics: (a) Relationship between average speed and the standard deviation of the corresponding speed; (b) under different .
4.1.2. Validation of a Hidden Markov Model-Based Traffic Breakdown Prediction Model
After obtaining the traffic breakdown critical speed, the historical data were combined to calculate the hidden state transition probability matrix A and the two-state corresponding probability matrix B. We defined the state of a road section as 1 when it was in the traffic breakdown state, and 0 otherwise, as shown in Figure 9. Since the of the CAV parameter is taken into account in the hybrid grid-connected environment, the value within the hidden state transition probability matrix is a variable that varies with . As seen in Figure 9, as the penetration rate increases, there are progressively fewer transfers of road segment states from 0–0, replaced by an increase in 1–1, which indicates an increase in the probability of road segment collapse as the penetration rate increases. For the convenience of presentation, this paper only showed the hidden state transition probability matrix when the penetration rate was 0 in Table 1. Table 2 shows the state of the collapse state corresponding to , , where the density of the road section is processed, 18 veh/km was selected as the interval, and K was divided into segments equally from 0 to , and the number of data points in each interval was taken as the value of the interval.
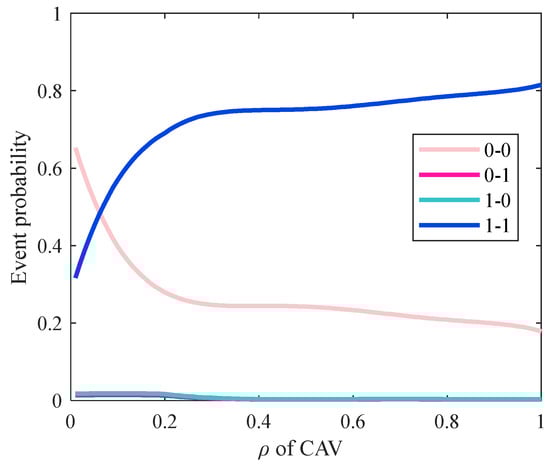
Figure 9.
The event probability with different .

Table 1.
Hidden state transition probability matrix.
Table 2.
Two-state correspondence probability matrix.
.
After obtaining the above traffic breakdown prediction parameters, the accuracy of the prediction model was tested by running the simulated road network, and at the same time, the traffic breakdown prediction model based on the logistic model was used for comparison (denoted as HMMD and LMD, respectively). The relationship between the probability of the occurrence of traffic breakdown and the traffic density of the upstream road section under different penetration rates was finally obtained, as shown in Figure 10. In order to explore the difference in critical density under HMMD and LMD more intuitively, the traffic density interval when no traffic breakdown occurs was defined as the stable traffic density area, which is shown in Figure 11. With in the range of 0.1–0.6, HMMD can detect a traffic breakdown phenomenon at a much lower traffic density. At other penetration rates, the LMD model will determine that a lower traffic density will produce traffic breakdown.
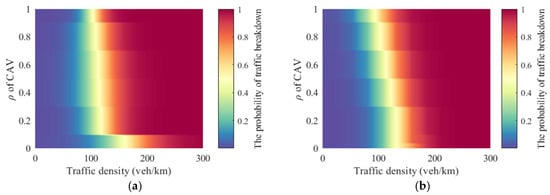
Figure 10.
The relationship of traffic density and traffic break under different : (a) HMMD prediction method; (b) LMD prediction method.
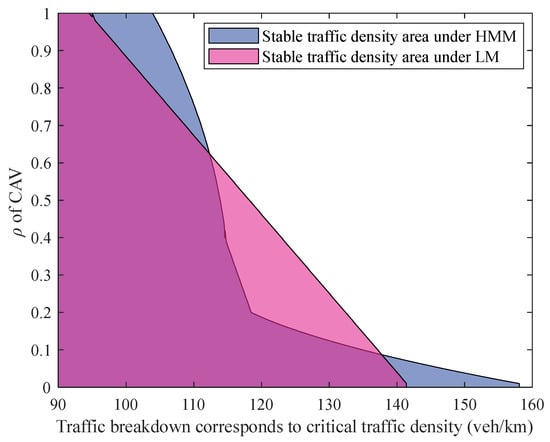
Figure 11.
Areas of stable traffic density under the influence of .
In addition, HMMD and LMD were applied to predict the collapse state of the road network, respectively, and the prediction results are shown in Table 3. In predicting the number of traffic breakdowns occurring at 1763 moments of simulation, HMMD and LMD predicted that traffic breakdowns would occur 1235 and 1311 times, respectively, whereas 1212 traffic breakdowns occurred in reality. Therefore, it can be obtained that the prediction accuracies of HMMD and LMD were 0.9870 and 0.9438, respectively, and the prediction accuracy of HMM was 4.32% higher than that of the LM prediction model.
Table 3.
Traffic breakdown prediction and actual statistics.
4.2. Experimental Analysis of Hard Shoulder Opening Strategies
4.2.1. Experimental Parameter Description
Under the Figure 6 scenario, the traffic breakdown prediction model in this paper set the traffic data collection interval and the hard shoulder opening duration to 5 min. The input traffic volume is shown in Figure 12. At 0–1000 s, the input traffic volume was 2 veh/s; at 1000–4000 s, the input traffic volume was 1 veh/s; and at 4000–10,000 s, the input traffic volume was 0.67 veh/s. The corresponding penetration rates were = 0.4 at 0–1000 s and = 0.6 at 1000–10,000 s. Furthermore, when the simulation proceeded to 500 ths, an accident occurred at 5000 thm of the road section, which led to the creation of a bottleneck. At 8500 s of the simulation, the accident lifted and the bottleneck disappeared.
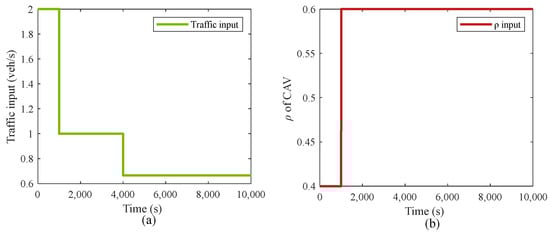
Figure 12.
(a) Traffic input; (b) input.
In order to verify the effectiveness of HMMD-HSR, four sets of experiments were set in this paper as (1) HMMD-HSR, HMMD traffic breakdown prediction method with hard shoulder opening; (2) HMM-HSR, HMM traffic breakdown prediction method without considering the permeability change with hard shoulder opening; (3) LMD-HSR, LMD traffic breakdown prediction method with hard shoulder opening; (4) N-HSR, no hard shoulder opening.
4.2.2. Analysis of Results
Figure 13 illustrates the parameters of the four hard shoulder opening strategies. As shown in Figure 13a, the average travel speed of the road section under the four hard shoulder openings is shown. At the beginning of the simulation, since the starting conditions of the four hard shoulder opening approaches were not reached, the average travel speeds of the road section under the four opening approaches remained the same from 0 to 2800 s, and all of them gradually decreased with the occurrence of accidents within the road section. Starting at 2800 s, the hard shoulders were opened according to their respective opening thresholds with the occurrence of HMMD, HMM, and LMD predicted traffic breakdowns. Eventually, with the disappearance of the bottleneck and the reduction in loaded traffic at 8500 s, the bottleneck speed within the road section gradually returned to the free-flow speed. As can be seen in Figure 13a, when the HMMD-HSR was taken, the time period when the average speed of the road segment did not collapse was significantly higher than that of HMM-HSR, LMD-HSR, and N-HSR, while the average speed within the road segment was always low when the N-HSR was taken.
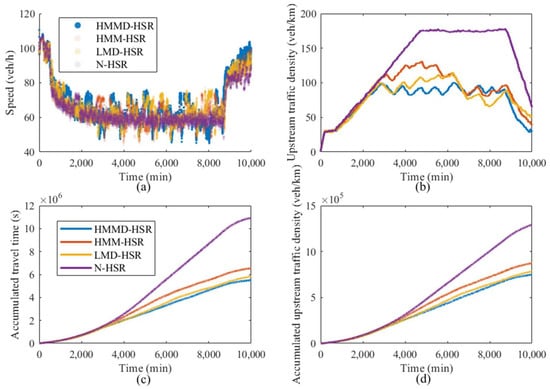
Figure 13.
Parameters of hard shoulder opening strategies under different traffic breakdown prediction models under the influence of : (a) Speed; (b) Upstream traffic density; (c) Accumulated travel time; (d) Accumulated upstream traffic density.
The average upstream traffic density and accumulated density under the four hard shoulder opening approaches are shown in Figure 13b,d. From 0 to 2800 s, the upstream density remained the same during this period because the hard shoulder was not opened for all four approaches. With the opening of the hard shoulder after 2800 s, respectively, the section density upstream of the bottleneck started to produce significant differences, and the maximum section density upstream of the bottleneck under HMMD-HSR, HMM-HSR, LMD-HSR, and N-HSR reached 99 veh/km, 114 veh/km, 128 veh/km, and 177 veh/km, respectively. The average section density and accumulated density of the upstream of the bottleneck under the hard shoulder opening modes were the same for all four modes during this period. HMMD-HSR had a lower section density than HMM-HSR, which proves that considering the effect of when opening the hard shoulder will significantly improve the opening effect. In addition, from the accumulated density, it can be seen that the accumulated upstream traffic density sections were lower under HMMD-HSR than under LMD-HSR, with values of 7.4762 × 10⁵ veh/km and 7.8466 × 10⁵ veh/km, respectively.
The accumulated travel time of the road segments under the four hard shoulder opening modes are shown in Figure 13c. From 0 to 2800 s, the accumulated travel time of the road segments remained the same during this period because the hard shoulder was not opened for all four modes. As the hard shoulders opened after 2800 s, respectively, the accumulated travel time of the road segments started to differ significantly. The accumulated travel time of the road segments under HMMD-HSR and LMD-HSR were lower than those under HMM-HSR. In addition, the accumulated travel time of the road segments under HMMD-HSR were lower than those under LMD-HSR, with the values of 5.5199 × 10⁶ s and 5.8385 × 10⁶ s, respectively.
Since there are differences in the probability of traffic breakdown under different permeability , there are also differences in the degree of hard shoulder opening enhancement effect under different permeability . In order to analyze the effect of HMMD-HSR under different penetration rates , in this paper, we set as 0, 0.2, 0.4, 0.6, 0.8. and 1.0, respectively, and the statistics of the accumulated upstream traffic density and travelling time are shown in Table 4, while the percentage of accumulated density and accumulated travelling time reduction under HMMD-HSR are shown in Figure 14 using N-HSR as a baseline. It can be obtained from Table 4 that both the accumulated density and accumulated travel time decreased significantly with increasing permeability . From Figure 14, it can be seen that the degree of the enhancement effect of HMMD-HSR becomes better and better as the penetration rate increases.
Table 4.
Accumulated travel time and accumulated traffic density at different .
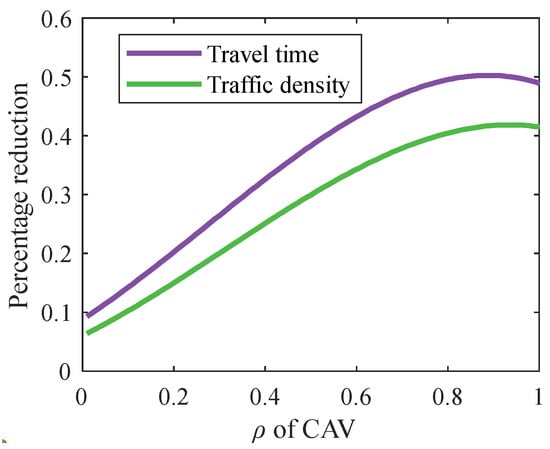
Figure 14.
Reduction in travel time and traffic density at different .
5. Conclusions
The aim of this paper was to propose a hidden Markov model-based dynamic hard shoulder opening strategy in a hybrid network environment to reduce the impact of the dynamic penetration rate . The following three main works were carried out. First, a traffic breakdown prediction model based on HMM in a hybrid network environment was proposed to extend the scope of application of the traditional traffic breakdown prediction model. Then, the characteristics of traffic breakdown in a hybrid network environment were explored to provide a basis for dynamic hard shoulder opening. Finally, the traffic breakdown events predicted by HMMD were used as a discriminative condition for the opening of the hard shoulder, which further extends the hard shoulder opening application scenarios and improves the accuracy of hard shoulder opening conditions in hybrid network environments. The simulation results showed the following. (1) The HMM model is effective in predicting traffic breakdown in mixed network environments. (2) In a mixed network environment, the probability of traffic breakdown increases with , as the evaluation criteria for crashes caused by an increase in the overall average speed become more stringent. (3) Compared to LMD-HSR and HMM-HSR, the use of HMMD-HSR in hybrid network environments can effectively reduce the occurrence of traffic crashes. Additionally, the optimization effect of HMMD-HSR improves with higher values.
Research on congestion in mixed network environments is limited, and this paper did not comprehensively analyze the factors affecting traffic breakdown in mixed network environments. Additionally, it is noteworthy that a higher increases the likelihood of traffic crashes. In the future, we will explore the causes of traffic breakdown in mixed network environments more comprehensively to better address their occurrence.
Author Contributions
Conceptualization, J.Y.; Writing—original draft preparation, Y.Q.; Methodology, Z.F.; Supervision, review and editing, J.Z.; Review and editing, H.Z.; Review and editing, T.C.; Review and editing, S.M. All authors have read and agreed to the published version of the manuscript.
Funding
This research was supported by the National Key R&D Program of China (Grant 2021YFB 1600500), the Zhejiang Provincial Department of Transportation, Jiangsu Provincial Transportation Technology and Achievement Transformation Project (No. 2023Y06), and the Natural Science Foundation of Tibet Autonomous Region (XZ202201ZR0040G).
Institutional Review Board Statement
Not applicable.
Informed Consent Statement
Not applicable.
Data Availability Statement
The data presented in this study are available on request from the corresponding author.
Conflicts of Interest
Authors Jinqiang Yao, Tianyi Chen and Shaoyin Meng were employed by the company ZheJiang Communications Investment Group Co., Ltd. The remaining authors declare that the research was conducted in the absence of any commercial or financial relationships that could be construed as a potential conflict of interest.
References
- Yao, Z.; Xu, T.; Jiang, Y.; Hu, R. Linear stability analysis of heterogeneous traffic flow considering degradations of connected automated vehicles and reaction time. Phys. A Stat. Mech. Its Appl. 2021, 561, 125218. [Google Scholar] [CrossRef]
- Calvert, S.C.; Schakel, W.J.; Van Lint, J.W.C. Will automated vehicles negatively impact traffic flow? J. Adv. Transp. 2017, 2017, 3082781. [Google Scholar] [CrossRef]
- Nitsche, P.; Olstam, J.; Taylor, N.; Reinthaler, M.; Ponweiser, W.; Bernhardsson, V.; van Dam, E. Pro-active management of traffic incidents using novel technologies. Transp. Res. Procedia 2016, 14, 3360–3369. [Google Scholar] [CrossRef]
- Fuhs, C.; Brinckerhoff, P. Synthesis of Active Traffic Management Experiences in Europe and the United States; No. FHWA-HOP-10-031; Federal Highway Administration: Washington, DC, USA, 2010. [Google Scholar]
- Coffey, S.; Park, S. State of the non-operations based research of hard shoulder running. Procedia Eng. 2016, 145, 693–698. [Google Scholar] [CrossRef][Green Version]
- Li, Y.; Chow, A.H.; Cassel, D.L. Optimal control of motorways by ramp metering, variable speed limits, and hard-shoulder running. Transp. Res. Rec. 2014, 2470, 122–130. [Google Scholar] [CrossRef]
- Su, H.; Zhong, Y.D.; Chow, J.Y.; Dey, B.; Jin, L. EMVLight: A multi-agent reinforcement learning framework for an emergency vehicle decentralized routing and traffic signal control system. Transp. Res. Part C Emerg. Technol. 2023, 146, 103955. [Google Scholar] [CrossRef]
- Farrag, S.G.; Outay, F.; Yasar, A.U.H.; El-Hansali, M.Y. Evaluating active traffic management (ATM) strategies under non-recurring congestion: Simulation-based with benefit cost analysis case study. Sustainability 2020, 12, 6027. [Google Scholar] [CrossRef]
- Geistefeldt, J. Operational experience with temporary hard shoulder running in Germany. Transp. Res. Rec. 2012, 2278, 67–73. [Google Scholar] [CrossRef]
- Dutta, N.; Boateng, R.A.; Fontaine, M.D. Safety and operational effects of the interstate 66 active traffic management system. J. Transp. Eng. Part A Syst. 2019, 145, 04018089. [Google Scholar] [CrossRef]
- Sullivan, A.; Fadel, G. Implementing Active Traffic Management Strategies in the US; No. FHWA/CA/OR; University Transportation Center for Alabama: Tuscaloosa, AL, USA, 2010. [Google Scholar]
- Ma, J.; Hu, J.; Hale, D.K.; Bared, J. Dynamic hard shoulder running for traffic incident management. Transp. Res. Rec. 2016, 2554, 120–128. [Google Scholar] [CrossRef]
- Yang, F.; Wang, F.; Ding, F.; Tan, H.; Ran, B. Identify Optimal Traffic Condition and Speed Limit for Hard Shoulder Running Strategy. Sustainability 2021, 13, 1822. [Google Scholar] [CrossRef]
- Li, R.; Ye, Z.; Li, B.; Zhan, X. Simulation of hard shoulder running combined with queue warning during traffic accident with CTM model. IET Intell. Transp. Syst. 2017, 11, 553–560. [Google Scholar] [CrossRef]
- Samoili, S.; Efthymiou, D.; Antoniou, C.; Dumont, A.G. Short-term lane flow distribution forecasting in hard shoulder running freeways. In Proceedings of the Optimum 2013 International Symposium on Recent Advances in Transport Modeling, Kingscliffe, SW, Australia, 21–23 April 2013. [Google Scholar]
- Samoili, S.; Efthymiou, D.; Antoniou, C.; Dumont, A.G. Investigation of lane flow distribution on hard shoulder running freeways. Transp. Res. Rec. 2013, 2396, 133–142. [Google Scholar] [CrossRef]
- Ma, J.; Smith, B.L.; Fontaine, M.D. Comparison of in-vehicle auditory public traffic information with roadside dynamic message signs. J. Intell. Transp. Syst. 2016, 20, 244–254. [Google Scholar] [CrossRef]
- Hussein, F.F.; Naik, B.; Süer, G.A. Development of Hybrid Hard Shoulder Running Operation System for Active Traffic Management. In Proceedings of the International Conference on Transportation and Development, Seattle, WA, USA, 26–29 May 2020; American Society of Civil Engineers: Reston, VA, USA, 2020; pp. 194–205. [Google Scholar]
- Arora, K.; Kattan, L. Operational and safety impacts of integrated variable speed limit with dynamic hard shoulder running. J. Intell. Transp. Syst. 2023, 27, 769–798. [Google Scholar] [CrossRef]
- Zhou, W.; Yang, M.; Lee, M.; Zhang, L. Q-learning-based coordinated variable speed limit and hard shoulder running control strategy to reduce travel time at freeway corridor. Transp. Res. Rec. 2020, 2674, 915–925. [Google Scholar] [CrossRef]
- Vrbanić, F.; Ivanjko, E.; Mandžuka, S.; Miletić, M. Reinforcement learning based variable speed limit control for mixed traffic flows. In Proceedings of the 2021 29th Mediterranean Conference on Control and Automation (MED), Puglia, Italy, 22–25 June 2021; IEEE: Piscataway, NJ, USA, 2021; pp. 560–565. [Google Scholar] [CrossRef]
- Vrbanić, F.; Tišljarić, L.; Majstorović, Ž.; Ivanjko, E. Reinforcement Learning-Based Dynamic Zone Placement Variable Speed Limit Control for Mixed Traffic Flows Using Speed Transition Matrices for State Estimation. Machines 2023, 11, 479. [Google Scholar] [CrossRef]
- Ding, H.; Zhang, L.; Chen, J.; Zheng, X.; Pan, H.; Zhang, W. MPC-based dynamic speed control of CAVs in multiple sections upstream of the bottleneck area within a mixed vehicular environment. Phys. A Stat. Mech. Its Appl. 2023, 613, 128542. [Google Scholar] [CrossRef]
- Li, Y.; Shi, Y.; Lee, J.; Yuan, C.; Wang, B. Safety Effects of Connected and Automated Vehicle-Based Variable Speed Limit Control near Freeway Bottlenecks considering Driver’s Heterogeneity. J. Adv. Transp. 2022, 2022, 7996623. [Google Scholar] [CrossRef]
- Gokasar, I.; Timurogullari, A.; Ozkan, S.S.; Deveci, M. IDILIM: Incident detection included linear management using connected autonomous vehicles. Ann. Oper. Res. 2023, 1–20. [Google Scholar] [CrossRef]
- Li, Y.; Pan, B.; Xing, L.; Yang, M.; Dai, J. Developing dynamic speed limit strategies for mixed traffic flow to reduce collision risks at freeway bottlenecks. Accid. Anal. Prev. 2022, 175, 106781. [Google Scholar] [CrossRef]
- Wu, W.; Sun, R.; Ni, A.; Liang, Z.; Jia, H. Simulation and evaluation of speed and lane-changing advisory of CAVS at work zones in heterogeneous traffic flow. Int. J. Mod. Phys. B 2020, 34, 2050201. [Google Scholar] [CrossRef]
- Ghiasi, A.; Hussain, O.; Qian, Z.S.; Li, X. A mixed traffic capacity analysis and lane management model for connected automated vehicles: A Markov chain method. Transp. Res. Part B Methodol. 2017, 106, 266–292. [Google Scholar] [CrossRef]
- Shang, M.; Wang, S.; Stern, R.E. Extending ramp metering control to mixed autonomy traffic flow with varying degrees of automation. Transp. Res. Part C Emerg. Technol. 2023, 151, 104119. [Google Scholar] [CrossRef]
- Silgu, M.A.; Erdağı, İ.G.; Göksu, G.; Celikoglu, H.B. Combined control of freeway traffic involving cooperative adaptive cruise controlled and human driven vehicles using feedback control through SUMO. IEEE Trans. Intell. Transp. Syst. 2021, 23, 11011–11025. [Google Scholar] [CrossRef]
- Carlson, R.C.; Papamichail, I.; Papageorgiou, M.; Messmer, A. Optimal mainstream traffic flow control of large-scale motorway networks. Transp. Res. Part C Emerg. Technol. 2010, 18, 193–212. [Google Scholar] [CrossRef]
- Cohen, S. Using the hard shoulder and narrowing lanes to reduce traffic congestion some lessons from an experience on the Paris motorway network. In Proceedings of the 12th IEE International Conference on Road Transport Information & Control—RTIC 2004, London, UK, 20–22 April 2004; pp. 149–153. [Google Scholar]
- Kononov, J.; Hersey, S.; Reeves, D.; Allery, B.K. Relationship between freeway flow parameters and safety and its implications for hard shoulder running. Transp. Res. Rec. 2012, 2280, 10–17. [Google Scholar] [CrossRef]
- Choi, J.; Tay, R.; Kim, S.; Jeong, S.; Kim, J.; Heo, T.Y. Safety Effects of Freeway Hard Shoulder Running. Appl. Sci. 2019, 9, 3614. [Google Scholar] [CrossRef]
- Lemke, K. Hard shoulder running as a short-term measure to reduce congestion. In Proceedings of the 4th International Symposium on Highway Geometric Design, Valencia, Spain, 2–5 June 2010. [Google Scholar]
- Zhao, P.; Ma, J.; Xu, C.; Zhao, C.; Ni, Z. Research on the safety of the left hard shoulder in a multi-lane highway based on safety performance function. Sustainability 2022, 14, 15114. [Google Scholar] [CrossRef]
- Ma, D.; Nakamura, H.; Asano, M.; Axel, W. A Study on Expressway Breakdown Phenomenon Considering Flow Characteristics on Individual Lanes. In Proceedings of the 9th International Conference of Eastern Asia Society for Transportation Studies, Jeju, Republic of Korea, 20–23 June 2011; Volume 8, p. 279. [Google Scholar]
- Chen, X.Q. Modeling Traffic Flow Dynamic and Stochastic Evolutions. Ph.D. Thesis, Tsinghua University, Beijing, China, 2012; pp. 73–79. [Google Scholar]
- Brilon, W.; Geistefeldt, J.; Regler, M. Reliability of freeway traffic flow: A stochastic concept of capacity. In Proceedings of the 16th International Symposium on Transportation and Traffic Theory, College Park, MD, USA, 19–21 July 2005; Volume 125143. [Google Scholar]
- Kühne, R.; Mahnke, R.; Hinkel, J. Modelling the effects of corridor control systems on road capacity. In Proceedings of the 5th International Symposium on Highway Capacity and Quality of Service, Yokohama, Japan, 25–29 July 2006. [Google Scholar]
- Cvahte Ojsteršek, T.; Topolšek, D. Influence of drivers’ visual and cognitive attention on their perception of changes in the traffic environment. Eur. Transp. Res. Rev. 2019, 11, 45. [Google Scholar] [CrossRef]
- Aron, M.; Cohen, S.; Seidowsky, R. Two French Hard-Shoulder Running operations: Some comments on effectiveness and safety. In Proceedings of the 13th International IEEE Conference on Intelligent Transportation Systems, Funchal, Portugal, 19–22 September 2010; IEEE: Piscataway, NJ, USA, 2010; pp. 230–236. [Google Scholar]
- Khattak, Z.H.; Fontaine, M.D. A Bayesian modeling framework for crash severity effects of active traffic management systems. Accid. Anal. Prev. 2020, 145, 105544. [Google Scholar] [CrossRef] [PubMed]
- Guerrieri, M.; Mauro, R. Capacity and safety analysis of hard-shoulder running (HSR). A motorway case study. Transp. Res. Part A Policy Pract. 2016, 92, 162–183. [Google Scholar] [CrossRef]
- Yu, Q.; Wu, L.; Zhang, H.; Lei, L.; Wang, L. The Impact of Automated Vehicles on Road and Intersection Capacity. Appl. Sci. 2023, 13, 5073. [Google Scholar] [CrossRef]
- Ma, Y.; Qi, S.; Zhang, Y.; Lian, G.; Lu, W.; Chan, C.Y. Drivers’ visual attention characteristics under different cognitive workloads: An on-road driving behavior study. Int. J. Environ. Res. Public Health 2020, 17, 5366. [Google Scholar] [CrossRef] [PubMed]
- Sedar, R.; Vázquez-Gallego, F.; Casellas, R.; Vilalta, R.; Muñoz, R.; Silva, R.; Alonso-Zarate, J. Standards-compliant multi-protocol on-board unit for the evaluation of connected and automated mobility services in multi-vendor environments. Sensors 2021, 21, 2090. [Google Scholar] [CrossRef] [PubMed]
- Zhong, Z.; Lee, E.E.; Nejad, M.; Lee, J. Influence of CAV clustering strategies on mixed traffic flow characteristics: An analysis of vehicle trajectory data. Transp. Res. Part C Emerg. Technol. 2020, 115, 102611. [Google Scholar] [CrossRef]
- Tanveer, M.; Kashmiri, F.A.; Naeem, H.; Yan, H.; Qi, X.; Rizvi, S.M.A.; Lu, H. An assessment of age and gender characteristics of mixed traffic with autonomous and manual vehicles: A cellular automata approach. Sustainability 2020, 12, 2922. [Google Scholar] [CrossRef]
- Zhang, J.; Wu, K.; Cheng, M.; Yang, M.; Cheng, Y.; Li, S. Safety evaluation for connected and autonomous vehicles’ exclusive lanes considering penetrate ratios and impact of trucks using surrogate safety measures. J. Adv. Transp. 2020, 2020, 5847814. [Google Scholar] [CrossRef]
- Zhu, W.X.; Zhang, H.M. Analysis of mixed traffic flow with human-driving and autonomous cars based on car-following model. Phys. A Stat. Mech. Its Appl. 2018, 496, 274–285. [Google Scholar] [CrossRef]
- Treiber, M.; Kesting, A.; Helbing, D. Influence of reaction times and anticipation on stability of vehicular traffic flow. Transp. Res. Rec. 2017, 1999, 23–29. [Google Scholar] [CrossRef]


Disclaimer/Publisher’s Note: The statements, opinions and data contained in all publications are solely those of the individual author(s) and contributor(s) and not of MDPI and/or the editor(s). MDPI and/or the editor(s) disclaim responsibility for any injury to people or property resulting from any ideas, methods, instructions or products referred to in the content. |
© 2024 by the authors. Licensee MDPI, Basel, Switzerland. This article is an open access article distributed under the terms and conditions of the Creative Commons Attribution (CC BY) license (https://creativecommons.org/licenses/by/4.0/).