Article

A New Permutation-Based Method for Ranking and Selecting Group Features in Multiclass Classification

1
Department of Industrial and Management Engineering, Hanyang University, Ansan 15588, Republic of Korea
2
Department of Statistics, Dongguk University, Seoul 04620, Republic of Korea
*
Author to whom correspondence should be addressed.
Appl. Sci. 2024, 14(8), 3156; https://doi.org/10.3390/app14083156
Submission received: 9 March 2024 / Revised: 3 April 2024 / Accepted: 6 April 2024 / Published: 9 April 2024
(This article belongs to the Special Issue Machine-Learning-Based Feature Extraction and Selection)

Abstract

:
The selection of group features is a critical aspect in reducing model complexity by choosing the most essential group features, while eliminating the less significant ones. The existing group feature selection methods select a set of important group features, without providing the relative importance of all group features. Moreover, few methods consider the relative importance of group features in the selection process. This study introduces a permutation-based group feature selection approach specifically designed for high-dimensional multiclass datasets. Initially, the least absolute shrinkage and selection operator (lasso) method was applied to eliminate irrelevant individual features within each group feature. Subsequently, the relative importance of the group features was computed using a random-forest-based permutation method. Accordingly, the process selected the highly significant group features. The performance of the proposed method was evaluated using machine learning algorithms and compared with the performance of other approaches, such as group lasso. We used real-world, high-dimensional, multiclass microarray datasets to demonstrate its effectiveness. The results highlighted the capability of the proposed method, which not only selected significant group features but also provided the relative importance and ranking of all group features. Furthermore, the proposed method outperformed the existing method in terms of accuracy and F1 score.

1. Introduction

Feature selection is an important task for the high-dimensional low-sample-size (HDLSS) datasets that are prevalent across various domains, such as text recognition, finance, and gene expression microarrays. HDLSS datasets are characterized by many features relative to the limited number of available samples. For instance, in microarray datasets, the number of features (representing genes) is often greater than thousands, whereas the sample size remains small [1]. An HDLSS dataset requires a reduction in the dimensions of the feature space. Reducing dimensionality not only decreases model complexity but also improves model prediction accuracy [2]. In the context of HDLSS datasets, a predominant challenge emerges: a significant number of features do not contribute to the accurate prediction of the target variable. However, these features can be irrelevant or redundant. Therefore, the principal objective of managing HDLSS datasets is to select and rank features that offer substantial insight into the desired outcome, ensuring that the model’s predictive capacity is optimized.
The analysis of microarray gene expression datasets has gained significant attention in the fields of data mining and machine learning [3]. As scientists strive to identify key features within HDLSS datasets, diverse feature selection methods have been proposed and categorized into filter, wrapper, hybrid, and embedded methods. In microarray datasets that include thousands of features, many features are correlated because they originate from the same source. Correlated features tend to form clusters that collectively affect the outcomes [4], suggesting that selecting groups of correlated features is more effective than selecting individual features. This approach is known as group feature selection and recognizes the interdependence of each cluster.
Group feature selection methods aim to discard irrelevant and redundant group features that cause a decrease in classification accuracy, while retaining only informative group features, thereby enhancing the computational efficiency and classification performance [5]. Bakin [6] introduced the probing least absolute square modeling (PLASM) method for group feature selection, extending the principles of the least absolute shrinkage and selection operator (lasso) method [7] to the group level. Yuan and Lin [8] further advanced Bakin’s PLASM method, pioneering the development of a group lasso for group feature selection (GFS), which was a significant breakthrough in this domain. Meier et al. [9] extended the group lasso method to logistic regression and applied it specifically to DNA sequence data. Additionally, Simon et al. [10] proposed the sparse-group lasso method, introducing sparsity considerations at both the within-group and group levels. Fang et al. [11] took this a step further by developing an adaptive sparse-group lasso. Vincent and Hansen [12] proposed a multinomial sparse-group lasso as an extension of the sparse-group lasso. Group lasso and its extensions are very effective gene selection and classification methods for microarray datasets. Many studies have applied the group least squares (GLS) method for group feature selection. In the group lasso penalty, features are considered in a group manner [5,13].
Despite these advancements, existing group feature selection methods have inherent limitations, in that they fail to quantify the relative importance of the selected group features. These methods can identify some feature groups as relevant but do not distinguish those that are most relevant to a target variable. Zubair and Kim [14] proposed a group feature (GF) ranking and selection approach that is applicable only to binary-class datasets. Consequently, the existing methods cannot determine the relative importance of group features for multiclass datasets. Thus, the existing methods cannot provide insight into how selected groups contribute compared to others, thereby limiting the interpretability of the model.
This study introduced a novel permutation-based methodology for the simultaneous ranking and selection of group features, to address the existing limitations of multiclass classification. To this end, we propose a new group feature importance metric that simultaneously permutes all features within a specific group. This process enables us to determine the impact of the group feature on the model’s prediction performance and quantify its relative significance. We can rank and select certain imperative group features by employing this metric. This permutation-based approach provides a reliable method for assessing the significance of each group feature. In addition, the study ranked the group features based on their permutation importance and selected the most crucial group features for further analysis. Figure 1 illustrates the various steps involved in this methodology.
The remainder of this paper is organized as follows: The following section provides an extensive literature review, encompassing both individual feature ranking and selection, as well as group feature selection. Section 3 describes the methodology used in this study. Section 4 presents a detailed discussion of the experimental results. Finally, the concluding section presents a synthesis of the conclusions and discussion.

2. Related Work

Related work was reviewed to gain an understanding of the existing methods related to feature selection and ranking. The first section of this chapter explains ranking-based feature selection methods. These methods consider only individual features for ranking and selection, providing the ranking of features, but they do not deal with groups. In the second section, details of group feature selection methods are provided, which select the whole group instead of individual features, because a group of features has a common effect on the target variable. However, most of these methods do not provide the ranking or relative importance of group features.

2.1. Individual Feature Ranking and Selection

Feature ranking and selection are crucial areas in machine learning and data mining [15]. Numerous techniques have been developed to address this problem. These methodologies have been widely applied in various real-world domains, including microarray gene analysis, text recognition, malware detection, image processing, image retrieval, and information retrieval [16,17,18,19,20]. Feature ranking and selection methods can be classified into two primary groups: subset methods and individual evaluation methods. Subset evaluation methods involve the selection of a subset of features for model construction using a search strategy. Conversely, individual evaluation methods measure the relevance of each feature to the target variable, assigning importance scores or ranks based on their correlation with the target variable [21]. Furthermore, these methods fall under the categories of filter, wrapper, hybrid, and embedded techniques [22,23,24,25].
The primary category, known as the filter method [22], examines features based on their mathematical and statistical attributes during selection. Notably, this method operates independently of classifiers in decision-making, leading to rapid processing. This makes it effective for handling high-dimensional datasets. The second category, the wrapper method [23], employs the selection of an optimal subset of individual features and subsequently evaluates the subset’s goodness with the help of a classifier. This method is renowned for its superior classification performance [4] compared to filter methods. However, it is not recommended for use with high-dimensional datasets [3], due to intensive computational demands.
The hybrid methods, which constitute the third category [24], combine the advantages of both the filter and wrapper methods. A hybrid method creates a trade-off between the computational efficiency of the filter method and the superior classification ability of the wrapper method. Recognized for its robustness in feature selection and enhanced classification performance, the hybrid method stands out as an intelligent compromise. The final category, the embedded method [25], is a feature selection approach that combines model training and feature selection simultaneously. The embedded method employs a classifier to select the most relevant features as it trains [22].
Most feature ranking methods belong to the filter category. These methods deploy diverse filtering strategies to evaluate how related the features are to the target variable. Some notable strategies include the following: The chi-squared statistic ( X 2 ) is a commonly used method [26] for feature ranking. This method evaluates the importance of an individual feature by computing chi-square statistics with respect to the class. Information gain (IG) plays a crucial role in an array of techniques for ranking and selecting features [27]. This metric measures the efficacy of a feature in classifying datasets by computing the decrease in dataset entropy, which represents a measure of uncertainty within a dataset, after splitting the dataset based on the feature. Notably, IG does not have any problem with features that have samples with large values. However, IG is biased toward features that have a large number of different values [28]. A gain ratio is introduced to address this bias. The gain ratio (GR) is a nonsymmetrical measure crucial for individual feature evaluation [29]. This approach is frequently used to address the biases inherent in the IG, which tend to exhibit a preference for features with a multitude of distinct possible values. Relief, introduced by Kira and Rendell [30], is another important method for feature ranking. It employs a distance metric to calculate the importance or ranking of features. ReliefF is an extension of the original Relief algorithm that is adapted for noisy, incomplete datasets or those with multiple classes [31]. Building on the original Relief and ReliefF, a family of Relief-based algorithms (RBA), TuRf, VLSReliefF, I-Relief, EReliefF, spatially uniform relief SURF, SURF*, MultiSURF, MultiSURF*, SWRF*, and statistical inference relief (STIR) have been developed to refine feature selection [32,33,34,35,36,37,38].
In addition, many other methods are used for feature-ranking-based selection, such as rank product, Fisher’s ratio, and Welch’s t-test [39,40,41]. All these techniques are designed to rank individual features. They are not capable of conducting group feature ranking. In all these feature ranking and selection methods, there is no universal best for all tasks [42]. Researchers can select any of these methods based on their specific problems.

2.2. Group Feature Selection Method
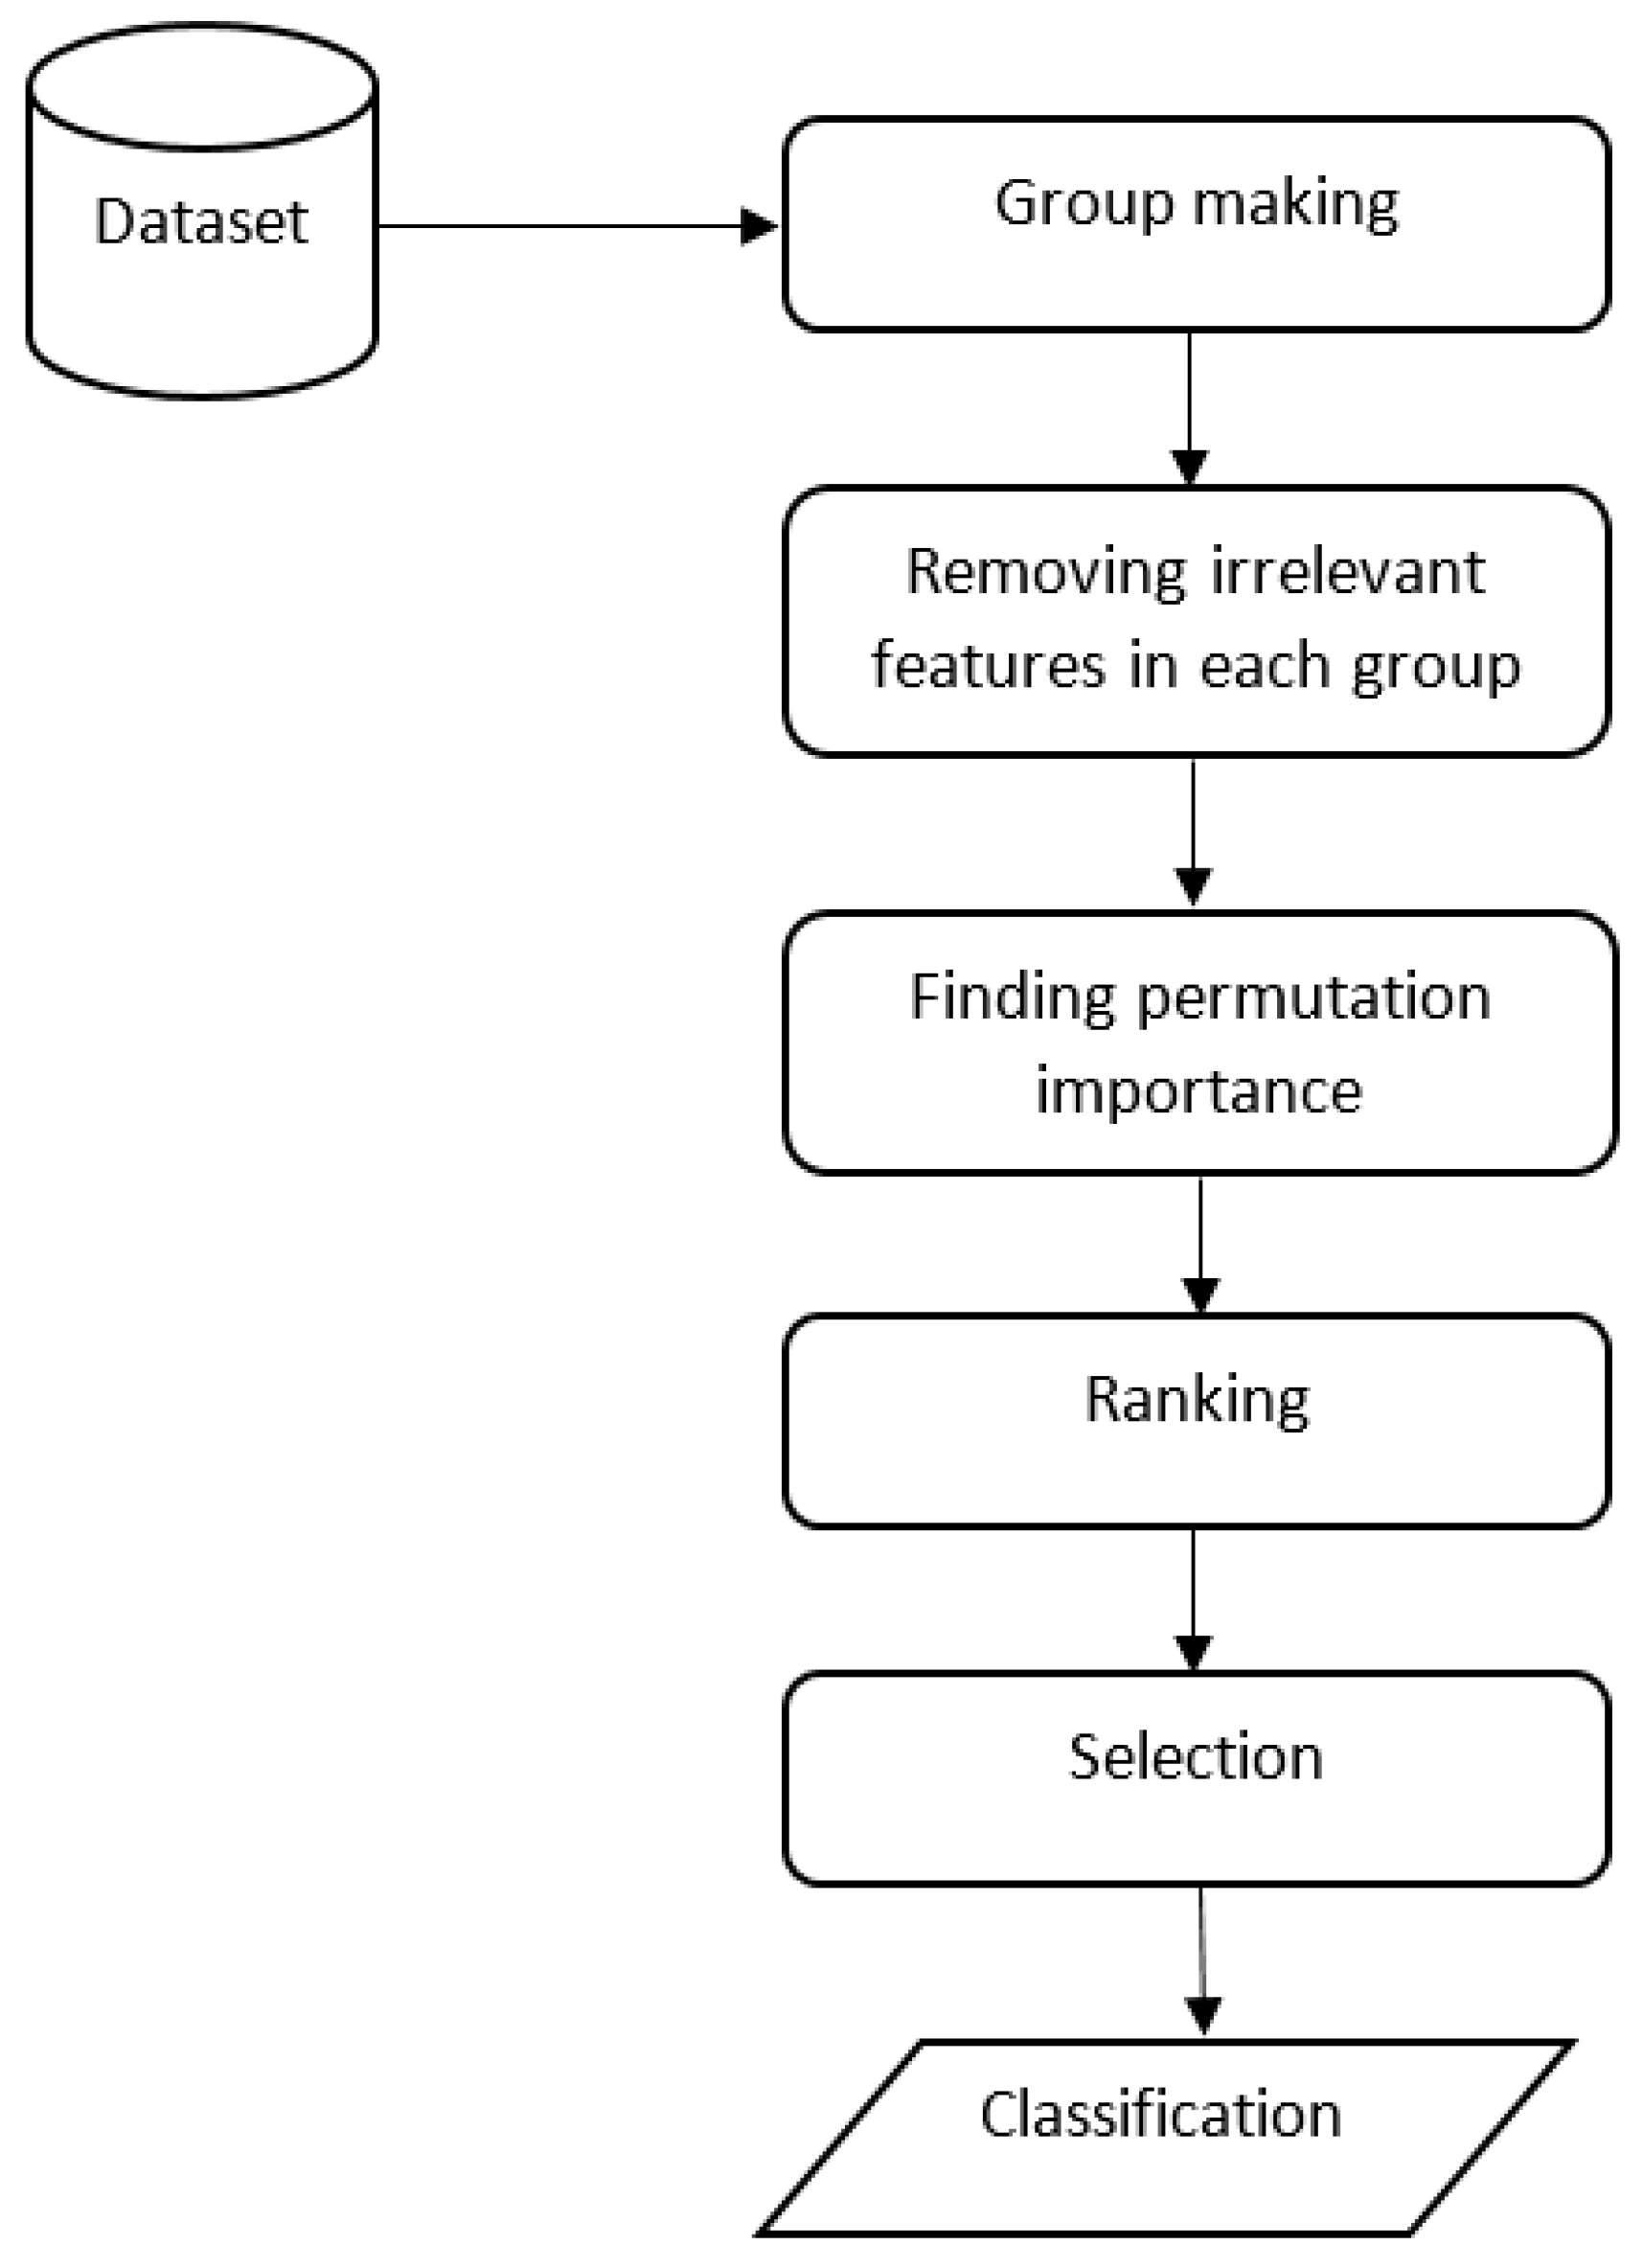
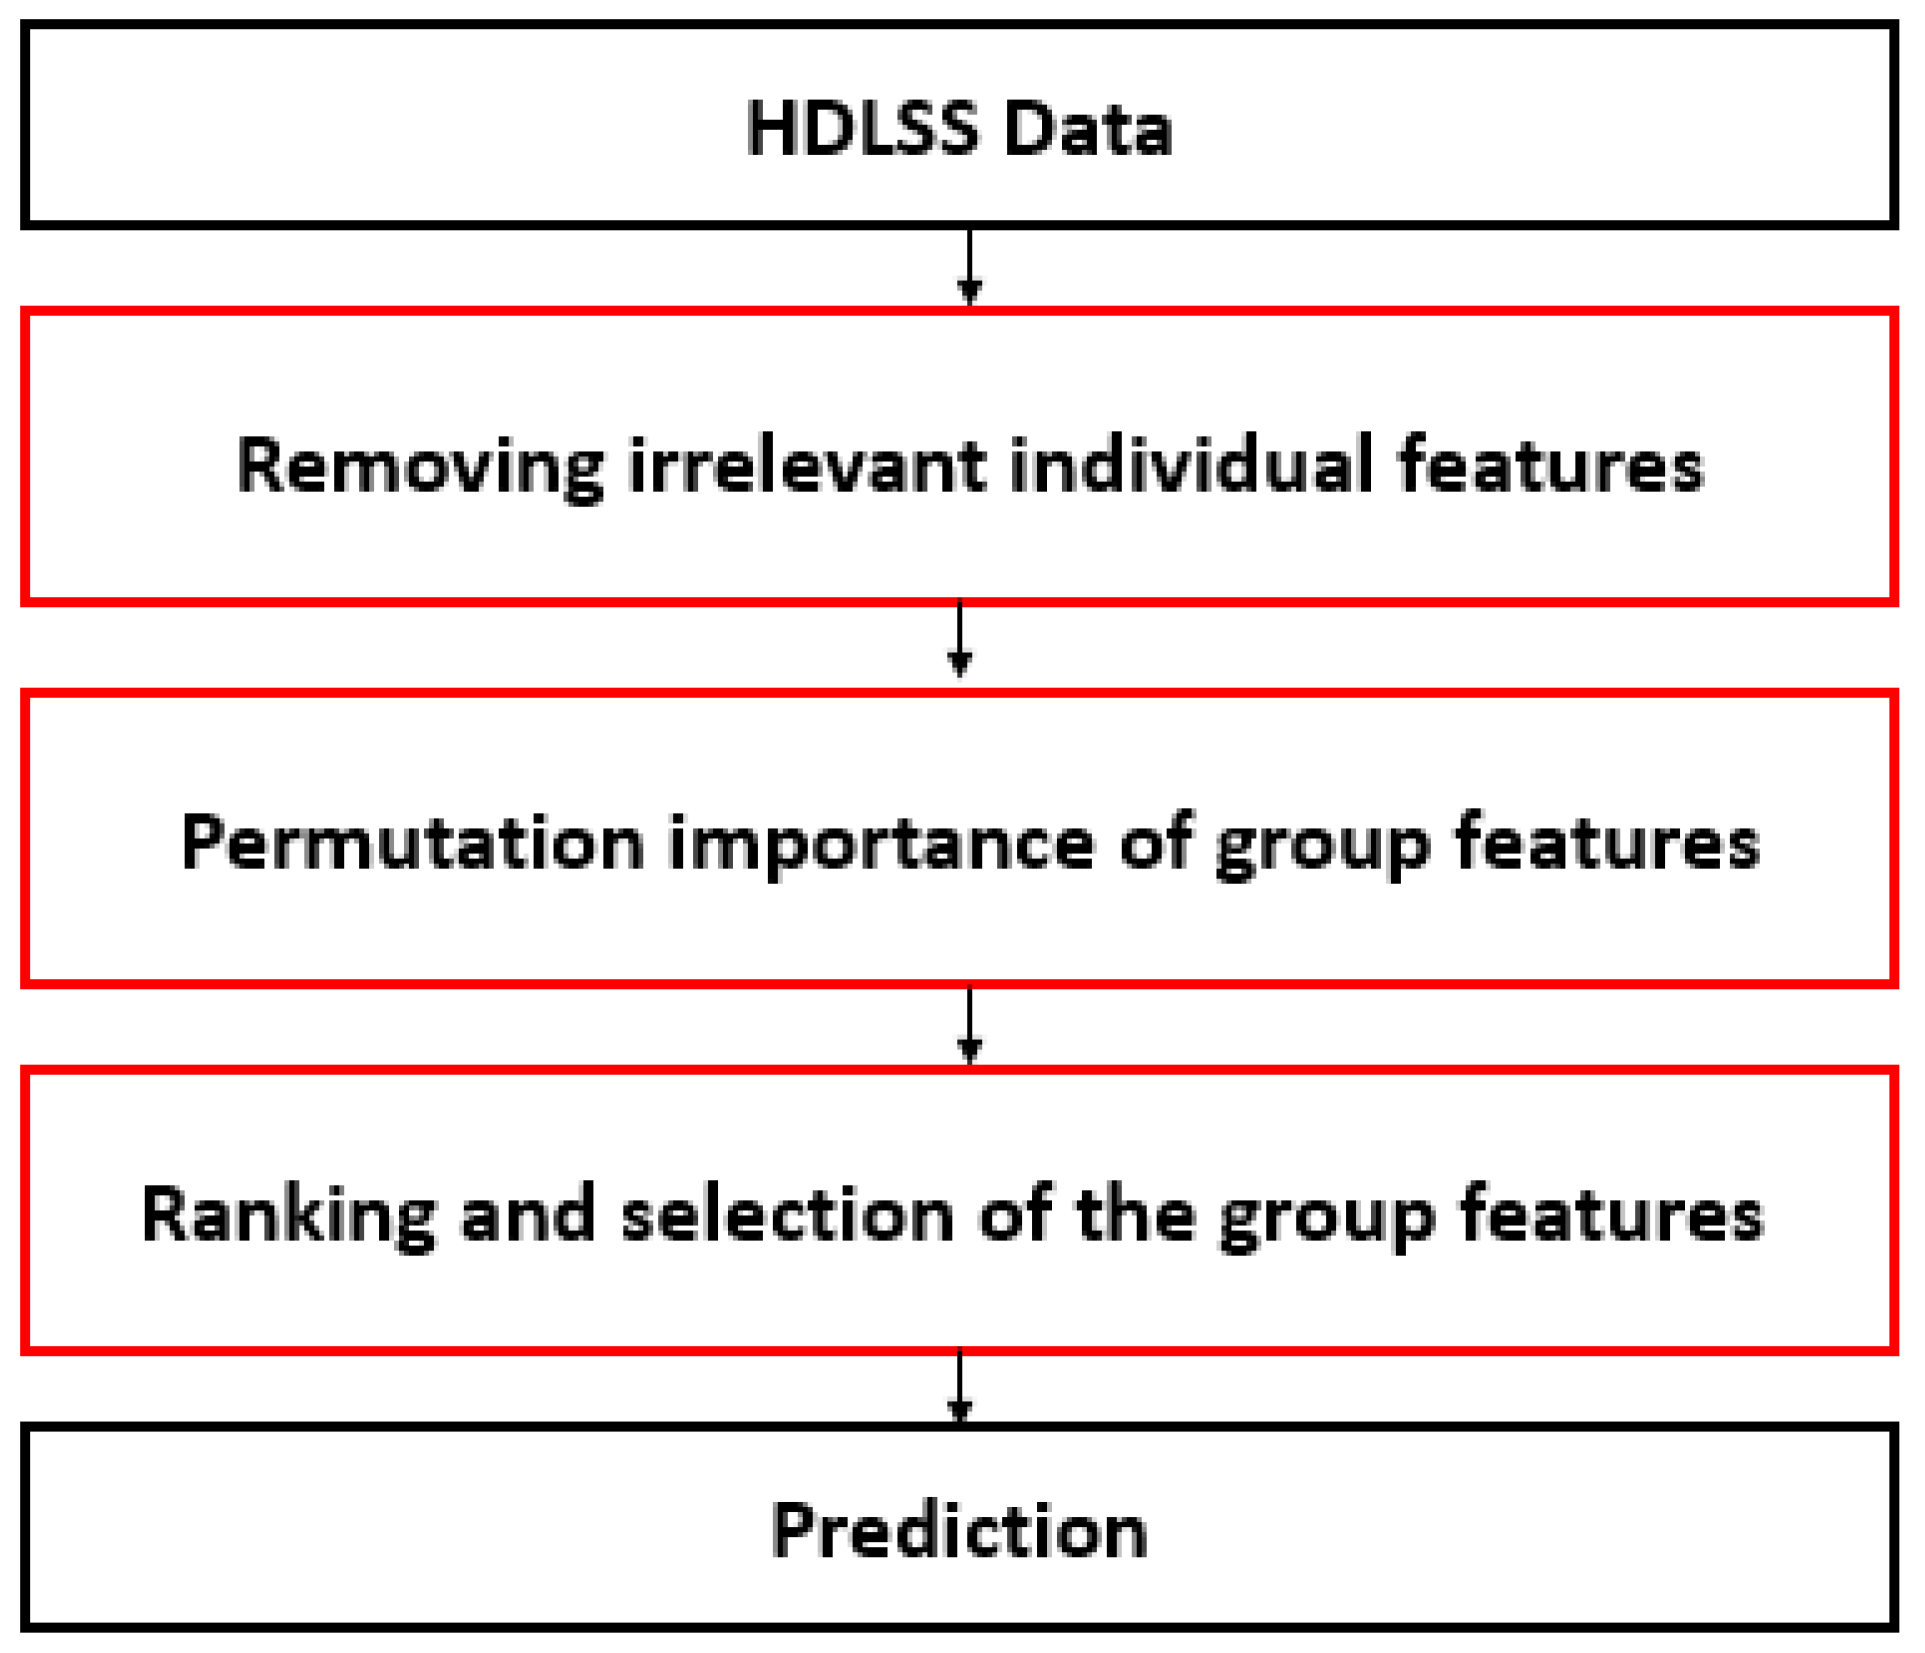
In the context of high-dimensional datasets, particularly within microarray gene expression datasets, the emergence of group structures among features is prevalent and attributed to various factors. Notably, genes that share membership in the same biological pathway, or genetic markers originating from identical genes, can be conceptualized as constituting a group [43]. Features belonging to the same membership group exhibit similar characteristics. Consequently, a strong correlation is often observed between features within the same group [44]. In such datasets, there is a preference for selecting entire features within the same group rather than individual features. Thus, feature ranking and selection in this scenario refer to group feature ranking and selection.
Numerous methodologies have been developed by researchers to address group feature selection [13]. These methods are designed to select group features rather than individual features. However, the existing group feature selection methods do not provide information on the relative importance of group features, while various feature ranking-based selection techniques for individual features exist [27]. Therefore, only a few methods have demonstrated the ability to select group features based on their rankings.
Zubair and Kim [14] developed a method for group feature ranking and selection for high-dimensional datasets. In this method, the relief method was initially applied to each feature group to eliminate irrelevant individual features. Subsequently, Fisher’s linear discriminant analysis (FDA) was employed to reduce the dimensions of each group to a singular dimension, thus capturing the essence of the group features. Finally, a random forest method was used to assess the relative importance of these features. The features were ranked based on their relative importance, and those that surpassed a specified threshold were selected. The experimentation phase involved real-world microarray gene expression datasets characterized by a binary-class target variable. This method was specifically developed to rank and select group features in the context of binary-class datasets. Consequently, group feature ranking and selection for multiclass datasets remain challenging.
In response to the challenges and limitations outlined above, this study extends the framework proposed by Zubair and Kim [14] and introduces a novel permutation-based feature ranking and selection method explicitly developed for multiclass datasets. This study does not transform group features into a single dimension; instead, it selects the entire group. By adopting this approach, the information is preserved in its original form. Furthermore, this method addresses multiclass datasets rather than binary class datasets.

3. Method

In this section, we present a novel permutation-based method for group feature ranking and selection. The method involves several key steps. First, the datasets that were used for this study have high dimensionality. In each dataset, many features were correlated or relevant to each other and had a common effect on the target variable. Therefore, the relevant features formed groups or clusters. We used the “agglomerative hierarchical clustering” technique to find these groups in the high-dimensional datasets. This method helped us to find similar features, so that we could observe the patterns more clearly. Despite splitting datasets into groups, the dimensionality within each group remained high. Hence, we applied the lasso algorithm to eliminate irrelevant and redundant individual features, ensuring that only the most informative features were retained for further analysis.
Next, we proposed a new method for calculating the permutation importance of each feature group. We obtained an importance score for each group feature by permuting the values of each group feature and measuring the resulting impact on model performance. Based on these permutation importance scores, we ranked the group features in terms of their significance and selected a subset of highly ranked group features for subsequent analyses. Figure 2 provides a visual representation of the overall procedure, illustrating the sequential steps involved in our permutation-based method for group feature ranking and selection.
The existing group feature selection methods do not provide the relative importance of all group features. However, we are interested in ranking the group features according to their importance. Therefore, we proposed a new permutation importance method to determine the relative importance of all the group features. The permutation-based method allowed us to assess the significance and relative importance of each group feature. A few highly ranked group features were selected for further analysis after assessing the relative importance of all the group features. This approach enhances the interpretability of the results and improves the efficiency of data analysis, particularly for HDLSS datasets, where exhaustive analysis may be computationally expensive. Permutation-based methods are well known for their robustness and consistency [45]. We obtained a more reliable estimate of the group feature importance by considering multiple permutations of the group feature values, thereby reducing the influence of random fluctuations and improving the ranking robustness.

3.1. Removing Irrelevant Individual Features

In high-dimensional data, many individual features may be irrelevant to the target variable, making them unsuitable for computing the permutation importance of the feature groups. To address this issue, we adopted the straightforward approach of removing individual features that were deemed irrelevant before calculating the permutation importance of the group features. Several existing approaches are available for identifying irrelevant individual features. In this study, we proposed employing the lasso method to remove irrelevant individual features from the group features. Using the lasso method, we effectively filtered out irrelevant individual features, ensuring that only the most informative features were considered when computing the permutation importance of the group features. This step significantly enhanced the relevance of the selected features to the target variable and rankings, which ultimately improved the classification performance of our proposed method in high-dimensional data analysis.
Tibshirani [7] introduced the original lasso method, which has proven to be an effective technique for eliminating irrelevant individual features. This method has two primary objectives: regularization and loss functions. For regularization, the lasso method adds a penalty term that encourages some coefficients of the variables to be reduced to zero. This regularization step aids in controlling the complexity of the model and prevents overfitting. By shrinking some of the coefficients, we obtained a sparse feature space using the lasso method.
Suppose there is a high-dimensional dataset with n instances and p individual features. In addition, Y denotes a K dimensional response vector with K classes represented as Y = y 1 , y 2 , , y n , where y i denotes the class label vector for the i-th instance. The LASSO method selects individual features by minimizing the following objective function [7]:
Q β | X O , Y = i = 1 n y i log y ^ i + λ j = 1 p β j
where λ is a shrinkage parameter that controls the amount of penalty, and has great importance in this method. If λ is sufficiently large in Equation (1), more variables are forced to be exactly zero, which results in a greater dimension reduction. The coefficient β j represents the feature weights for each class, and y ^ i denotes the predicted probabilities of the i-th instance. The first term in the objective function represents the multiclass cross-entropy loss, which measures the dissimilarity between the true class labels and the predicted probabilities for each class. The second term is the L 1 regularization term, which penalizes the absolute values of the coefficients for each class. This term promotes feature selection by driving some of the coefficients to zero, resulting in dimension reduction and the selection of relevant features. Based on this mechanism, the LASSO method can select features with non-zero coefficients. These features were deemed significant and were retained for further analysis, whereas the coefficients of the irrelevant features decreased to zero, effectively excluding them from the model.

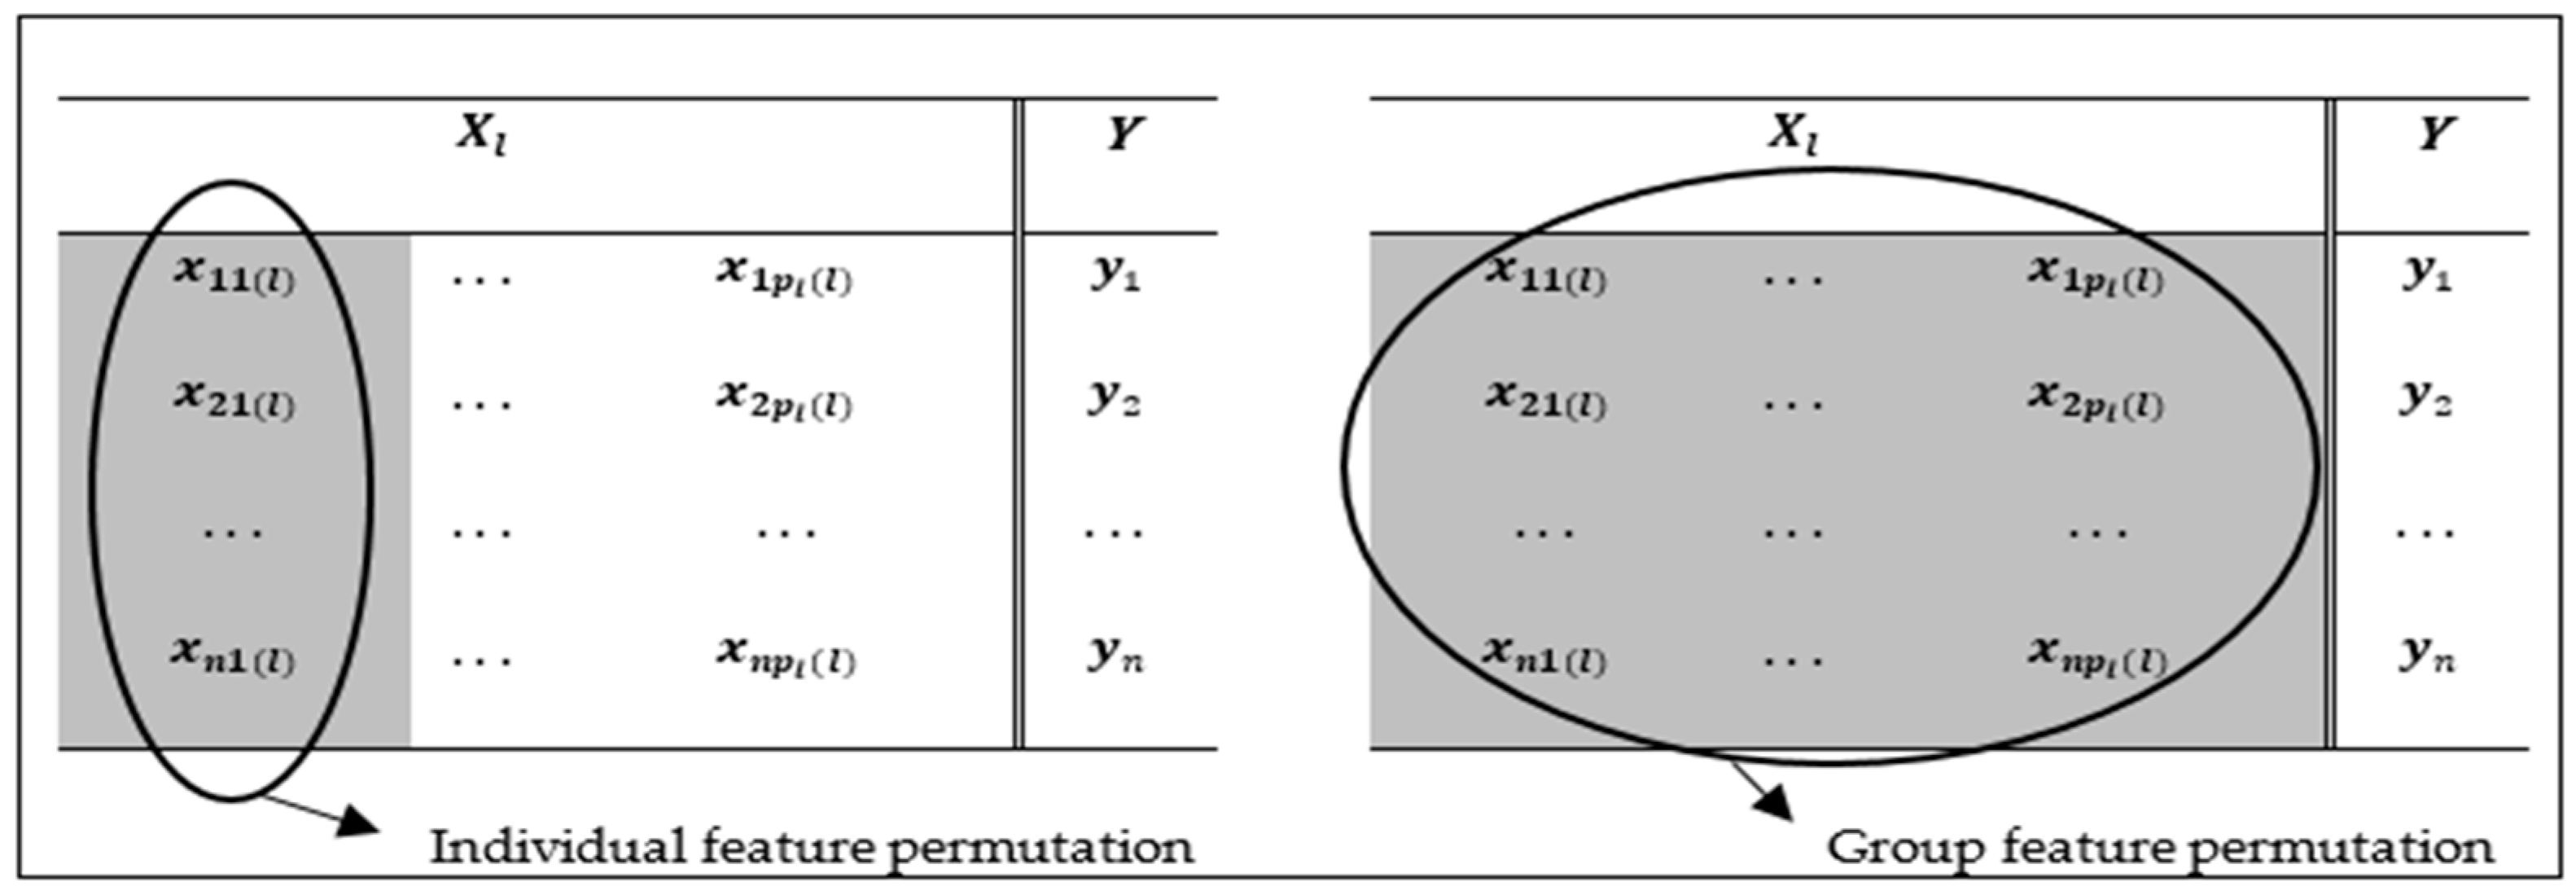
3.2. A Novel Permutation-Based Group Feature Importance Measure

We aimed to compute the importance of features by considering groups of features rather than individually. To achieve this, we proposed a new group feature importance measure that extended the permutation importance of individual features. Conventional methods typically compute the permutation importance of individual features by permuting them separately. However, in the present study, we encountered multidimensional groups consisting of multiple features. To handle this scenario appropriately, we propose permuting all columns within a common group at the same time, while keeping all other groups and target variables unchanged. This approach expands the importance of traditional feature permutation to a group feature level to capture the collaborative effect of feature groups.
Suppose we obtain a new dataset including a feature matrix X that has d individual features, which is much smaller than p, after removing irrelevant individual features based on LASSO. As shown in Figure 3, the new feature matrix X includes L groups, denoted as X = X 1 , X 2 , , X L , where X l is a n × p l matrix of features representing the l-th group feature of the new dataset. Each of these group features has p l individual features, where x 11 ( l ) is an individual value of the individual feature. Each group feature contains relevant and informative individual features, because irrelevant features have been removed using the LASSO method. Y = y 1 ,   y 2 , ,   y n is the target variable. By permuting all the features within a common group, while preserving the other groups and target variables in their original forms (Figure 3), we accurately assessed the importance score of each group feature in the context of the entire dataset. This enabled us to measure the impact of each group on the prediction performance of the model and to determine the relative significance of the group features in contributing to the overall predictive power of the model. This score assesses the increase in the prediction error of the model when the values of the group features are permuted.
The proposed method permutes the values of individual features within a specific group feature without altering the target variable. During this process, all other group features and target variable are kept in their original form, allowing us to assess the impact of that specific group on the prediction accuracy of the model. A significant decrease in prediction accuracy indicates that the group is strongly aligned with the target variable.
The process of random-forest-based permutation importance of the group feature is as follows: The group feature X l is randomly permuted, and the association of this group feature with the target variable Y is disrupted. When the permuted group feature X l , along with the nonpermuted group features, is used to predict the target variable for out-of-bag observation, the prediction accuracy decreases considerably if the original X l is aligned with the target variable. Therefore, according to Breiman [46], the difference in prediction accuracy before and after permuting X l is averaged across all trees as a measure of the group feature importance. This concept is defined as follows: Consider a tree t within an RF composed of n t r e e trees. Let β ( t ) represent the out-of-bag (OOB) sample for the tree t. Before permuting any features, the predicted class of the i-th observation by the tree t is denoted by y ^ i t . After permuting the values of a group feature X l , the predicted class of the same i-th observation is represented by y ^ i , π l t . The group feature permutation importance w ( t ) of X l in tree t is then defined as follows:
w t X l = i β t I y i = y ^ i t β t i β t I y i = y ^ i , π l t β t
By using Equation (2), the group feature permutation importance w of X l over all trees is then computed as
w X l = t = 1 n t r e e w t X l     n t r e e
The importance score, described in Equation (3), quantifies the impact of the group features on the model’s prediction performance. A higher importance score indicates that the group feature contributes significantly to the model accuracy. In contrast, a lower score suggests that the group feature has a lower impact on model performance. We gained valuable insight into the relative importance of each group feature by calculating the permutation importance, enabling us to rank and select the most influential group features for further analysis and model refinement. The pseudocode for this process is presented in Algorithm 1.
Algorithm 1: Pseudocode of permutation group importance based on random forest
Input: X matrix with d individual features, X L group features, and Y response variable
Output: vector W
1procedure Split dataset X into training and testing datasets
2Train the model on the training dataset and compute the baseline out-of-bag by using a random forest classifier
3Initialize all group feature score w[ X l ] = [ ]
4For l = 1 to L do
5 Compute the permutation importance of X l in tree t
w t X l = i β t I y i = y ^ i t β t i β t I y i = y ^ i , π l t β t
6 Calculate the overall permutation importance of X l
  w X l = t = 1 n t r e e w t X l     n t r e e
7end
8return vector W of group features score
9end procedure

3.3. Ranking and Selection of GF

Subsequently, by computing the permutation-based group feature importance scores for all the groups, we ranked them according to their importance scores. The group with the highest score was assigned the highest rank, which indicated the significance of the predictive performance of the model. This ranking allowed us to discern the relative importance of each group feature in contributing to the overall predictive power of the models.
Next, we calculated the average of all the importance scores obtained for the groups. The average score served as the threshold for selecting the most influential group features. Groups with importance scores above the average were retained. These selected group features were considered more relevant and influential in driving the model’s predictive accuracy.
By adopting this approach, we could efficiently identify and retain the most important group features, while discarding those with lower importance. This helped streamline the model’s representation and enhanced its interpretability by focusing on the most informative group features for further analysis and decision-making.

4. Results

4.1. Data Description

In this section, we present the performance of both the proposed method and an existing approach, along with a comparative analysis. We focus on the permutation-based group feature importance method introduced in Section 3, as well as the established group lasso method. For this evaluation, three distinct datasets (https://jundongl.github.io/scikit-feature/OLD/datasets_old.html (accessed on 15 February 2023)) were used: GLA-BRA-180, CLL-SUB-111, and TOX-171. These datasets consisted of microarray gene expression data sourced from the National Center for Biotechnology Information (NCBI). The datasets contained genes as predictors and included multiclass response variables. Specifically, the GLA-BRA-180 dataset comprised 49,151 features and 4 distinct classes, whereas CLL-SUB-111 included 11,340 features and 3 classes. The TOX-171 dataset encompassed 5749 features and 4 classes. Further insights into the characteristics of these datasets are presented in Table 1.
The GLA-BRA-180 dataset encompasses the expression profiles of stem cell factors important for exploring tumor angiogenesis. This dataset is useful for analyzing gliomas of various grades. In total, 180 samples were categorized into distinct classes: 23 samples belonged to the brain oligodendroglia class, 26 samples corresponded to glioblastomas, 81 samples represented astrocytomas, and 50 samples belonged to the non-tumor class. The CLL-SUB-111 dataset, another gene expression dataset, comprises distinct clinically and genetically delineated subgroups of B-cell chronic lymphocytic leukemia (B-CLL). Within this dataset, the initial 11 samples were assigned to the first class, 49 to the second class, and the remaining samples to the third class. This dataset facilitated the investigation of nuanced characteristics within B-CLL subgroups. The TOX-171 dataset considers the effect of influenza A on plasmacytoid dendritic cells (PDC). It leverages toxicology to assimilate a diverse range of biological data, encompassing aspects such as expression and clinical chemistry. This dataset was characterized by profiles generated across three distinct types of toxicants. The underlying objective of this dataset involves discerning whether a given sample exhibits toxicity, non-toxicity, or control.

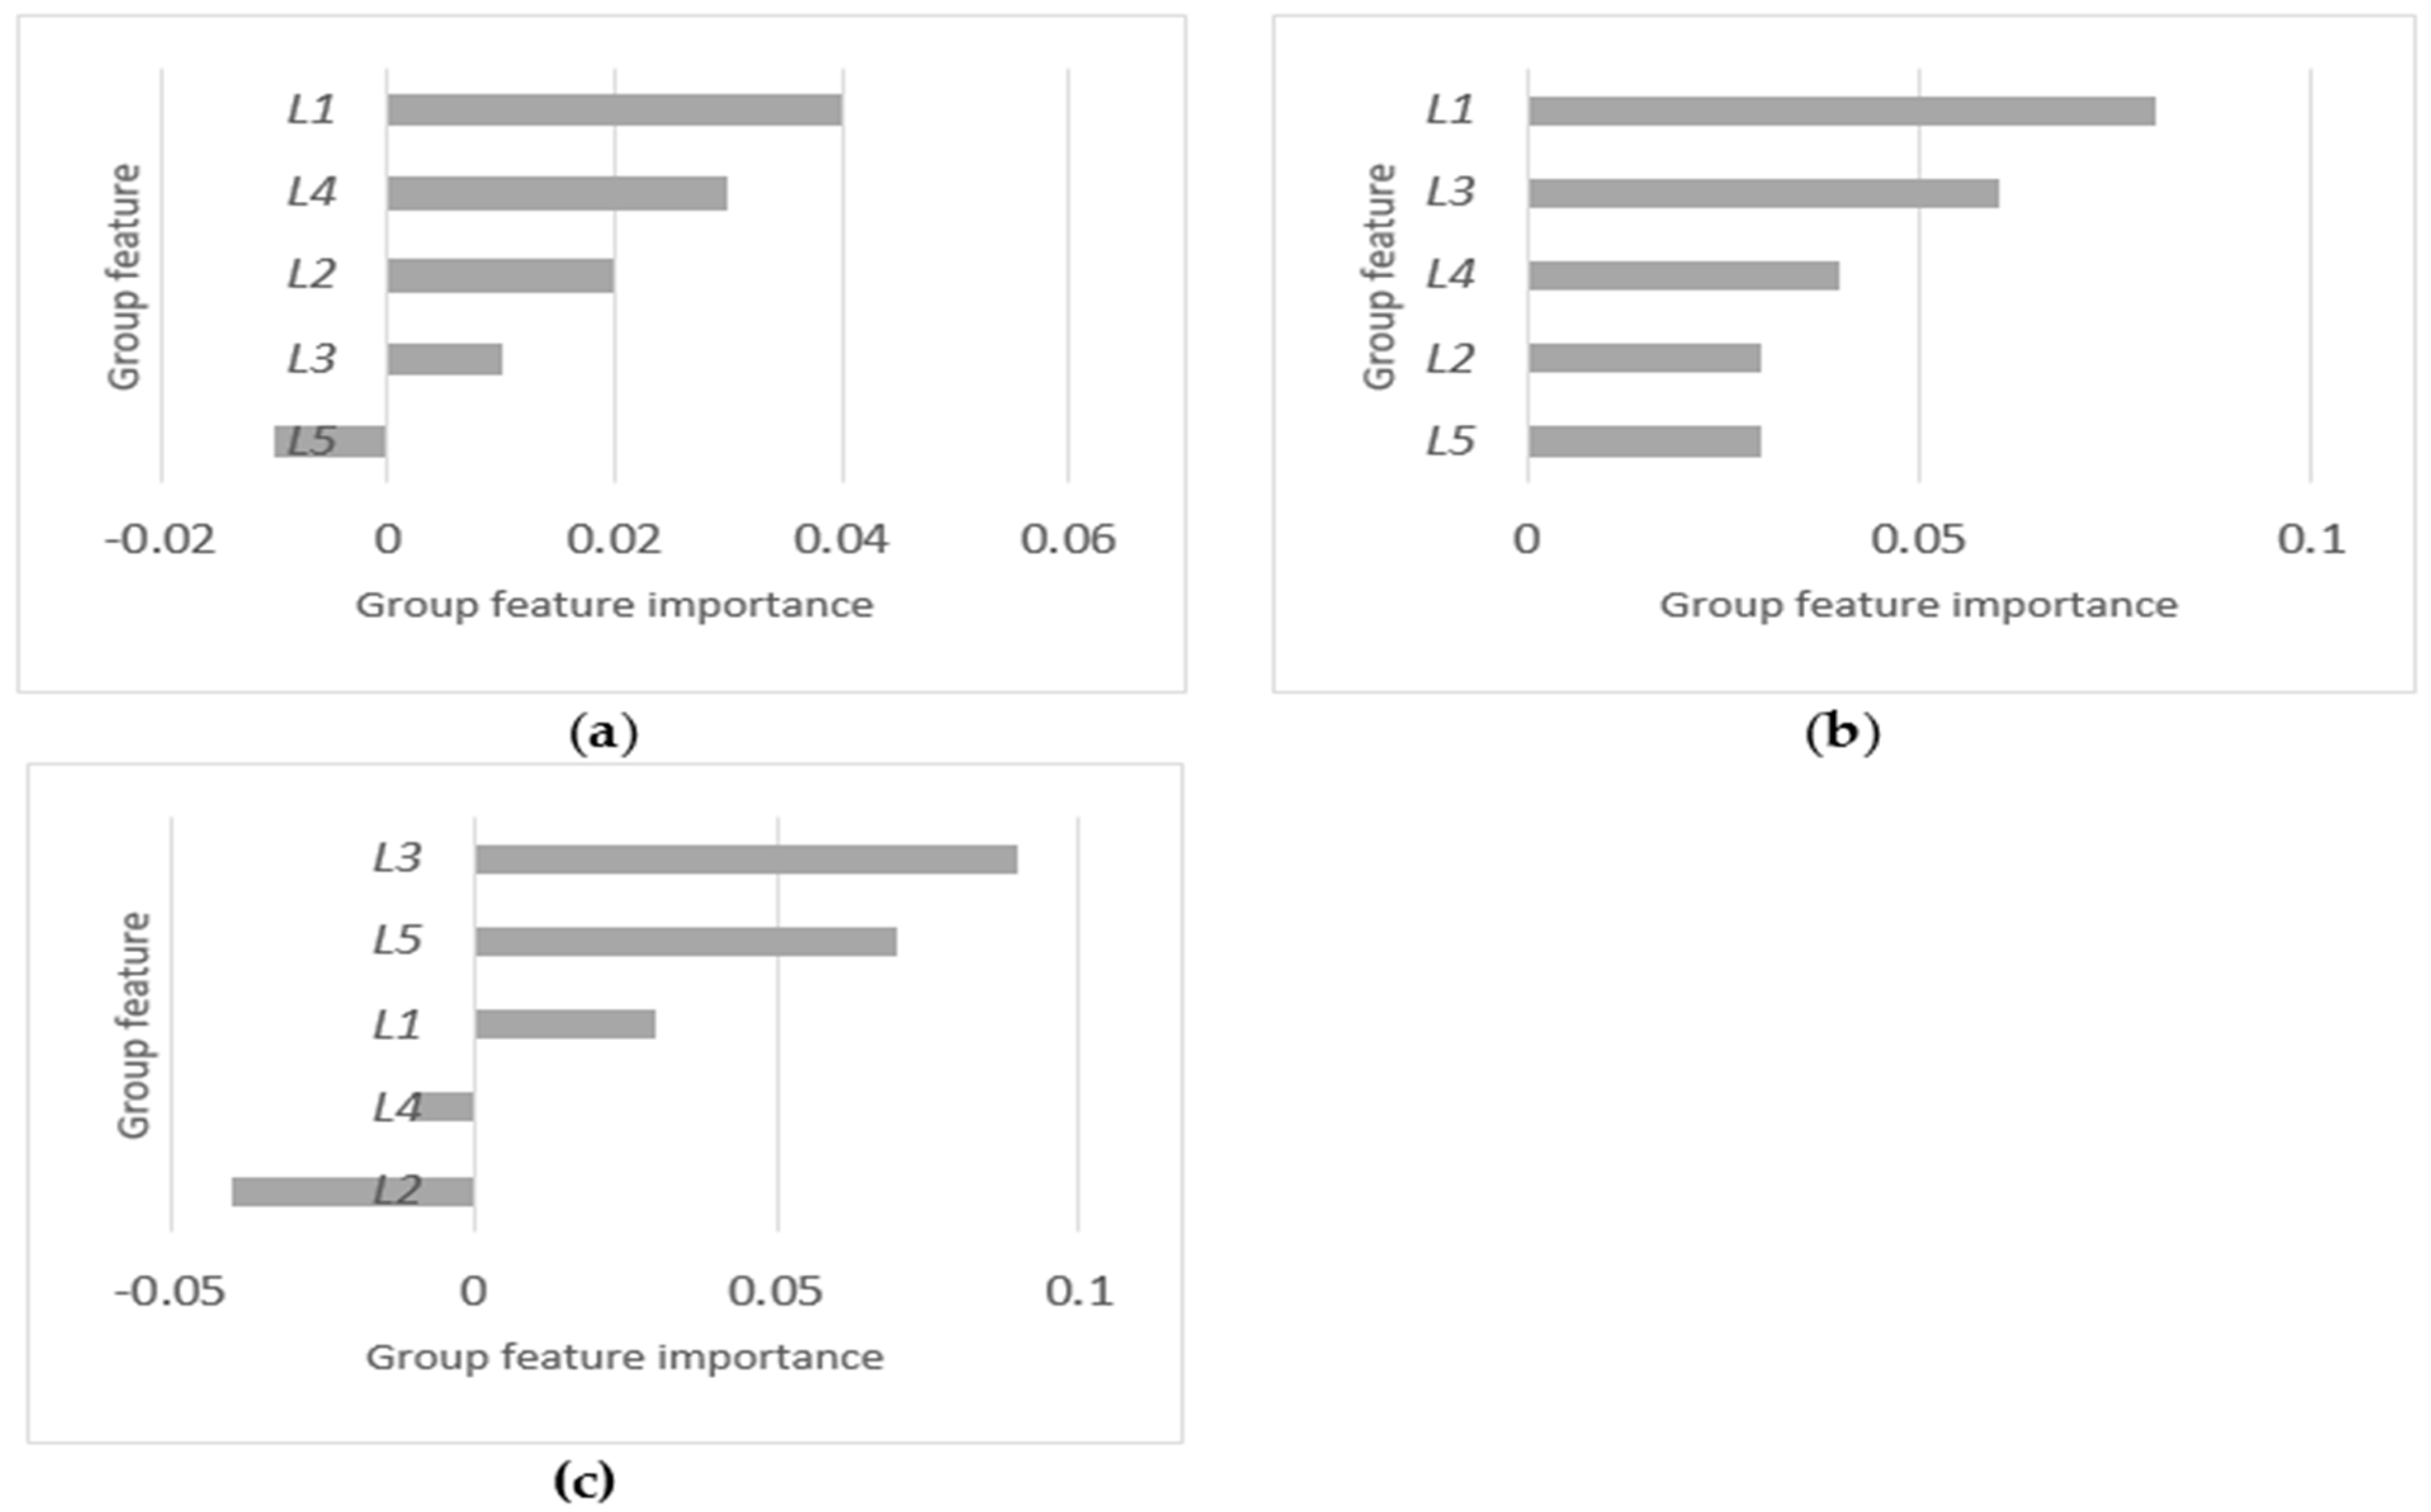
4.2. Relative Importance and Selection of Groups

In this study, we used high-dimensional gene expression datasets. The number of features in these datasets was as high as that of the samples. In each dataset, many features were correlated or relevant to each other. Thus, the relevant features formed groups or clusters. To address this issue, we employed the “agglomerative hierarchical clustering” technique, which facilitated the identification of groups in these datasets.
After splitting these datasets into groups, they still had large dimensions and many irrelevant features. The least absolute shrinkage and selection operator method was used to remove irrelevant features from each group. After removing the irrelevant features from each group, the remaining informative features were used for further analysis. Once we had identified meaningful features in each group, we determined the most important group features. For this purpose, we used the proposed technique called “permutation-based group feature importance” with the help of a random forest. Using this method, we determined the relative importance and importance scores of all group features, as shown in Figure 4.
Thus, we determined the important group features. Figure 4 shows the relative importance of all the group features, where L1, L2, …, L5 represent the group features. With the help of the relative importance, these group features could be ranked based on their importance. In Figure 4a, L1 had the largest importance, followed by L4, L2, L3, and L5. In Figure 4b, L1 emerged as the most important group feature, followed by L3, L4, L2, and L5. Similarly, in Figure 4c, L3 demonstrated the largest importance, followed by L5, L1, L4, and L2. Existing methods for group feature selection, such as group lasso, cannot provide the ranking and relative importance of each group. They simply select a few group features and do not provide information regarding their importance. The proposed method can select group features and provide additional information such as ranking and relative importance.
To select group features based on the relative importance of the groups, we took the average of all importance scores and selected those group features that were above the average values. Table 2 shows the selected group features and the total number of individual features in each group. Overall, our method combines selection, ranking, and understanding of the relative importance of group features. This approach sets our research apart from other works and helps us make better sense of complex data.

4.3. Comparison of the Classification Results

In this section, we conduct a comparison assessment between the proposed permutation-based group feature ranking method and an existing method called the group lasso. Initially, the original lasso method was employed to remove irrelevance features on an individual basis. We then examined the performance of group feature selection approaches by employing the selected group features in classification tasks. The tasks were executed through machine learning algorithms, aiming at identifying which one performed better in terms of the classification tasks. The comparison involved the utilization of machine learning techniques, specifically three algorithms: logistic regression (LR), support vector machine (SVM), and random forest (RF). Leave-one-out cross-validation was employed to evaluate the performance of the methods, providing a robust measure of the classification performance.
Important performance metrics, accuracy, and F1 score (F1) were used to evaluate the performance of the classification methods. To compute these performance metrics, a confusion matrix was determined as outlined in Table 3. In Table 3, tp represents true positive, tn denotes true negative, fp denotes false positive, and fn denotes false negative. Accuracy helped us understand the number of correct predictions made by our method compared to the total number of predictions. The formula for accuracy can be expressed as follows:
accuracy = t p + t n t p + t n + f p + f n
The F1 score balances precision and recall as follows:
F 1 = 2 × p r e c i s i o n × r e c a l l p r e c i s i o n + r e c a l l
where precision and recall denote t p t p + f p and t p t p + f n , respectively. In the context of a multi-class classification, we extended the confusion matrix by calculating an F1 score for each class individually. These scores were then averaged to arrive at a macro-averaged F1 score. This macro-averaging technique ensured an equitable contribution from each class to the final score. Consequently, this approach fairly evaluated the performance of the classification model, regardless of class imbalance.
The following three gene expression datasets were examined: GLA-BRA-180, CLL-SUB-111, and TOX-171. The proposed and group lasso methods were applied to these datasets, and each method selected group features separately. The selected group features were used to train the machine learning algorithms and calculate their respective accuracies and F1 scores on the testing dataset. Machine learning algorithms were also trained and evaluated using the original datasets, without employing any feature selection technique (No-FS). The results are summarized in Table 4. In comparison to No-FS, both feature selection methods (group lasso and the proposed method) performed better. Notably, using the CLL-SUB-111 dataset, the proposed method outperformed the group lasso using LR, SVM, and RF. For the GLA-BRA-180 dataset, the performances of both methods were almost the same for the SVM and RF classifiers in terms of accuracy. However, the proposed method performed slightly better with LR. Finally, concerning the TOX-171 dataset, the proposed method demonstrated a slight advantage over LR and RF and nearly the same performance as the SVM. This comparative analysis helped us see how well our approach stands up against an established method and which method works best on which algorithms.
For group feature selection, both the proposed method and group lasso were effective, which is why the results of these two methods in terms of accuracy and F1 score did not show a significant difference. However, the significance of the proposed method compared to group lasso lies in its ability to provide the relative importance of all group features.
The proposed method demonstrated superior performance in terms of accuracy and F1 score across all datasets. For instance, on the GLA-BRA-180 dataset, the proposed method achieved the highest accuracy of 89%, surpassing the group lasso method, which achieved an accuracy of 88%, and outperforming the No-FS approach, which achieved only 74% accuracy. Additionally, the proposed method achieved an F1 score of 89%, while the group lasso and No-FS methods achieved scores of 83% and 68%, respectively. This highlighted the effectiveness of the proposed method, which outperformed the group lasso by 1% in accuracy and by 15% compared to No-FS. Moreover, in terms of F1 score, the proposed method outperformed the group lasso by 6% and No-FS by 21%.
Similarly, on the CLL-SUB-111 dataset, the proposed method achieved the highest accuracy of 97%, while the group lasso and No-FS methods achieved 90% and 85%, respectively. The F1 score of the proposed method was 98%, compared to 93% for group lasso and 88% for No-FS. This demonstrated the superior performance of the proposed method across the various classification metrics.
On the TOX-171 dataset, the proposed method achieved an accuracy of 98%, slightly outperforming group lasso with 97% and No-FS with 90%. This further validated the effectiveness of the proposed method in achieving superior performance compared to existing methods across different datasets.
A key advantage of our method is its ability to provide not only the selection of group features but also their ranking and the relative importance of these group features. This rich information enables a more informed decision-making process for the group feature selection. While group lasso focuses primarily on selecting groups of features, our method goes beyond quantifying the importance of each feature group. Thus, we can identify the groups that contribute most to the predictive power of the model.
Our method offers a significant advantage by not only selecting group features but also by providing their ranking and delineating the relative importance of these groups. This capability affords a nuanced understanding that aids in informed decision-making for feature selection, whereas group lasso primarily selects feature groups without ranking them. By utilizing the rankings and importance scores, we ascertain the comprehensive contribution of each group feature, which facilitates the effective prioritization of the most impactful ones. Furthermore, the proposed method is not limited to specific algorithms and its insights can be applied to various classifiers. This flexibility allows it to be adapted to different machine-learning tasks.
In summary, the advantage of our method lies in its ability to offer a more detailed understanding of group feature importance, facilitating better decision-making in feature selection. This advantage, coupled with its ability to enhance model performance, makes it a powerful tool for addressing high-dimensional and low-sample-size data challenges.
In this study, we focused on distinct sparsity levels at the group level and within individual groups. In the future, we envision the simultaneous implementation of the sparsity process at both group and intragroup levels, particularly targeting multiclass high-dimensional and low-sample size (HDLSS) datasets. This study aimed to formulate a novel method for selecting and ranking group features in the context of multiclass HDLSS data. This method was subsequently compared to an established approach. This study demonstrated that the proposed method exhibited superior performance compared with the group lasso method.

5. Discussion and Conclusions

To the best of our knowledge, only a limited number of studies have introduced methods for group feature ranking and selection, specifically for high-dimensional datasets. Previous studies have not used permutation methods for this purpose. In this study, a novel permutation-based approach was proposed that systematically computes the relative importance scores for all group features and subsequently ranks them based on their respective scores. The proposed method selects a subset comprising only the most important group features. To assess the efficacy of the proposed group feature ranking and selection method, rigorous evaluations were conducted using high-dimensional real-world datasets.
The datasets analyzed in this study demonstrated a mix of high dimensionality and a limited number of samples. With feature numbers extending to thousands and sample sizes remaining in the range of a few hundred, a practical approach to dimensionality reduction is imperative. This study emphasized the importance of a careful reduction strategy. This highlights the fact that datasets with moderate sizes or dimensions do not necessarily require drastic dimensionality reduction. For practitioners working with datasets of different sizes, adjusting the parameters at the beginning allows for fine-tuning the removal of irrelevant features according to specific needs. Notably, this study showed a performance improvement when the dimensionality reduction was more aggressive in the early stages.
The introduced methodology enhances the interpretability of group features, an aspect that existing methods weaken by not providing information regarding the relative importance of selected groups. Unlike existing group feature selection methods, such as the group lasso, which cannot describe the specific contributions or importance of selected or rejected groups, our proposed method provides insights into both selected and rejected groups. Moreover, the proposed method maintains a competitive classification performance in the field of machine learning algorithms, positioning itself at an equal level with existing methodologies.
This paper introduced a group feature selection method that employs a permutation-based strategy specifically designed for datasets characterized by high dimensionality and small sample sizes. Initial dimensionality reduction was accomplished by eliminating irrelevant individual features within each group, followed by the computation of the relative importance of all groups. Subsequently, groups with importance values exceeding the average were selected. The data obtained from these groups were divided into training and testing datasets. Machine learning algorithms were trained on the training data, and model performance was evaluated using test data. Given the small sample size of the datasets used in this study, leave-one-out cross-validation was employed to assess the performance of the proposed method. The experimental results demonstrated that the performance of the proposed method was comparable or superior to that of existing methodologies in machine learning algorithms.
The proposed method exhibited distinctive characteristics that are particularly noteworthy in the context of high-dimensional datasets. Notably, the method undertook an aggressive dimensionality reduction, yielding a higher classification accuracy than that of the original datasets, despite the removal of a substantial number of features. A notable aspect of the proposed method is its departure from existing permutation importance methods, which are typically applied to compute the importance of individual features. Existing methods tend to overestimate the importance of specific features in scenarios characterized by feature correlations and group structures. To address this, the proposed method employs permutations at the group level, offering a more accurate reflection of the importance of group features within the context of correlated features and group structures.
Despite the utilization of datasets with a low sample size in this study, it is pertinent to note that the proposed method is applicable to datasets characterized by more ample sample sizes. Furthermore, the applicability of this method extends beyond microarray gene expression datasets and encompasses a broader spectrum of datasets. This method initiates the imposition of sparsity at the within-group level as the first step, followed by a secondary sparsity operation at the group level. A prospective avenue for future research involves the concurrent application of sparsity constraints at both group and within-group levels.

Author Contributions

Modelling, I.M.Z. and B.K.; Validation, I.M.Z.; Writing—original draft, I.M.Z.; Writing—review and editing, Y.-S.L.; Supervision, Y.-S.L. and B.K. All authors have read and agreed to the published version of the manuscript.

Funding

This reseach received no external funding.

Data Availability Statement

The data presented in this study are available at https://jundongl.github.io/scikit-feature/OLD/datasets_old.html accessed on 15 February 2023.

Acknowledgments

Byunghoon Kim’s work is supported by the National Research Foundation of Korea (NRF) grant funded by the Korea government (MSIT) (No. NRF-2022R1F1A1063273). Also, Yung-Seop Lee’s work is supported by the Dongguk University Research Fund of 2024 and the National Research Foundation of Korea (NRF) grant funded by the Korean government (MSIT) (No. NRF-2021R1A2C1007095). The authors would like to thank the editor and reviewers for their insightful and constructive comments, which greatly contributed to enhancing the quality of this work.

Conflicts of Interest

The authors declare no conflicts of interest.

References

  1. Cavalheiro, L.P.; Bernard, S.; Barddal, J.P.; Heutte, L. Random forest kernel for high-dimension low sample size classification. Stat. Comput. 2024, 34, 9. [Google Scholar] [CrossRef]
  2. Jiménez, F.; Sánchez, G.; Palma, J.; Miralles-Pechuán, L.; Botía, J.A. Multivariate feature ranking with high-dimensional data for classification tasks. IEEE Access 2022, 10, 60421–60437. [Google Scholar] [CrossRef]
  3. Bolón-Canedo, V.; Sánchez-Marono, N.; Alonso-Betanzos, A.; Benítez, J.M.; Herrera, F. A review of microarray datasets and applied feature selection methods. Inf. Sci. 2014, 282, 111–135. [Google Scholar] [CrossRef]
  4. Tang, F.; Adam, L.; Si, B. Group feature selection with multiclass support vector machine. Neurocomputing 2018, 317, 42–49. [Google Scholar] [CrossRef]
  5. Wang, Y.; Li, X.; Ruiz, R. Weighted general group lasso for gene selection in cancer classification. IEEE Trans. Cybern. 2018, 49, 2860–2873. [Google Scholar] [CrossRef] [PubMed]
  6. Bakin, S. Adaptive Regression and Model Selection in Data Mining Problems; The Australian National University: Canberra, Australia, 1999. [Google Scholar]
  7. Tibshirani, R. Regression shrinkage and selection via the lasso. J. R. Stat. Soc. Ser. B Stat. Methodol. 1996, 58, 267–288. [Google Scholar] [CrossRef]
  8. Yuan, M.; Lin, Y. Model selection and estimation in regression with grouped variables. J. R. Stat. Soc. Ser. B Stat. Methodol. 2006, 68, 49–67. [Google Scholar] [CrossRef]
  9. Meier, L.; Van De Geer, S.; Bühlmann, P. The group lasso for logistic regression. J. R. Stat. Soc. Ser. B Stat. Methodol. 2008, 70, 53–71. [Google Scholar] [CrossRef]
  10. Simon, N.; Friedman, J.; Hastie, T.; Tibshirani, R. A sparse-group lasso. J. Comput. Graph. Stat. 2013, 22, 231–245. [Google Scholar] [CrossRef]
  11. Fang, K.; Wang, X.; Zhang, S.; Zhu, J.; Ma, S. Bi-level variable selection via adaptive sparse group Lasso. J. Stat. Comput. Simul. 2015, 85, 2750–2760. [Google Scholar] [CrossRef]
  12. Vincent, M.; Hansen, N.R. Sparse group lasso and high dimensional multinomial classification. Comput. Stat. Data Anal. 2014, 71, 771–786. [Google Scholar] [CrossRef]
  13. Zhang, H.; Wang, J.; Sun, Z.; Zurada, J.M.; Pal, N.R. Feature selection for neural networks using group lasso regularization. IEEE Trans. Knowl. Data Eng. 2019, 32, 659–673. [Google Scholar] [CrossRef]
  14. Zubair, I.M.; Kim, B. A Group Feature Ranking and Selection Method Based on Dimension Reduction Technique in High-Dimensional Data. IEEE Access 2022, 10, 125136–125147. [Google Scholar] [CrossRef]
  15. Theng, D.; Bhoyar, K.K. Feature selection techniques for machine learning: A survey of more than two decades of research. Knowl. Inf. Syst. 2024, 66, 1575–1637. [Google Scholar] [CrossRef]
  16. Egozi, O.; Gabrilovich, E.; Markovitch, S. Concept-Based Feature Generation and Selection for Information Retrieval. In Proceedings of the AAAI, Chicago, IL, USA, 13–17 July 2008; pp. 1132–1137. [Google Scholar]
  17. Chen, J.; Huang, H.; Tian, S.; Qu, Y. Feature selection for text classification with Naïve Bayes. Expert Syst. Appl. 2009, 36, 5432–5435. [Google Scholar] [CrossRef]
  18. Vajda, S.; Karargyris, A.; Jaeger, S.; Santosh, K.; Candemir, S.; Xue, Z.; Antani, S.; Thoma, G. Feature selection for automatic tuberculosis screening in frontal chest radiographs. J. Med. Syst. 2018, 42, 146. [Google Scholar] [CrossRef] [PubMed]
  19. Dy, J.G.; Brodley, C.E.; Kak, A.; Broderick, L.S.; Aisen, A.M. Unsupervised feature selection applied to content-based retrieval of lung images. IEEE Trans. Pattern Anal. Mach. Intell. 2003, 25, 373–378. [Google Scholar] [CrossRef]
  20. Lazar, C.; Taminau, J.; Meganck, S.; Steenhoff, D.; Coletta, A.; Molter, C.; de Schaetzen, V.; Duque, R.; Bersini, H.; Nowe, A. A survey on filter techniques for feature selection in gene expression microarray analysis. IEEE/ACM Trans. Comput. Biol. Bioinform. 2012, 9, 1106–1119. [Google Scholar] [CrossRef]
  21. Haq, A.U.; Zhang, D.; Peng, H.; Rahman, S.U. Combining multiple feature-ranking techniques and clustering of variables for feature selection. IEEE Access 2019, 7, 151482–151492. [Google Scholar] [CrossRef]
  22. Chandrashekar, G.; Sahin, F. A survey on feature selection methods. Comput. Electr. Eng. 2014, 40, 16–28. [Google Scholar] [CrossRef]
  23. Kohavi, R.; John, G.H. Wrappers for feature subset selection. Artif. Intell. 1997, 97, 273–324. [Google Scholar] [CrossRef]
  24. Hsu, H.-H.; Hsieh, C.-W.; Lu, M.-D. Hybrid feature selection by combining filters and wrappers. Expert Syst. Appl. 2011, 38, 8144–8150. [Google Scholar] [CrossRef]
  25. Abeel, T.; Helleputte, T.; Van de Peer, Y.; Dupont, P.; Saeys, Y. Robust biomarker identification for cancer diagnosis with ensemble feature selection methods. Bioinformatics 2010, 26, 392–398. [Google Scholar] [CrossRef] [PubMed]
  26. Liu, H.; Setiono, R. Chi2: Feature selection and discretization of numeric attributes. In Proceedings of the 7th IEEE International Conference on Tools with Artificial Intelligence, Herndon, VA, USA, 5–8 November 1995; pp. 388–391. [Google Scholar]
  27. Chuang, L.-Y.; Ke, C.-H.; Chang, H.-W.; Yang, C.-H. A two-stage feature selection method for gene expression data. OMICS A J. Integr. Biol. 2009, 13, 127–137. [Google Scholar] [CrossRef] [PubMed]
  28. Göcs, L.; Johanyák, Z.C. Feature Selection with Weighted Ensemble Ranking for Improved Classification Performance on the CSE-CIC-IDS2018 Dataset. Computers 2023, 12, 147. [Google Scholar] [CrossRef]
  29. Cheng, Y.; Shi, Q. PCMIgr: A fast packet classification method based on information gain ratio. J. Supercomput. 2023, 79, 7414–7437. [Google Scholar] [CrossRef]
  30. Kira, K.; Rendell, L.A. A practical approach to feature selection. In Machine Learning Proceedings 1992; Elsevier: Amsterdam, The Netherlands, 1992; pp. 249–256. [Google Scholar]
  31. Kononenko, I.; Šimec, E.; Robnik-Šikonja, M. Overcoming the myopia of inductive learning algorithms with RELIEFF. Appl. Intell. 1997, 7, 39–55. [Google Scholar] [CrossRef]
  32. Eppstein, M.J.; Haake, P. Very large scale ReliefF for genome-wide association analysis. In Proceedings of the 2008 IEEE Symposium on Computational Intelligence in Bioinformatics and Computational Biology, Sun Valley, ID, USA, 15–17 September 2008; pp. 112–119. [Google Scholar]
  33. Greene, C.S.; Penrod, N.M.; Kiralis, J.; Moore, J.H. Spatially uniform relieff (SURF) for computationally-efficient filtering of gene-gene interactions. BioData Min. 2009, 2, 5. [Google Scholar] [CrossRef] [PubMed]
  34. Greene, C.S.; Himmelstein, D.S.; Kiralis, J.; Moore, J.H. The informative extremes: Using both nearest and farthest individuals can improve relief algorithms in the domain of human genetics. In Proceedings of the European Conference on Evolutionary Computation, Machine Learning and Data Mining in Bioinformatics, Istanbul, Turkey, 7–9 April 2010; pp. 182–193. [Google Scholar]
  35. Urbanowicz, R.J.; Meeker, M.; La Cava, W.; Olson, R.S.; Moore, J.H. Relief-based feature selection: Introduction and review. J. Biomed. Inform. 2018, 85, 189–203. [Google Scholar] [CrossRef]
  36. Granizo-Mackenzie, D.; Moore, J.H. Multiple threshold spatially uniform relieff for the genetic analysis of complex human diseases. In Proceedings of the Evolutionary Computation, Machine Learning and Data Mining in Bioinformatics: 11th European Conference, EvoBIO 2013, Vienna, Austria, 3–5 April 2013; pp. 1–10. [Google Scholar]
  37. Stokes, M.E.; Visweswaran, S. Application of a spatially-weighted Relief algorithm for ranking genetic predictors of disease. BioData Min. 2012, 5, 20. [Google Scholar] [CrossRef]
  38. Le, T.T.; Urbanowicz, R.J.; Moore, J.H.; McKinney, B.A. Statistical inference relief (STIR) feature selection. Bioinformatics 2019, 35, 1358–1365. [Google Scholar] [CrossRef] [PubMed]
  39. Breitling, R.; Armengaud, P.; Amtmann, A.; Herzyk, P. Rank products: A simple, yet powerful, new method to detect differentially regulated genes in replicated microarray experiments. FEBS Lett. 2004, 573, 83–92. [Google Scholar] [CrossRef]
  40. Ye, J.; Xiong, T.; Madigan, D. Computational and Theoretical Analysis of Null Space and Orthogonal Linear Discriminant Analysis. J. Mach. Learn. Res. 2006, 7, 1183–1204. [Google Scholar]
  41. Dudoit, S.; Yang, Y.H.; Callow, M.J.; Speed, T.P. Statistical methods for identifying differentially expressed genes in replicated cDNA microarray experiments. Stat. Sin. 2002, 12, 111–139. [Google Scholar]
  42. Bolón-Canedo, V.; Sánchez-Maroño, N.; Alonso-Betanzos, A. A review of feature selection methods on synthetic data. Knowl. Inf. Syst. 2013, 34, 483–519. [Google Scholar] [CrossRef]
  43. Huang, J.; Breheny, P.; Ma, S. A selective review of group selection in high-dimensional models. Stat. Sci. A Rev. J. Inst. Math. Stat. 2012, 27, 481–499. [Google Scholar] [CrossRef] [PubMed]
  44. Jiang, D.; Huang, J. Concave 1-norm group selection. Biostatistics 2015, 16, 252–267. [Google Scholar] [CrossRef] [PubMed]
  45. Noguchi, K.; Konietschke, F.; Marmolejo-Ramos, F.; Pauly, M. Permutation tests are robust and powerful at 0.5% and 5% significance levels. Behav. Res. Methods 2021, 53, 2712–2724. [Google Scholar] [CrossRef]
  46. Breiman, L. Random forests. Mach. Learn. 2001, 45, 5–32. [Google Scholar] [CrossRef]
Figure 1. Flow chart of the proposed methodology.
Applsci 14 03156 g001
Figure 2. The framework of this study.
Applsci 14 03156 g002
Figure 3. Permutation scheme for individual features (left) and for the group features (right).
Applsci 14 03156 g003
Figure 4. Relative importance among group features of the GLA−BRA−180 (a), CLL−SUB−111 (b), and TOX−171 datasets (c).
Applsci 14 03156 g004
Table 1. Data description.
CategoryDatasetNo. of
Samples
No. of
Features
No. of
Classes
Microarray GLA-BRA-180180 491514
MicroarrayCLL-SUB-111111113403
MicroarrayTOX-17117157494
Table 2. The selected group features on different datasets.
GroupGLA-BRA-180CLL-SUB-111TOX-171
No. of
Features
Selected GroupsNo. of
Features
Selected GroupsNo. of
Features
Selected Groups
L11411644118605
L2140442113 5156
L35089 14512774
L434941766 4941
L512412 1598 1768
Table 3. An example of a confusion matrix.
Predicted Class
PositiveNegative
Actual classPositivetpfn
Negativefptn
Table 4. Prediction accuracy and F1 score of the proposed method and group lasso.
DatasetClassifierNo-FSGroup-LassoProposed Method
AccuracyF1 ScoreAccuracyF1 ScoreAccuracyF1 Score
GLA-BRA-180LR0.740.680.810.790.830.82
SVM0.730.670.880.830.890.89
RF0.70.570.710.630.710.65
CLL-SUB-111LR0.820.830.870.910.950.97
SVM0.850.880.90.930.970.98
RF0.710.750.830.870.880.91
TOX-171LR0.860.850.870.880.90.89
SVM0.90.890.970.970.980.98
RF0.720.720.710.720.740.73
Disclaimer/Publisher’s Note: The statements, opinions and data contained in all publications are solely those of the individual author(s) and contributor(s) and not of MDPI and/or the editor(s). MDPI and/or the editor(s) disclaim responsibility for any injury to people or property resulting from any ideas, methods, instructions or products referred to in the content.

