
Fracture Evolution and Mechanical Properties of Mortar Containing Different Inclusions


Abstract
:1. Introduction
2. Test Methodology
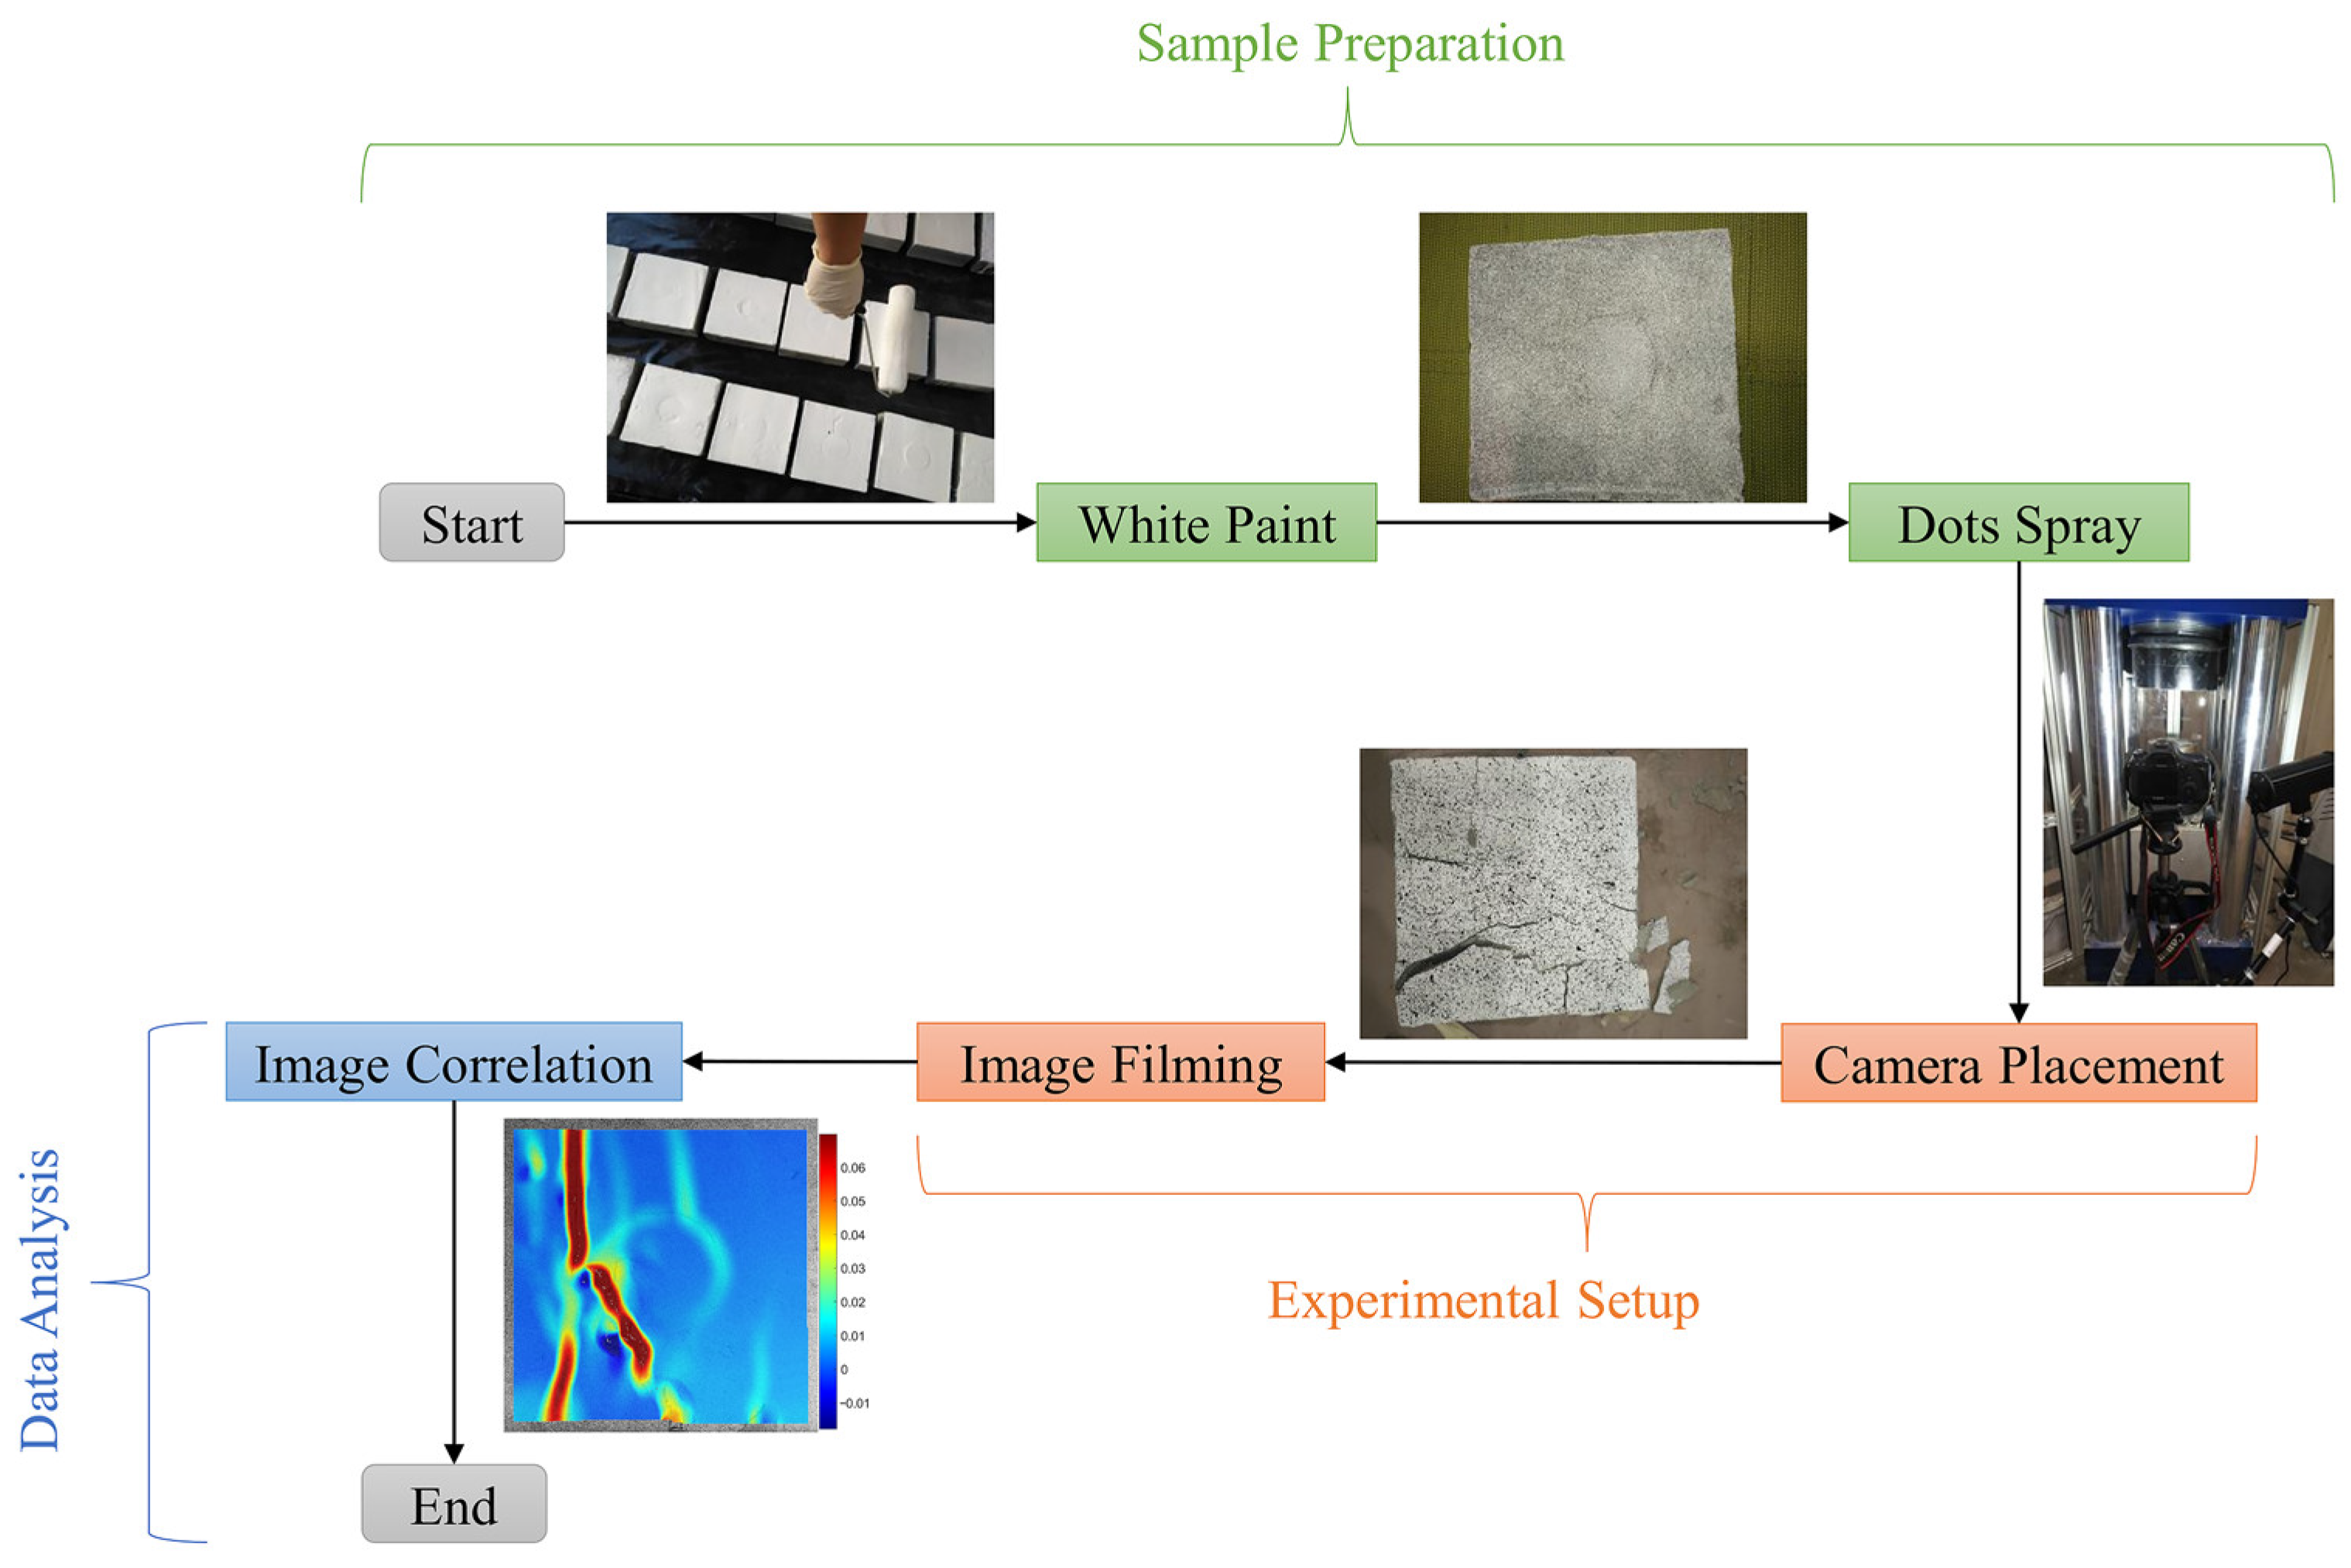
2.1. DIC Method
- Paint the surface of the sample with white paint.
- Spray black dots on the white paint as reference points for the image analysis.
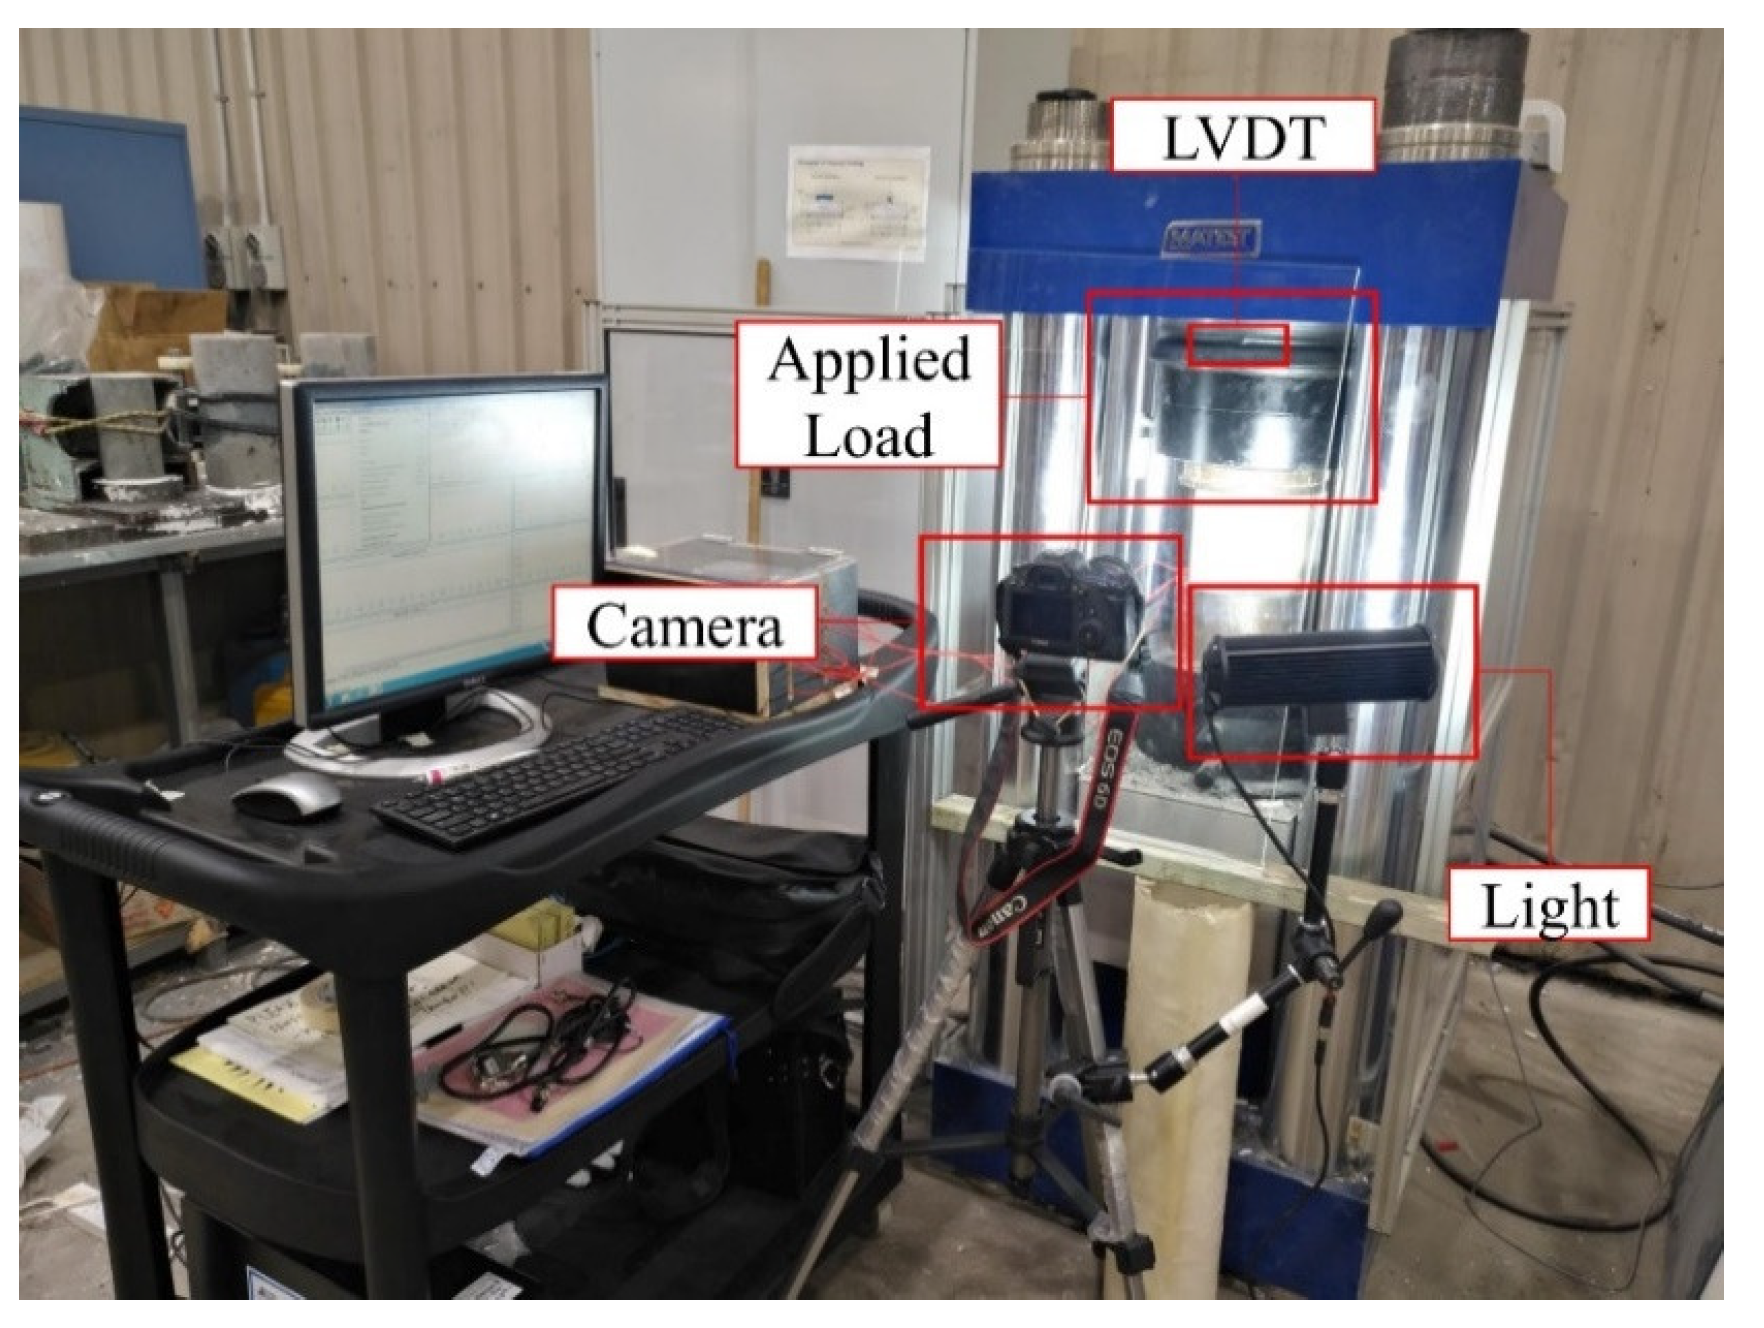
- Place the camera and tripod in front of the sample. Additional light needs to be added to avoid shadow if necessary.
- Film the sample surface during the loading process.
- Visualize the fracture process on the sample surface using image correlation software.
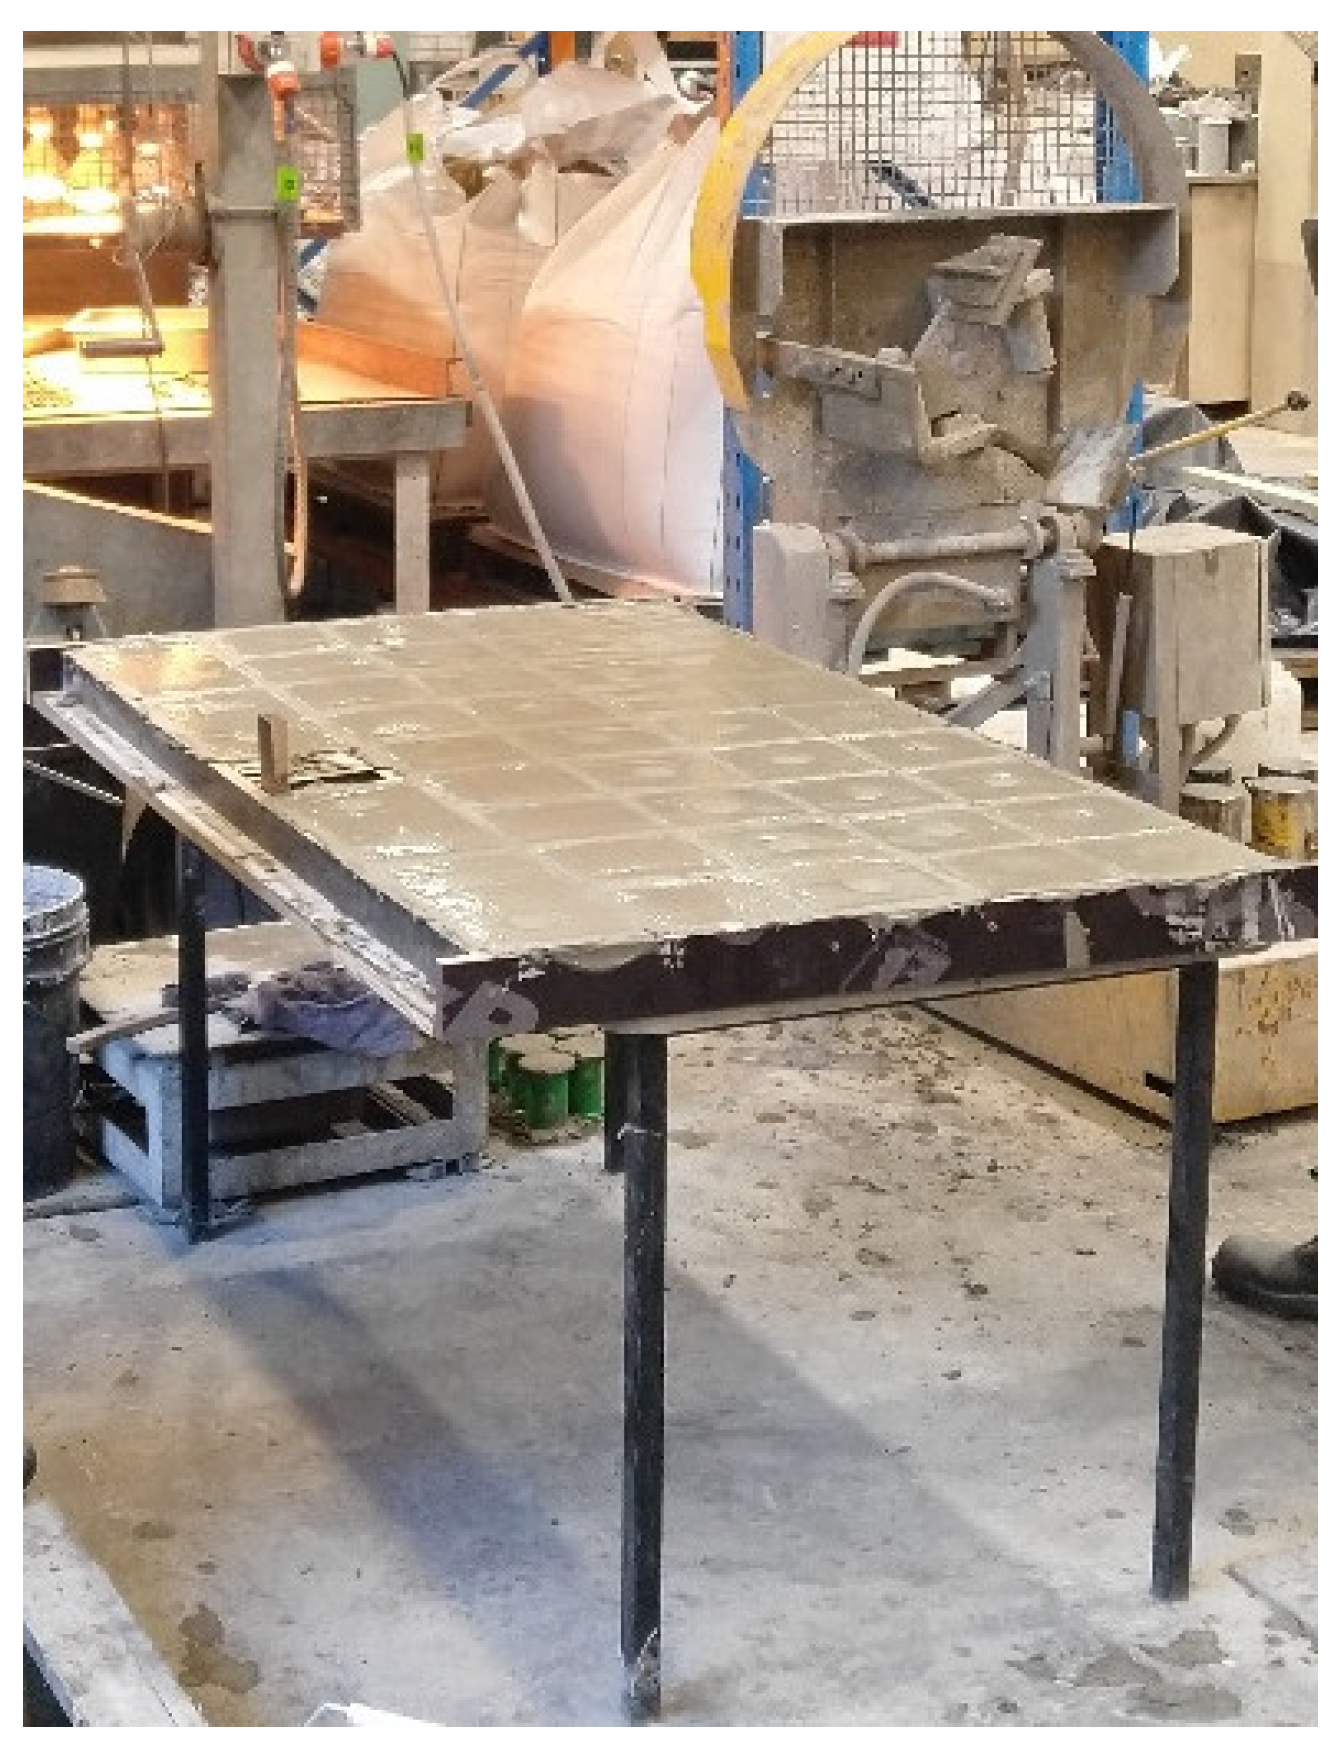
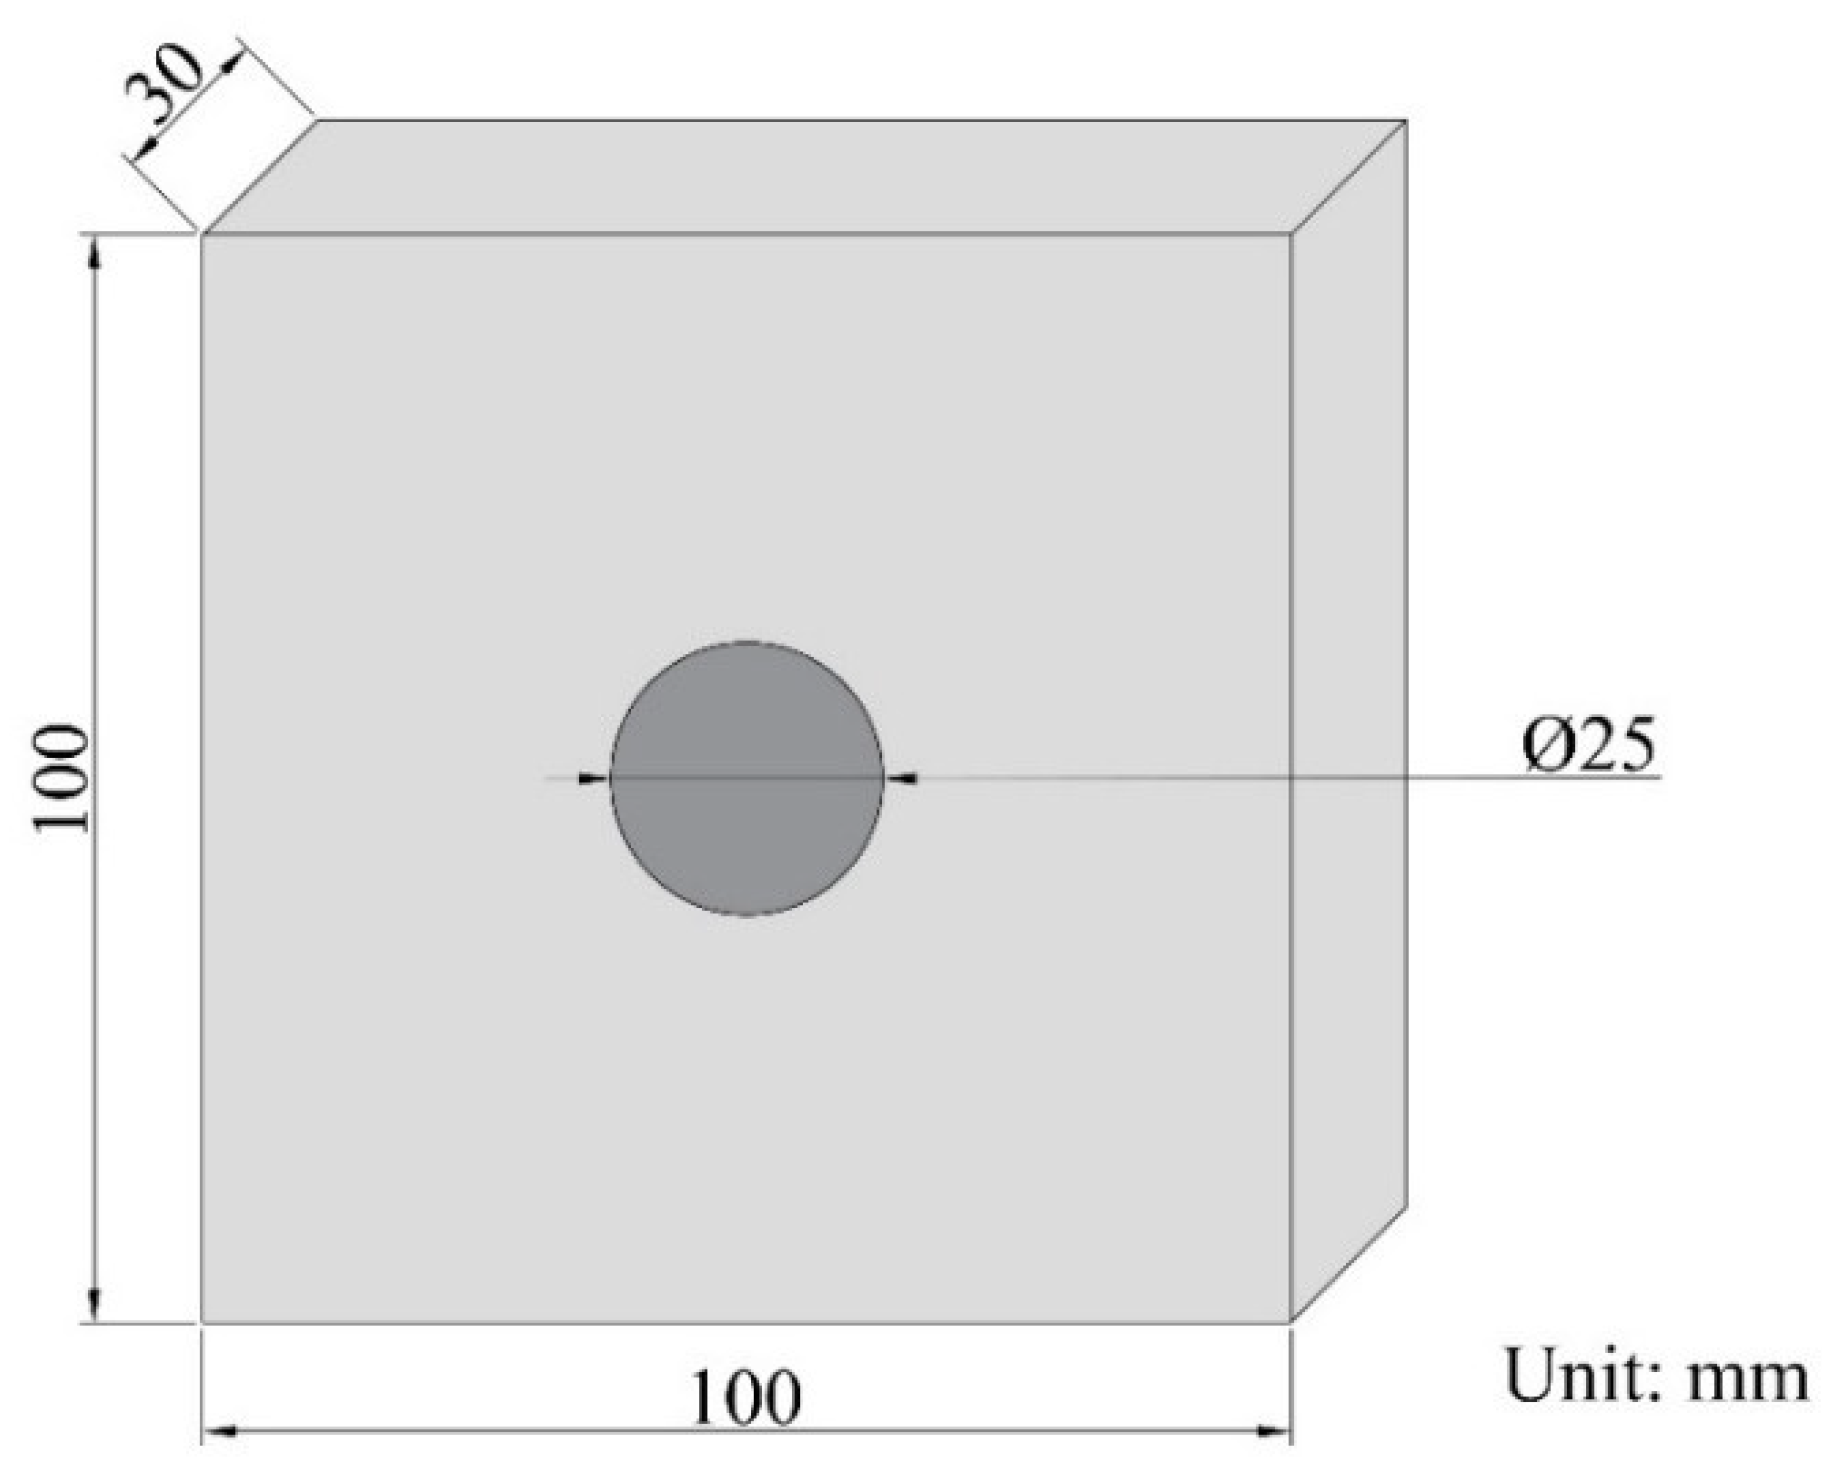
2.2. Sample Preparation
2.3. Test Procedure
3. Test Results
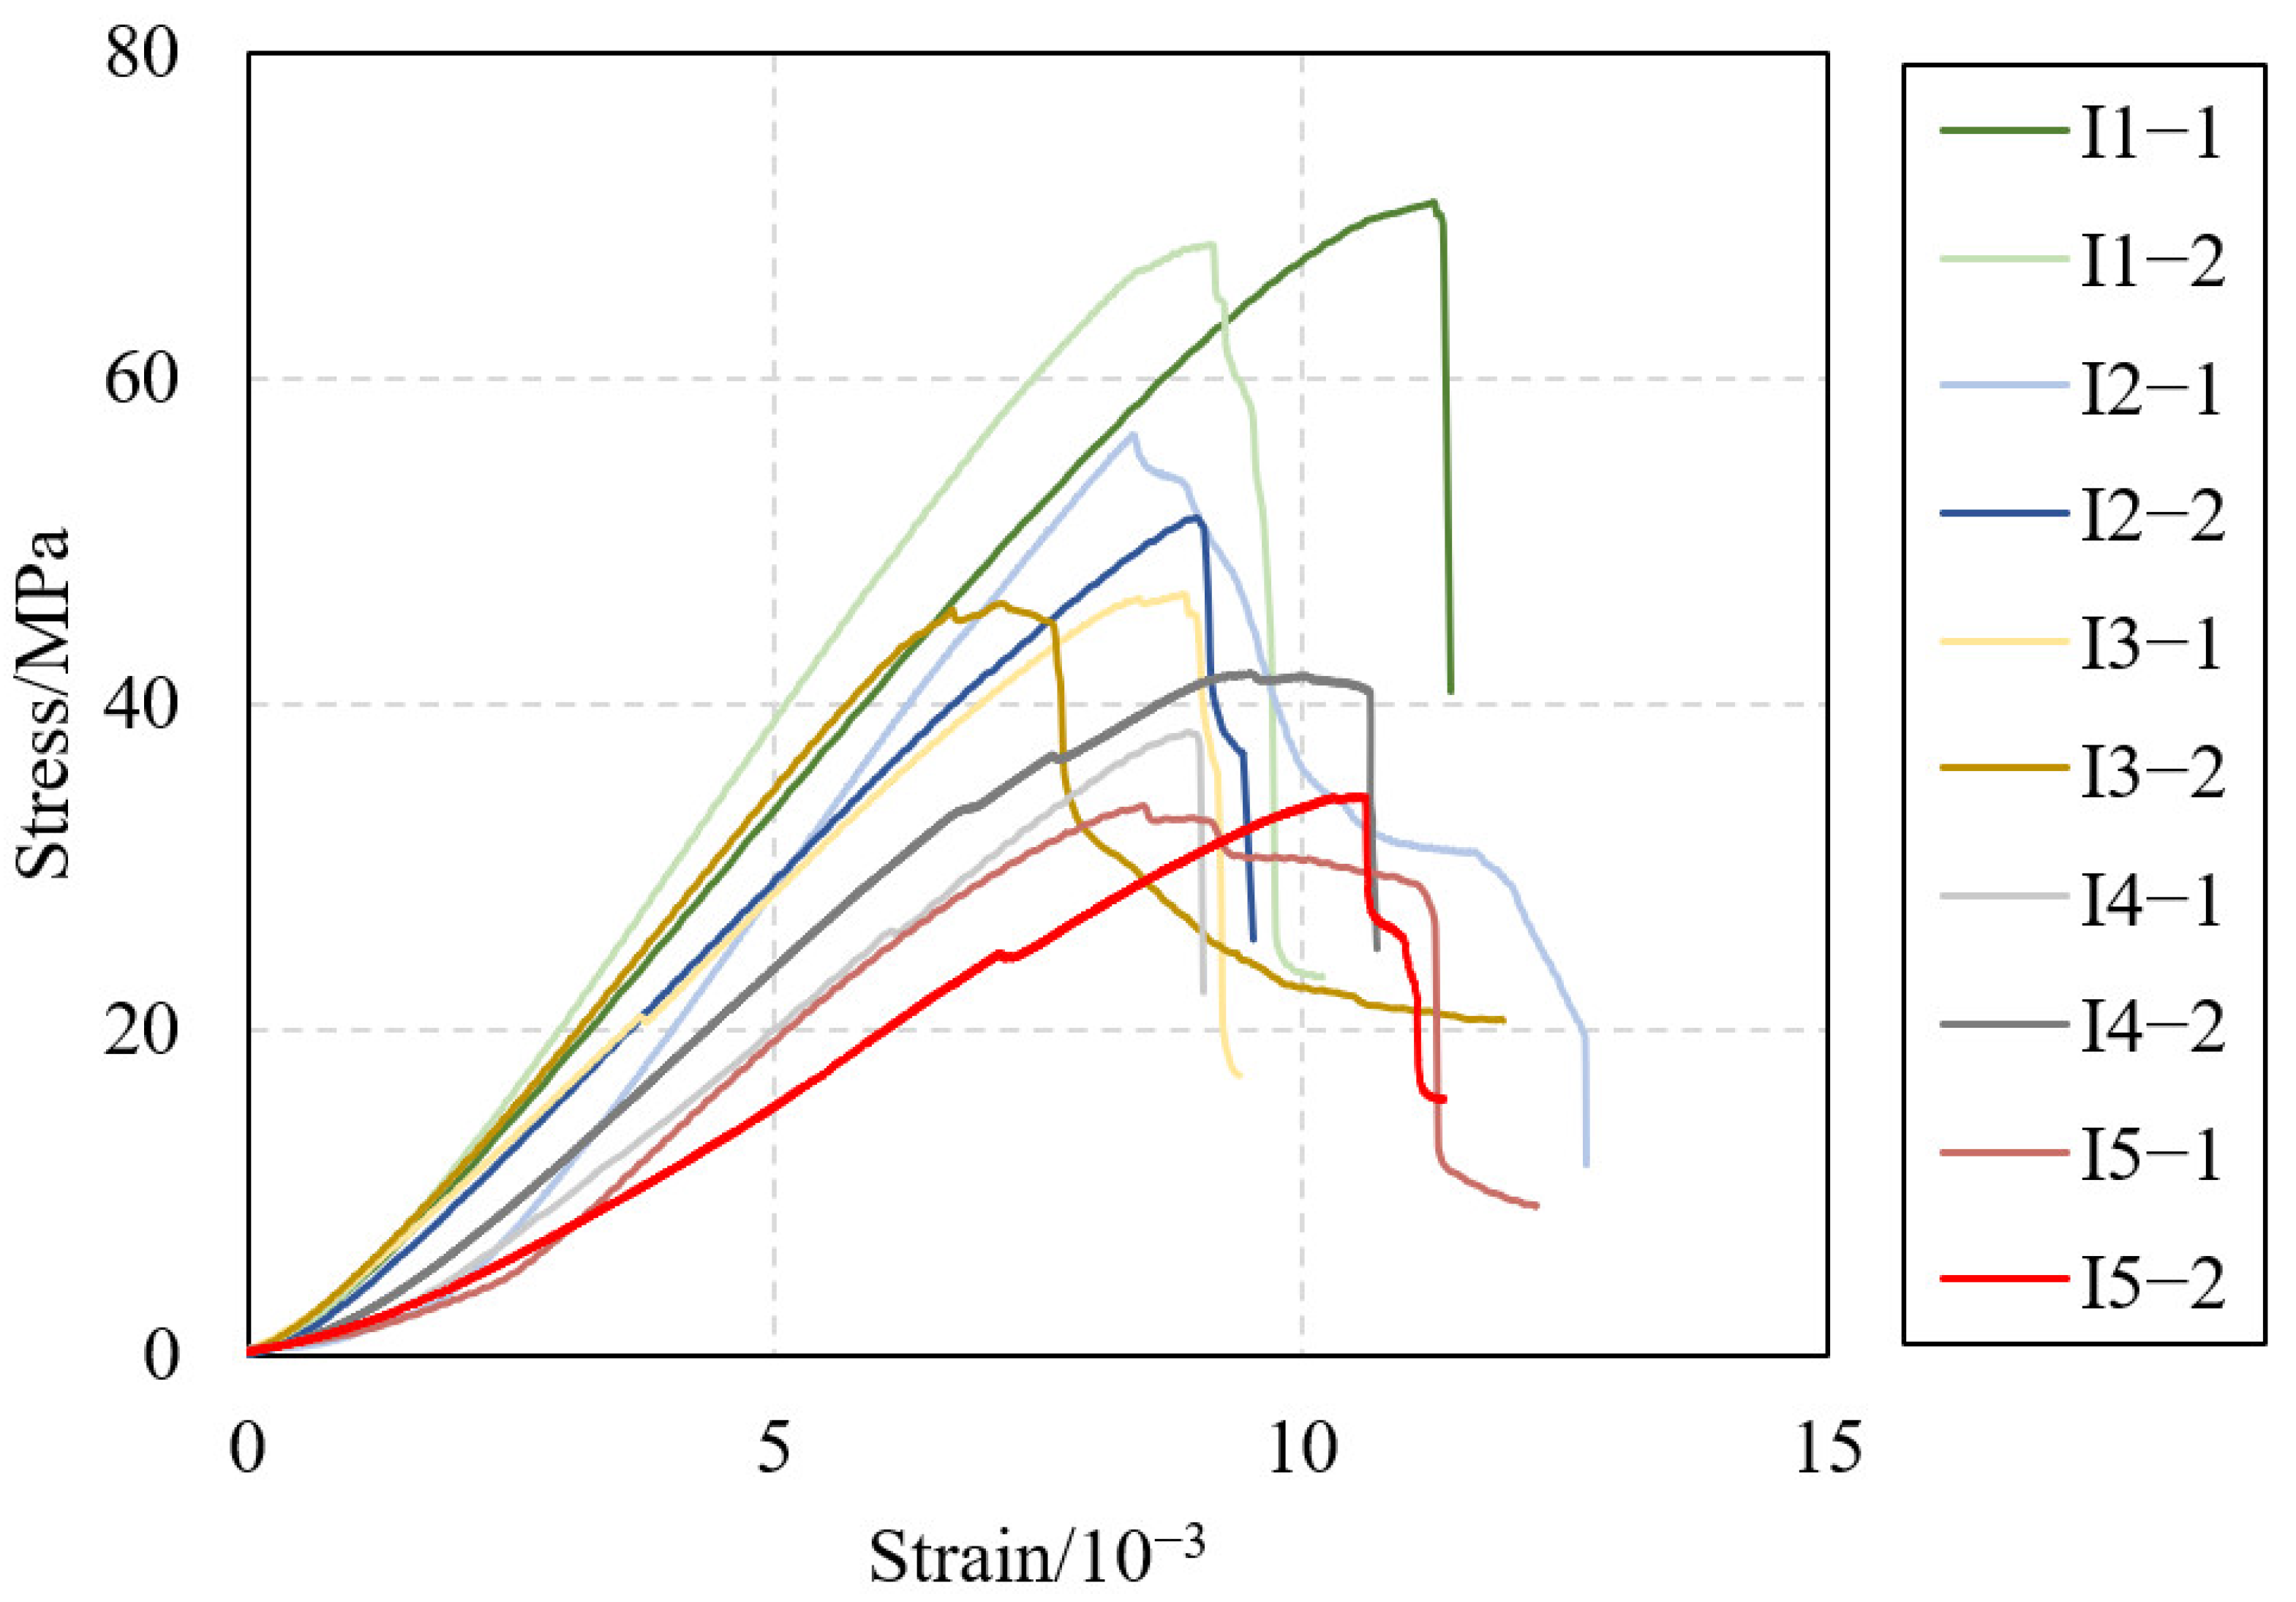
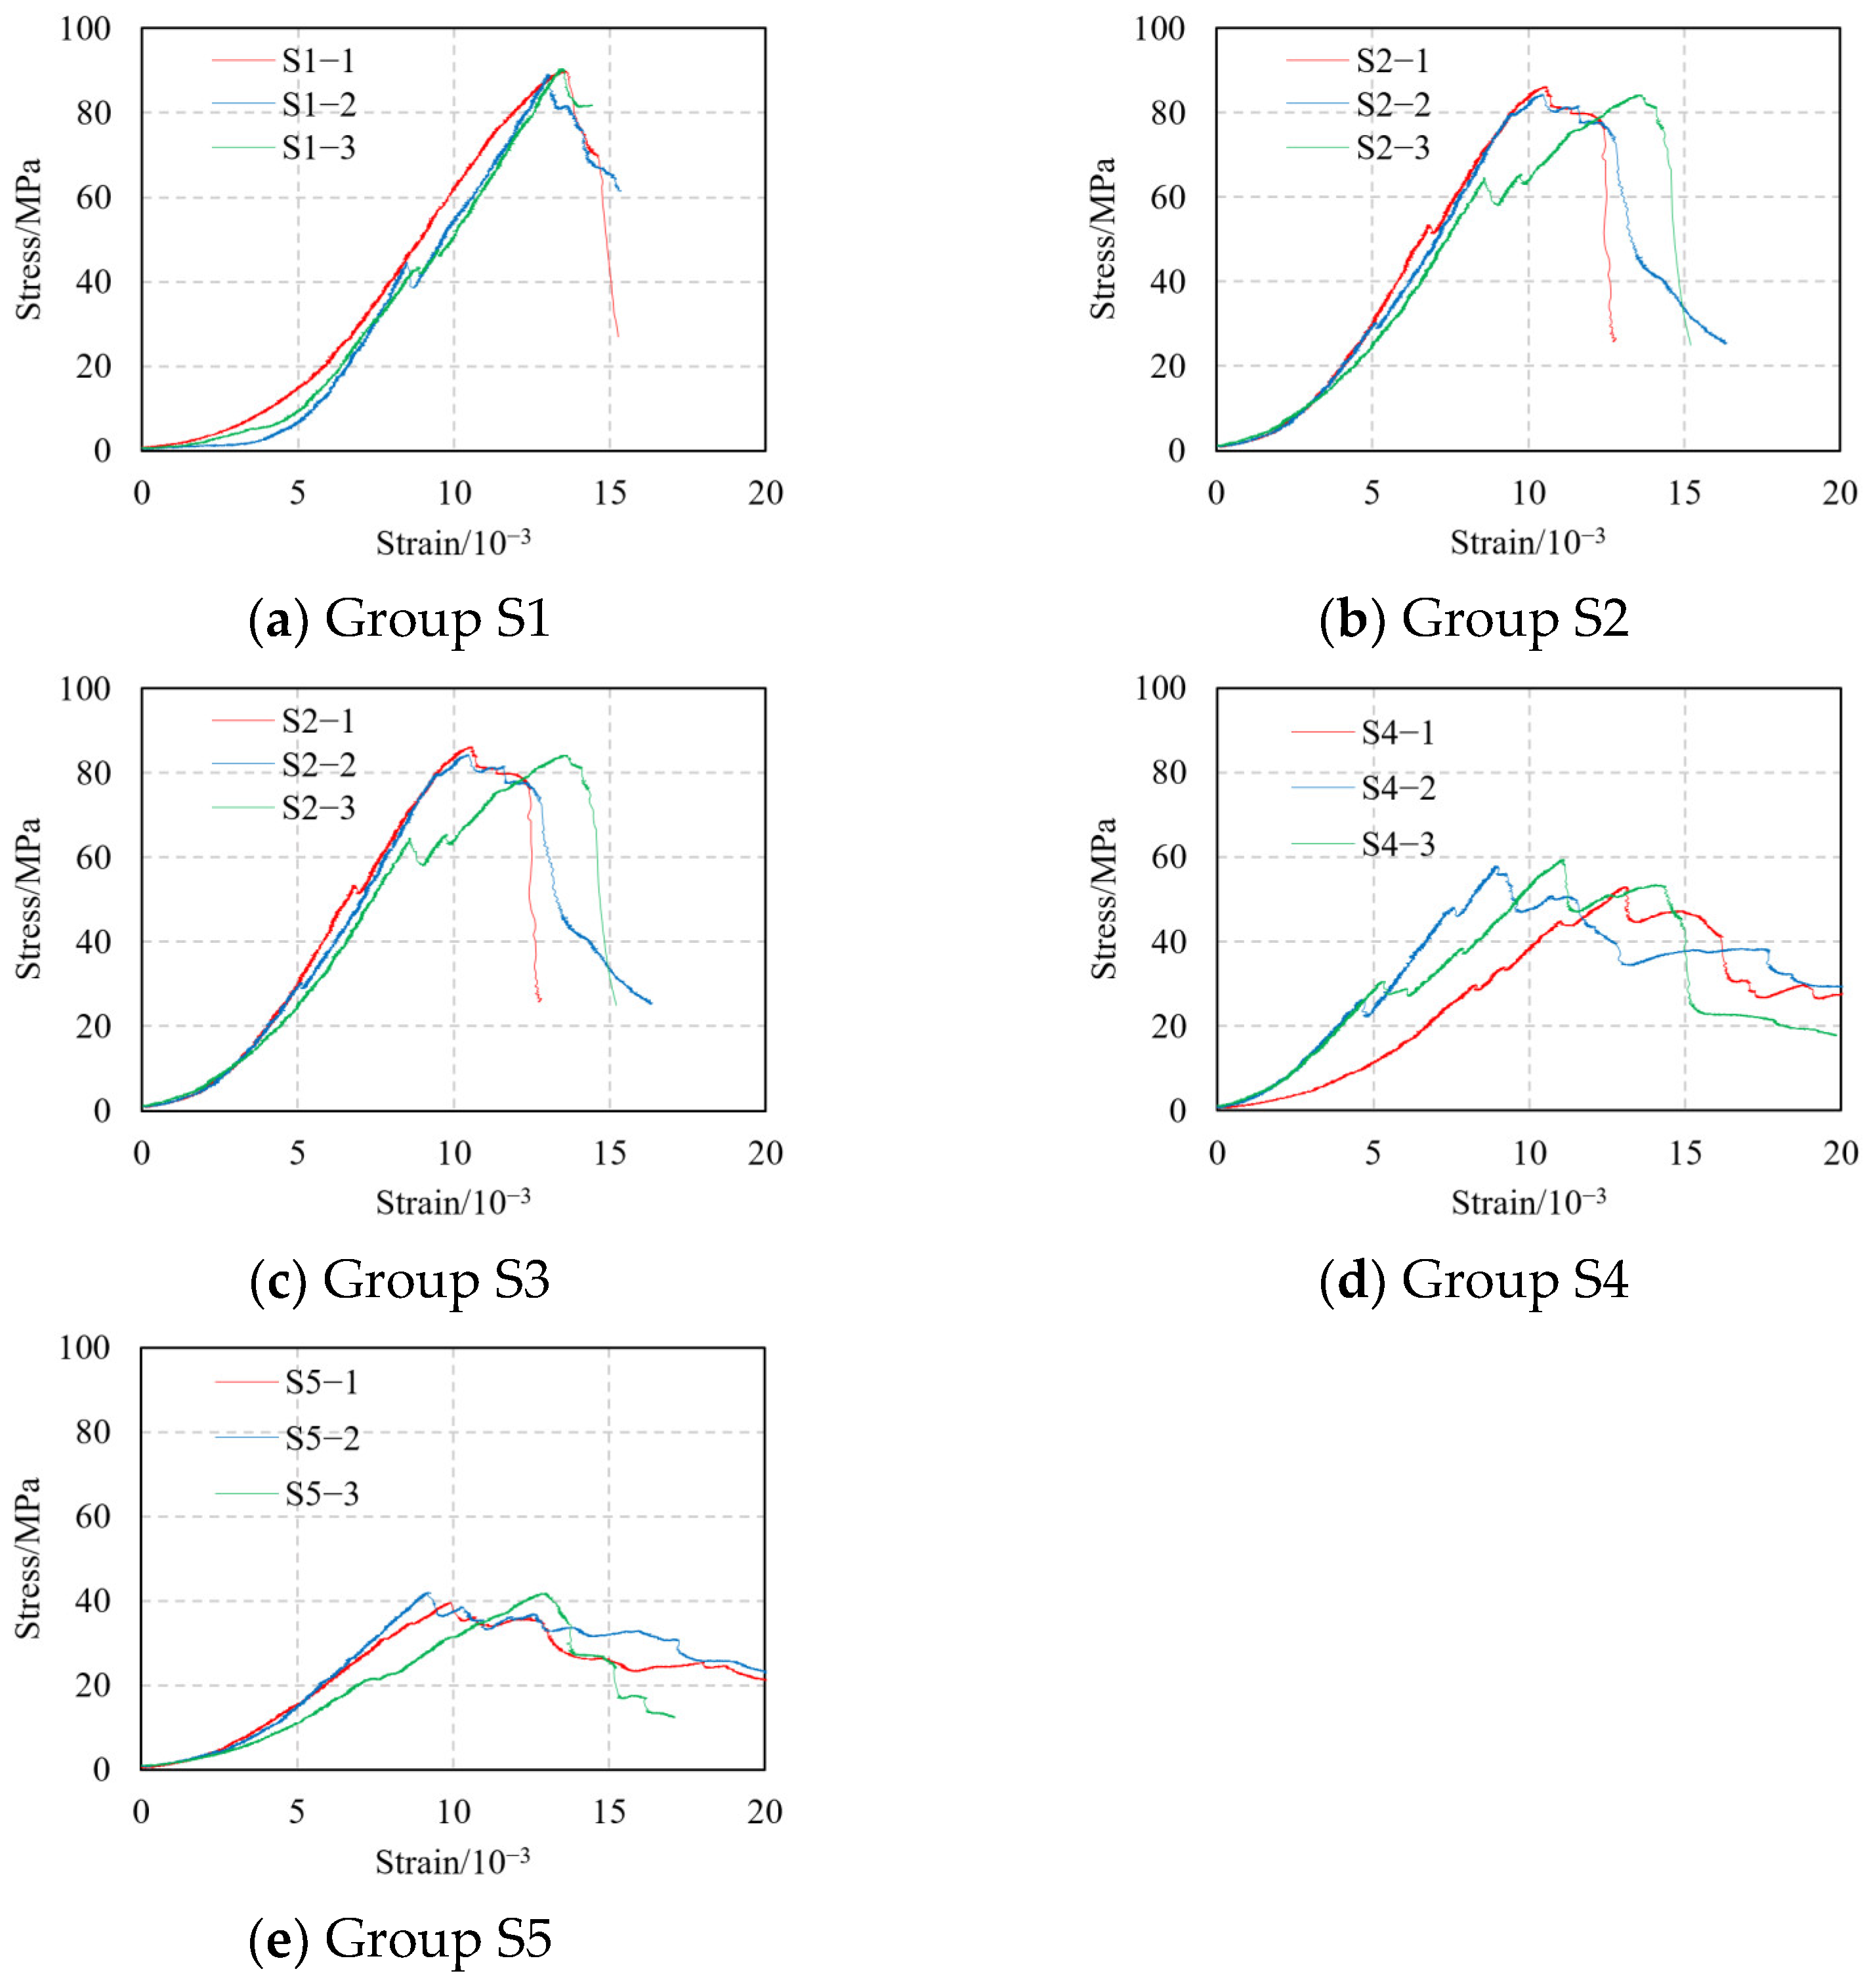
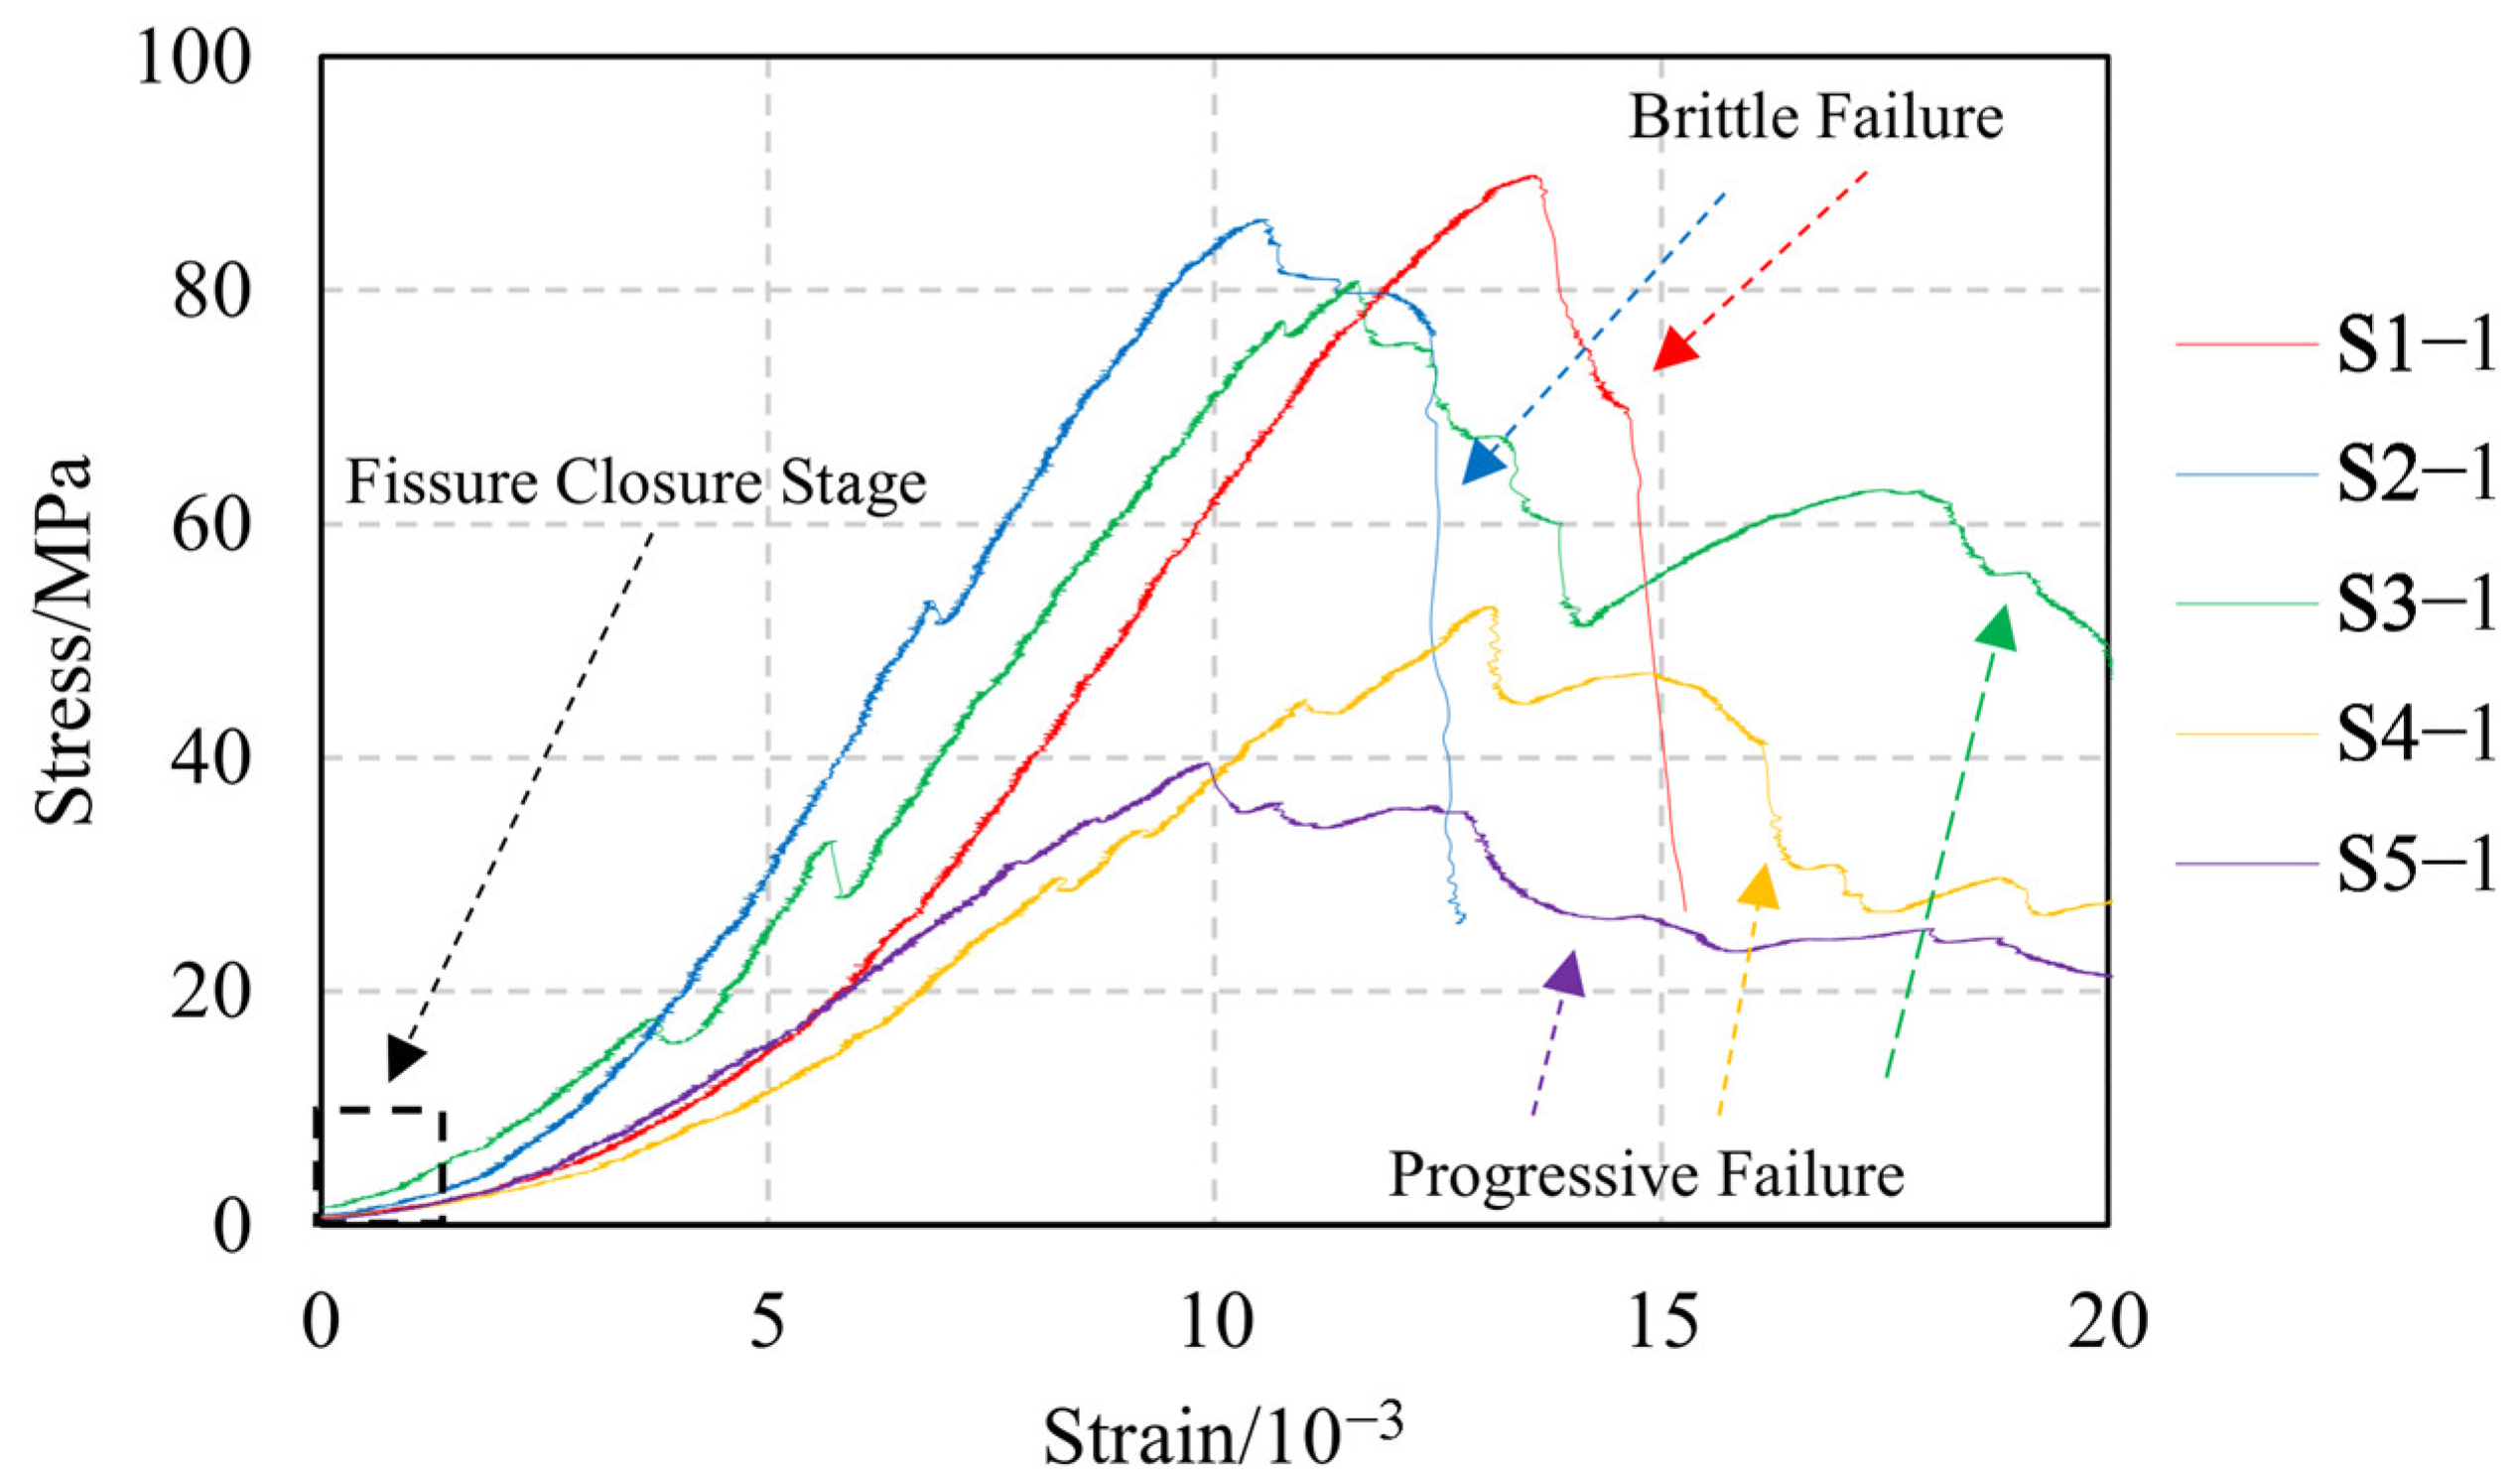
3.1. Axial Stress–Strain Curves
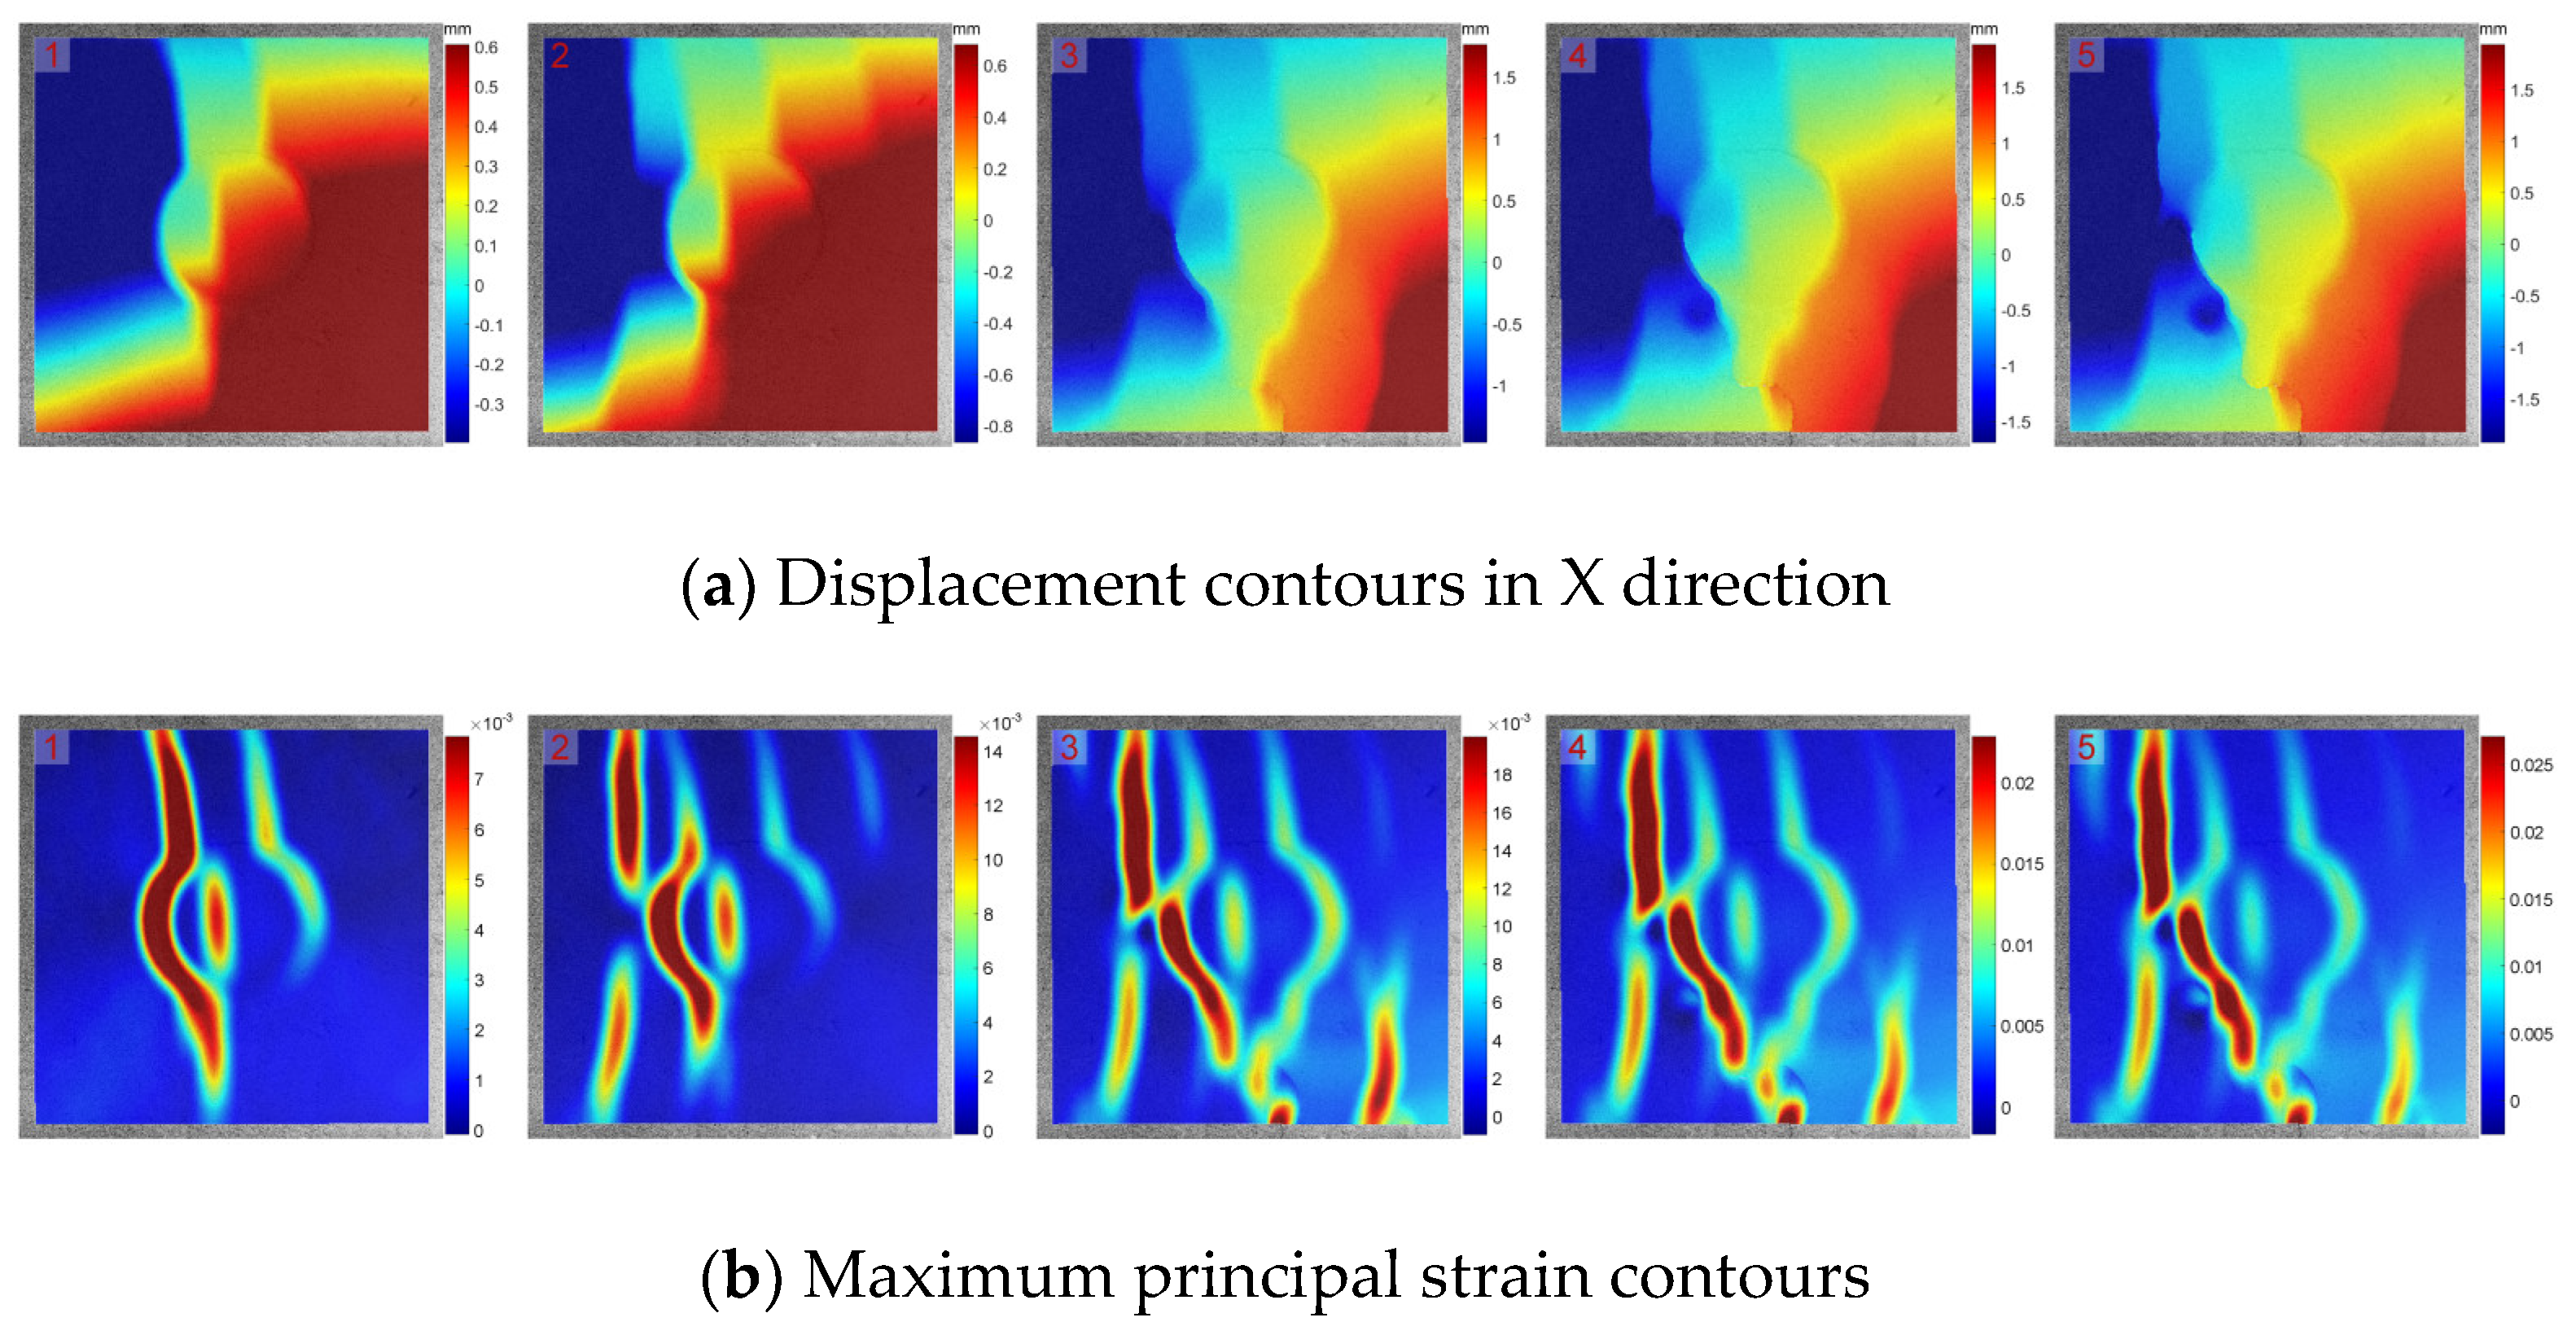
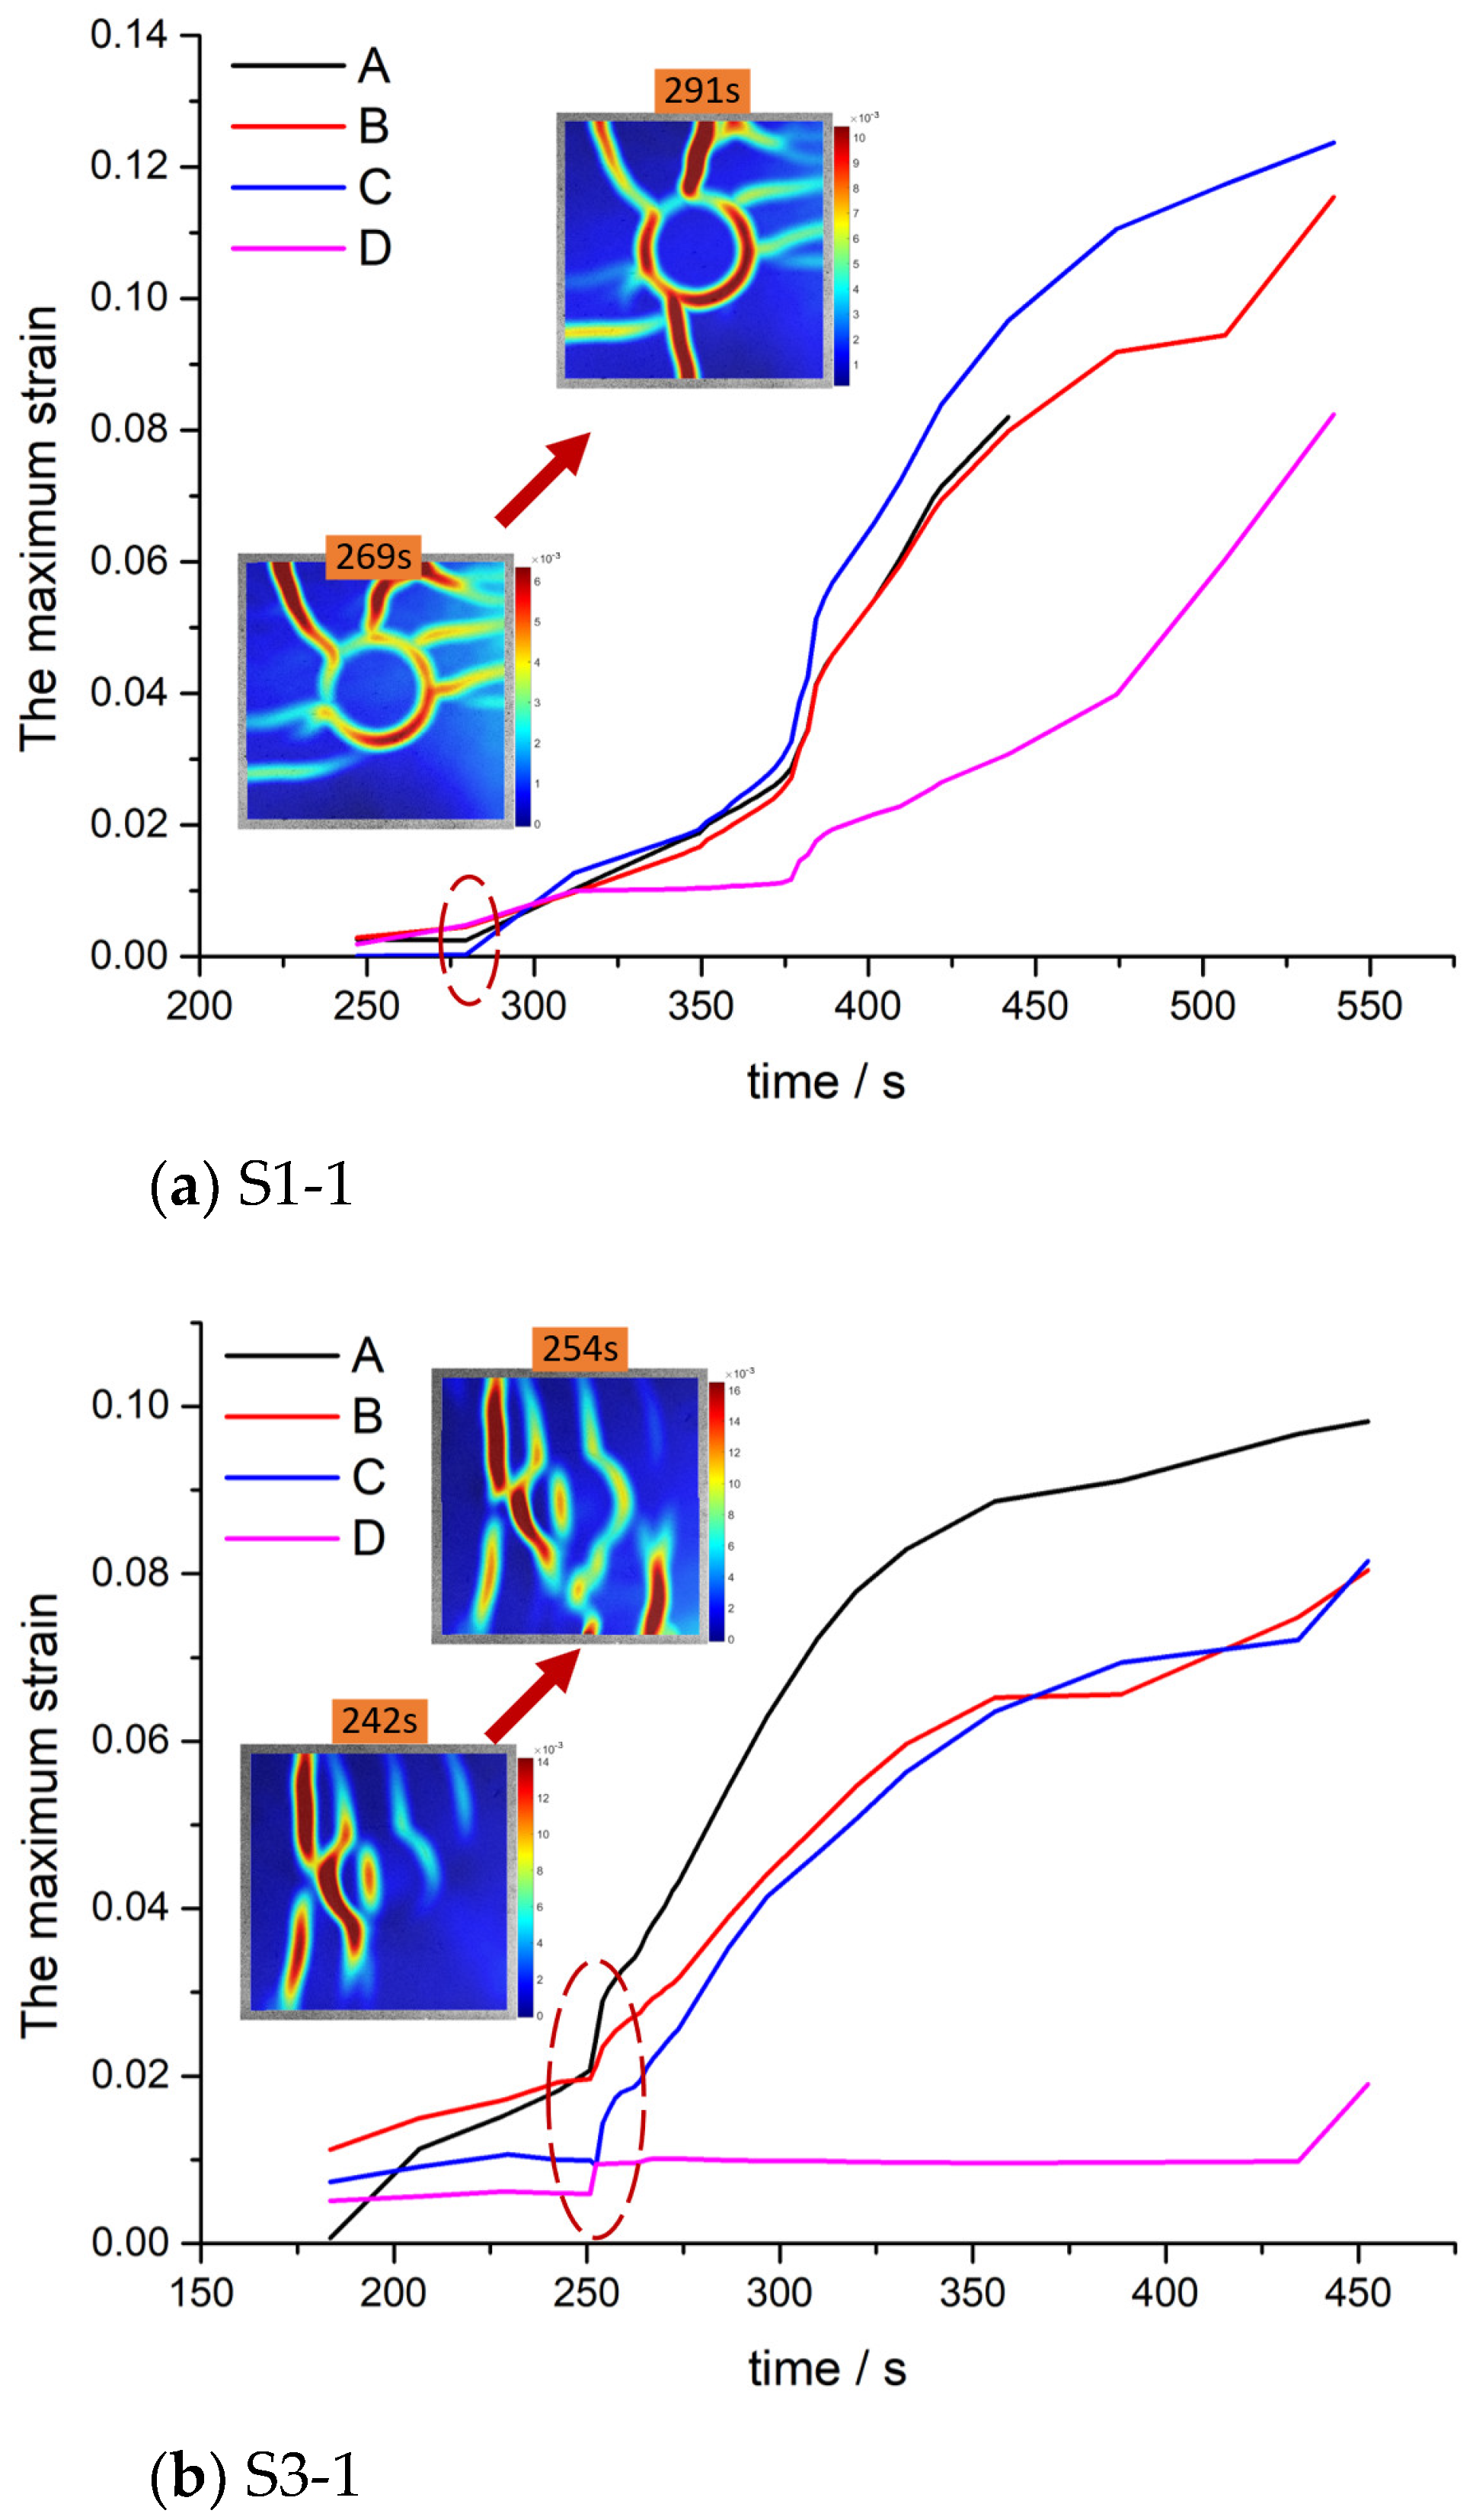
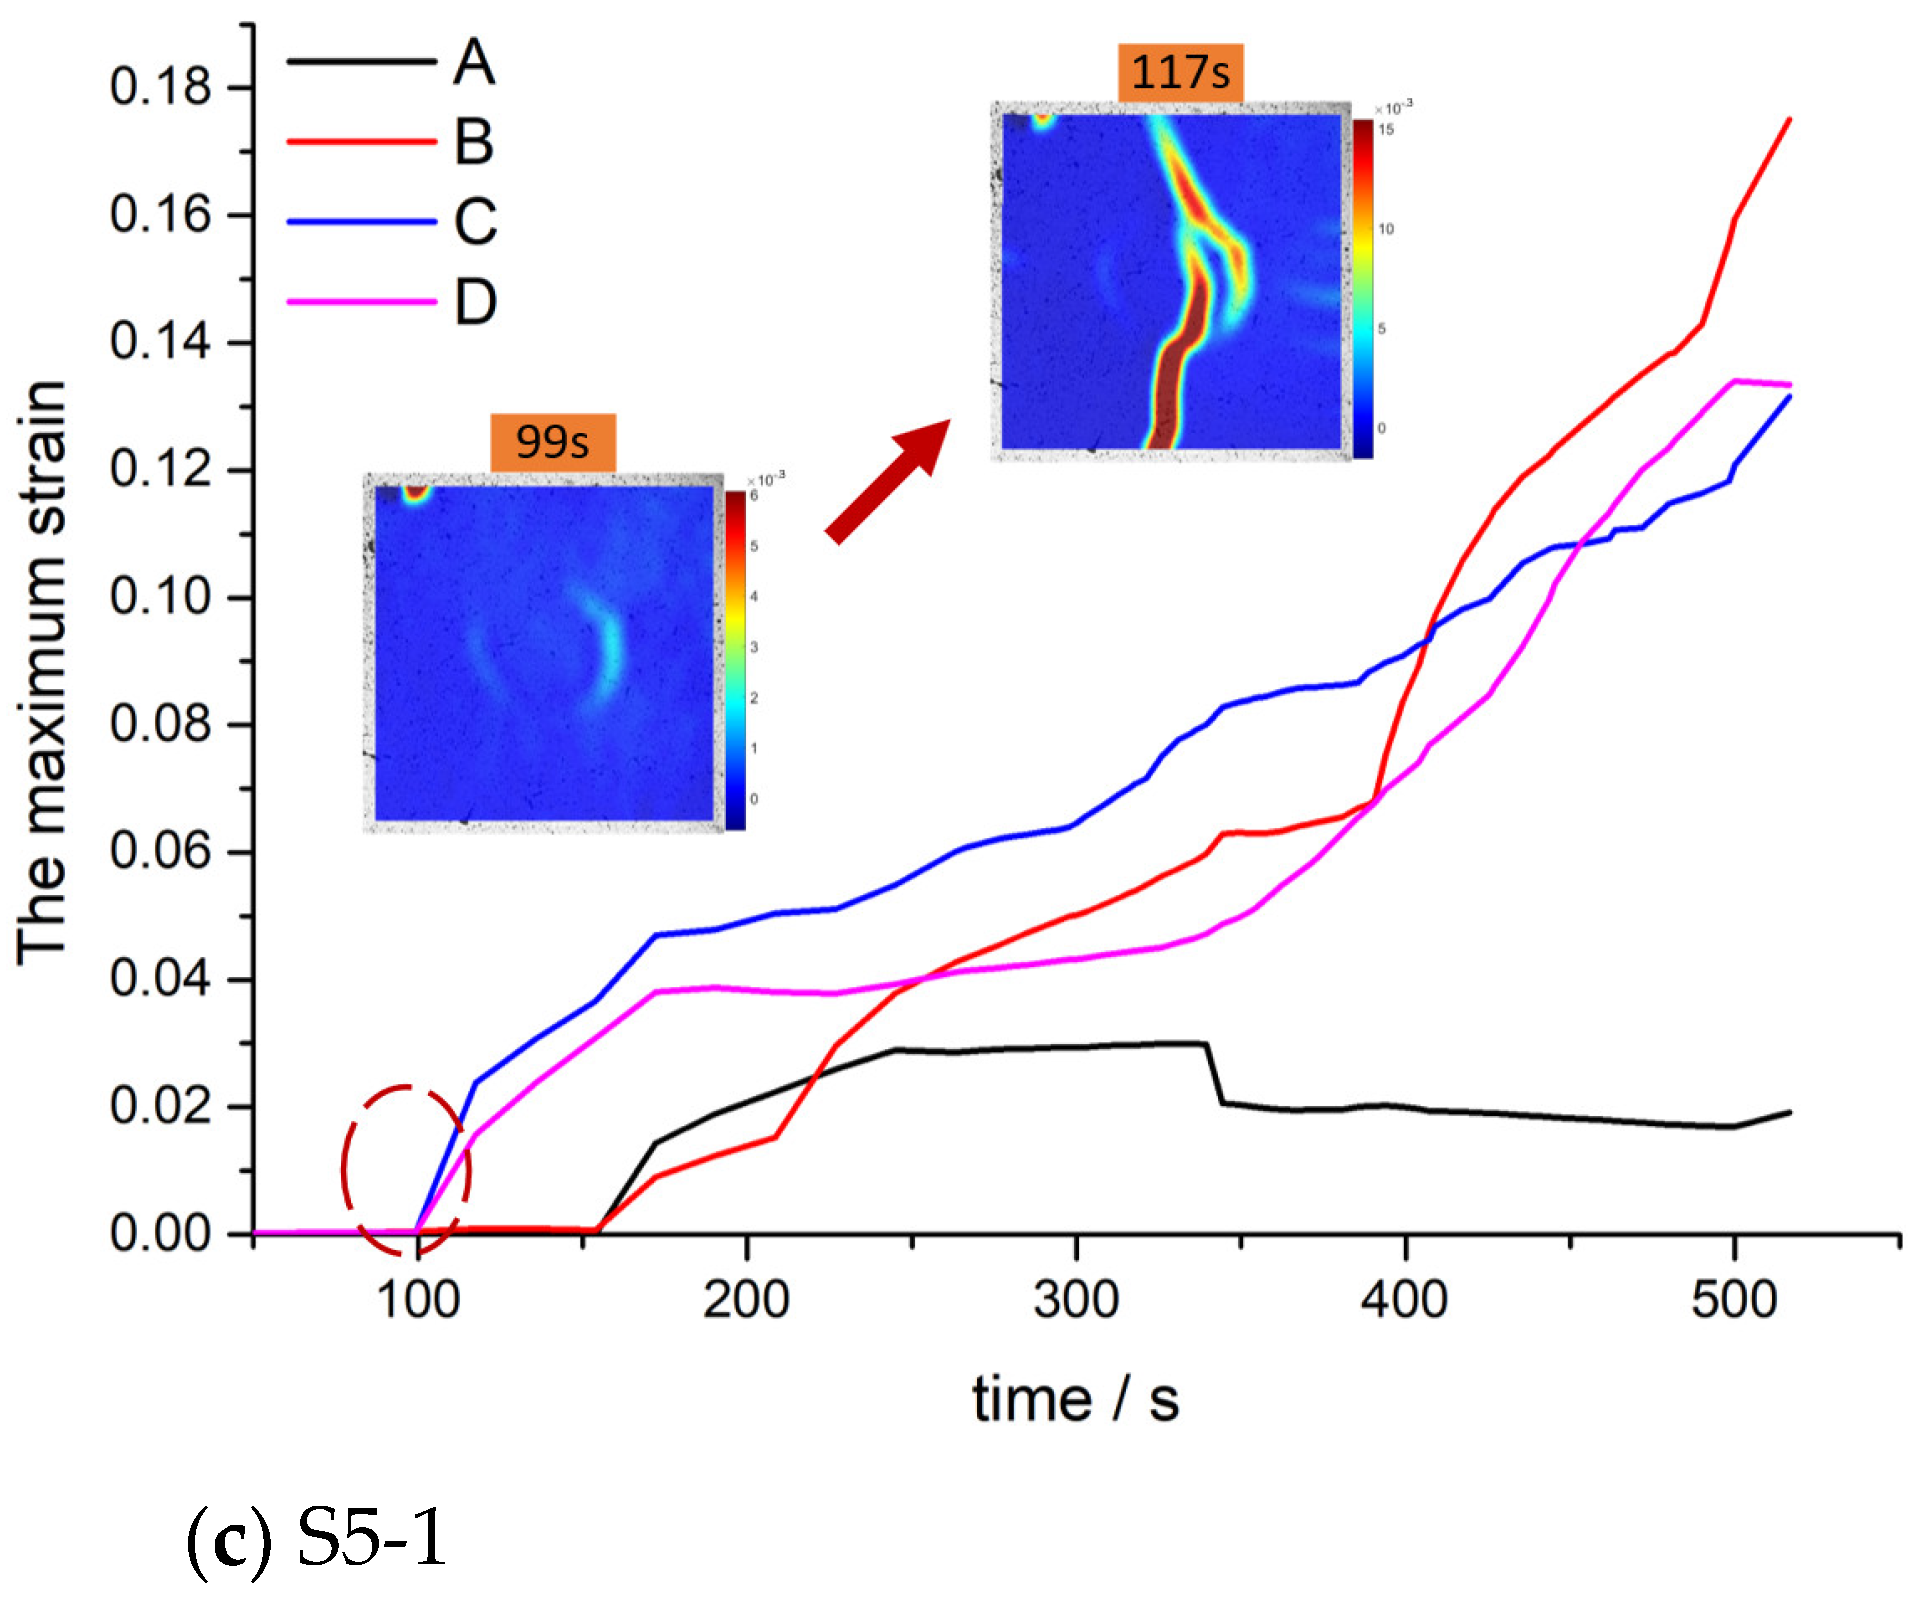
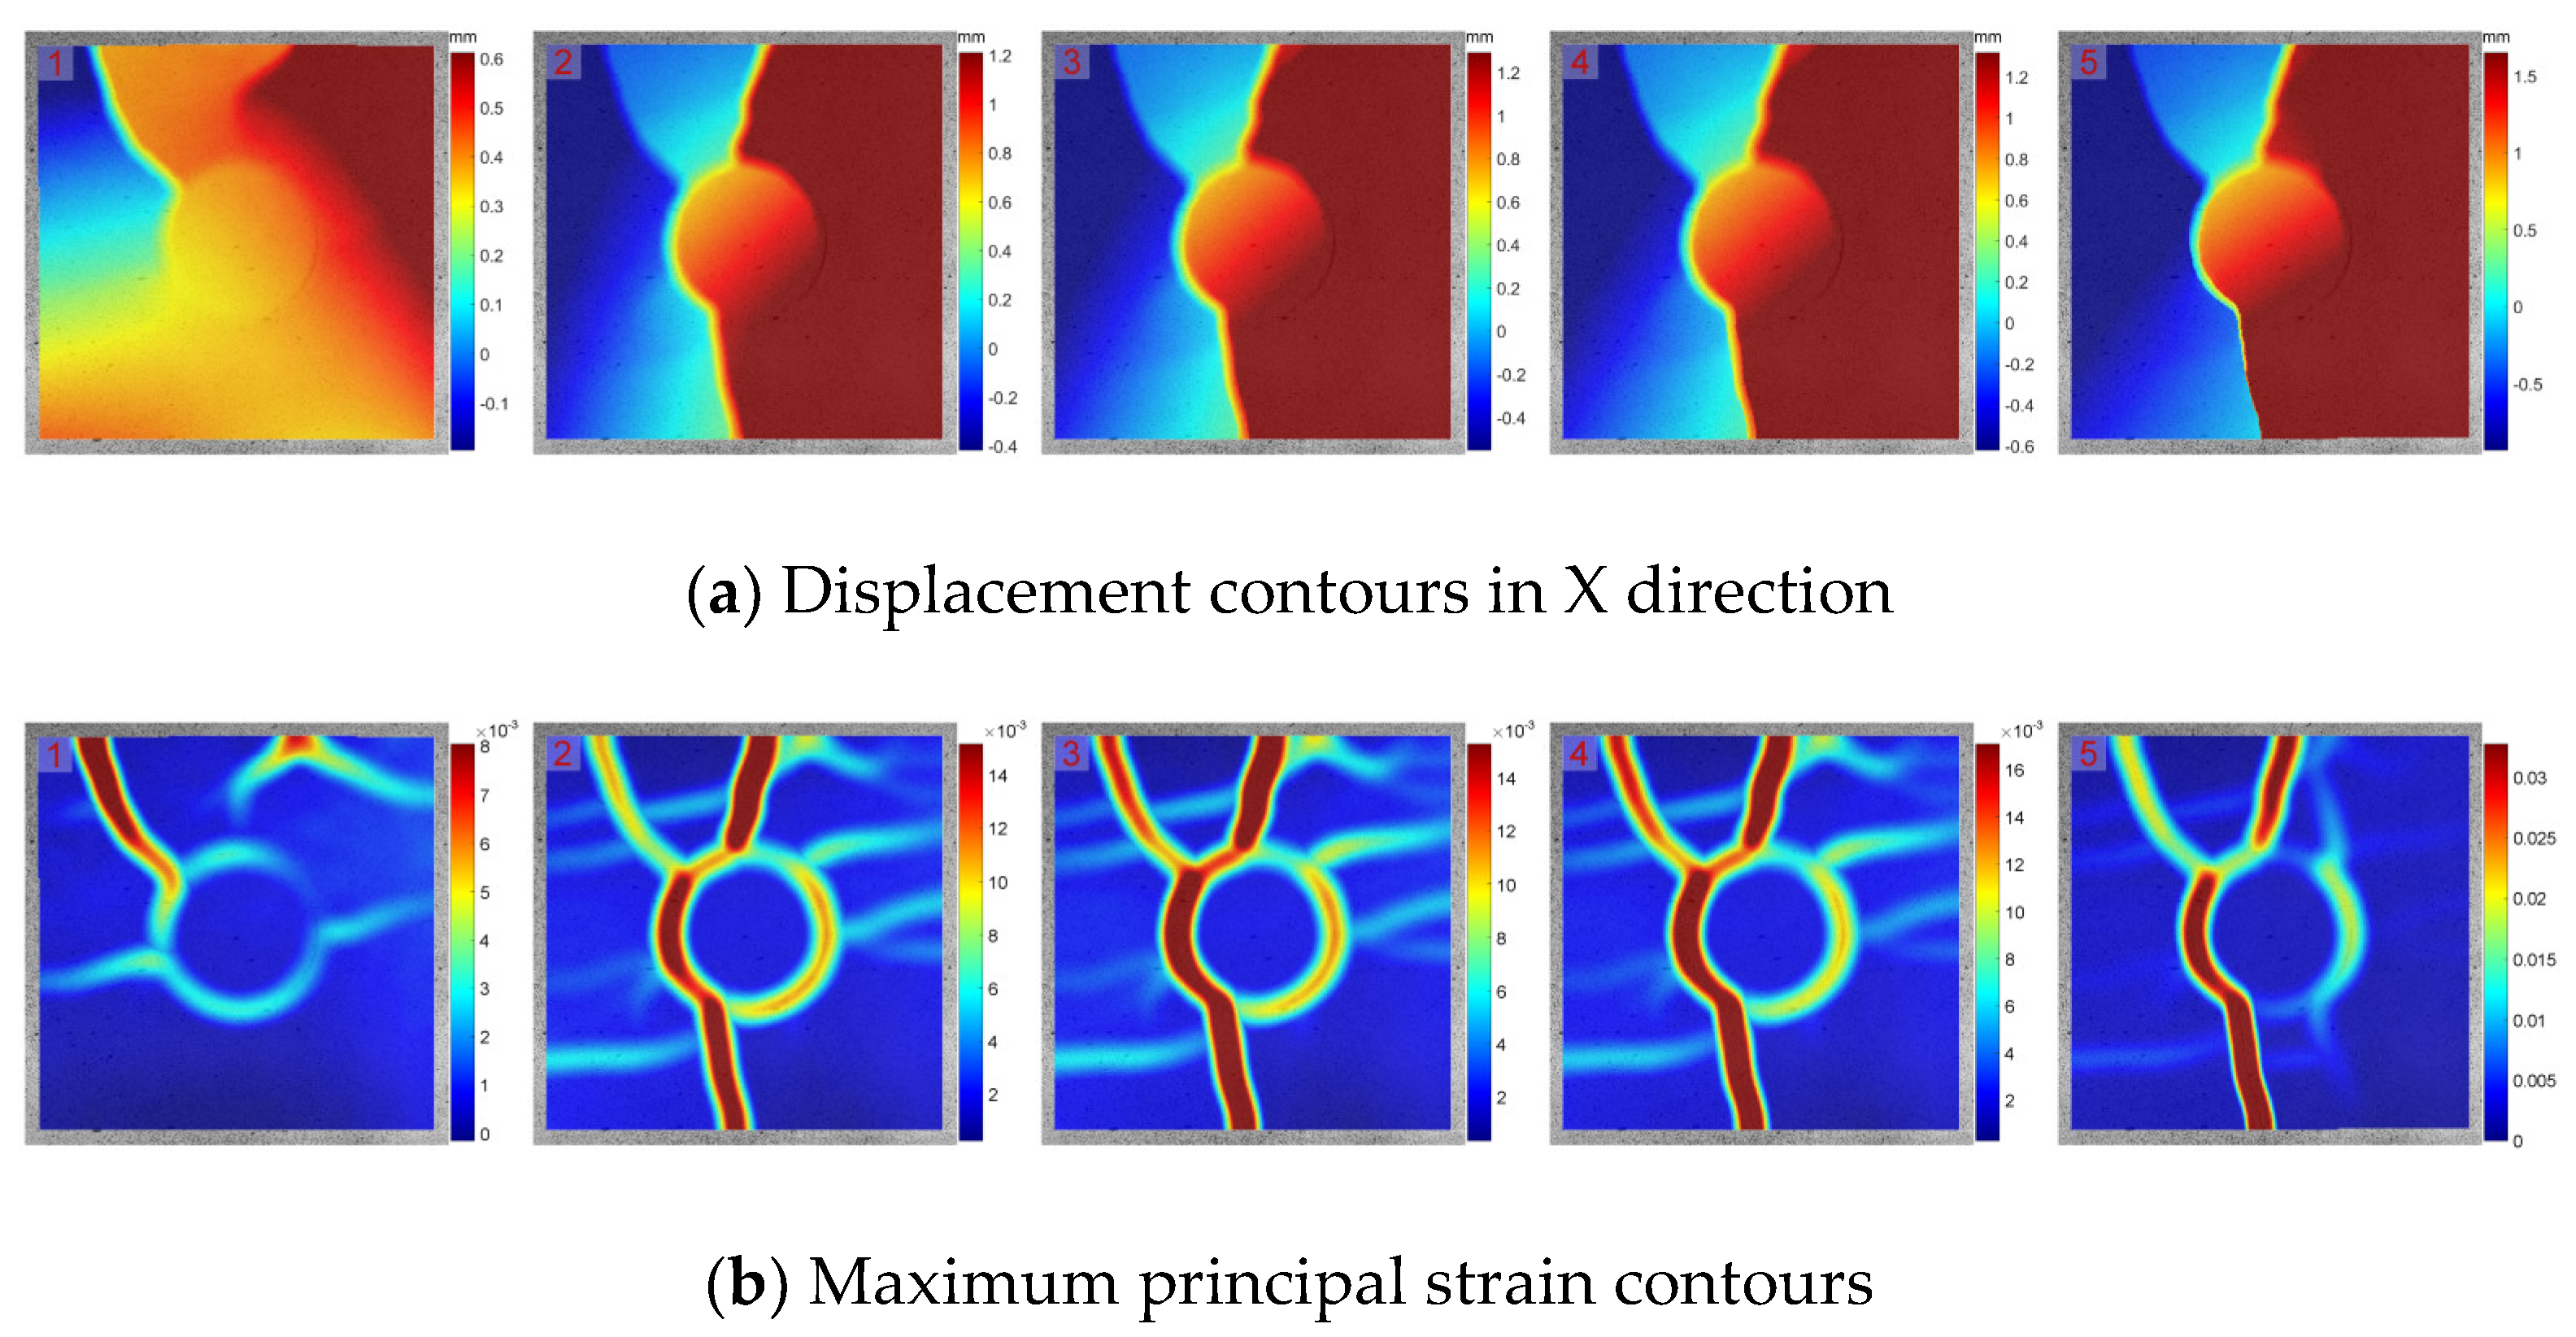
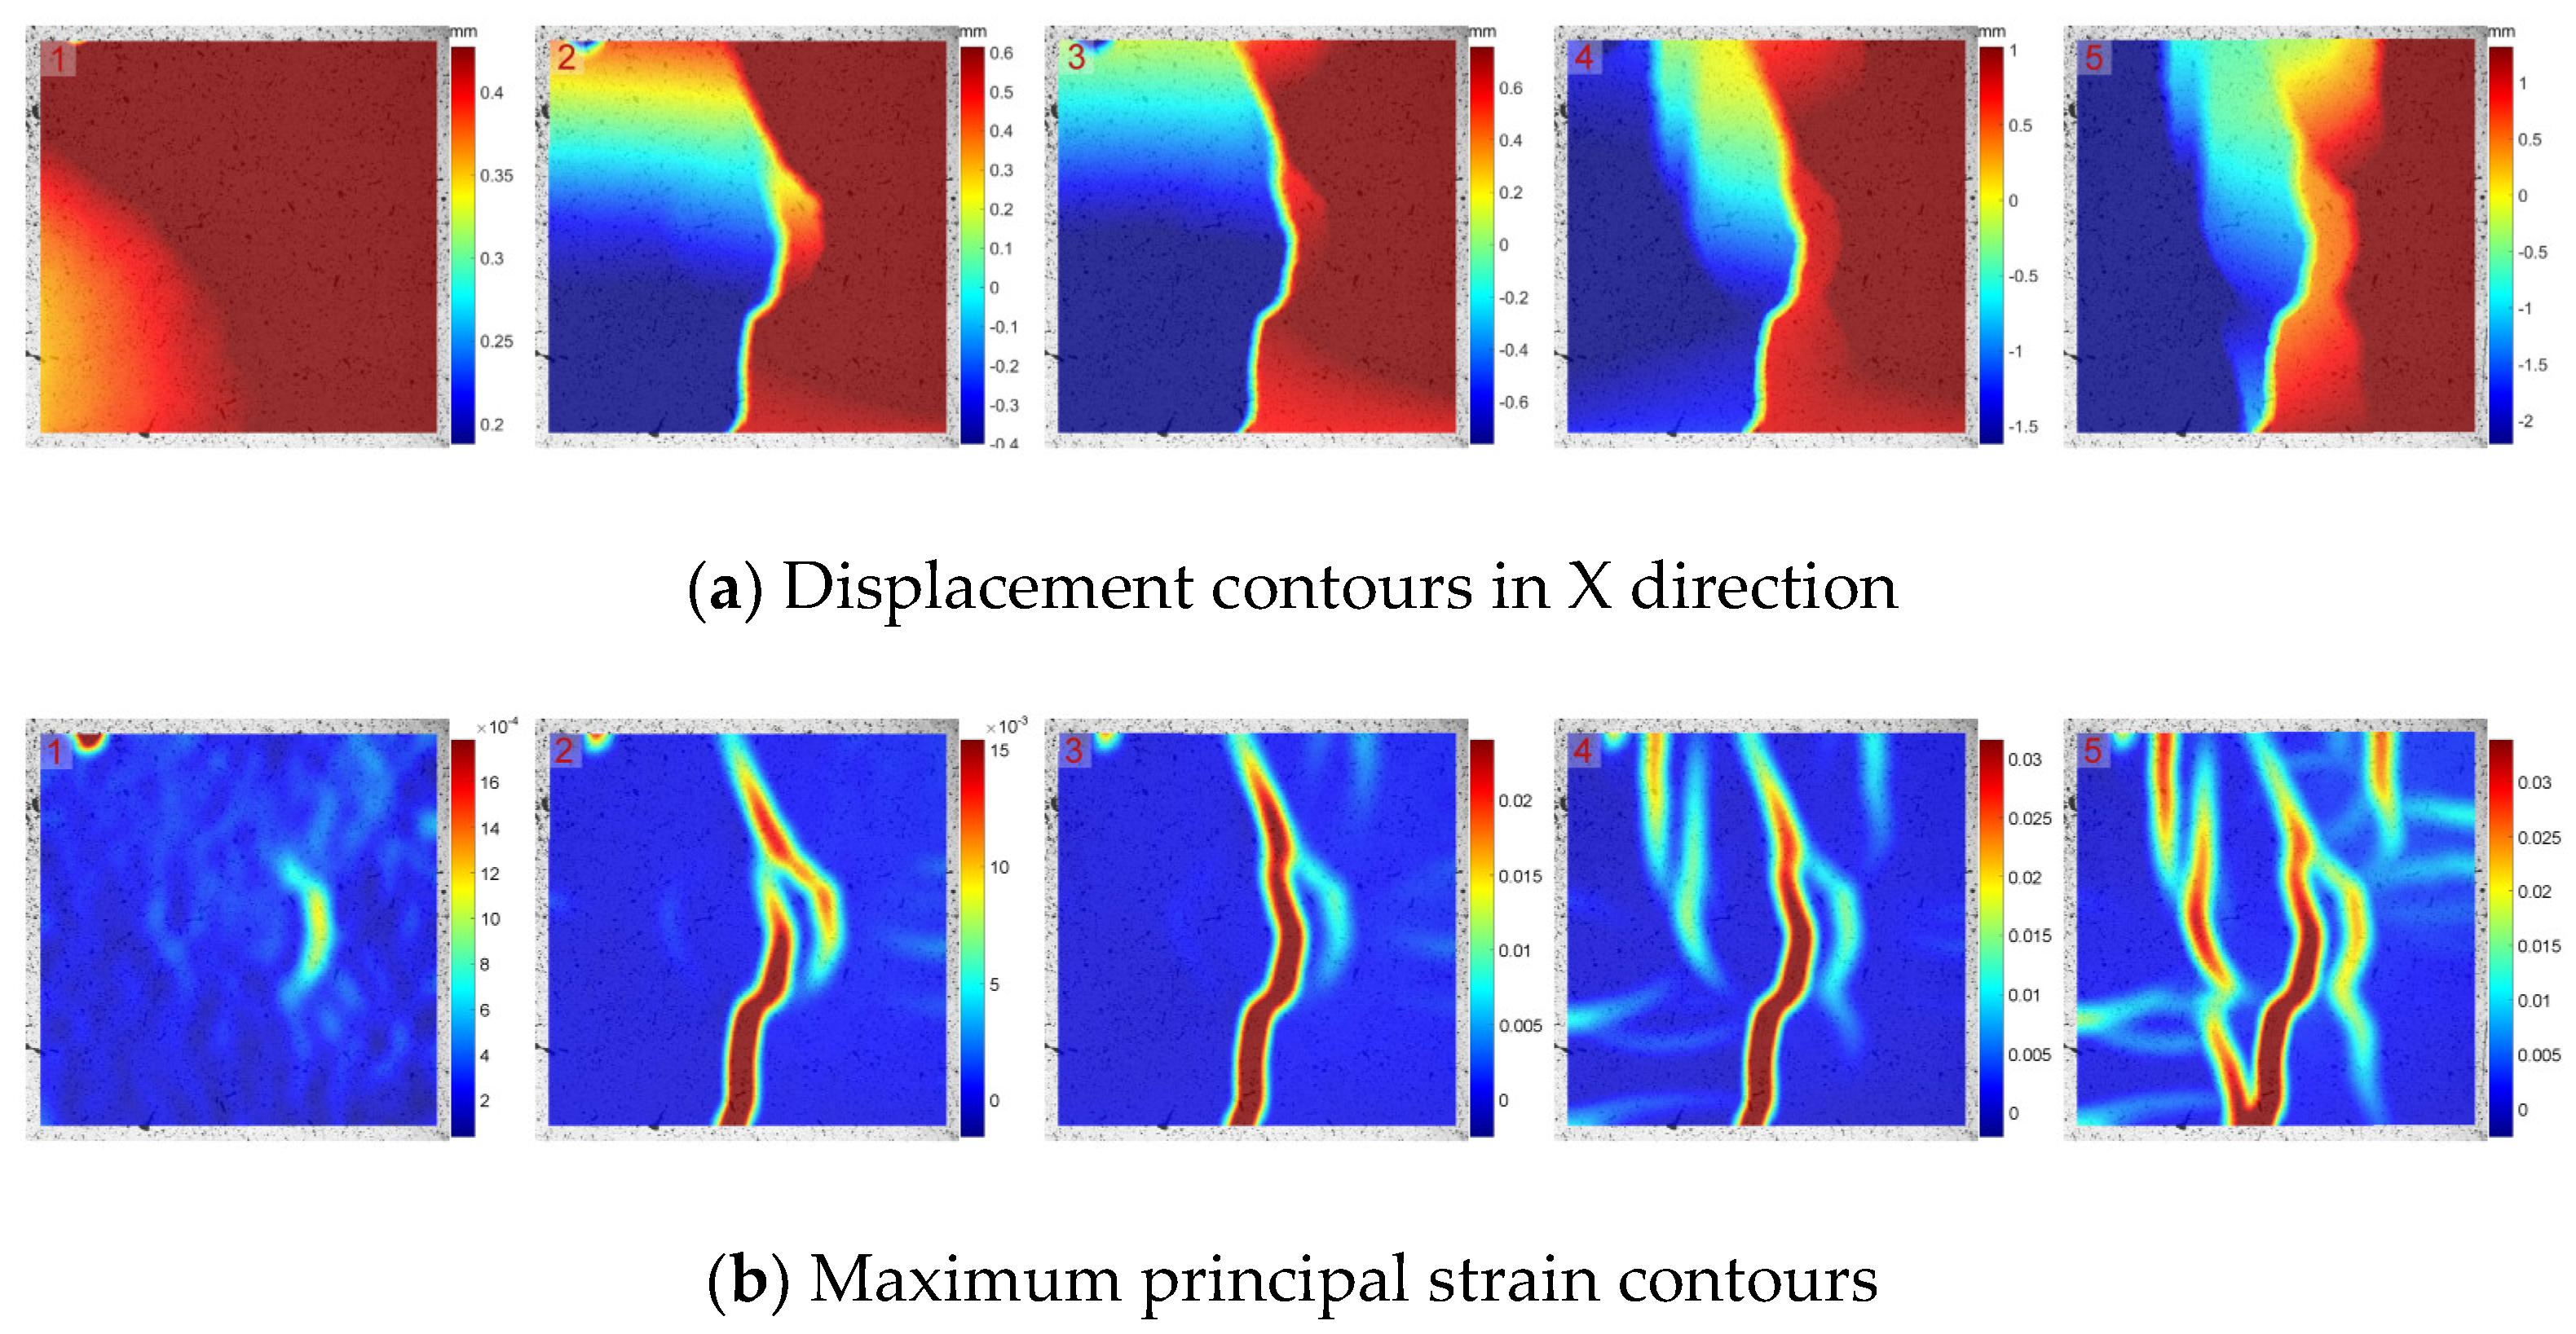
3.2. Cracking Process
3.3. Failure Pattern
4. Discussion
5. Conclusions
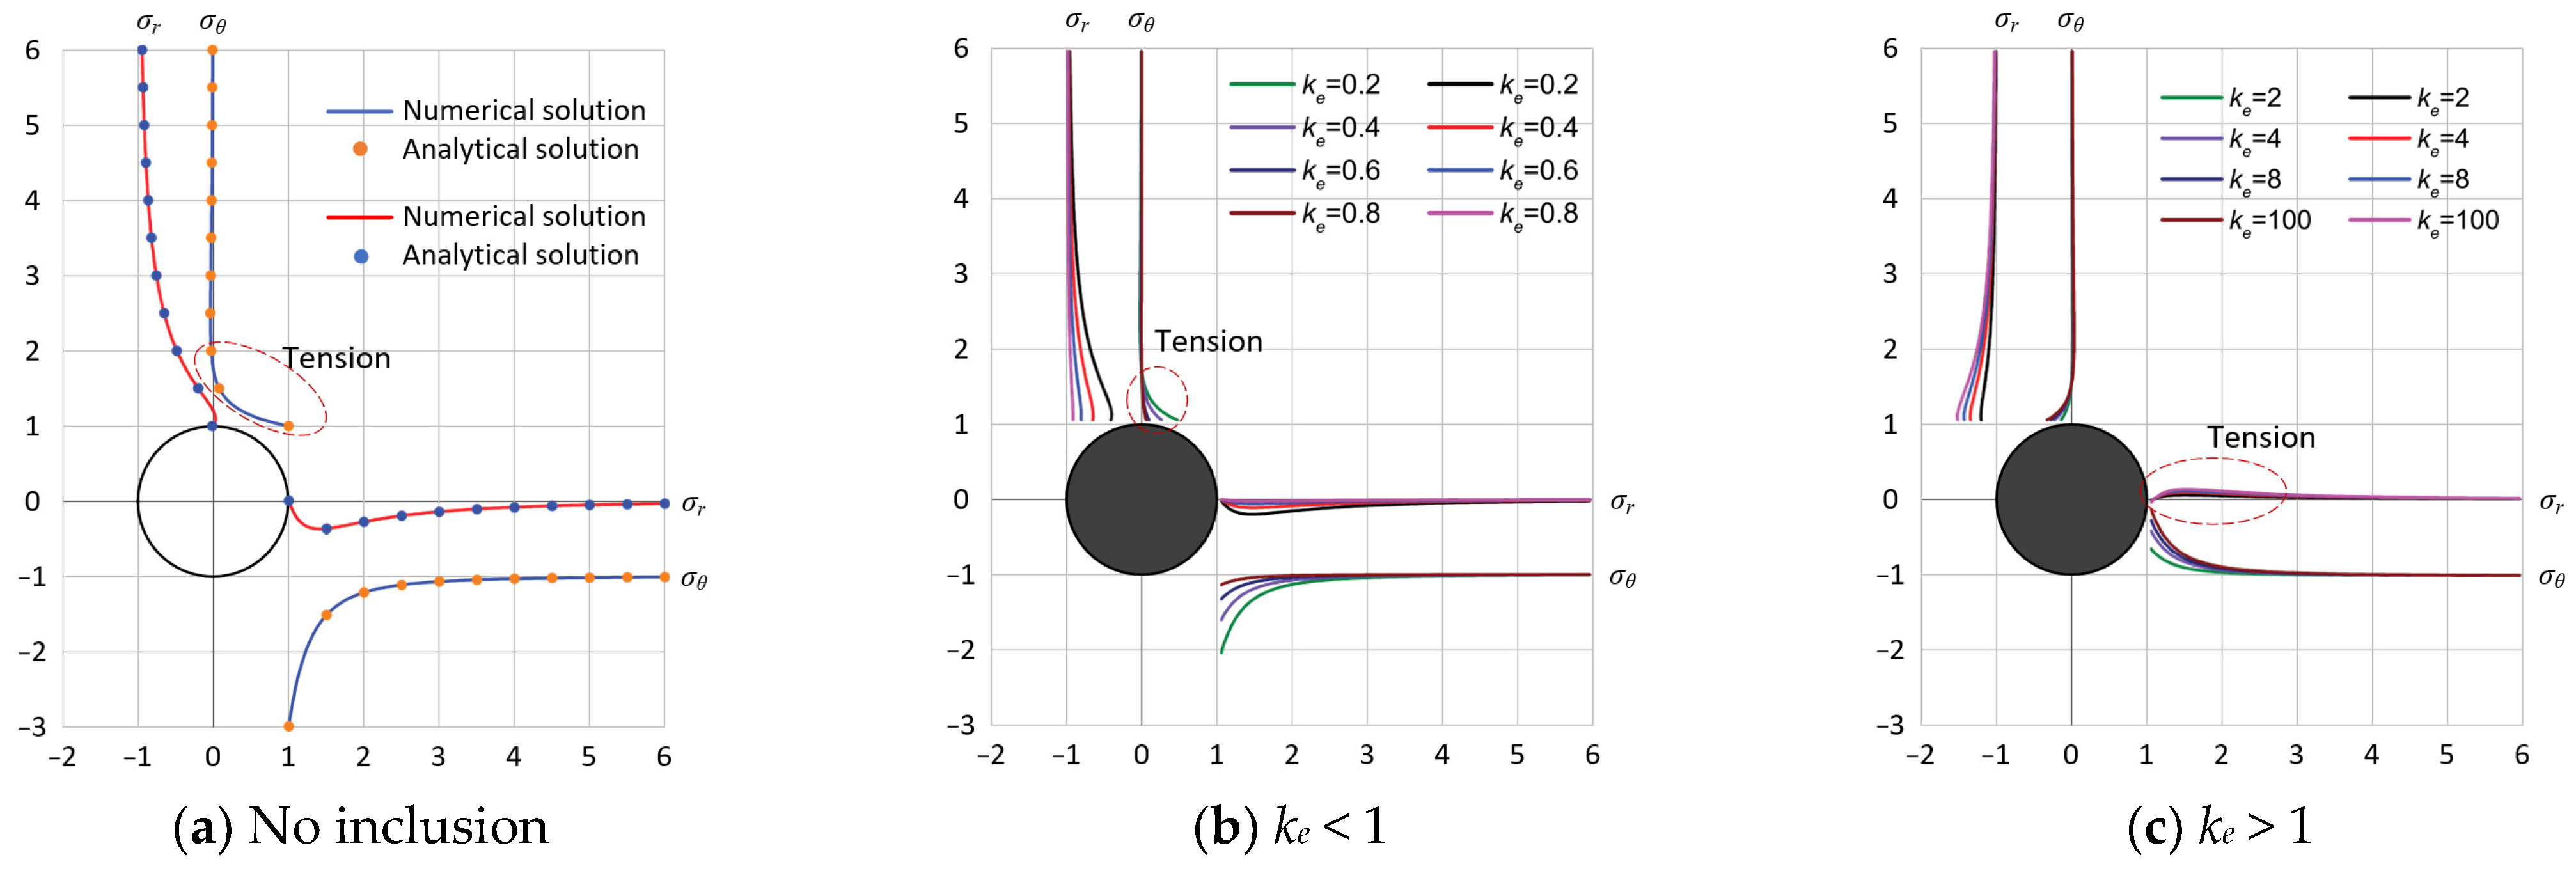
- The existence of inclusions can significantly improve the stress concentration around the opening and increase the strength of the mortar sample. However, this improvement in overall strength is not very obvious when the inclusion is stronger than the external material.
- The inclusion has a significant influence on the fracture pattern of the sample. When the inclusion is weaker than the external material, the inside of the inclusion will undergo penetrated tensile failure along the loading direction. The failure mode of the external part is similar to the samples without an inclusion. The top and the bottom of the opening are characterized by tensile failure, but the splitting failure around the left boundary of the opening is not apparent due to the restraint effect of the inclusion. The debonding failure along the interface is not conspicuous either. When the mechanical properties of the inclusion are consistent with the external material, the debonding failure can be found. Under the influence of the interface, the presence of failure within the inclusion is unlikely to lead to contiguous deformation or a pronounced failure that extends through to the external material.
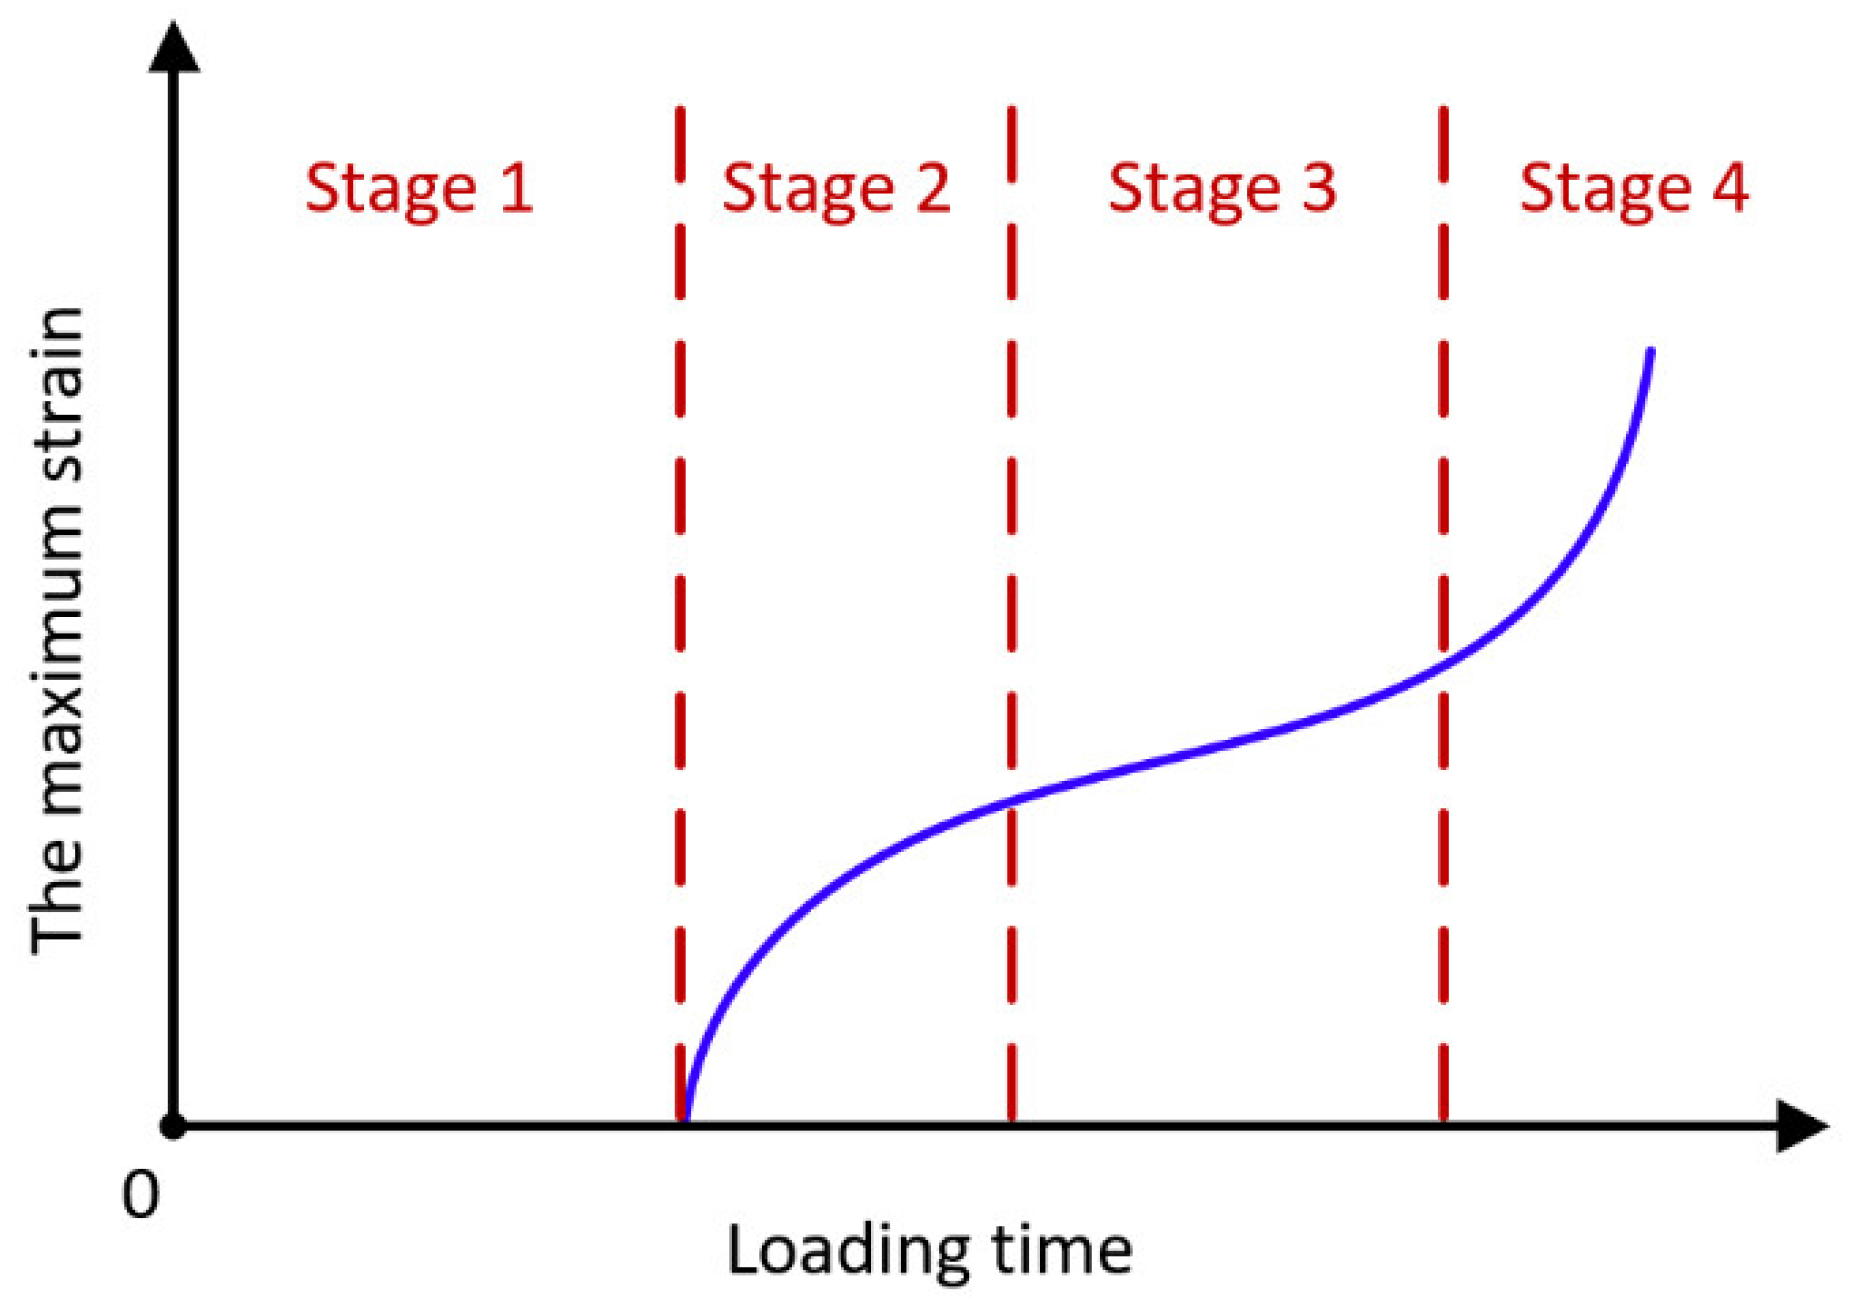
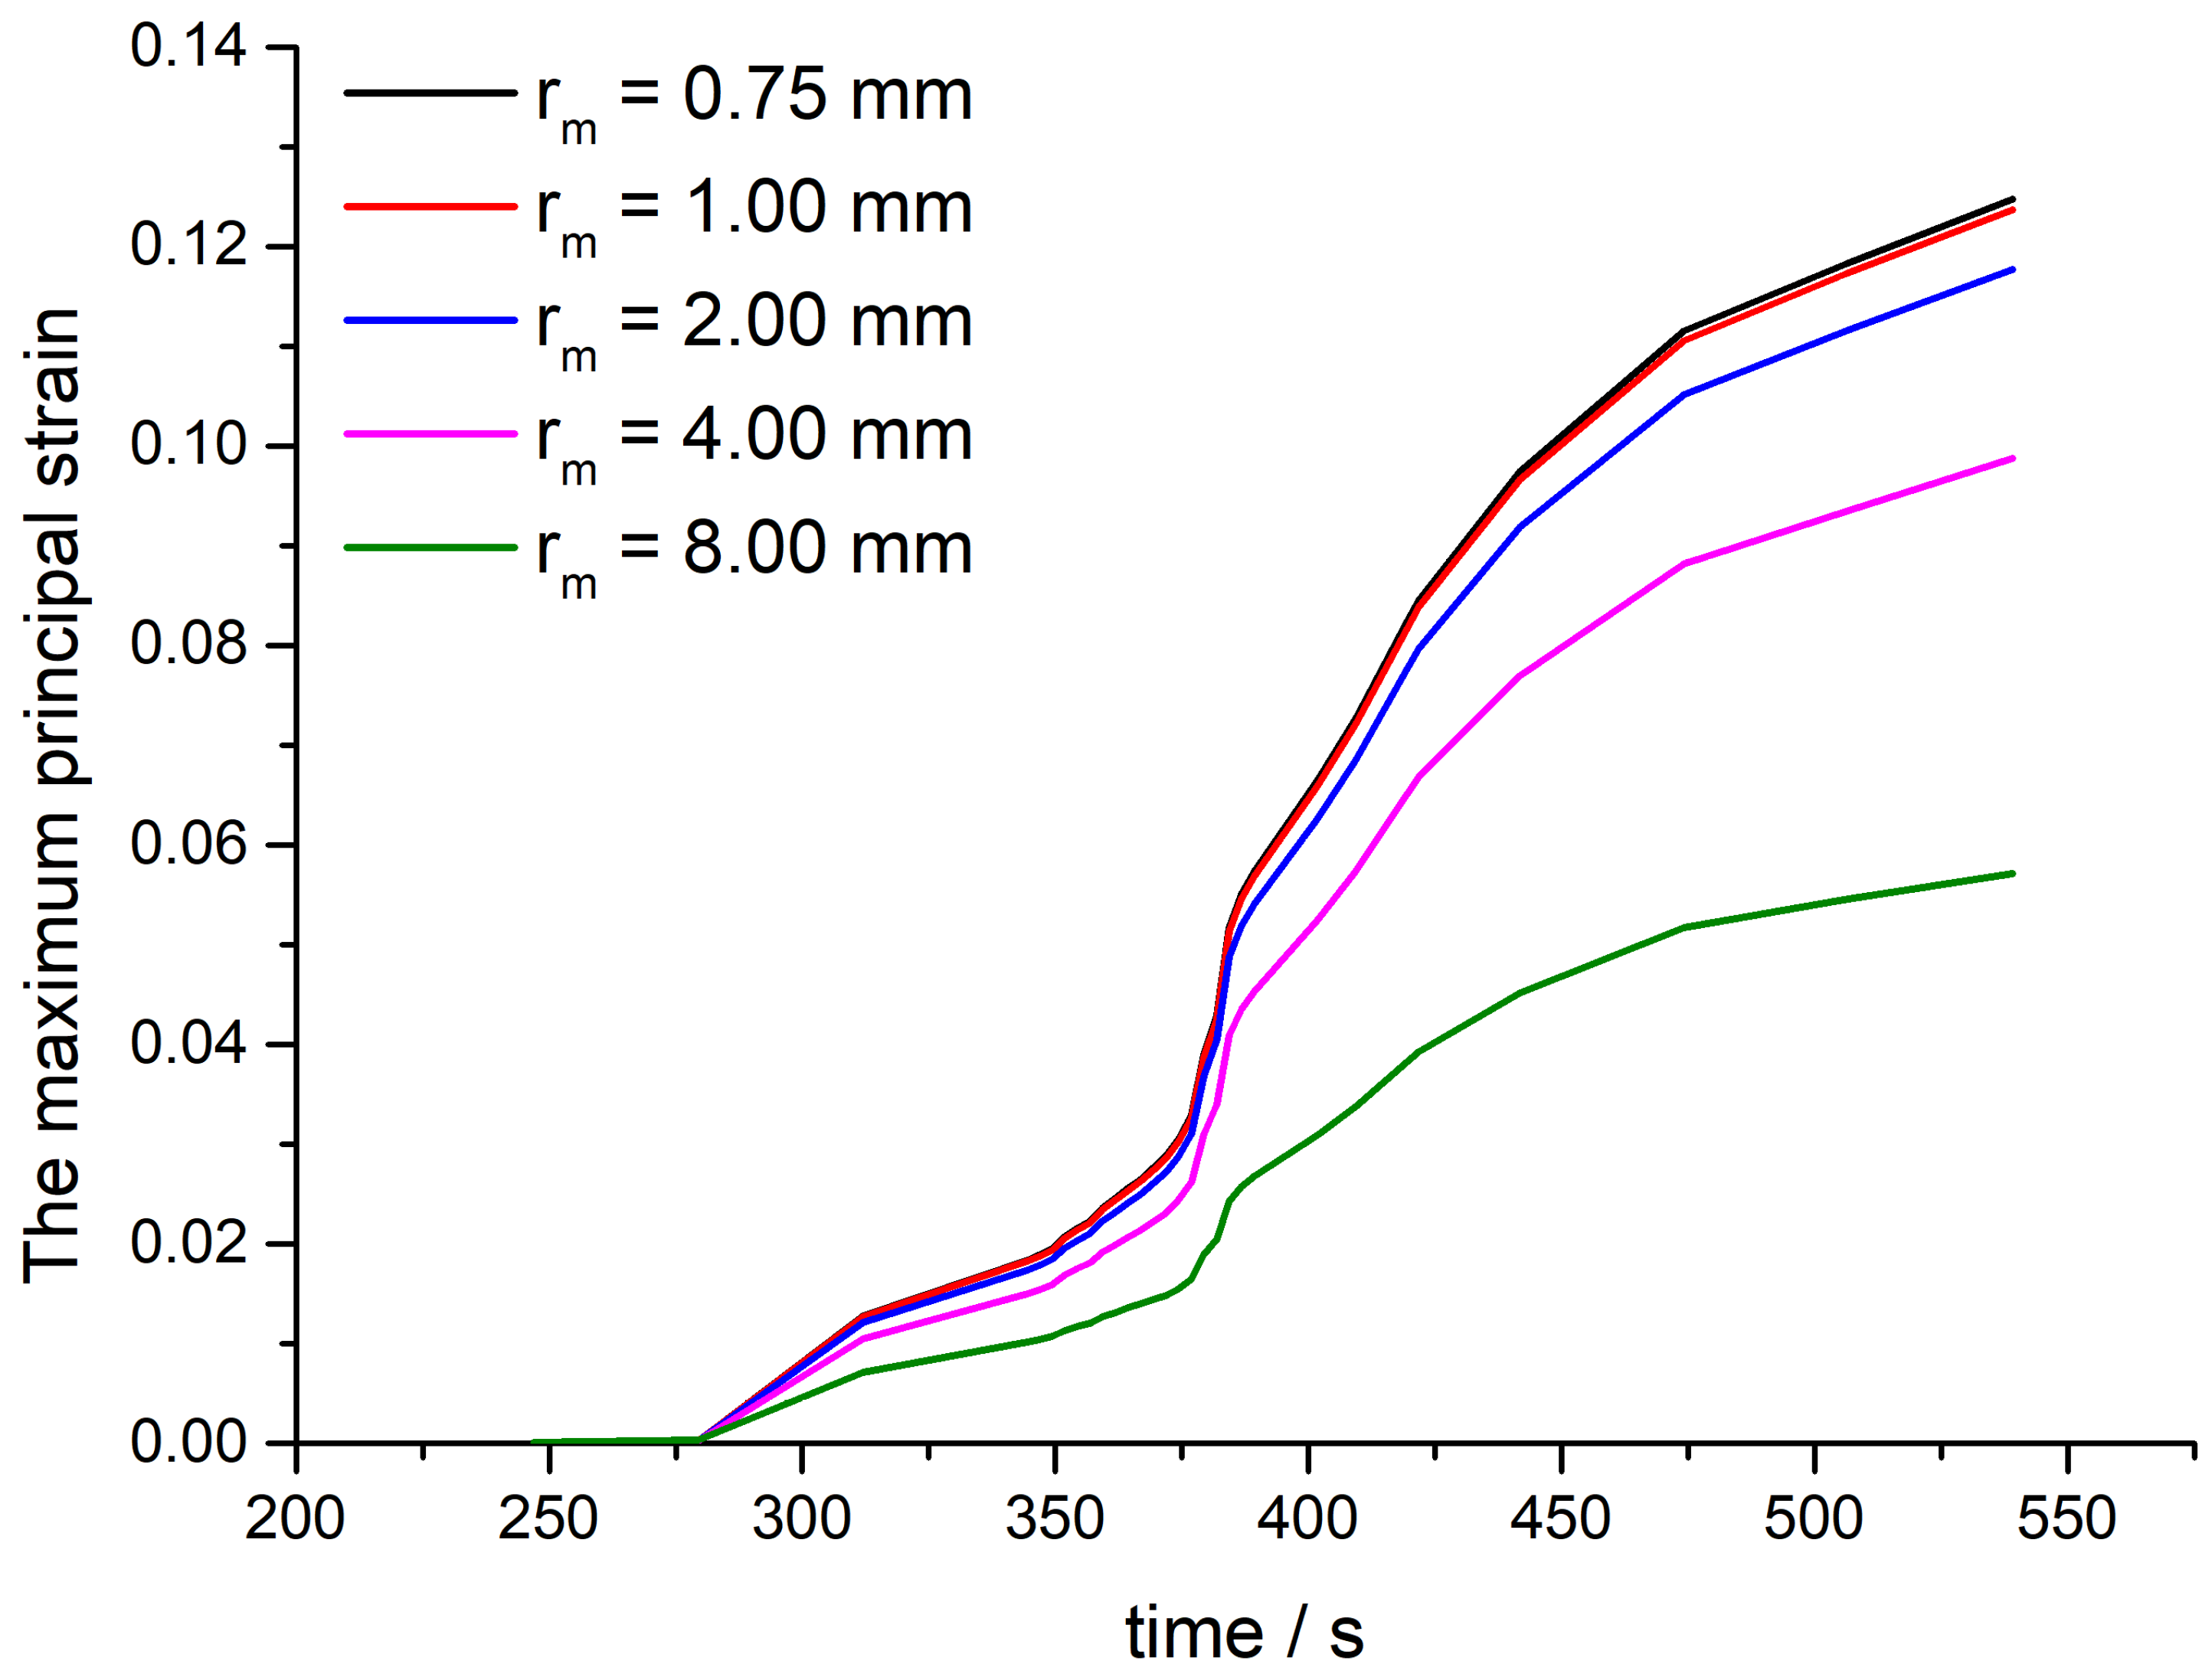
- The results of the strain evolution of the measurement circle along the fracture path show that, under uniaxial static compression, the fracture’s propagation can be divided into four stages: the quiet stage, the formation stage of the stress concentration area, the stable crack propagation stage, and the rapid crack propagation stage.
- The strength of the intact sample is higher than that of all samples containing inclusions, even if the inclusions are identical or stronger than the external material. This shows that the discontinuity of the mechanical properties of the inclusions and the external material may have a certain weakening effect on the overall mechanical properties of the sample, which suggests more attention should be given to the coordinated force and deformation between the backfilling material and the surrounding rock in related projects.
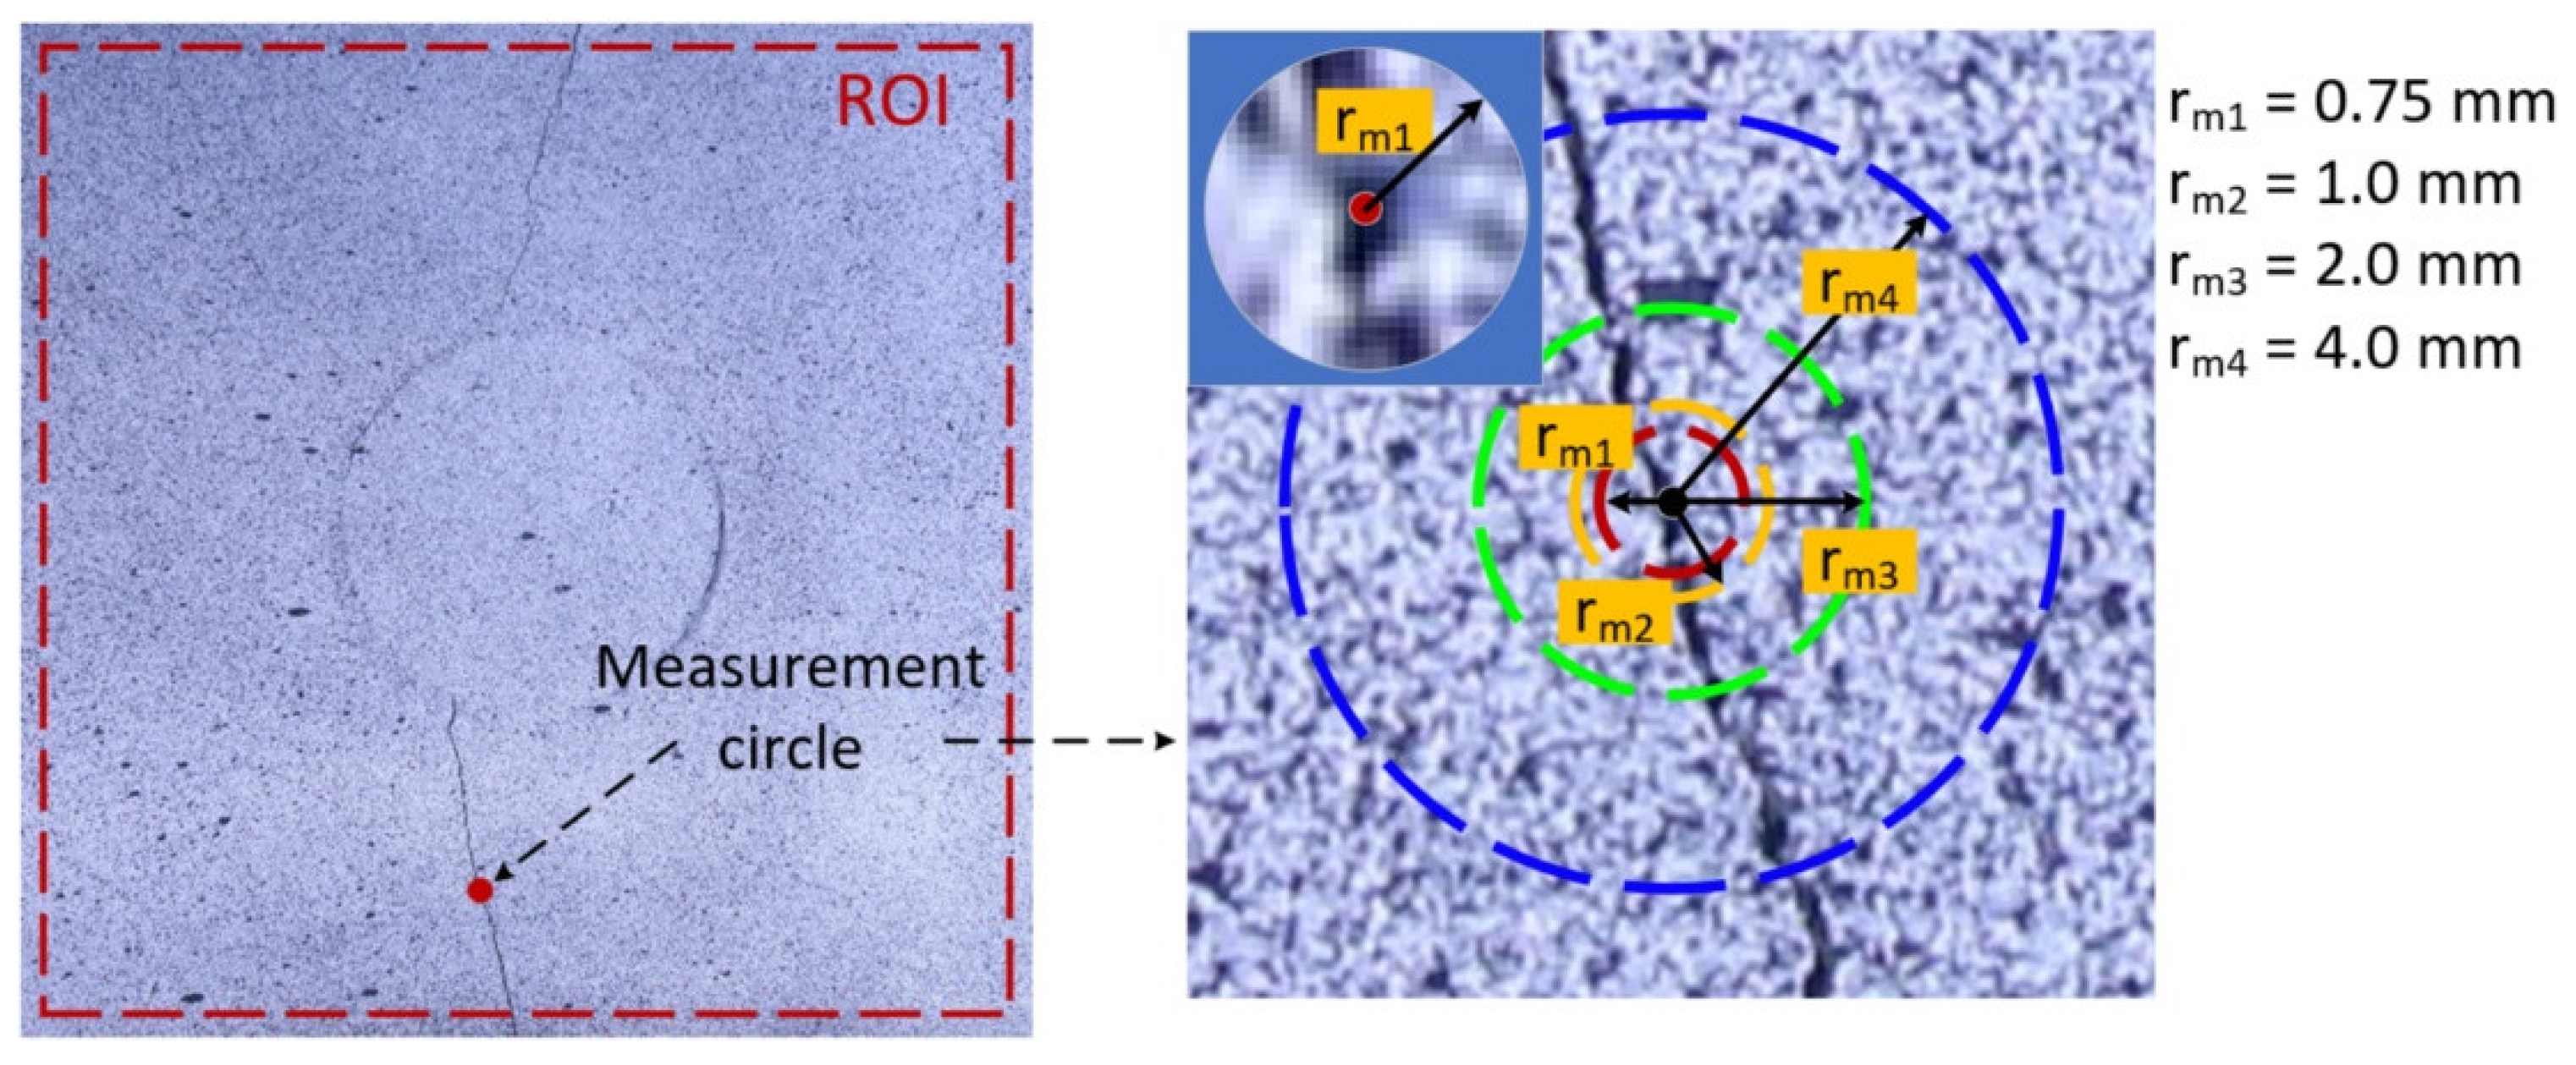
- By strategically arranging measurement circles along the crack path and employing DIC technology, the deformation characteristics within the fracture zone can be accurately captured, allowing for effective monitoring of the crack’s entire evolution process. In future studies, this approach can be further optimized by incorporating displacement vector fields around the cracks, enabling the classification of crack types to be determined.
Author Contributions
Funding
Institutional Review Board Statement
Informed Consent Statement
Data Availability Statement
Conflicts of Interest
References
- Erlbeck, L.; Schreiner, P.; Schlachter, K.; Dörnhofer, P.; Fasel, F.; Methner, F.J.; Rädle, M. Adjustment of thermal behavior by changing the shape of PCM inclusions in concrete blocks. Energy Convers. Manag. 2018, 158, 256–265. [Google Scholar] [CrossRef]
- Chen, L.; Su, R.K.L. Service life modelling of carbonated reinforced concrete with supplementary cementitious materials considering early corrosion propagation. Constr. Build. Mater. 2024, 413, 134861. [Google Scholar] [CrossRef]
- Xu, M.; Liu, X.S. Experimental and Theoretical Solutions on Collapse Mechanism of Tunnelling with Embedded Forepoles. J. Civ. Archit. Environ. Eng. 2013, 35, 25–31. [Google Scholar] [CrossRef]
- Beer, G.; Marussig, B.; Zechner, J.; Dünser, C.; Fries, T.P. Isogeometric boundary element analysis with elasto-plastic inclusions. Part 1: Plane problems. Comput. Methods Appl. Mech. Eng. 2016, 308, 552–570. [Google Scholar] [CrossRef]
- Wu, Z.J.; Wong, L.N.Y. Modeling cracking behavior of rock mass containing inclusions using the enriched numerical manifold method. Eng. Geol. 2013, 162, 1–13. [Google Scholar] [CrossRef]
- Li, Z.; Ren, T.; Li, X.; Cheng, Y.; He, X.; Lin, J.; Qiao, M.; Yang, X. Full-scale pore structure characterization of different rank coals and its impact on gas adsorption capacity: A theoretical model and experimental study. Energy 2023, 277, 127621. [Google Scholar] [CrossRef]
- Ju, F.; Huang, P.; Guo, S.; Xiao, M.; Lan, L.X. A roof model and its application in solid backfilling mining. Int. J. Min. Sci. Technol. 2017, 27, 139–143. [Google Scholar] [CrossRef]
- Li, L. Generalized solution for mining backfill design. Int. J. Geomech. 2014, 14, 04014006. [Google Scholar] [CrossRef]
- Zhu, X.J.; Guo, G.L.; Liu, H.; Yang, X.Y. Surface subsidence prediction method of backfill-strip mining in coal mining. Bull. Eng. Geol. Environ. 2019, 78, 6235–6248. [Google Scholar] [CrossRef]
- Wang, Q.; He, M.C.; Yang, J.; Gao, H.K.; Jiang, B.; Yu, H.C. Study of a no-pillar mining technique with automatically formed gob-side entry retaining for longwall mining in coal mines. Int. J. Rock Mech. Min. Sci. 2018, 110, 1–8. [Google Scholar] [CrossRef]
- Zhang, N.; Yuan, L.; Han, C.L.; Xue, J.H.; Kan, J.G. Stability and deformation of surrounding rock in pillarless gob-side entry retaining. Saf. Sci. 2012, 50, 593–599. [Google Scholar] [CrossRef]
- Yang, H.Y.; Cao, S.G.; Wang, S.Q.; Fan, Y.C.; Wang, S.; Chen, X.Z. Adaptation assessment of gob-side entry retaining based on geological factors. Eng. Geol. 2016, 209, 143–151. [Google Scholar] [CrossRef]
- Kan, Y.C.; Pei, K.C.; Chang, C.L. Strength and fracture toughness of heavy concrete with various iron aggregate inclusions. Nucl. Eng. Des. 2004, 228, 119–127. [Google Scholar] [CrossRef]
- Xiao, J.Z.; Li, W.G.; Corr, D.J.; Shah, S.P. Effects of interfacial transition zones on the stress–strain behavior of modeled recycled aggregate concrete. Cem. Concr. Res. 2013, 52, 82–99. [Google Scholar] [CrossRef]
- Lagier, F.; Massicotte, B.; Charron, J.P. Experimental investigation of bond stress distribution and bond strength in unconfined UHPFRC lap splices under direct tension. Cem. Concr. Compos. 2016, 74, 26–38. [Google Scholar] [CrossRef]
- Raphael, F.L.; Luca, S.; David, C. Development of electrically conductive concrete and mortars with hybrid conductive inclusions. Constr. Build. Mater. 2020, 237, 117470. [Google Scholar]
- Janeiro, R.P.; Einstein, H.H. Experimental study of the cracking behavior of specimens containing inclusions (under uniaxial compression). Int. J. Fract. 2010, 164, 83–102. [Google Scholar] [CrossRef]
- Miao, S.T.; Pan, P.Z.; Wu, Z.H.; Li, S.J.; Zhao, S.K. Fracture analysis of sandstone with a single filled flaw under uniaxial compression. Eng. Fract. Mech. 2018, 204, 319–343. [Google Scholar] [CrossRef]
- Zhu, Q.Q.; Li, D.Y.; Han, Z.Y.; Li, X.B.; Zhou, Z.L. Mechanical properties and fracture evolution of sandstone specimens containing different inclusions under uniaxial compression. Int. J. Rock Mech. Min. Sci. 2019, 115, 33–47. [Google Scholar] [CrossRef]
- Wada, H.; Matsumoto, T.; Yamashita, Y. Diagnosis and treatment of disseminated intravascular coagulation (DIC) according to four DIC guidelines. J. Intensive Care 2014, 2, 15. [Google Scholar] [CrossRef]
- Li, D.Y.; Huang, P.Y.; Chen, Z.B.; Yao, G.W.; Guo, X.Y.; Zheng, X.H.; Yang, Y. Experimental study on fracture and fatigue crack propagation processes in concrete based on DIC technology. Eng. Fract. Mech. 2020, 235, 107166. [Google Scholar] [CrossRef]
- Skarżyński, Ł.; Tejchman, J. Experimental Investigations of Fracture Process Using DIC in Plain and Reinforced Concrete Beams under Bending. Strain 2013, 49, 521–543. [Google Scholar] [CrossRef]
- Munoz, H.; Taheri, A.; Chanda, E.K. Pre-peak and post-peak rock strain characteristics during uniaxial compression by 3D digital image correlation. Rock Mech. Rock Eng. 2016, 49, 2541–2554. [Google Scholar] [CrossRef]
- De Domenico, D.; Urso, S.; Borsellino, C.; Spinella, N.; Recupero, A. Bond behavior and ultimate capacity of notched concrete beams with externally-bonded FRP and PBO-FRCM systems under different environmental conditions. Constr. Build. Mater. 2020, 265, 121208. [Google Scholar] [CrossRef]
- Tan, L.; Zhou, Z.; Cai, X.; Rui, Y. Analysis of mechanical behaviour and fracture interaction of multi-hole rock mass with DIC measurement. Measurement 2022, 191, 110794. [Google Scholar] [CrossRef]
- Tan, L.; Ren, T.; Dou, L.; Cai, X.; Yang, X.; Zhou, Q. Dynamic response and fracture evolution of marble specimens containing rectangular cavities subjected to dynamic loading. Bull. Eng. Geol. Environ. 2021, 80, 7701–7716. [Google Scholar] [CrossRef]
- Destrebecq, J.F.; Toussaint, E.; Ferrier, E. Analysis of cracks and deformations in a full scale reinforced concrete beam using a digital image correlation technique. Exp. Mech. 2011, 51, 879–890. [Google Scholar] [CrossRef]
- David, C.; Matteo, A.; Lori, G.-B.; Surendra, S. Digital image correlation analysis of interfacial debonding properties and fracture behavior in concrete. Eng. Fract. Mech. 2007, 74, 109–121. [Google Scholar]
- Schreier, H.; Orteu, J.J.; Sutton, M.A. Image Correlation for Shape, Motion and Deformation Measurements: Basic Concepts, Theory and Applications; Springer: Berlin/Heidelberg, Germany, 2009; Volume 1. [Google Scholar]
- Blaber, J.; Adair, B.; Antoniou, A. Ncorr: Open-Source 2D Digital Image Correlation Matlab Software. Exp. Mech. 2015, 55, 1105–1122. [Google Scholar] [CrossRef]
- AS 3972-2010; General Purpose and Blended Cements. Standards Australia: Sydney, Australia, 2010.
- Zhu, W.C.; Liu, J.S.; Tang, C.A.; Zhao, X.D.; Brady, B.H. Simulation of progressive fracturing processes around underground excavations under biaxial compression. Tunn. Undergr. Space Technol. 2005, 20, 231–247. [Google Scholar] [CrossRef]
- Tan, L.; Ren, T.; Dou, L.; Yang, X.; Qiao, M.; Peng, H. Analytical stress solution and mechanical properties for rock mass containing a hole with complex shape. Theor. Appl. Fract. Mech. 2021, 114, 103002. [Google Scholar] [CrossRef]
- Tan, L.; Ren, T.; Dou, L.; Yang, X.; Wang, G.; Peng, H. Analytical Stress Solution and Numerical Mechanical Behavior of Rock Mass Containing an Opening under Different Confining Stress Conditions. Mathematics 2021, 9, 2462. [Google Scholar] [CrossRef]
- Carter, B.J.; Lajtai, E.Z.; Yuan, Y. Tensile fracture from circular cavities loaded in compression. Int. J. Fract. 1992, 57, 221–236. [Google Scholar] [CrossRef]
- Dzik, E.; Lajtai, E. Primary fracture propagation from circular cavities loaded in compression. Int. J. Fract. 1996, 79, 49–64. [Google Scholar] [CrossRef]
- Lotidis, M.A.; Nomikos, P.P.; Sofianos, A.I. Numerical Simulation of Granite Plates Containing a Cylindrical Opening in Compression. Procedia Eng. 2017, 191, 242–247. [Google Scholar] [CrossRef]
- Chen, G.; Gao, D.; Zhu, H.; Song Yuan, J.; Xiao, X.; Wang, W. Effects of novel multiple hooked-end steel fibres on flexural tensile behaviour of notched concrete beams with various strength grades. Structures 2021, 33, 3644–3654. [Google Scholar] [CrossRef]


| Inclusion Type | Cement/% | Sand/% | Water/% | Strength/MPa |
|---|---|---|---|---|
| I1 | 51.72 | 34.48 | 13.79 | 69.44 |
| I2 | 41.67 | 41.67 | 16.66 | 53.97 |
| I3 | 40.00 | 40.00 | 20.00 | 46.49 |
| I4 | 38.46 | 38.46 | 23.08 | 40.11 |
| I5 | 32.27 | 48.38 | 19.35 | 34.08 |
| Sample Group | S1 | S2 | S3 | S4 | S5 |
| Inclusion Type | I1 | I2 | I3 | I4 | I5 |
| Sample | S1-1 | S3-1 | S5-1 |
|---|---|---|---|
| DIC Analysis | 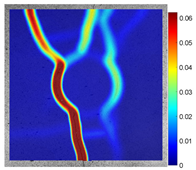 | 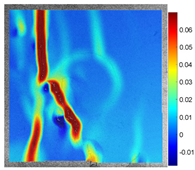 |  |
| Failure pattern | 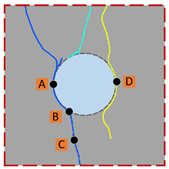 | 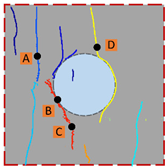 |  |
Disclaimer/Publisher’s Note: The statements, opinions and data contained in all publications are solely those of the individual author(s) and contributor(s) and not of MDPI and/or the editor(s). MDPI and/or the editor(s) disclaim responsibility for any injury to people or property resulting from any ideas, methods, instructions or products referred to in the content. |
© 2024 by the authors. Licensee MDPI, Basel, Switzerland. This article is an open access article distributed under the terms and conditions of the Creative Commons Attribution (CC BY) license (https://creativecommons.org/licenses/by/4.0/).
Share and Cite
Yao, G.; Wang, G.; Tan, L.; Zhang, Y.; Wang, R.; Yang, X. Fracture Evolution and Mechanical Properties of Mortar Containing Different Inclusions. Appl. Sci. 2024, 14, 3166. https://doi.org/10.3390/app14083166
Yao G, Wang G, Tan L, Zhang Y, Wang R, Yang X. Fracture Evolution and Mechanical Properties of Mortar Containing Different Inclusions. Applied Sciences. 2024; 14(8):3166. https://doi.org/10.3390/app14083166
Chicago/Turabian StyleYao, Gang, Guifeng Wang, Lihai Tan, Yinfeng Zhang, Ruizhi Wang, and Xiaohan Yang. 2024. "Fracture Evolution and Mechanical Properties of Mortar Containing Different Inclusions" Applied Sciences 14, no. 8: 3166. https://doi.org/10.3390/app14083166