Article

Comparative Analysis of Fatty Acids Concentration in Liver and Muscle Tissues of Rats and Mice

by
Marcin Kłosok
1,
Daria Gendosz de Carrillo
1,2,
Piotr Łaszczyca
3,
Tomasz Płociniczak
3,
Halina Jędrzejowska-Szypułka
1 and
Tomasz Sawczyn
1,*
1
Department of Physiology, Faculty of Medical Sciences in Katowice, Medical University of Silesia, Medyków 18, 40-752 Katowice, Poland
2
Department of Histology and Cell Pathology, Faculty of Medical Sciences in Zabrze, Medical University of Silesia, 40-055 Katowice, Poland
3
Institute of Biology, Biotechnology and Environmental Protection, Faculty of Natural Sciences, University of Silesia in Katowice, Jagiellońska 26/28, 40-032 Katowice, Poland
*
Author to whom correspondence should be addressed.
Appl. Sci. 2024, 14(8), 3192; https://doi.org/10.3390/app14083192
Submission received: 16 February 2024 / Revised: 5 April 2024 / Accepted: 6 April 2024 / Published: 10 April 2024
(This article belongs to the Section Applied Biosciences and Bioengineering)

Abstract

:
This study conducted a comparative analysis of fatty acids (FAs) concentration derived from polar (PL) and non-polar (NPL) lipids in the liver and muscle tissues of rats and mice. The objective was to elucidate species-specific differences in tissue FA distribution. Employing targeted GC/MS-based methodology, the study aimed to provide insights into conserved and species-specific aspects of lipid metabolism, thereby enhancing future experimental design, linked with comprehension of the interactions between diet, metabolism, and health. Results revealed markedly higher levels of total fatty acids (TFAs) derived from PL in mice skeletal muscle compared to rats and elevated saturated fatty acids (SFAs) levels in mice. Unsaturated fatty acid levels, mainly monounsaturated fatty acids (MUFAs) and polyunsaturated fatty acids (PUFAs), were substantially higher in mice muscle across all lipid classes, resulting in a higher PUFA/TFA ratio in mice muscle. Detailed analysis of specific unsaturated fatty acids (C16:1, C18:1n9c, C18:2n6c, C22:6n3) indicated elevated levels in mice relative to rats. Conversely, rats exhibited higher SFA levels derived from the NPL fraction in the liver, particularly in myristic (C14:0), stearic (C18:0), and tricosanoic (C23:0) acids. Mice liver PL fractions displayed significantly elevated unsaturated FA levels, with notably higher MUFAs and lower PUFAs in NPL fractions compared to rats. Analysis of specific unsaturated FAs revealed higher levels of palmitoleic acid (C16:1) in mice, while rats exhibited increased linoleic (C18:2n6c) and linolenic (C18:3n3) acids. In conclusion, significant differences in FAs tissue distribution between rats and mice underscore the importance of considering species-specific FAs variations when utilizing these animal models and interpreting experimental results related to FA metabolism.

1. Introduction

Among the myriad of fatty acids (FA), saturated (SFA) and unsaturated (UFA), they exhibit distinct biochemical properties that can profoundly influence cellular functions and contribute to the development of metabolic disorders [1]. Despite the vast body of literature exploring lipid metabolism, there is a notable gap in the understanding of species-specific variations, particularly in the context of rodents. This paper aims to address this gap by undertaking a comprehensive analysis of the FAs concentrations derived from polar (PL) and non-polar (NPL) lipids in the liver and muscle tissues of two commonly studied rodent models, rats (Rattus norvegicus) and mice (Mus musculus). While these two species share a substantial genetic homology, emerging evidence suggests existing differences in their metabolism [2]. Understanding the distinct FAs profiles in rats and mice may offer valuable insights into the evolutionarily conserved and species-specific aspects of lipid metabolism, thereby informing future research endeavors and pointing out the potential implications for human health. The intricate relationship between diet, metabolism, and health has been a focal point in biomedical research, with lipids playing a pivotal role in these interconnections [3].
FAs are essential components of our diet and play an important role in maintaining human health. These organic molecules are not only crucial for energy storage but also serve as structural elements in cell membranes (polar lipids) and as precursors for various bioactive lipid mediators [4,5,6]. In recent years, there has been growing interest in the composition, and distribution of different fatty acid classes, particularly SFAs, MUFAs, and PUFAs, due to their profound impact on human health [7].
SFAs are characterized by the presence of single bonds only in their hydrocarbon chains, making them relatively stable and solid at room temperature. While SFAs are necessary for certain physiological functions, excessive consumption has been linked to adverse health outcomes, including cardiovascular diseases [8]. In contrast, UFAs such as MUFAs and PUFAs, primarily found in olive oil, avocados, and nuts, are valued for their potential health benefits, such as improved lipid profiles, anti-inflammatory properties, and reduced risk of heart disease [9]. The presence of different lipid species within the pool of fatty acids eligible for integration has been proposed to impact the diversity of membrane phospholipids. As the ratio of lipids containing MUFAs chains rises compared to SFAs, more MUFAs are likely assimilated into membrane phospholipids, consequently altering membrane properties. The presence of a single double bond introduces a degree of polarity to MUFAs, which can affect their interactions with cellular membranes and various enzymes [10]. PUFAs are characterized by multiple double bonds in their hydrocarbon chains and can be further classified into omega-3 (n-3) and omega-6 (n-6) fatty acids. These essential fatty acids are not synthesized by the human body and must be delivered into the human body with diet. PUFAs play a critical role in inflammation regulation, brain development, and cardiovascular health [11]. The optimal balance between n-3 and n-6 PUFAs is essential for organism inflammation status, and their imbalance is associated with various chronic diseases. The presence of multiple double bonds in PUFAs increases their polarity, thereby affecting membrane fluidity, cell signaling, and eicosanoid production [11].
Recent findings suggest that while diet, sex, and genotype each contribute to overall variance in lipidomic profiles, organ identity remains the most defining factor for lipid composition. This comprehensive lipidomic characterization serves as a valuable reference for future biomedical research using mouse models [12]. Similarly, lipidomic profiles across different tissues in rats, underscoring the tissue-specific nature of lipid composition. The analysis demonstrates distinct lipidomic fingerprints associated with various tissues, highlighting the unique metabolic functionalities and cellular structures of each tissue type. The study emphasizes the importance of understanding tissue-specific lipidomics for interpreting metabolic states and disease mechanisms [13]. The findings derived from metabolic investigations frequently entail a comparative analysis between rats and mice, organisms characterized by numerous shared traits, particularly in lipid metabolism. Nevertheless, notable distinctions between them manifest in certain facets. For both rats and mice, the liver is the primary site for de novo lipogenesis (DNL), the process of creating fatty acids from acetyl-CoA, predominantly derived from glucose, but the rate of fatty acid synthesis in the liver can vary between the two species, influenced by factors such as diet and hormonal regulation. Mice generally have a higher rate of de novo lipogenesis in the liver compared to rats [14]. Rodents, including rats and mice, primarily use glucose as the precursor for fatty acid synthesis, unlike other species that may use acetic acid or other substrates [15]. Rodent adipocytes, which would include those from rats and mice, are noted for their broad responsiveness to various endocrine signals, which can significantly influence lipid metabolism. This includes a wide array of hormonal responses that regulate anabolic and catabolic processes in lipid metabolism [16].
Understanding the contribution of these particular fatty acid classes in living organisms is crucial to explaining the intricate connections between dietary intake, metabolic pathways, and health outcomes. This article aims to present an analysis of the content and composition of SFA, MUFA, and PUFA in both liver and skeletal muscle tissues of rats and mice, which are the most common animal models used in lipid metabolism research. By delineating the lipidomic landscapes of crucial metabolic organs such as the liver on skeletal muscles, we aim to uncover potential variations that could underpin observed differences in metabolic phenotypes between rats and mice. Additionally, elucidating the species-specific lipid signatures may shed light on the adaptability of rodent models to dietary interventions, pharmacokinetics, and metabolic surgery, providing essential context for interpreting experimental outcomes and extrapolating findings to human physiology. The outcomes of this research may have implications for refining experimental design, data interpretation, and translational relevance, ultimately advancing our understanding of the intricate interplay between diet, metabolism, and health.

2. Materials and Methods

2.1. Animals

Animal care and handling were performed following the principles of the 3Rs (Replacement, Reduction, and Refinement), and all experimental procedures received approval from the Local Ethical Committee for Experiments on Animals at the Medical University of Silesia in Katowice (No.149/2019). The animals, mice (Mus musculus, C57BL/6 strain, n = 6) and rats (Rattus norvegicus, Wistar strain, n = 6), were housed in temperature- and humidity-controlled quarters with a standard light/dark cycle (12L/12D) and provided ad libitum access to the same diet (Table 1) and water. The studies used sexually mature animals with an average body weight, respectively, for rats: 8 weeks, 150–170 g, and for mice: 6 weeks, 20–30 g. The animals were killed according to The European Directive on the protection of animals used for scientific purposes (2010/63/EU). Animals were euthanized through dislocation of the neck, with the prior use of isofluran (dose: 3% isofluran/2 L O2/min), introduced into the chamber in which the animal was located. Immediately after euthanasia, a lobe of the liver was removed after opening the abdominal cavity. In the next step, the soleus muscle was harvested.

2.2. Diet Composition

Both rats and mice were fed the same animal feed, the composition of which is detailed in Table 1.

2.3. Tissue Sample Preparation

The organs (liver and soleus muscle) weighing 30–55 mg were homogenized in 1 mL ice-cold extracting mixture (hexane:isopropanol, 3:2 vol./vol.) with butylated hydroxytoluene (BHT, 50 µg/mL). The volume of extracting buffer was calculated per mg of wet weight. Tissue samples were homogenized in 2 mL Eppendorf tubes. Homogenates were shaken using a mechanical shaker (800 osc./min, 20 min) at room temperature, and subsequently centrifuged at 10,000× g for 5 min. Then supernatant (organic phase) was transferred to a clean Eppendorf tube. The 0.5 mL of Na2SO4 (0.1 mol/L) was added to the supernatant, then vigorously shaken, and centrifuged again (10,000× g, 5 min). Each lipid-containing supernatant was later placed on separate centrifuge microfilters, and centrifuged at 3000× g for 3 min. Crude lipid samples were dried three times under a low-pressure nitrogen atmosphere. The yield of lipids after the last drying cycle was measured gravimetrically (RADWAG WPS 180/C/1 scale) with an accuracy of 0.1 mg. At this step, the lipid samples were stored at −80 °C until further analysis. Before analyses, the collected lipid samples were dissolved in a hexane/isopropanol mixture (3:2 vol./vol.) to obtain a final lipid concentration of 20 µg/µL.

2.4. Estimation of Saturated, Monounsaturated and Polyunsaturated Fatty Acid Fractions by GC-MS Approach

Initially, samples were separated using a solid-phase extraction system on silica gel (Baker, CA, USA) with subsequent extractions using chloroform, acetone, and methanol [17,18]. Nitrogen-dried lipid samples were transesterified according to Christie’s method, which consists of several steps: mixing with methanol, toluene, KOH, and acetic acid, phase separation (centrifugation), drying and dissolving of separated fractions in 70 µL of hexane [17,18]. Fatty acids were identified by gas chromatography. GC/MS analysis was performed using an HP 6890(II) gas chromatograph coupled to an HP 5972 mass spectrometer with electron impact ionization (70 eV). An Rt-2560 capillary column (100 m, 0.25 mm ID, 0.20 µm) (Hewlett-Packard 6890 (Agilent-HP, Santa Clara, CA, USA), Rt®-2560 biscyanopropyl polysiloxane column (Restek, Centre County, PA, USA)) was used. The column temperature was programmed to rise from 50 to 240 °C at a rate of 5 °C min−1. The carrier gas was helium at a flow rate of 1.2 mL min−1. The split ratio was 60:1. The scan time and mass range were 1 s and m/z 40–300, respectively. The content of individual fatty acid fractions was converted into the wet weight of the tissue used for the study.
Nineteen fatty acid species (Sigma-Aldrich, St. Louis, MO, USA) were used as standards: Caproic Acid (C6:0); Caprylic Acid (C8:0); Undecanoic Acid (C11:0); Lauric Acid (C12:0); Myristic Acid (C14:0); Pentadecenoic Acid (C15:0); Palmitic Acid (C16:0); Palmitoleic Acid (C16:1); Heptadecenoic Acid (C17:0); cis-10-Heptadecenoic Acid (C17:1); Stearic Acid (C18:0); Oleic Acid (C18:1n9c); Linoleic Acid (C18:2n6c); Arachidic Acid (C20:0); cis-11-Eicosanoic Acid (C20:1); Linolenic Acid (C18:3n3); cis-8,11,14-Eicosatrienoic Acid (C20:3n6); Tricosanoic Acid (C23:0); cis-4,7,10,13,16,19-Docosahexaenoic Acid (C22:6n3).

2.5. Statistics

Data were analyzed with GraphPad Prism 9. The normality of distribution was assessed with the Shapiro–Wilk test. Statistical comparisons were conducted with the multiple Mann–Whitney test for non-Gaussian distribution data. For each comparison between groups, the false discovery rate correction (FDR) was performed. All statistical tests were calculated based on medians with interquartile ranges generated from the number of animals in each group. Differences at p < 0.05 were considered to be statistically significant.

3. Results

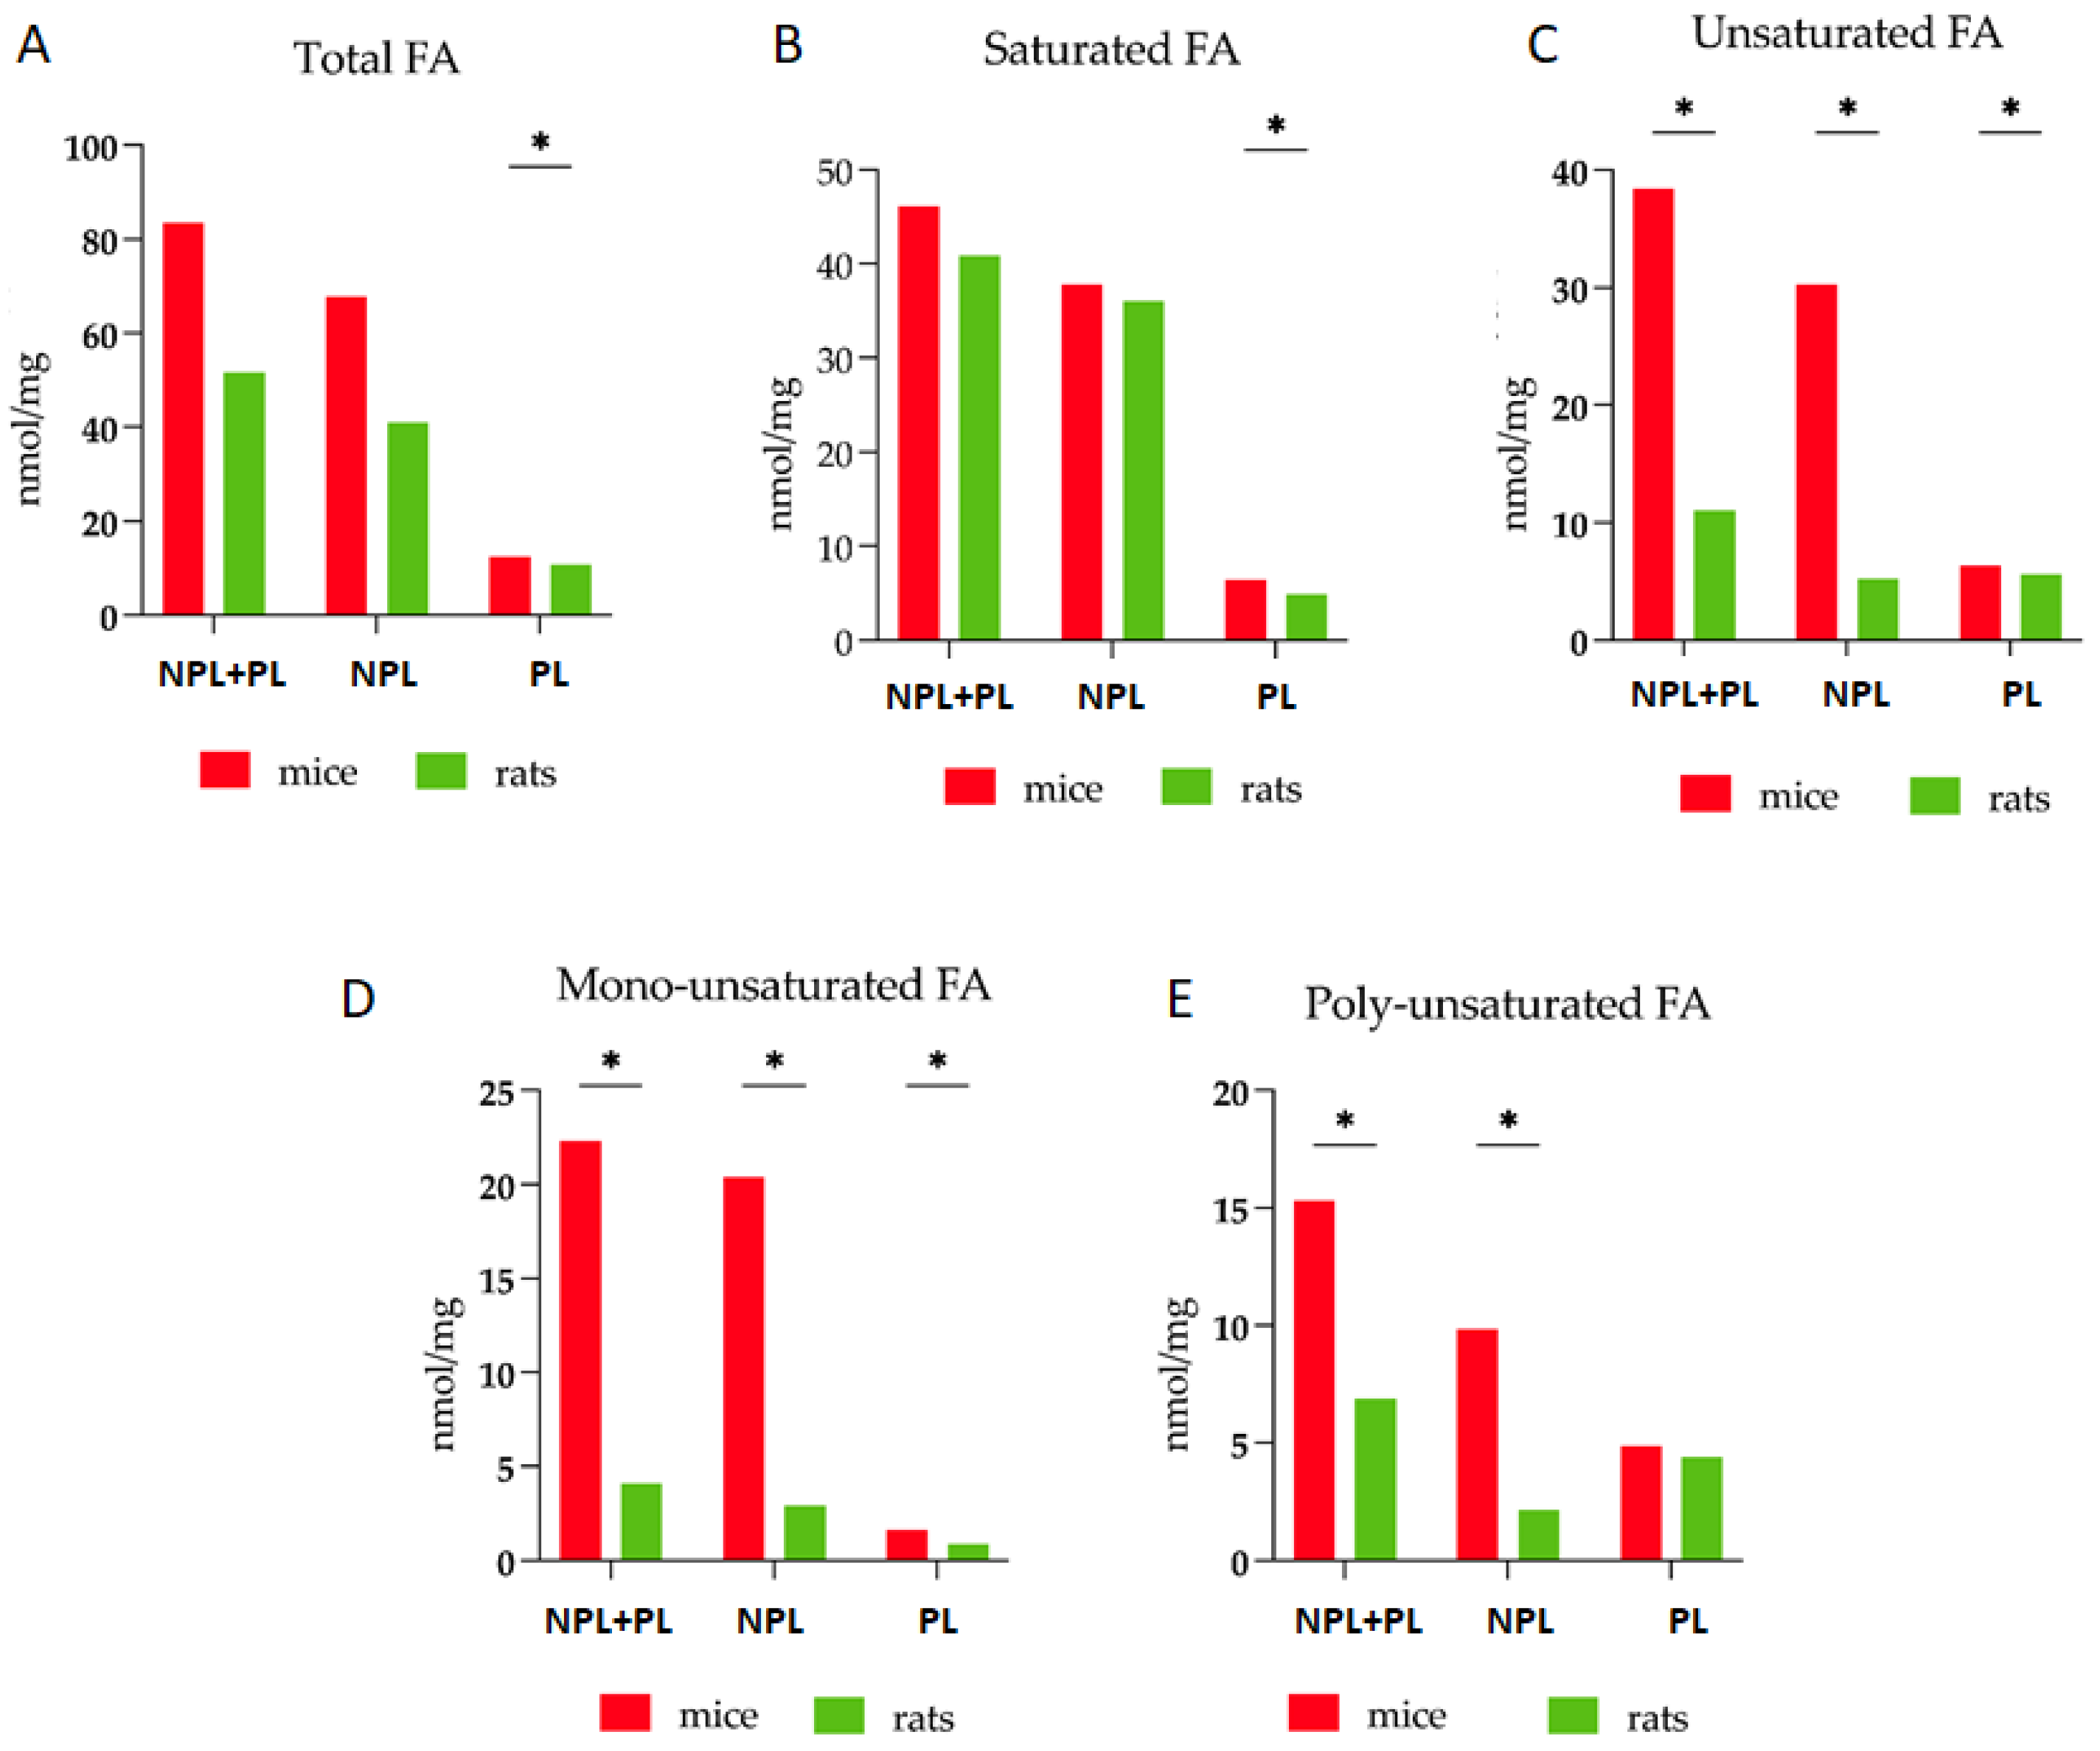
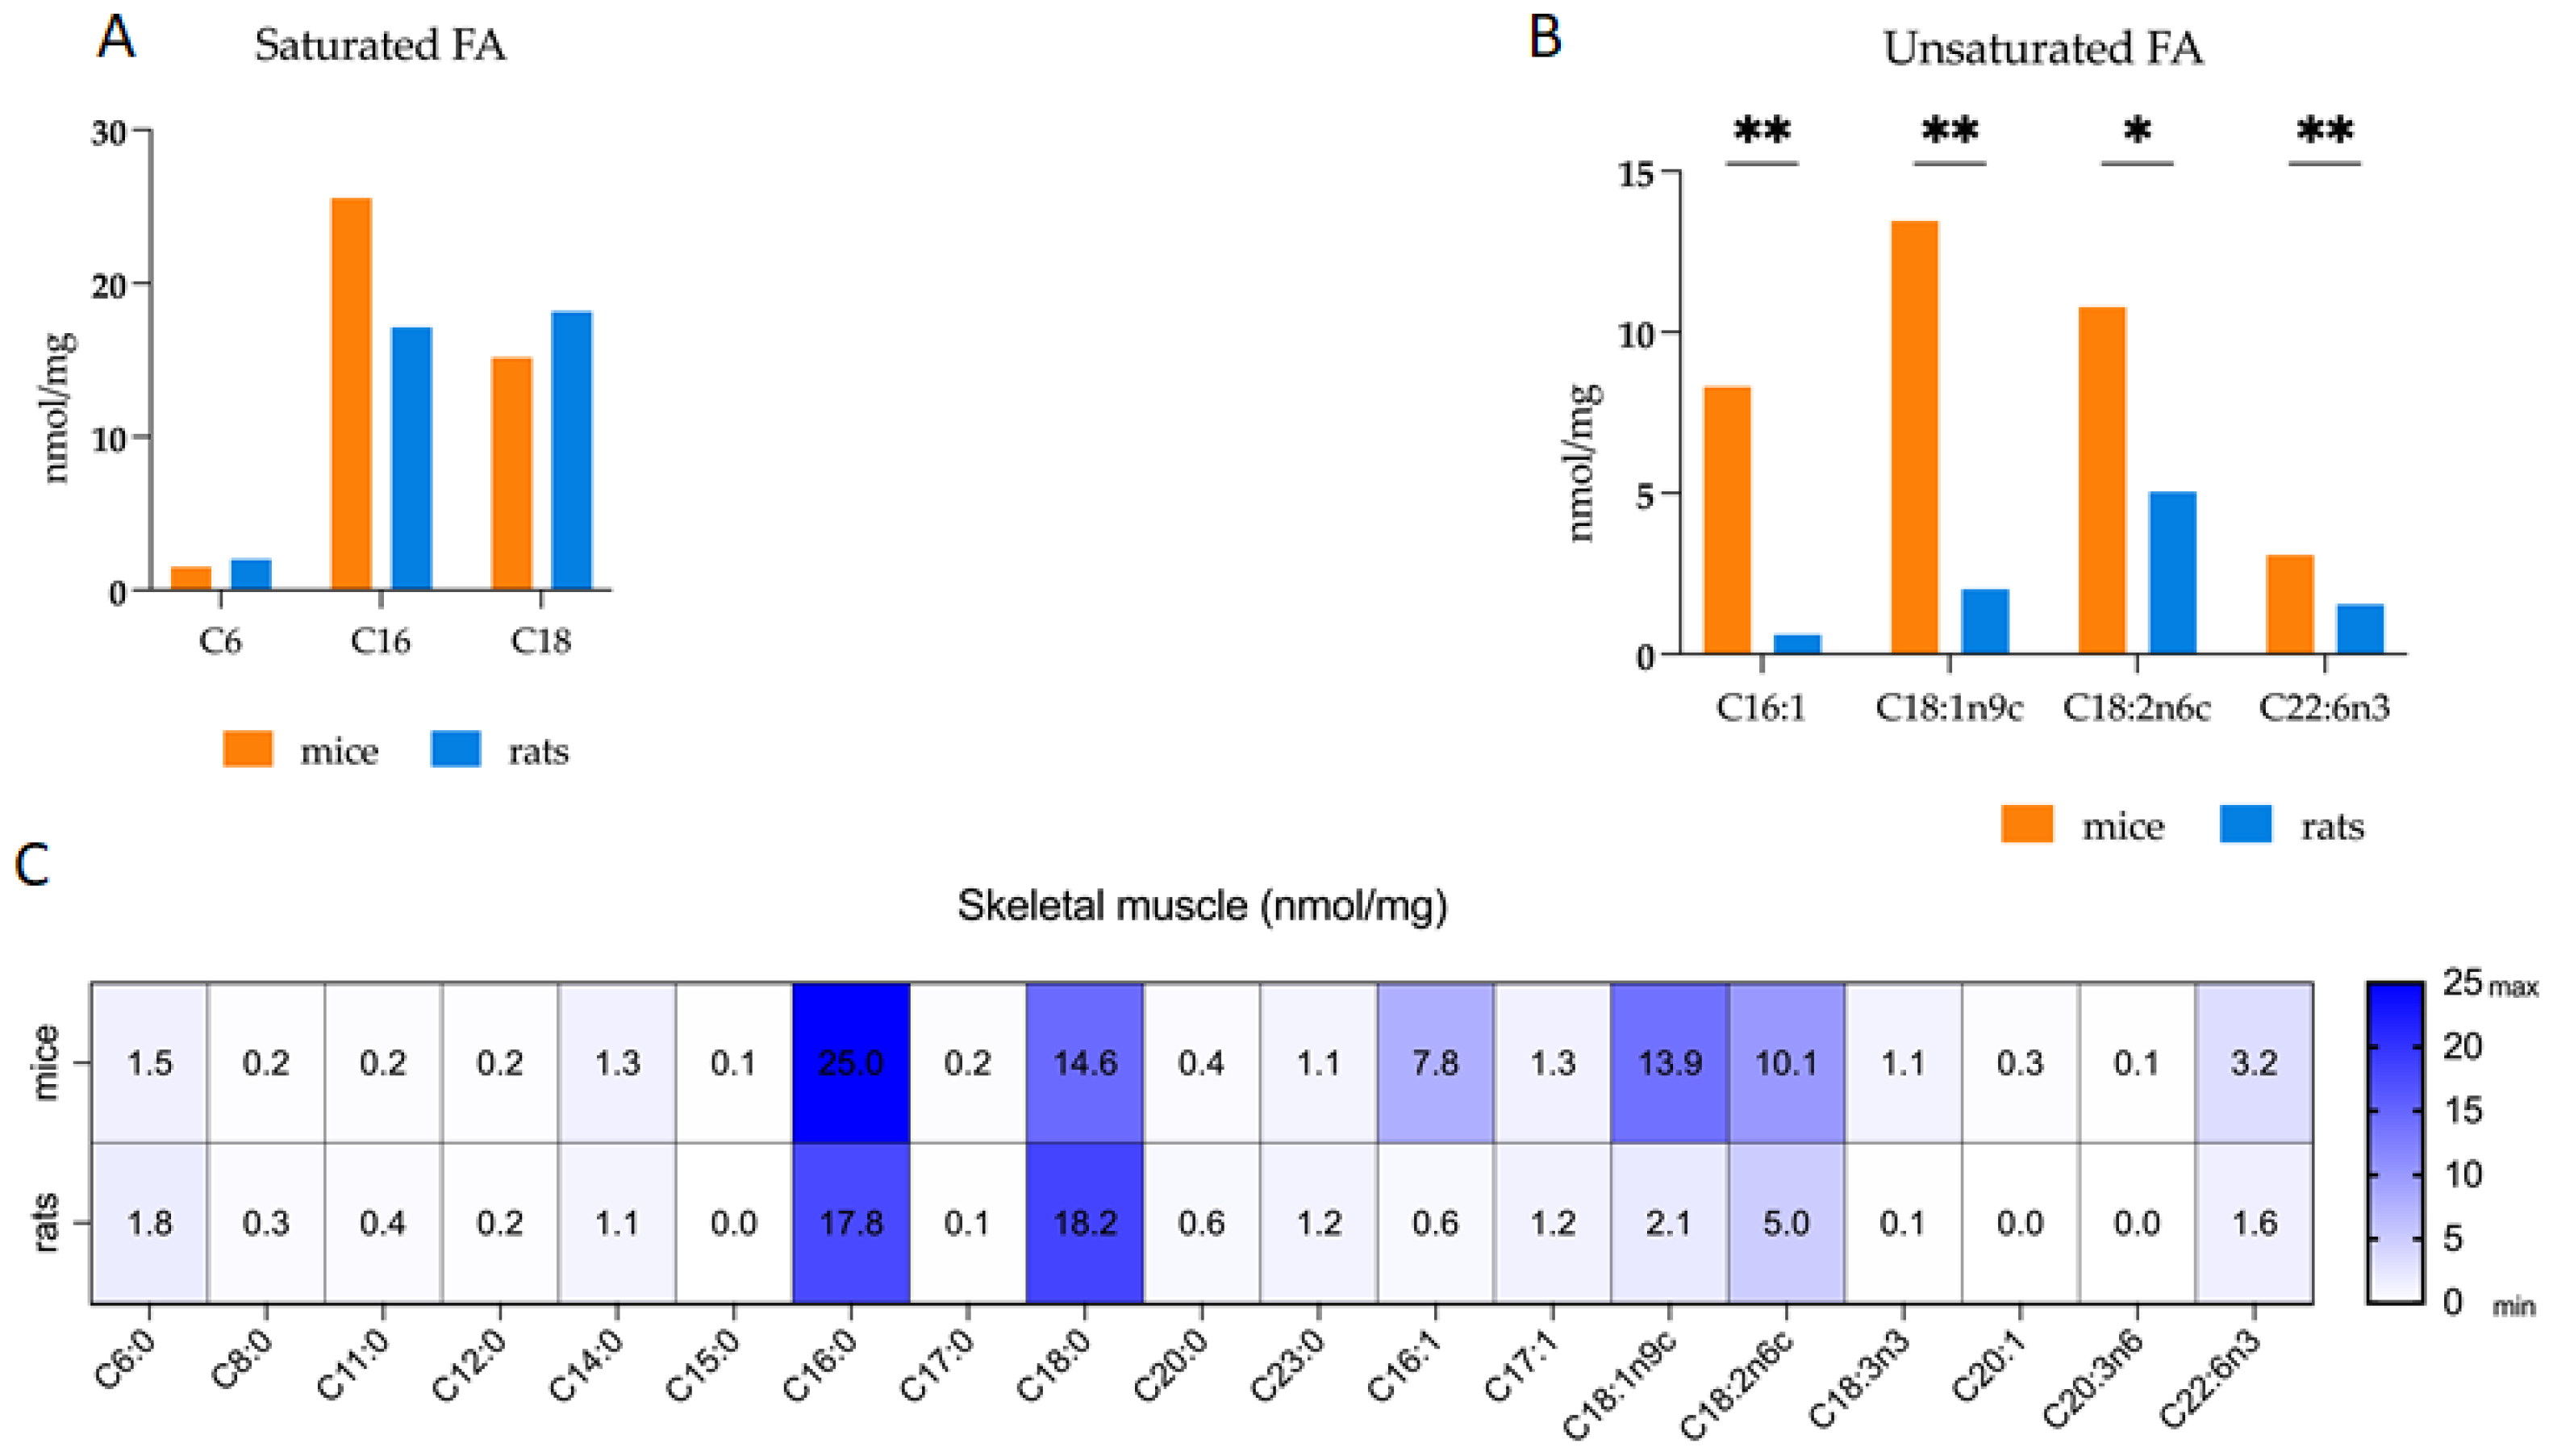
3.1. Comparative Analysis of Fatty Acid Profiles in Skeletal Muscle: Delineating Species-Specific Differences in Polar and Non-Polar Lipid Fractions between Mice and Rats

Mice exhibit significantly elevated levels of total fatty acids (TFAs) derived from PL fraction of skeletal muscle when compared to rats (Figure 1A, Table 2). This same pattern is observed in the PL fraction of saturated fatty acids (SFAs) in mice in comparison to rats (Figure 1B). However, in the non-polar lipids (NPL) and the combined non-polar and polar lipids (NPL + PL), there was no significant difference in SFAs levels between the two species. The analysis of saturated fatty acid levels (particularly: caproic acid—C6:0, palmitic acid—C16:0, and stearic acid—C18:0) in the muscle tissues of both mice and rats did not show any significant difference (Figure 2A). The levels of unsaturated fatty acids were significantly higher in mice than in rats in all three categories: NPL + PL, NL, and PL (Figure 1C). The same results were observed for MUFA levels (Figure 1D). PUFAs levels were higher for the NPL + PL and NPL lipid fractions, but no difference was observed in the PL fraction (Figure 1E). The ratio of polyunsaturated fatty acids into the total fatty acids (Table 2. PUFA/TFA) was significantly higher in mice muscle comparing to rats. The analysis of unsaturated fatty acid levels (particularly: palmitoleic acid—C16:1, oleic acid—C18:1n9c, linoleic acid—C18:2n6c, cis-4,7,10,13,16,19-docosahexaenoic acid—C22:6n3) in the muscle tissue samples of both mice and rats showed that mice had generally higher levels of these unsaturated FAs compared to rats (Figure 2B). The concentrations of 19 fatty acids from mice and rats skeletal muscle samples selected for statistical analysis are presented on the heatmap (Figure 2C).

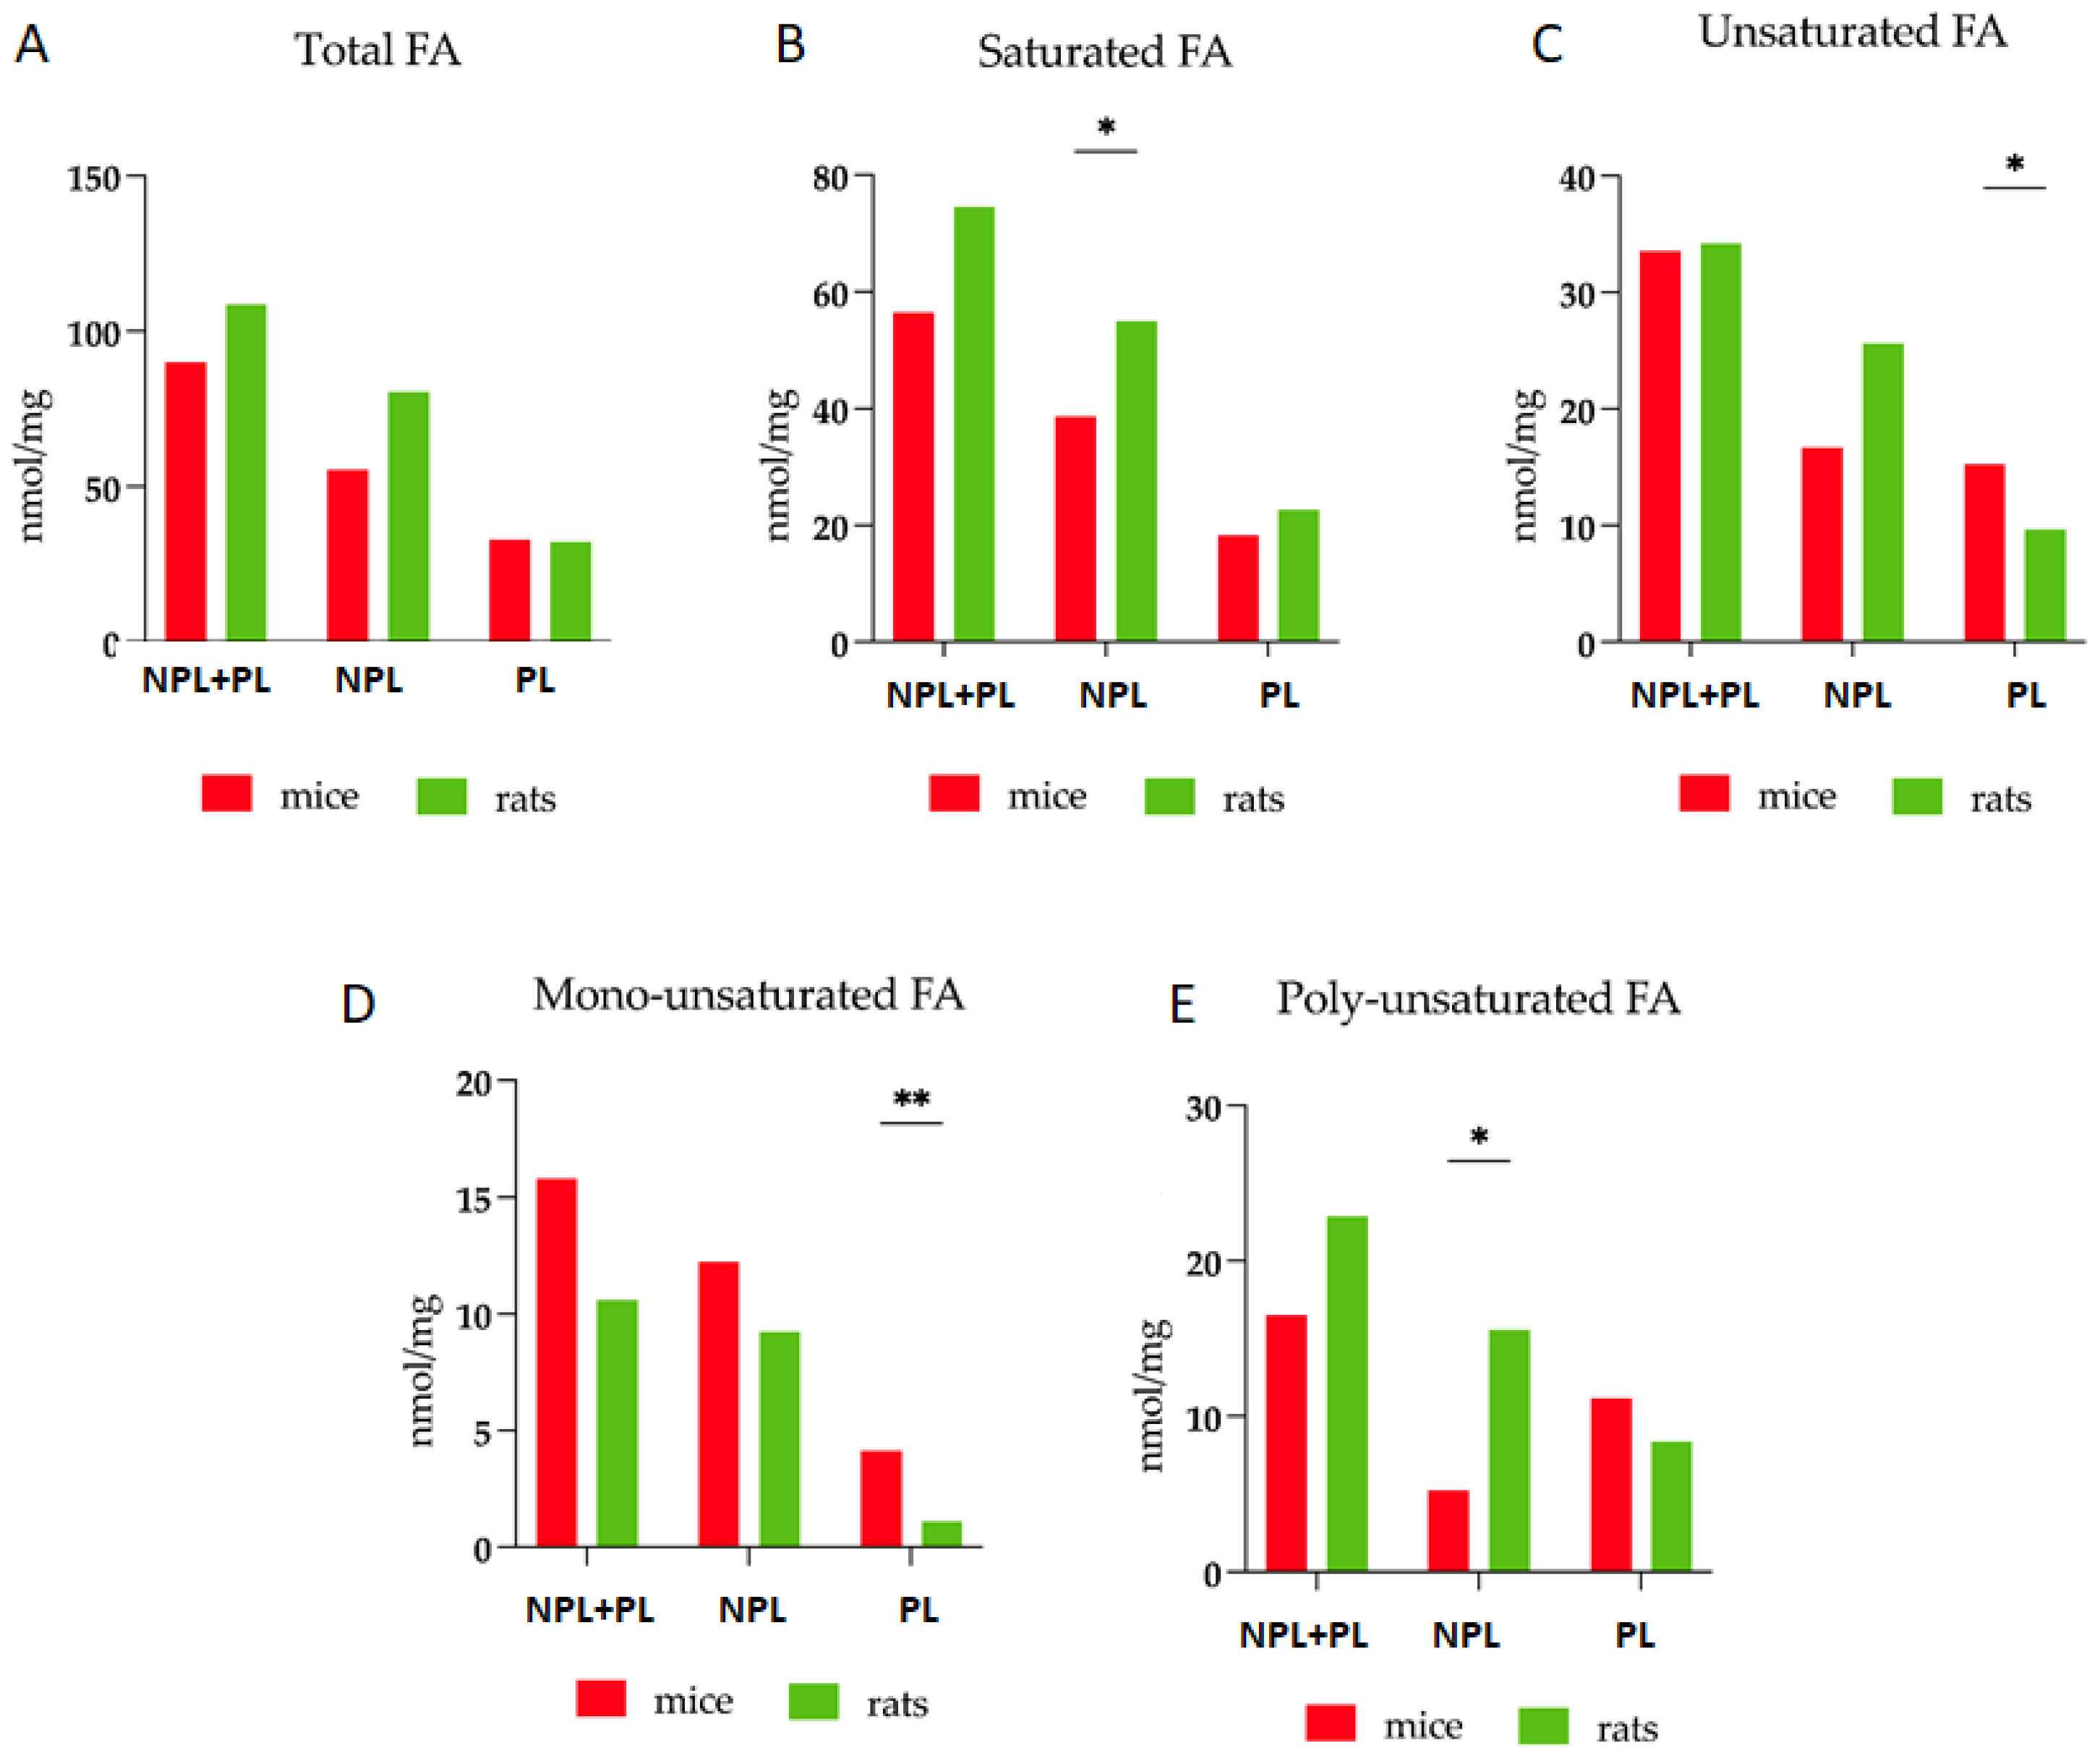
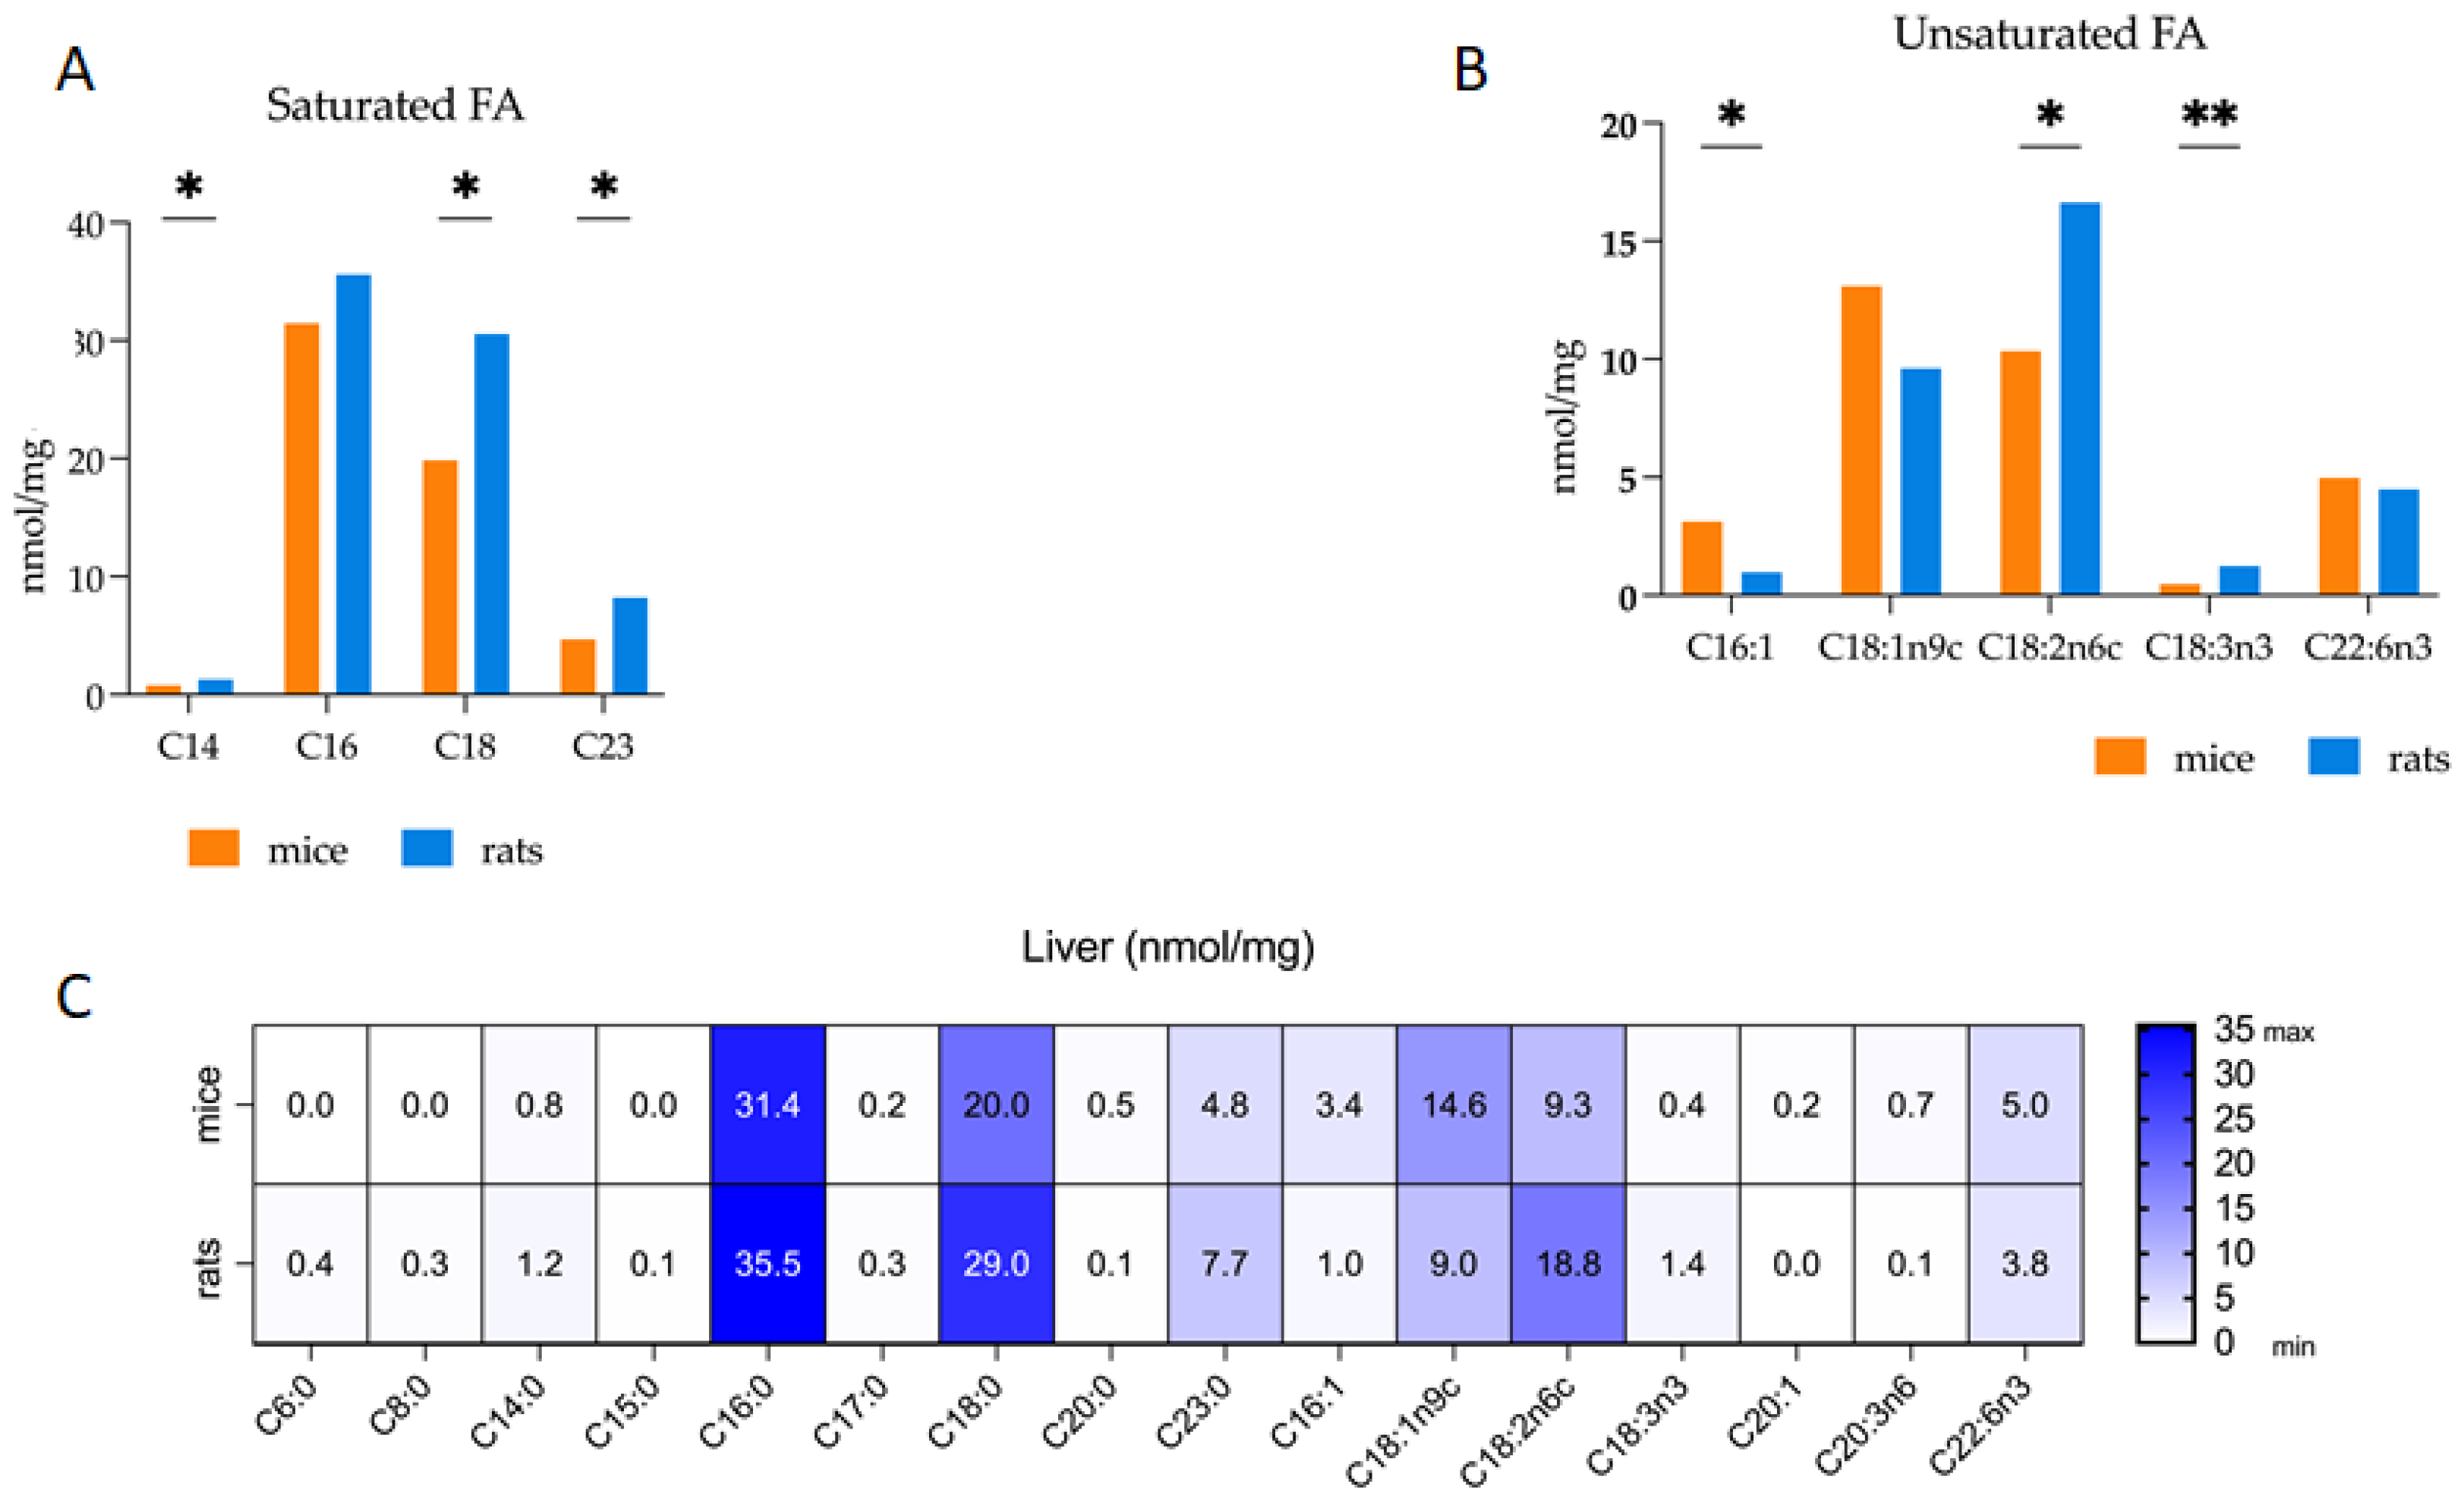
3.2. Comparative Analysis of Fatty Acid Profiles in Liver: Delineating Species-Specific Differences in Polar and Non-Polar Lipid Fractions between Mice and Rats

For Total FA, the NPL + PL, NPL, and PL lipids fractions did not show statistically significant differences between mice and rats (Figure 3A, Table 3). The NPL lipid fraction levels of Saturated FA were significantly higher in rats’ liver tissue compared to mice (Figure 3B). Comparison of the selected saturated FA (myristic acid—C14:0, palmitic acid—C16:0, stearic acid—C18:0, tricosanoic acid—C23:0) in the liver of mice and rats revealed statistically higher levels of C14:0, C18:0, and C23:0 in rats liver (Figure 4A). There is a significant increase in the levels of UFA derived from PL fractions of the liver tissue in mice compared to rats (Figure 3C). For PL fractions, mice demonstrated significantly higher levels of MUFAs than rats (Figure 3D). The PUFA content in NPL fractions was two-fold higher in rats than mice (Figure 3E). The analysis of unsaturated fatty acid levels (particularly: palmitoleic acid—C16:1, oleic acid—C18:1n9c, linoleic acid—C18:2n6c, linolenic acid—C18:3n3, cis-4,7,10,13,16,19-docosahexaenoic acid—C22:6n3) in the liver tissues of both mice and rats showed that rats had higher levels of C18:2n6c and C18:3n3 than mice, and mice have a higher level of C16:1 compared to rats (Figure 4B).

4. Discussion

In our study, the overall quantity of muscle total FAs derived from PL is greater in mice compared to rats. This distinction is also evident when examining other categories of fatty acids, including SFAs and UFAs. Particularly within the UFAs derived from PL, only the skeletal muscles of mice exhibit higher levels of MUFAs in comparison to rats, while both species exhibit similar levels of PUFAs. Differences between species in the content of fatty acids derived from PL are also visible at the level of the liver. The total amount of UFAs was higher in mice; however, statistically significant differences were only observed for MUFAs.
Polar lipids play a critical role in biological membranes and are essential for various cellular processes, including maintenance of cell integrity, control of the molecules passage in and out of cells, and facilitation of the cell communication [19,20]. Despite the lack of differences between species in the total PUFAs content in muscle and liver derived from PL, significant inter-species differences were noted in the concentration of FAs derived from NPL. One of the primary functions of NPL is to serve as an efficient long-term energy storage molecule. Lipid droplets serve to prevent the harmful effects of unesterified fatty acids and offer a lipid reserve that can be readily tapped into to meet cellular demands in various metabolic and physiological conditions. Precise regulation of lipid droplet formation and the release of neutral lipids in terms of timing and location is crucial for directing lipid intermediates to their respective cellular destinations and ensuring cellular balance is upheld. Recent study suggests that non-polar lipids, particularly certain lipid species such as ceramides, may play a role in metabolic signaling and regulation [21]. We suggest that this lipid fraction primarily served as the muscle reservoir for analyzed PUFA and MUFA, the concentrations of which exhibited significant differences among the examined animal groups. Analysis of selected PUFAs in the muscle tissues of mice and rats revealed elevated concentrations of docosahexaenoic acid (DHA; C22:6n3), linoleic acid (LA; 18:2n6), and alfa-linolenic acid (ALA; 18:3n3) in mice. In contrast, the levels of liver UFAs, specifically those derived from NPL sources, were found to be higher in rats than in mice, particularly in the case of LA and ALA.
PUFAs n-3 are renowned for their ability to alleviate inflammation and provide therapeutic benefits for conditions marked by persistent inflammation and regulate cellular function by modulating signaling pathways and membrane proteins [22,23]. ALA, EPA (eicosapentaenoic acid), and DHA represent the principal dietary sources of n-3 polyunsaturated fatty acids [24]. ALA is classified as an essential fatty acid due to its inability to be endogenously synthesized, necessitating its acquisition through dietary intake. Our research further demonstrated the tendency to a greater presence of ALA in the muscles of mice as opposed to rats. Given that ALA serves as an exogenous precursor to DHA and EPA, acquired through dietary intake, and considering that all animals in our experiment were maintained on identical diets, the variances observed could potentially be attributed to variations in ALA absorption and distribution levels, which could have contributed to the significantly higher DHA levels recorded in mice. Our findings imply significant variances in fatty acid metabolism between mice and rats muscle and liver, potentially encompassing enzymatic activities such as delta-6 desaturase (D6D), elongase, and delta-5 desaturase (D5D), enzymes which are crucial for omega-3 and omega-6 fatty acids metabolism [25]. The aforementioned hypothesis finds support in our data showing elevated levels of LA in mouse muscles relative to rats. This disparity does not persist at the level of eicosatrienoic acid (DGLA; C20:3n6), a metabolite produced through enzymatic transformations facilitated by D6D and elongase, this may indicate their different activity in both tested animals. While our study did not assess the concentrations of EPA and arachidonic acid (AA), important components in elucidating the interplay between pro-inflammatory and anti-inflammatory factors, our findings align with existing data. They substantiate observations derived from comprehensive lipidome analyses of mice and rats organs, underscoring the discernible dissimilarities among the tested animal cohorts [5].
Likewise, in the case of MUFAs, higher levels of oleic acid (OA; C18:1) were observed in the muscle tissues of mice in comparison to rats. OA is biosynthesized through dietary intake as well as endogenous synthesis. Within the human diet, OA stands as the predominant MUFA [26]. Endogenously, it emerges as the primary monounsaturated omega-9 fatty acid, synthesized predominantly by stearoyl-CoA desaturase 1 (SCD1). This enzymatic process involves the conversion of stearic acid (SA; C18:0) to oleic acid through D9 desaturation catalyzed by SCD1 [27]. The main function of OA is an energy molecule and an element of cell membranes. Moreover, since the identification of membrane receptors for FFAs, new cellular functions have been attributed to it [28]. One of its most characteristic effects is its antioxidant capacity, because it can directly regulate both the synthesis and activities of antioxidant enzymes [29]. Considering that the SA levels in mice and rats maintained on identical dietary regimens remained comparable, disparities observed in OA levels, similarly to ALA, could potentially stem from variations in SCD1 activity, and/or absorption and distribution levels of both SA and OA. This hypothesis may be supported by the fact that the enzymatic function of SCD1 contributes to the lipogenesis of palmitoleic acid (PA; C16:1), which exhibited significantly greater levels in mice muscle and liver tissue compared to rats.
Different levels of FAs in the same organs of the tested animals may significantly differentiate the results obtained in studies of oxidative processes. An interesting example is DHA, the most susceptible to peroxidation fatty acid, 320 times more prone to peroxidation compared to OA and 8 times more susceptible than the LA [4,30]. It is important to note whether there exists a particular fatty acids content pattern in selected organs, with species-specific characteristics that render them more susceptible to peroxidation than others. The mechanisms by which oxidative stress induces lipotoxicity remain incompletely elucidated. Thus far, the predominant observations regarding lipotoxicity in cells have primarily implicated apoptosis as the principal mechanism of cell death [31,32,33]. Nevertheless, a novel mode of controlled cellular death has been elucidated more recently, termed ferroptosis [34]. This distinctive cellular death process entails the formation of hydroperoxides within the PUFA side chains of membrane lipids, facilitated by reactive oxygen species (ROS) and iron dependency [35,36]. This mechanism affects the cellular membranes’ integrity and eventually executes ferroptosis [37]. Multiple scientific evidence points to the fact that a higher content of exogenous PUFA increases the sensitivity of cells to ferroptosis, whereas increased MUFA content acts against the mechanisms triggering ferroptotic cell death [38].
In this study, we showed a significant difference in the proportion of liver SFAs derived from NL, where in rat liver their levels were significantly higher compared to mice. In addition, rat liver also exhibited higher concentrations of some SFAs, particularly myristic acid (C:14), stearic acid (C:18), and tricosanoic acid (C:23), when compared to mice liver. The results of our study are consistent with others’ studies, that indicate significant interspecies differences as well as in inter-organ variations in the composition of fatty acids [4,10,13,39,40]. Significantly higher levels of SFAs derived from NPL in the liver of rats may indicate a greater susceptibility to induction of lipotoxicity or NAFLD (non-alcoholic fatty liver disease). Saturated and unsaturated fatty acids exhibit notable differences in their respective impacts on lipotoxicity. Prior investigations conducted in Chinese hamster ovary cells, cardiac myocytes, pancreatic β-cells, breast cancer cell lines, and hematopoietic precursor cell lines collectively propose that the phenomenon of lipotoxicity, resulting from the buildup of long-chain fatty acids, is either selective to or exacerbated by saturated fatty acids [41,42,43,44].
Our findings are relevant for studies focusing on lipid metabolism and its implications in diseases such as diabetes and metabolic disorders studied in mice or rats models. The significant difference between mice and rats in the FAs derived from NPL and PL fractions of skeletal muscle and liver indicated the species-specific metabolic characteristics. We suggest that the differences we described in the presented article might affect how skeletal muscle and liver responds to metabolic stress, exercise, and diet, impacting overall energy metabolism and possibly disease susceptibility or resilience.

5. Conclusions

There are significant differences between rats and mice in lipid metabolism. This study highlights the critical need to consider FAs distribution nuances when selecting appropriate animal models for research in lipid metabolism and associated diseases, ensuring the validity and applicability of experimental outcomes in the broader context of health and disease.

Author Contributions

M.K. contributed to the project design, data collection, analysis, and manuscript writing. D.G.d.C. contributed to the project design, data analysis, interpretation, and manuscript writing. P.Ł. contributed to the project design. T.P. contributed to the data collection. H.J.-S. contributed to the manuscript writing. T.S. contributed to the analysis and manuscript writing. All authors have read and agreed to the published version of the manuscript.

Funding

This research received no external funding.

Institutional Review Board Statement

Animal care and handling were performed following the principles of the 3Rs (Replacement, Reduction, and Refinement), and all experimental procedures received the approval from the Local Ethical Committee for Experiments on Animals at the Medical University of Silesia in Katowice (No.66/2022).

Informed Consent Statement

Not applicable.

Data Availability Statement

The raw data supporting the conclusions of this article will be made available by the authors on request.

Conflicts of Interest

The authors declare no conflicts of interest.

References

  1. Nagao, K.; Yanagita, T. Bioactive Lipids in Metabolic Syndrome. Prog. Lipid Res. 2008, 47, 127–146. [Google Scholar] [CrossRef]
  2. Nilsson, S.; Helou, K.; Walentinsson, A.; Szpirer, C.; Nerman, O.; Ståhl, F. Rat-Mouse and Rat-Human Comparative Maps Based on Gene Homology and High-Resolution Zoo-FISH. Genomics 2001, 74, 287–298. [Google Scholar] [CrossRef]
  3. Whelan, J.; Whelan, J. Conversion of Dietary Polyunsaturated Fats between Humans and Rodents: A Review of Allometric Scaling Models. Prostaglandins Leukot. Essent. Fat. Acids 2020, 158, 102094. [Google Scholar] [CrossRef]
  4. Hulbert, A.J.; Faulks, S.C.; Buffenstein, R. Oxidation-Resistant Membrane Phospholipids Can Explain Longevity Differences among the Longest-Living Rodents and Similarly-Sized Mice. J. Gerontol. Ser. A Biol. Sci. Med. Sci. 2006, 61, 1009–1018. [Google Scholar] [CrossRef]
  5. Xu, L.; Schmitt, M.V.; Ruan, H.; Jiao, Y.; Wang, X.; Wang, Y.; Yang, T.; Lienau, P.; Reichel, A.; Liu, X. Systematic Analysis of the Whole-Body Tissue Distribution and Fatty Acid Compositions of Membrane Lipids in CD1 and NMRI Mice and Wistar Rats. Int. J. Anal. Chem. 2020, 2020, 8819437. [Google Scholar] [CrossRef]
  6. Krümmel, B.; von Hanstein, A.S.; Plötz, T.; Lenzen, S.; Mehmeti, I. Differential Effects of Saturated and Unsaturated Free Fatty Acids on Ferroptosis in Rat β-Cells. J. Nutr. Biochem. 2022, 106, 109013. [Google Scholar] [CrossRef]
  7. Avela, H.F.; Sirén, H. Advances in Lipidomics. Clin. Chim. Acta 2020, 510, 123–141. [Google Scholar] [CrossRef]
  8. Briggs, M.A.; Petersen, K.S.; Kris-Etherton, P.M. Saturated Fatty Acids and Cardiovascular Disease: Replacements for Saturated Fat to Reduce Cardiovascular Risk. Healthcare 2017, 5, 29. [Google Scholar] [CrossRef]
  9. Lunn, J.; Theobald, H.E. The Health Effects of Dietary Unsaturated Fatty Acids. Nutr. Bull. 2006, 31, 178–224. [Google Scholar] [CrossRef]
  10. Barelli, H.; Antonny, B. Lipid Unsaturation and Organelle Dynamics. Curr. Opin. Cell Biol. 2016, 41, 25–32. [Google Scholar] [CrossRef] [PubMed]
  11. Kapoor, B.; Kapoor, D.; Gautam, S.; Singh, R.; Bhardwaj, S. Dietary Polyunsaturated Fatty Acids (PUFAs): Uses and Potential Health Benefits. Curr. Nutr. Rep. 2021, 10, 232–242. [Google Scholar] [CrossRef]
  12. Surma, M.A.; Gerl, M.J.; Klose, C.; Simons, K. Mouse Lipidomics Reveals Inherent Flexibility of a Mammalian Lipidome. Sci. Rep. 2021, 11, 19364. [Google Scholar] [CrossRef]
  13. Pradas, I.; Huynh, K.; Cabré, R.; Ayala, V.; Meikle, P.J.; Jové, M.; Pamplona, R. Lipidomics Reveals a Tissue-Specific Fingerprint. Front. Physiol. 2018, 9, 387781. [Google Scholar] [CrossRef]
  14. Sul, H.S.; Wang, D. Nutritional And Hormonal Regulation Of Enzymes In Fat Synthesis: Studies of Fatty Acid Synthase and Mitochondrial Glycerol-3-Phosphate Acyltransferase Gene Transcription. Annu. Rev. Nutr. 1998, 18, 331–351. [Google Scholar] [CrossRef]
  15. Postic, C.; Dentin, R.; Girard, J. Role of the Liver in the Control of Carbohydrate and Lipid Homeostasis. Diabetes Metab. 2004, 30, 398–408. [Google Scholar] [CrossRef]
  16. Guo, X.; Xu, K.; Zhang, J.; Li, H.; Zhang, W.; Wang, H.; Lange, A.J.; Chen, Y.E.; Huo, Y.; Wu, C. Involvement of Inducible 6-Phosphofructo-2-Kinase in the Anti-Diabetic Effect of Peroxisome Proliferator-Activated Receptor Gamma Activation in Mice. J. Biol. Chem. 2010, 285, 23711–23720. [Google Scholar] [CrossRef]
  17. Christie, W. Isolation, Separation, Identification and Structural Analysis of Lipids. In Lipid Analysis, 3rd ed.; Oily Press: Mondovi, WI, USA, 2003. [Google Scholar]
  18. Christie, W. High-Performance Liquid Chromatography & Lipids: A Practical Guide; Pergamon: Oxford, UK, 1987; pp. 183–208. [Google Scholar]
  19. Ötles, S.; Ozgoz, S. Health Effects of Dietary Fiber. Acta Sci. Pol. Technol. Aliment. 2014, 13, 191–202. [Google Scholar] [CrossRef]
  20. Oshida, K.; Shimizu, T.; Takase, M.; Tamura, Y.; Shimizu, T.; Yamashiro, Y. Effects of Dietary Sphingomyelin on Central Nervous System Myelination in Developing Rats. Pediatr. Res. 2003, 53, 589–593. [Google Scholar] [CrossRef]
  21. Barbosa, A.D.; Siniossoglou, S. Function of Lipid Droplet-Organelle Interactions in Lipid Homeostasis. Biochim. Biophys. Acta-Mol. Cell Res. 2017, 1864, 1459–1468. [Google Scholar] [CrossRef] [PubMed]
  22. Albert, B.B.; Derraik, J.G.B.; Brennan, C.M.; Biggs, J.B.; Smith, G.C.; Garg, M.L.; Cameron-Smith, D.; Hofman, P.L.; Cutfield, W.S. Higher Omega-3 Index Is Associated with Increased Insulin Sensitivity and More Favourable Metabolic Profile in Middle-Aged Overweight Men. Sci. Rep. 2014, 4, 6697. [Google Scholar] [CrossRef] [PubMed]
  23. Singh, J.E. Dietary Sources of Omega-3 Fatty Acids Versus Omega-3 Fatty Acid Supplementation Effects on Cognition and Inflammation. Curr. Nutr. Rep. 2020, 9, 264–277. [Google Scholar] [CrossRef] [PubMed]
  24. Shahidi, F.; Ambigaipalan, P. Omega-3 Polyunsaturated Fatty Acids and Their Health Benefits. Annu. Rev. Food Sci. Technol. 2018, 9, 345–381. [Google Scholar] [CrossRef] [PubMed]
  25. Budd, J.M.; Hucik, B.; Wang, C.; King, A.N.; Sarr, O.; Nakamura, M.T.; Harasim-Symbor, E.; Chabowski, A.; Dyck, D.J.; Mutch, D.M. A Reduction of Skeletal Muscle DHA Content Does Not Result in Impaired Whole Body Glucose Tolerance or Skeletal Muscle Basal Insulin Signaling in Otherwise Healthy Mice. Am. J. Physiol. Endocrinol. Metab. 2023, 324, E241–E250. [Google Scholar] [CrossRef] [PubMed]
  26. Schwingshackl, L.; Hoffmann, G. Monounsaturated Fatty Acids and Risk of Cardiovascular Disease: Synopsis of the Evidence Available from Systematic Reviews and Meta-Analyses. Nutrients 2012, 4, 1989–2007. [Google Scholar] [CrossRef] [PubMed]
  27. Piccinin, E.; Cariello, M.; De Santis, S.; Ducheix, S.; Sabbà, C.; Ntambi, J.M.; Moschetta, A. Role of Oleic Acid in the Gut-Liver Axis: From Diet to the Regulation of Its Synthesis via Stearoyl-CoA Desaturase 1 (SCD1). Nutrients 2019, 11, 2283. [Google Scholar] [CrossRef]
  28. Hidalgo, M.A.; Carretta, M.D.; Burgos, R.A. Long Chain Fatty Acids as Modulators of Immune Cells Function: Contribution of FFA1 and FFA4 Receptors. Front. Physiol. 2021, 12, 668330. [Google Scholar] [CrossRef] [PubMed]
  29. Bhattacharjee, B.; Pal, P.K.; Chattopadhyay, A.; Bandyopadhyay, D. Oleic Acid Protects against Cadmium Induced Cardiac and Hepatic Tissue Injury in Male Wistar Rats: A Mechanistic Study. Life Sci. 2020, 244, 117324. [Google Scholar] [CrossRef] [PubMed]
  30. Das, U.N. “Cell Membrane Theory of Senescence” and the Role of Bioactive Lipids in Aging, and Aging Associated Diseases and Their Therapeutic Implications. Biomolecules 2021, 11, 241. [Google Scholar] [CrossRef]
  31. Eitel, K.; Staiger, H.; Brendel, M.D.; Brandhorst, D.; Bretzel, R.G.; Häring, H.U.; Kellerer, M. Different Role of Saturated and Unsaturated Fatty Acids in β-Cell Apoptosis. Biochem. Biophys. Res. Commun. 2002, 299, 853–856. [Google Scholar] [CrossRef]
  32. Welters, H.J.; Diakogiannaki, E.; Mordue, J.M.; Tadayyon, M.; Smith, S.A.; Morgan, N.G. Differential Protective Effects of Palmitoleic Acid and CAMP on Caspase Activation and Cell Viability in Pancreatic β-Cells Exposed to Palmitate. Apoptosis 2006, 11, 1231–1238. [Google Scholar] [CrossRef]
  33. Lupi, R.; Dotta, F.; Marselli, L.; Del Guerra, S.; Masini, M.; Santangelo, C.; Patané, G.; Boggi, U.; Piro, S.; Anello, M.; et al. Prolonged Exposure to Free Fatty Acids Has Cytostatic and Pro-Apoptotic Effects on Human Pancreatic Islets: Evidence That β-Cell Death Is Caspase Mediated, Partially Dependent on Ceramide Pathway, and Bcl-2 Regulated. Diabetes 2002, 51, 1437–1442. [Google Scholar] [CrossRef] [PubMed]
  34. Dixon, S.J.; Lemberg, K.M.; Lamprecht, M.R.; Skouta, R.; Zaitsev, E.M.; Gleason, C.E.; Patel, D.N.; Bauer, A.J.; Cantley, A.M.; Yang, W.S.; et al. Ferroptosis: An Iron-Dependent Form of Nonapoptotic Cell Death. Cell 2012, 149, 1060–1072. [Google Scholar] [CrossRef] [PubMed]
  35. Gaschler, M.M.; Stockwell, B.R. Lipid Peroxidation in Cell Death. Biochem. Biophys. Res. Commun. 2017, 482, 419–425. [Google Scholar] [CrossRef] [PubMed]
  36. Xie, Y.; Hou, W.; Song, X.; Yu, Y.; Huang, J.; Sun, X.; Kang, R.; Tang, D. Ferroptosis: Process and Function. Cell Death Differ. 2016, 23, 369–379. [Google Scholar] [CrossRef] [PubMed]
  37. Pope, L.E.; Dixon, S.J. Regulation of Ferroptosis by Lipid Metabolism. Trends Cell Biol. 2023, 33, 1077–1087. [Google Scholar] [CrossRef] [PubMed]
  38. Dixon, S.J.; Olzmann, J.A. The Cell Biology of Ferroptosis. Nat. Rev. Mol. Cell Biol. 2024. [Google Scholar] [CrossRef]
  39. Bergen, W.G.; Mersmann, H.J. Comparative Aspects of Lipid Metabolism: Impact on Contemporary Research and Use of Animal Models. J. Nutr. 2005, 135, 2499–2502. [Google Scholar] [CrossRef]
  40. Aviram, R.; Manella, G.; Kopelman, N.; Neufeld-Cohen, A.; Zwighaft, Z.; Elimelech, M.; Adamovich, Y.; Golik, M.; Wang, C.; Han, X.; et al. Lipidomics Analyses Reveal Temporal and Spatial Lipid Organization and Uncover Daily Oscillations in Intracellular Organelles. Mol. Cell 2016, 62, 636–648. [Google Scholar] [CrossRef] [PubMed]
  41. Hardy, S.; Langelier, Y.; Prentki, M. Oleate Activates Phosphatidylinositol 3-Kinase and Promotes Proliferation and Reduces Apoptosis of MDA-MB-231 Breast Cancer Cells, Whereas Palmitate Has Opposite Effects. Cancer Res. 2000, 60, 6353–6358. [Google Scholar]
  42. Listenberger, L.L.; Ory, D.S.; Schaffer, J.E. Palmitate-Induced Apoptosis Can Occur through a Ceramide-Independent Pathway. J. Biol. Chem. 2001, 276, 14890–14895. [Google Scholar] [CrossRef]
  43. De Vries, J.E.; Vork, M.M.; Roemen, T.H.M.; De Jong, Y.F.; Cleutjens, J.P.M.; Van Der Vusse, G.J.; Van Bilsen, M. Saturated but Not Mono-Unsaturated Fatty Acids Induce Apoptotic Cell Death in Neonatal Rat Ventricular Myocytes. J. Lipid Res. 1997, 38, 1384–1394. [Google Scholar] [CrossRef] [PubMed]
  44. Maedler, K.; Spinas, G.A.; Dyntar, D.; Moritz, W.; Kaiser, N.; Donath, M.Y. Distinct effects of saturated and monounsaturated Fatty Acids on β-Cell Turnover and Function. Diabetes 2021, 50, 69–76. [Google Scholar] [CrossRef] [PubMed]
Figure 1. Comparative analysis of fatty acid profiles in skeletal muscle of mice and rats. Content of fatty acids (FA) derived from polar (PL) and non-polar (NPL) lipids in skeletal muscle of mice and rats. All of the values expressed as median interquartile range; multiple Mann–Whitney test; n = 6 per animal group; * p < 0.05.
Applsci 14 03192 g001
Figure 2. The comparison of selected fatty acids concentrations from mice and rats skeletal muscle samples. (A,B): All of the values expressed as median interquartile range; * p < 0.05, ** p < 0.01. Multiple Mann–Whitney test; n = 6 per animal group. (C): Heat map. Fatty acid level expressed as median interquartile range. Caproic Acid (C6:0); Caprylic Acid (C8:0); Undecanoic Acid (C11:0); Lauric Acid (C12:0); Myristic Acid (C14:0); Pentadecenoic Acid (C15:0); Palmitic Acid (C16:0); Palmitoleic Acid (C16:1); Heptadecenoic Acid (C17:0); cis-10-Heptadecenoic Acid (C17:1); Stearic Acid (C18:0); Oleic Acid (C18:1n9c); Linoleic Acid (C18:2n6c); Arachidic Acid (C20:0); cis-11-Eicosanoic Acid (C20:1); Linolenic Acid (C18:3n3); cis-8,11,14-Eicosatrienoic Acid (C20:3n6); Tricosanoic Acid (C23:0); cis-4,7,10,13,16,19-Docosahexaenoic Acid (C22:6n3).
Applsci 14 03192 g002
Figure 3. Comparative analysis of fatty acid profiles in liver of mice and rats. Content of fatty acids (FA) derived from polar (PL) and non-polar (NPL) lipids in liver of mice and rats. All of the values expressed as median with interquartile range; Multiple Mann–Whitney test; n = 6 per animal group; * p < 0.05, ** p < 0.01.
Applsci 14 03192 g003
Figure 4. The comparison of selected fatty acids concentrations from mice and rat liver. (A,B): All of the values expressed as median ± quartile range; * p < 0.05, ** p < 0.01. Multiple Mann–Whitney test; n = 6 per animal group. (C): Heat map. Fatty acid level expressed as median interquartile range. Caproic Acid (C6:0); Caprylic Acid (C8:0); Myristic Acid (C14:0); Pentadecenoic Acid (C15:0); Palmitic Acid (C16:0); Palmitoleic Acid (C16:1); Heptadecenoic Acid (C17:0); cis-10-Stearic Acid (C18:0); Oleic Acid (C18:1n9c); Linoleic Acid (C18:2n6c); Arachidic Acid (C20:0); cis-11-Eicosanoic Acid (C20:1); Linolenic Acid (C18:3n3); cis-8,11,14-Eicosatrienoic Acid (C20:3n6); Tricosanoic Acid (C23:0); cis-4,7,10,13,16,19-Docosahexaenoic Acid (C22:6n3).
Applsci 14 03192 g004
Table 1. Regular chow rodent diet. Labofeed (Poland) B standard. Metabolic energy content 11.5 MJ.
MacronutrientsDoseMineralsDoseVitaminsDoseAmino AcidsDose
Raw protein175.0 gCalcium9.5 gVitamin A12,000.0 IULysine9.0 g
Raw fat2.8 gTotal phosphorus6.5 gVitamin D3800.0 IUMethionine + Cyst.6.3 g
Crude fiber70.0 gMagnesium3.0 gVitamin E78.0 mgTryptophan2.0 g
Starch330.0 gPotassium7.5 gVitamin K32.4 mgThreonine6.0 g
Ash57.0 gSodium1.9 gVitamin B18.0 mgIsoleucine6.0 g
Sulfur1.9 gVitamin B27.0 mgLeucine12.0 g
Iron144.0 mgVitamin B611.0 mgValine8.0 g
Manganese50.0 mgVitamin B1242.0 mcgHistidine4.0 g
Zinc50.0 mgPantothenic acid25.0 mgArginine10.0 g
Copper11.0 mgFolic acid2.0 mgPhenylalanine7.0 g
Iodine0.2 mgBiotin0.3 mgTyrosine5.0 g
Selenium0.4 mgNicotinic acid94.0 mgBetaine17.0 g
Choline1900.0 mg
Table 2. Median (M) and quartile deviation (Q25 and Q75; 25th and 75th percentiles, respectively) comparison of fatty acid content derived from muscles of mice and rats.
Muscle FAMiceRat
nmol/mg Q25–Q75nmol/mgQ25–Q75
TFA83.5 *9.9–31.951.7 *2.6–7.7
PL12.5 *0.8–1.810.7 *2.1–0.3
NPL67.87.1–33.341.02.8–7.0
SFA46.26.6–12.340.92.8–4.4
UFA38.5 *6.7–7.711.0 *0.3–0.2
MUFA22.3 *2.6–7.84.1 *0.4–0.4
PUFA15.3 *3.2–2.46.9 *0.5–0.5
NL/PL5.11.5–2.04.00.3–0.3
UFA/TFA0.46 *0.03–0.020.21 *0.02–0.02
PUFA/UFA0.390.04–0.050.610.03–0.04
TFA—total fatty acids; PL—fatty acids derived from polar lipids; NPL—fatty acids derived from non-polar lipids; SFA—saturated fatty acids; UFA—unsaturated fatty acids; MUFA—monounsaturated fatty acids; PUFA—polyunsaturated fatty acids; NL/PL—proportion of fatty acids derived from non-polar and polar lipids; UFA/TFA—ratio of unsaturated fatty acids in the total volume of fatty acids; PUFA/UFA—polyunsaturated fatty acids in the total volume of unsaturated fatty acids; PUFA/TFA—polyunsaturated fatty acids in the total number of identified ones; MUFA/UFA—monounsaturated fatty acids in the total volume of unsaturated fatty acids; Multiple Mann–Whitney test; n = 6 per animal group; * p < 0.05.
Table 3. Median (M) and quartile deviation (Q25 and Q75; 25th and 75th percentiles, respectively) comparison of fatty acid content derived from liver of mice and rats.
Liver FAMiceRat
nmol/mg Q25–Q75nmol/mg Q25–Q75
TFA90.010.5–20.5108.720.1–28.6
PL33.14.3–5.032.48.4–2.1
NPL55.53.9–10.580.630.0–22.2
SFA56.42.1–9.174.67.1–16.5
UFA33.58.4–11.434.213.0–12.1
MUFA15.81.6–6.510.65.3–2.8
PUFA16.55.6–1.322.97.1–11. 5
NL/PL1.450.10–1.293.160.74–0.29
UFA/TFA0.370.06–0.030.310.07–0.04
PUFA/UFA0.51 *0.07–0.050.72 *0.06–0.02
Abbreviations: TFA—total fatty acids; PL—total fatty acids derived from polar lipids; NPL—total fatty acids derived from non-polar lipids; SFA—saturated fatty acids; UFA—unsaturated fatty acids; MUFA—monounsaturated fatty acids; PUFA—polyunsaturated fatty acids; NL/PL—proportion of fatty acids derived from non-polar and polar lipids; UFA/TFA—ratio of unsaturated fatty acids in the total volume of fatty acids; PUFA/UFA—polyunsaturated fatty acids in the total volume of unsaturated fatty acids; PUFA/TFA—polyunsaturated fatty acids in the total number of identified ones; MUFA/UFA—monounsaturated fatty acids in the total volume of unsaturated fatty acids; all of the values expressed as median ± quartile range; Multiple Mann–Whitney test; n = 6 per animal group; p < 0.05 *—significant differences.
Disclaimer/Publisher’s Note: The statements, opinions and data contained in all publications are solely those of the individual author(s) and contributor(s) and not of MDPI and/or the editor(s). MDPI and/or the editor(s) disclaim responsibility for any injury to people or property resulting from any ideas, methods, instructions or products referred to in the content.

