Article

Utilizing Cost-Effective Determination Techniques to Authenticate Cosmetics

1
National Institute for Food and Drug Control, Beijing 100050, China
2
Key Laboratory of Cosmetic Research and Evaluation of the National Medical Products Administration, Beijing 100050, China
*
Authors to whom correspondence should be addressed.
These authors contributed equally to this work.
Appl. Sci. 2024, 14(8), 3198; https://doi.org/10.3390/app14083198
Submission received: 11 March 2024 / Revised: 4 April 2024 / Accepted: 9 April 2024 / Published: 10 April 2024
(This article belongs to the Special Issue Analytical Chemistry: Techniques and Applications)

Abstract

:

Featured Application

This research developed three cost-effective testing techniques to quickly and efficiently detect suspected samples to determine the authenticity of cosmetics utilizing MALDI-TOF, GC-MS and mid-IR instruments.

Abstract

(1) Background: The adulteration of cosmetics has become increasingly common, which seriously harms ordinary consumers. The counterfeit cosmetics pointed out in this study mainly refer to imitating genuine products in terms of ingredients and packaging. Ordinary consumers cannot distinguish their authenticity solely based on appearance and daily use. If there is a convenient and low-cost detection method that can expose this phenomenon of adulteration, it will be able to expose adulteration and protect the interests of consumers quickly and conveniently. (2) Methods: MALDI-TOF, GC-MS, and mid-IR were used to develop low-cost and fast methods for identifying the authenticity of cosmetics. Five types of liquid and five types of emulsion cosmetics purchased from container and wholesale markets were analyzed using the three instruments mentioned above, and their spectra and acquired data were carefully compared to determine their authenticity. MALDI-TOF and GC-MS directly tested cosmetic samples, and mid-IR spectroscopy tested the ink on the outer packaging of cosmetics. (3) Results: The data procured by MALDI-TOF can provide a representation of its product attributes; two liquid samples and one paste sample demonstrated inconsistent test outcomes with the corresponding reference samples, suggesting contamination. The results of GC-MS can illustrate the substance count within cosmetic samples; the comparison outcomes of the total ion chromatogram indicate that one paste sample was a counterfeit. The results attained from mid-IR were consonant with those acquired from the MALDI-TOF analysis and GC-MS. (4) Conclusions: These three newly developed techniques can all be effectively utilized for the task of detecting cosmetic adulteration and quality control in the manufacturing process. With regard to user-friendliness and rapidity, both MALDI-TOF and mid-IR outperform GC-MS, demonstrating consistently superior levels of detection. Conversely, GC-MS has unique advantages in identifying emulsion cosmetics containing a high amount of weak polarity and volatile substances. Consequently, these corresponding methods could serve as efficient and cost-effective ways to detect authenticity issues in real-world cosmetic products.

1. Introduction

As an essential element of product evaluations and inspections on a daily basis, the authenticity identification of products serves as a crucial testing field for economic and social security, fostering equitable trade and upholding consumer interests [1]. Particularly in the realm of daily consumer goods such as food and cosmetics, due to the corresponding motivation, it is not uncommon to encounter low-quality items replacing high-quality ones, swaps of origins or original products, substitution, etc., all aimed at maximizing mutual benefits during transactions. Cosmetics refers to chemical industrial products or fine chemical products that are applied or sprayed, or other similar methods, to any part of the human body surface, such as skin, hair, toenails, lips, teeth, etc., in order to achieve cleaning, maintenance, beauty, modification, and change of appearance, or to correct human odor and maintain good condition. In recent years, with the escalation of the worldwide cosmetics trade, it ascended to a level of nearly USD 100 billion in 2022, serving as one of the select industries that did not experience a decline due to the influence of the global epidemic. Adjusting to alterations in users’ consumption principles, the sales and use of cosmetics have cultivated more market segments and user experience requirements [2]. Remote sales, digital experience customization, etc., have seen significant advancements. The original medical beauty companion, a personalized makeup experience, has established a more dependable consumption pipeline [3,4]. The authenticity of cosmetics hinges on the intrinsic properties of the utilization of cosmetic products and the specificities of product transformation. With the advent of more social sales and usage ecosystem of cosmetic products, multiple aspects of the authenticity of cosmetics require identification. This is primarily manifested in the unusual supply channel products, product duplicity, the utilization of substandard raw materials of products, the adulteration of formulas, the exclusive products of closed sales channels, etc. [5]. From the viewpoint of safety oversight, that is, from the perspective of comprehensive protection of typical consumers, the emergence of novel sales strategies or novel customized products has presented new challenges to the authenticity of cosmetics. For instance, the direct sale and use of products, purportedly regular manufacturer knockoffs or disguised as regular manufacturers, occurs frequently, often overlooked due to a focus solely on safety or monitoring or supervision that does not pose health risks in the immediate term, leading to fraud within formal trade, which is ultimately detrimental to the industry, and users are deceived [6,7].
Since the authenticity of cosmetics eliminates adulteration, the addition of chemical substances, and other facets that potentially pose risks to health and safety, there are additional authenticity aspects such as counterfeiting, formula alterations, substitution of substandard raw materials, processing modifications, etc. [8]. Given cosmetic products’ formula-based nature, their main scrutiny focuses on safety indicators, such as hazards, prohibited substances, heavy metals, solvents, etc. These tests do not differentiate among products through these factors. Furthermore, economically speaking, due to the final format being a product consumption experience, consumers themselves may not perceive the quality of the use of their products due to the authenticity of the cosmetics alone. Therefore, unless it is a specific endeavor, the authenticity test itself cannot significantly increase the cost of cosmetics in the daily economic context [9]. This suggests that the quality of cosmetic products can genuinely be reflected not just by the product production itself but also by its societal aspect. Hence, from the viewpoint of inspection economics, considering the standing of cosmetic products, its authenticity detection should be viewed in light of holistic assessment, fingerprint detection, and non-target screening [10,11].
Currently, many nations employ a filing system to oversee cosmetics. Companies are accountable for cosmetic quality and safety. Regulatory focus mainly lies on restricted items like heavy metals and toxins, with no explicit rules for identifying authenticity. Developing methods to authenticate cosmetics is incredibly significant for upholding consumer and company interests. This study employs three detection methods, which include matrix-assisted laser desorption ionization time-of-flight mass spectrometry (MALDI-TOF) [12], gas chromatography mass spectrometry (GC-MS) [13], and mid-infrared (mid-IR) spectroscopy [14], for examination. Its economic advantages primarily manifest in simplified sample handling or absence thereof, comprehensive detection, and elimination of equipment. The expense of detection is significantly lower than 1% of that of traditional laboratory detection. The cost of its primary testing apparatus has also been directly diminished to under 10% of the original. Regarding the authenticity verification of cosmetics, from the perspective of sample analysis, the principal manifestation lies in the disparity of chemical composition of the formula, alteration of chemical composition, disparity of packaging, differing ink used on packaging, etc. The pertinent techniques primarily aim at the qualitative account of the outline of chemical substances found in the tested sample, and the authenticity distinction of cosmetics can also be discerned from the entire scenario. Due to formula discrepancies in most adulteration and the use of economical raw materials, the majority of differences are observed in packaging and packaging materials where authentic samples are difficult to procure or replicable formula compositions exist [15]. The purpose of this study is to develop methods which can efficiently address all aspects of authenticity identification of cosmetics as a formula product, serving as a simple and cost-effective screening to identify the authenticity issues of cosmetics in the practical realm.

2. Materials and Methods

2.1. Chemicals and Reagents

HPLC grade methanol, acetonitrile, and tetrahydrofuran were purchased from Merck. Dimethyl sulfoxide (DMSO) n-hexane, ethyl acetate, and acetone (all analytical grade) were purchased from Sinopharm group. Ultrapure water was obtained from a Milli-Q system. Research samples (30 liquid cosmetic products and 20 emulsion-based products) were procured from specialized cosmetics companies’ counters and wholesale markets.

2.2. Sample Grouping

Cosmetic samples were acquired from select cosmetics enterprises and wholesale markets, comprising 30 liquid cosmetics and 20 emulsion products. These cosmetics are originally from France, Germany, Switzerland, Japan, and China. The function of the liquid products was mainly for cleaning, and the cream samples were mainly care products. These samples were purchased from Beijing in October 2023. Two brands were considered high priced, while the remaining three were considered medium priced. In accordance with the sample details, 30 liquid cosmetics encompassed 5 diverse brands, each featuring 6 products. Two of them were procured from the mall counter (signifying genuine products) and were designated as the control group; these brands were labeled SL1-SL5. The other 20 products from the wholesale market (presumed to be adulteration) were identified as SL11-SL55. The 20 emulsion samples were also segmented into 5 groups based on separate brands; 10 of them procured from the mall counter were elected as a control group, labeled SC1-SC5. The remaining 10 from the wholesale market were designated as SC11-SC55 based on brand disparities.

2.3. MALDI-TOF Analysis

The utility of cosmetic ingredient analysis and authentication by MALDI-TOF has been identified by previous explorations [12,16]. Given the unique characteristics of cosmetics, an efficient analysis methodology was developed. Firstly, 0.1 mL or 0.1 g of uniform sample was taken and diluted with TBS buffer (laboratory-made, generally 10 mmol/L Tris containing 0.9% NaCl, and the pH was adjusted to 7.4 with 1 N HCl) at a 1:20 volume or mass ratio. Then, the suspension was sonicated for 20 min. Subsequently, it was refrigerated at 4 °C for an hour. The solution was centrifugated at 5000 rpm for 10 min to obtain the supernatant. Then, 10 g/L of 3-hydroxypyridinic acid solution (50% acetonitrile + 50% 0.1% TFA aqueous solution) was added into the corresponding sample solution in a 1:1 ratio to formulate a matrix sample solution.
The matrix sample solution of 2.5 μL was positioned onto the 96-well target plate, repeated twice for each sample point, and the target plate was heated until dry. Afterwards, this target plate was sent to MALDI-TOF mass spectrometry for subsequent analysis. The parameters were set as follows: the source voltage was 20 kV, laser frequency was 1 kHz, laser energy was 9 μJ, linear cationic mode was employed, the relative molecular mass scanning range was 100~1200 m/z, the scanning speed was 0.5 mm/s, and the sample analysis time was 40 s/hole. Spectral analysis was performed using QuanTOF 1.0 software.
Figure 1 shows the comparison of the MALDI-TOF mass spectra of two groups of samples from the same brand but different purchase locations. Minor differences could be displayed on the spectrum through comparison, and the percentage of differences could be obtained through subsequent statistical comparisons.

2.4. GC-MS Analysis

GC-MS is an instrument for the separation and identification of complex components [17,18], which has been widely used in the analysis of food and cosmetics [19,20]. There were universal pre-treatment methods for emulsion cosmetics; 0.1 g of uniform emulsion sample was placed in a centrifuge tube, and 5 mL acetonitrile was added to induce thorough vortexing and mixing. Ultrasonic extraction was performed for 10 min, and anhydrous magnesium sulfate was dehydrated and centrifuged at 10,000 r/min for 5 min. The supernatant was passed through a 0.22 µm filter membrane, and the filtrate was collected for subsequent analytical examination.
The GC-MS system was calibrated with acetonitrile solution of n-alkanes to determine the relative retention index, and then 1 μL of sample solution was injected into the instrument for analysis. The parameters were set as follows: the DB-5MS column was utilized for chromatographic separation with an inlet temperature of 280 °C and a split ratio of 20:1. The carrier gas was high-purity helium at a flow rate of 1 mL/min. The temperature rise procedure was 50 °C (3 min) −7 °C/min-100 °C (2 min) −10 °C/min-235 °C (2 min) −20 °C/min-280 °C. The parameters were as follows: a mass spectrum interface temperature of 280 °C, solvent delay time of 3.5 min, ion source temperature of 230 °C, EI ion source, positive ion scanning, and scanning range of 50–1000 m/z.
Figure 2 shows the TIC of emulsion cosmetics acquired by GC-MS. The differences mainly occurred in the part after the retention time of 45 min, and the percentage of differences still needed to be obtained by exporting the data to statistical software for further processing.

2.5. Mid-IR Analysis

Infrared spectroscopy was widely used in the field of food analysis [21,22]. Due to its convenient and easy-to-use characteristics, it was increasingly applied in the analysis of complex components such as cosmetics [14,23]. In this research, ink was scraped from the outer packaging of the sample and the outer shell of the inner vessel. The extracted sample was suspended in 2 mL DMSO, ultrasound was executed for 5 min, and 1 mL acetone was incorporated. Following vortex, centrifuge was carried out at 8000 RPM for 10 min, and the supernatant was taken for use. Before the test, the supernatant was dripped onto the salt window, the solvent volatilized, and the sample film was formed.
Each sample was divided into internal and external samples according to the sampling position. Using diamond attenuated total reflection attachment, the mid-infrared spectrum of samples was acquired with an FTIR spectrometer. Prior to spectrum acquisition, the air background scan must be undertaken initially, and the sample spectrum recorded only when the background spectrum was presented normally. When collecting the infrared spectrum of the sample, the reflection interface was cleaned with a small amount of DMSO and acetone to avoid cross-contamination. The detection was based on the atmospheric background with a resolution of 4 cm−1. The signal was superimposed 16 times each cycle, and the scanning wave number range was 4000–450 cm−1.
The mid-IR spectral differences of the ink on these packaging mainly ranged from 900 to 1600 cm−1. Figure 3 shows three groups of samples with significant differences. The degree of difference needed to be determined through subsequent statistical analysis.

3. Results

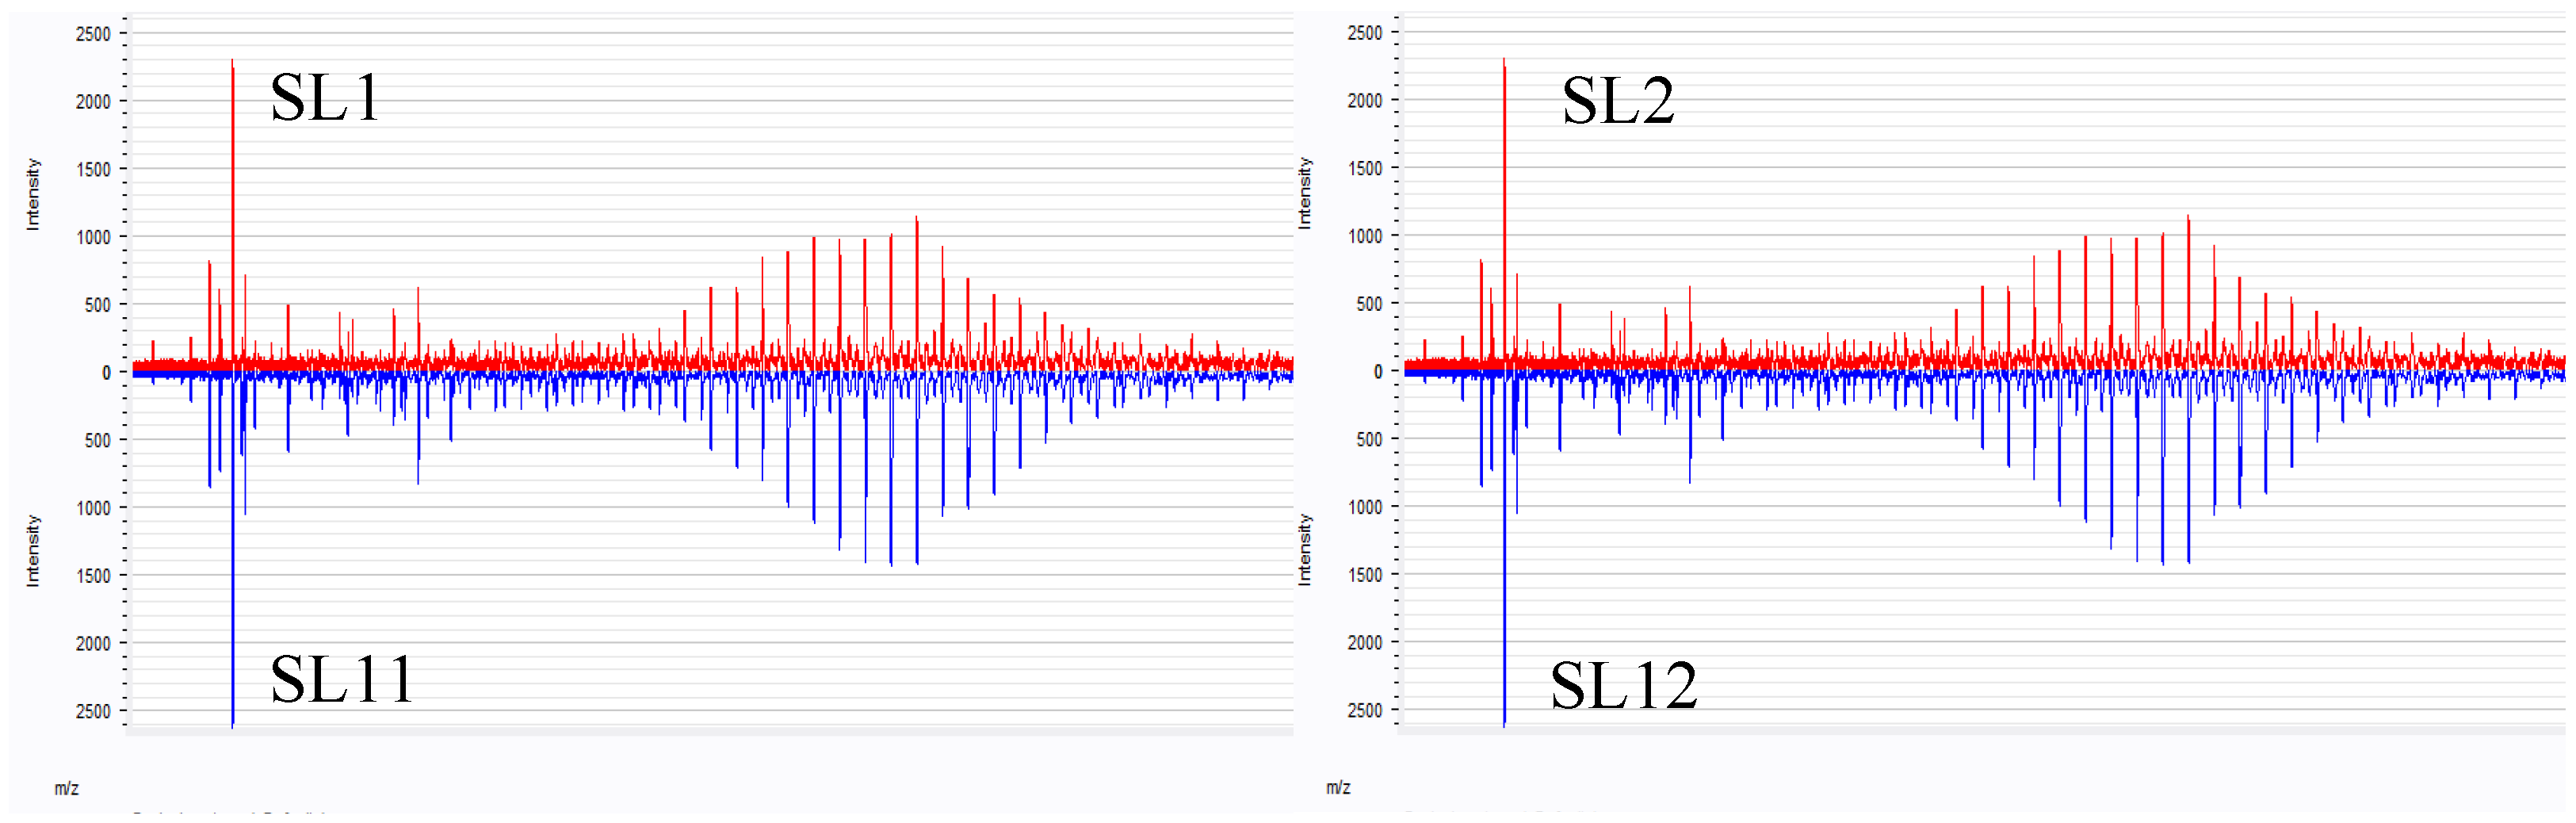
3.1. Identified Cosmetic Ingredients via MALDI-TOF Analysis

The identified quantity of compounds served as the foundation for contrast across product types sourced from different procurement locations. The disparity between substance count and holistic spectrum was scrutinized. The corresponding findings are illustrated in Table 1.
The sample with the same label purchased from the counter exhibited batch stability, and the obtained substance number and similarity results demonstrated that the basic substance profile of the product can be reflected by direct measurement of TOF, which can be used to represent its product characteristics. Then, the liquid cosmetics samples from the wholesale market were tested, and the experimental findings are shown in Table 2.
Upon analyzing the outcomes obtained from several samples procured from the wholesale platform, it can be firmly established that there exists a certain uniformity between diverse batches of samples bearing identical labels, which concurrently signifies that the cosmetics from a specific production repository possess a consistent caliber. However, subsequent comparison with the counter samples—i.e., the control faction—reveals that samples SL11, SL33, and SL44 exhibit a significant conformity with the counter products. The specimens of SL22 and SL55 can be recognized as emanating from the same production establishment, and when juxtaposed with the corresponding counter products—i.e., samples SL2 and SL5 in the control faction—there exists a substantial discrepancy, and the corresponding substance code is also considerably divergent, indicating that these two products may pose authenticity issues, and there are distinct discrepancies in the utilization of raw materials and formula composition.
In the testing of emulsion samples, identical outcomes to those of the above liquid cosmetics were observed. Labeled samples from the same procurement unit showed identical substance numbers and similarity. Compared to the control group, the substance number of SC33 was merely 40% of the control sample SC3, suggesting authenticity concerns.

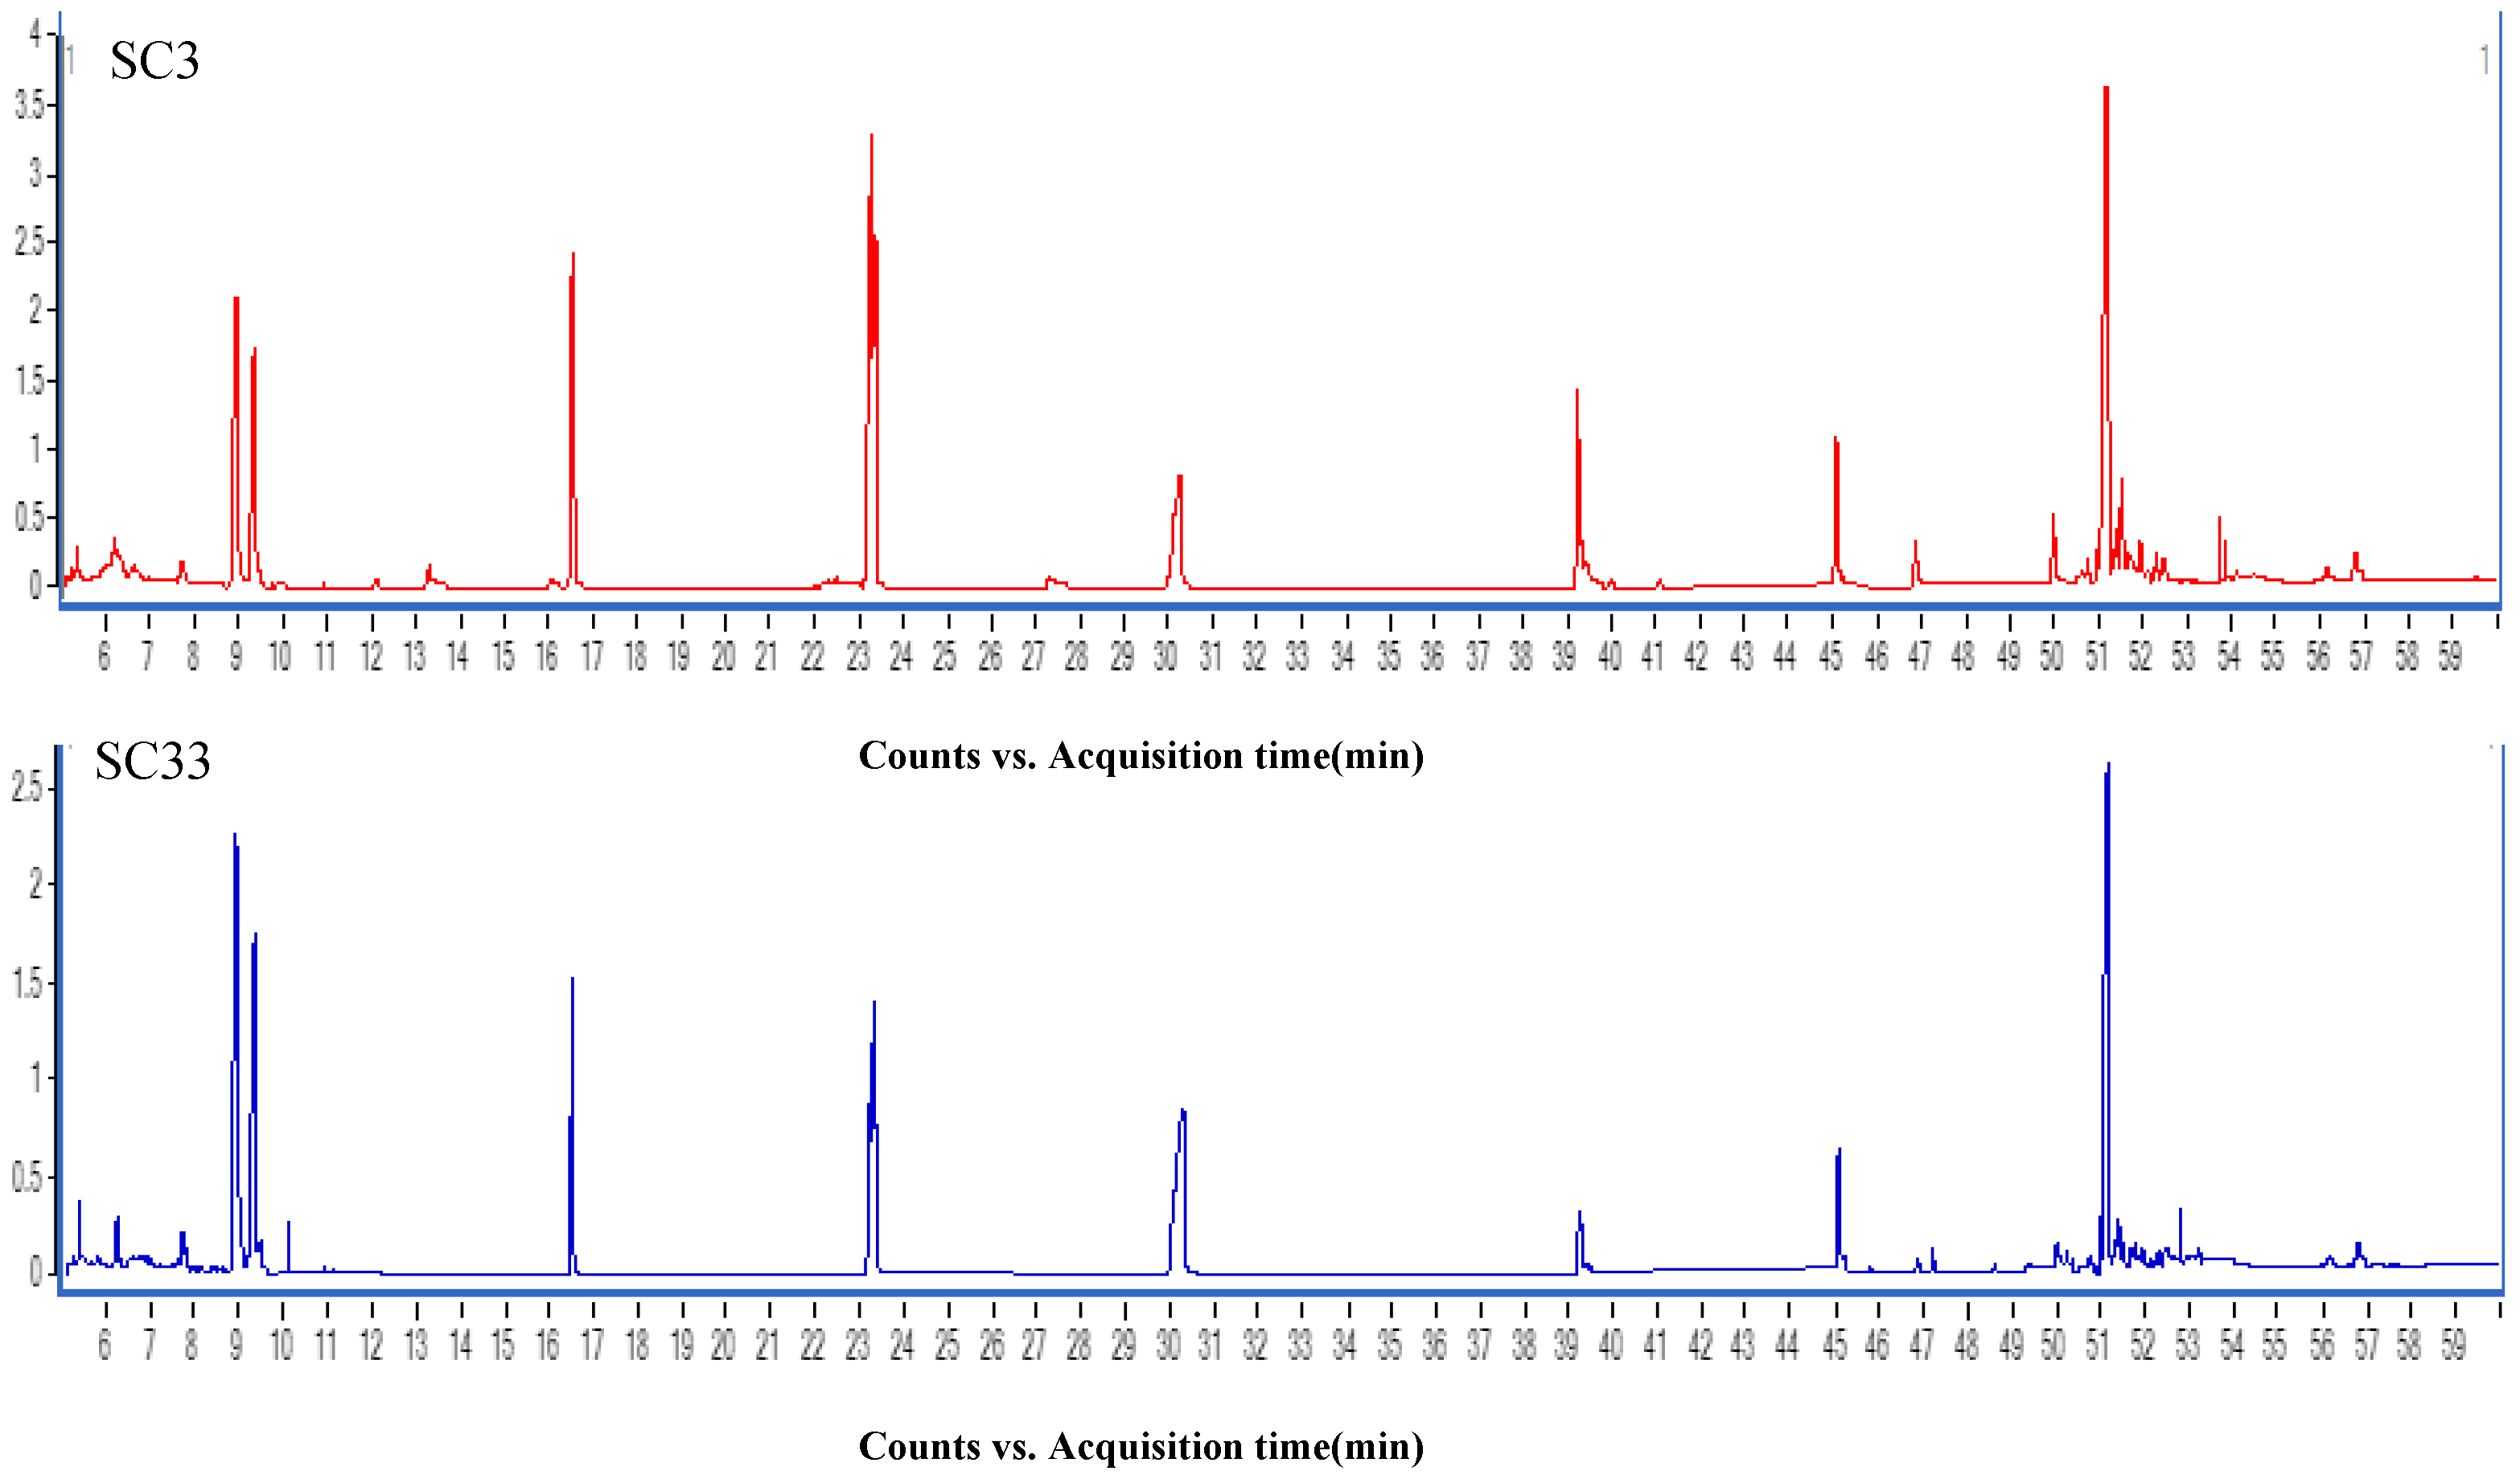
3.2. Identified Cosmetic Ingredients via GC-MS Analysis

Gas chromatography mass spectrometry (GC-MS) was used for the qualitative identification of emulsion cosmetics. The similarity between substance number and full spectrum was compared. The results are shown in Table 3.
Counter-purchased labeled samples also exhibit batch stability. The obtained substance number and similarity results show that the non-polar substance profile of the product can be reflected by the measurement of gas chromatography, which is used to represent its product characteristics. Emulsion cosmetics bought from the wholesale market were tested, and their test results are shown in Table 4.
In the results of samples purchased from the wholesale market, it can be seen that the emulsion samples with the same label still have a certain inter-batch stability, which also indicates that the cosmetics from a production unit have a certain constant quality, but after comparing with the counter samples, that is, the control group, it is found that SC11, SC22, SC44, and SC55 have a good similarity match with the counter products and can be identified as coming from the same production unit, while the sample of SC33 is significantly different from the corresponding counter products, that is, the sample of SC3 in the control group, and the corresponding substance number is also significantly different, indicating that the authenticity of the two products is problematic.
In the detection of liquid samples, there are similar results to the above emulsion cosmetics. Samples with the same label from the same procurement unit have similar results in terms of substance number and similarity. In comparison with the control group, SL22 and SL55 are compared with the corresponding SL2 and SL5. The number of substances was only 50% and 47% of the control samples, and the similarity was 55.7% and 63.3%, indicating similar authenticity problems.

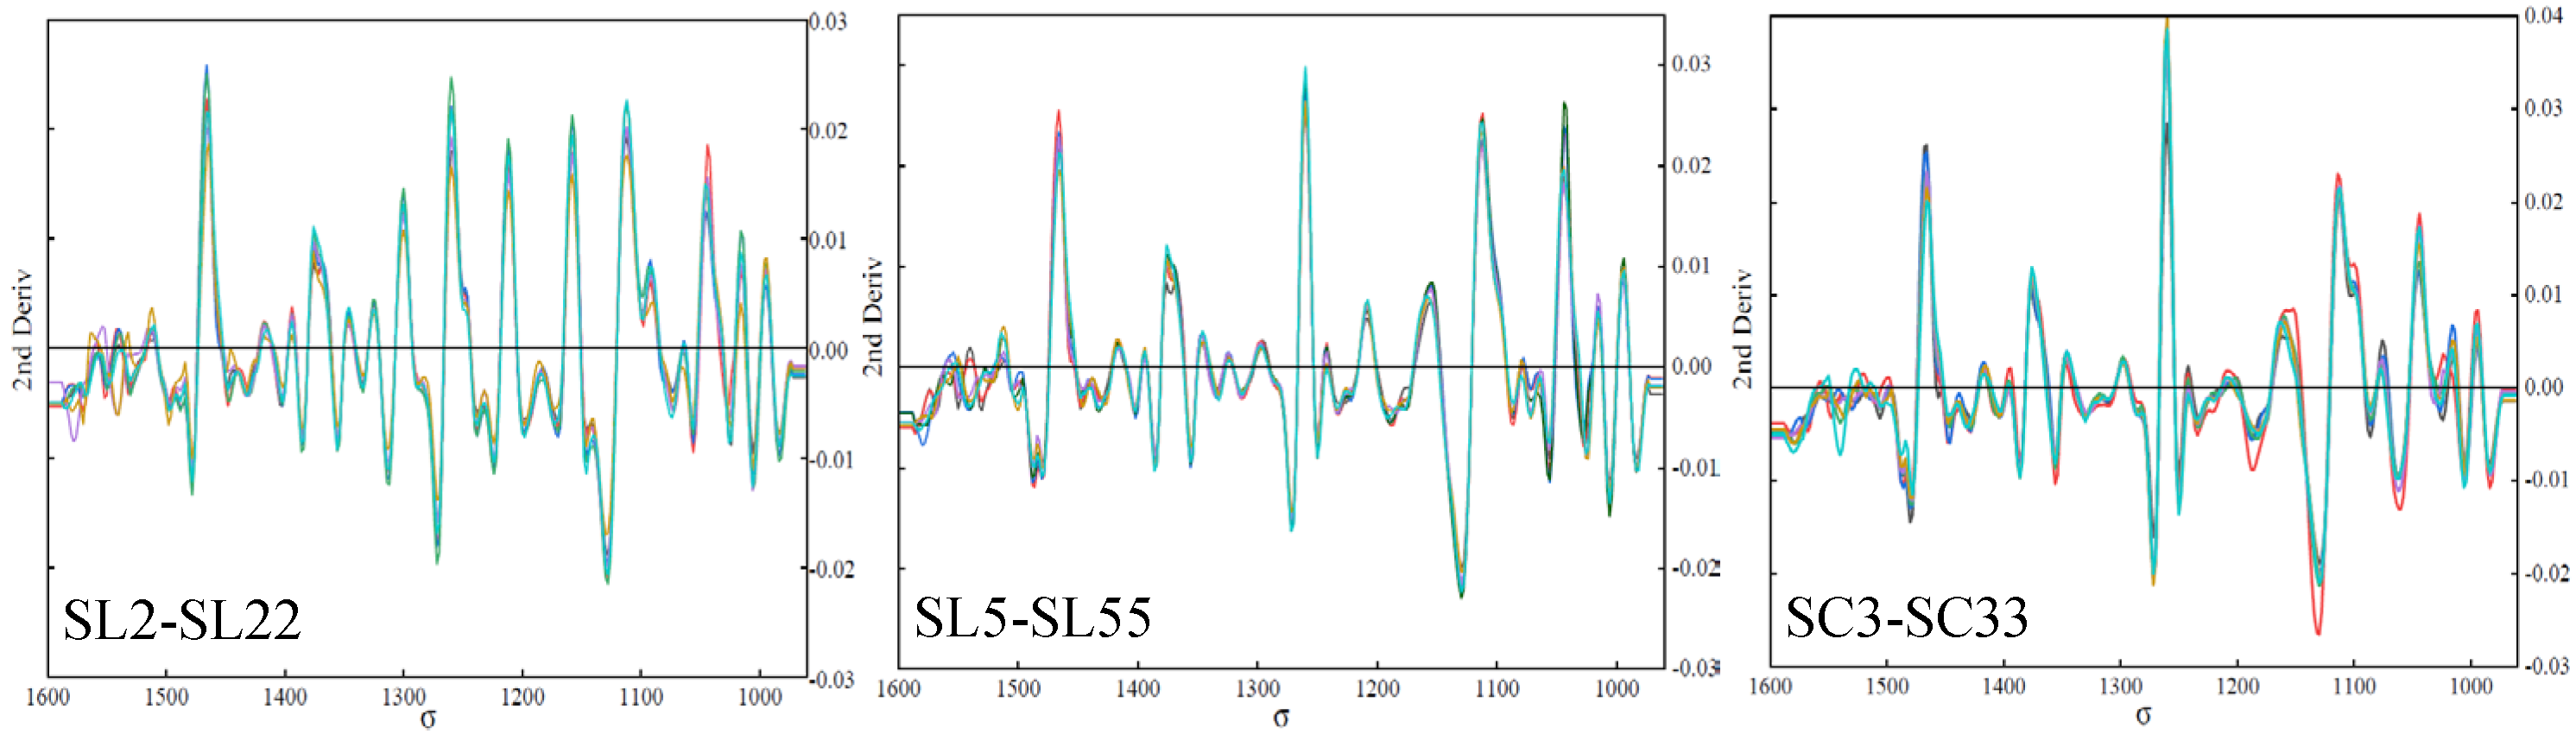
3.3. Identified Ink and Adhesive on the Outer Packaging via Mid-IR Analysis

The ink and adhesive content of 50 packaging samples were scraped, extracted, and dispersed for a spectral test. The infrared spectrum of these exhibited high similarity analysis: five liquid and emulsion cosmetic samples from the control group had over 99% similarity to those from the wholesale market. Within each group, there was significant similarity matching. Comparing the sample group to the control group, SL22 and SL55 in the liquid category had a likeness of 73% and 81%, respectively, indicating remarkable differences in packaging adhesive and ink components. Within the emulsion samples, the similarity of SC33 to the control SC3 is 53%, highlighting a more substantial difference. These data prove infrared spectroscopy’s ability to quickly recognize packaging materials and assess sample variances. The performance in this aspect reached over 93% congruency between the sample group and the control group, indicating excellent similarity.

4. Discussion

Cosmetic ingredients are complex, and product variations are significant. To authenticate cosmetics, comparing the suspected sample to an authentic item was much more effective than component characterization. Proper use of analytical equipment that captures data signals is crucial for confirming whether these two items’ signals match. The process of identifying authenticity calls for two critical tasks: (a) fine tuning the parameters of the analytical instrument to accurately capture both samples’ data; (b) employing scientific methods for data comparison, setting a viable deviation margin to verify the authenticity of the suspected sample.
MALDI-TOF analysis mainly prioritizes substance examination and sorting in life sciences. The sample preparation method has a significant impact on the analysis results [24,25]. The technique involves charge transfer from the matrix to target ions under laser energy, wherein the overall analysis is optimized by choosing an appropriate matrix for measurement [26,27]. Common substrates for small molecule detection include nicotinic acid, picolinic acid, 3-hydroxypicolinic acid, and 3-aminopicolinic acid. DHB-based mixture, 4-chloro-a-cyano-cinnamic acid, 2-(4-hydroxyphenylazo) benzoic acid, and 2-mercaptobenzothiazole enable large molecule analysis. To assess cosmetic authenticity, small molecule chemical profiles were compared through mass spectrum similarity. In this study, diverse matrices were tested, and it was discovered that employing 3-hydroxypicolinic acid as a matrix provided comprehensive and distinct responses. Consequently, 3-hydroxypicolinic acid was chosen as the optimal matrix for testing. The sample was dispersed with buffer solution to differentiate polar and nonpolar substances which represent the molecular profile of cosmetics. A cold storage technique after dispersion enhanced the separation of polar and nonpolar substances, with up to 200–300 molecules identified per sample. Following thorough dispersion, samples were refrigerated for substance sedimentation before centrifugal separation. This approach was effective across all samples examined.
Gas chromatograph mass spectrometer (GC-MS) efficiently analyzes weak polar or partially polar substances due to the presence of accurate characteristic spectral libraries [28,29,30,31]. In cosmetic authenticity testing, it establishes relative retention index references using a mix of n-alkanes for the identification and discrimination of relevant components. To ensure separation efficiency, the performance of GC columns such as DB-5 and DB-624 was evaluated, with improved results seen with temperature programing on the former; it effectively separates over 100 components compared to others. Next, organic solvents including acetonitrile, n-hexane, and propanone were utilized to extract the compounds, with acetonitrile demonstrating superior dispersion and prior solute release in dispersible liquid and emulsion cosmetics samples, eventually receiving validation post dehydration via acetonitrile extraction as the GC sample.
When infrared light irradiates organic molecules, the chemical bonds or functional groups in the molecule can undergo vibrational absorption. Different chemical bonds or functional groups have different absorption frequencies and will be located at different positions in the infrared spectrum, thus obtaining information on what chemical bonds or functional groups are contained in the molecule [32,33,34,35,36]. In this experiment, DMSO and acetone were mainly used for sample extraction and dispersion, so that the ink on the cosmetic packaging could be dissolved and uniformly dispersed. The extraction solvent was optimized, and solvent systems such as chloroform and ethyl acetate were attempted. The results showed that using DMSO dispersion and acetone extraction can effectively free the sample from substances such as ink and adhesive and can be well dispersed on the salt window of infrared detection, forming a sample film for detection.
Prior to consistency analysis, the analysis software provided by the instrument company is utilized to export data in txt format. MS exports the response intensity data for all charge–mass ratios, GCMS exports peak intensity data corresponding with retention time, and mid-IR spectroscopic exports absorption wavenumber and corresponding transmittance data. The data are subsequently imported into SPSS 19.0 software for comparison under the Reliability Analysis function. Intraclass correlation coefficient, a two-way random model, and consistency calculation type, is selected to ascertain the consistency between the two datasets based on calculated Intraclass correlation values [37]. In this study, the data consistency of two identical products from the same brand, procured at the same location, exceeded 98%, indicating excellent instrument testing repeatability. Considering authenticity identification and potential testing errors, if the Intraclass correlation value falls below 90%, it may signify non-identity and can be identified as a potential counterfeit product.

5. Conclusions

As for the detection of cosmetics themselves and packaging by the above three methods, it can be found that MALDI-TOF and GC methods can quickly identify the similarity degree of substance composition in cosmetics, and further use the identification of mass spectrometry mass number and the qualitative identification of gas chromatographic retention index to qualitatively identify substances, and then identify the actual sources of differences. Due to the interference of the main components of cosmetics, it is difficult to identify the substance composition of cosmetics using the infrared spectrum, but the adhesive and ink on the packaging can be targeted for identification and detection. Interestingly, the three methods for authenticity detection of cosmetics obtained consistent results in the samples collected this time, further proving the effectiveness of the above three methods for authenticity identification of cosmetics. The methods used in this paper are fast, low cost, and easy to operate in practice. The results show that they can be used to identify the authenticity of products and serve the actual product supervision.

Author Contributions

Conceptualization, S.J. and J.C.; methodology, H.Q.; software, X.N.; validation, S.J., H.Q. and S.C.; formal analysis, J.C.; investigation, S.C.; resources, H.Q.; data curation, X.N.; writing—original draft preparation, S.J. and J.C.; writing—review and editing, S.J., H.Q. and S.C.; visualization, X.N.; supervision, J.C.; project administration, S.C. and J.C. All authors have read and agreed to the published version of the manuscript.

Funding

This research received no external funding.

Institutional Review Board Statement

Not applicable.

Informed Consent Statement

Not applicable.

Data Availability Statement

The original contributions presented in the study are included in the article, further inquiries can be directed to the corresponding authors.

Acknowledgments

This research was supported by the Key Laboratory of Cosmetic Research and Evaluation of the National Medical Products Administration.

Conflicts of Interest

The authors declare no conflicts of interest.

References

  1. Pun, H.; Hou, P.W. Combating copycatting from emerging market suppliers in global supply chains. Prod. Oper. Manag. 2022, 31, 3304–3319. [Google Scholar] [CrossRef]
  2. Mondello, A.; Salomone, R.; Mondello, G. Exploring circular economy in the cosmetic industry: Insights from a literature review. Environ. Impact Assess. Rev. 2024, 105, 107443. [Google Scholar] [CrossRef]
  3. Kolling, C.; Ribeiro, J.L.D.; de Medeiros, J.F. Performance of the cosmetics industry from the perspective of Corporate Social Responsibility and Design for Sustainability. Sustain. Prod. Consum. 2022, 30, 171–185. [Google Scholar] [CrossRef]
  4. Manousi, E.; Chatzitaki, A.; Vakirlis, E.; Karavasili, C.; Fatouros, D.G. Development and in vivo evaluation of 3D printed hydrogel patches for personalized cosmetic use based on skin type. J. Drug Deliv. Sci. Technol. 2024, 92, 105306. [Google Scholar] [CrossRef]
  5. Martins, A.M.; Marto, J.M. A sustainable life cycle for cosmetics: From design and development to post-use phase. Sustain. Chem. Pharm. 2023, 35, 101178. [Google Scholar] [CrossRef]
  6. Do, T.K.T.; Hadji-Minaglou, F.; Antoniotti, S.; Fernandez, X. Authenticity of essential oils. TrAC Trends Anal. Chem. 2015, 66, 146–157. [Google Scholar] [CrossRef]
  7. Wu, X.; Zhao, Z.; Tian, R.; Niu, Y.; Gao, S.; Liu, H. Total synchronous fluorescence spectroscopy coupled with deep learning to rapidly identify the authenticity of sesame oil. Spectrochim. Acta Mol. Biomol. Spectrosc. 2021, 244, 118841. [Google Scholar] [CrossRef] [PubMed]
  8. Ficheux, A.; Gomez-Berrada, M.; Roudot, A.; Ferret, P. Consumption and exposure to finished cosmetic products: A systematic review. Food Chem. Toxicol. 2019, 124, 280–299. [Google Scholar] [CrossRef]
  9. Suphasomboon, T.; Vassanadumrongdee, S. Toward sustainable consumption of green cosmetics and personal care products: The role of perceived value and ethical concern. Sustain. Prod. Consum. 2022, 33, 230–243. [Google Scholar] [CrossRef]
  10. Alexander-White, C.; Bury, D.; Cronin, M.; Dent, M.; Hack, E.; Hewitt, N.J.; Kenna, G.; Naciff, J.; Ouedraogo, G.; Schepky, A.; et al. A 10-step framework for use of read-across (RAX) in next generation risk assessment (NGRA) for cosmetics safety assessment. Regul. Toxicol. Pharm. 2022, 129, 105094. [Google Scholar] [CrossRef]
  11. Kharbach, M.; Marmouzi, I.; El Jemli, M.; Bouklouze, A.; Vander Heyden, Y. Recent advances in untargeted and targeted approaches applied in herbal-extracts and essential-oils fingerprinting—A review. J. Pharmaceut. Biomed. 2020, 177, 112849. [Google Scholar] [CrossRef] [PubMed]
  12. Tsai, C.; Lin, Y.; Chen, Y.; Feng, C. Chemical derivatization combined with capillary LC or MALDI-TOF MS for trace determination of lipoic acid in cosmetics and integrated protein expression profiling in human keratinocytes. Talanta 2014, 130, 347–355. [Google Scholar] [CrossRef] [PubMed]
  13. Desmedt, B.; Canfyn, M.; Pype, M.; Baudewyns, S.; Hanot, V.; Courselle, P.; De Beer, J.O.; Rogiers, V.; De Paepe, K.; Deconinck, E. HS-GC-MS method for the analysis of fragrance allergens in complex cosmetic matrices. Talanta 2015, 131, 444–451. [Google Scholar] [CrossRef] [PubMed]
  14. Surek, M.; Cobre, A.D.F.; Fachi, M.M.; Santos, T.G.; Pontarolo, R.; Crisma, A.R.; Felipe, K.B.; Souza, W.M.D. Propolis authentication of stingless bees by mid-infrared spectroscopy and chemometric analysis. LWT 2022, 161, 113370. [Google Scholar] [CrossRef]
  15. Lee, S.; Sung, B.; Phau, I.; Lim, A. Communicating authenticity in packaging of Korean cosmetics. J. Retail. Consum. Serv. 2019, 48, 202–214. [Google Scholar] [CrossRef]
  16. Kritikou, A.S.; Aalizadeh, R.; Damalas, D.E.; Barla, I.V.; Baessmann, C.; Thomaidis, N.S. MALDI-TOF-MS integrated workflow for food authenticity investigations: An untargeted protein-based approach for rapid detection of PDO feta cheese adulteration. Food Chem. 2022, 370, 131057. [Google Scholar] [CrossRef] [PubMed]
  17. Feizi, N.; Hashemi-Nasab, F.S.; Golpelichi, F.; Saburouh, N.; Parastar, H. Recent trends in application of chemometric methods for GC-MS and GC×GC-MS-based metabolomic studies. TrAC Trends Anal. Chem. 2021, 138, 116239. [Google Scholar] [CrossRef]
  18. Md Ghazi, M.G.; Lee, L.C.; Sino, H.; Abdul Halim, M.I. Review of contemporary chemometric strategies applied on preparing GC-MS data in forensic analysis. Microchem. J. 2022, 181, 107732. [Google Scholar] [CrossRef]
  19. Sokołowski, A.; Dybowski, M.P.; Oleszczuk, P.; Gao, Y.; Czech, B. Fast and reliable determination of phthalic acid esters in soil and lettuce samples based on QuEChERS GC-MS/MS. Food Chem. 2024, 440, 138222. [Google Scholar] [CrossRef]
  20. Xiao, G.; Yuan, L.; Liao, D.; Dong, H.; Luo, X.; Huang, Y. A study on the applicability of one-step vortex extraction and purification combined with gas chromatography-tandem mass spectrometry for analysis of four skin penetration enhancers in cosmetics. J. Chromatogr. A 2023, 1710, 464379. [Google Scholar] [CrossRef]
  21. Alshebly, S.M.; Mahmoud, S.S.; Aly, E.M.; Awad, S.M.; Kamal, G.M. Effects of non-toxic doses of various food additives on the structure of mammalian retina: Investigation by mid-infrared spectroscopy. Vib. Spectrosc. 2022, 123, 103469. [Google Scholar] [CrossRef]
  22. Cobbinah, E.; Generalao, O.B.; Ke, G.; Malaluan, R.; Lubguban, A.; Dumancas, G.G. A rapid analytical method for turmeric essential oil authentication using mid-infrared spectroscopy and chemometrics. J. Food Compos. Anal. 2024, 129, 106102. [Google Scholar] [CrossRef]
  23. Luengo, G.S.; Fameau, A.; Léonforte, F.; Greaves, A.J. Surface science of cosmetic substrates, cleansing actives and formulations. Adv. Colloid Interfac. 2021, 290, 102383. [Google Scholar] [CrossRef] [PubMed]
  24. Jeverica, S.; Nagy, E.; Mueller-Premru, M.; Papst, L. Sample preparation method influences direct identification of anaerobic bacteria from positive blood culture bottles using MALDI-TOF MS. Anaerobe 2018, 54, 231–235. [Google Scholar] [CrossRef] [PubMed]
  25. Bočánek, O.; Aedo, O.; Pekár, S.; Zdráhal, Z. Evaluation of sample preparation protocols for spider venom profiling by MALDI-TOF MS. Toxicon 2017, 133, 18–25. [Google Scholar] [CrossRef] [PubMed]
  26. Wu, Z.; Xu, N.; Li, W.; Lin, J. A membrane separation technique for optimizing sample preparation of MALDI-TOF MS detection. Chin. Chem. Lett. 2019, 30, 95–98. [Google Scholar] [CrossRef]
  27. Badía, J.D.; Strömberg, E.; Ribes-Greus, A.; Karlsson, S. Assessing the MALDI-TOF MS sample preparation procedure to analyze the influence of thermo-oxidative ageing and thermo-mechanical degradation on poly (Lactide). Eur. Polym. J. 2011, 47, 1416–1428. [Google Scholar] [CrossRef]
  28. Zdravkovic, S.A. Solid phase extraction in tandem with GC/MS for the determination of semi-volatile organic substances extracted from pharmaceutical packaging/delivery systems via aqueous solvent systems. J. Pharmaceut. Biomed. 2015, 112, 126–138. [Google Scholar] [CrossRef] [PubMed]
  29. Yadav, K.; Bhardwaj, A.; Sunder Raman, R. Chemical characterization, source identification and potential health effects of PM2.5-bound non-polar organic compounds over a COALESCE network site—Bhopal, India. Sci. Total Environ. 2024, 920, 170957. [Google Scholar] [CrossRef]
  30. Casey, J.S.; Jackson, S.R.; Ryan, J.; Newton, S.R. The use of gas chromatography—High resolution mass spectrometry for suspect screening and non-targeted analysis of per- and polyfluoroalkyl substances. J. Chromatogr. A 2023, 1693, 463884. [Google Scholar] [CrossRef]
  31. Lopez, P.; van Sisseren, M.; De Marco, S.; Jekel, A.; de Nijs, M.; Mol, H.G.J. A straightforward method to determine flavouring substances in food by GC-MS. Food Chem. 2015, 174, 407–416. [Google Scholar] [CrossRef] [PubMed]
  32. Shen, X.; Lan, S.; Zhao, Y.; Xiong, Y.; Yang, W.; Du, Y. Characterization of skin moisture and evaluation of cosmetic moisturizing properties using miniature near-infrared spectrometer. Infrared Phys. Technol. 2023, 132, 104759. [Google Scholar] [CrossRef]
  33. Deconinck, E.; Bothy, J.L.; Desmedt, B.; Courselle, P.; De Beer, J.O. Detection of whitening agents in illegal cosmetics using attenuated total reflectance-infrared spectroscopy. J. Pharmaceut. Biomed. 2014, 98, 178–185. [Google Scholar] [CrossRef] [PubMed]
  34. Gamberini, M.C.; Baraldi, C.; Palazzoli, F.; Ribechini, E.; Baraldi, P. MicroRaman and infrared spectroscopic characterization of ancient cosmetics. Vib. Spectrosc. 2008, 47, 82–90. [Google Scholar] [CrossRef]
  35. Dias Santos, J.; Pinto, P.F.; Edwards, H.G.M.; Cappa De Oliveira, L.F. Characterization by Raman and infrared spectroscopy and fluorescence microscopy of human hair treated with cosmetic products. Spectrochim. Acta Mol. Biomol. Spectrosc. 2022, 280, 121577. [Google Scholar] [CrossRef] [PubMed]
  36. Skobeeva, S.; Banyard, A.; Rooney, B.; Thatti, R.; Thatti, B.; Fletcher, J. Near-infrared spectroscopy combined with chemometrics to classify cosmetic foundations from a crime scene. Sci. Justice 2022, 62, 327–335. [Google Scholar] [CrossRef]
  37. Maric, M.; de Haan, E.; Hogendoorn, S.M.; Wolters, L.H.; Huizenga, H.M. Evaluating Statistical and Clinical Significance of Intervention Effects in Single-Case Experimental Designs: An SPSS Method to Analyze Univariate Data. Behav. Ther. 2015, 46, 230–241. [Google Scholar] [CrossRef]
Figure 1. The comparison of the MALDI-TOF mass spectra of different samples.
Applsci 14 03198 g001
Figure 2. The total ion chromatogram (TIC) of different samples.
Applsci 14 03198 g002
Figure 3. The diversity of mid-IR spectra of different samples.
Applsci 14 03198 g003
Table 1. MALDI-TOF analysis results of liquid cosmetics samples from the counter.
GroupSampleSubstance NumberSimilarity (within Groups, %)
SL1SL1-122199.7
SL1-2224
SL2SL2-125798.9
SL2-2253
SL3SL3-121999.1
SL3-2212
SL4SL4-128698.4
SL4-2284
SL5SL5-126699.5
SL5-2267
Table 2. MALDI-TOF analysis results of liquid cosmetics samples from the wholesale market.
GroupSampleSubstance NumberSimilarity (within Groups, %)Similarity (Different Procurement Location, %)
SL11SL11-121599.597.4
SL11-2214
SL11-3211
SL11-4210
SL22SL22-112798.173.5
SL22-2138
SL22-3126
SL22-4123
SL33SL33-122799.298.0
SL33-2222
SL33-3229
SL33-4232
SL44SL44-126698.897.5
SL44-2261
SL44-3267
SL44-4269
SL55SL55-111998.169.3
SL55-2121
SL55-3113
SL55-4117
Table 3. GC-MS analysis results of emulsion cosmetics samples from the counter.
GroupSampleSubstance NumberSimilarity (within Groups, %)
SC1SC1-113799.1
SC1-2131
SC2SC2-117299.3
SC2-2179
SC3SC3-116598.9
SC3-2161
SC4SC4-113198.7
SC4-2125
SC5SC5-113699.4
SC5-2140
Table 4. GC-MS analysis results of emulsion cosmetics samples from the wholesale market.
GroupSampleSubstance NumberSimilarity (within Groups, %)Similarity (Different Procurement Location, %)
SC11SC11-112998.998.2
SC11-2134
SC22SC22-116899.298.7
SC22-2161
SC33SC33-15299.463.2
SC33-251
SC44SC44-113998.797.1
SC44-2143
SC55SC55-114599.198.3
SC55-2142
Disclaimer/Publisher’s Note: The statements, opinions and data contained in all publications are solely those of the individual author(s) and contributor(s) and not of MDPI and/or the editor(s). MDPI and/or the editor(s) disclaim responsibility for any injury to people or property resulting from any ideas, methods, instructions or products referred to in the content.

