Article

Investigation on the Mechanical Characteristics of the Excavation of a Double-Line Highway Tunnel Underpass Existing Railway Tunnel under the Influence of Dynamic and Static Load

1
School of Civil and Environment Engineering, University of Science and Technology Beijing, Beijing 100083, China
2
School of Mine Engineering, North China University of Science and Technology, Tangshan 063210, China
*
Authors to whom correspondence should be addressed.
Appl. Sci. 2024, 14(8), 3242; https://doi.org/10.3390/app14083242
Submission received: 17 March 2024 / Revised: 4 April 2024 / Accepted: 9 April 2024 / Published: 11 April 2024
(This article belongs to the Section Earth Sciences)

Abstract

:
Research on the excavation mechanical properties of underpass tunnels has already had certain results, but only a few of them consider the effects of dynamic and static loads on the excavation mechanical properties of underground tunnels at the same time; particularly, there is a lack of research investigating double-line highway tunnels with angled underpasses of existing railway tunnels. In this paper, based on the tunnel project of the new double-line Shiqian Highway Tunnel passing under the Hurong Railway with an oblique angle, based on the method of over-advance geological prediction and investigations into the palm face surrounding the rock, the rock degradation caused by dynamic and static loads is quantified using the perturbation system. Additionally, the mechanical parameters of the rock under the influence of dynamic and static load coupling in the influence area of the cross-tunneling project are determined using the Hoek–Brown criterion, and the mechanical characteristics of the excavation of a tunnel under the double-lane highway tunnel passing under the existing railroad are constructed with the mechanical characteristics of the double-lane highway tunnel, taking into consideration the influence of the dynamic and static load coupling in a three-dimensional model. The results show that, in line with the new tunnel rock movement law for the top of the arch sinking, the bottom plate bulging, the side wall outward movement, the height and width of the arch, and the bottom plate arch show an increase with the tunnel excavation, while the side wall rock displacement effect is smaller; the left and right line tunnel disturbed area of the rule of change is similar; the existing tunnel bottom plate displacement is larger than the top plate and the left and right side wall, under the influence of the excavation time step. Typical profile point displacement is mainly determined by the distance from the excavation surface; von Mises stress extremes are observed in the top plate and side walls of the existing tunnel, which occur in the tunnel structure, and there are unloading and pressure-bearing zones in the bottom plate; the new tunnel has the same rock disturbance angle under the four calculation conditions and, based on the displacement control criterion, the excavation method is preferred and the upper and lower step blasting excavation method is recommended.

1. Introduction

Underground highway and railway tunnels, as part of underground space development, are an important means of alleviating traffic congestion in China [1,2]. With the gradual reduction in underground transportation space, new tunnels are often developed by being built under existing tunnels [3,4,5,6,7,8]. However, the excavation of new tunnels not only redistributes the stresses in the surrounding rock, but also increases the stresses and deformations in the existing tunnels, due to secondary disturbances. Especially under the influence of the dynamic loads of trains in the existing tunnel and the dynamic and static loads of the excavated new tunnel, the tunnel structure and its mechanical properties will be further deteriorated [5,6,7,8]. Therefore, it is of great significance to study the mechanical characteristics of double-line new highway tunnels that are built underneath the existing railway tunnels.
For the action effect of double-line tunnel excavation, researchers have predicted the internal force and deformation of existing tunnels through theoretical formulas [9,10,11,12,13] and have used model testing [14,15,16] and numerical simulation [17,18,19,20,21] to study the effects of static and dynamic loads on the mechanical characteristics of the excavation of existing tunnels during the excavation of newly built tunnels; however, the current study considers the effects of dynamic and static load coupling to a lesser extent. In terms of the static load effects of excavation, Chen et al. [17,19] investigated the effects of rock mass, the radii of new and existing tunnels, the burial depth of existing tunnels, and the gaps between the traversing tunnels on the stability of existing tunnels by using numerical simulation software, FLAC3Dv6.0. In terms of the oblique angle, Lin et al. [18] used numerical simulation to investigate the mechanical response of a new double-line tunnel passing under an existing tunnel at an oblique angle and verified their findings using on-site measurements. The results show that the diagonal angle undercutting will cause the lateral deformation and internal force of the existing tunnel to exhibit obvious asymmetric characteristics. Zhou et al. [22] investigated the effects of the shape of the tunnel, the soil parameters, and the construction parameters on the ground settlement above the tunnel, using numerical simulation. Chen et al. [23] systematically monitored the deformation and stress of the existing tunnel, based on the case of a proximity earth pressure balance shield (EPBS) going down the existing tunnel. The results showed that the settlement development of the existing tunnels experienced four states, as follows: subsidence, bulge, secondary subsidence, and stability. Additionally, the location of the maximum settlement point of the existing tunnels—caused by the second tunnel underpass—was biased towards the center of the twin tunnels. Lai et al. [24] used the finite difference method (FDM) to establish a model to study the settlement characteristics of the new tunnel, with a small intersection angle close to the existing tunnel. The results show that the deformation of the existing tunnel caused by the excavation of the new tunnel is dominated by vertical settlement, accompanied by torsional deformation; both deformations are the largest in the crossing area. The simulation results are consistent with the field monitoring data. Lei et al. [25] conducted a series of transparent clay modeling tests to study the effect of shield tunnel face excavation on the stability of existing tunnels. The results show that the damage mode of the shield tunnel face is an overall damage mode and that the relative vertical and horizontal distances play a dominant role in the damage mode.
In terms of the dynamic load impact of blasting and the excavation of new tunnels, Cheng et al. [26] summarized the current research status of dynamic response, damage assessment, and damage mitigation of highway tunnels under blast loads and then discussed the effects of response analysis methods and response types on the dynamic response and damage characteristics of tunnel structures. Tian et al. [27] carried out a series of blasting vibration tests and, based on the actual engineering monitoring data, the tunnel blasting impact area was divided into four zones, which were the danger zone, the warning zone, the blasting control zone, and the safety zone. Then, signal processing was carried out with the help of matlabv7.0 programming and the results showed that the maximum mass vibration velocity of the surface decreased with the increase in the distance, and the mass vibration velocity in the z-direction was greater than the mass vibration velocity in the horizontal direction. Duan et al. [28] analyzed the peak velocity change of particles, stress, and settlement characteristics during the excavation of the cross-section of the Gaojiu Road Ⅰ tunnel on the left line of the Jiahua Tunnel, based on both field monitoring and numerical simulation. The results show that in the cross-section, the new tunnel blasting vibration has the greatest influence on the peak particle velocity at the roof of the existing tunnel below. The maximum tensile stresses in the existing tunnel below are mainly concentrated in the top region, while the maximum compressive stresses are concentrated in the crown footing. The maximum cumulative settlement value is found at the cross-section of the two tunnels. Wu et al. [29] used ABAQUS 6.13 simulation software to establish a tunnel blasting finite element model to study the vibration and stress response of the tunnel lining. The results show that, in the same tunnel section, the vibration velocity response in the Y-direction is the largest and the vibration velocity response in the Z-direction is the smallest. The MISES stresses of the tunnel lining were distributed regionally. Ruan et al. [30] established a blasting vibration velocity model for deep rock mass and investigated the effect of the overlying soil layer on blasting vibration. The results show that the blasting vibration velocity gradually decreases with the increase in the thickness of the overburden layer.
Regarding the mechanical parameters of the rock mass in the influence area of the cross-tunneling project, some scholars have determined the rock mass reduction parameters based on photo images and the information of the over-advanced geological prediction by using the Hoek–Brown criterion. Li et al. [31] established a more complete system of the comprehensive tunnel overrun geological forecasting method and also established a comprehensive grading evaluation system for adverse geological conditions in tunnels. Zhou et al. [32] used the method of combining overpass geological prediction and investigations into the palm face surrounding the rock to obtain the Hoek–Brown parameters of the tunnel’s surrounding rock, and then analyzed the stability of the surrounding rock in the fracture zone through FLAC3D numerical simulation. Geng et al. [33] firstly determined the Hoek–Brown strength parameters using on-site investigation and the empirical checklist method and then simulated the excavation process of the three-step method and the double sidewall guideway method by combining FLAC3D. The results show that the double sidewall guideway method can better control the surrounding rock deformation and is suitable for tunnel sections with more broken surrounding rock. Hu et al. [34] corrected the parameters ‘mb’ and ‘s’, based on the Hoek–Brown strength criterion, from which the equivalent M-C strength parameters of anisotropic side-slope rock mass were further calculated; the reasonableness of the parameters was tested using engineering examples. Li et al. [35] summarized the current research status of tunnel overtopping prediction technology using the drill-and-blast method and proposed a four-stage all-process integrated overtopping geological prediction system for tunnels.
To summarize, there are some results on the mechanical response characteristics of new tunnels with static excavation and blasting excavation, but usually the static and dynamic loads are only considered individually and there are fewer cases that consider both at the same time; in particular, there is a lack of research cases on the tunneling of double-line highway tunnels diagonally passing through existing railways. Therefore, this paper relies on the tunnel project of the new double-line Shiqian Highway Tunnel passing under the Hurong Railway at an oblique angle; adopts the method of over-advance geological prediction and investigation into the palm face surrounding the rock; determines the rock’s mechanical parameters of the cross-tunneling project influence area, considering the coupling effect of dynamic and static loads through the quantization of disturbance system and Hoek–Brown criterion; establishes an engineering-scale finite element numerical model; and reveals the mechanical parameters of the double-line highway tunnel passing through the existing railway tunnel under the influence of dynamic and static loads.

2. Project Background and Calculation Method

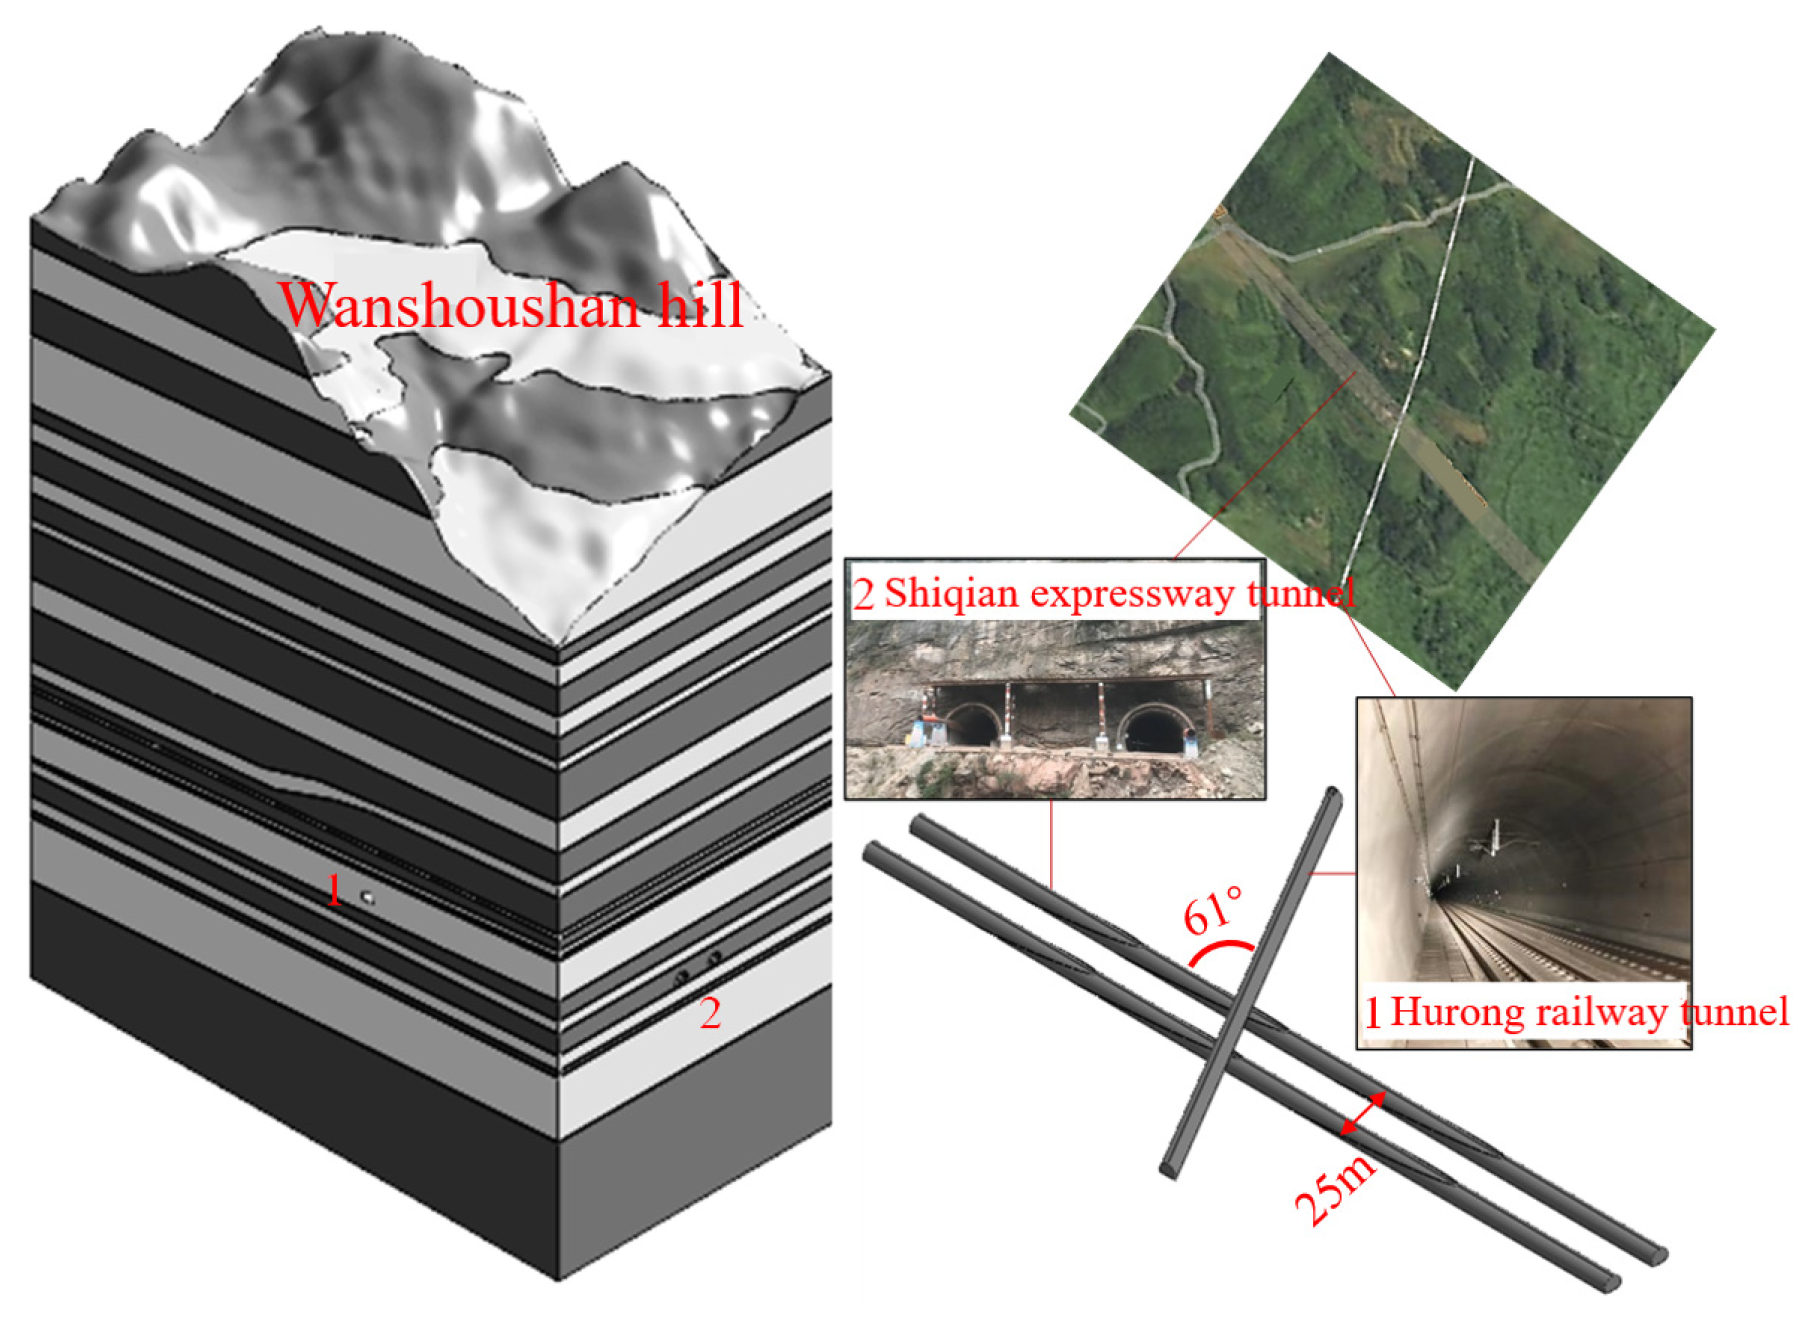
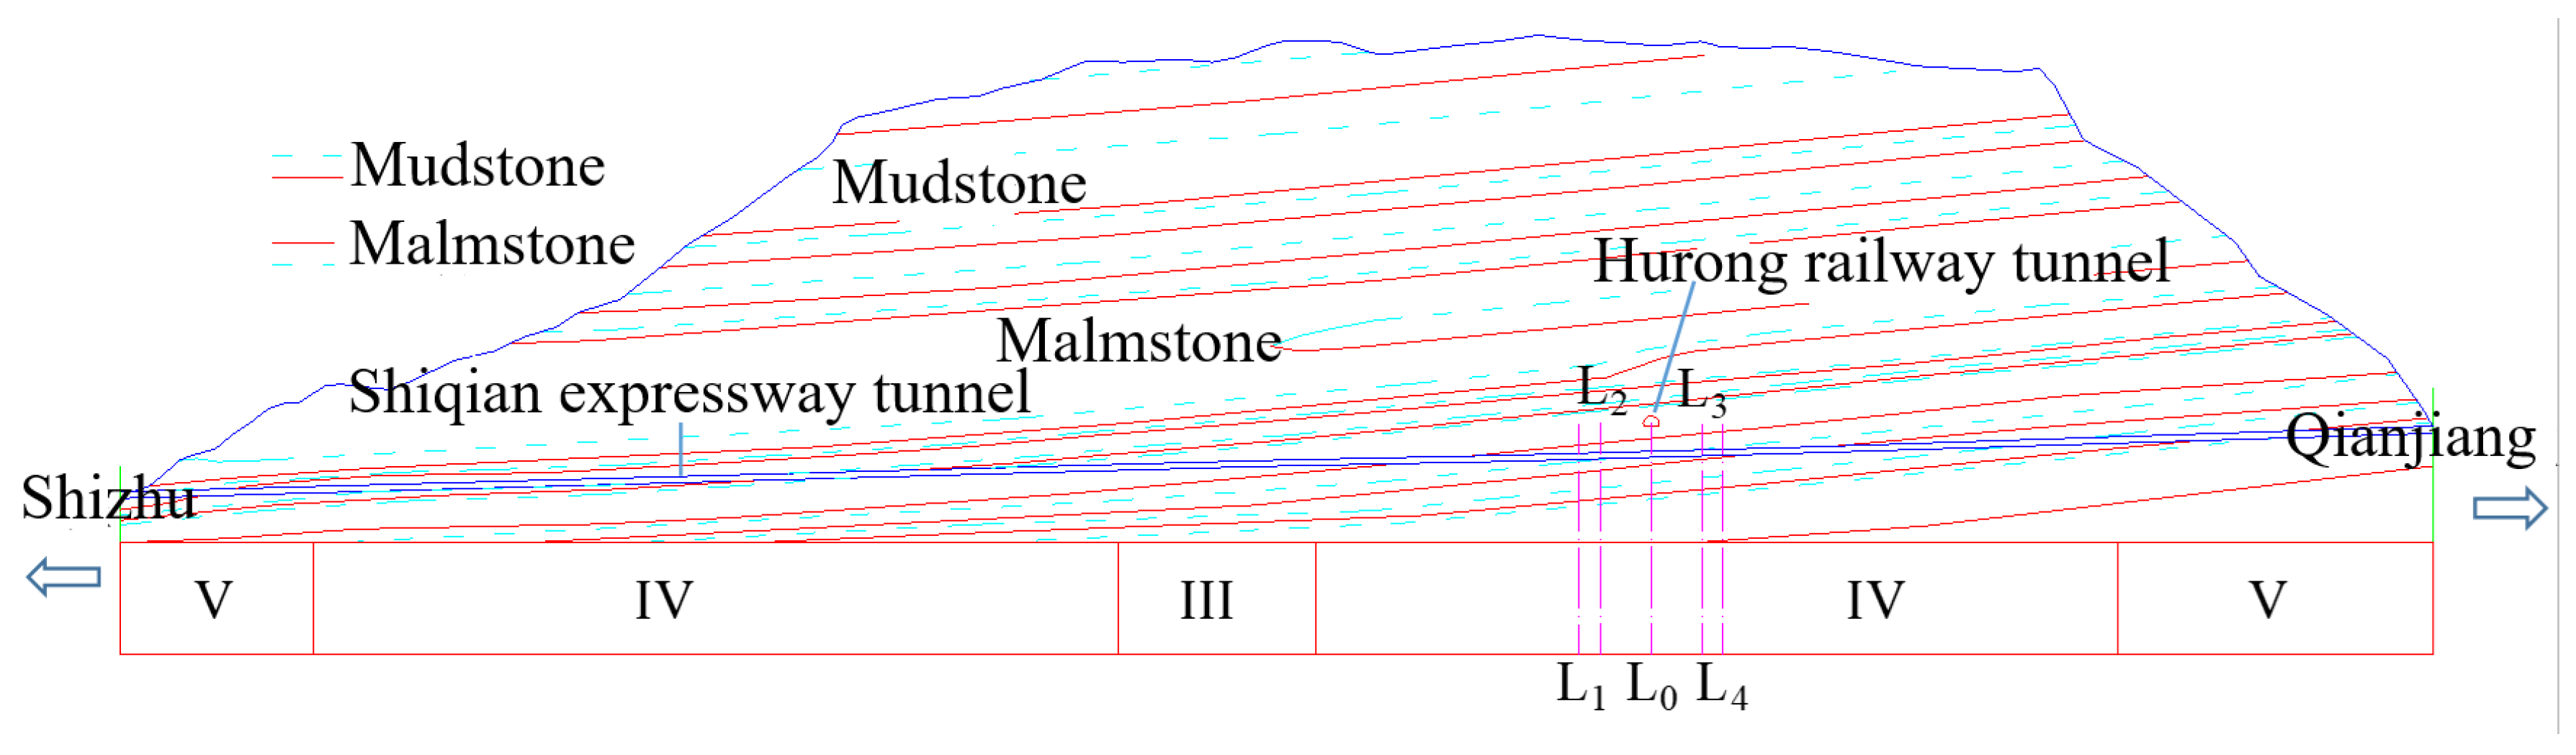
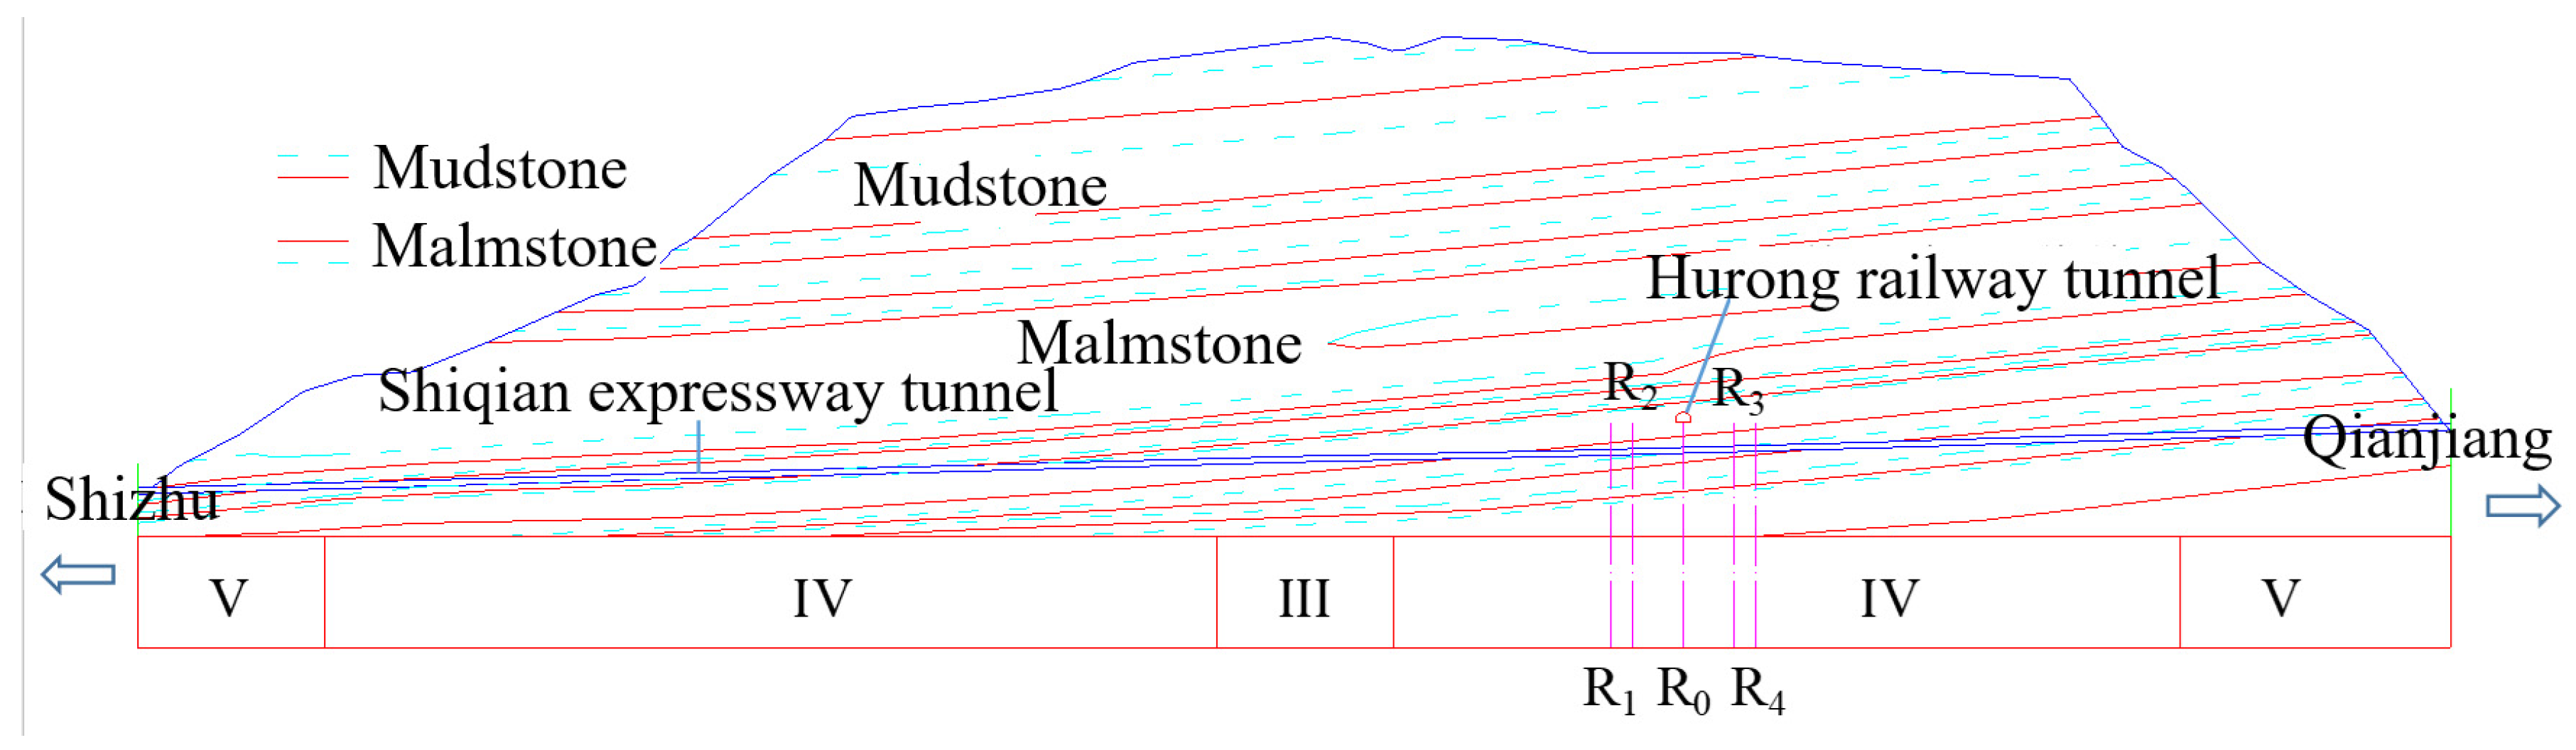
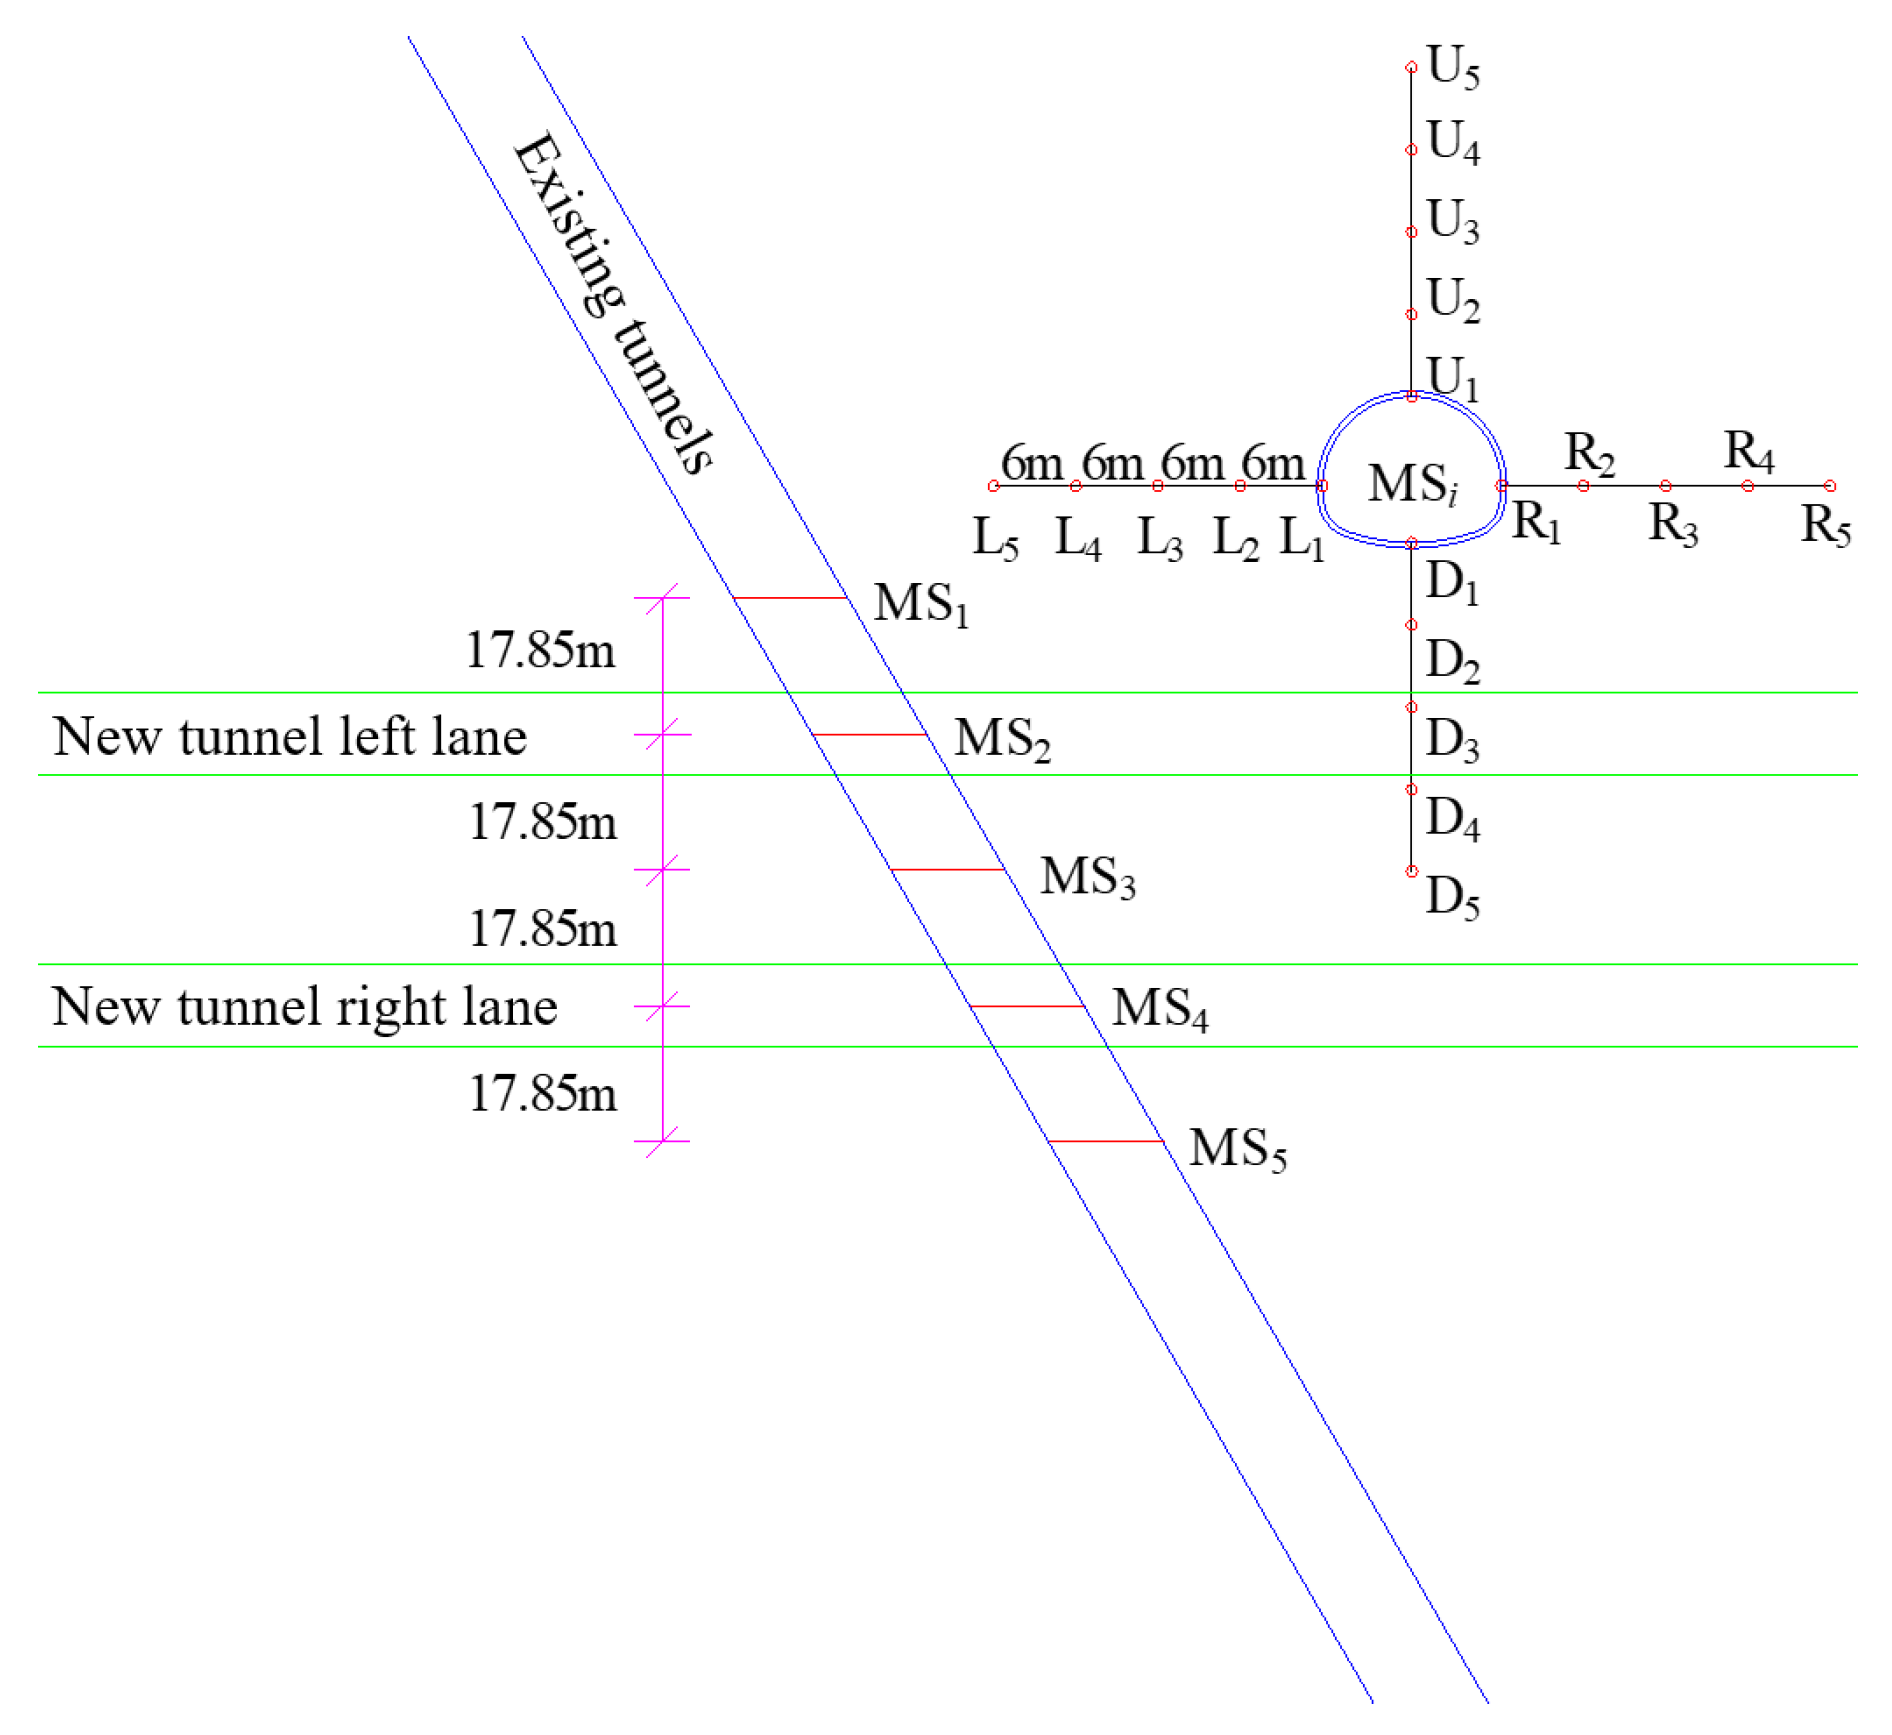
2.1. Project Background

This study relies on the cross-tunneling project of the double-line Shiqian Highway Tunnel with an oblique angle under the Hurong Railway, in the Wanshoushan section [36].
The Shiqian Highway Tunnel is a two-way, four-lane tunnel with a total length of more than 90 km, a clear section width of 10.66 m, a height of 8.60 m, and a clear area of 76.85 m2. The Hurong Wanshoushan Railway is a double-line tunnel with a total length of 264.4 km, a one-sided gradient of 15.5%, a net section width of 12.26 m, a height of 10.03 m, and a headroom area of 99.49 m2.
As shown in Figure 1, the road tunnel goes under the railway tunnel at an oblique angle of 61° and the design line static spacing of the road tunnel at the underpass railway is 25 m.

2.2. Calculation Method

In this paper, based on the results of the impact area of the Wanshoushan double-line cross-tunnel project studied in the literature [36], the rock body in the impact area was optimized by adopting the method of optimizing the surrounding rock grading using photo images and the information of the over-advanced geological prediction; using the disturbance coefficients to quantify the deterioration of the rock properties caused by the static and dynamic load; and determining the mechanical parameters of the rock body in the impact area of the cross-tunnel project, by taking into consideration the influence of the dynamic and static load coupling with the application of Hoek–Brown criterion, which, in turn, revealed the mechanical characteristics of the excavation for the tunnel of the double-line highway tunnel under the influence of the dynamic and static load, under the influence of the tunnel crossing the existing railway.
According to the research results in the literature [36] on the impact area of the double-line underpass tunnel project in Wanshoushan Mountain, we optimize the enclosing rock classification based on photo images and over-advanced geological forecast information; quantify the deterioration of rock properties caused by dynamic and static loads using a perturbation system; determine the mechanical parameters of the rock under the influence of dynamic and static load coupling in the impact area of the cross-tunnel project using the Hoek–Brown criterion; and construct a three-dimensional model, considering the influence of dynamic and static load coupling. A three-dimensional model of the mechanical characteristics analysis of tunnel excavation of the two-lane highway tunnel under the existing railroad is constructed by considering the influence of dynamic and static load coupling. On the basis of analyzing the displacement and stress response law of the existing tunnel and the new tunnel structure in the tunnel excavation process, a reasonable excavation method is given.

2.2.1. Methods for Determining Rock Mass Parameters in Areas Affected by Dynamic and Static Loads

The Hoek–Brown criterion is an empirical guideline for determining the mechanical parameters of a rock mass and includes the GSI (Geological Strength Index) and the rock disturbance coefficient, D.
The expression for the Hoek–Brown empirical criterion [37] is:
σ1 = σ3 + σci[mb(σ3/σci) + s]a
where σ1 and σ3 are the maximum and minimum principal stresses; σci is the uniaxial compressive strength of the rock mass; and mb, s, and a are the semi-empirical parameters of rock properties as a function of the Geological Strength Index (GSI) [38]:
mb = mie[(GSI−100)/(28−14D)]
s = e[(GSI−100)/(9−3D)]
a = 1/2 + (e−GSI/15 − e−20/3)/6
GSI = 1.5Jcond89 + RQD/2
In the formula, Jcond89 is the state of the joints, RQD is the quality of the rock, GSI is the Geological Strength Index, and these three values are in the range of 5~100; mi, the rock material constant obtained from the triaxial compression test of intact rock, can also be determined according to the type of rock, the structure, by taking a value in the range of 5~40; D is the weakening factor for the consideration of the rock body by anthropogenic or natural factors of perturbation, taking a value in the range of 0~1.
(1)
Determination of modulus of elasticity
The modulus of elasticity is an important parameter describing the strength of a material and the modulus of elasticity, Em, (GPa) of a rock is calculated as:
Em = (1 − 0.5D)·(σci/100)0.5·10[(GSI−10)/40], σci ≤ 100 MPa
Em = (1 − 0.5D)·10[(GSI−10)/40], σci > 100 MPa
(2)
Determination of shear strength parameters
The shear strength parameters are cohesion, c, and friction angle, φ [37]. The expressions for the equivalent cohesion, c′, and equivalent friction angle, φ′, of the rock adopted using the Hoek–Brown criterion are, respectively:
c = σ c i [ 1 + 2 a s + ( 1 a ) m b σ 3 n ] ( s + m b σ 3 n ) a 1 ( 1 + a ) ( 2 + a ) 1 + [ 6 a m b ( s + m b σ 3 n ) a 1 ] / [ ( 1 + a ) ( 2 + a ) ]
φ = arcsin [ 6 a m b ( s + m b σ 3 n ) a 1 2 ( 1 + a ) ( 2 + a ) + 6 a m b ( s + m b σ 3 n ) a 1 ]
where σ 3 n = σ 3 max /σci, and for deep tunnels σ 3 max can be determined using the following equation:
σ 3 max / σ c m = 0.47 ( σ c m / γ H ) 0.94
where γ is the bulk weight of the rock mass; H is the burial depth of the tunnel, and when the horizontal stress is higher than the vertical stress, γH in Equation (10) is replaced by the value of the horizontal stress; and σ c m is the strength of the rock mass, which is calculated using the formula:
σ cm = σ c i [ m b + 4 s a ( m b 8 s ) ] ( 0.25 m b + s ) a 1 2 ( 1 + a ) ( 2 + a )
(3)
Disturbance factor of rock mass for tunneling D
The disturbance factor for the rock mass is usually taken empirically, as shown in Table 1.

2.2.2. Determination of Rock Reduction Parameters

1.
Hoek–Brown criterion parameterization
  • (1)
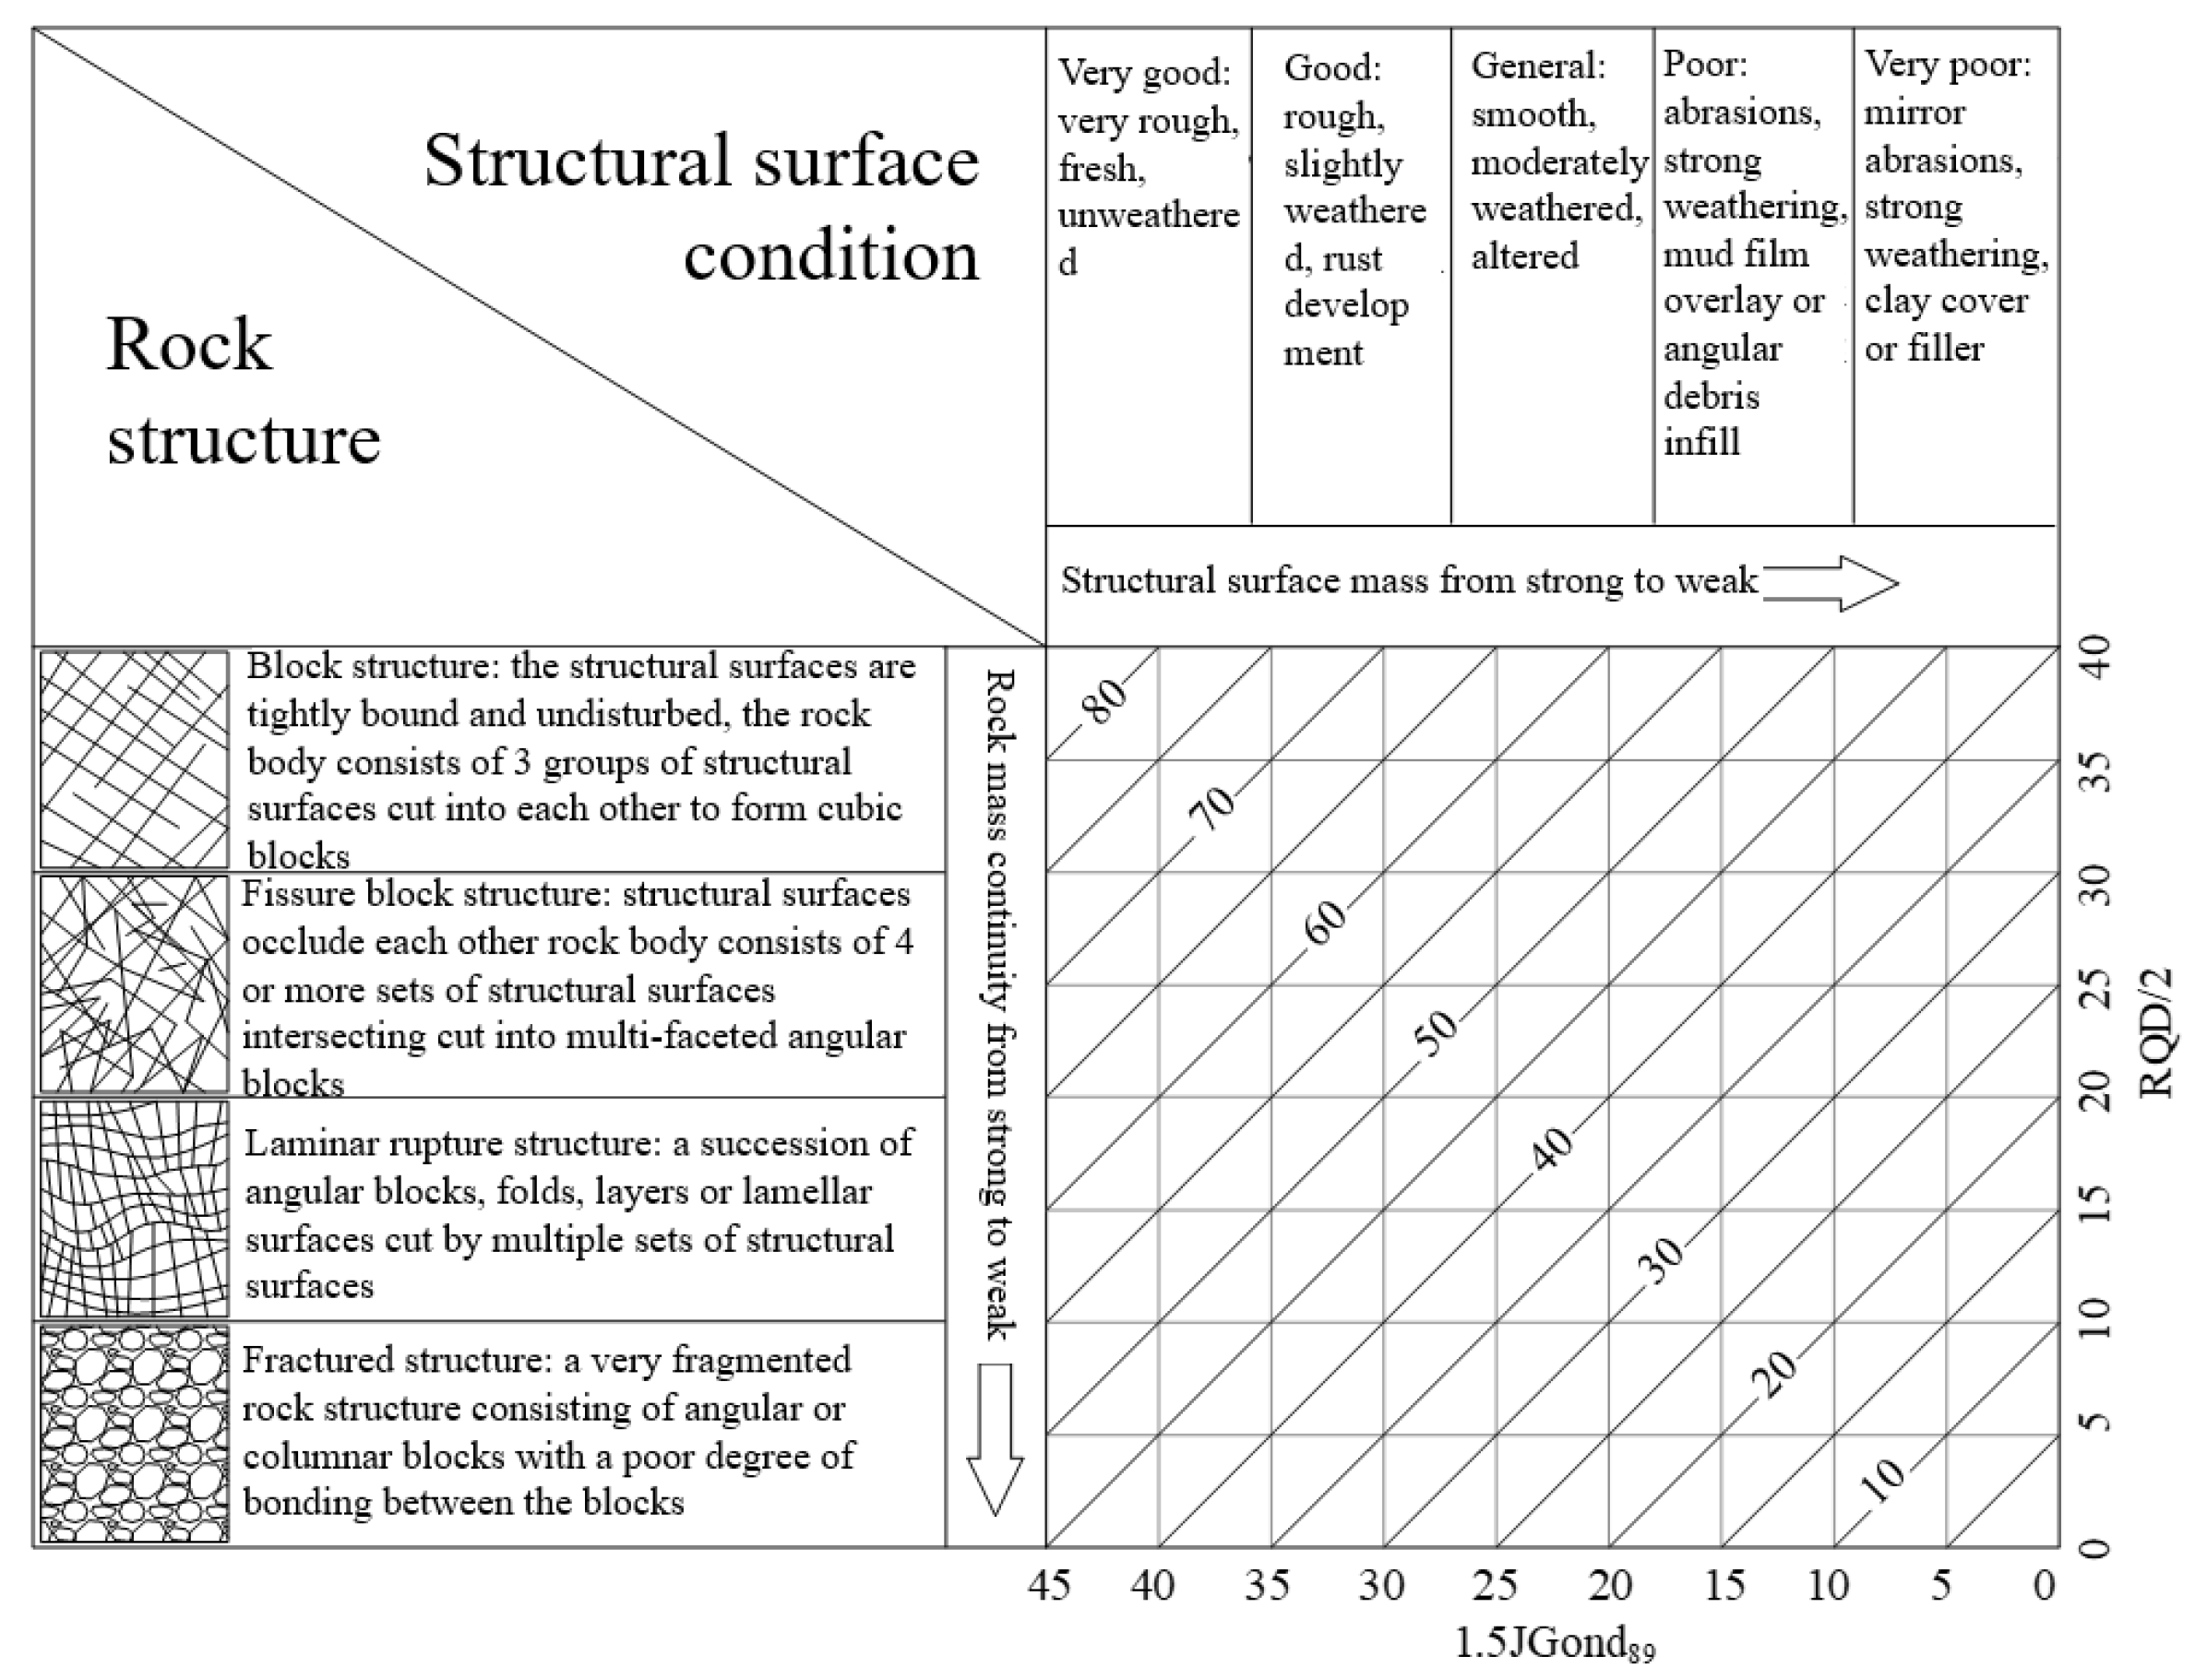
    GSI value determination
The Hoek–Brown criterion parameters were determined on the basis of the distribution profiles of rock layers and the surrounding rock grades in the new tunnels, the overtopping geological forecast, and the observation information of the palm face, combined with the GSI index map proposed by Hoke et al. [38].
    • a.
      Rock layer and surrounding rock grading section
The new Wanshoushan Tunnel is a double-line highway tunnel, the left line intersects with Hurong Railway Tunnel at K3+674.943 (Figure 2 L0) and the right line intersects with Hurong Railway Tunnel at YK3+694.291 (Figure 3 R0). The 60 m before and after the intersection point of the new highway tunnel is the excavation-sensitive area [36]. Preliminarily, the excavation sensitive area is determined as Class IV surrounding rock. Typical cross-sections of 60 m and 85 m before and after the tunnel intersection are extracted for analysis; the left line includes L1 section K3+590, L2 section K3+615, L3 section K3+735, and L4 section K3+760; and the right line includes R1 section YK3+609, R2 section YK3+634, R3 section YK3+754, and R4 section YK3+779.
    • b.
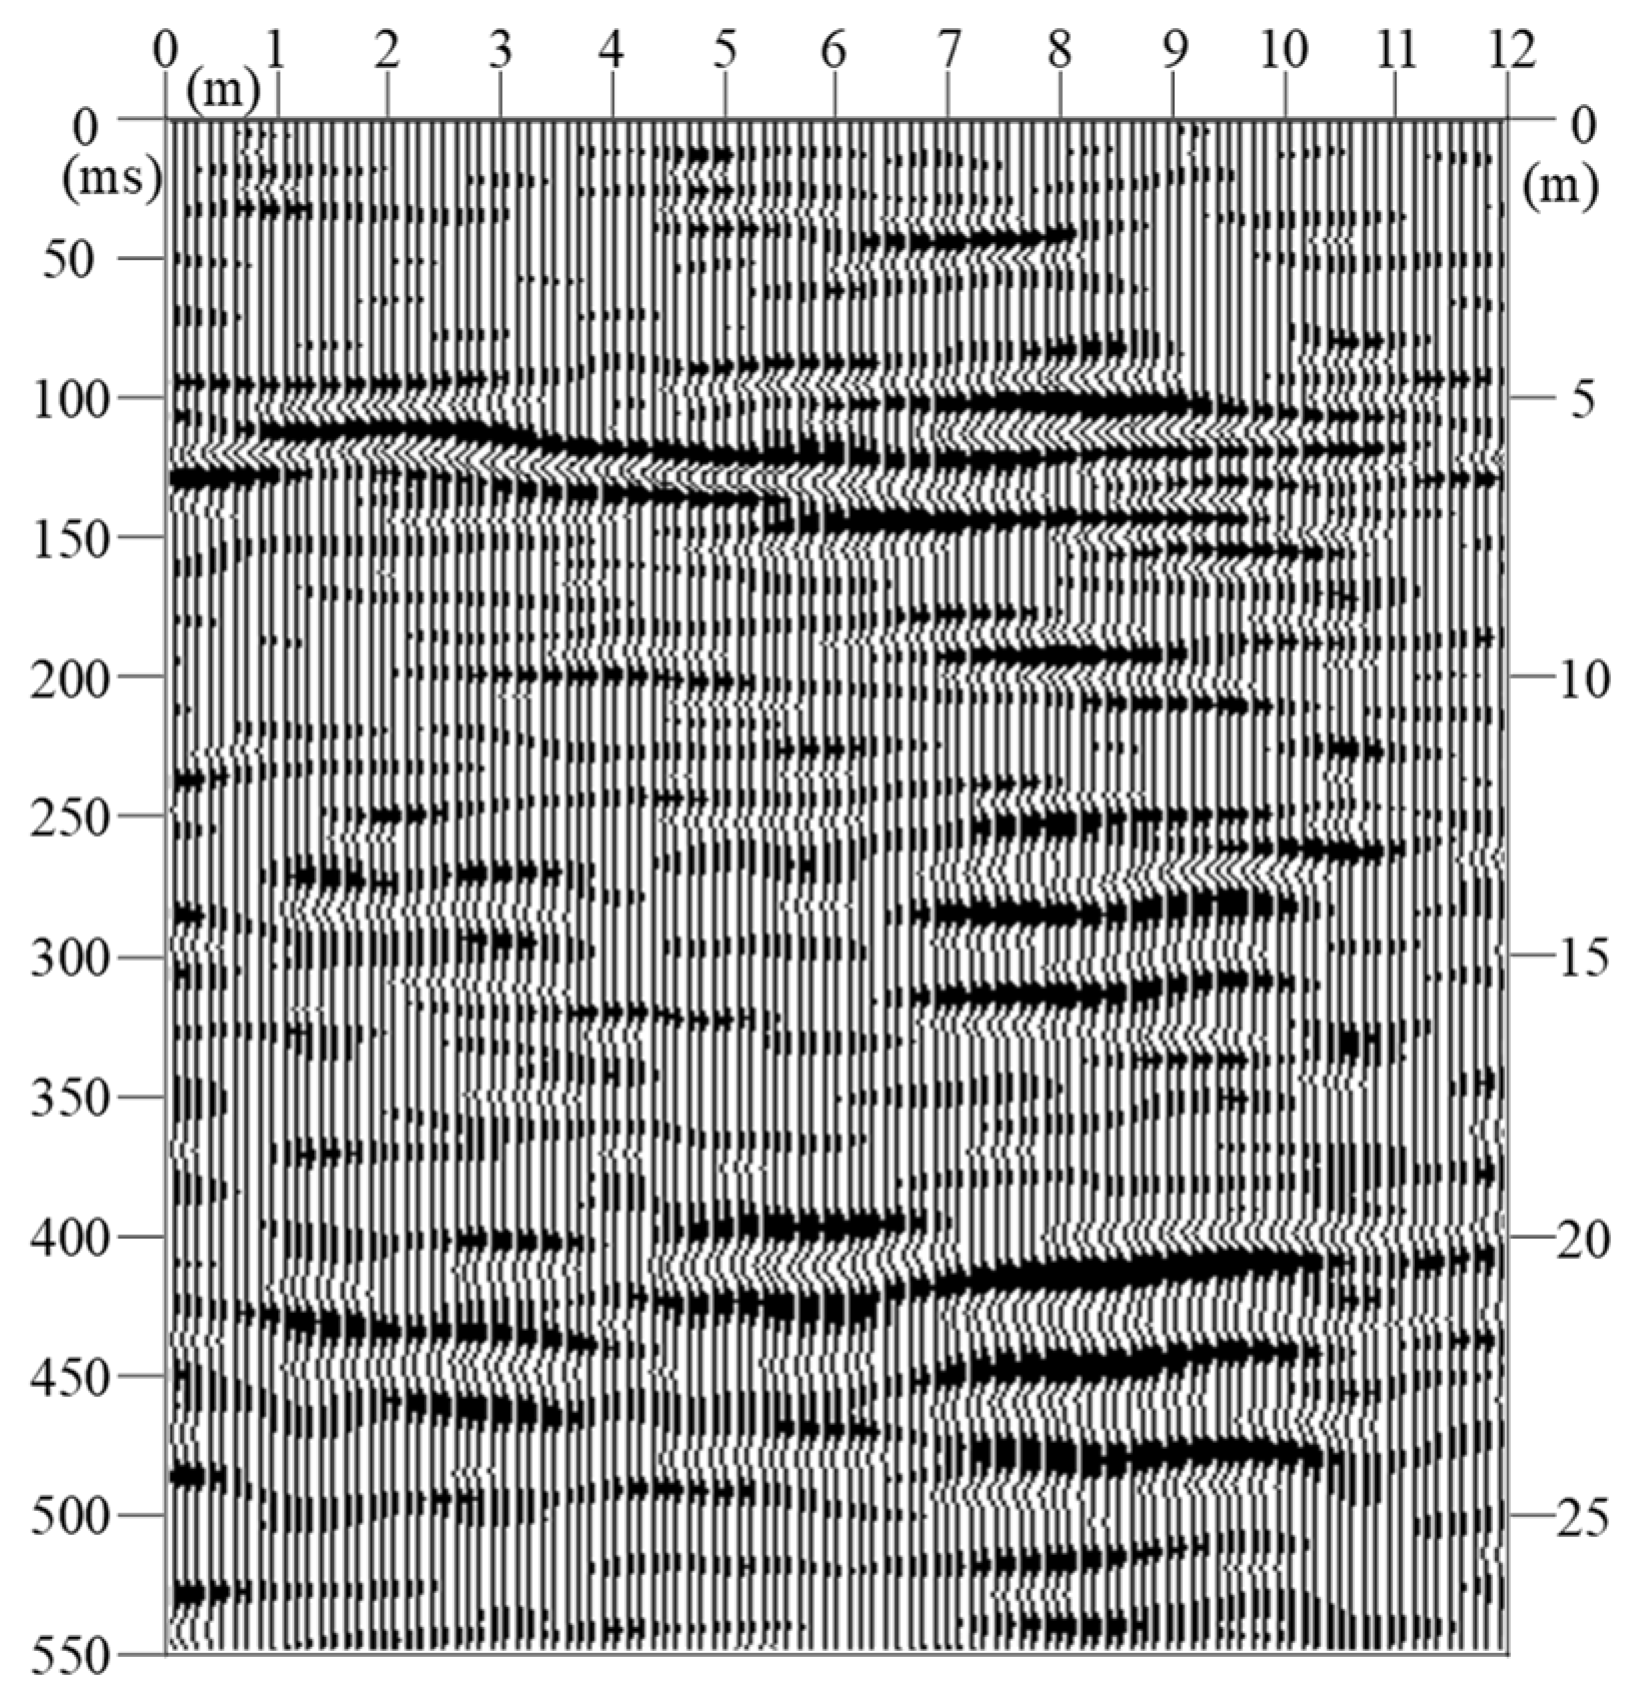
      Over-advanced geological forecast
The equipment used for advanced geological forecasting is the SRI-20 geological radar combined with a 100 MHz antenna. The geological forecast line is 12 m long and distributed in the shape of a zig-zag at the bottom of the upper step of the palm face, 1.2 m away from the height of the lower step, as shown in Figure 4.
    • c.
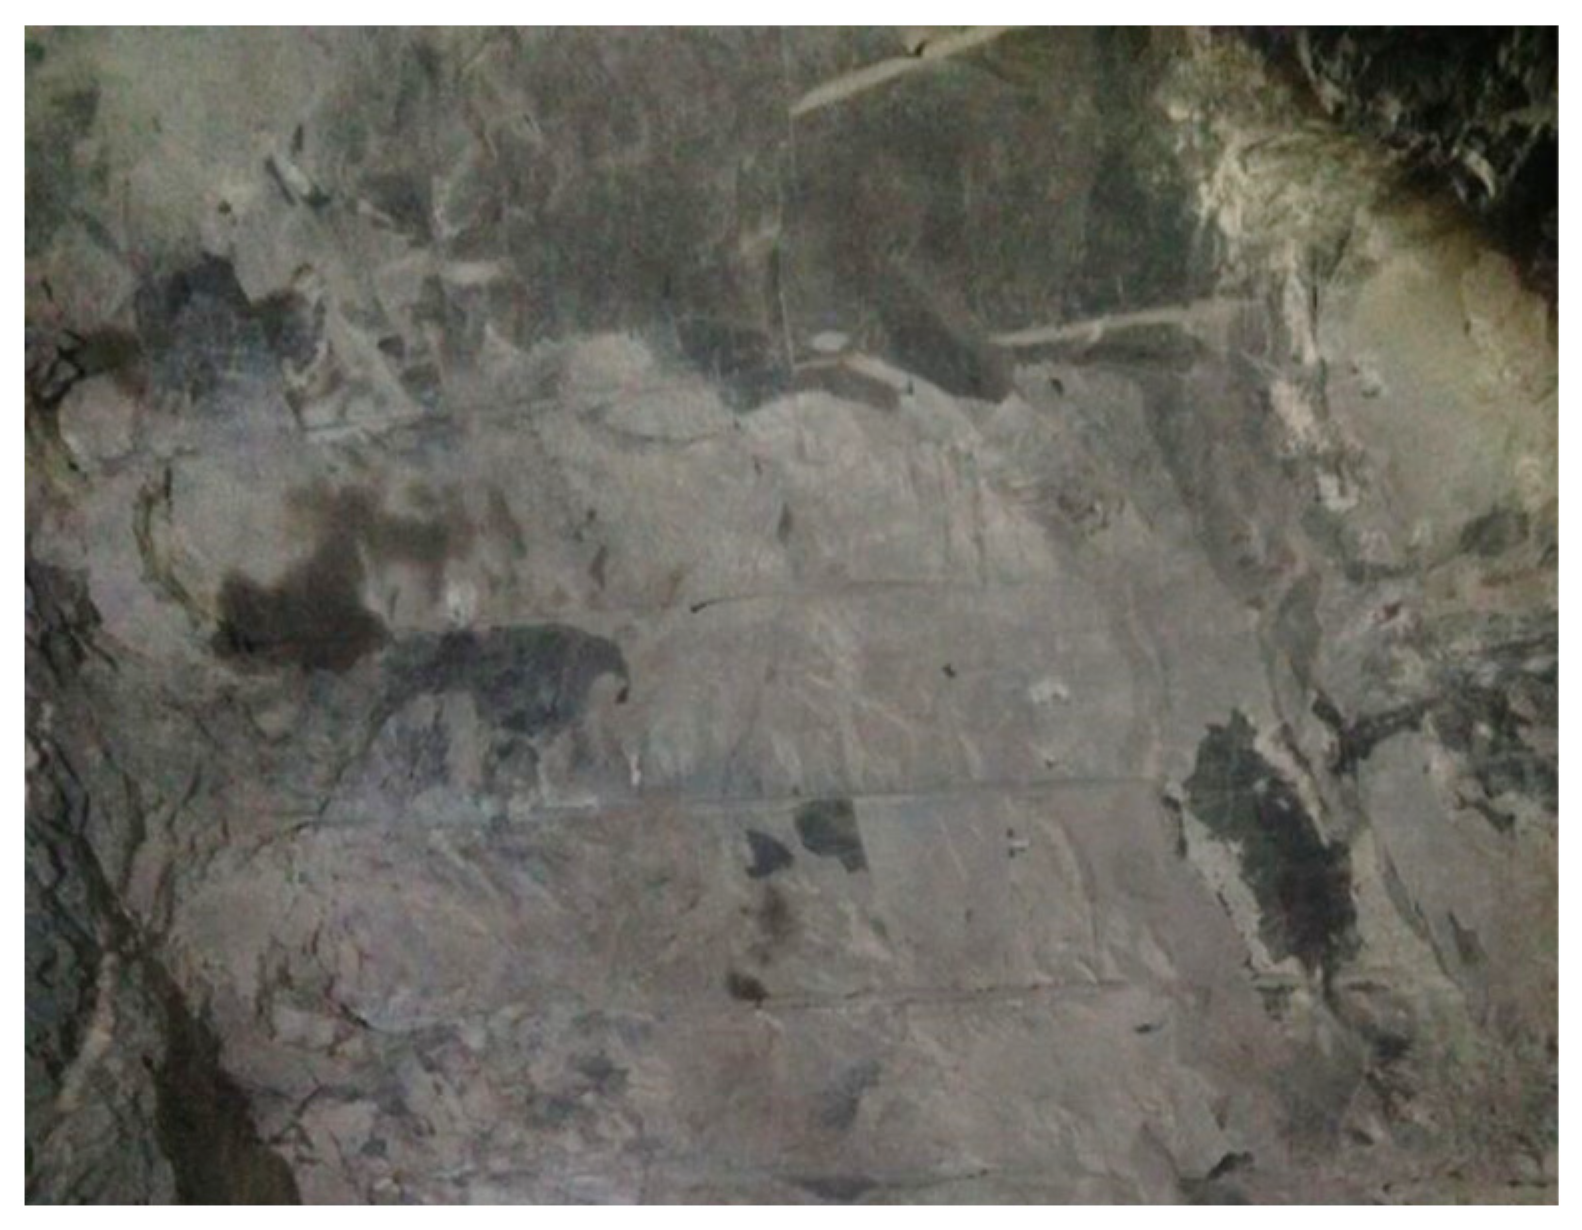
      Left line palm surface observation and radar data analysis
Observed photographs and radar data of the palm face of the four sections of the left line, exemplified by the L1 photographs, are shown in Figure 5 and Figure 6.
The surrounding rocks of the L1 and L2 sections are mainly medium-weathered grayish-white malmstone, with a good integrity and interlayer combination, undeveloped joints and fissures, and a dry palm surface. A small amount of mudstone locally exists in L1, with medium-thickness bedding, while thick bedding is dominant in L2.
The surrounding rock of the L3 section is mainly mudstone, which is a soft rock. The rock body is relatively broken, mainly in thin layers; the combination between rock layers is general; joints and fissures are developed; strong weathering is dominant; and the palm surface is dry.
The surrounding rocks in section L4 are mainly mudstone and there are obvious malmstone and mudstone interlayers within 2 m above the upper step, of which mudstone is a soft rock and malmstone is a hard rock. The rock body is more complete, the combination between the rock layers is general, the joints and fissures are developed, medium weathering is dominant, and the palm surface is drier.
The radar reflection signals of the L1 and L2 sections are strong and the frequency change of electromagnetic wave signals is general and continuous in the same direction; L1 is dominated by medium–low frequency signals and L2 is dominated by medium–high frequency signals. Combined with the condition of the palm surface of the section, it is concluded that the 0~25 m section in front of the L1 and L2 section is mainly malmstone, which belongs to the harder rock; the joints and fissures are not developed; and the integrity of the rock body is better and the surrounding rock is denoted as level IV.
The L3 section radar reflection signal is strong; the electromagnetic wave signal frequency change is general, mainly in the middle and high frequency signals; the isotropic axis is intermittent and local continuous, with no obvious shock wave signal. Combined with the situation of the palm surface in the L3 section, it is concluded that mudstone dominates in the range of 0~25 m, at the front of the L3 section—mudstone is a soft rock, with developed joints and fissures—while the integrity of the surrounding rock is more typical and there are weak and soft surrounding rock segments in the local area; as such, it is a class IV deviation surrounding rock.
The radar reflection signal of the L4 section is strong and the frequency change of the electromagnetic wave signal is typically dominated by a homogeneous medium–low frequency signal, with continuous isotropic axis and no obvious shock wave signal. Combined with the situation of the palm face of the L4 section, it is concluded that mudstone is dominant in the range of 0~25 m, at the front of the L4 section. Furthermore, there may be malmstone and mudstone interbedding in the local area, of which mudstone is a soft rock and malmstone is a harder rock, with developed joints and fissures, while the integrity of the surrounding rock is more typical; as such, it is a class IV surrounding rock.
    • d.
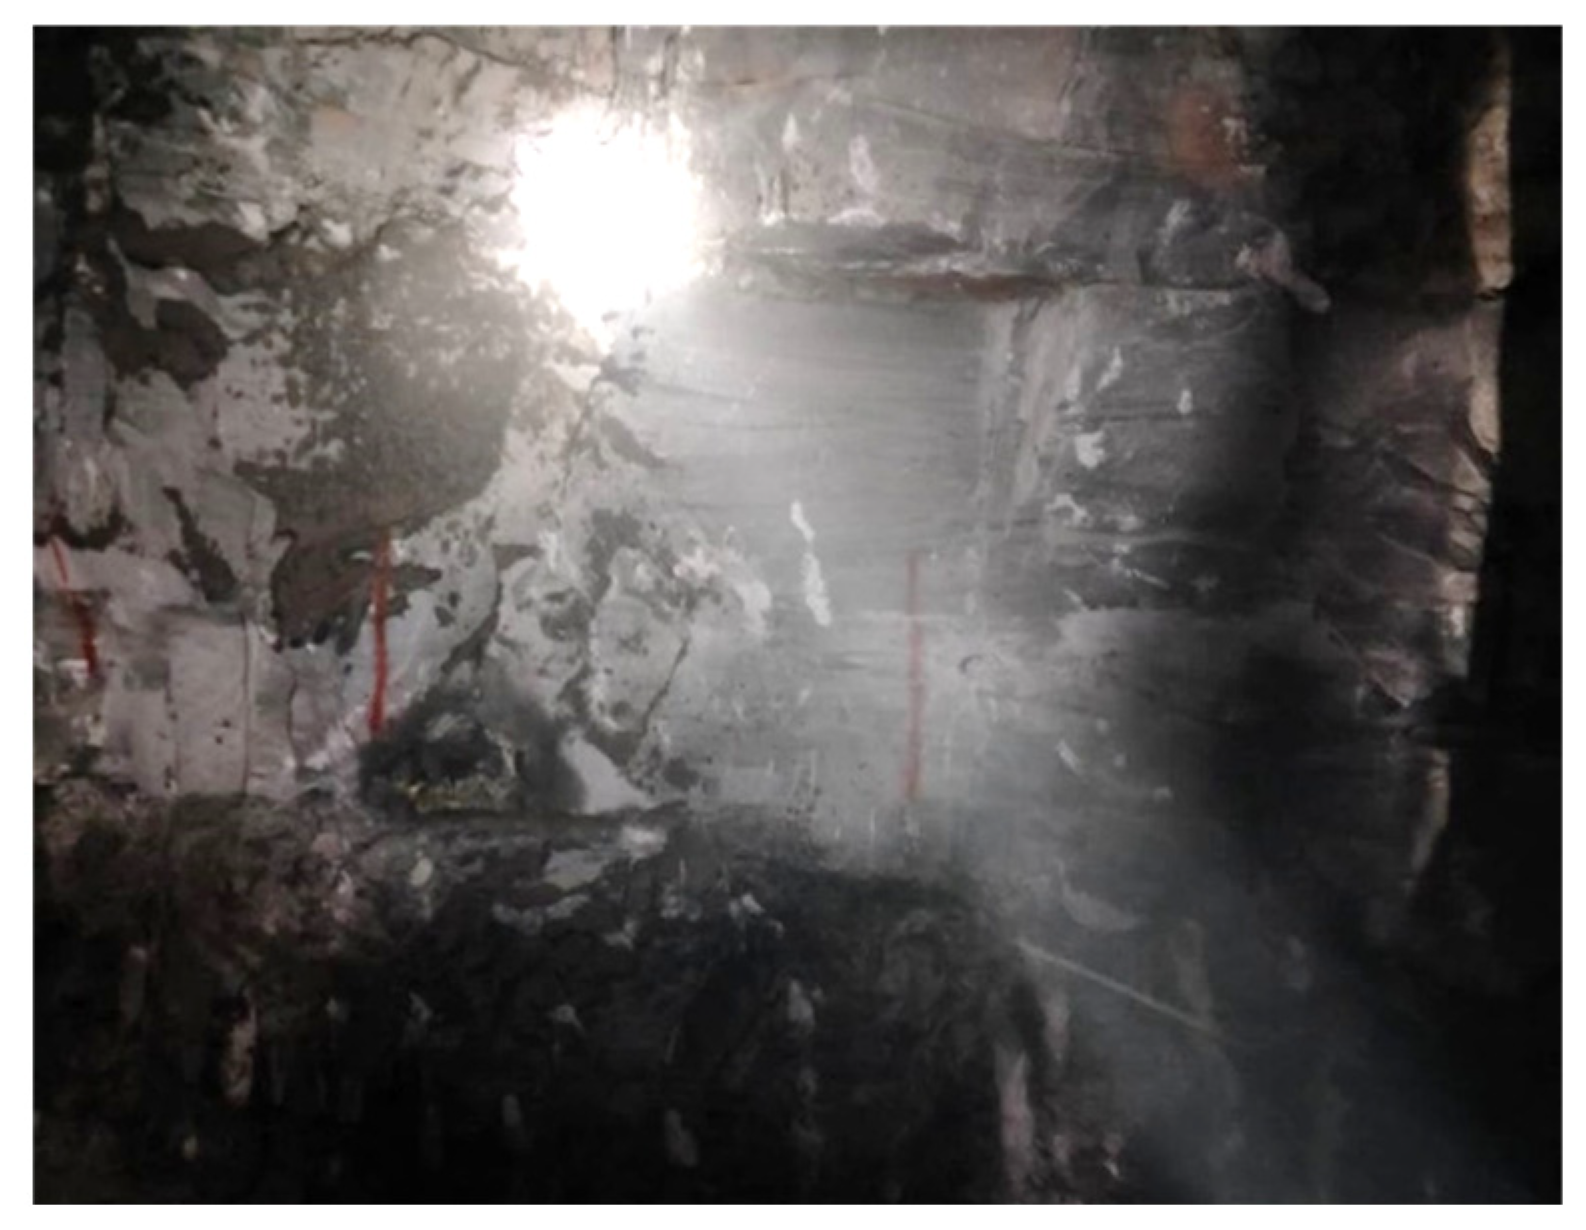
      Observation and radar data analysis of the right line palm surface
Observed photographs and radar data of the palm face of the four sections of the left line, exemplified by the R1 photographs, are shown in Figure 7 and Figure 8.
The surrounding rocks in section R1 are mainly gray–white malmstone; the rock body is complete, mainly with medium-thick lamination; the combination between the rock layers is good; the joints and fissures are not developed; mainly medium weathering is present; and the palm face is dry.
The surrounding rocks in section R2 are mainly malmstone, mixed with mudstone—malmstone and mudstone are both soft rocks—and there is an obvious interlayer in the middle of the palm face. The surrounding rocks are mainly medium–thick bedded, the integrity of the rock body is typical, the combination between the rock layers is typical, the joints and fissures are developed, strong weathering is dominant, and the palm surface is dry.
The surrounding rocks in section R3 are mainly mudstone and malmstone; mudstone is a soft rock and malmstone is a hard rock. The rock body is more broken, mainly in thin layers, and the combination between the rock layers is poor.
The R4 section is mainly surrounded by mudstone, which is a soft rock; is surrounded by thin layers; the integrity of the rock body is typical; and the combination between rock layers is generally better. The R3 and R4 sections have developed joints and fissures, which are mainly strongly weathered, and the palm surface is dry.
The radar reflection signal is stronger in section R1 and weaker in section R2. The R1 and R2 sections’ electromagnetic wave signal frequency change is typical, mainly in the low-frequency signal region, and the isotropic axis is intermittent. Combined with the condition of the palm surface, it is concluded that the 0~25 m section surrounding sections R1 and R2 is dominated by malmstone, which belongs to the harder rock, but mixed with mudstone, which belongs to the softer rock. The joints and fissures are developed, and the rock body integrity is typical, resulting in it being a class IV surrounding rock.
The R3 section’s radar reflection signal is strong and its electromagnetic wave signal frequency change is typical, mainly in the middle- and high-frequency signal regions, and the same direction axis is locally continuous, locally intermittent, and its amplitude is typical. Combined with the condition of the R3 section’s palm face, it is concluded that the 0~25 m range is dominated by mudstone and malmstone, with mudstone belonging to the softer rock and malmstone belonging to the harder rock. The joints and fissures are developed in the range of 0~10 m in front of the palm face, and the integrity of the peripheral rock is typical; as such, it is a peripheral rock of level IV deviation.
The radar reflection signal of the R4 section is strong, and the frequency change of its electromagnetic wave signal is typical, dominated by medium- and high-frequency signals, with the same direction axis being continuous, without an obvious shock wave signal. Combined with the situation of the R4 section’s palm face, it is concluded that the range of 0~25 m, in front of the R4 section, is dominated by mudstone, which is a soft rock. The joints and fissures are undeveloped and the integrity of the surrounding rock is typical; as such, it is a class IV deviation surrounding rock.
The photo of the new tunnel palm face, as well as the results of the analysis of the overtopping geological prediction radar data, are in good agreement with the grading profile of the rock layers and the surrounding rocks. Therefore, it is, finally, determined that the malmstone layer of the cross-tunnel project (assuming that the grading of the surrounding rocks of the existing tunnels is the same as that of the new tunnels) is a Class IV surrounding rock, while the mudstone layer is a Class IV deviated surrounding rock and, at the same time, with reference to the GSI index diagram (Figure 9), it is determined that the malmstone and mudstone layers have a GSI value of 55 and 45.
  • (2)
    Determination of rock integrity coefficient mi
Based on the palm face observation and overtopping geological forecast information, the integrity coefficient of the rock, mi, was determined by rock type and structure [38] (Table 2), and the integrity coefficients of malmstone and mudstone formations of the cross-tunneling project were determined to be 21 and 9.
  • (3)
    Determination of uniaxial compressive strength, σci, of rocks
A uniaxial compression test was carried out to determine the uniaxial compressive strength of malmstone and mudstone in the cross-tunnel project, which were determined to be 8.9 MPa and 3.84 MPa, respectively.
  • (4)
    Determination of disturbance coefficient, D
Based on the disturbance situation of the field tunnel [36], referring to the rock disturbance coefficient value chart (Table 1), it is determined that the disturbance coefficient of the area affected by blasting and excavation of the cross-tunnel project is 0.5, that of the area affected by static excavation is 0, that of the area affected by the train dynamic load is 0.2, and that of the area overlapping the blasting load and the train dynamic load is 0.7.
  • (5)
    Determination of rock mass-related parameters for cross-tunneling project
The average depth of the new tunnel is 460 m, the average depth of the existing tunnel is 420 m, the average depth of the overlapping area is 445 m, and the average weight of the overlying rock layer—the average value of the weight of malmstone and mudstone—is 23.51 kN/m3. The values of GSI, mi, σci, D, γ, and H will be input into the corresponding formulas, which will, subsequently, provide the values of the relevant parameters of the rock body in the area affected by the cross-tunneling project; the details are shown in Table 3.
2.
Determination of mechanical parameters of rock body
The values of the relevant parameters in Table 3 of the rock mass, as well as those reported in the literature [36], were input into the previous equations to derive the parameters of elastic modulus, equivalent cohesion, equivalent internal friction angle, and Poisson’s ratio for different influence regions [39], which are detailed in Table 4.
3.
Model building
The mechanical parameters of the rock body in the different influence areas are input in the Wanshoushan double-line cross tunnel engineering model to obtain a mechanical characteristics analysis grid model of the tunnel excavation under the existing railway, as shown in Figure 10.
4.
Calculation of working conditions
Combined with the design of the tunnel excavation in the cross section, four working conditions are selected for the mechanical characterization of the excavation methods in the influence area, and the numerical calculation conditions are as follows: upper and lower step blasting method excavation (UPBM), upper and lower step static method excavation (UPSM), CD blasting method excavation (CDBM), and CD static method excavation (CDSM), as shown in Figure 11 and Figure 12. The blasting and static method excavation is determined based on the mechanical parameters of the rock body computed by the different perturbation coefficients, D, in the Hoek–Brown criterion.
The left line tunnel is set as the first excavation tunnel, which is excavated from the inlet (left) to the outlet (right). In order to reduce the boundary effect, the excavation process of the new tunnel is carried out within 140 m of the analyzed area, the extracted time steps, Si, are numbered as S1, S2, S3, …S10, the left and right line tunnels differ by 3 Si, and the length of Si is 20 m, as shown in Figure 13.

3. Results and Discussion

3.1. Analysis of Rock Formations in the Area of Influence

Tunnel excavation and support will change the displacement and stress of the initial stress field of the surrounding rock and form a new equilibrium stress field. In order to reveal the mechanical response mechanism of the underpass tunnel excavation project, the total displacement and von Mises stress evolution characteristics of the cross-tunneling project were analyzed by extracting different time step data as an example of the working conditions of the upper and lower step blasting method.

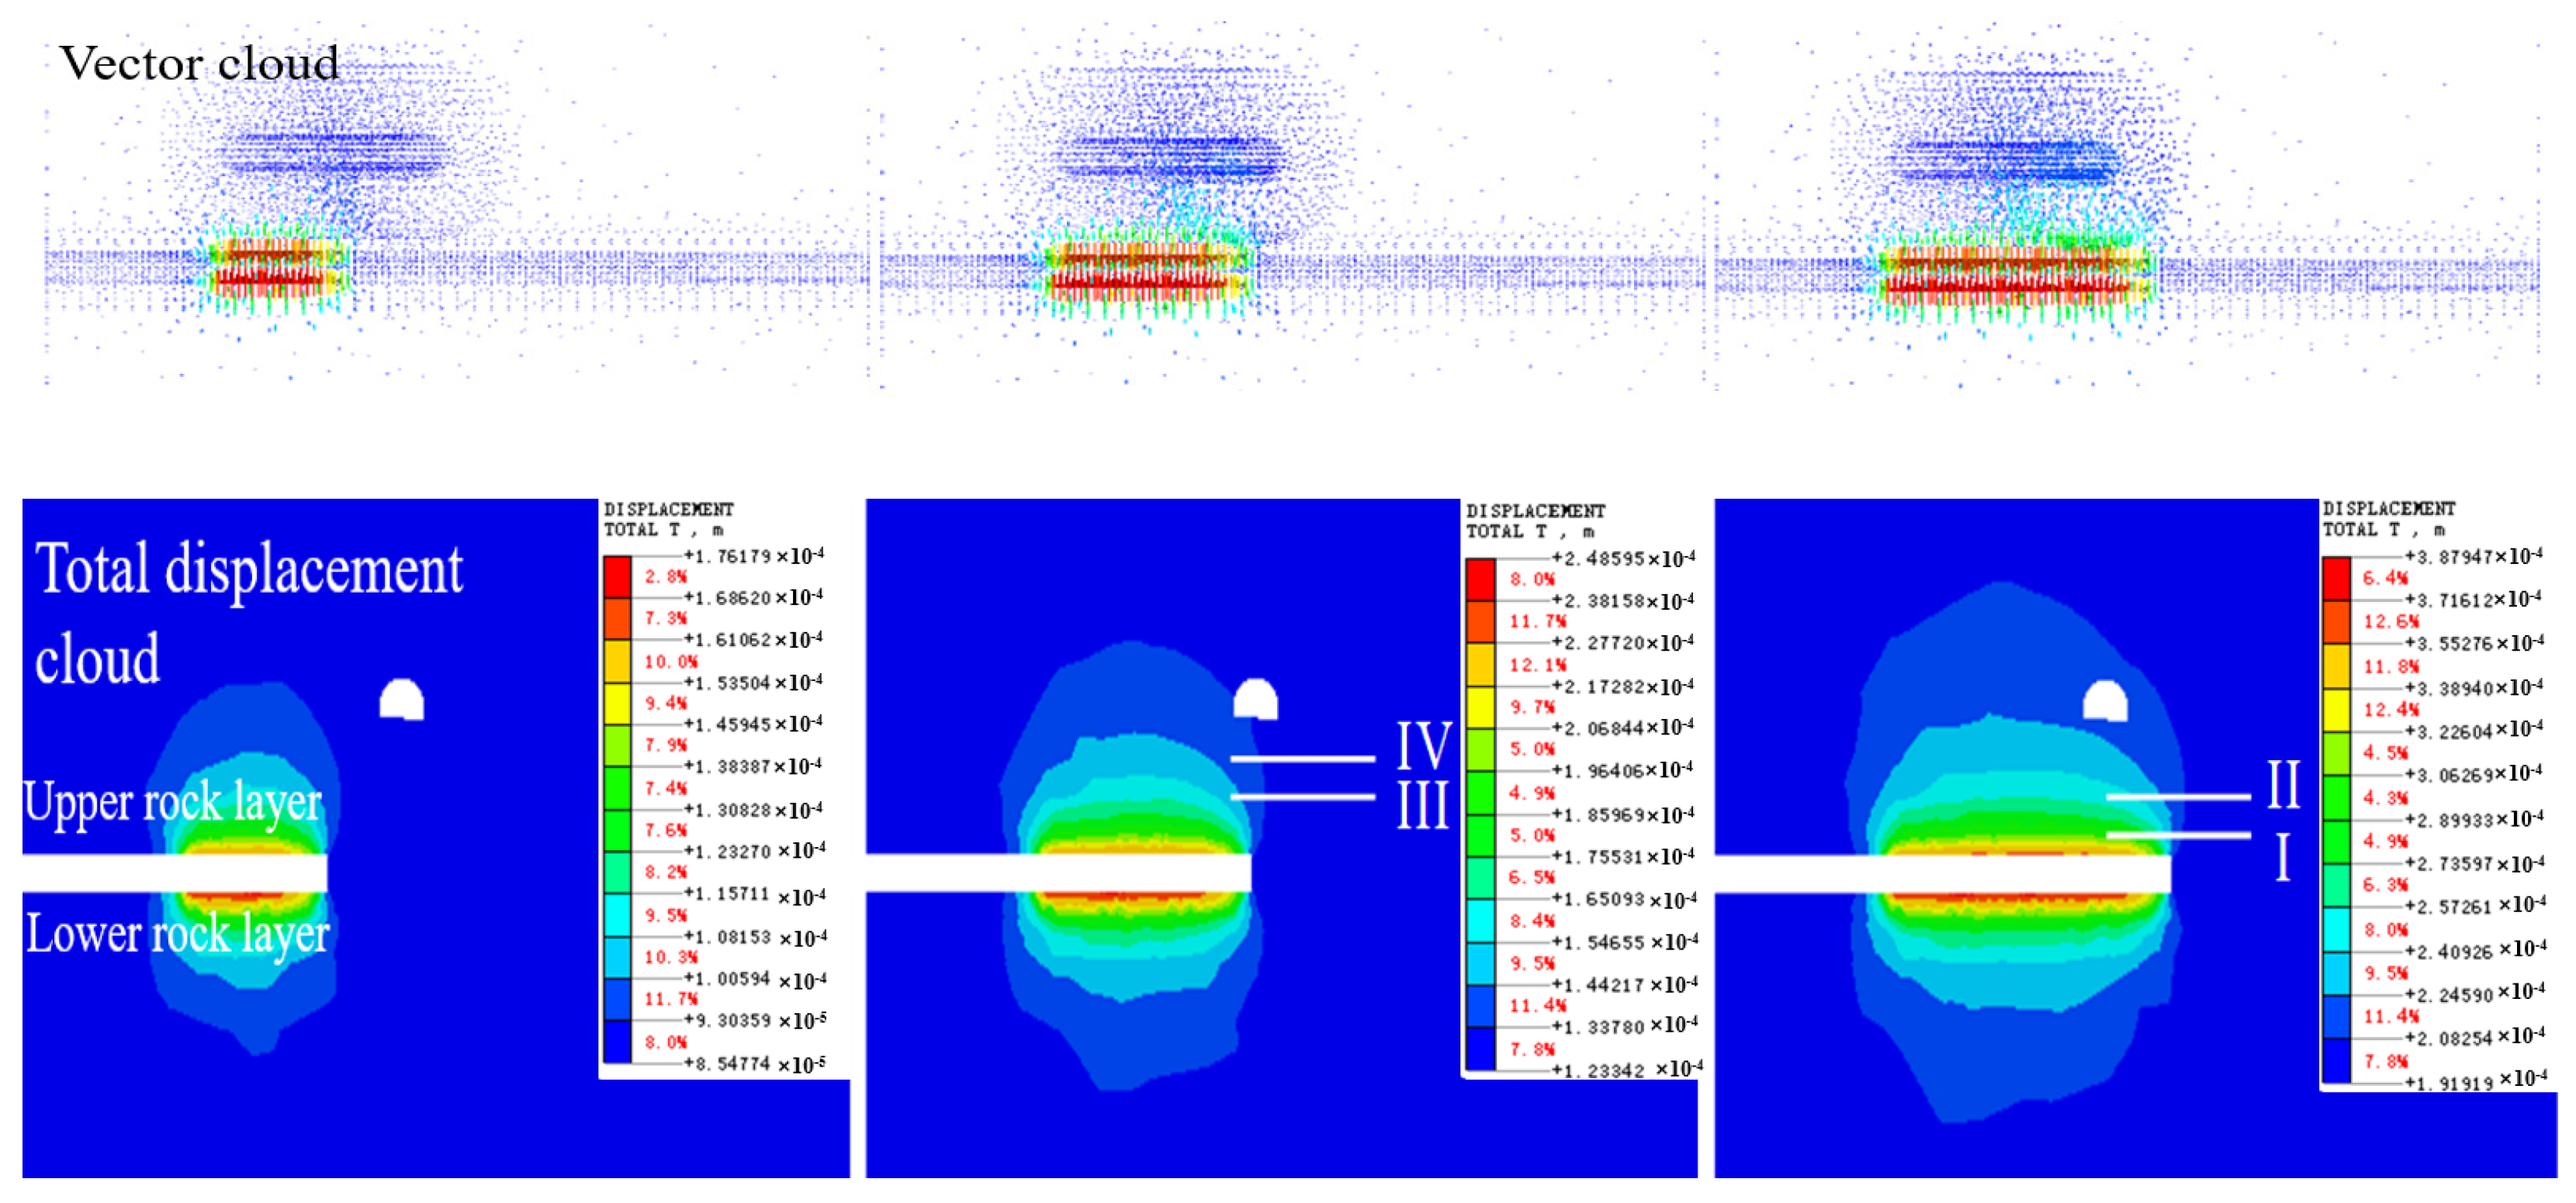
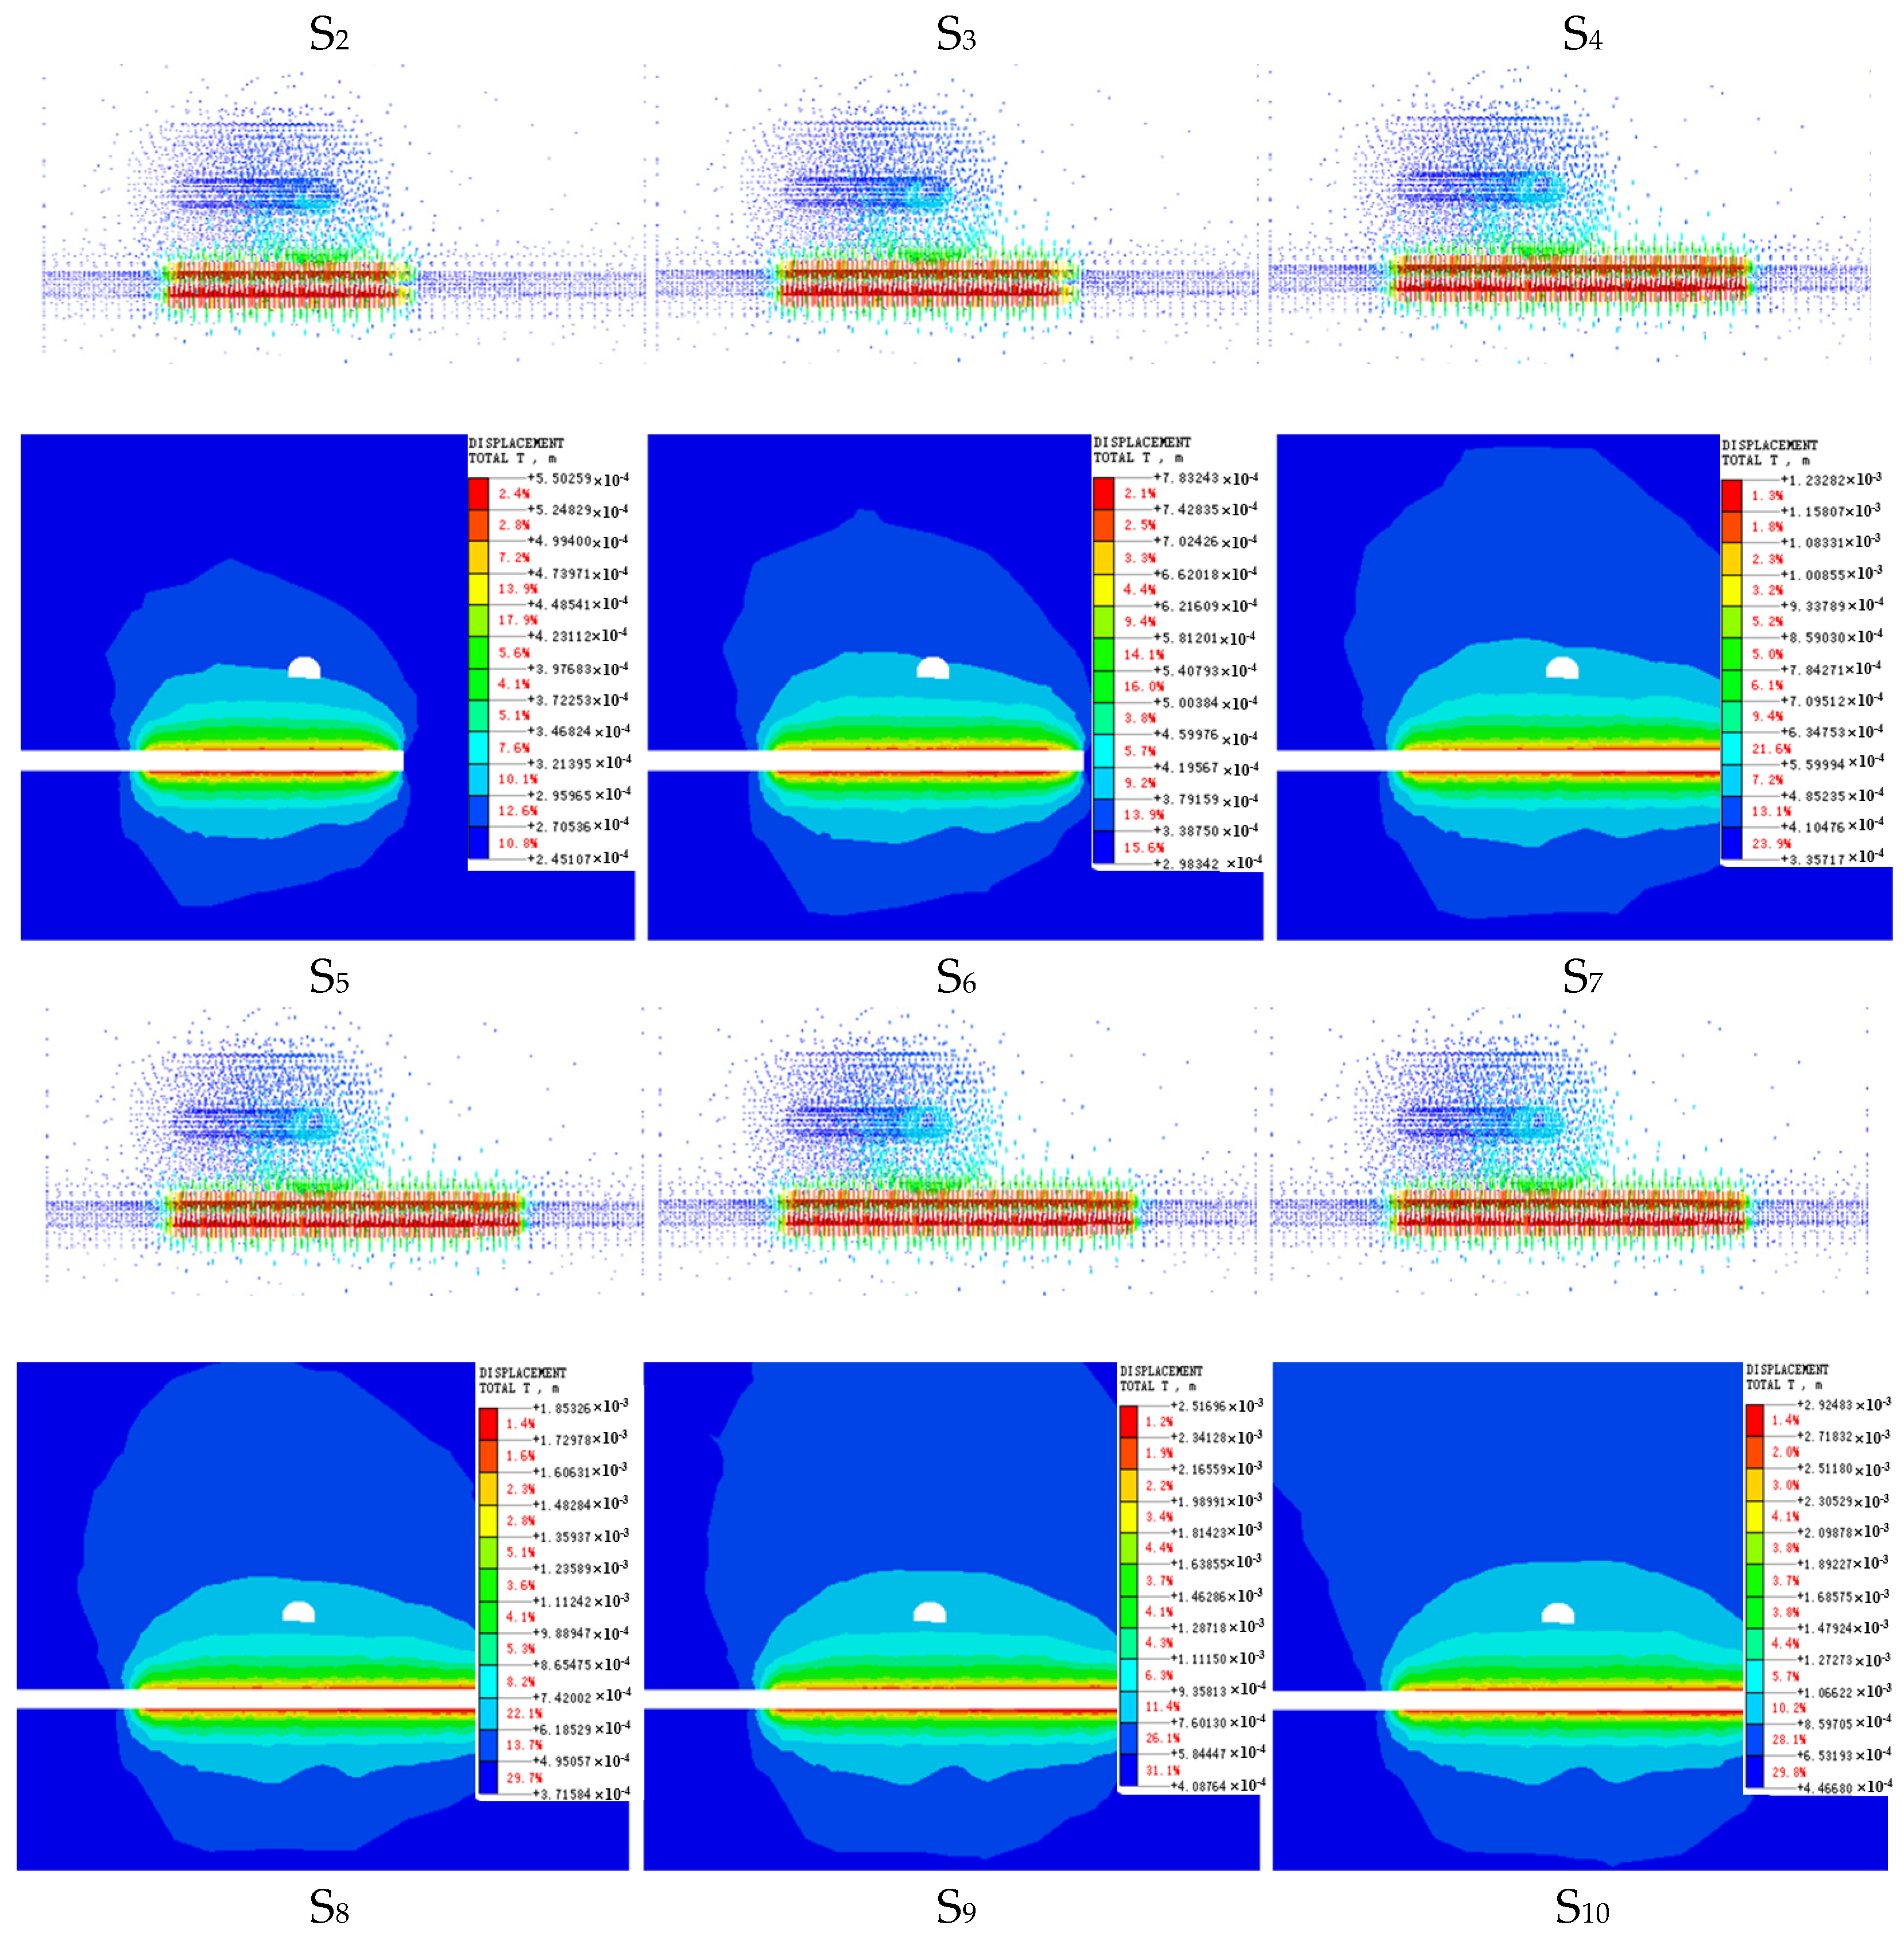
3.1.1. Total Displacement Response

The total displacement response characteristics of the cross-tunneling project were analyzed based on the vector and total displacement cloud maps of the axial profile of the new left-lane tunnel, the axial profile of the existing tunnel, and the monitoring point data.
(1)
Vector versus total displacement cloud analysis
Figure 14 shows the axial profile vector and total displacement of the new left tunnel. After the excavation and support of the new tunnel, the upper rock layer moves downward and the bottom rock layer moves upward. The displacement-affected area is divided into strong disturbance area I, medium disturbance area II, low disturbance area III, and slight disturbance area IV, which are symmetrically distributed.
As the excavation progresses, the range of each influence area tends to increase. In the upper rock layer, the strong disturbance area ranges from 1 to 2 times the diameter of the hole, the medium disturbance area ranges from 0.5 to 1 times the diameter of the hole, the low disturbance area ranges from 0.8 to 3.5 times the diameter of the hole, and the micro-disturbance area has a large range. In the bottom rock layer, the strong disturbance region ranges from 1 to 1.5 times the hole diameter, the medium disturbance region ranges from 0.5 times the hole diameter, the low disturbance region ranges from 0.5 to 2 times the hole diameter, and the micro-disturbance region ranges from 2 to 4 times the hole diameter.
Figure 15 shows the axial profile vector and total displacement cloud diagram of the existing tunnel. After the excavation and support of the new tunnel, the tunnel vault sinks, the floor slab bulges, and the side walls move outward. The displacement areas of the upper and lower rock layers of the new tunnel include the following four areas: strong disturbance area I, medium disturbance area II, low disturbance area III, and micro-disturbance area IV, while the displacement areas of the rock layers of the sidewalls are mainly in the low-disturbance area III and micro-disturbance area IV.
As the tunnel excavation progresses, the height and width of the upper and lower arch influence zones of the tunnel increase, while the lateral direction does not change much. The left tunnel and right tunnel excavation and support process of the strong disturbance area and the medium disturbance area have similar change rules and expand separately; the low disturbance and micro-disturbance areas are based on the first excavation impact area expanding in concert; the middle area of the tunnel exists in the micro-disturbance and undisturbed areas.
(2)
Analysis of monitoring point data
Five typical profiles are selected at an interval of 17.85 m in the Y-axis direction of the cross-tunneling project, four 24 m-long survey lines are arranged in each profile, and five survey points at an interval of 6 m are arranged on each survey line, as shown in Figure 16.
Figure 17 shows the existing tunnel’s profile measurement point excavation data extraction time step and the total displacement change curve, which is analyzed using the different profile measurement point displacement evolution law obtain the displacement characteristics of the measurement point.
Vaulting points: The tunnel structure points in the middle profile of the left and right tunnels (MS3) were affected by the two tunnel excavations and had the largest total displacement, followed by the left and right tunnel profiles (MS2 and MS4) with comparable displacement values, and, finally, by the MS1 and MS5 tunnel structure points, with the MS5 tunnel structure point having a larger displacement than that of the MS1 point. With the excavation time step (S1 and S2), MS1 and MS2 profile points are the first to produce a displacement disturbance, due to the new tunnel and the existing tunnel at a diagonal angle. The left line intersection with the latter time step (S3 and S4) displacement growth slope is the largest, ranging from the tunnel structure measuring point to a point away from the gradually decreasing tunnel body measuring point displacement value, with the difference between the measuring points demonstrating a trend of growth; the S5~S7 excavation process of the displacement value of the measuring points demonstrates a trend of growth; however, the slope tends to decrease. After S8 excavation, the slope change tends to stabilize and the difference between the measuring points does not change much. The MS3 profile from the left line excavation to the intersection (S3) of each measuring point began to produce a displacement perturbation; to the right line intersection after the excavation (S4~S7), the slope of the growth of the displacement value of each measuring point remains stable; after that (S8~S10), the displacement value of each measuring point shows a trend of growth, the slope shows a tendency to reduce, and the difference between the measuring points does not change much. In the MS4 profile, the displacement difference between measuring points is not obvious during the excavation of the left line (S1~S6), the displacement difference between the right line excavation to the intersection point and the next step (S7 and S8) shows an increasing trend, and, after that (S9~S10), the difference does not change much; when affected by the excavation of the left tunnel (S1~S4), the displacement of the measuring points away from the cave body gradually increases. In the MS5 profile, in the left line excavation to the right line excavation to the intersection process (S1~S7), the displacement difference between measurement points is not obvious, while for (S8 and S9), the displacement difference is increasing; in the S1~S6 excavation process, the displacement difference between measurement points is not obvious. In the S1~S6 excavation process, from the tunnel structure measuring point to a point away from the hole body measuring point, the displacement value gradually increased, with the difference between the measuring points being very small; in the S8~S9 excavation process, from the tunnel structure measuring point to a point away from the hole body measuring point, the displacement value gradually decreased; the right line intersection S7 excavation process for the left and right lines of the tunnel excavation displacement perturbation impacts the switching time period.
Bottom plate measurement points: the left and right tunnel profiles (MS2, MS4) and the left and right tunnel intermediate profiles (MS3) have comparable displacement values, which are larger than that of the MS5 tunnel structural measurement point. The MS1 tunnel structural measurement point has the smallest displacement value; the MS1 profile measurement point generates a displacement perturbation after the excavation of S2, and the slope of the displacement growth of the left intersection and the latter step (S3 and S4) has a high value. The slope of the displacement growth of the various measurement points in the process of excavation from S5 to S7 gradually becomes smaller, and the slopes of S7 and S8 are gradually reduced. The slope gradually becomes smaller and, after S8 excavation, the displacement slope of each measurement point does not change much, the displacement difference between the measurement points tends to stabilize, the displacement value gradually decreases from the tunnel structure measurement point to the measurement point far away from the cave body, and the displacement values of the D1 and D2 measurement points are similar. The MS2 profile measurement point produces a displacement perturbation after the excavation of S3, and the slope of the displacement growth of the left line intersection is the largest at the S4 step after the left line intersection, and the displacement of the measurement points changes little, with the slope of the measurement points increasing only by a little. The slope change is not big, the displacement difference between the measuring points tends to be stable, the displacement value gradually increases from the tunnel structure measuring point to the measuring point far away from the cave body, and the displacement difference between the measuring points also tends to increase. The MS3 profile measuring point produces a displacement disturbance after S3 excavation and the displacement growth slope of the left line intersection and the latter step (S4 and S5) is high; S6 excavation produces a displacement disturbance and the displacement of the D5 measuring point tends to be stable; D1~D4 measuring points tend to be stable and the displacement of the D5 measuring point tends to be stable. After the excavation of S7 and S8, the slope of the displacement growth of the D1~D4 measuring points tends to stabilize and the displacement difference between the measuring points does not change much; the displacement value gradually decreases from the measuring point of the tunnel structure to the measuring point far away from the cave body, and the displacement values of the D1 and D2 measuring points are similar. The displacement difference between the measuring points in the left excavation process (S1~S6) is not obvious, and the displacement value from the tunnel structure measuring point to the measuring point away from the hole body is gradually decreasing; the displacement value of each measuring point is similar after the excavation value intersection, the slope of the displacement growth of each measuring point is the largest after the excavation of S8, the slope of the displacement growth of each measuring point tends to be stable after that, the difference in the displacement value of each measuring point does not change much, and the displacement value of each measuring point gradually increases from the measuring point of the tunnel structure to the measuring point away from the hole body. After S7 excavation and support, the displacement of each measuring point is obviously disturbed and the displacement value of the tunnel structure measuring point becomes the minimum value; after S7 excavation and support, the displacement growth slope of each measuring point is the largest and the displacement values of D1~D4 are similar; after that (S8~S10), the displacement of the tunnel structure measuring point tends to be stabilized and the slope of the displacement growth rate of the D1~D4 measuring points decreases.
Left side wall measurement point: The slope of the MS1 profile measurement point in the S2~S3 excavation support after displacement growth is high and the displacement value gradually increased from the tunnel structure measurement point to the point away from the hole body measurement; after (S4~S10), the displacement growth slope gradually reduced, the L1~L4 measurement point displacement values are similar and at a greater value than the L5 displacement value. The slope of the MS2 profile measurement point in the S2~S4 excavation support after displacement growth is high and the displacement value gradually increased from the tunnel structure measurement point to the point away from the hole body measurement; after (S5~S10), the displacement growth slope gradually reduced and, after, the tunnel through the displacement value of each measurement point does not have much difference. The slope of the MS3 profile measurement point in the the S2~S6 excavation support after displacement growth is high and there are not many changes, with the difference in the displacement value of the measurement point being stable; then (S7~S10), the displacement value is similar and greater than the L5 displacement value. The slope of displacement growth in S2~S6 is high and few changes are observed, with the displacement difference between each point being stable; after that (S7~S10), the slope of displacement growth decreases gradually and the displacement difference between each point does not show much difference after tunnel penetration; the slope of displacement growth in S2~S6 shows an increase and the displacement difference between each point is also increasing; after that (S7~S10), the slope of displacement growth decreases gradually and the displacement difference between each point does not show much difference after tunnel penetration; the displacement difference between each point does not show much difference in S2~S7 and S7, and the displacement difference between each point does not show much difference. After the excavation and support of S7, the slope of displacement growth shows an increase and the difference in displacement between the measuring points gradually increases; after that (S8~S10), the slope of displacement growth gradually decreases and there is not much difference in the displacement values of the measuring points after the tunnel has passed through.
Right side wall measurement points: The slope of the MS1 and MS2 profile measurement points in the S2~S4 excavation and support after the displacement growth shows a growing trend and the displacement difference between the measurement points gradually increases from the tunnel structure measurement point to the point away from the tunnel body measurement, while the displacement value gradually decreases; after that (S5~S10), the displacement growth slope gradually decreases, and the displacement value of the measurement points does not differ after the tunnel. After the excavation and support of S2~S4, the slope of displacement growth shows an increasing trend and the displacement difference between the measuring points gradually increases; after the excavation and support of S5~S8, the slope of displacement growth remains stable and the displacement difference between the measuring points does not change much, while the displacement value gradually decreases from the measuring point of the tunnel structure to the point far away from the tunnel body; after that, the slope of displacement growth decreases and there is not much difference in the displacement value of the measuring points after the tunnel passes through; after the excavation and support of S4, the displacement growth slope decreases and there is not much difference in the displacement value of the measuring points after the tunnel passes through. After the excavation and support of S8, the slope of displacement growth tends to increase, the displacement difference between the measuring points gradually increases, and the displacement value from the tunnel structure measuring point to the measuring point far away from the cave body gradually decreases; after that (S9 and S10), the slope of displacement growth gradually decreases and there is not much difference in the displacement value of each measuring point after the tunnel. The displacement difference between the measurement points gradually decreases and the displacement value gradually increases from the tunnel structure measurement point to the measurement point far away from the tunnel body; the displacement growth slope decreases after the excavation of S10 and there is not much difference between the displacement values of the measurement points.
In summary, the displacement of the base plate of the existing tunnel is greatly affected by the excavation time step, and the change rule of the top plate and the left and right side walls is similar. The trend of displacement change at the measuring point is mainly determined by the distance between the excavation surface and the typical profile, and the 40 m range in the middle of the tunnel measuring point is the sensitive area affected by the excavation, which shows slow growth when the distance is far away and fast growth when the distance is close.

3.1.2. von Mises Stress Response

Based on the typical excavation data of the axial section of the new left tunnel and the axial section of the existing tunnel, the von Mises stress cloud and monitoring point data at different time steps were extracted for mechanical response characterization.
(1)
von Mises stress cloud
After the excavation and support of the new tunnel underneath, the von Mises stress perturbation area of the excavated tunnel and the new tunnel changes significantly in the support structure, while other areas are slightly perturbed at the initial stage.
(2)
Monitoring point data
Figure 18 shows the time step of excavation data extraction and von Mises stress change curves of typical profile measurement points of existing tunnels and also analyzes the von Mises stress evolution law of different profile measurement points.
Vertex measurement points: von Mises stress changes at the tunnel structure measurement points in the MS1~MS5 profiles are prominent, while the values of von Mises stress changes at the other measurement points are similar. Von Mises stress changes show two stages of rapid decline (S2~S6) and rebound (S7~S10); the MS3 profile U1 measurement point’s von Mises stress changes show three stages, as follows: slow rise (S2 and S3), rapid decline (S4~S7), and stabilization (S8~S10); the MS4 profile U1 measurement point’s von Mises stress changes show three stages, as follows: slow rise (S2~S4) and rapid decline (S5~S10); the MS5 profile U1 point’s von Mises stress change manifested in three phases, as follows: a slow rise (S2~S5), a slow decline (S6 and S7), and a rapid decline (S8~S10; each profile U2~U5 point’s von Mises stress change law is similar to the U1 point, the range of the fluctuation of the stress value is smaller, and the change stage is slow.
Bottom plate measurement points: The MS1 profile measurement points can be divided into four categories, according to the change rule of von Mises stress, as follows: D1 measurement point stress drop in the strong perturbation region, D2 measurement point stress stable micro-disturbance region, D3 measurement point stress rise in the low perturbation region, and D4 and D5 measurement point stress rise in four categories of the strong perturbation region; the D1 measurement point von Mises stress change manifested as a slow decline (S2), a rapid decline (S3 and S4), rebound (S4), a rapid decline (S3 and S4), and a rapid decline (S4). The D4 and D5 points show four stages of von Mises stress change, as follows: slow rise (S2), rapid rise (S3 and S4), slight rise (S5~S7), and stabilization (S8~S10). The MS2 profile points can be divided into D1~D3 points, according to the change rule of von Mises stress change, as follows: the region of low disturbance, D4 points into the region of medium disturbance, and D5 points into the region of medium disturbance. According to the change rule of von Mises stress, the D1 stress can be divided into four categories, as follows: D2 stress is stable and slightly disturbed, D3 stress is rising and low disturbed, and D4 and D5 stress is rising and strongly disturbed; the D1 von Mises stress is divided into the following five stages: S2, S3, S4~S7, S8, and S10; the D2 von Mises stress is divided into the following five stages: S5~S7, S8, and S10; and the D2 von Mises stress is divided into the following five stages: S5~S7, S8, and S10. The von Mises stress change at the measurement point exhibits three stages, which are slightly rising (S2 and S3), slightly falling (S4), and slowly rising (S5~S10); the D3 Von Mises stress change at the measurement point exhibits four stages, which are slightly rising (S2), slowly rising (S3 and S4), rising (S5~ S8), and stabilizing (S9~S10); and the von Mises stress changes in the D4 and D5 measurement points can be divided into the following five stages: slightly rising (S2), slowly rising (S3), rapidly rising (S4), rising (S5~S7), and stabilizing (S8~S10). The MS4 measurement points can be divided into the following three categories: D1~D3 measurement points with low stress reduction and low perturbation area, D4 measurement points with medium stress reduction and medium perturbation area, and D5 measurement points with strong stress rise and strong perturbation area. The D1~D3 measuring points’ von Mises stress change manifested as the following three stages: a slight rise (S2~S6), a rapid decline (S7 and S8), and being stable (S9~S10); the D4 measuring points’ von Mises stress change manifested as the following four stages: a slight rise (S2~S6), a decline (S7), a rapid decline (S8), and a slight increase (S9~S10); the von Mises stress change at the D5 measurement point is characterized by the following five stages: slightly rising (S2~S6), rapidly rising (S7), slightly falling (S8), slightly rising (S9), and stabilizing (S10). The MS5 profile measurement points can be divided into D2 and D3 measurement points with low disturbance, D1 and D4 measurement points with medium disturbance, and D5 measurement points with strong disturbance (S10); the D4 measuring point von Mises stress change shows three stages of slight rise (S2~S6), rapid rise (S7~S9), and slight rise (S10); the D5 measuring point von Mises stress change shows four stages of slight rise (S2~S6), rise (S7), rapid rise (S8~S9), and slight rise (S10).
Side wall measurement points: the change rule of von Mises stress at the measurement points of the left and right side wall profiles is consistent, the change in von Mises stress at the measurement points of the tunnel structure is prominent, and the change in von Mises stress at the other measurement points has similar values. The change in von Mises stress at the U1 measurement point of the MS1 profile exhibits a slow decline (S2), a rapid decline (S3 and S4), a rapid rebound (S5~S7), and a slow recovery (S8~S10); the MS2 profile U1 measurement points’ von Mises stress change shows a slow decline (S2), a rapid decline (S3 and S4), a slow decline (S5), and a slow recovery (S6~S10); the MS3 profile U1 measurement points’ von Mises stress change shows a slow rise (S2) and a slow decline (S3); the MS5 profile’s U1 von Mises stress change manifested as a slow rise (S2~S6), a slow decline (S7), a rapid decline (S8~S9), and a slow recovery (S10); each profile U2~U5 measurement points’ von Mises stress change law is similar to that of the U1 measurement point, with the range of the stress value being smaller and the change stage is slow.
Comprehensive analysis concludes that the existing tunnel roof and side wall points’ von Mises stress disturbance mainly occurs in the tunnel structure area. The distance between the excavation surface and the typical profile determines the trend of stress change at the measuring point, which is characterized by a stress rise when the distance is far away and a stress fall when the distance is close, and can be classified into the following four types: micro, slow, normal, and fast. The sensitive distance of roof stress disturbance ranges from 2 to 4 excavation data extraction time steps, i.e., in the 40~80 m range; the sensitive distance of side wall stress disturbance ranges from 2 to 3 excavation data extraction time steps, i.e., in the 40~60 m range. Existing tunnel floor measuring point von Mises stress disturbance can be divided into the following four types: micro, low, medium, and high, the tunnel structure measuring point is in the stress reduction in the level of disturbance, and the rule of change is similar to the tunnel structure measuring point in other regions; there are pressure relief and pressure-bearing areas in the tunnel floor area and, during the excavation process of the left tunnel, the proximity of the measuring point is the pressure relief area of the stress reduction, and the long-distance distance measuring point is in the pressure-bearing area of the stress rise. Under the influence of the stress disturbance of the left tunnel excavation, the measuring points far away from the tunnel structure during the excavation of the right tunnel produced the phenomenon of stress rise under pressure, indicating the existence of a pressurized stress arch. The stress disturbance-sensitive distance ranges from 1 to 2 excavation data extraction time steps, i.e., in the 20~40 m range.

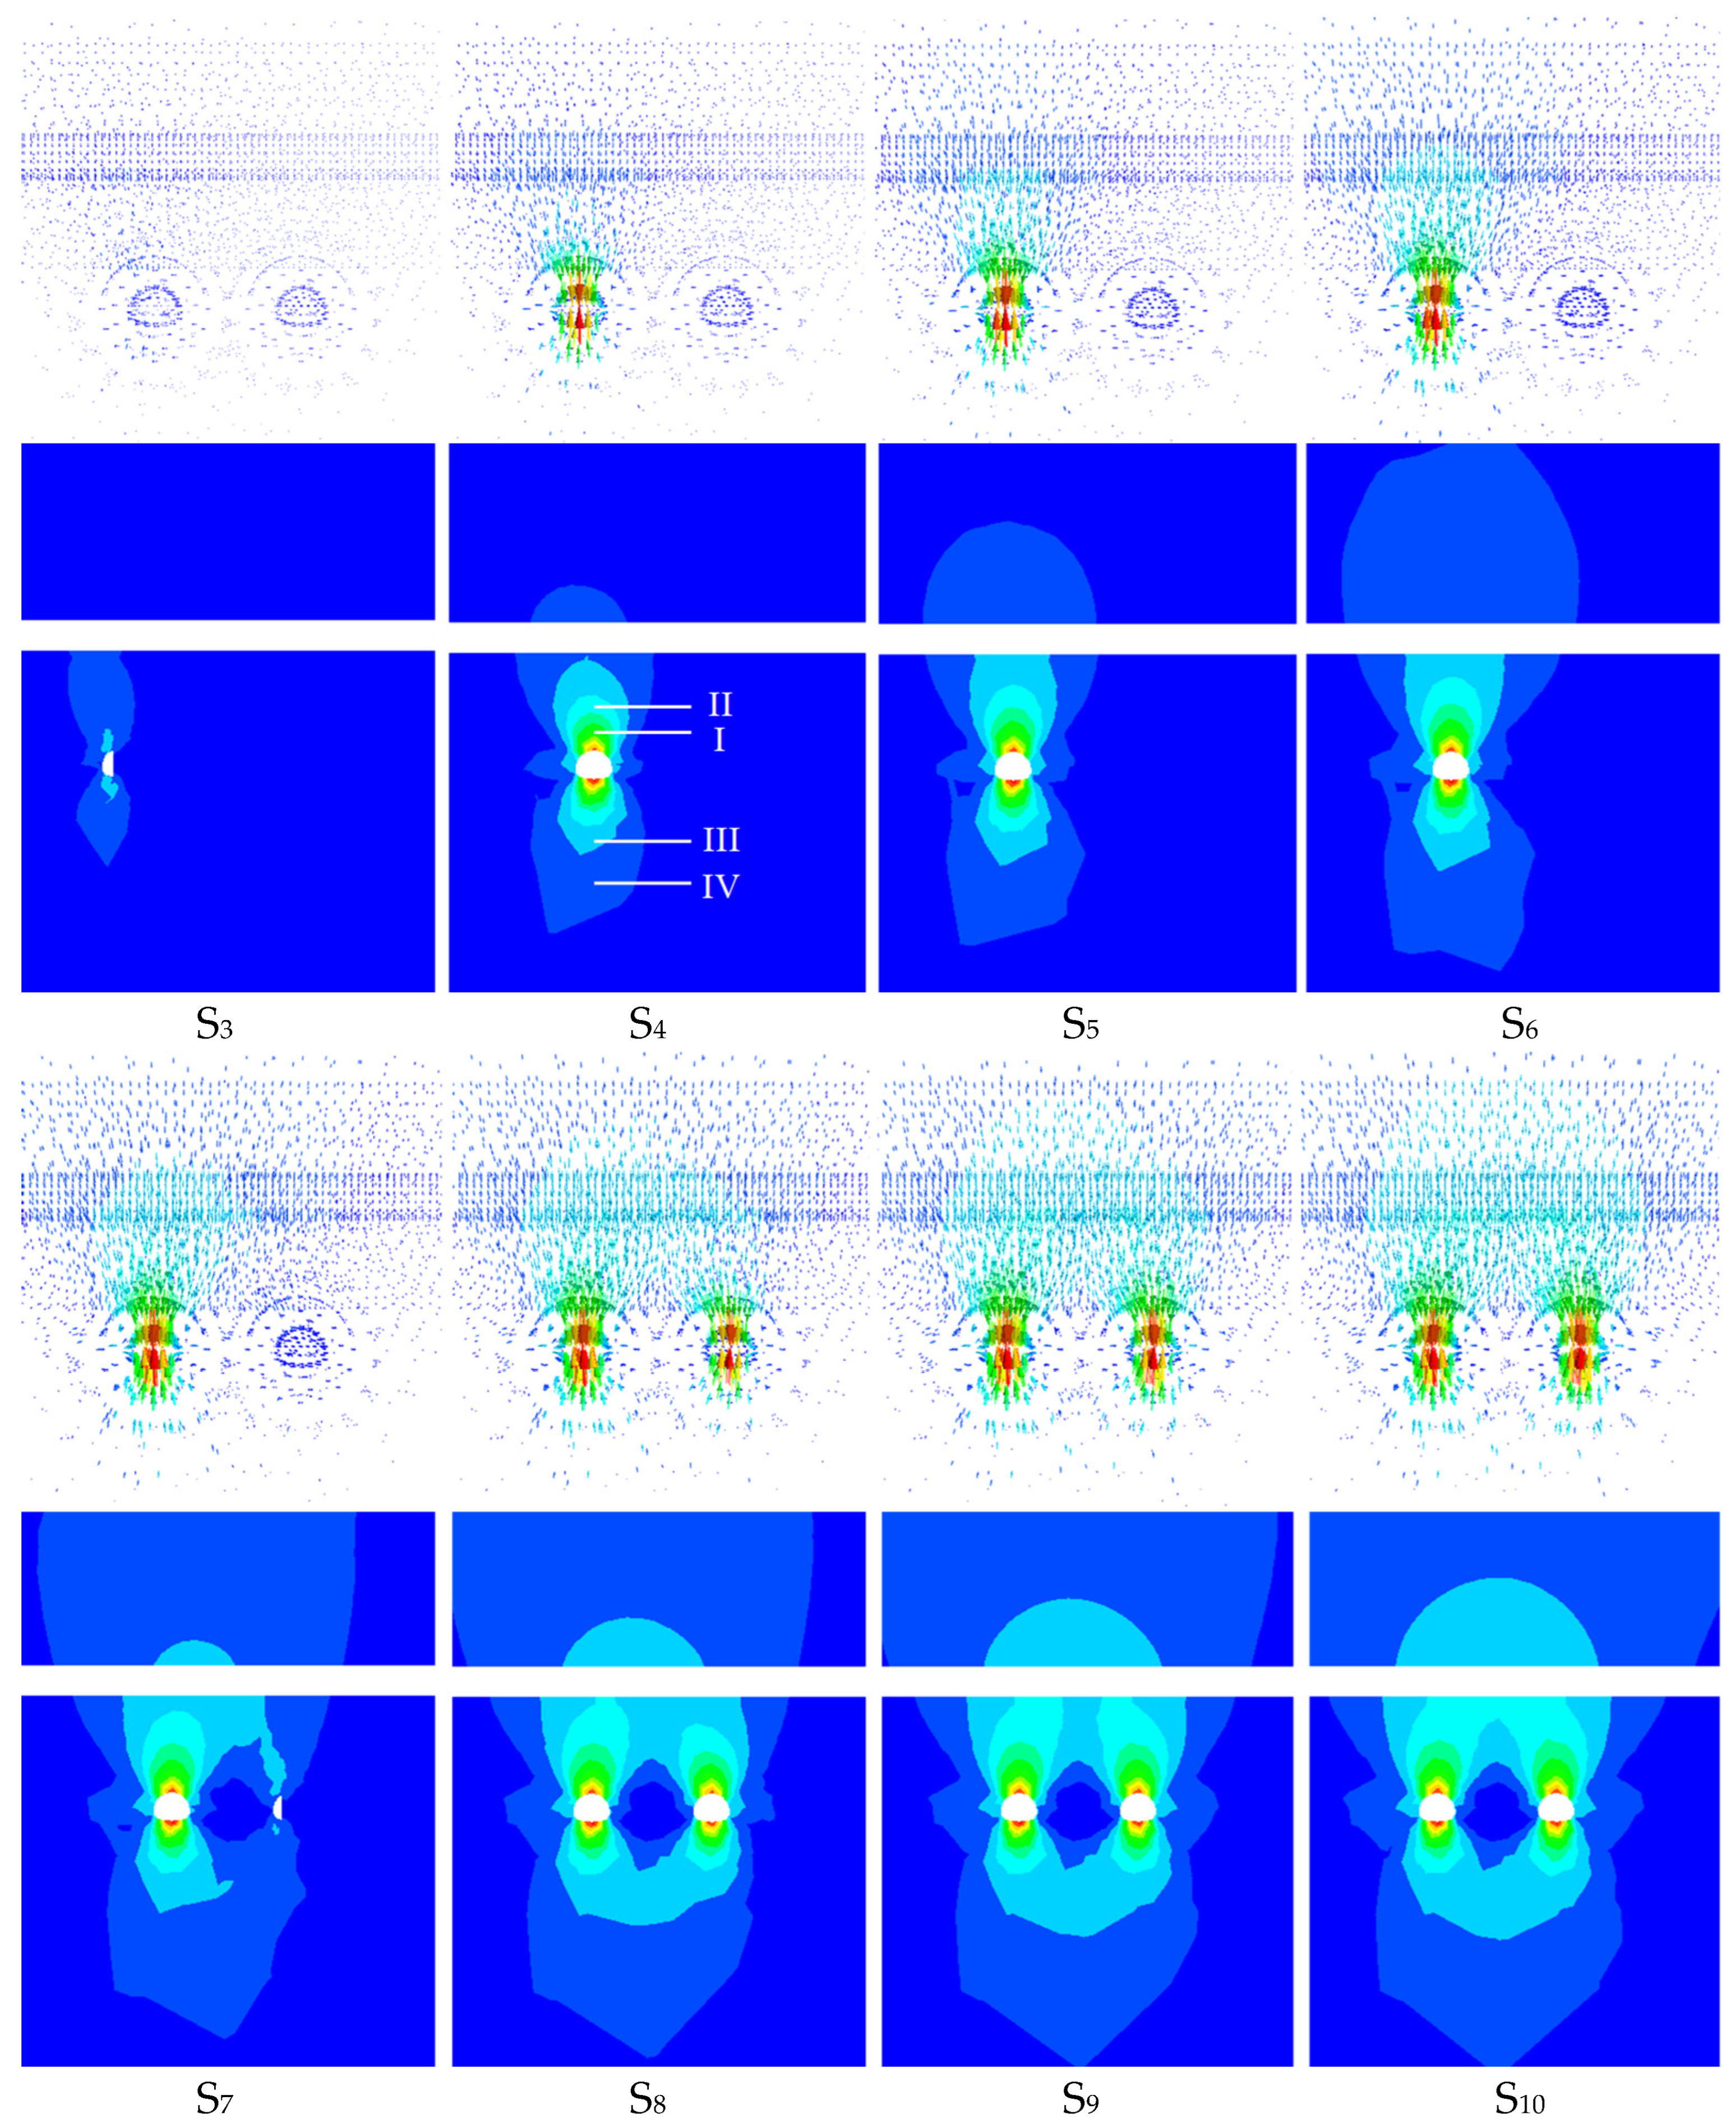
3.2. Typical Profile Analysis

Based on the total displacement characteristics of typical profiles, the mechanical characteristics of typical measurement points in the affected area under different calculation conditions, and the mechanical characteristics of the existing tunnel floor, the mechanical response characteristics are analyzed and the construction method is optimized.

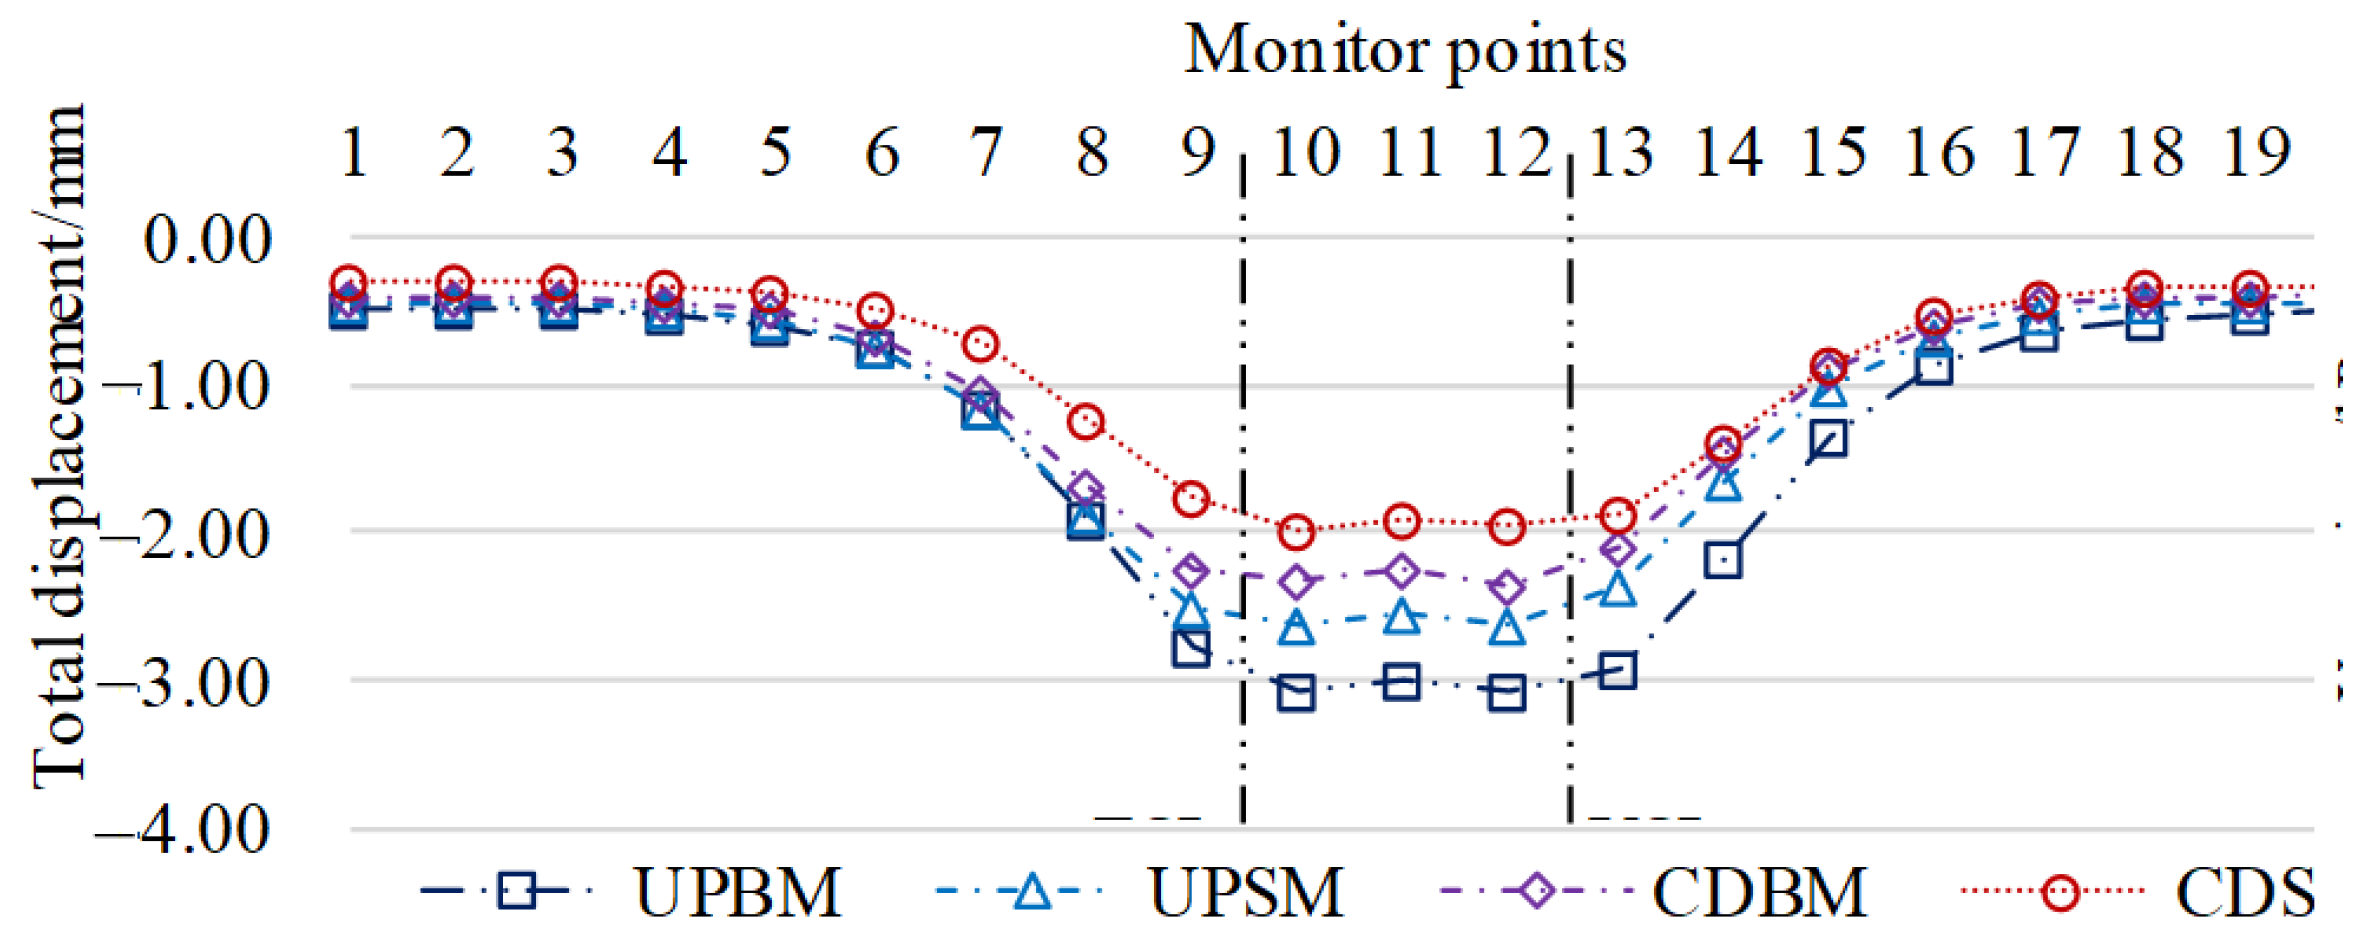
3.2.1. Total Displacement Characterization

The total displacement maps (Figure 19) of the axial profile of the existing tunnels at the time of tunnel penetration were extracted for the four calculation conditions, to analyze the characteristics of the total displacement of the axial profile.
The total displacement of the rock layer in the profile of the existing tunnel is effectively the same under the four calculation conditions, as follows: the strong disturbance region III and the low disturbance region I of the UPBM and CDBM methods are of the same height; the middle disturbance region II is connected at double the diameter of the existing tunnel; the strong disturbance region I and the low displacement disturbance III of the UPSM and CDSM methods are of the same height, which is a little lower than the height of the excavation of the blast method; and the middle disturbance region of displacement II is not connected.

3.2.2. Typical Point Characteristics

Comparison and analysis of the total displacement and von Mises stress extremes of the existing tunnel’s measurement points in typical profiles for the four calculation conditions.
(1)
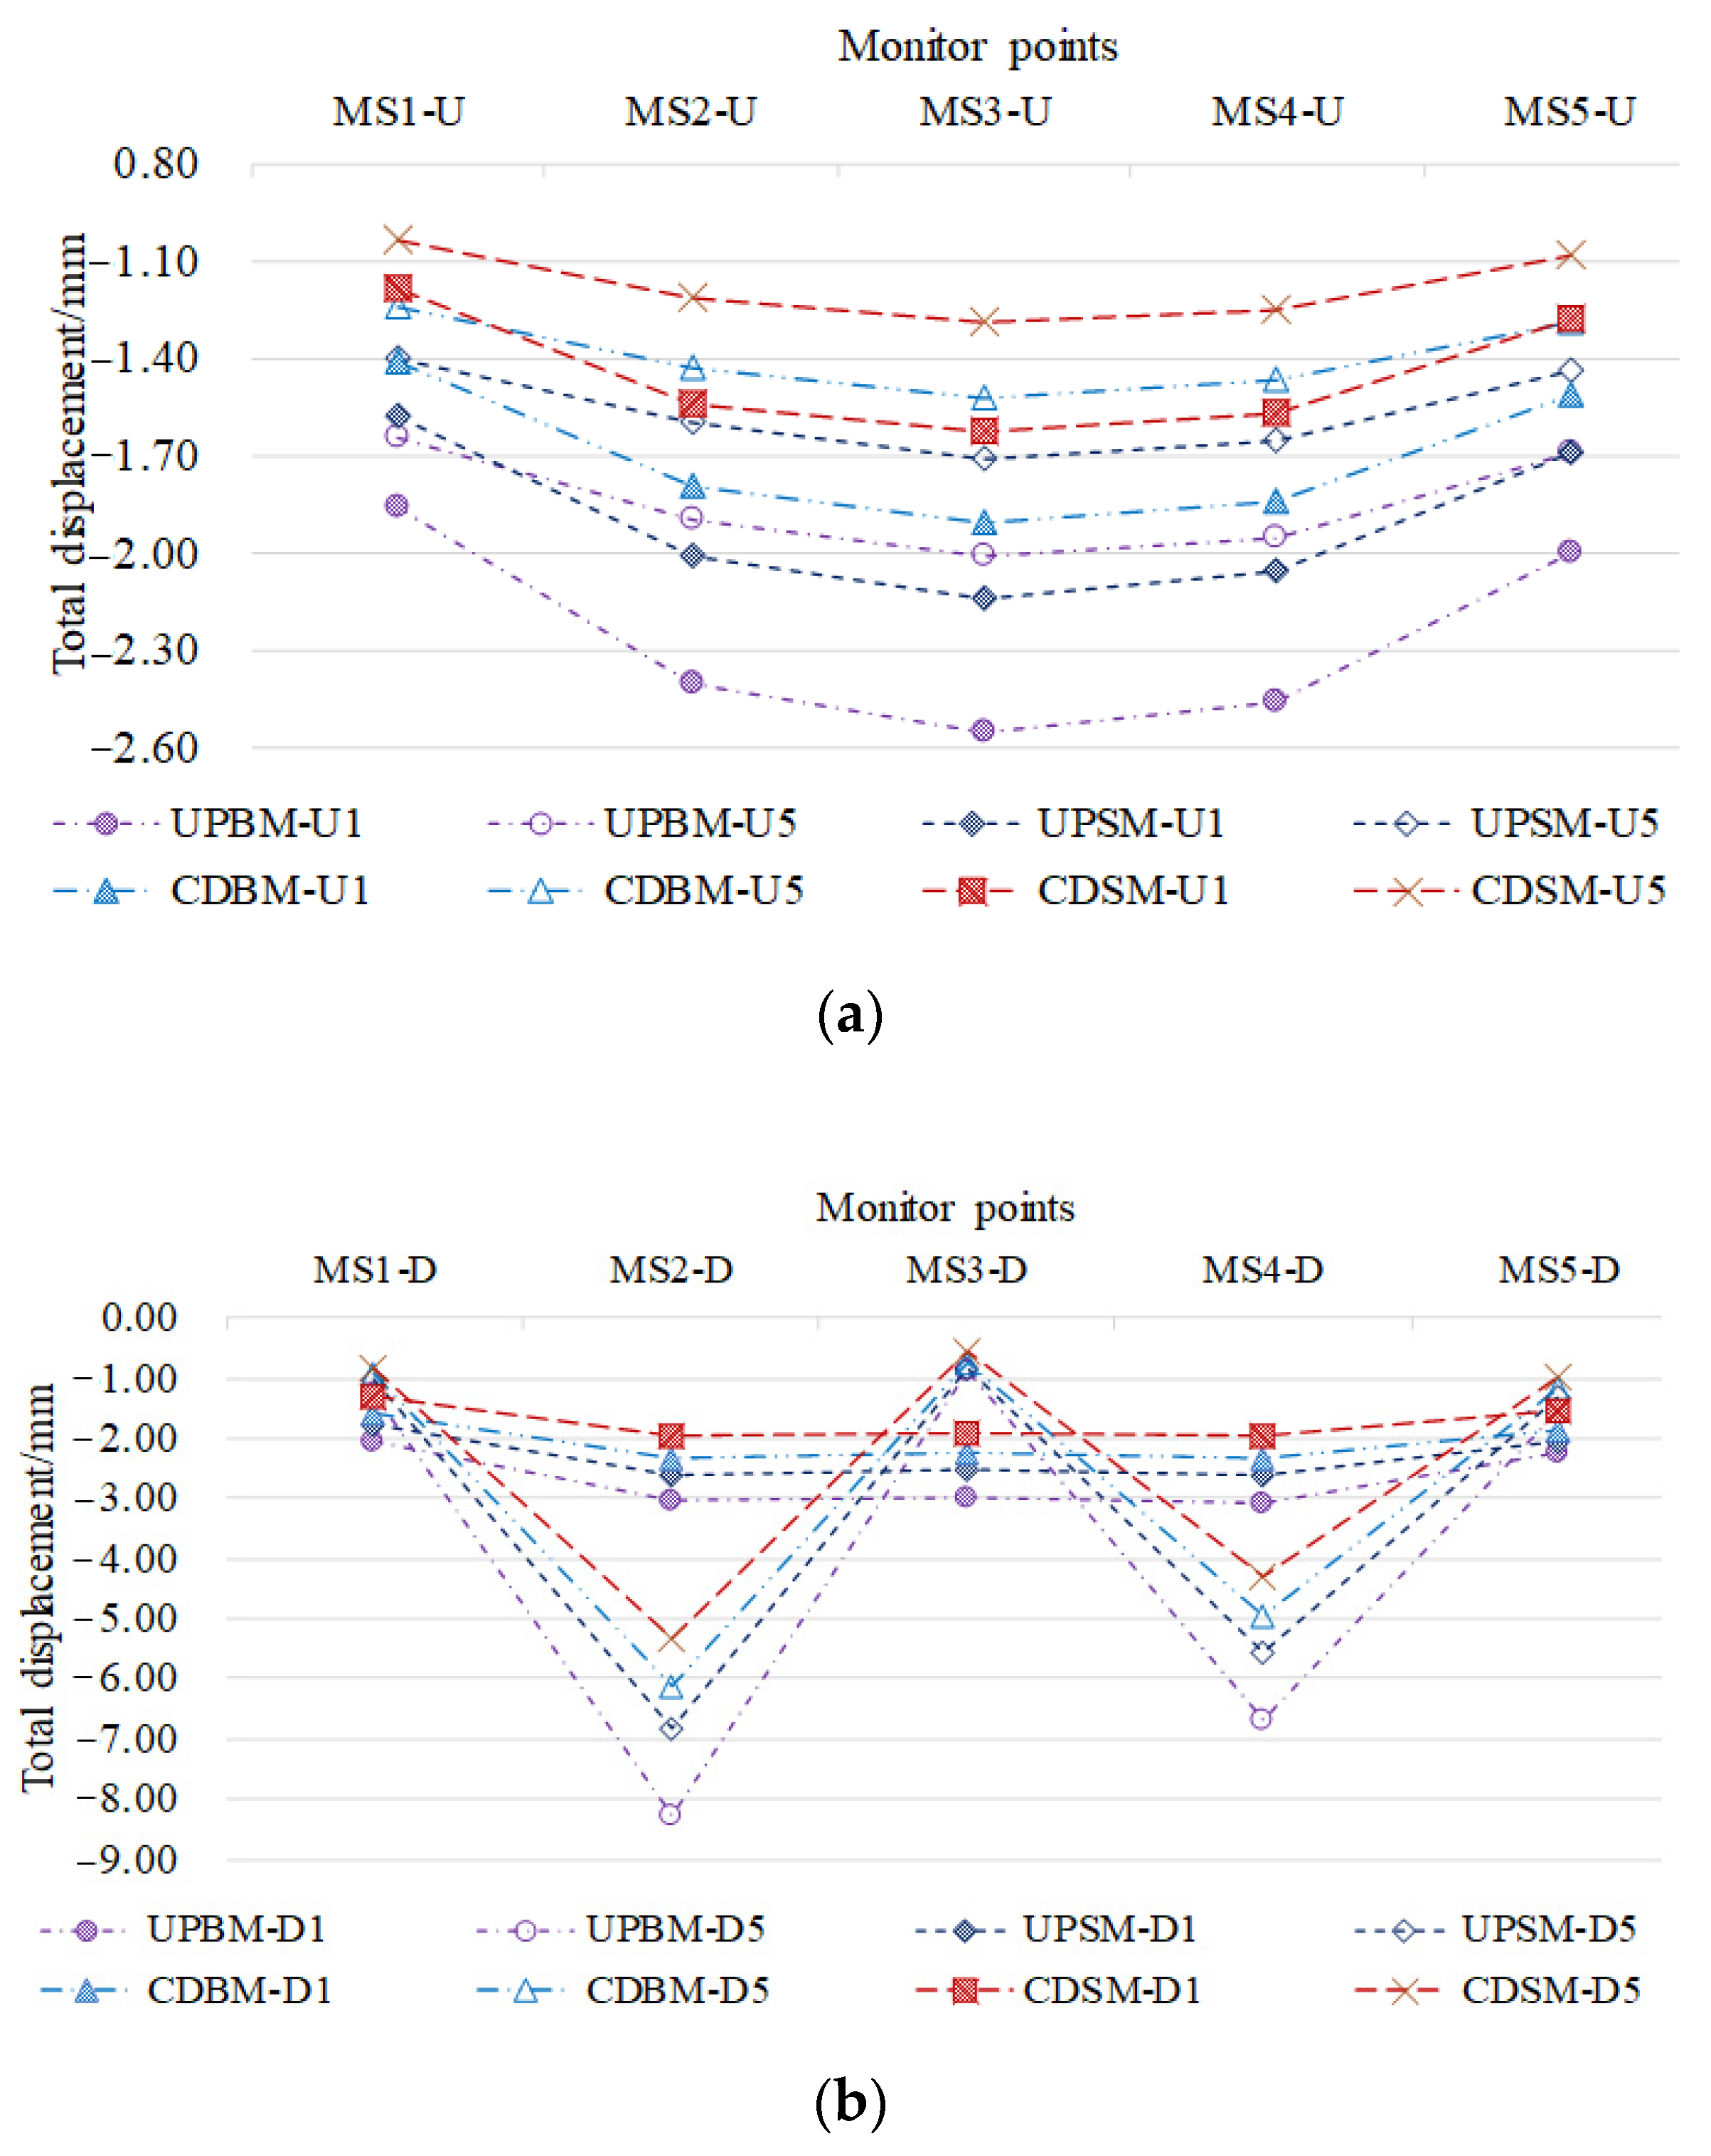
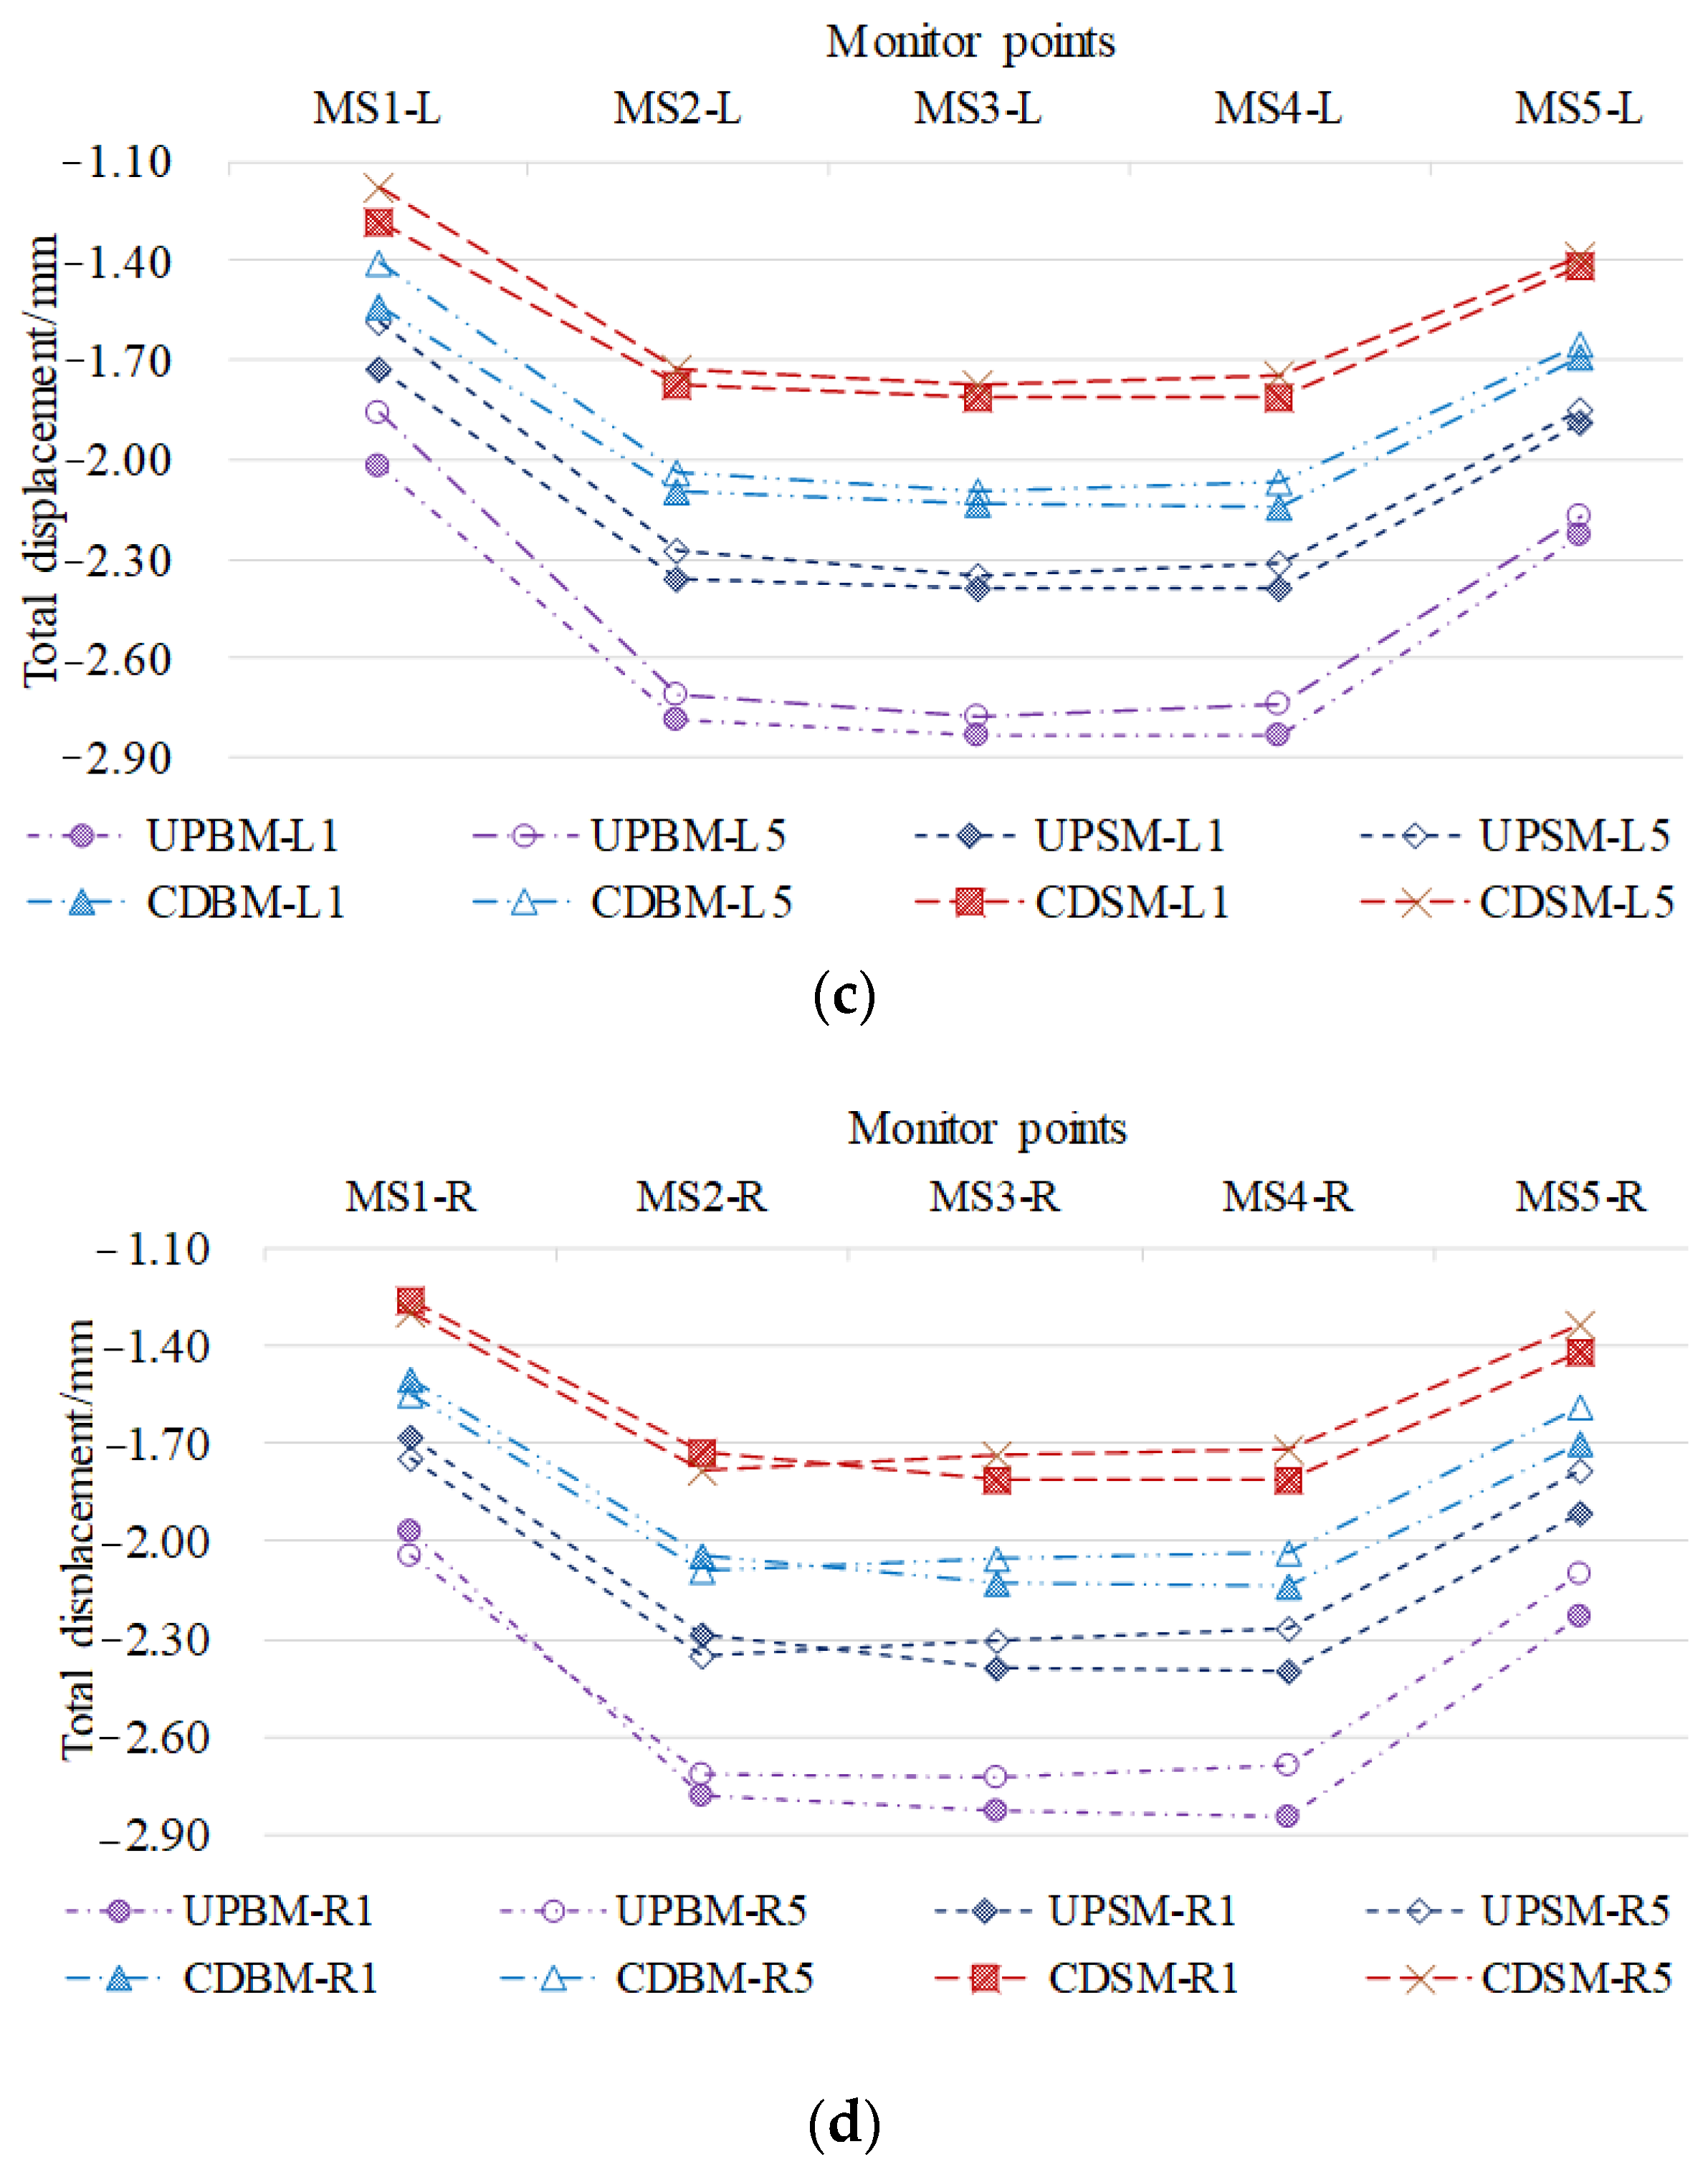
Analysis of total displacement at measuring points
Figure 20 shows the comparison curves of the total displacement at the typical profile of existing tunnels under different working conditions.
The total displacement change rule of measuring points in the MS1~MS5 profiles of the tunnel under the four calculation conditions is the same, and the extreme value of the typical measuring points of the upper and lower step blasting method excavation is the largest, followed by the upper and lower step static method, the CD blasting method, and the CD static method.
The total displacement of the arch measuring points U1 and U5 in the MS3 profile is the largest and the values of both profiles decrease symmetrically, with the settlement value of measuring point U1 being larger than the settlement value of measuring point U5. The total displacement extreme value of the upper and lower step blasting method’s excavation measuring points, for U1 and U5, is 2.55 mm and 2.01 mm.
The total displacement extreme value of measuring point D1 of the base plate tunnel structure is obvious in the MS2~MS4 profile settlement, with similar values; MS4-U1 is larger than MS2-U1, which is larger than MS3-U1. The total displacement extreme value of measuring point D5 of the base plate away from the tunnel structure is prominent in the MS2 and MS4 profile settlements, with MS2-U5 > MS4-U5, and the total displacement extreme values of measuring point D5 of the MS1, MS3, and MS5 profiles are smaller, but with similar values. The extreme values of total displacement of measuring points U1 and U5 in the excavation of the upper and lower step blasting method are 3.09 mm and 8.27 mm.
Typical measurement points of the left and right side walls have similar total displacement extremes and the settlement is obvious in the MS2~MS4 profile, with similar values. The total displacement extremes of measuring points L1 and L5 of the upper and lower step blasting method excavation are 2.83 mm and 2.78 mm; the total displacement extremes of measuring points R1 and R5 are 2.84 mm and 2.72 mm.
(2)
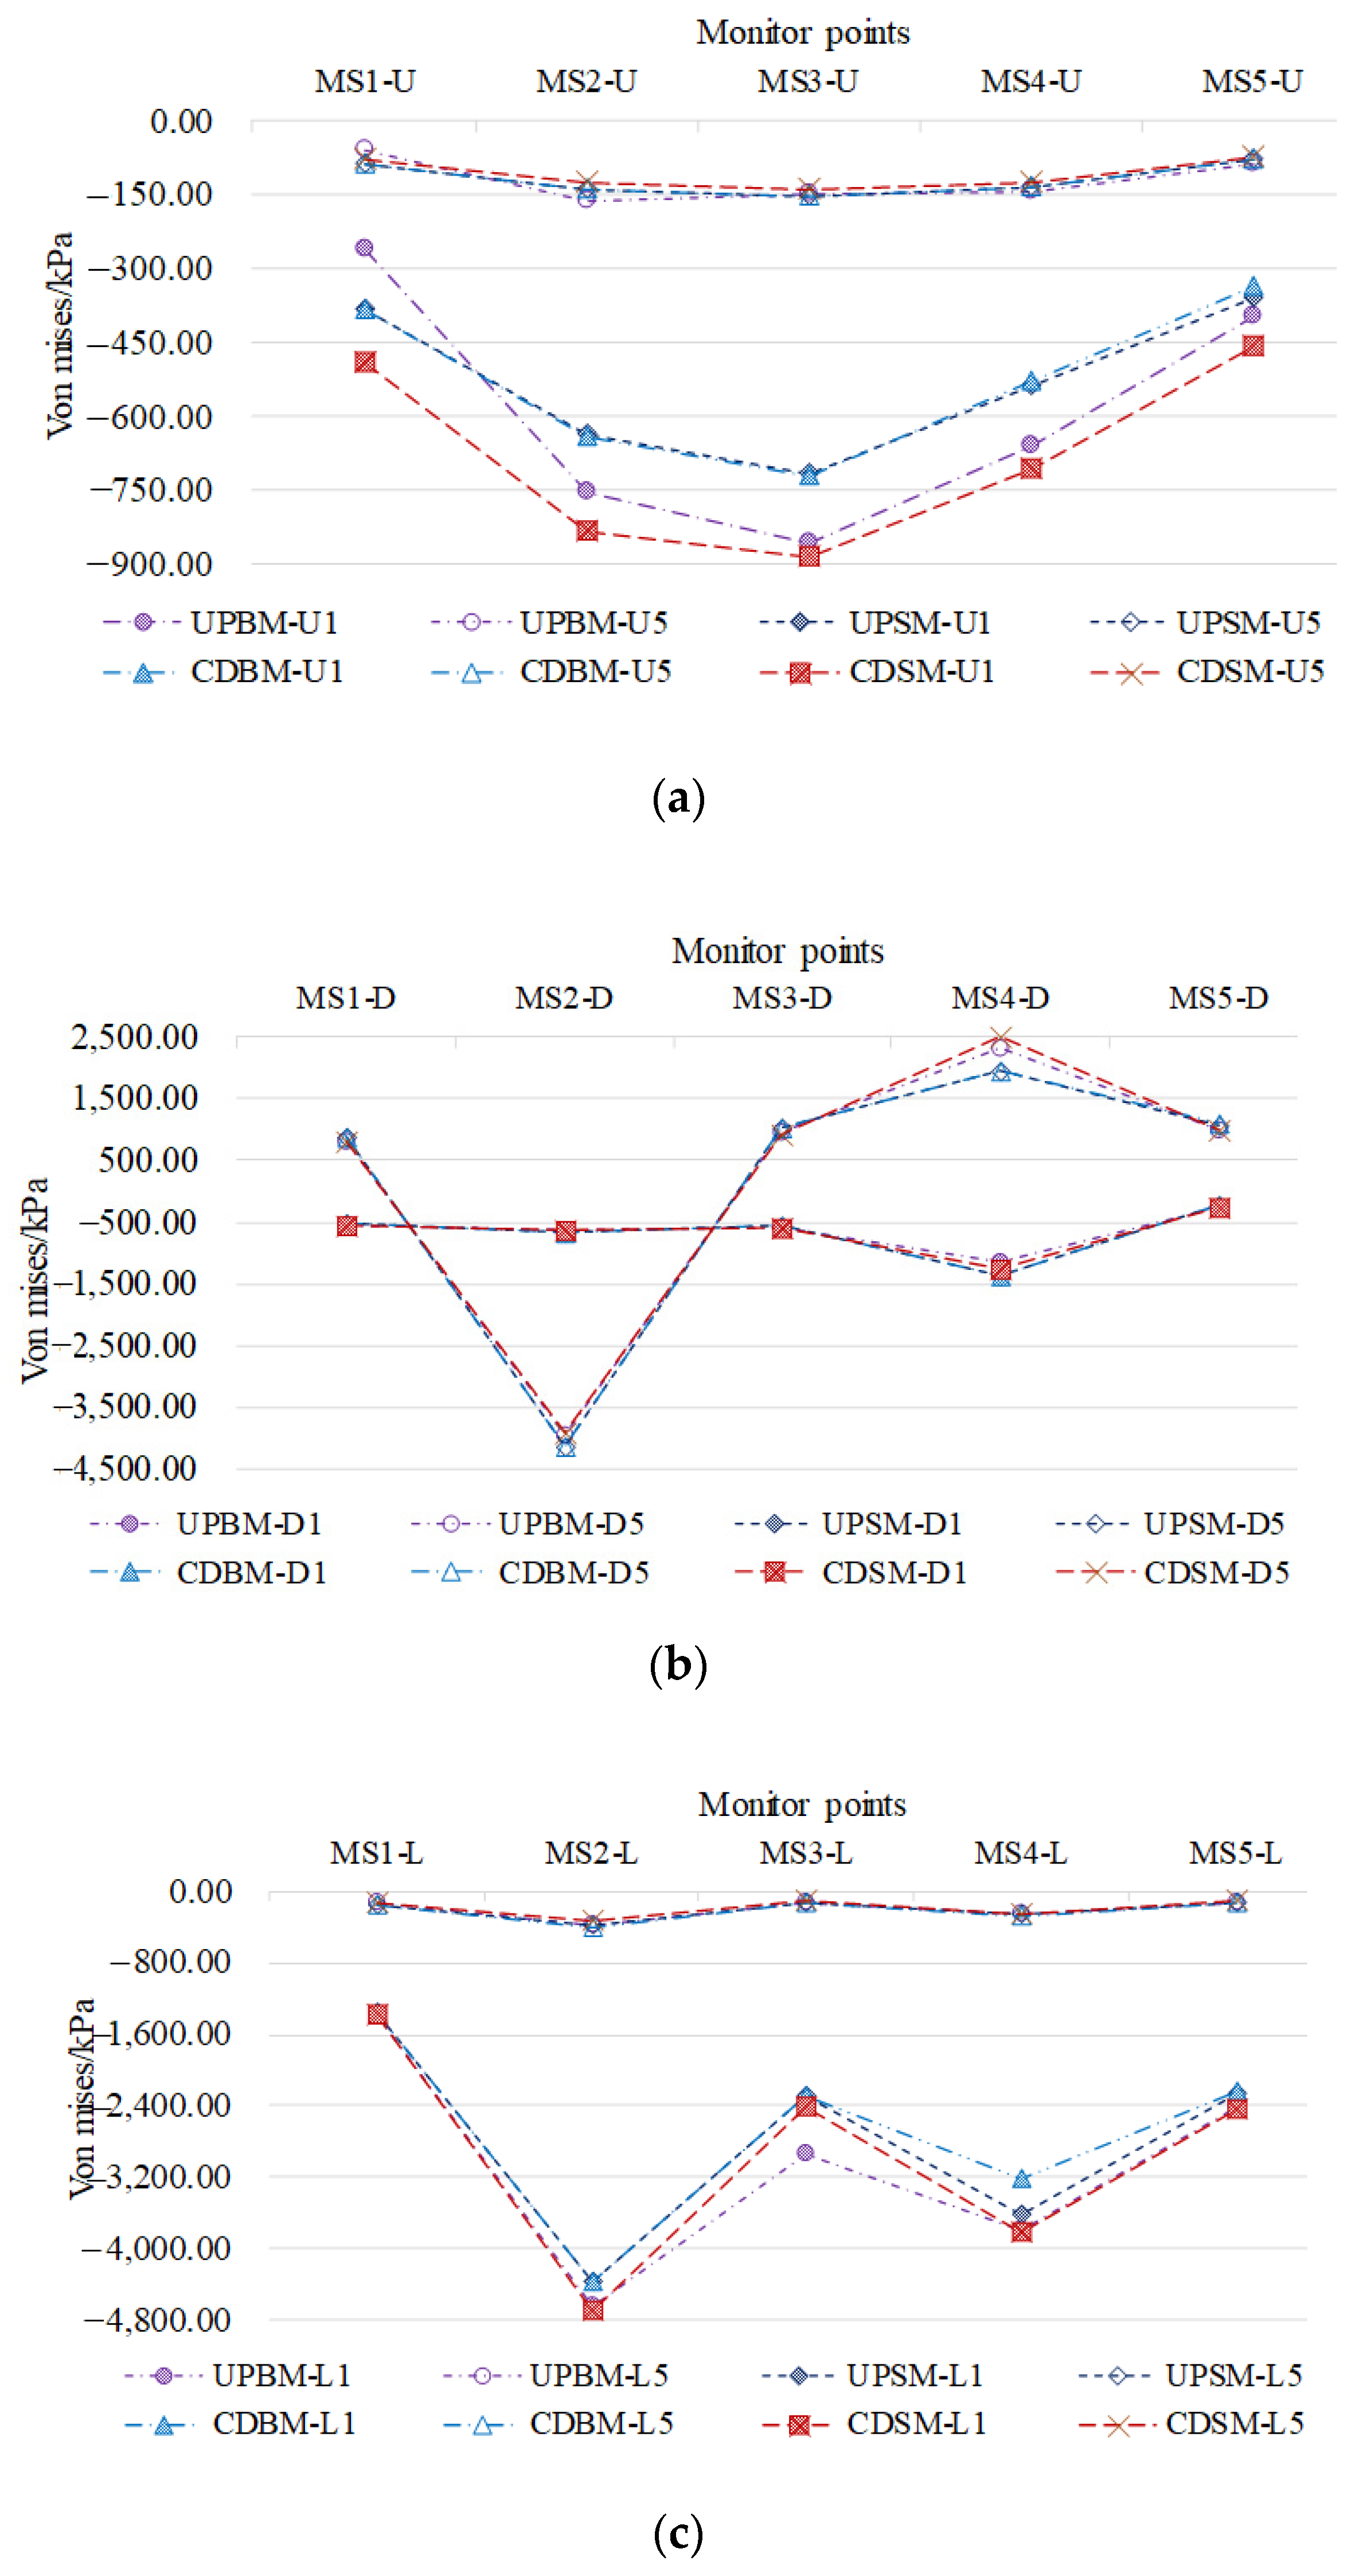
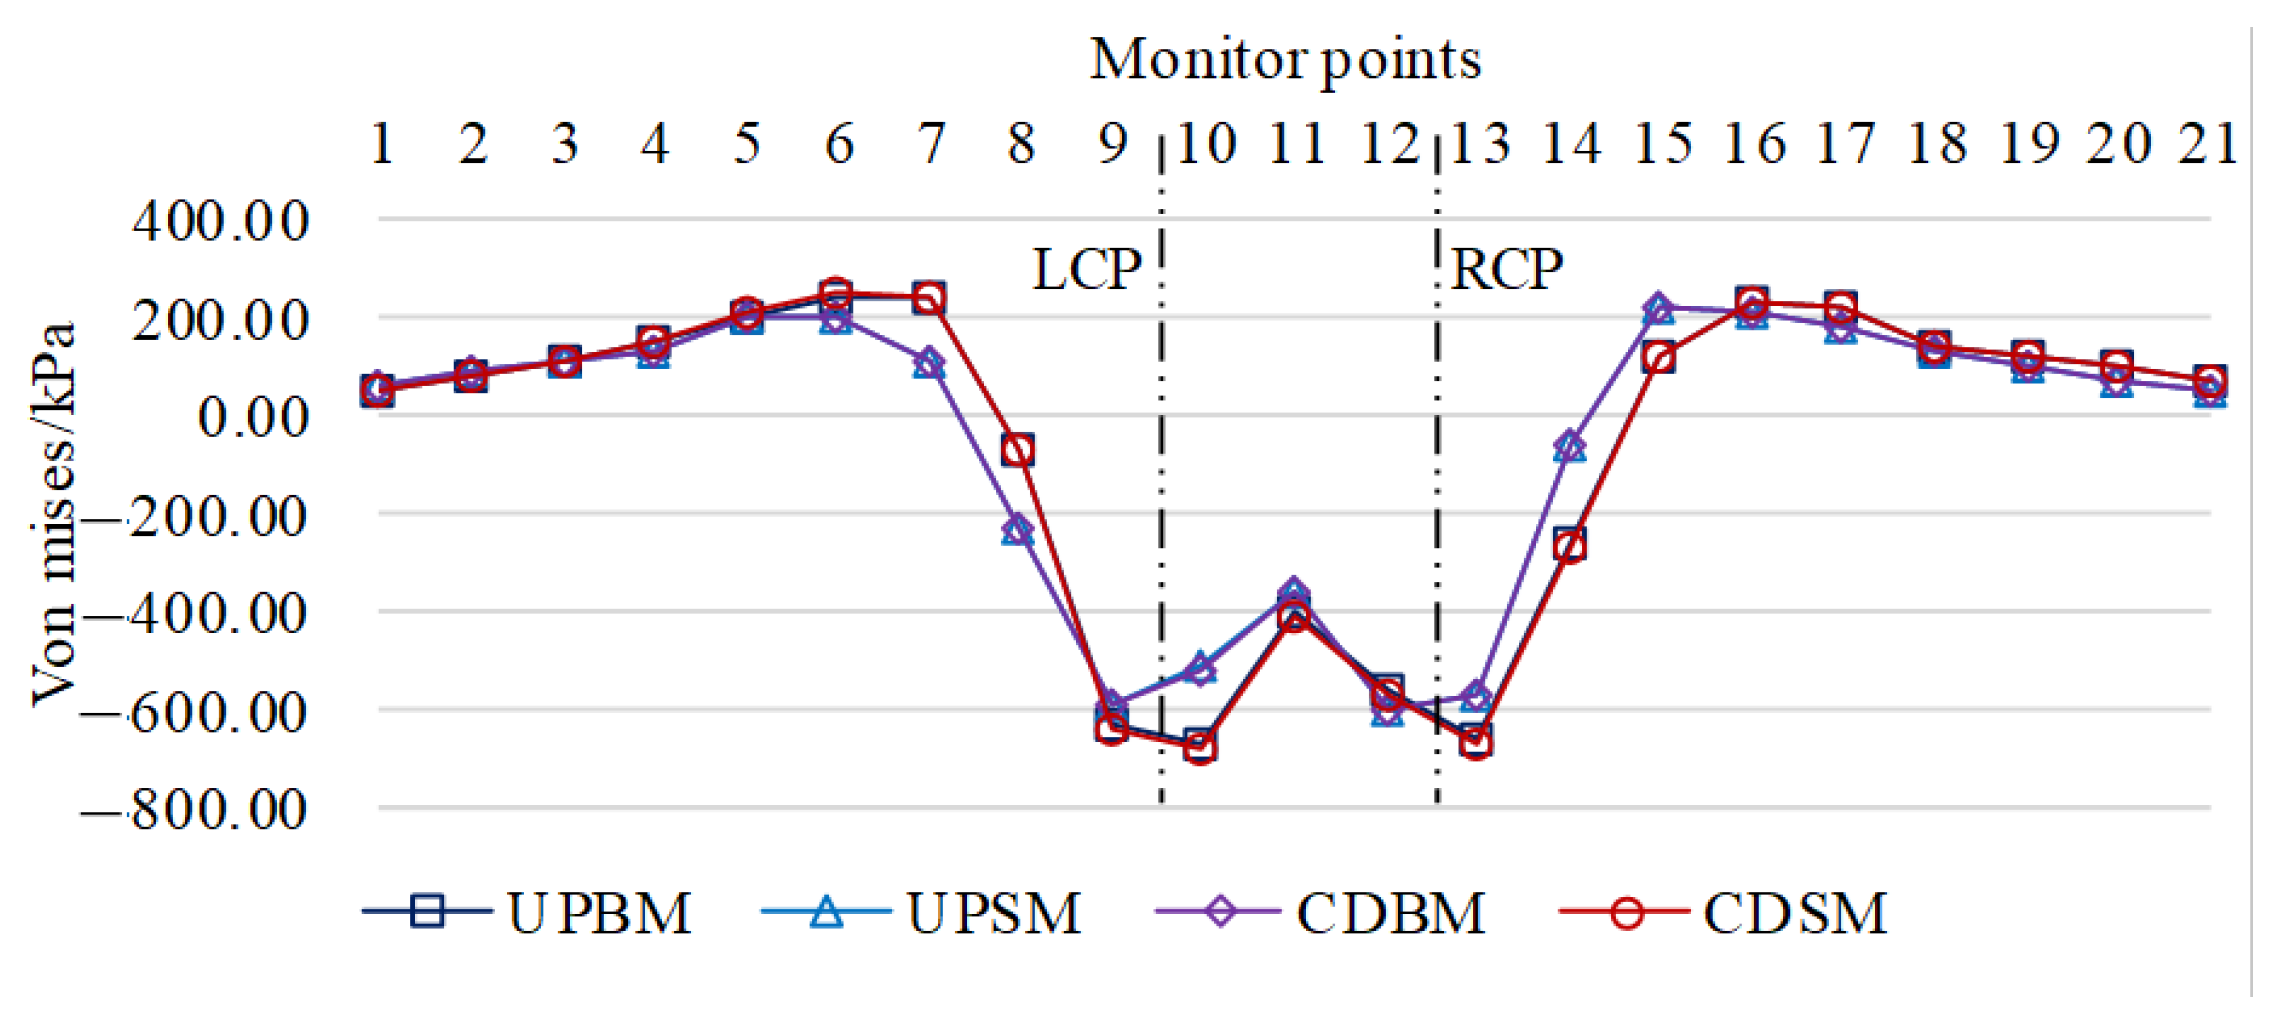
von Mises stress analysis at measurement points
Figure 21 shows the comparison curves of von Mises stress extremes at typical profile measurement points for existing tunnels with different operating conditions.
The von Mises stress extremes of the tunnel structure measurement points and the farthest end measurement points in the four calculation conditions’ MS1~MS5 profiles have similar patterns.
The von Mises stress increase values of the arch measuring point U1 are all negative increase values, and the negative increase value of the MS3 profile is the largest; the values of the upper and lower step blasting method and the CD static method are similar, and the difference between the upper and lower step static method and the CD blasting method is minimal; the negative change extreme value of the von Mises stress of the measuring point U5 of the CD static method is the largest and it is −887.42 kPa; the von Mises stress increase values of the arch measuring point U5 are all negative increase values, and the negative change extreme value is −887.42 kPa. The von Mises stress increase value are negative increase, the change value is small, and the values of different calculation conditions are similar, while the distribution of von Mises stress negative change extreme values is from −139.74 to −164.41 kPa.
The von Mises stress increase values of the bottom plate measurement point U1 are all negatively increasing, the negative increase value of the measurement point in the MS4 profile is the largest, and the values of the measurement points of the four working conditions demonstrate a similar amount of change; the negative change extreme value of the von Mises stress of the measurement point of the excavation using the CD blasting method is the largest, and it is −1634.97 kPa. The negative change extreme value of the von Mises stress of the measurement point U5 is negatively increasing in the MS2 profile, and it ranges from −139.74 to −164.41 kPa in the MS1, MS3, MS4, and MS5 profiles, which are negatively increasing; however, a positive increase was seen in the MS1, MS4, and MS5 profiles, and the values of the four working conditions are similar; the negative value of the von Mises stress at the upper and lower step static method excavation point U5 is the largest, which is −4150.37 kPa; the positive value of the von Mises stress at the CD static method excavation point U5 is the largest, which is 2496.89 kPa.
The extreme value of von Mises stress at the left and right sidewall tunnel structure measurement points is similar in different calculation conditions, with the negative change of the measurement point value in the MS2 and MS4 profiles being prominent, and the negative change of the measurement point value in the MS2 profile being the largest; the extreme value of the measurement point in the CD static method excavation is the largest, whereby the extreme value of the measurement point L1 is −4696.90 kPa and the extreme value of the measurement point R1 is −4366.50 kPa. The extreme value of von Mises stress at the measurement point far away from the tunnel structure is similar, with the extreme value of negative change at the measurement point of the MS2 profile being the largest and the extreme value of the measurement point of the CD blasting method being the largest; the extreme value of the measurement point L5 is −398.64 kPa and the extreme value of the measurement point R5 is −360.02 kPa.

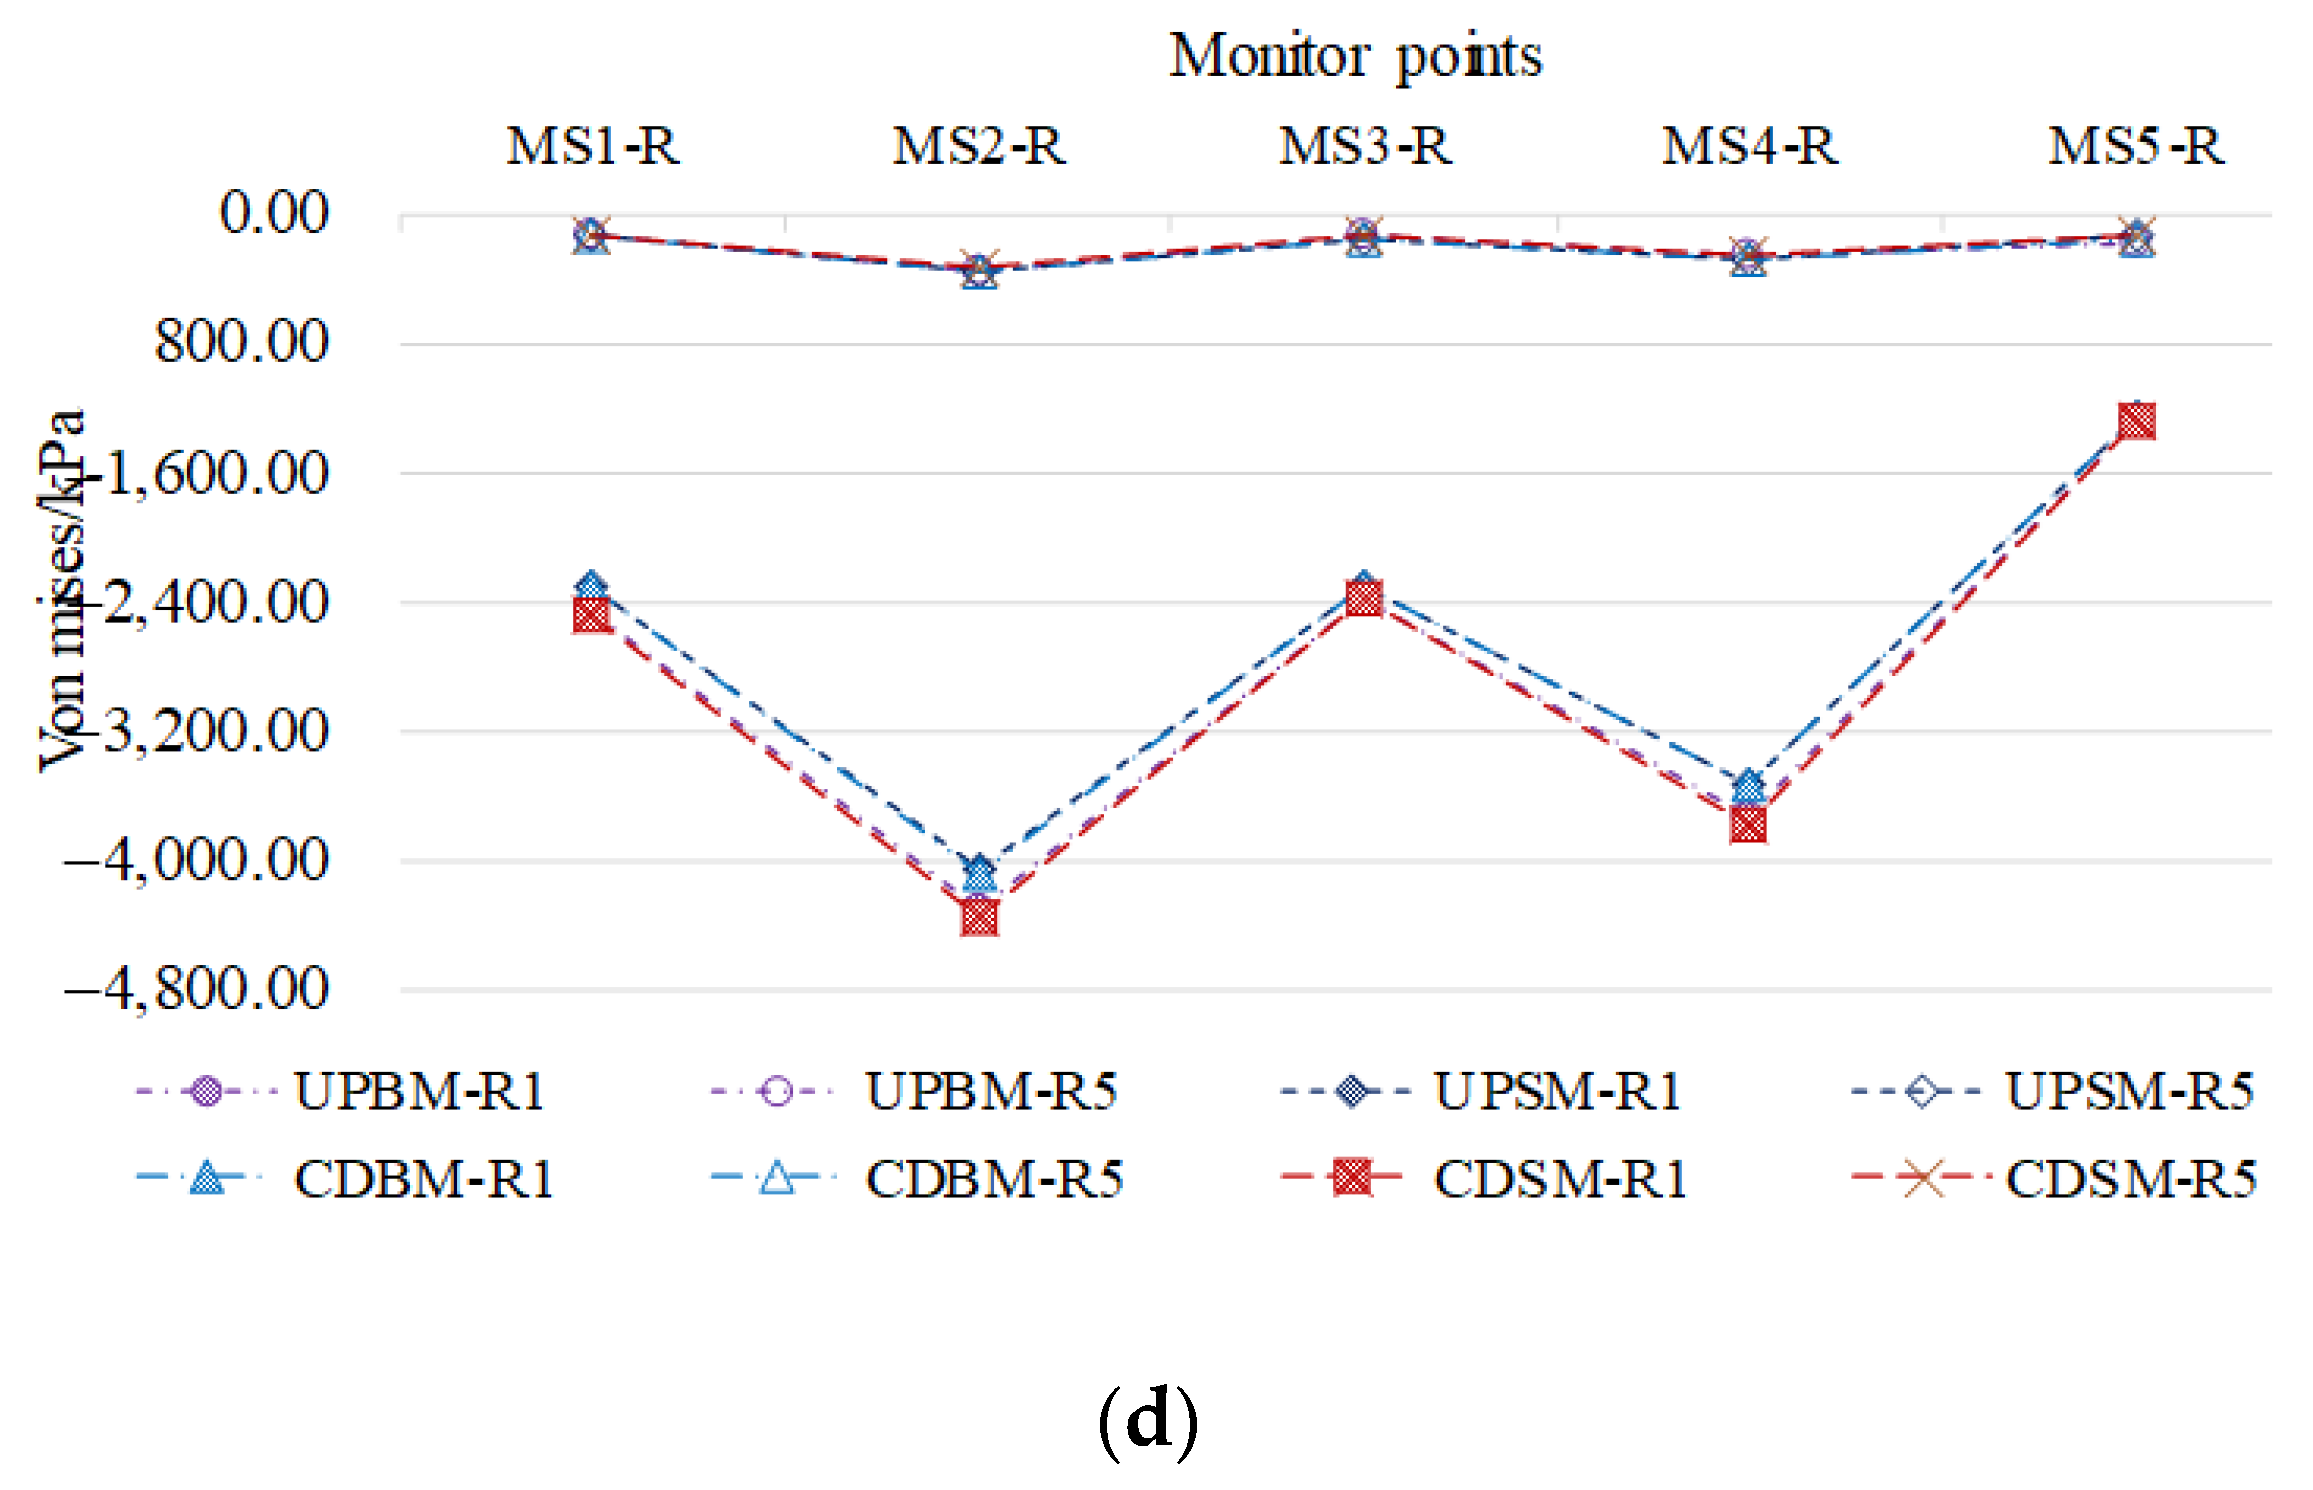
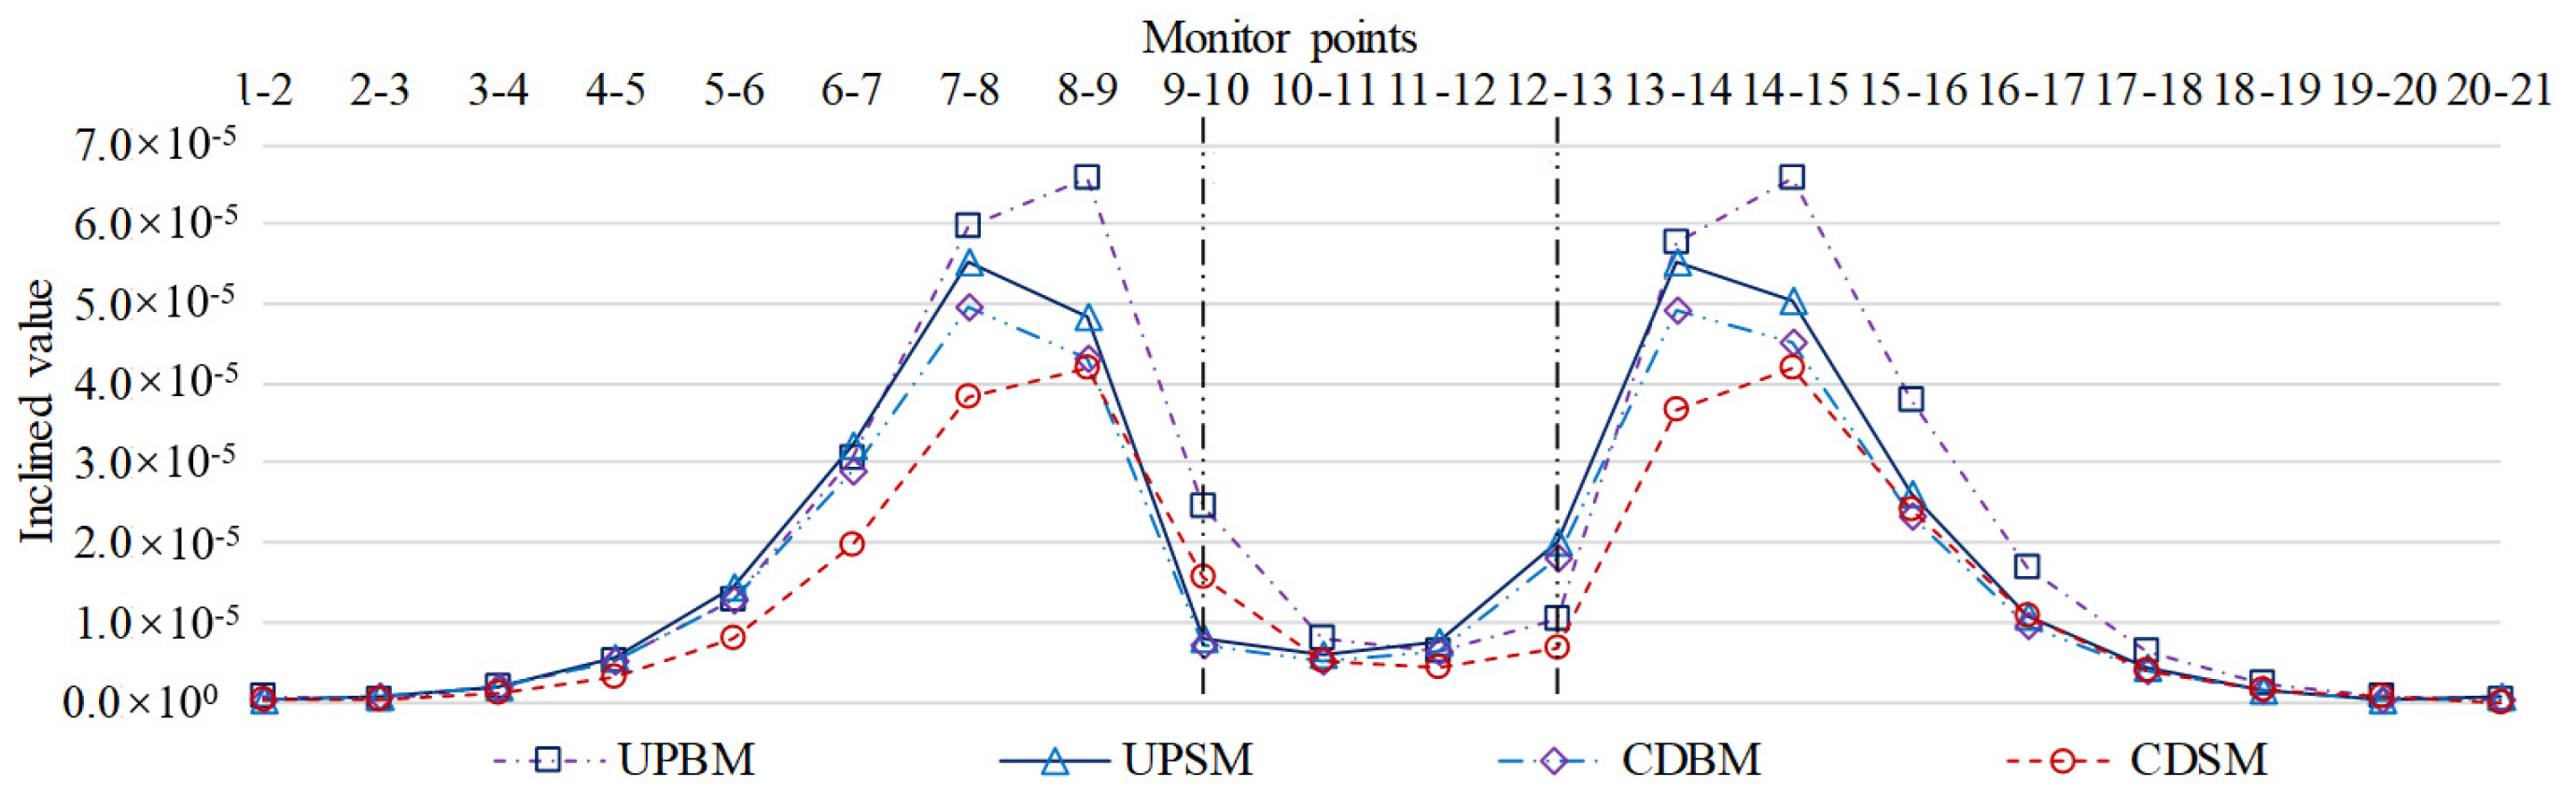
3.2.3. Characterization of Bottom Plate Measurement Points

Based on the data of total displacement, the von Mises stress, and the high and low tilt values of the centerline of the bottom plate of the step tunnel at the time of tunnel penetration under different excavation methods, the control effect on the mechanical response of the bottom plate of the existing tunnel is analyzed.
Figure 22 shows the total displacement and settlement curves of the existing tunnel base plate under different excavation methods, which shows that the total displacement and settlement of the existing tunnel’s base plate under different excavation methods are consistent. Taking the centerline of the left and right tunnels as the axis, the data of the left and right measurement points are symmetrically distributed and the value of the right measurement point is slightly larger than the value of the left measurement point, which is mainly due to the fact that the left tunnel is the first one to be excavated, which is caused by the spatial mechanical effect. The settlement value of the area between the intersection points of the left and right tunnels is the largest, the settlement value gradually decreases to both sides, and, after a certain distance, it is an overall uniform settlement area. In the area between the intersection points, the displacement settlement order is as follows: upper and lower step blasting method excavation settlement value of up to 3.09 mm, upper and lower step static method excavation settlement value of up to 2.64 mm, CD blasting method excavation settlement value of up to 2.35 mm, and CD static method excavation settlement value of up to 1.97 mm; outside the intersection point of the left side of the region, using the upper and lower step blasting method, the upper and lower step static method, and the CD method, the excavation settlement value is similar and greater than that of the CD static method; outside the intersection point of the right area, using the upper and lower step blasting method, the CD blasting method, and the CD static method, the excavation settlement value is similar and less than that of the upper and lower step blasting method. For the location of the settlement sensitive area between measurement points 6 and 16, the distance is 130 m.
Figure 23 shows the change curve of von Mises stress in the centerline of the existing tunnel base plate after different excavation methods are adopted for the new tunnel, and the change rule is consistent. Taking the left and right tunnel centerline as the axis, the data of left and right measurement points are symmetrically distributed and the values of von Mises stress change in the middle line of the base plate of existing tunnels using the four excavation methods are similar. The left and right intersection area von Mises stress negative change is the largest; for the high decompression area, the upper and lower step blasting method excavation maximum negative value changes to −669 kN, the upper and lower step static method excavation maximum negative value changes to −591 kN, the CD blasting method excavation maximum negative value changes to −593 kN, and the CD static method excavation maximum negative value changes to −683 kN; the center of the lower tunnel link is the medium decompression area and the negative change of the stress decreases; to the intersection of the left and right sides of the von Mises stress, the negative change gradually becomes smaller and the positive change from the pressure relief area turns into a pressurized area; measurement points 6, 7, and 15–16 for the higher pressurized area—up and down the steps of the blasting method of excavation of the largest positive value changes to 236 kN, up and down the steps of static method of excavation of the largest negative value changes to 199 kN, the CD blasting method of excavation of the largest negative value changes to 199 kN, and the CD static method of excavation of the largest negative value changes to 243 kN; on both sides of the higher pressure-bearing area, the positive change in von Mises stress gradually decreases and a transition is observed from the high pressure-bearing area to the slightly disturbed area. The sensitive area of von Mises stress change is located between measurement points 6 and 16, with a distance of 130 m.
Figure 24 shows the curve of high and low inclination values of the centerline of the base plate of the existing tunnel under different excavation methods and the high and low inclination values of the base plate are calculated using Equation (12) [40]:
f = [δ]/L
where f is the value of the height and tilt of the base plate, [δ] is the maximum vector difference between neighboring measurement points of the base plate, and L is the distance between neighboring measurement points
According to the total displacement settlement value of the existing tunnel base plate under different excavation methods, calculated using Formula (12) (L takes a value of 13 m), the curve of the high and low tilt value of the centerline of the existing tunnel base plate under different excavation methods is derived. Taking the centerline of the left and right tunnels as the axis, the data of the left and right measurement points are approximately symmetrically distributed, their change rules are similar, and they are in the following order from the end to the axis: micro-growth, growth, rapid growth, rapid decline, and decline. The intersection of the left and right tunnels to the higher pressure-bearing area is the sensitive area for the change of high and low tilt values, i.e., measurement points 6–7, 7–8, and 8–9 and measurement points 13–14, 14–15, and 15–16. In the areas sensitive to changes in high and low tilt values, the tilt values in order of magnitude are as follows: the maximum tilt value of the upper and lower step blasting method excavation is 6.57 × 10⁻⁵, the maximum tilt value of the upper and lower step static method excavation is 5.54 × 10⁻⁵, the maximum tilt value of the CD blasting method excavation is 4.94 × 10⁻⁵, and the maximum tilt value of the CD static method excavation is 4.30 × 10⁻⁵.

3.2.4. Excavation Method Preference

The von Mises stress changes in the base plate of the existing tunnel caused by the four underpass tunnel excavation methods are small and similar, and the existing tunnel structure is in a safe condition. Therefore, in this paper, the excavation methods are preferred by displacement control criteria [41]. The line static geometry allowable deviation management value, the high and low tilt values as the evaluation index, and the allowable management value are shown in Table 5.
Assuming that the tilt value of the base plate and the tilt value of the railway track are equal, the operation acceptance tolerance value is selected as the high and low tilt value tolerance value, i.e., 0.0002. After excavation of the four methods, the tilt value of the base plate of the existing tunnel ranges from 6.57 × 10⁻⁵ to 4.30 × 10⁻⁵, which is less than the evaluation tolerance value, and it meets the displacement and deformation control standard. Combined with the construction efficiency and cost [33], the upper and lower step blasting method is preferred and recommended for excavation. During the construction process, monitoring and measurement are strictly implemented, and 70% of the permissible value is set as the warning threshold and, when the warning threshold is reached, the excavation method should be adjusted to the CD blasting method.

4. Conclusions

This paper investigates the excavation mechanical characteristics of a double-line highway tunnel under the influence of dynamic and static loads with an oblique angle under the railway tunnel. Through the method of photographic images and over-advanced geological forecast information, the rock parameters in the influence area of the cross-tunnel project under dynamic and static loads are determined using the quantitative method of a disturbance system and Hoek–Brown criterion, and the engineering scale model of the mechanical excavation of the tunnel under the underpass and the four kinds of calculation conditions are constructed, as well as the mechanical characteristics of the double-line highway tunnel under the influence of dynamic and static loads being revealed on the basis of the analysis of the data of the rock layers in the influence area and mechanical characteristics of the typical section. The mechanical response mechanism of excavation under dynamic and static loads of double-line highway tunnels under the influence of existing railway tunnels is revealed.
(1)
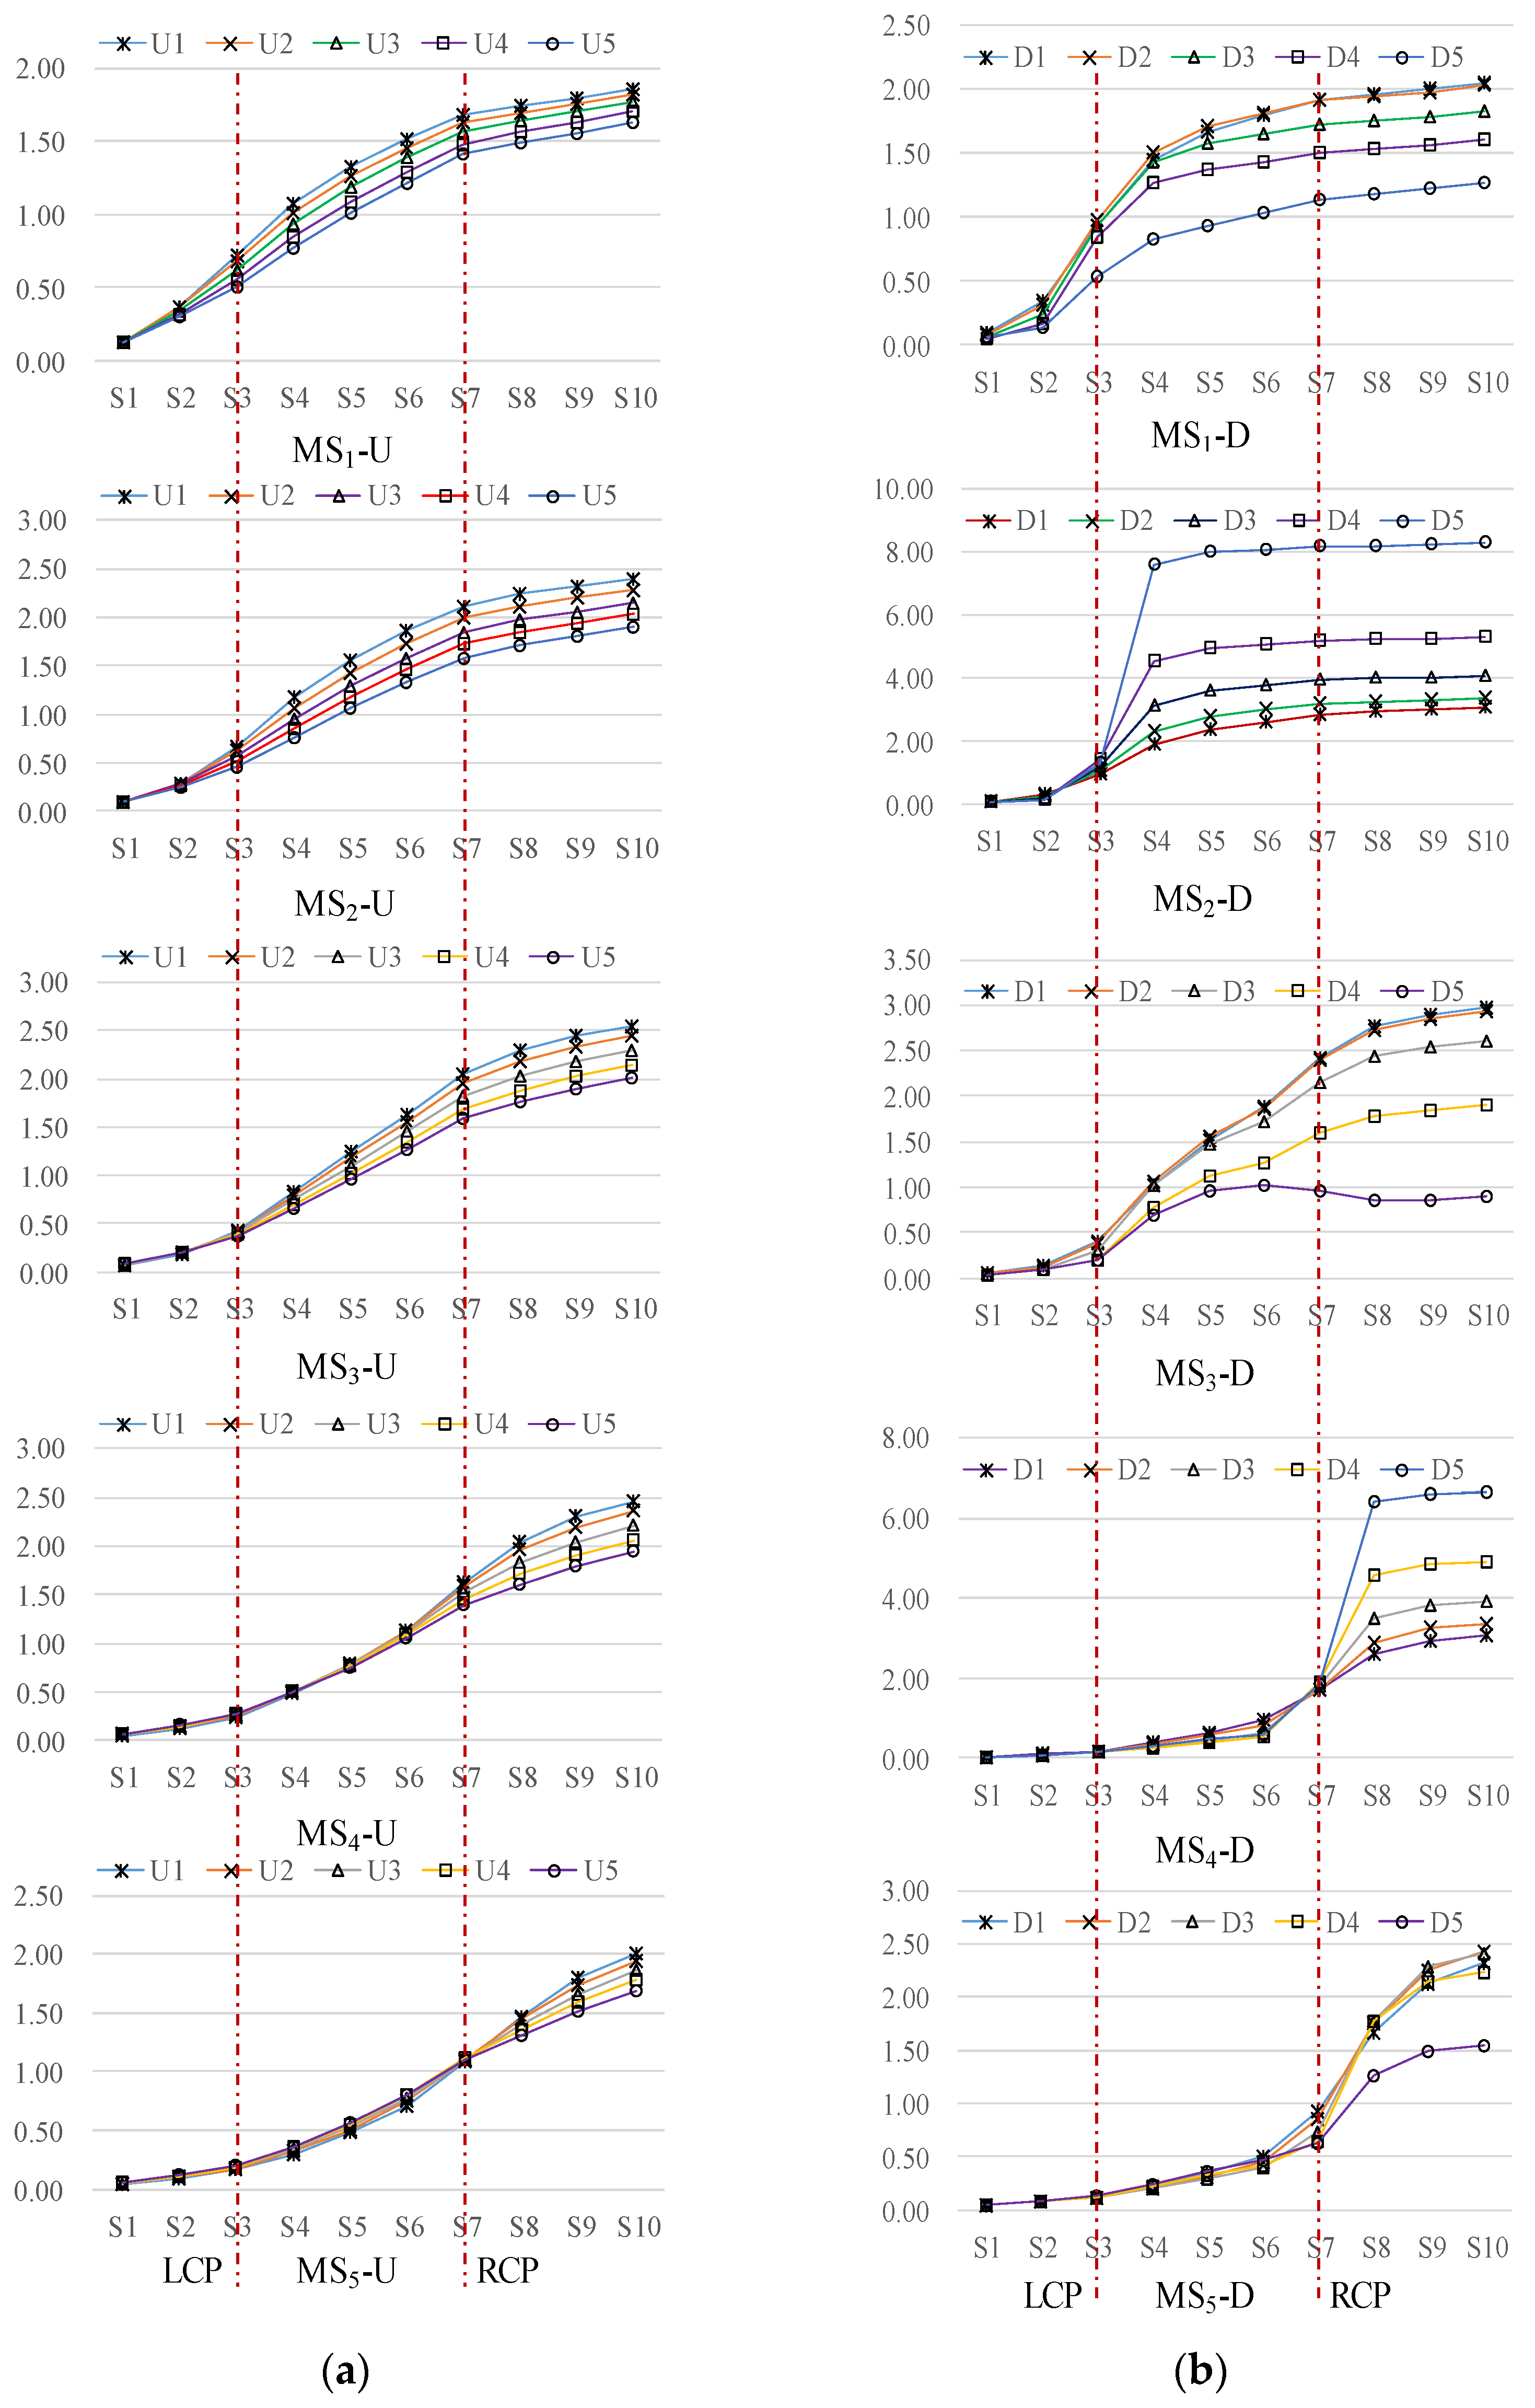
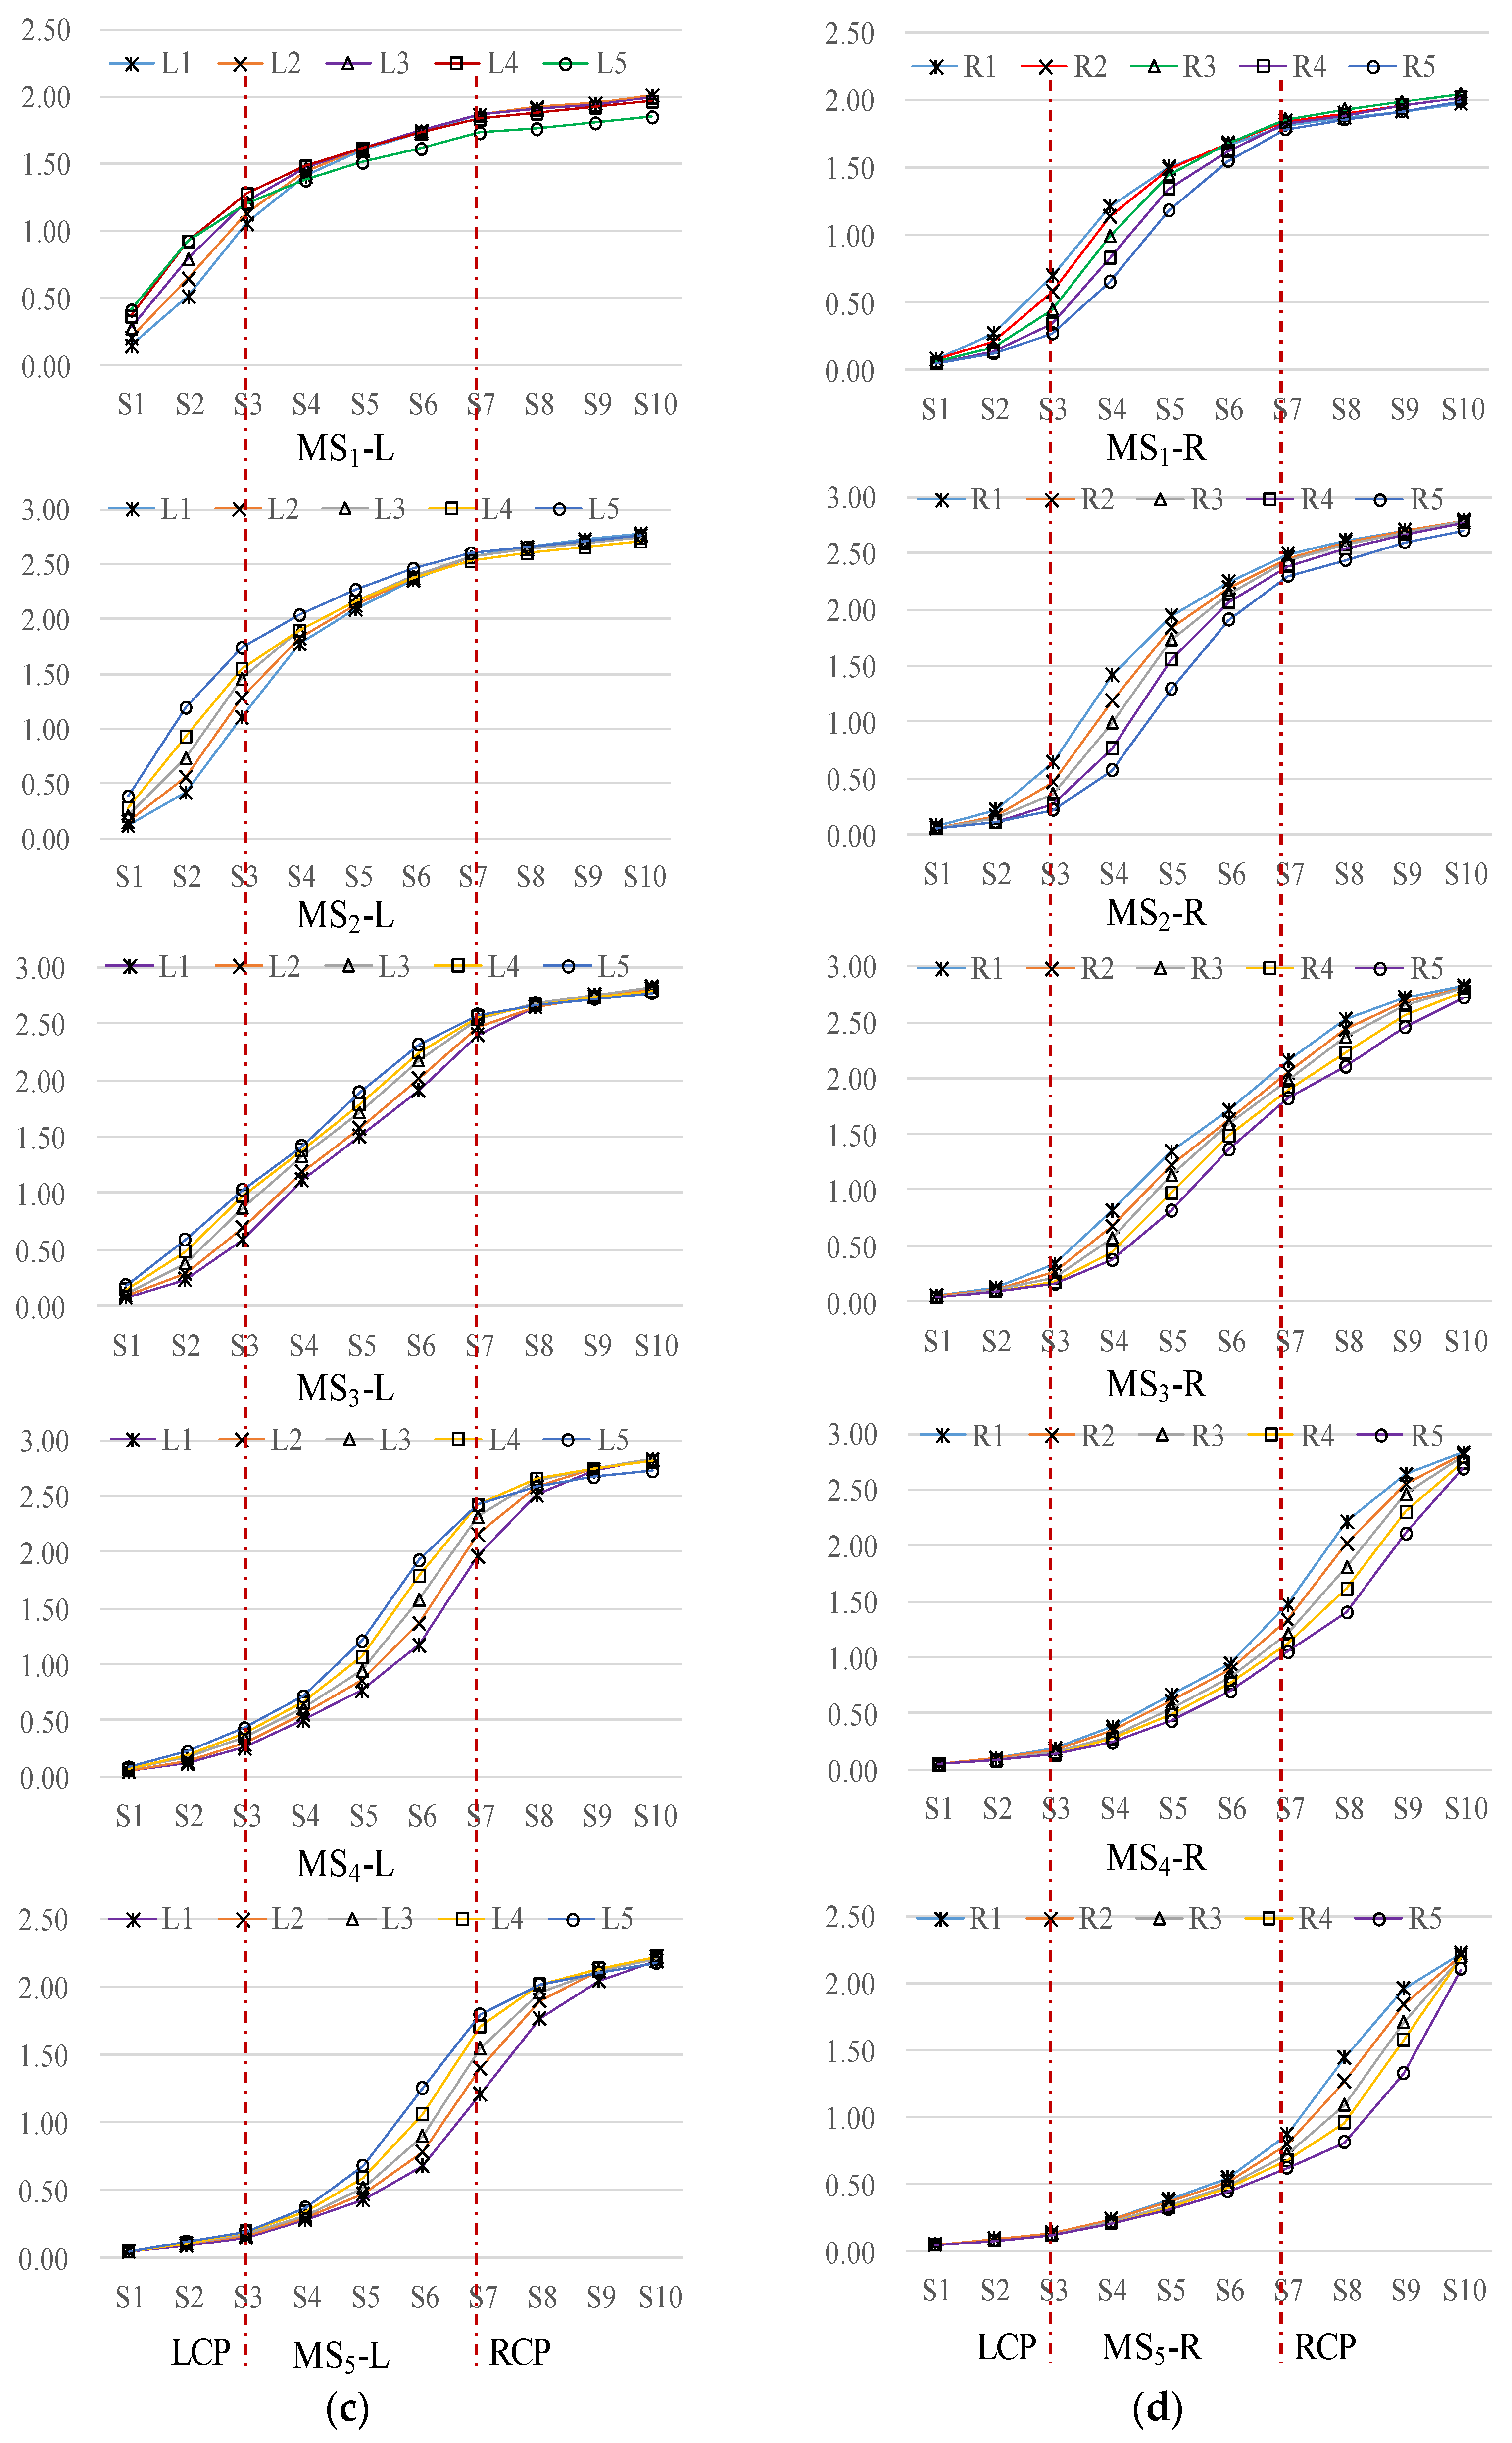
The rock layer movement law of the underpass tunnel construction is revealed. The upper rock layer moves downward and the bottom rock layer moves upward; the arch of the tunnel structure sinks, the bottom plate bulges, and the side walls move outward. The affected areas of the upper and lower rock layer displacement of the new tunnel include the following four areas: strong disturbance area I, medium disturbance area II, low disturbance area III, and micro-disturbance area IV; and the affected areas of the rock layer displacement of the sidewalls are mainly the low disturbance area III and the micro-disturbance area IV. The influence area is arch-shaped and the height and width of the upper and lower arches of the tunnel increase with the increase in the tunnel excavation and support length, while the dimensions of the arches of the sidewalls do not change much. The left tunnel and right tunnel excavation and support process is similar to the strong disturbed area and medium disturbed area change rule, with expansion alone; the low disturbed area and the micro-disturbed area are in the first excavation, on the basis of the expansion of the influence of the region; the left and right tunnel are in the middle of the region of the micro-disturbed and undisturbed areas. The spatial distance between the excavation surface of the new tunnel and the existing tunnel determines the trend of the structural displacement of the existing tunnel, which shows slow growth when the distance is far away and fast growth when the distance is close, and the sensitive influence distance is 40 m.
(2)
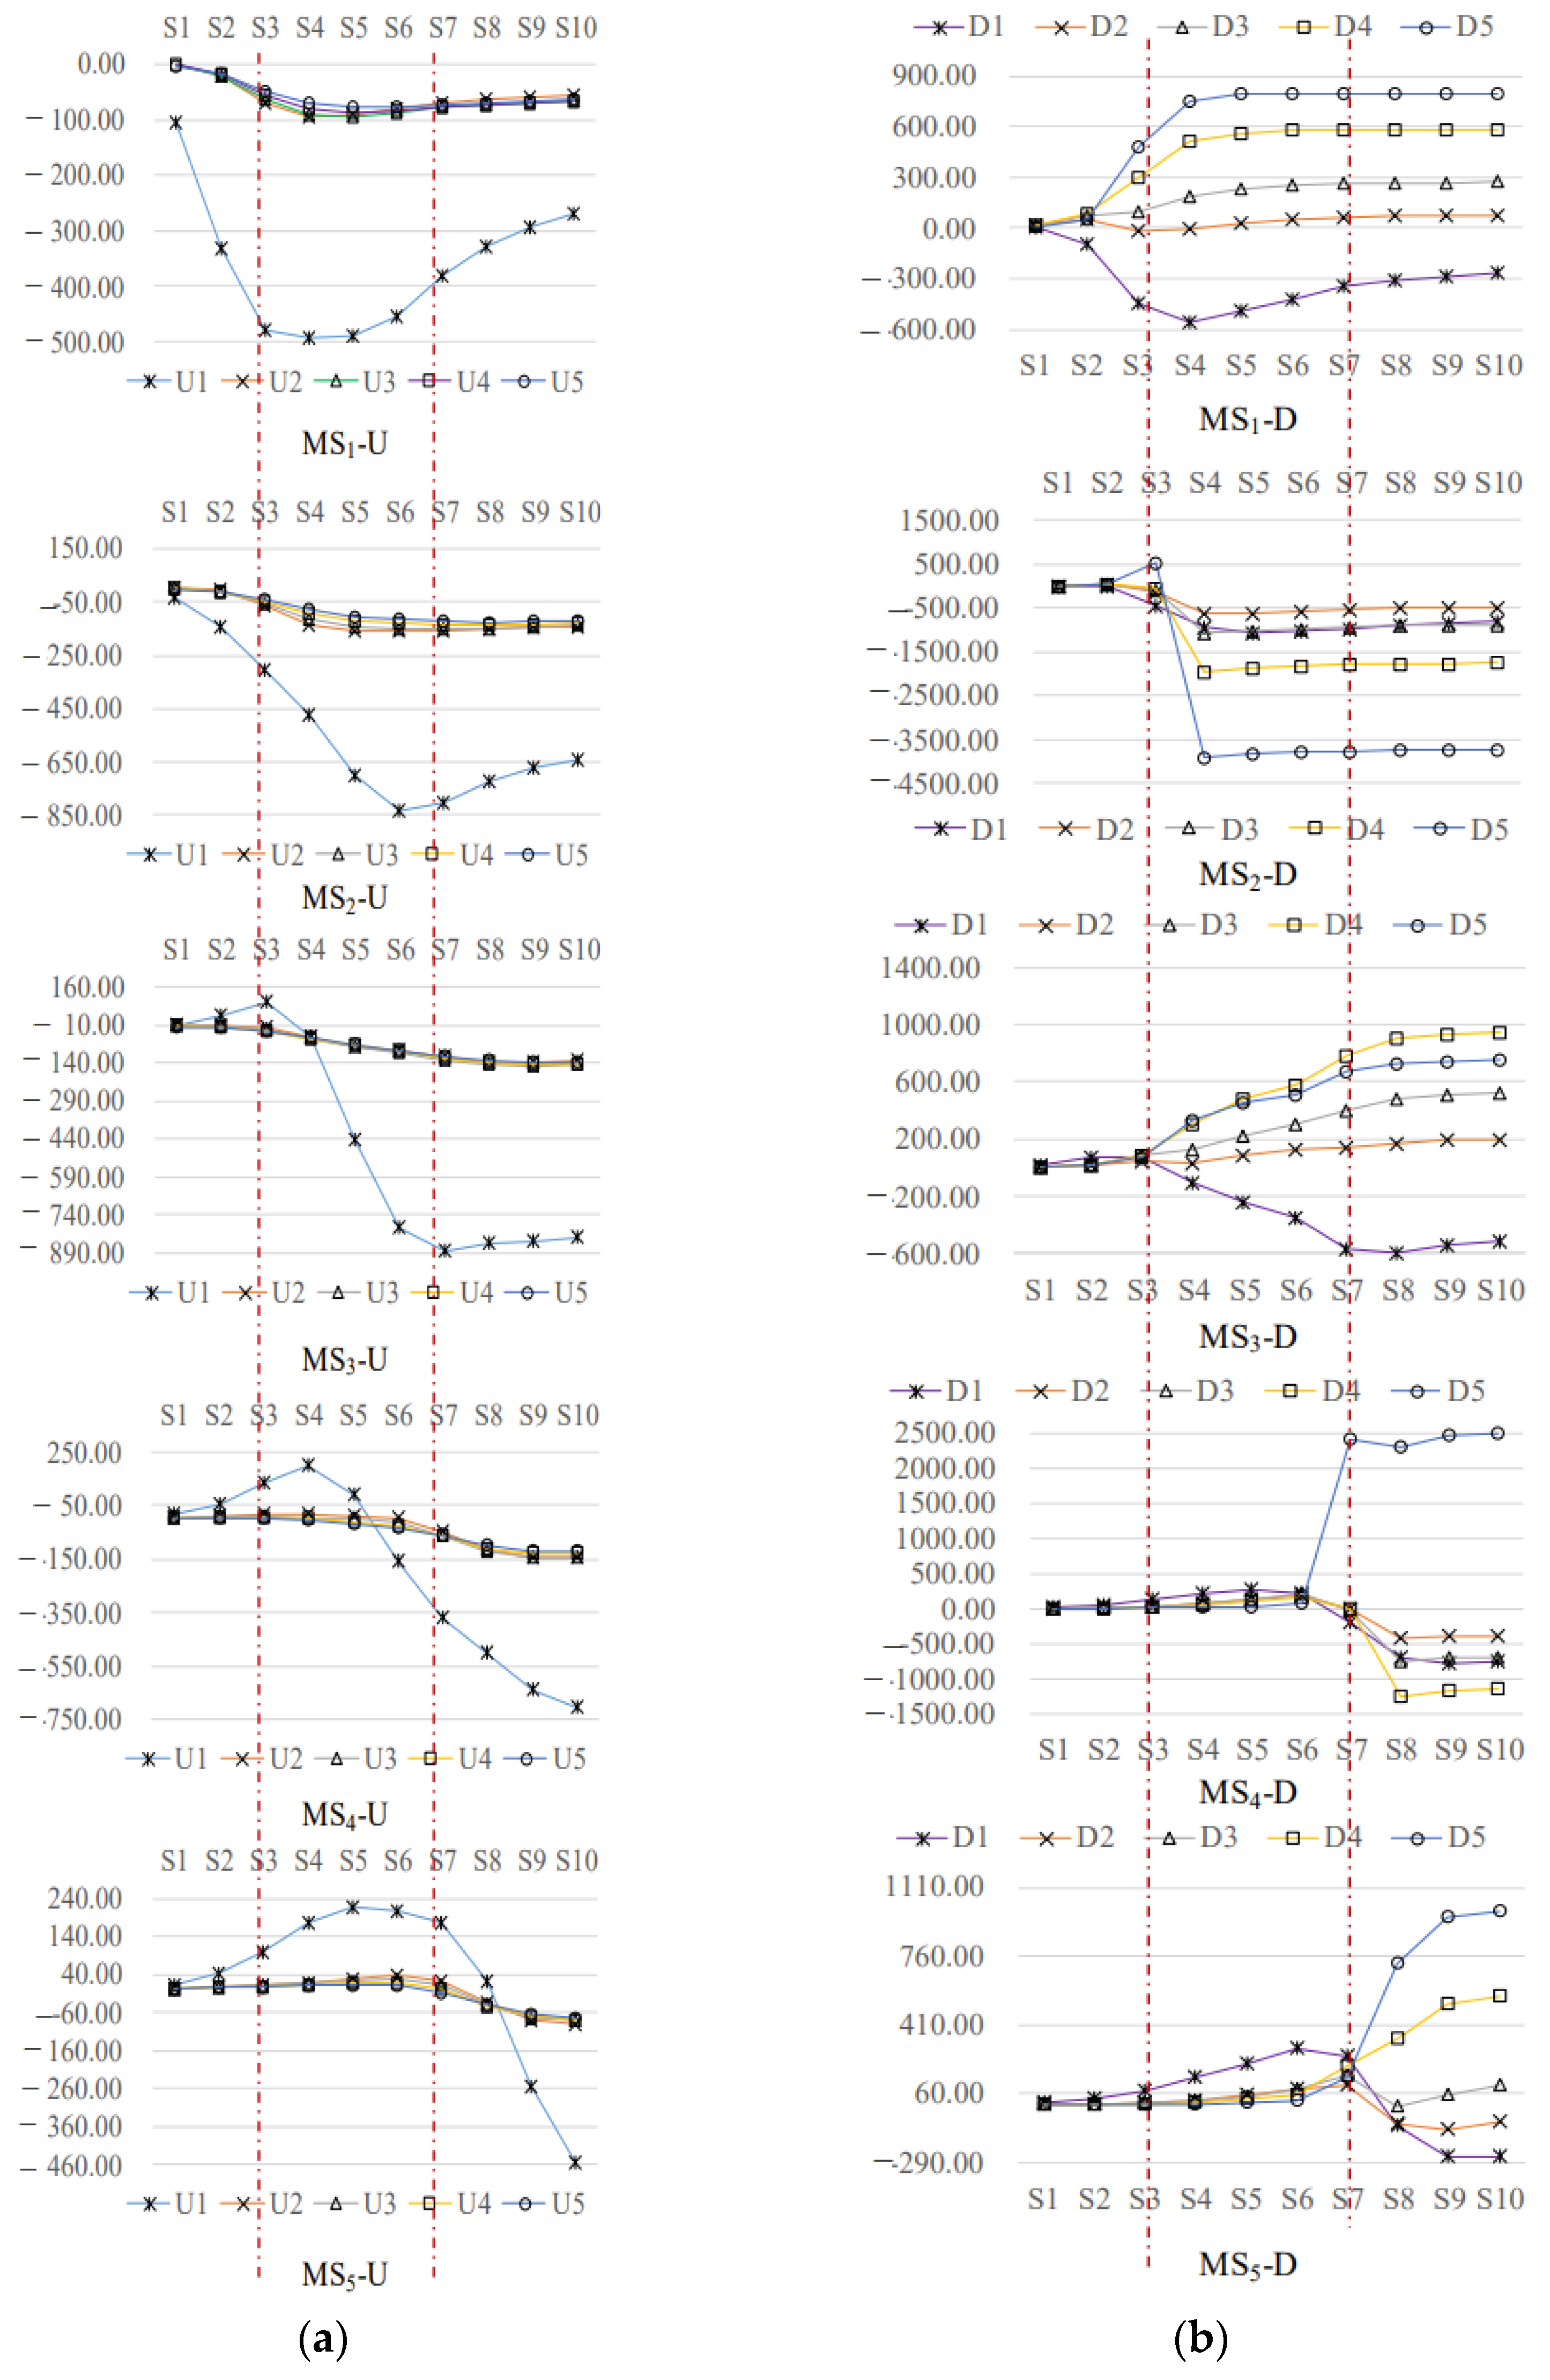
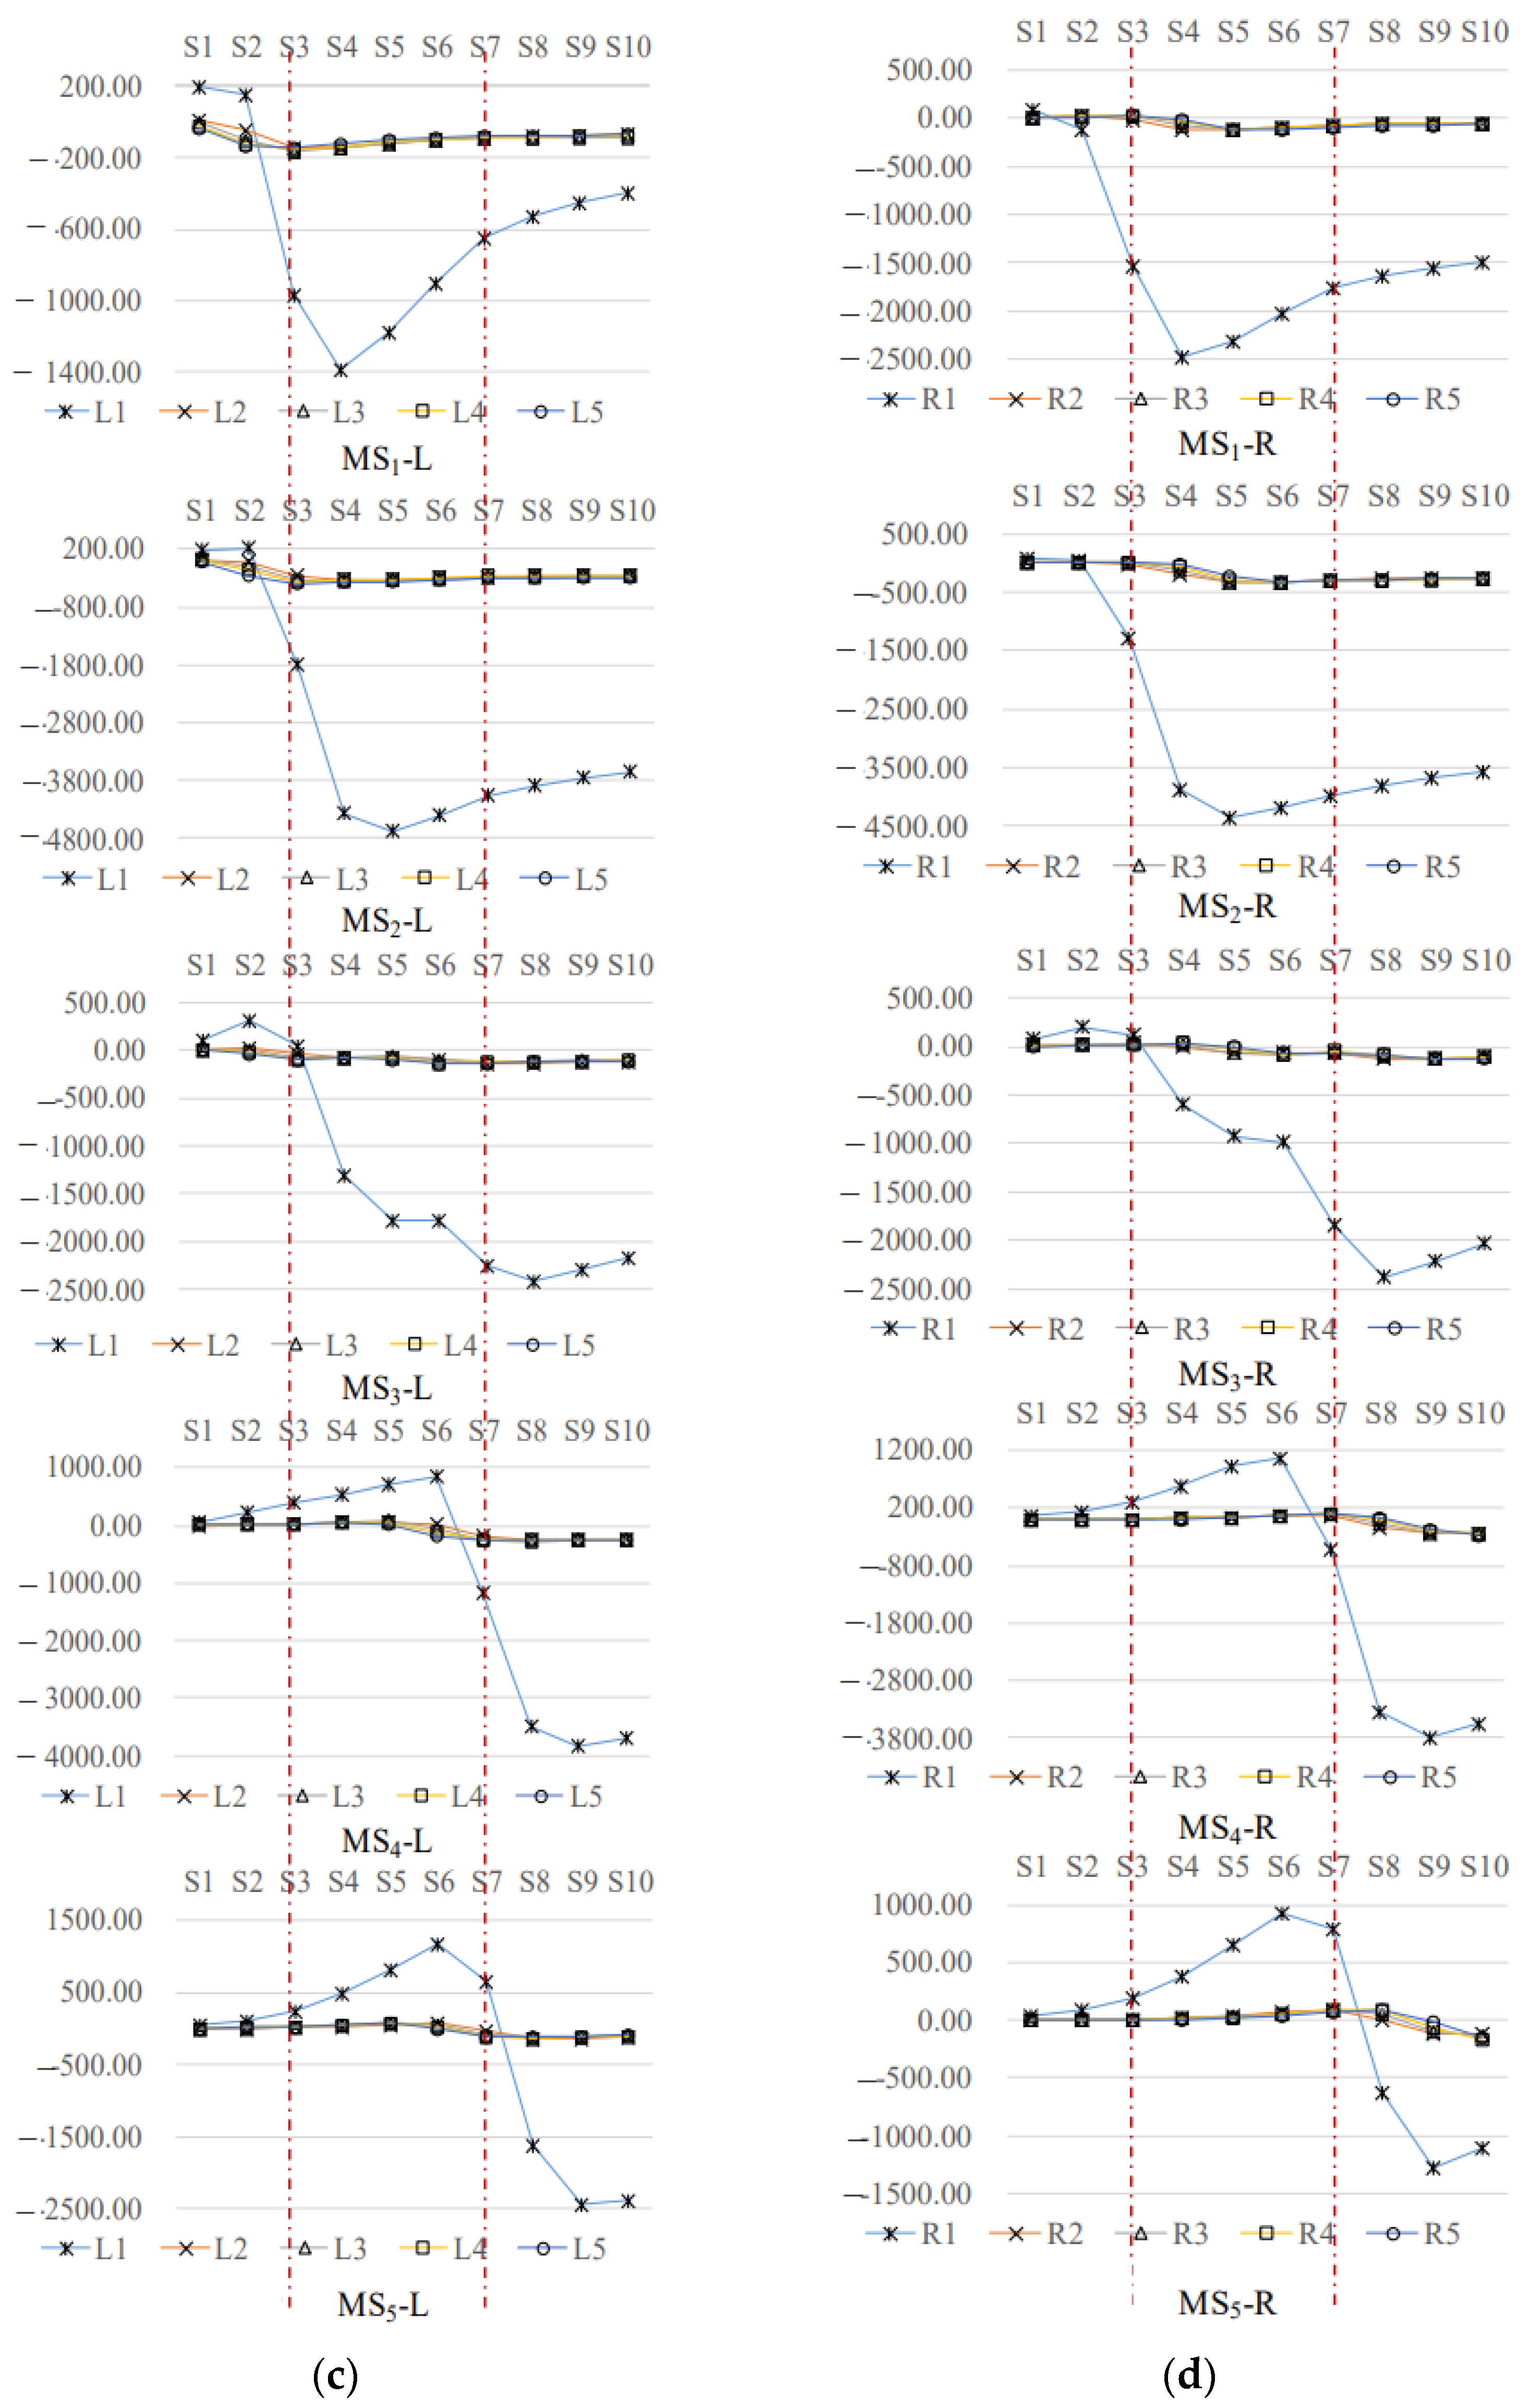
The von Mises stress perturbation law of the existing tunnel for underpass tunnel construction is revealed. The existing tunnel’s roof and side wall von Mises stress disturbance mainly occurs in the tunnel structure; the excavation surface and the existing tunnel space distance determines the corresponding position of the stress trend, the distance is far from the performance of the stress rise, the distance is close to the performance of the stress decline, a certain distance after the stress change tends to stabilize, the degree of different distances to perform the stress change is different and can be divided into four types, as follows: micro, slow, normal, and fast; The sensitive distance of roof stress disturbance is 40~80 m; the sensitive distance of side wall stress disturbance is 40~60 m. The stress disturbance of von Mises on the tunnel floor can be divided into the following four types: micro, low, medium, and high; there are pressure relief and pressure-bearing areas in the tunnel floor area; in the process of the excavation of the left tunnel, the close area of the excavation surface is the pressure relief area with reduced stress, and the far area is the pressure-bearing area with increased stress; the stress disturbance caused by the left tunnel excavation can be divided into the following four types: micro, slow, normal, and fast. Under the influence of the stress disturbance of the left tunnel excavation, the area far away from the tunnel structure during the excavation of the right tunnel shows the phenomenon of stress rising and pressure-bearing, and there is a pressure-bearing stress arch; the sensitive distance of the stress disturbance is 20~40 m.
(3)
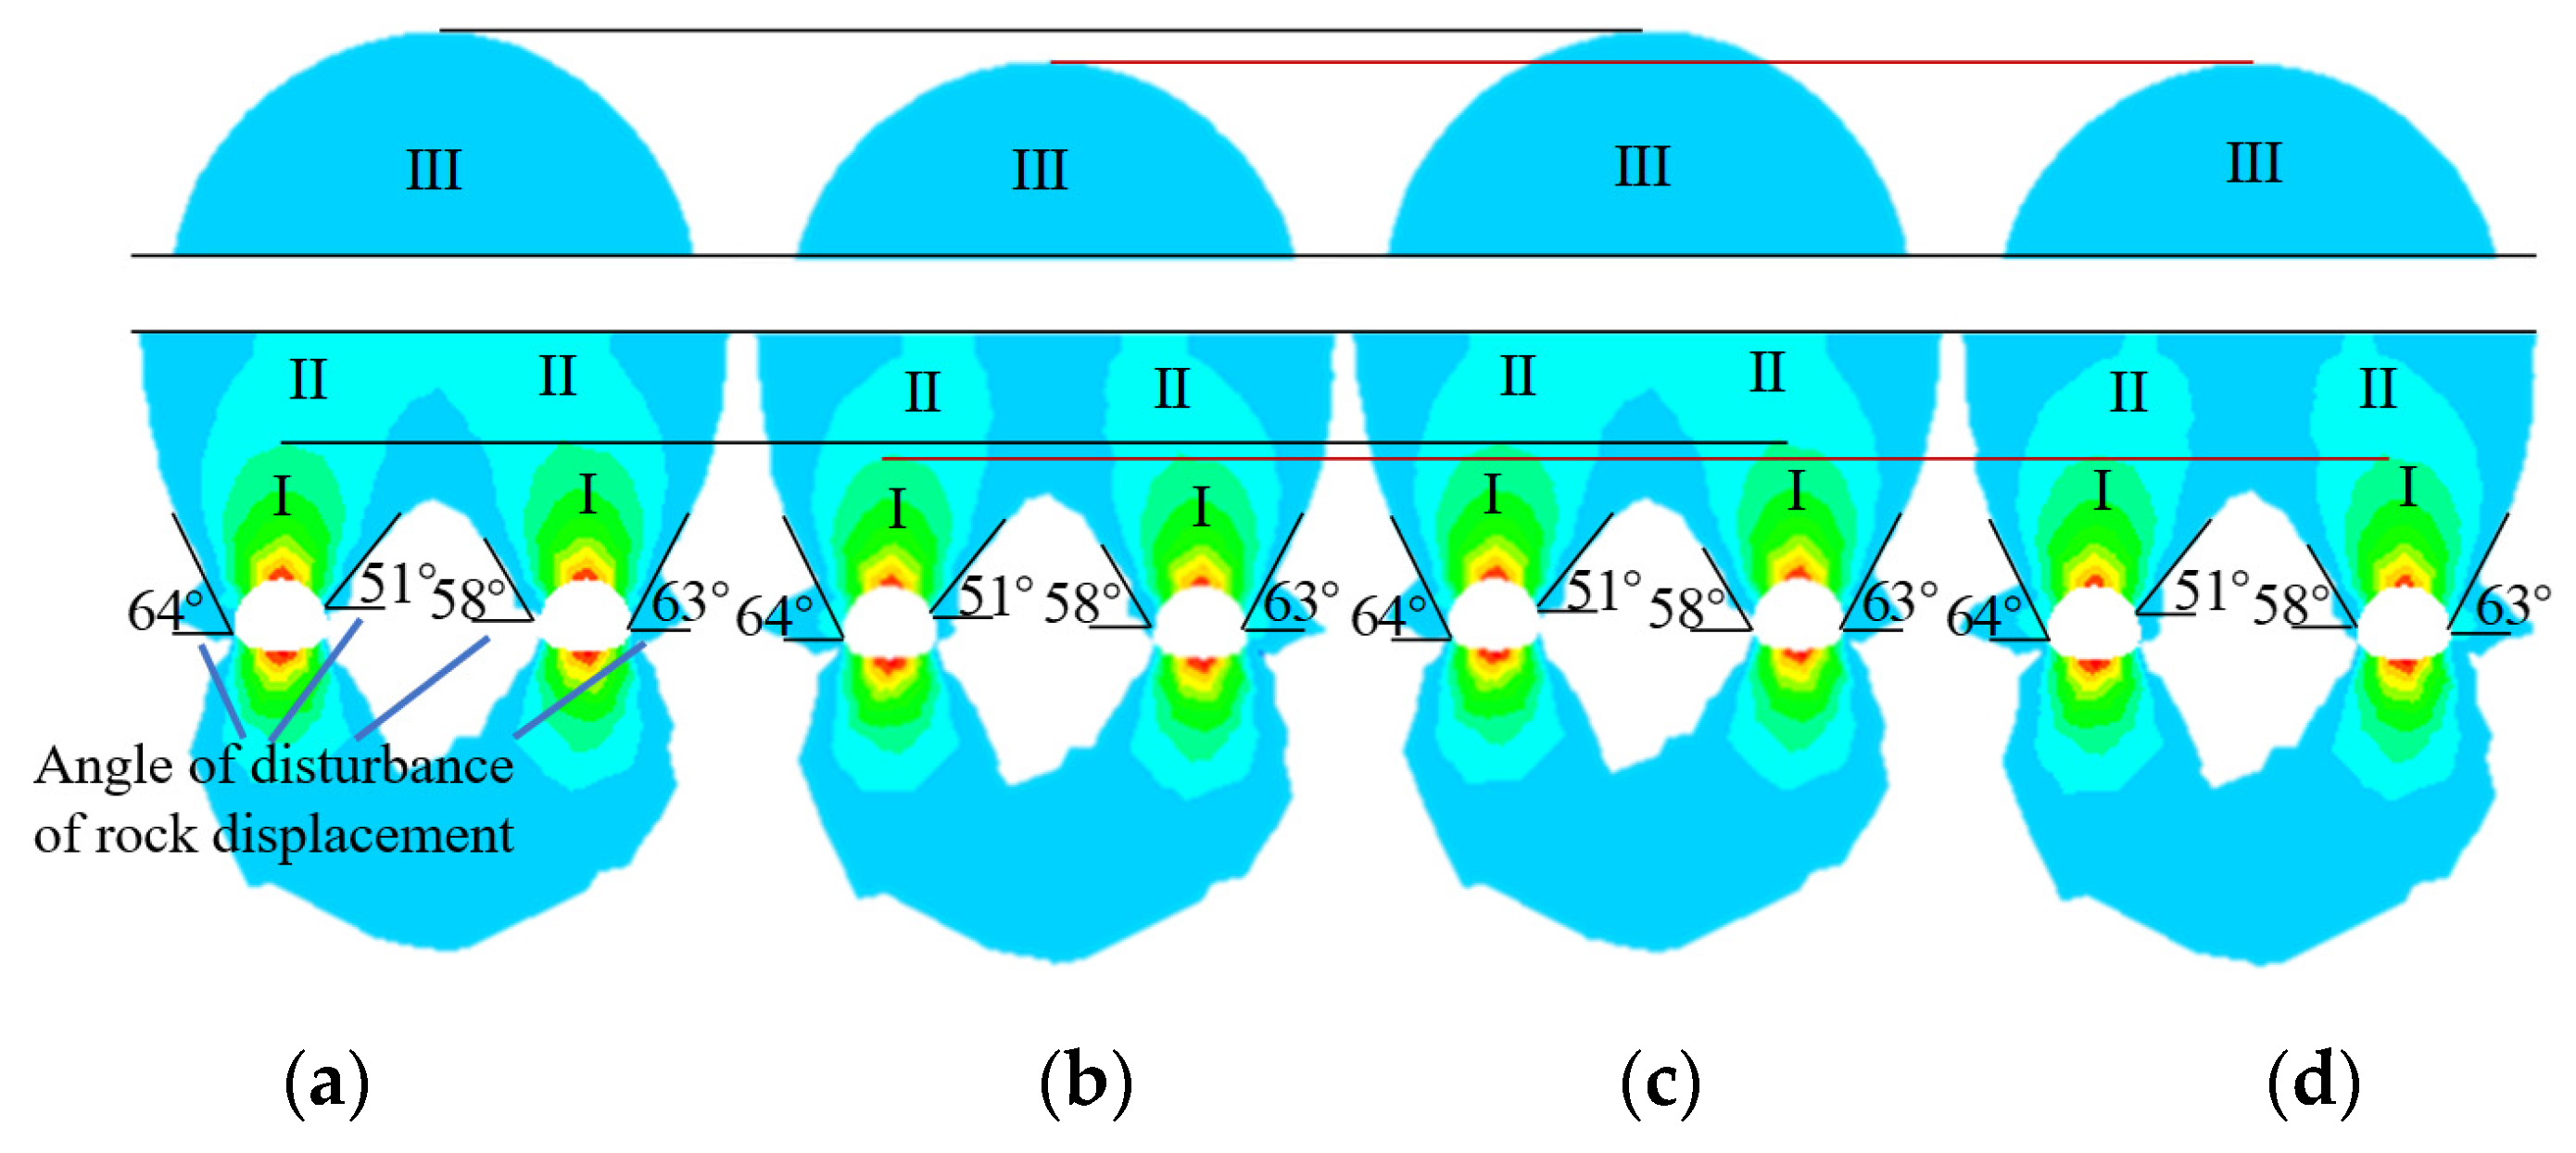
Preferred tunnel construction method. Comparison of the feasible upper and lower step blasting method of excavation (UPBM), the upper and lower step static method of excavation (UPSM), the CD blasting method of excavation (CDBM), and the CD static method of excavation (CDSM) of low-disturbance area of the contour boundary of the tangent and the angle between the horizontal line of the new tunnel for the new tunnel excavation of the rock disturbance angle are equal; the two types of blasting and excavation methods of the displacement of the disturbed area in the existing tunnel under the base plate are connected at one times the diameter of the existing tunnel, and the heights of the displacement-strong disturbance region arch and low-displacement disturbance arch are the same; the two methods of static excavation are not connected and the heights of the displacement-strong disturbance region arch and low displacement disturbance arch are the same, which are lower than the height of the blasting excavation. The total displacement, von Mises stress, and the high and low tilt values of the centerline of the bottom plate of the step tunnel at the time of tunnel penetration were extracted from the data of different excavation methods and, based on the displacement control criterion, the excavation methods were preferred, and the upper and lower step blasting method was recommended for the excavation method.

Author Contributions

Methodology, Y.L.; Formal analysis, Y.L., C.H. and H.L.; Resources, C.H.; Data; curation, C.H., H.L. and C.M.; Writing—original draft, C.H., H.L. and C.M.; Writing—review and editing, H.L. and C.M.; Visualization, C.H., H.L. and C.M.; Funding acquisition, Y.L. All authors have read and agreed to the published version of the manuscript.

Funding

This work is supported by the Hongjian Lu: Natural Science Foundation of Hebei Province (No. E2021209006).

Institutional Review Board Statement

Not applicable.

Informed Consent Statement

Not applicable.

Data Availability Statement

Data are contained within the article.

Conflicts of Interest

The authors declare no conflicts of interest.

References

  1. Chen, Y.L.; Chen, Z.L.; Guo, D.J.; Zhao, Z.W.; Lin, T.; Zhang, C.H. Underground space use of urban built-up areas in the central city of Nanjing: Insight based on a dynamic population distribution. Undergr. Space 2022, 7, 748–766. [Google Scholar] [CrossRef]
  2. Peng, F.L.; Qiao, Y.K.; Sabri, S.; Atazadeh, B.; Rajabifard, A. A collaborative approach for urban underground space development toward sustainable development goals: Critical dimensions and future directions. Front. Struct. Civ. Eng. 2021, 15, 20–45. [Google Scholar] [CrossRef]
  3. Cheng, H.Z.; Chen, R.P.; Wu, H.N.; Meng, F.Y.; Yi, Y.L. General solutions for the longitudinal deformation of shield tunnels with multiple discontinuities in strata. Tunn. Undergr. Space Technol. 2021, 107, 103652. [Google Scholar] [CrossRef]
  4. Chen, R.P.; Song, X.; Meng, F.Y.; Wu, H.N.; Lin, X.T. Analytical approach to predict tunneling-induced subsurface settlement in sand considering soil arching effect. Comput. Geotech. 2022, 141, 104492. [Google Scholar] [CrossRef]
  5. Liu, T.; Xie, Y.; Feng, Z.H.; Luo, Y.B.; Wang, K.; Xu, W. Better understanding the failure modes of tunnels excavated in the boulder-cobble mixed strata by distinct element method. Eng. Fail. Anal. 2020, 116, 104712. [Google Scholar] [CrossRef]
  6. Li, S.B.; Zhang, Y.G.; Cao, M.Y.; Wang, Z.N. Study on Excavation Sequence of Pilot Tunnels for a Rectangular Tunnel Using Numerical Simulation and Field Monitoring Method. Rock Mech. Rock Eng. 2022, 55, 3507–3523. [Google Scholar] [CrossRef]
  7. Qiu, J.L.; Lu, Y.Q.; Lai, J.X.; Guo, C.X.; Wang, K. Failure behavior investigation of loess metro tunnel under local-high-pressure water environment. Eng. Fail. Anal. 2020, 115, 104631. [Google Scholar] [CrossRef]
  8. Zhao, C.Y.; Lei, M.F.; Shi, C.H.; Cao, H.R.; Yang, W.C.; Deng, E. Function mechanism and analytical method of a double layer pre-support system for tunnel underneath passing a large-scale underground pipe gallery in water-rich sandy strata: A case study. Tunn. Undergr. Space Technol. 2021, 115, 104041. [Google Scholar] [CrossRef]
  9. Chaipanna, P.; Jongpradist, P. 3D response analysis of a shield tunnel segmental lining during construction and a parametric study using the ground-spring model. Tunn. Undergr. Space Technol. 2019, 90, 369–382. [Google Scholar] [CrossRef]
  10. Liu, B.; Zhang, D.W.; Yang, C.; Zhang, Q.B. Long-term performance of metro tunnels induced by adjacent large deep excavation and protective measures in Nanjing silty clay. Tunn. Undergr. Space Technol. 2020, 95, 103147. [Google Scholar] [CrossRef]
  11. Zhang, D.M.; Xie, X.C.; Li, Z.L.; Zhang, J. Simplified analysis method for predicting the influence of deep excavation on existing tunnels. Comput. Geotech. 2020, 121, 103477. [Google Scholar] [CrossRef]
  12. Peng, K.; Yi, G.S.; Luo, S.; Si, X.F. Stress Analysis and Spalling Failure Simulation on Surrounding Rock of Deep Arch Tunnel. Appl. Sci. 2023, 13, 6474. [Google Scholar] [CrossRef]
  13. Rosso, M.M.; Marasco, G.; Aiello, S.; Aloisio, A.; Chiaia, B.; Marano, G.C. Convolutional networks and transformers for intelligent road tunnel investigations. Comput. Struct. 2023, 275, 106918. [Google Scholar] [CrossRef]
  14. Deng, Z.Y.; Liu, X.R.; Zhou, X.H.; de la Fuente, A.; Han, Y.F.; Xiong, F.; Peng, H.Y. Field monitoring of mechanical parameters of deep-buried jacketed-pipes in rock: Guanjingkou water control project. Tunn. Undergr. Space Technol. 2022, 125, 104531. [Google Scholar] [CrossRef]
  15. Ma, J.F.; He, S.H.; Cui, G.Y.; He, J.X.; Liu, X.B. Construction stability and reinforcement technology for the super-large rectangular pipe-jacking tunnel passing beneath the operational high-speed railway in composite stratum. Geomat. Nat. Hazards Risk 2023, 14, 2208720. [Google Scholar] [CrossRef]
  16. Ma, P.; Shimada, H.; Sasaoka, T.; Moses, D.N.; Matsumoto, F.; Chen, X.H. Investigation on the engineering effects of the geometrical configuration of the jacking rectangular pipe. Tunn. Undergr. Space Technol. 2022, 119, 104239. [Google Scholar] [CrossRef]
  17. Chen, F.Y.; Wang, L.; Zhang, W.G. Reliability assessment on stability of tunnelling perpendicularly beneath an existing tunnel considering spatial variabilities of rock mass properties. Tunn. Undergr. Space Technol. 2019, 88, 276–289. [Google Scholar] [CrossRef]
  18. Lin, X.T.; Chen, R.P.; Wu, H.N.; Cheng, H.Z. Deformation behaviors of existing tunnels caused by shield tunneling undercrossing with oblique angle. Tunn. Undergr. Space Technol. 2019, 89, 78–90. [Google Scholar] [CrossRef]
  19. Chen, R.P.; Zhang, P.; Wu, H.N.; Wang, Z.T.; Zhong, Z.Q. Prediction of shield tunneling-induced ground settlement using machine learning techniques. Front. Struct. Civ. Eng. 2019, 13, 1363–1378. [Google Scholar] [CrossRef]
  20. Zhang, P.; Wu, H.N.; Chen, R.P.; Dai, T.; Meng, F.Y.; Wang, H.B. A critical evaluation of machine learning and deep learning in shield-ground interaction prediction. Tunn. Undergr. Space Technol. 2020, 10, 103593. [Google Scholar] [CrossRef]
  21. Zhang, P. A novel feature selection method based on global sensitivity analysis with application in machine learning-based prediction model. Appl. Soft Comput. 2019, 85, 105859. [Google Scholar] [CrossRef]
  22. Zhou, J.; Shi, X.Z.; Du, K.; Qiu, X.Y.; Li, X.B.; Mitri, H.S. Feasibility of Random-Forest Approach for Prediction of Ground Settlements Induced by the Construction of a Shield-Driven Tunnel. Int. J. Geomech. 2017, 17, 04016129. [Google Scholar] [CrossRef]
  23. Chen, R.P.; Lin, X.T.; Kang, X.; Zhong, Z.Q.; Liu, Y.; Zhang, P.; Wu, H.N. Deformation and stress characteristics of existing twin tunnels induced by close-distance EPBS under-crossing. Tunn. Undergr. Space Technol. 2018, 82, 468–481. [Google Scholar] [CrossRef]
  24. Lai, H.P.; Zheng, H.W.; Chen, R.; Kang, Z.; Liu, Y. Settlement behaviors of existing tunnel caused by obliquely under-crossing shield tunneling in close proximity with small intersection angle. Tunn. Undergr. Space Technol. 2020, 97, 103258. [Google Scholar] [CrossRef]
  25. Lei, H.Y.; Liu, Y.N.; Hu, Y.; Jia, R.; Zhang, Y.J. Active stability of the shield tunneling face crossing an adjacent existing tunnel: Transparent clay model test and DEM simulation. Can. Geotech. J. 2023, 60, 864–884. [Google Scholar] [CrossRef]
  26. Cheng, R.S.; Chen, W.S.; Hao, H.; Li, J.D. A state-of-the-art review of road tunnel subjected to blast loads. Tunn. Undergr. Space Technol. 2021, 112, 103911. [Google Scholar] [CrossRef]
  27. Tian, X.X.; Song, Z.P.; Wang, J.B. Study on the propagation law of tunnel blasting vibration in stratum and blasting vibration reduction technology. Soil Dyn. Earthq. Eng. 2019, 126, 105813. [Google Scholar] [CrossRef]
  28. Duan, B.F.; Gong, W.Z.; Ta, G.S.; Yang, X.X.; Zhang, X.W. Influence of Small, Clear Distance Cross-Tunnel Blasting Excavation on Existing Tunnel below. Adv. Civ. Eng. 2019, 2019, 4970269. [Google Scholar] [CrossRef]
  29. Wu, B.; Cui, Y.Z.; Meng, G.W.; Xu, S.X.; Xia, C.M.; Li, Y.C.; Zhang, Y. Research on Dynamic Response of Shallow Buried Tunnel Lining Constructed by Drilling and Blasting Method. Adv. Mater. Sci. Eng. 2022, 2022, 4254690. [Google Scholar] [CrossRef]
  30. Ruan, J.B.; Wang, T.H.; Zhao, Z.K.; Zhang, L.; Yin, H.B. Discussion on Blasting Vibration Velocity of Deep Rock Mass Considering Thickness of Overlying Soil Layer. Period. Polytech. Civ. Eng. 2023, 67, 1264–1272. [Google Scholar] [CrossRef]
  31. Li, T.B.; Meng, L.B.; Zhu, J.; Li, Y.; Mou, L. Comprehensive analysis method for advanced forecast of geology in tunnels. Chin. J. Rock Mech. Eng. 2009, 28, 2429–2436. [Google Scholar]
  32. Zhou, Y.; Zhang, B.; Geng, Z.; Chen, D.; Luo, L.; Su, H. Stability analysis of soft rock surrounding tunnel based on hoek-brown strength criterion. J. Eng. Geol. 2019, 27, 980–988. [Google Scholar]
  33. Geng, Z.; Zhang, B.; Li, W.; Huang, F.; Wang, H. Comparison and Analysis on Surrounding Rock Stability of Bias Large Span Tunnel with Different Excavation Methods. J. Eng. Geol. 2018, 26, 866–873. [Google Scholar]
  34. Hu, W.; Liu, J.; Pang, Y.; Zhong, H. Correction of Strength Parameters for Anisotropic Slope Rock Mass Based on H-B Principles. J. Eng. Geol. 2018, 26, 1196–1202. [Google Scholar]
  35. Li, S.; Liu, B.; Sun, H.; Nie, L.; Zhong, S.; Su, M.; Li, X.; Xu, Z. State of art and trends of advanced geological prediction in tunnel construction. Chin. J. Rock Mech. Eng. 2014, 33, 1090–1113. [Google Scholar]
  36. Li, Y.F.; Huang, C.F.; Lu, H.J.; Mou, C. Investigation of the Influence Area of the Excavation of a Double-Line Highway Tunnel under an Existing Railway Tunnel. Appl. Sci. 2024, 14, 290. [Google Scholar] [CrossRef]
  37. Marinos, P.; Marinos, V.; Hoek, E. Geological Strength Index (GSI). A characterization tool for assessing engineering properties for rock masses. In Proceedings of the Underground Works under Special Conditions Workshop, Lisbon, Portugal, 1–6 July 2007. [Google Scholar]
  38. Hoek, E.; Brown, E.T. The Hoek-Brown failure criterion and GSI—2018 edition. J. Rock Mech. Geotech. Eng. 2019, 11, 445–463. [Google Scholar] [CrossRef]
  39. Heping, X.I.E.; Yang, J.U.; Liyun, L.I.; Ruidong, P. Energy mechanism of deformation and failure of rock masses. Chin. J. Rock Mech. Eng. 2008, 27, 1729–1740. [Google Scholar]
  40. Wang, Y.; Yin, J.M.; Xiao, G.Q. Three-dimensional stability analysis of stratified rock mass tunnel based on anisotropic theory. In Proceedings of the 5th International Symposium on In-Situ Rock Stress, Beijing, China, 25–27 August 2010; pp. 617–621. [Google Scholar]
  41. Guo, F.; Liu, J.X.; Li, Y.F. Fatigue life evaluation of high-speed maglev train bogie under higher operating speed grade. In Proceedings of the 5th International Conference on Transportation Information and Safety (ICTIS), Liverpool, UK, 14–17 July 2019; pp. 149–154. [Google Scholar]
Figure 1. Spatial location map of the underpass tunnel project.
Applsci 14 03242 g001
Figure 2. Grading section of rock strata and surrounding rocks in the left lane of the new tunnel.
Applsci 14 03242 g002
Figure 3. Grading section of rock layers and surrounding rocks in the right lane of the new tunnel.
Applsci 14 03242 g003
Figure 4. Layout of the over-advanced geological forecast line.
Applsci 14 03242 g004
Figure 5. L1 photographs of sectioned palm faces.
Applsci 14 03242 g005
Figure 6. L1 cross-section radar data analysis map.
Applsci 14 03242 g006
Figure 7. R1 photographs of sectioned palm faces.
Applsci 14 03242 g007
Figure 8. R1 cross-section radar data analysis map.
Applsci 14 03242 g008
Figure 9. GSI indicator identification chart.
Applsci 14 03242 g009
Figure 10. Grid model for mechanical characterization of tunnel excavation under double-line highway tunnel passing through existing railway.
Applsci 14 03242 g010
Figure 11. Upper and lower step method excavation process grid model diagrams: I—new tunnel blasting excavation influence area, II—anchor reinforcement area, III—secondary lining support, and IV—initial support; 1—pre-excavation cross-section, 2—upper step excavation, 3—upper step initial support, 4—upper step anchor reinforcement area imposition, 5—upper step peripheral rock influence area imposition, 6—lower step excavation, 7—lower step initial support, 8—lower step anchor reinforcement area imposition, 9—lower step peripheral rock influence area imposition, and 10—secondary lining support.
Applsci 14 03242 g011
Figure 12. Grid model diagram of excavation process using the CD method: I—blasting excavation influence area of new tunnel, II—anchor reinforcement area, III—secondary lining support, IV—initial support, e1—left upper guide pit area, e2—left lower guide pit area, e3—right upper guide pit area, and e4—right lower guide pit area; 1—pre-excavation cross-section view, 2—left upper guide pit excavation, 3—left upper guide pit initial support, 4—left upper guide pit anchor reinforcement zone applied, 5—left upper guide pit perimeter rock influence zone applied, 6—left lower guide pit excavation, 7—left lower guide pit initial support, 8—left lower guide pit anchor reinforcement zone applied, 9—left lower guide pit perimeter rock influence zone applied, 10—right upper guide pit excavation, 11—right upper guide pit initial support, 12—right upper guide pit anchor reinforcement zone imposed, 13—right-side upper guide pit perimeter rock influence zone imposed, 14—right-side lower guide pit excavation, 15—right-side lower guide pit initial support, 16—right-side lower guide pit anchor reinforcement zone imposed, 17—right-side lower guide pit perimeter rock influence zone imposed, and 18—secondary lining support.
Applsci 14 03242 g012
Figure 13. Tunnel excavation data extraction time step diagram.
Applsci 14 03242 g013
Figure 14. New axial profile vector and total displacement cloud map of left tunnel.
Applsci 14 03242 g014aApplsci 14 03242 g014b
Figure 15. Vector and total displacement maps of the axial section of the existing tunnel.
Applsci 14 03242 g015
Figure 16. Typical Y-axis profile and survey point layout of cross-tunneling project.
Applsci 14 03242 g016
Figure 17. Plot of the total displacement change versus the time step when extracting excavation data from typical profiles of existing tunnels: (a) vault; (b) floor; (c) left wall; and (d) right wall. The red lines are 12 m apart, referring to the distance between L2 and L4.
Applsci 14 03242 g017aApplsci 14 03242 g017b
Figure 18. Plots of the time step of excavation data extraction versus von Mises stress change curves for typical profiles of existing tunnels: (a) arch; (b) floor; (c) left wall; and (d) right wall. The red lines are spaced at intervals of 80 m, which refer to the time step of excavation data extraction from S3 to S7.
Applsci 14 03242 g018aApplsci 14 03242 g018b
Figure 19. Clouds of the total displacement of the rock formation under different calculation conditions: (a) UPBM; (b) UPSM; (c) CDBM; and (d) CDSM.
Applsci 14 03242 g019
Figure 20. Comparison curves of total displacement extremes of typical profiles of existing tunnels with different working conditions: (a) arch top; (b) floor; (c) left wall; and (d) right wall.
Applsci 14 03242 g020aApplsci 14 03242 g020b
Figure 21. Comparison curves of von Mises stress extremes at typical profile measurement points of existing tunnels with different working conditions: (a) arch; (b) base plate; (c) left wall; and (d) right wall.
Applsci 14 03242 g021aApplsci 14 03242 g021b
Figure 22. Total displacement and settlement curve of the base plate of existing tunnels with different methods of excavation.
Applsci 14 03242 g022
Figure 23. von Mises stress curve of existing tunnel base plate with different excavation methods.
Applsci 14 03242 g023
Figure 24. Variation of the base plate height and inclination values of existing tunnels with different excavation methods.
Applsci 14 03242 g024
Table 1. Table of rock disturbance coefficients in tunneling.
Description of Rock Excavation Methods and EffectsD Value
Very little disturbance, good blasting or tunnel boring machine excavation0
Small disturbances, poor rock mass with mechanical or manual excavation0
Large disturbances, stress concentrations causing the tunnel bottom to bulge0.5
High disturbance, poor blasting results0.8
Table 2. Classification table of rock integrity coefficients mi.
Rock TypeRock GroupRock Structure
CoarseMedium GrainGrainVery Fine Grain
Sedimentary rockClastic rockConglomerate (geology) Conglomerate (geology)
Malmstone Malmstone
17 ± 4 siltstone 17 ± 4 siltstone
Non-clastic rocks7 ± 2 Claystone 7 ± 2 Claystone
Carbonate rock4 ± 2 4 ± 2
Non-clastic rocksConglomerate Conglomerate
MetamorphicEvaporites non-clastic rocks miscellaneous malmstones miscellaneous malmstones
(18 ± 3) Shale (18 ± 3) Shale
Organic Rocks6 ± 2 6 ± 2
Non-fragmentaryMarl Marl
Volcanic rockMicrofacies(7 ± 2) (7 ± 2)
Coarse crystalline limestone Coarse crystalline limestone
Lamellar Light-colored, dark octidolite(12 ± 3) Brilliant limestone (12 ± 3) Brilliant limestone
(10 ± 2) Microcrystalline limestone (10 ± 2) Microcrystalline limestone
(9 ± 2) Dolomite (9 ± 2) Dolomite
Dark-colored plutonic rocks(9 ± 2) Dolomite (9 ± 2) Dolomite
Gypsum rock Gypsum rock
Light-colored, dark-colored mafic rocks8 ± 2 Hard gypsum 8 ± 2 Hard gypsum
Table 3. Table of relevant parameters for each rock type in the area of influence.
Area of InfluenceExcavation MethodRock Typembsa σ c m /MPa σ 3 n /MPa
New tunnelsBlasting excavationMalmstone2.4640.00250.5041.860.514
Mudstone0.6560.00070.5080.401.087
Static excavationMalmstone4.2100.00670.5042.460.523
Mudstone1.2620.00220.5080.571.109
Existing tunnels——Malmstone3.5210.00470.5042.240.477
Mudstone1.0150.00140.5080.511.011
Overlap zoneBlasting excavationMalmstone1.7720.00150.5041.570.493
Mudstone0.4380.00030.5080.331.040
Static excavationMalmstone3.5210.00470.5042.240.504
Mudstone1.0150.00140.5080.511.068
Table 4. Table of mechanical parameters for rock modeling in different regions of influence.
Area of InfluenceExcavation MethodRock TypeγE/GPac′/MPaφ′/°v
New tunnelsBlasting excavationMalmstone23.132.980.8027.900.27
Mudstone23.891.100.3313.770.38
Static excavationMalmstone23.133.980.9732.230.23
Mudstone23.891.470.4417.530.35
Existing tunnels——Malmstone23.133.580.8631.480.24
Mudstone23.891.320.3816.720.36
Overlap zoneBlasting excavationMalmstone23.132.590.6925.600.28
Mudstone23.890.960.2711.910.40
Static excavationMalmstone23.133.580.8931.030.24
Mudstone23.891.320.3916.390.36
Table 5. Table of permissible values for high and low inclination of railway tracks.
Train SpeedOperational AcceptanceRegular MaintenanceTemporary Repairs
200~250 km/h0.00020.00050.0008
250~300 km/h0.00020.00040.0007
Disclaimer/Publisher’s Note: The statements, opinions and data contained in all publications are solely those of the individual author(s) and contributor(s) and not of MDPI and/or the editor(s). MDPI and/or the editor(s) disclaim responsibility for any injury to people or property resulting from any ideas, methods, instructions or products referred to in the content.

