Abstract
South Korea has one of the largest e-commerce markets in the world. The last-mile delivery segment of e-commerce often causes critical damage to products in protective packages. Despite the rapid growth of the e-commerce market in Korea, the last-mile distribution environment has not yet been thoroughly investigated. The main aim of this study was to provide an understanding of the vibration levels that were measured from various parcel delivery routes within Seoul, Korea, using common types of parcel delivery trucks. Vibration levels of ten delivery trucks were measured and analyzed in terms of power spectral densities (PSDs) and presented as PSD spectra. The last-mile delivery vehicle vibration levels in Korea were found to be consistently lower (in the 1 to 200 Hz frequency range) than those recommended by international standards and lower than the vibration levels of parcel delivery vehicles in the U.S. and Hungary. The results also revealed that the highest intensity peak of the PSD spectrum for Korea was located in the lower frequency range (1.5 to 2 Hz) compared to the ISTA 3A pickup and delivery test profile (3 to 4 Hz) and the test profile recommended for Hungary (13 to 16 Hz). A smoothed composite spectrum was also provided to support Korean packaging engineers in optimizing their packages by simulating proper last-mile truck delivery vibration levels in lab conditions.
1. Introduction
A common and widely used parcel delivery system, which is known as a two-echelon distribution network, consists of a logistics hub, a satellite facility (SF), and collection and delivery points (CDPs) [1]. Goods in the central logistics hub are distributed to multiple SFs using first-echelon transportation modes, such as large, heavy vehicles, or air and rail transportation [1]. Then, SFs distribute goods to two types of points of demand, which are CDPs and individual customers, using second-echelon vehicles, including different types of heavy/large or light/medium-size vehicles [1]. As the packages travel through this common distribution network, there are two main, inevitable types of hazards that packages can experience. First, shock and drop events due to both manual and automated handling points, and second, severe vibrations transmitted by both first-echelon and second-echelon vehicles. Packaging engineers design protective packaging to resist these distribution hazards and reach their customers with little to no damage to their products. To test their packages before the actual shipments to customers, packaging engineers use international lab-based testing protocols, such as ISTA 3A [2] or ASTM D7386-16 [3]. However, international testing standards sometimes do not completely reflect the unique circumstances in different countries. In packaging engineering, the product normally sits in a cushioning material. The cushioning material basically acts as a spring, and the product weight is a mass in the packaging system. The natural frequency of the packaging system can be calculated using the following equation (Equation (1)):
where fn is natural frequency (Hz), k is spring constant, g is gravitational acceleration, and W is product weight.
This equation indicates that a packaging system’s resonance depends on the cushioning material’s spring constant and the system’s weight. The ratio of the natural frequency of the system and the frequency of the input vibration (vibration generated from the package delivery vehicle in this case) determines whether the acceleration or amplitude of the product–package system will be greater (amplification) or lower (attenuation) than that of the input vibration. This phenomenon is called transmissibility. Transmissibility increases when the packaging system’s natural frequency overlaps or gets close to the frequency of the input vibrations. Therefore, packaging engineers need to avoid designing packaging systems with a natural frequency close to the peak intensity frequency of the targeted distribution environment. According to the previous explanation, packages designed to have natural frequencies that are far from the peak acceleration frequencies of international testing standards’ vibration test profiles can become less effective in different geographical regions. This is because other countries could use various types of package distribution vehicles, which have peak intensity frequencies closer to the initially designed natural frequency of the packaging system. The amplified vibration level due to matching frequencies can cause more fatigue and potential scuffing to the product.
Many researchers in the past have observed and analyzed the country-specific characteristics of shock and drop events and vibration levels needed to update international testing standards to be suitable for their regions. Characteristics of shock and drop events have been investigated in Europe [4], China [5], the United States [6,7,8], South Korea (Korea) [9], and transcontinental parcel shipments between Europe and the United States [10]. The vibration levels of heavy, large trucks, commonly used as first-echelon vehicles in the parcel delivery industry, were also widely researched for different regions, such as India [11], Japan [12], Spain [13], the United States [14], China [15], and Korea [16]. The vibration levels of other modes of transportation for packaging, such as drones [17], industrial forklifts [18], multimodal shipping containers [19], ULD dollies at air cargo sorting hubs [20], and aircraft [21], and how vibration is generated by these different modes of transportation can affect the integrity of packaged products [22,23,24,25]. This has also already been widely investigated. However, the vibration levels of second-echelon vehicles used for last-mile parcel delivery have only been measured in a few countries, such as Australia [26], Hungary [27], the United States [28,29], China [30], and Southeast Asia [31].
Packaging engineers have decades of experience designing packages for large trailers; hence, they understand the vibration environment very well through multiple studies published in different countries [11,12,13,14,15,16]. Yet, there is a growing need to understand the last-mile delivery portion of the distribution environment, which is conducted using smaller vehicles, due to its severe harshness compared to the larger truckload environment. The ISTA 3A recommended vibration test profile for last-mile delivery vehicles [2] has 75% higher intensity at the peak frequency band than the main peak in the first echelon vehicle vibration simulation profiles. Also, there are many changes in last-mile delivery vehicles that happen due to the different strategies of various business models, the different urban structures of various countries, and the advent of technologies, such as electric vehicles. Autonomous, crowdsourced parcel delivery services using personal vehicles have been growing recently in many parts of the world in response to the demand for the rapid delivery of purchased products in urban areas [32,33]. The vibration levels of these vehicles in the U.S. have been measured by previous researchers [28]. The vibration levels of various motorcycles, which are commonly used for parcel delivery in Southeast Asia but are not common in other parts of the world, were also measured in previous studies because of their unique characteristics [31]. These studies clearly show that many different versions of vehicles are used in last-mile deliveries, and they have unique vibration characteristics. Therefore, characterizing the vibration levels of commonly used last-mile delivery vehicle types in different geographical regions is extremely important to properly simulate their harshness and unique characteristics, such as different peak intensity frequencies, which could increase transmissibility.
E-commerce is a trending and emerging type of retail service in Korea. In 2022, annual online retail transactions in Korea accounted for 33.6% of the total retail transactions. They also had the second-largest ratio of e-commerce to retail distribution market in the world in 2021 [34,35]. Moreover, online retail transactions, excluding non-product delivery services, such as travel and transportation services, culture and leisure services, e-coupon services, food services, and other service transactions, accounted for 73.7% of total annual online retail transactions in Korea [35]. One key factor that serves as a cornerstone of the rapid growth of e-commerce is a fast and convenient parcel delivery service along with an advanced and efficient courier network. Accordingly, parcel delivery volume in Korea has significantly increased. Parcel delivery volume increased by 158.2% between 2012 and 2021, and it increased by 7.6% in 2021 compared to the year before [36]. Due to regulations in Korea limiting the cargo capacity of last-mile delivery vehicles to less than 1.5 tons, more and more small cargo vehicles, commonly known as ‘1-ton trucks’, are being utilized for Korean last-mile delivery in order to cover this increased parcel delivery volume. This unique practice differs from other countries where vans or motorcycles are predominantly used for parcel delivery. However, Korean packaging engineers still rely on the last-mile vehicle vibration test profiles recommended by international test standards due to the lack of test profiles specific to the Korean delivery environment. Most internationally used vibration profiles for parcel delivery vehicles were developed to simulate commonly used parcel delivery trucks in the U.S. Considering the large size of the e-commerce market and the booming parcel courier industry, proper understanding and simulation of the unique characteristics of the Korean parcel delivery system could create significantly positive synergy for packaging engineers in many ways. For example, it could provide cost and waste reduction opportunities by cutting out overused packaging materials, and it will help achieve higher customer satisfaction due to reduced product damage rates through the testing and optimizing of packages using properly simulated vibration test profiles. A properly optimized packaging system can easily contribute to lightening the weight of the packaging materials used. It is called a linear reduction strategy and is sometimes considered more critical for packaging sustainability than developing new packaging materials [37]. However, despite the anticipated positive synergy between improving parcel packaging through the proper simulation of different vibration levels experienced by parcels across the various last-mile delivery vehicles and regions in Korea, the unique vibration characteristics and a general last-mile vehicle vibration test profile for the Korean distribution environment have not yet been studied and established. This research is the first of its kind to address this topic.
Therefore, this study aims to pioneer the investigation into the unique characteristics of the Korean last-mile delivery environment by assessing and analyzing the vibration levels of commonly used last-mile delivery vehicle models across various delivery routes. This study also aimed to develop a composite vibration test profile and compare it to existing international test standards and last-mile delivery vehicle vibration levels from previously investigated countries. Finally, statistical characteristics of vibration data from Korea are also discussed in this study.
2. Materials and Methods
2.1. Instrumentation and Recording Parameters
In this study, field data recorders, such as Saver 3X90s manufactured by Lansmont Corporation (Monterey, CA, USA), were used to record the vibration levels of the most common last-mile delivery vehicles in South Korea. Saver 3X90s are equipped with full triaxial accelerometers that capture vibration levels in vertical, lateral, and longitudinal directions. The field data recorders were mounted to the vehicles’ cargo compartment floors using a magnetic base to measure the vibration levels of the locations where packages are directly loaded. The sensors were placed at the center front of the cargo areas where they could connect to the vehicles’ chassis. This was because there were no guarantees that the recorders would not get stolen if they were mounted to the bottom of the vehicles. Also, any other locations in the cargo areas were not feasible because those locations would disturb the loading process. Field data recorders were covered by a transparent acrylic box to prevent them from getting impacted by packages. The recording parameters used for this study were as follows:
Signal-triggered recording.
- Record time: 2 s;
- Sampling rate: 1000 Hz;
- Signal pre-trigger: 20%;
- Trigger level: 0.5 g;
- Filter frequency setting: 250 Hz;
- Data retention mode: Max overwrite;
- Memory allocation: 60%.
Timer-triggered recording.
- Record time: 2 s;
- Sampling rate: 1000 Hz;
- Wakeup interval: 20 s;
- Filter frequency setting: 250 Hz;
- Data retention mode: Fill/stop;
- Memory allocation: 40%.
2.2. Delivery Vehicles and Trip Details
The average vibration levels of different last-mile delivery vehicles within Seoul, Korea, were measured; more than half (58%) of Korea’s parcel delivery volume is concentrated in the Seoul capital area [38]. Seoul was divided into four quadrants: northeast (NE), southeast (SE), northwest (NW), and southwest (SW). Then, two to three last-mile delivery vehicles from each quadrant were selected for use in measuring the vibration levels. In total, the last-mile vibration levels of 10 small box trucks were measured (Figure 1). Measurements took place from the beginning to the end of their last-mile delivery service. All last-mile delivery vehicles traveled to the local delivery area from the sub-terminals where they belonged. The sub-terminals covering the Seoul area were mostly located in areas slightly beyond the direct delivery zones, where the population density is relatively lower. Therefore, during the initial stages of delivery, they accessed these locations using highways. Upon entering the delivery zones, delivery vehicles navigated through urban roads, allowing them to experience various road conditions. How long each truck was driving, but not idling (duration in motion), was determined to avoid artificially lowering the measured vibration intensity (described in detail in Section 2.3) and to provide recommended lab testing durations. The average length of time in motion of the investigated vehicles was 81 min (Table 1).
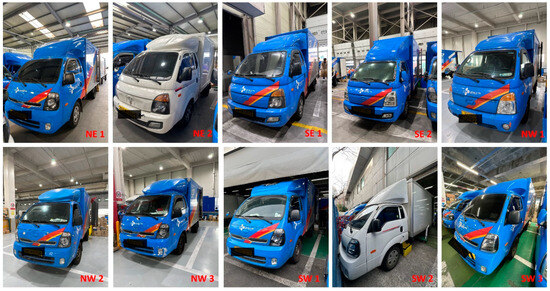
Figure 1.
Vehicles measured for last-mile delivery vibration. NE, SE, NW, and SW refer to northeast, southeast, northwest, and southwest, respectively, and the following number indicates the trip number.

Table 1.
Specifications and local delivery area information for each investigated vehicle.
Two different models of small box trucks that were similar to each other and common for last-mile delivery in Korea were selected for data collection: Bongo 3 (Kia, Seoul, South Korea) and Porter 2 (Hyundai Motor Company, Seoul, South Korea). Load capacity differed, even between the same models, due to modified (specialized) cargo boxes on some of the trucks and model year differences. The specifications and delivery areas of each box truck are listed in Table 1.
2.3. Data Analysis Method
Power spectrum density (PSD) is a way to present the average intensities of vibrations as a function of frequency. In this study, Saver Xware software v.4.2.1.1 (Lansmont Corporation, Monterey, CA, USA) was used to generate PSD for the measured vehicle vibrations. The PSD levels are presented from 1 to 200 Hz. In order to eliminate undesirable events that should not be considered vehicle vibrations, data points under 0.03 Grms (root-mean-square of the acceleration) and equal to or greater than 2 g were excluded from the analysis. This method has been historically used by many previous studies, especially to remove inactive movements of the vehicle, such as idling for pickup and delivery, and shock events that should be treated separately [27,39,40].
An independent t-test was used to compare the overall Grms values of the vertical vibration levels measured from the Porter 2s and Bongo 3s with a significance level of 0.05. The analysis was performed using SAS JMP Pro 16 software (SAS Enterprises, Raleigh, NC, USA).
Understanding the distribution characteristics of measured vibration data is also important for proper lab-based simulation tests. Thus, the kurtosis (K) and skewness (S) of probability density functions (confidence interval of 95%) were also computed using Minitab v. 21 (Minitab, LLC, State College, PA, USA). Kurtosis explains the degree of peakedness, and skewness describes the degree of symmetry of measured data distribution compared to the Gaussian distribution. Kurtosis and skewness can be calculated using Equations (2) and (3), respectively, as follows:
where is the mean and is the standard deviation.
3. Results and Discussion
Table 2 displays the overall Grms values, the statistical distribution measurements of the 10 shipments measured in this study, and measurements of common parcel delivery vehicles in the U.S. and Hungary as reported in previous studies [27,29]. This study first investigated whether the two vehicle models had any significant differences in the overall Grms values for vertical vibration. The mean Grms values of vertical vibration for Porter 2 and Bongo 3 were 0.104 (SD = 0.019) and 0.114 (SD = 0.017), respectively. An independent t-test result comparing the overall Grms of the two vehicle models showed that there were no statistically significant differences between the two models (t(7.9) = −0.86, p > 0.42, Bayes factor = 0.616). It was also clear that the overall Grms values for vertical vibration for the three types of delivery vehicles used in the U.S. and the delivery van in Hungary were significantly higher compared to all shipments measured in Korea. The values of the overall vertical Grms for the Korean last-mile parcel delivery environment were as much as 2.5 times higher than longitudinal and lateral directional vibrations. This confirms multiple historical studies’ findings that protective packaging needs to be designed and tested based on vertical vibration levels to resist product damage during transport; vertical vibration is the orientation that transmits the most considerable vibration levels [16,39,41,42]. These findings suggest that establishing a new vibration test profile for Korea in terms of vertical orientation is recommended to better optimize their packaging, but it does not require differentiating between the two most common last-mile delivery vehicle models when establishing the test profile.
Table 2.
Overall Grms values for vertical vibration of last-mile delivery vehicles in Korea, the USA, and Hungary.
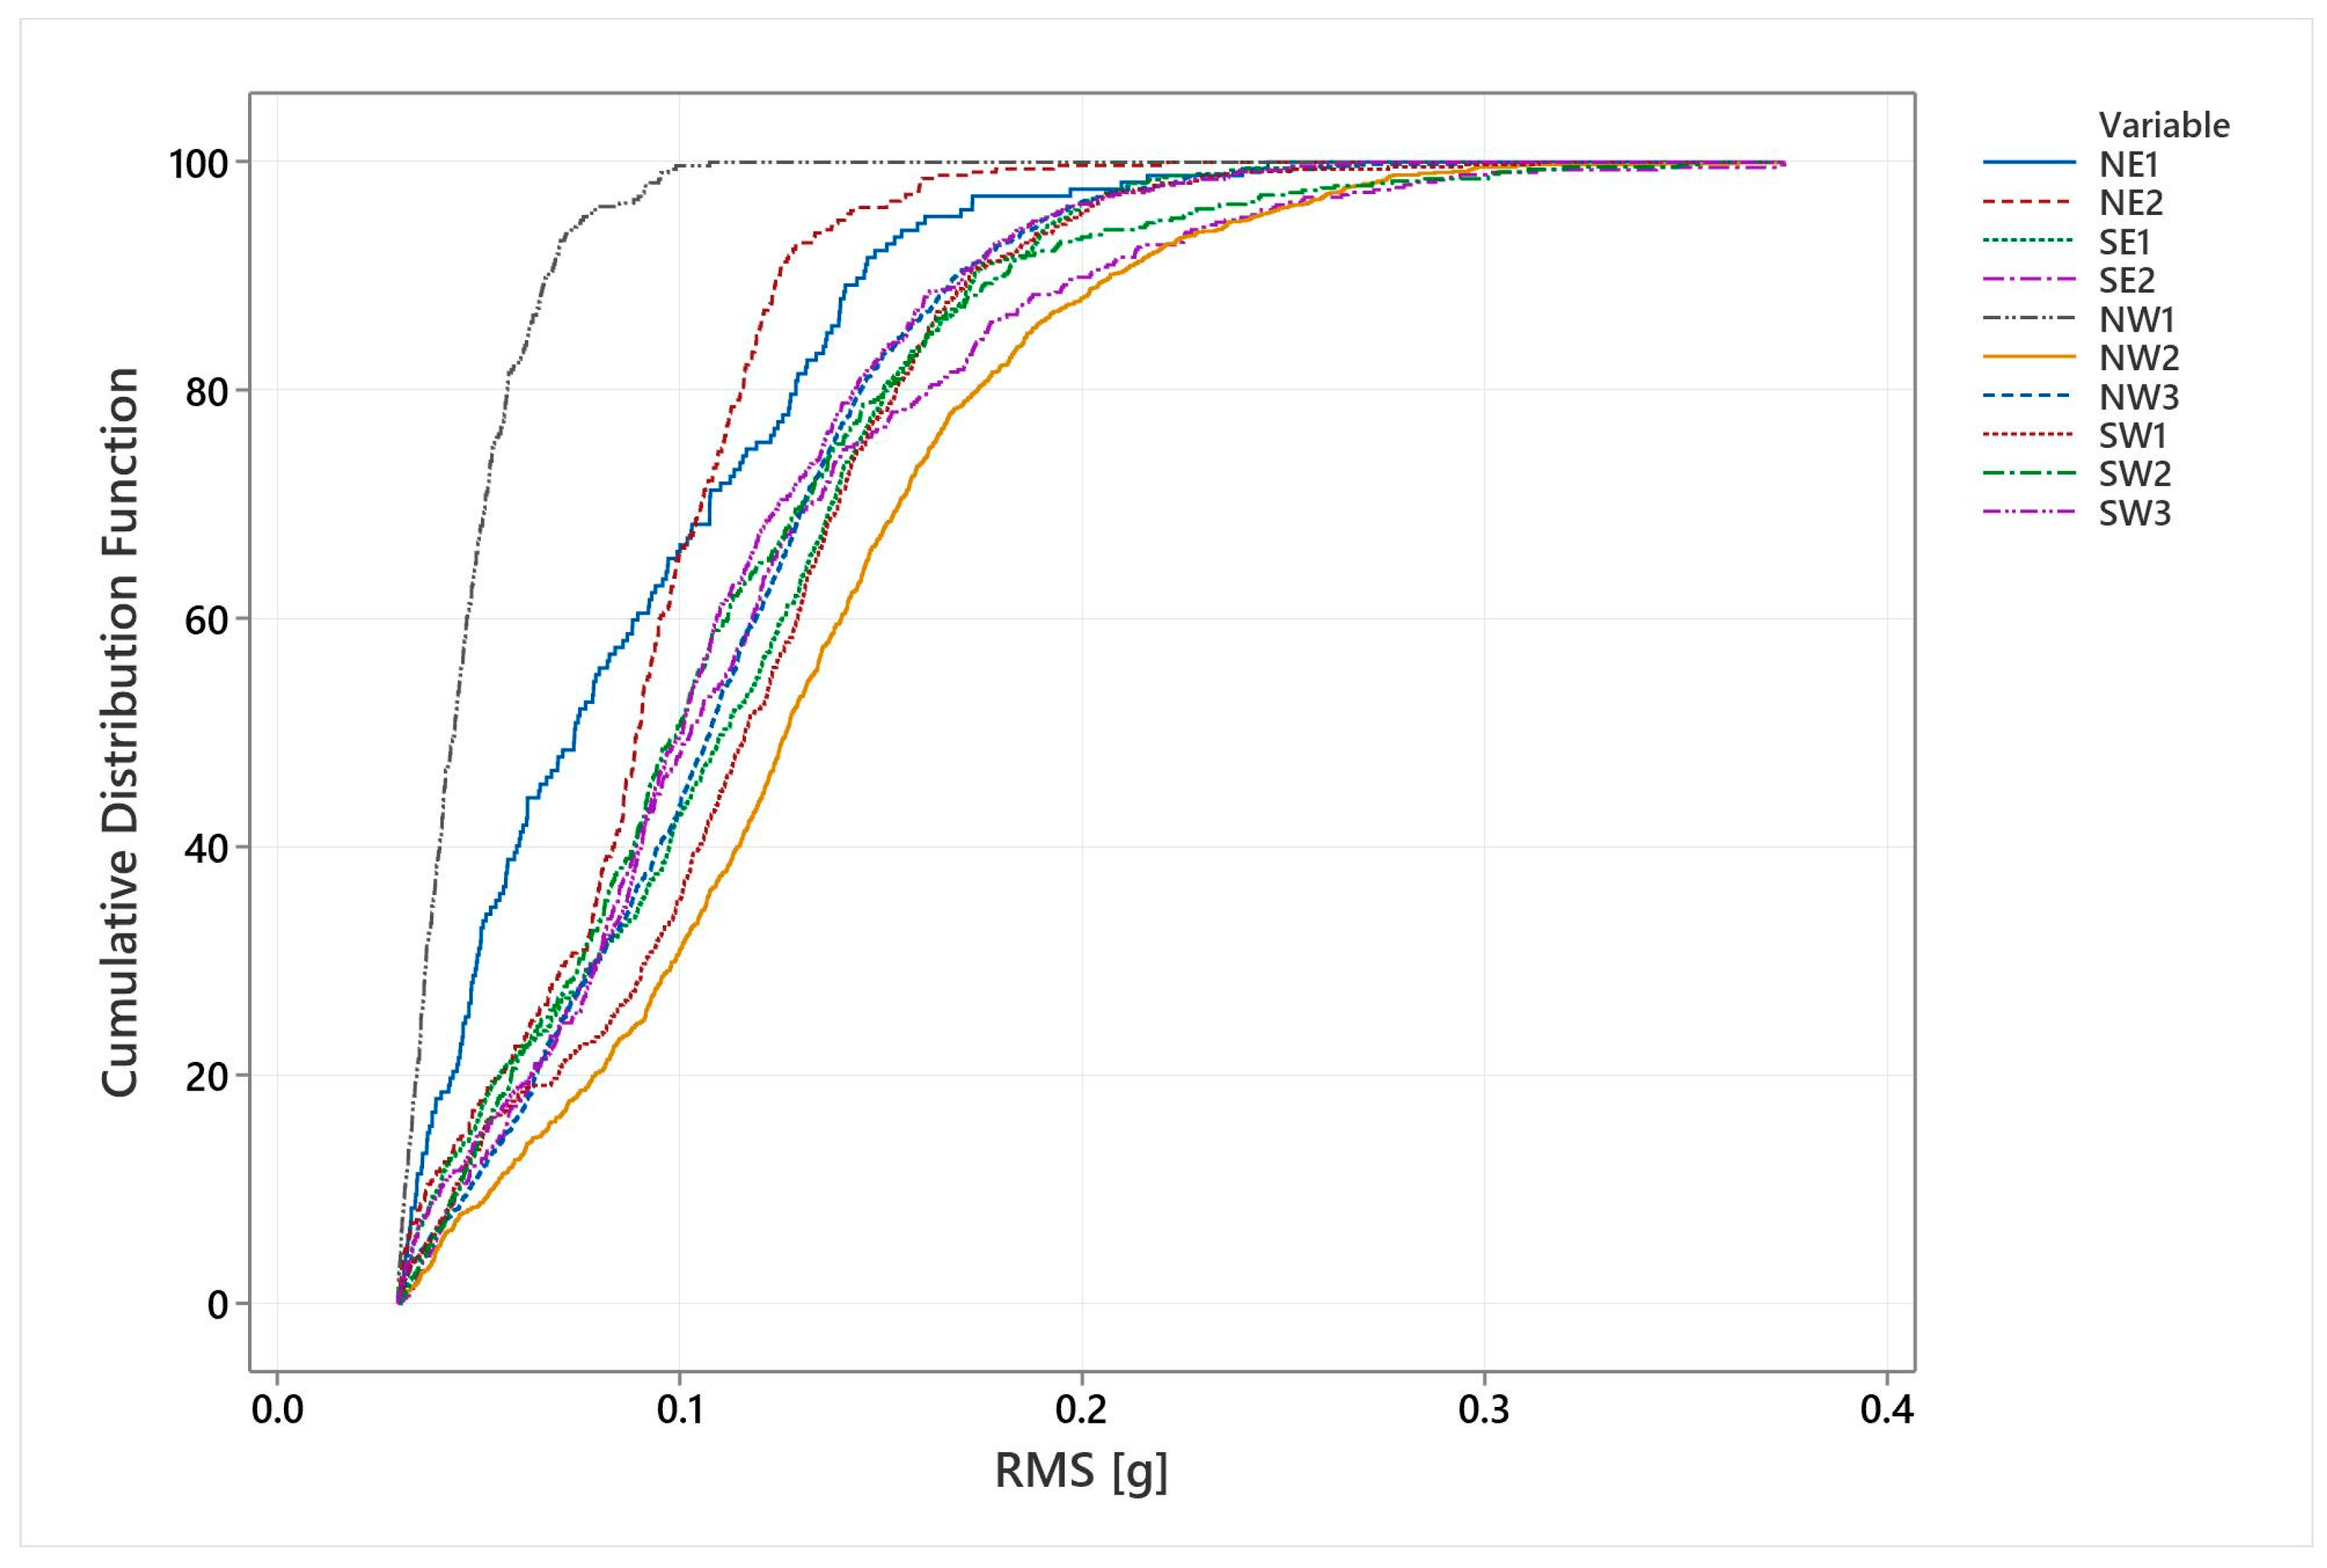
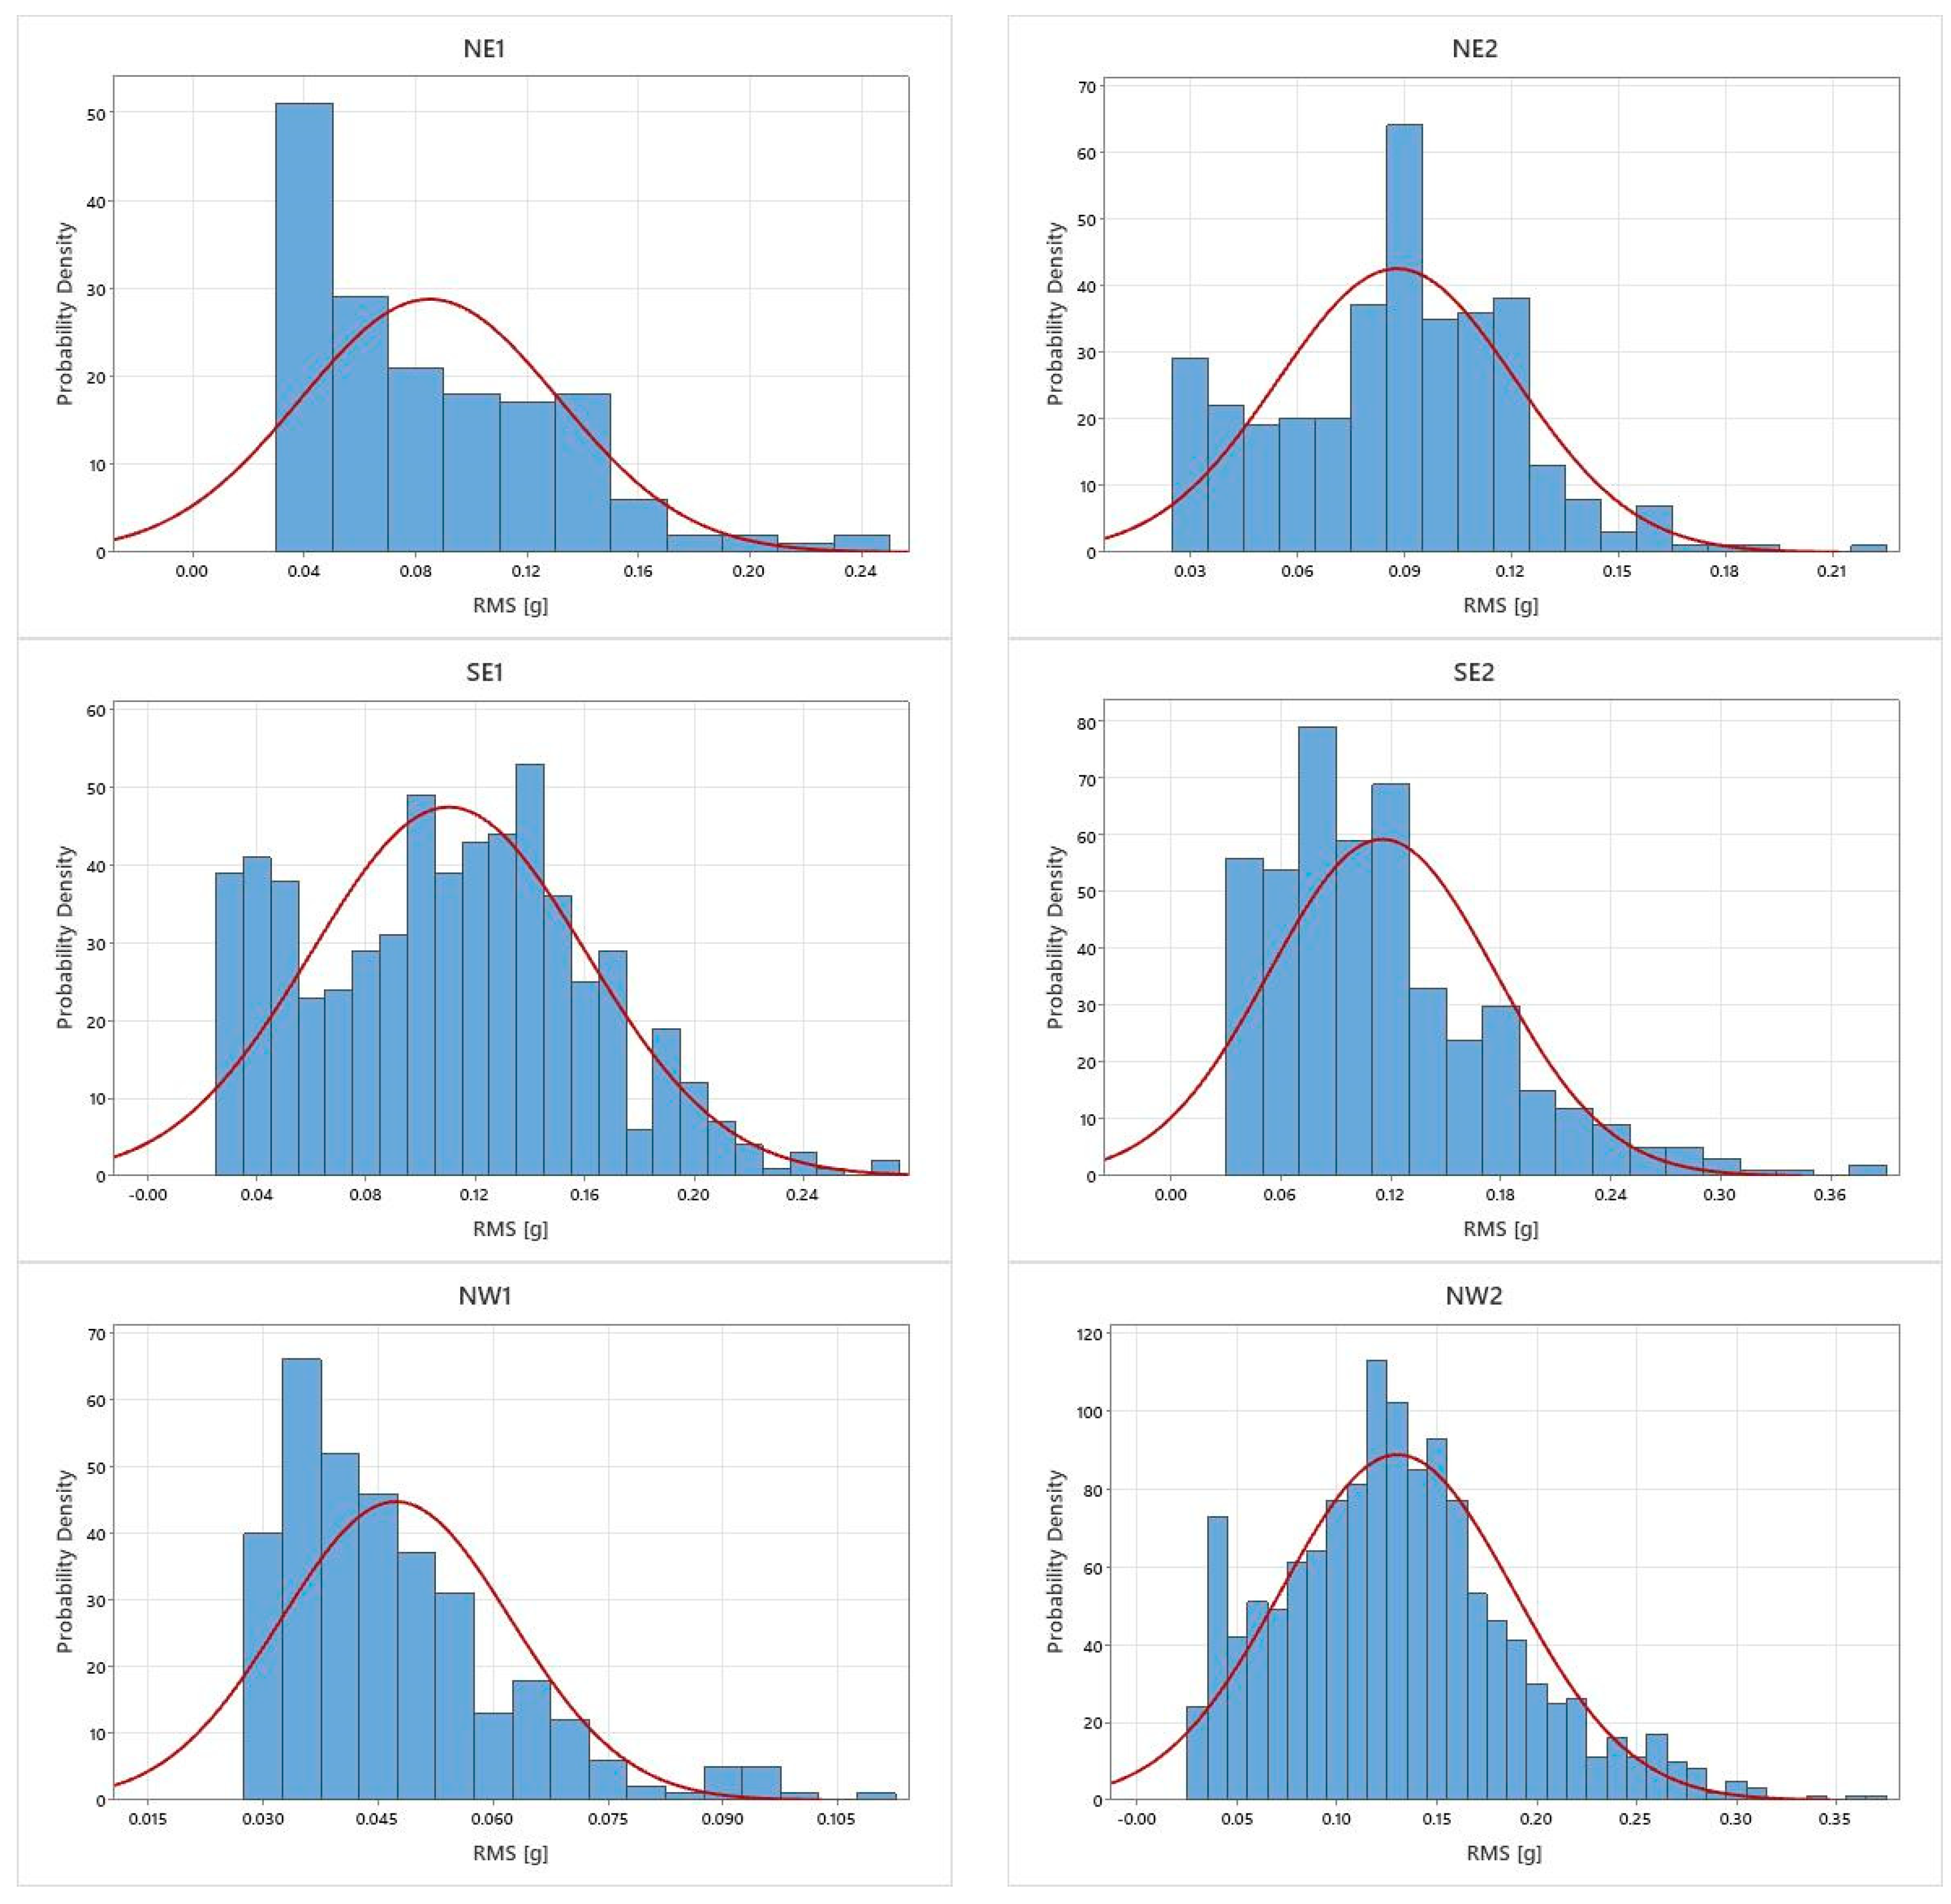
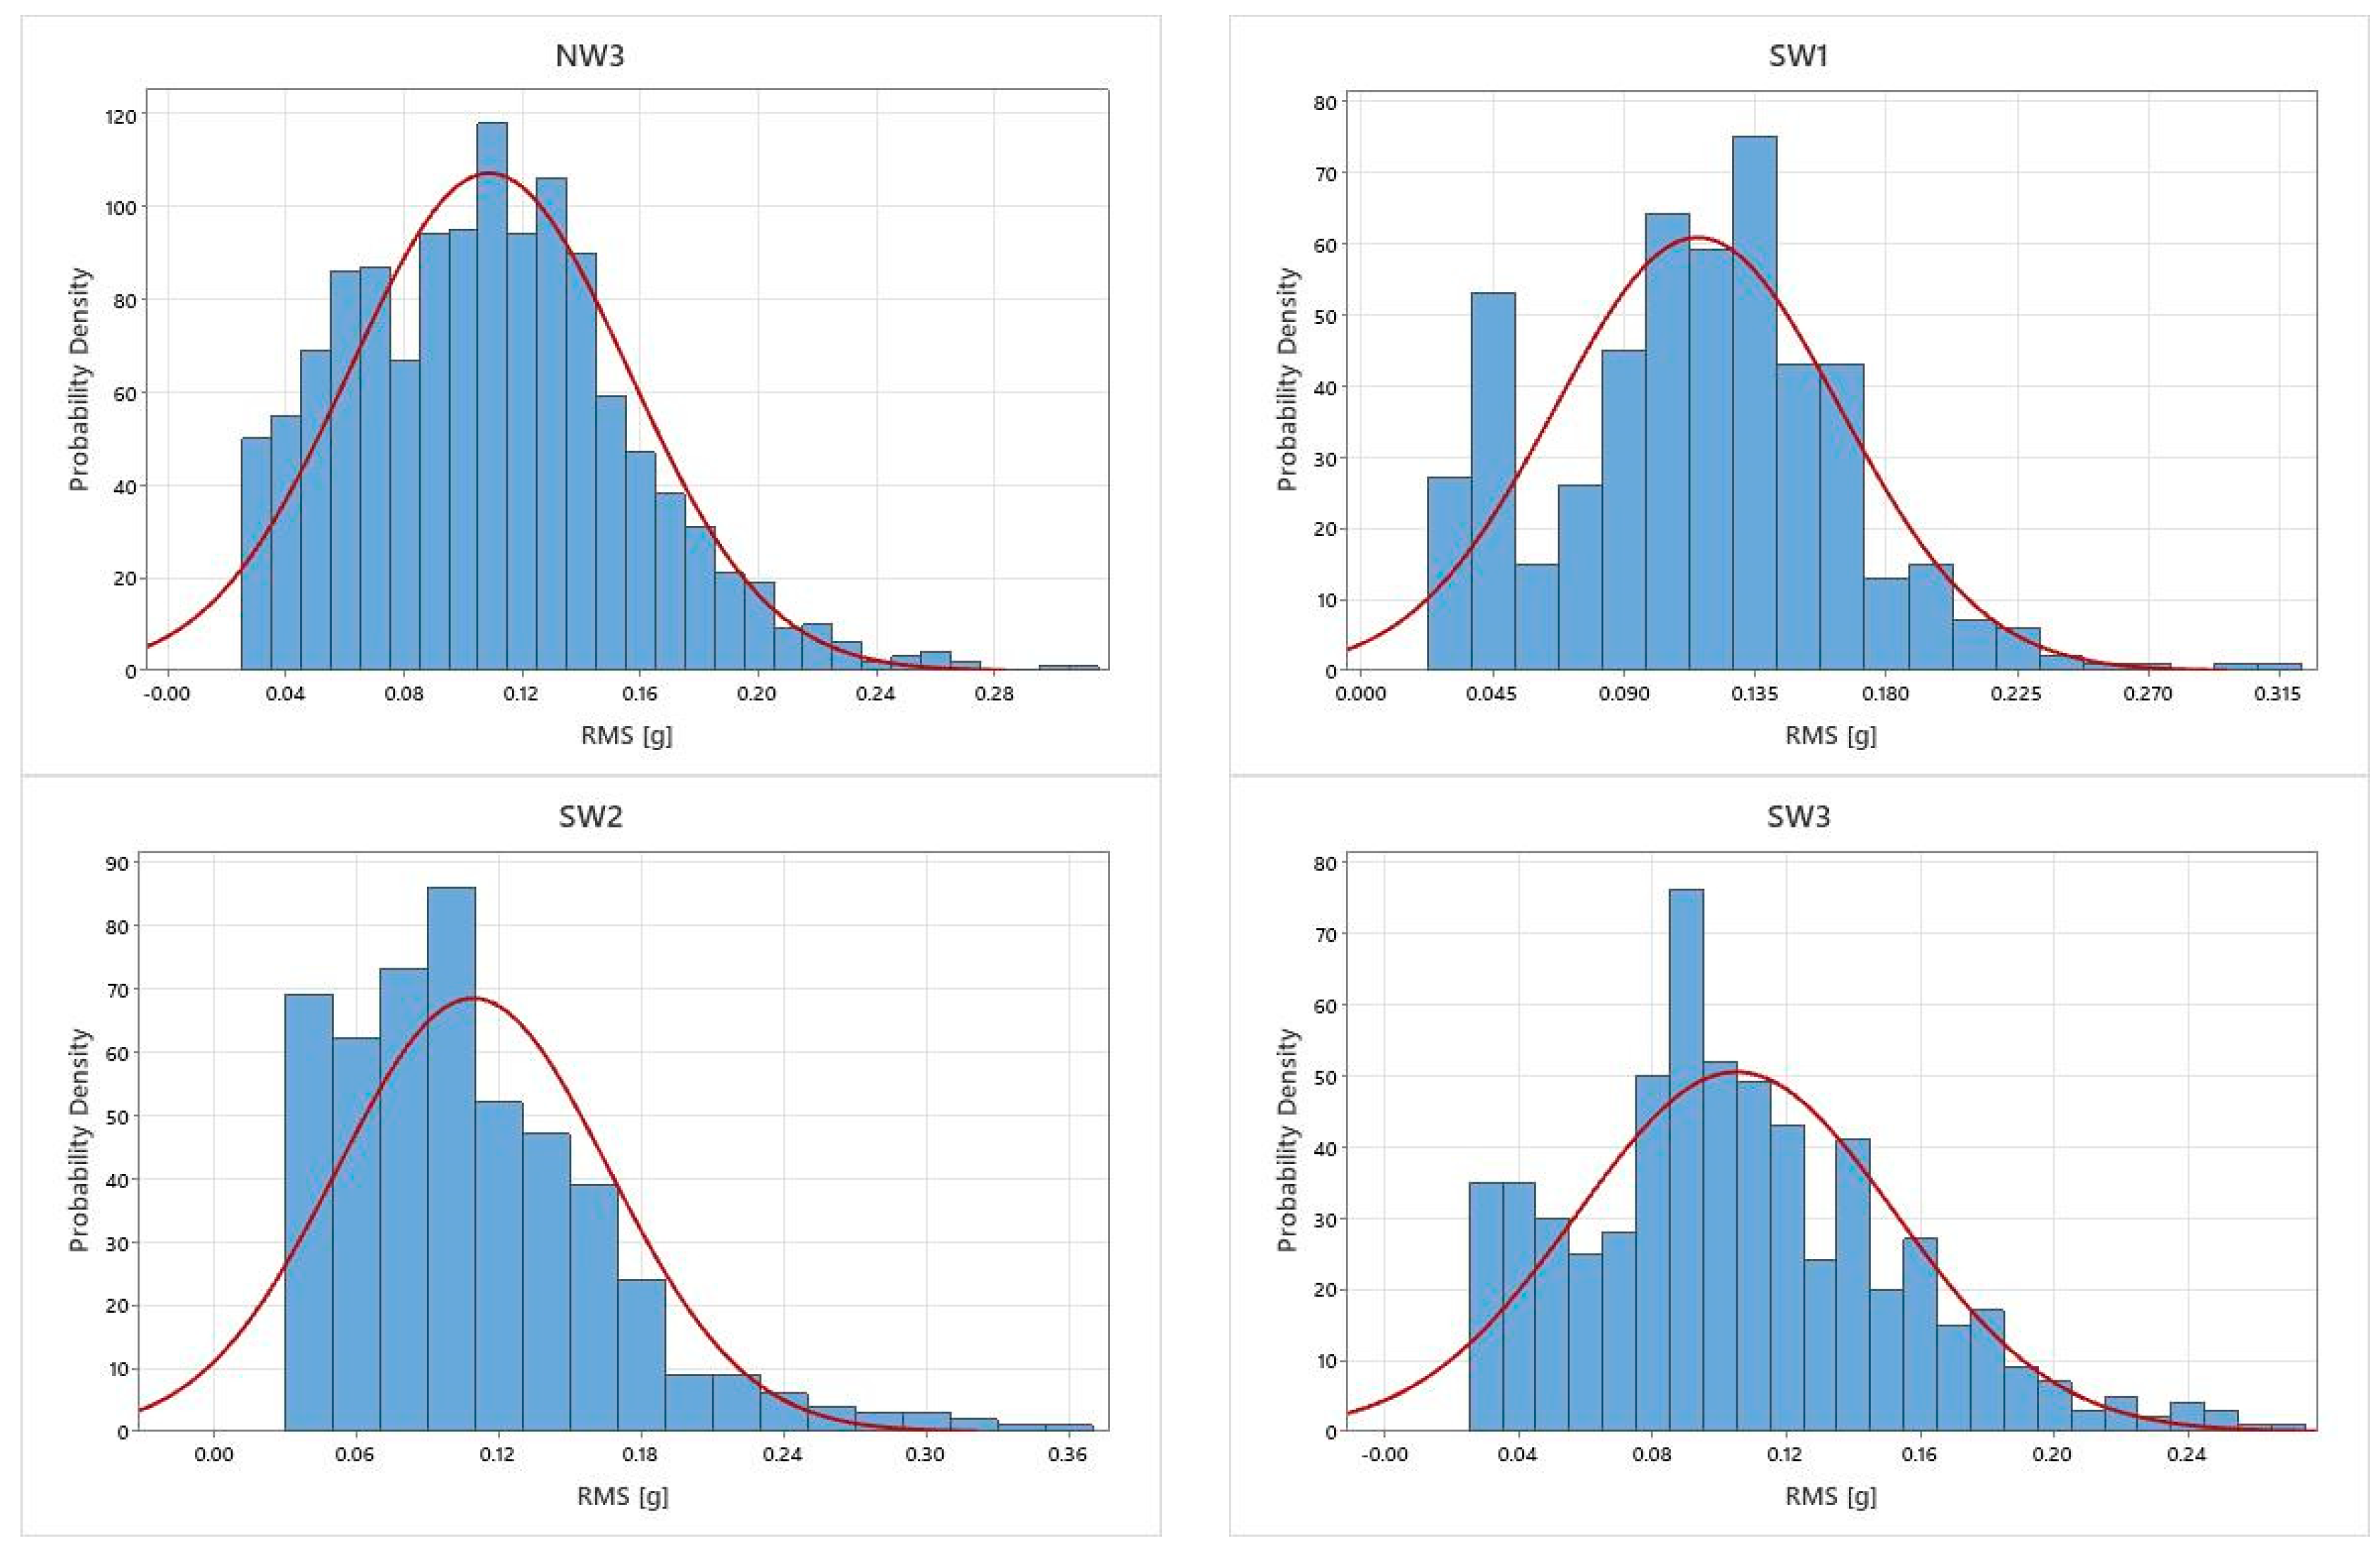
Figure 2 presents the cumulative distribution functions (CDFs) for the rms of measured vertical vibration events. The CDFs shown in Figure 3 provide the probability of event occurrence at a given the rms level. They show that 95% of the rms levels of vertical vibration events from all measured vehicles were below 0.25. The kurtosis (K) and skewness (S) of PDFs shown in Figure 4 are reported in Table 2. Kurtosis indicates how heavy or light the tail of the distribution is compared to normal distribution. The kurtosis of the normal distribution is 0, the heavy-tailed distribution has positive kurtosis, and the light-tailed distribution has negative kurtosis. The data showed positive kurtosis in most cases, except the SE1 route, which had negative kurtosis. These results show that the rms of recorded vertical vibration events do not follow the normal distribution. Skewness provides information on whether the data distribution is symmetrical. The normal distribution has a skewness value of 0, the right-skewed distribution has a positive skewness value, and the left-skewed distribution has a negative skewness value. The skewness value of data in this study ranged between 0.22 and 1.36, indicating that all measurements had right skewed rms data distribution. Most of the routes had moderately (>0.5) or highly skewed distributions (>1.0). The probability density functions (PDFs) with normal distributions for the individual routes are presented in Figure 3. This confirms that the rms of recorded vertical vibration events do not follow the normal distribution, and vehicle vibration is usually not uniformly excited due to irregular road conditions in the field [27].
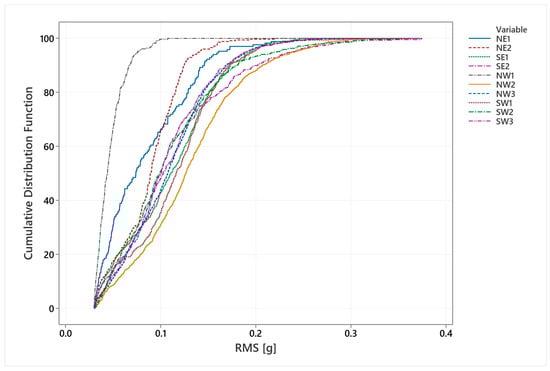
Figure 2.
Cumulative distribution function on the RMS acceleration of investigated routes in vertical orientation.
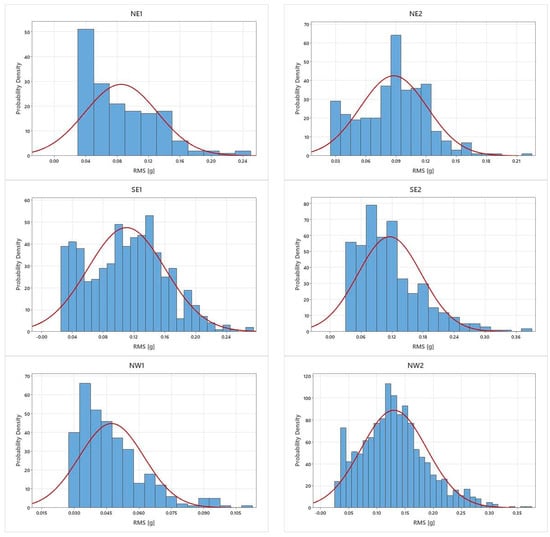

Figure 3.
RMS distribution of investigated routes in the vertical orientation.
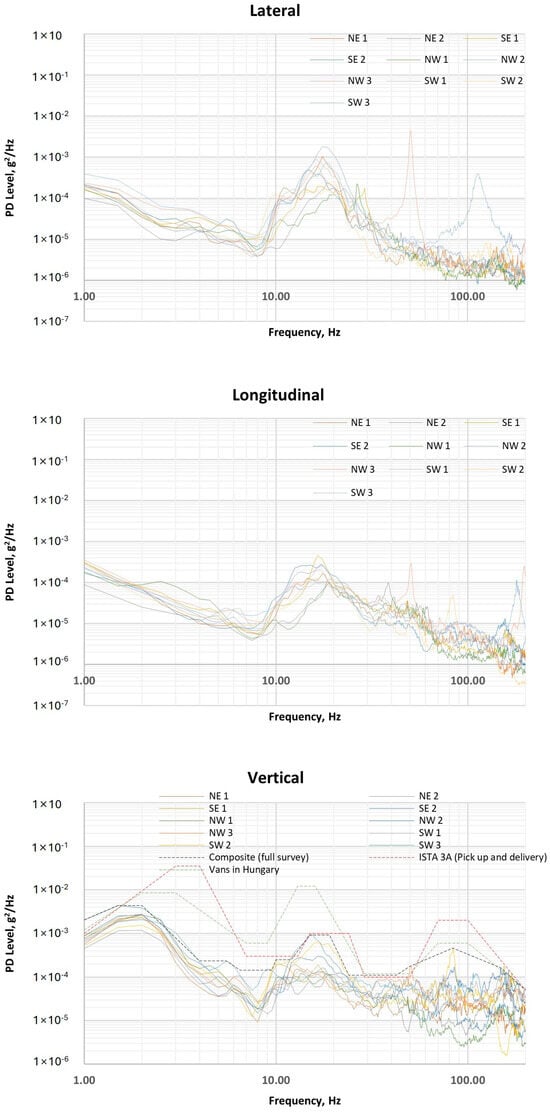
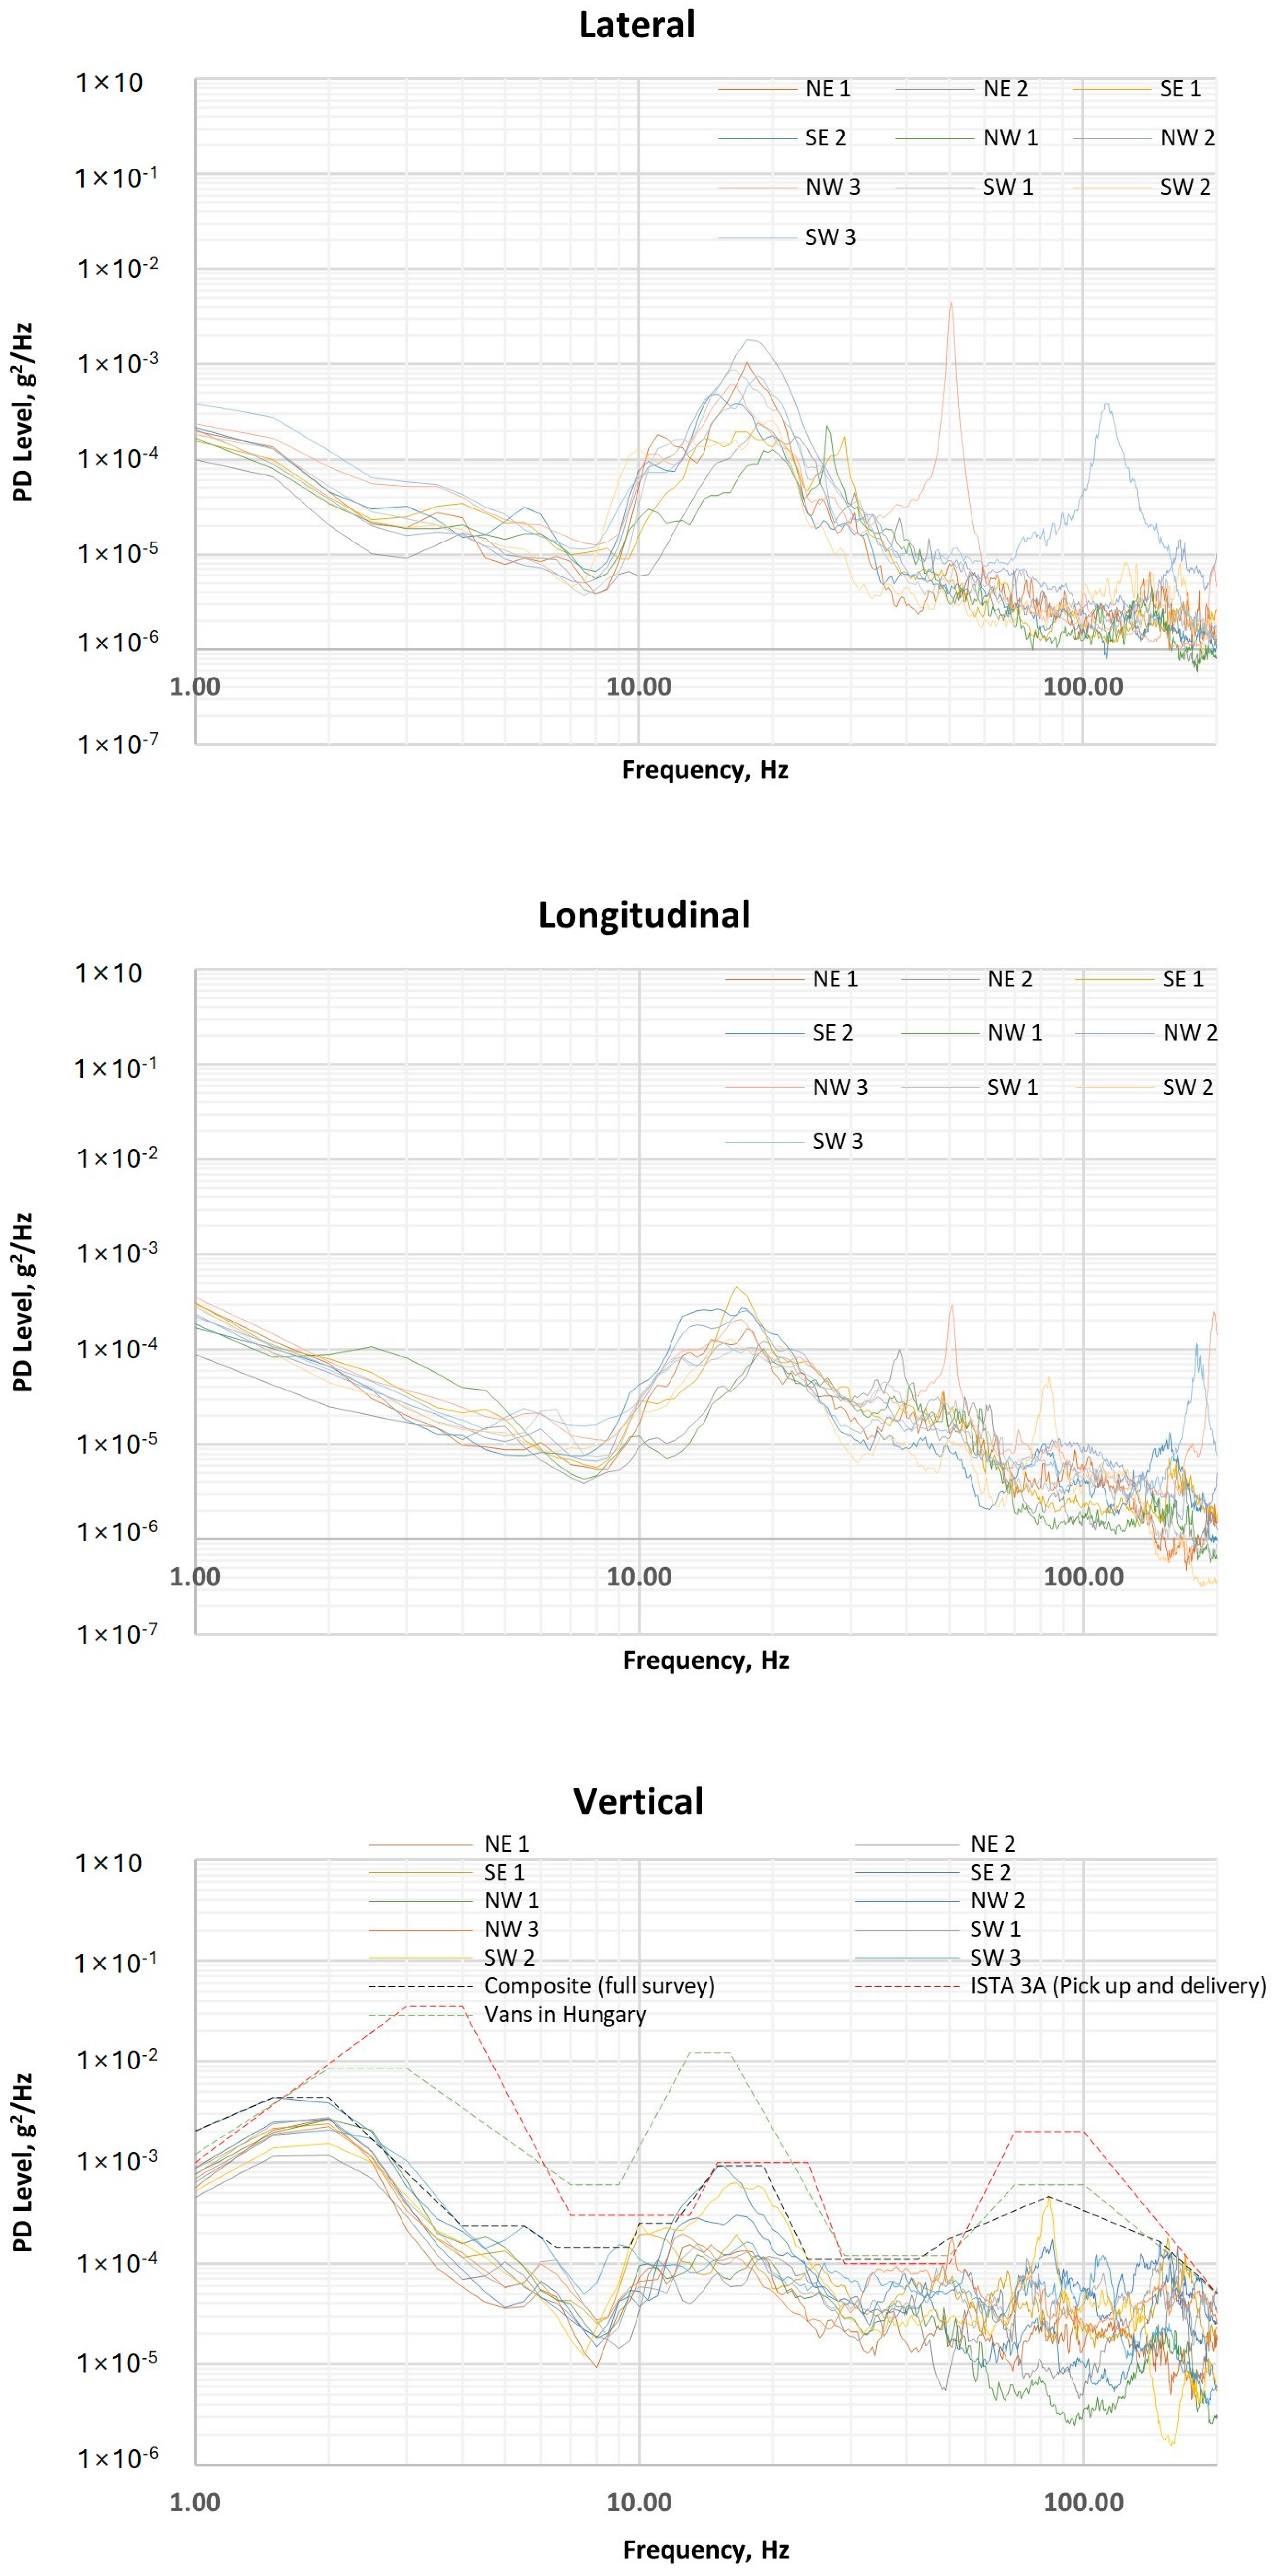
Figure 4.
PSD plots of 10 different small trucks for the lateral, longitudinal, and vertical orientations, recommended composite test spectrum for vertical small truck vibration, and ISTA 3A pickup and delivery vertical vibration test spectrum.
However, it is important to consider not only the overall Grms level and data distribution but also the shape of a vibration test spectrum when designing packages to prevent the damages that can occur from vibration. This is because different peak intensities at different forcing frequencies can magnify the vibrations experienced by the product differently in response to its natural frequency, even with the same overall Grms spectrum value. Therefore, the data collected from 10 different small trucks were analyzed to determine PD levels of vibration for the 10 different shipments. Figure 4 shows PSD plots of triaxial vibration for the 10 shipments, the recommended vertical vibration test spectrum for last-mile delivery using the small trucks in Korea, and the ISTA 3A standard [2] vertical vibration test spectrum for pickup and delivery (same as ASTM D7386-16 [3]).
A composite (full survey) PSD spectrum (the recommended test spectrum) was developed by smoothing the original small truck spectra using 17 breakpoints. The breakpoints and PD levels of the composite (full survey) spectrum were created by selecting the highest PD levels of vertical vibration data points coming from all 10 shipments between 1 Hz and 200 Hz. These breakpoints were used to ease the input process of the test profile to the testing equipment; testing equipment is usually incapable of following the sharp peaks shown in the original PSD spectrum. Recommended breakpoints in the composite (full survey) spectrum are listed in Table 3.
Table 3.
Recommended composite spectrum for small truck vibration in Korea.
The recommended test spectrum developed in this study shows that the vertical vibration levels are consistently lower, in the 1 to 200 Hz frequency range, than those recommended by ISTA 3A [2] and the previous study conducted in Hungary [27]. It was also observed that the peak intensities of the recommended spectrum reside in different frequencies than ISTA 3A [2]. The highest PD levels in the ISTA 3A vibration test profile were located between 3 to 4 Hz and 15 to 24 Hz, whereas intensive ranges in Korea were between 1.5 to 2 Hz and 15 to 19 Hz. This finding encourages Korean packaging engineers to avoid designing protective packaging that has cushioning systems with natural frequencies that overlap the intensive peak frequency range unique to the last-mile delivery environment in Korea rather than aiming to avoid the peak intensity frequency ranges recommended by international standards. Another observation from this study was that lateral and longitudinal orientations do not have intensive peaks of PD levels in the lower frequency range, between 1 and 10 Hz, whereas the vertical direction has the highest PD level peaks in that region. Lateral and longitudinal orientation also lost PD levels quicker in the higher frequency range (over 50 Hz) compared to vertical orientation, which was also observed in Hungary [27].
Table 4 shows a comparison between the overall Grms of ISTA 3A’s [2] recommended spectrum and the spectrum recommended from this study for similar bandwidths. Splitting spectra into the same bandwidths allowed for direct comparison of the two spectra. The comparison shows that the Grms values of the recommended spectrum for Korea are lower than ISTA 3A in all bandwidths; some by as much as 68%. The greatest reduction (−68%) also occurs in the 1–4 Hz region, where the highest intensity vibrations occur in the ISTA 3A profile.
Table 4.
The overall Grms differences in various bandwidths.
Results introduced previously from the overall Grms analysis and comparisons of PSD plots consistently show that vibration levels of the last-mile delivery segment in Korea are different and lower than in previously investigated countries. Traffic conditions in Seoul, Korea, could explain this. A high travel speed was discovered to be one of the main conditions that increase vehicle vibration levels from multiple historical studies [16,43]. However, delivery vehicles in Seoul, Korea, are often unable to drive at high speeds, even on highways, due to extreme traffic jams. Therefore, it can be inferred that the slow speed of vehicles plays a major role in keeping the vibration levels of delivery vehicles in Korea low.
4. Limitations of Study
- Last-mile parcel delivery vehicle vibration measurements in this study were only conducted on delivery routes that served destinations within Seoul due to the predominant parcel delivery volume (58%) in Seoul compared to other cities in Korea. Vibration levels of last-mile delivery routes outside of Seoul, especially rural areas, may be further investigated in the future for better representation of the whole country.
- Measurements in this study were limited to two major vehicle models for last-mile parcel delivery in Korea. The vehicle models investigated in this study are primarily used for parcel delivery purposes, so the vibration test profiles recommended in this study would be highly beneficial to packaging engineers in Korea. However, it is worth noting that there is a growing trend towards using different types of vehicles for parcel delivery, such as electric trucks and low-profile vehicles. This trend is growing due to the demands for sustainable delivery methods from customers and to accommodate the low height restrictions of underground parking facilities in Korea. Therefore, it may be useful to expand future research to investigate a broader range of courier vehicles.
- Numerous factors could affect the measured vibration levels in specific countries, such as road conditions, speed, and driving styles. This study provided a wide snapshot of the vibration profile of parcel delivery vehicles in Korea for the first time. Further investigation of the factors mentioned above is recommended for future studies in order to fully characterize the details of last-mile delivery vehicle vibration levels in Korea.
- It is important to note that the international test standard compared with the recommended test profile from this study has been time compressed by artificially amplifying the vibration levels without providing a time compression factor. Therefore, readers and authors can only compare the Grms values and peak intensity locations of the two profiles.
- The payload of the investigated vehicles continuously changes (is reduced) since the measurements were conducted during actual parcel delivery service.
5. Conclusions
This study concludes with the following:
- Although there are some minor differences between the structure of the two most common last-mile delivery vehicle models used in Korea, the results indicated no statistically significant difference in the vertical vibration levels between them. Therefore, a composite vibration test profile developed in this study could be used interchangeably between both vehicle models.
- The vertical vibration levels observed from the most common last-mile delivery vehicles in the U.S. and Hungary and the international test standard for pickup and delivery of parcels were both higher than the vibration levels measured on last-mile delivery vehicles in Korea; hence, the recommended vertical vibration test spectrum for Korea is lower. However, various factors, like road and driving conditions, could also affect the level of parcel delivery vehicle vibrations in different geographical regions. Therefore, further studies are needed to understand whether it is the quality of roads and driving conditions or the vehicle type itself that causes more differences in vibration levels.
- The highest intensity peak for the recommended vibration test spectrum was in a lower frequency band (1.5 to 2 Hz) than the ISTA 3A pickup and delivery vibration test spectrum (3 to 4 Hz). This result suggests that packaging engineers in Korea should avoid designing packaging systems with natural frequencies overlapping or close to the peak intensity frequency band unique to the Korean delivery environment rather than avoiding the peak intensity frequency bands indicated in the international test standard.
- The PD levels of last-mile delivery vehicles in Korea were lower than were recorded in Hungary with no time compression in the entire frequency range that was an interest of this study (1 to 200 Hz).
- A simplified, recommended vertical vibration test profile for last-mile delivery in Korea could help packaging engineers in Korea test their packages in the laboratory before shipping them without processing the large datasets that are provided in ready-to-use form in this study.
Author Contributions
Conceptualization, S.K. and L.H.; data curation, S.K.; formal analysis, S.K.; funding acquisition, L.H.; investigation, S.K.; methodology, S.K. and L.H.; project administration, L.H.; resources, L.H., S.L. (Soohyung Lee) and S.L. (Sangwook Lee); software, S.K.; supervision, L.H.; validation, S.K. and L.H.; visualization, S.K.; writing—original draft, S.K.; writing—review and editing, L.H., S.L. (Soohyung Lee) and S.L. (Sangwook Lee). All authors have read and agreed to the published version of the manuscript.
Funding
This research was funded by CJ CheilJedang.
Institutional Review Board Statement
Not applicable.
Informed Consent Statement
Not applicable.
Data Availability Statement
Restrictions apply to the availability of these data. Data were obtained from CJ CheilJedang and are available from the authors with the permission of CJ CheilJedang.
Acknowledgments
The authors acknowledge access to facilities and vehicles provided by CJ Logistics.
Conflicts of Interest
The authors declare that they have no known competing financial interests or personal relationships that could have appeared to influence the work reported in this paper. Author Soohyung Lee is employee of CJ Logistics, Author Sangwook Lee is employee of CJ CheilJedang, who provided funding/technical support for the work. The funder had no role in the design of the study; in the collection, analysis, or interpretation of data, in the writing of the manuscript, or in the decision to publish the results.
References
- Janjevic, M.; Winkenbach, M.; Merchán, D. Integrating Collection-and-Delivery Points in the Strategic Design of Urban Last-Mile e-Commerce Distribution Networks. Transp. Res. E Logist. Transp. Rev. 2019, 131, 37–67. [Google Scholar] [CrossRef]
- ISTA 3A; Packaged-Products for Parcel Delivery System Shipment 70 Kg (150 Lb) or Less. International Safe Transit Association (ISTA): Chicago, IL, USA, 2018.
- ASTM D7386-16; Standard Practice for Performance Testing of Packages for Single Parcel Delivery Systems. ASTM International: West Conshohocken, PA, USA, 2016.
- Russell, P.; Kipp, W.I. European Express Shipping Drop/Impact Study. In Proceedings of the IAPRI Symposium in Windsor, Windsor, UK, 3–5 September 2007. [Google Scholar]
- Zhong, C.; Li, J.; Kawaguchi, K.; Saito, K.; An, H. Measurement and Analysis of Shocks on Small Packages in the Express Shipping Environment of China. Packag. Technol. Sci. 2016, 29, 437–449. [Google Scholar] [CrossRef]
- Saha, K.; Singh, J.; Singh, S.P. Measurement, Analysis and Comparison of Drops Experienced by Packages in Inter-State and Intra-State Next Day Shipments in United States. J. Appl. Packag. Res. 2010, 4, 95–106. [Google Scholar]
- Singh, S.P.; Voss, T. Drop Heights Encountered in the United Parcel Service Small Parcel Environment in the USA. J. Test. Eval. 1992, 20, 382–387. [Google Scholar] [CrossRef]
- Singh, J.; Singh, S.P.; Burgess, G.; Saha, K. Measurement, Analysis, and Comparison of the Parcel Shipping Shock and Drop Environment of the United States Postal Service with Commercial Carriers. J. Test. Eval. 2007, 35, 424–428. [Google Scholar] [CrossRef]
- Suh, S.; Lim, M.; Oh, J.Y. Analysis on the Distribution Environmental Loads of the Parcel Packaging Delivered by Means of E-Commerce in Korea. Korean J. Packag. Sci. Technol. 2017, 23, 103–108. [Google Scholar] [CrossRef]
- Garcia-Romeu-Martinez, M.A.; Singh, S.P.; Cloquell-Ballester, V.A.; Saha, K. Measurement and Analysis of International Air Parcel Shipping Environment for DHL and FedEx between Europe and United States. Packag. Technol. Sci. 2007, 20, 421–429. [Google Scholar] [CrossRef]
- Singh, S.P.; Sandhu, A.P.S.; Singh, J.; Joneson, E. Measurement and Analysis of Truck and Rail Shipping Environment in India. Packag. Technol. Sci. 2007, 20, 381–392. [Google Scholar] [CrossRef]
- Lu, F.; Ishikawa, Y.; Shiina, T.; Satake, T. Analysis of Shock and Vibration in Truck Transport in Japan. Packag. Technol. Sci. 2008, 21, 479–489. [Google Scholar] [CrossRef]
- Garrido, M.; Esteban, L.; Navarro, P.; Herranz, N.; Zabaleta, F.J.; Rouillard, V. Measurement and Analysis of Truck Vibration Levels in Logistic Spain Distribution to Simulate Package Testing. Packag. Technol. Sci. 2023, 36, 585–594. [Google Scholar] [CrossRef]
- Singh, J.; Singh, S.P.; Joneson, E. Measurement and Analysis of US Truck Vibration for Leaf Spring and Air Ride Suspensions, and Development of Tests to Simulate These Conditions. Packag. Technol. Sci. 2006, 19, 309–323. [Google Scholar] [CrossRef]
- Zhou, R.; Yan, L.; Li, B.; Xie, J. Measurement of Truck Transport Vibration Levels in China as a Function of Road Conditions, Truck Speed and Load Level. Packag. Technol. Sci. 2015, 28, 949–957. [Google Scholar] [CrossRef]
- Park, J.; Choi, S.; Jung, H.M. Measurement and Analysis of Vibration Levels for Truck Transport Environment in Korea. Appl. Sci. 2020, 10, 6754. [Google Scholar] [CrossRef]
- Ge, C.; Dunno, K.; Singh, M.A.; Yuan, L.; Lu, L.X. Development of a Drone’s Vibration, Shock, and Atmospheric Profiles. Appl. Sci. 2021, 11, 5176. [Google Scholar] [CrossRef]
- Huang, Y.Y.; Horvath, L.; Böröcz, P. Measurement and Analysis of Industrial Forklifts Vibration Levels for Unit Load Testing Purposes. Appl. Sci. 2021, 11, 2901. [Google Scholar] [CrossRef]
- Böröcz, P. Vibration and Acceleration Levels of Multimodal Container Shipping Physical Environment. Packag. Technol. Sci. 2019, 32, 269–277. [Google Scholar] [CrossRef]
- Singh, J.; Singh, P.; Saha, K. Evaluation of Vibration Profiles for ULD Dollies at Air-Cargo Sorting Hubs. J. Appl. Packag. Res. 2015, 7, 15–26. [Google Scholar] [CrossRef]
- Dunno, K.; Batt, G. Analysis of In-Flight Vibration of a Twin-Engine Turbo Propeller Aircraft. Packag. Technol. Sci. 2009, 22, 479–485. [Google Scholar] [CrossRef]
- Diao, J.; Huang, Q.; Pan, Y.; Zhang, C. Static and Random Vibration Analysis of an Air Freight Package. In Proceedings of the IOP Conference Series: Earth and Environmental Science; IOP Publishing Ltd.: Bristol, UK, 2021; Volume 769. [Google Scholar]
- Khodaei, M.; Seiiedlou, S.; Sadeghi, M. The Evaluation of Vibration Damage in Fresh Apricots during Simulated Transport. Res. Agric. Eng. 2019, 65, 112–122. [Google Scholar] [CrossRef]
- Fernando, I.; Fei, J.; Stanley, R. Measurement and Analysis of Vibration and Mechanical Damage to Bananas during Long-Distance 1 Interstate Transport by Multi-Trailer Road Trains 2. Postharvest Biol. Technol. 2019, 158, 110977. [Google Scholar] [CrossRef]
- Paternoster, A.; Vanlanduit, S.; Springael, J.; Braet, J. Measurement and Analysis of Vibration and Shock Levels for Truck Transport in Belgium with Respect to Packaged Beer during Transit. Food Packag. Shelf Life 2018, 15, 134–143. [Google Scholar] [CrossRef]
- Rouillard, V.; Sek, M. Creating Transport Vibration Simulation Profiles from Vehicle and Road Characteristics. Packag. Technol. Sci. 2013, 26, 82–95. [Google Scholar] [CrossRef]
- Böröcz, P.; Singh, S.P. Measurement and Analysis of Delivery van Vibration Levels to Simulate Package Testing for Parcel Delivery in Hungary. Packag. Technol. Sci. 2018, 31, 342–352. [Google Scholar] [CrossRef]
- Dunno, K.; Chavan, P. Measurement and Analysis of Crowdsourced Vehicle Vibration Levels during Last Mile Delivery Segments for Parcel Shipments. Vibration 2022, 5, 792–802. [Google Scholar] [CrossRef]
- Chonhenchob, V.; Singh, S.P.; Singh, J.J.; Stallings, J.; Grewal, G. Measurement and Analysis of Vehicle Vibration for Delivering Packages in Small-Sized and Medium-Sized Trucks and Automobiles. Packag. Technol. Sci. 2012, 25, 31–38. [Google Scholar] [CrossRef]
- Zhou, H.; Wang, Z.W. Measurement and Analysis of Vibration Levels for Express Logistics Transportation in South China. Packag. Technol. Sci. 2018, 31, 665–678. [Google Scholar] [CrossRef]
- Kurniawan, M.P.; Chonhenchob, V.; Singh, S.P.; Sittipod, S. Measurement and Analysis of Vibration Levels in Two and Three Wheel Delivery Vehicles in Southeast Asia. Packag. Technol. Sci. 2015, 28, 836–850. [Google Scholar] [CrossRef]
- Sampaio, A.; Savelsbergh, M.; Veelenturf, L.P.; Van Woensel, T. Delivery Systems with Crowd-Sourced Drivers: A Pickup and Delivery Problem with Transfers. Networks 2020, 76, 232–255. [Google Scholar] [CrossRef]
- Le, T.V.; Ukkusuri, S.V. Crowd-Shipping Services for Last Mile Delivery: Analysis from American Survey Data. Transp. Res. Interdiscip. Perspect. 2019, 1, 100008. [Google Scholar] [CrossRef]
- Korea Trade-Investment Promotion Agency. Rising E-Commerce Market. Available online: https://www.investkorea.org/ik-en/cntnts/i-306/web.do (accessed on 18 April 2023).
- Statistics Korea. Online Shopping Trends and the First Quarter Trends in Online International Direct Sales and Purchases (March, 2023). Available online: https://kostat.go.kr/board.es?mid=a10301120100&bid=241&act=view&list_no=425125&tag=&nPage=1&ref_bid=240,241&keyField=T&keyWord= (accessed on 3 September 2023).
- National Logistics Information Center. Annual Performance of Living Logistics. Available online: https://www.nlic.go.kr/nlic/parcelServiceLogistics.action (accessed on 18 April 2023).
- Barlow, C.Y.; Morgan, D.C. Polymer Film Packaging for Food: An Environmental Assessment. Resour. Conserv. Recycl. 2013, 78, 74–80. [Google Scholar] [CrossRef]
- Korea Post. Parcel Delivery Volume by Geographical Region. Available online: https://www.data.go.kr/data/15040740/fileData.do (accessed on 12 April 2023).
- Böröcz, P.; Singh, S.P. Measurement and Analysis of Vibration Levels in Rail Transport in Central Europe. Packag. Technol. Sci. 2017, 30, 361–371. [Google Scholar] [CrossRef]
- Böröcz, P.; Singh, P.; Singh, J. Evaluation of Distribution Environment Evaluation of Distribution Environment in LTL Shipment between Central Europe & South Africa. J. Appl. Packag. Res. 2015, 7, 3. [Google Scholar]
- Böröcz, P. Vibration Levels of Stacked Automotive Engine Rack in Truck Shipments as a Function of Vehicle Speed and Road Condition. J. Test. Eval. 2020, 49, 613–628. [Google Scholar] [CrossRef]
- Rouillard, V. Quantifying the Non-Stationarity of Vehicle Vibrations with the Run Test. Packag. Technol. Sci. 2014, 27, 203–219. [Google Scholar] [CrossRef]
- Garcia-Romeu-Martinez, M.A.; Paul Singh, S.; Cloquell-Ballester, V.A. Measurement and Analysis of Vibration Levels for Truck Transport in Spain as a Function of Payload, Suspension and Speed. Packag. Technol. Sci. 2008, 21, 439–451. [Google Scholar] [CrossRef]

Disclaimer/Publisher’s Note: The statements, opinions and data contained in all publications are solely those of the individual author(s) and contributor(s) and not of MDPI and/or the editor(s). MDPI and/or the editor(s) disclaim responsibility for any injury to people or property resulting from any ideas, methods, instructions or products referred to in the content. |
© 2024 by the authors. Licensee MDPI, Basel, Switzerland. This article is an open access article distributed under the terms and conditions of the Creative Commons Attribution (CC BY) license (https://creativecommons.org/licenses/by/4.0/).