4.1. UV Detection Image Processing
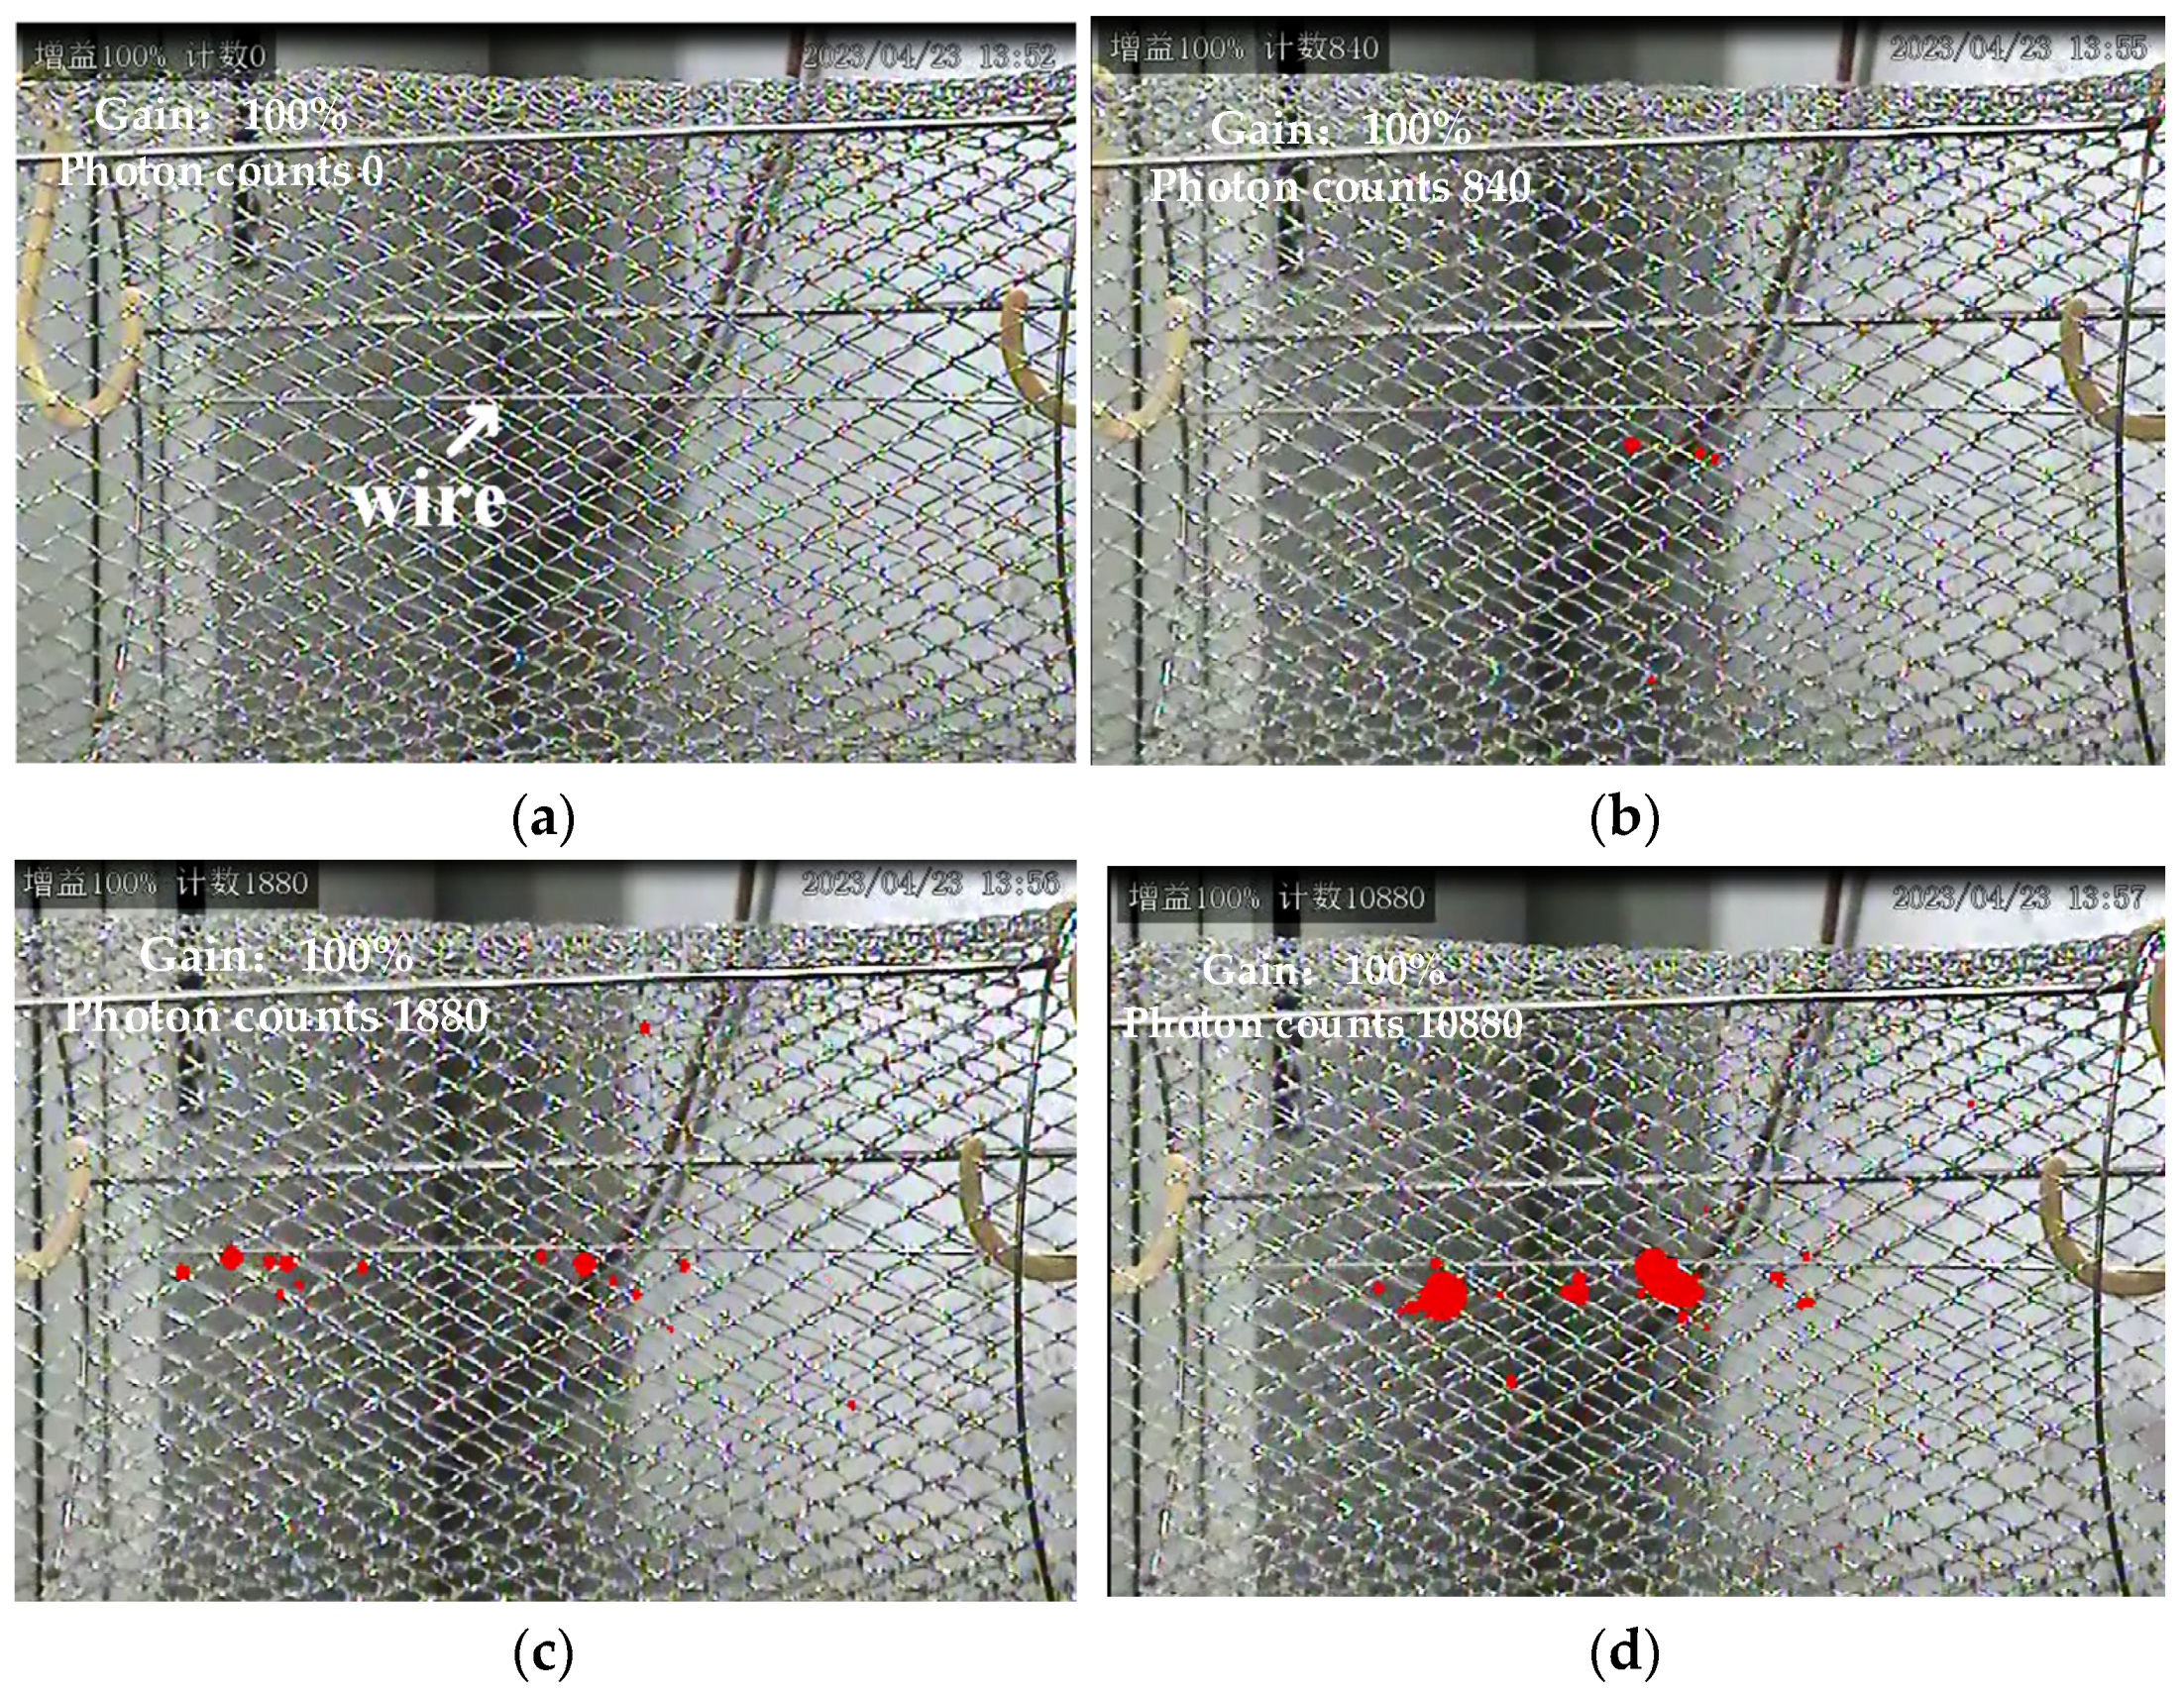
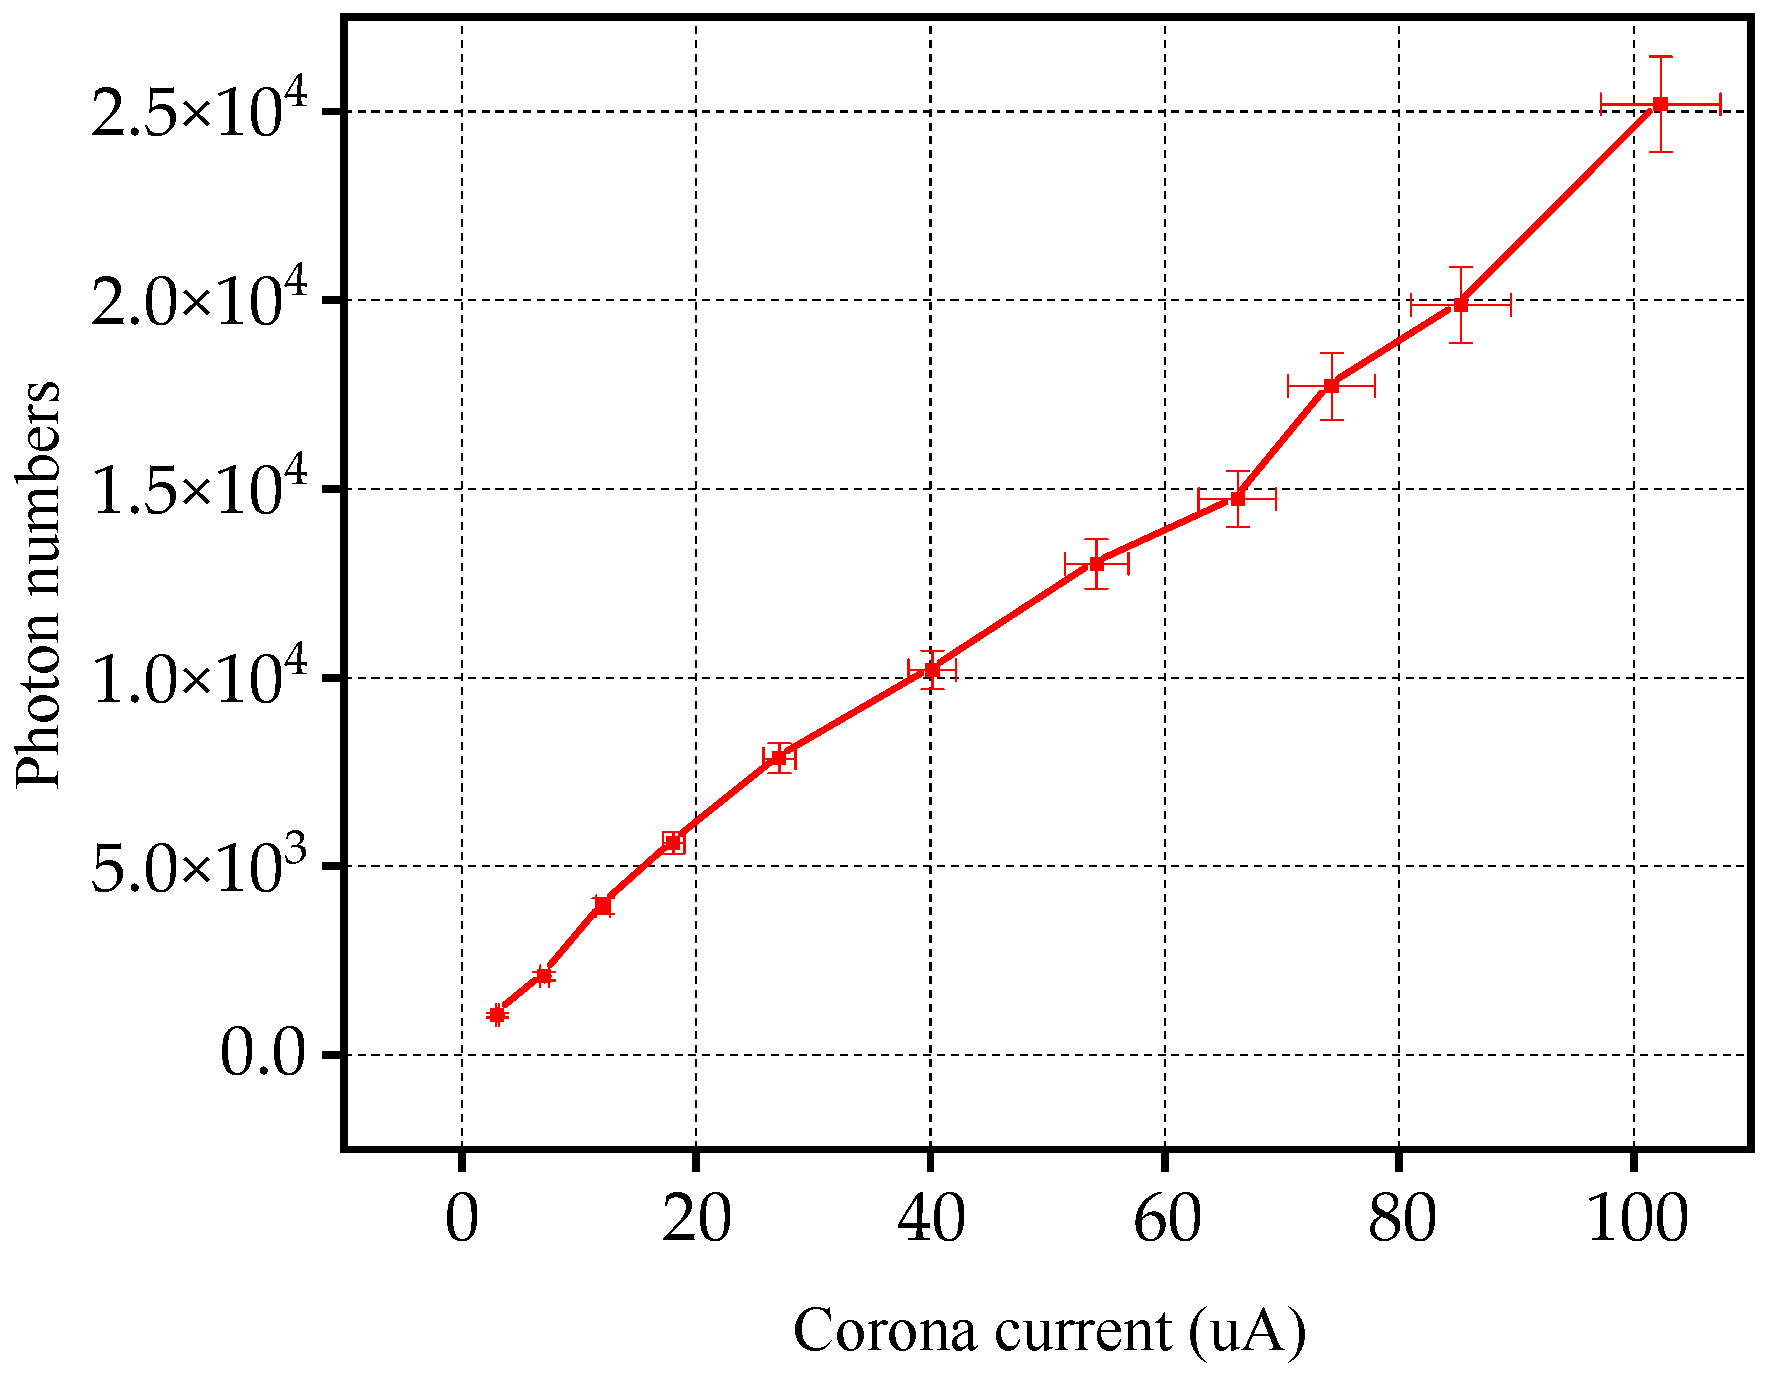
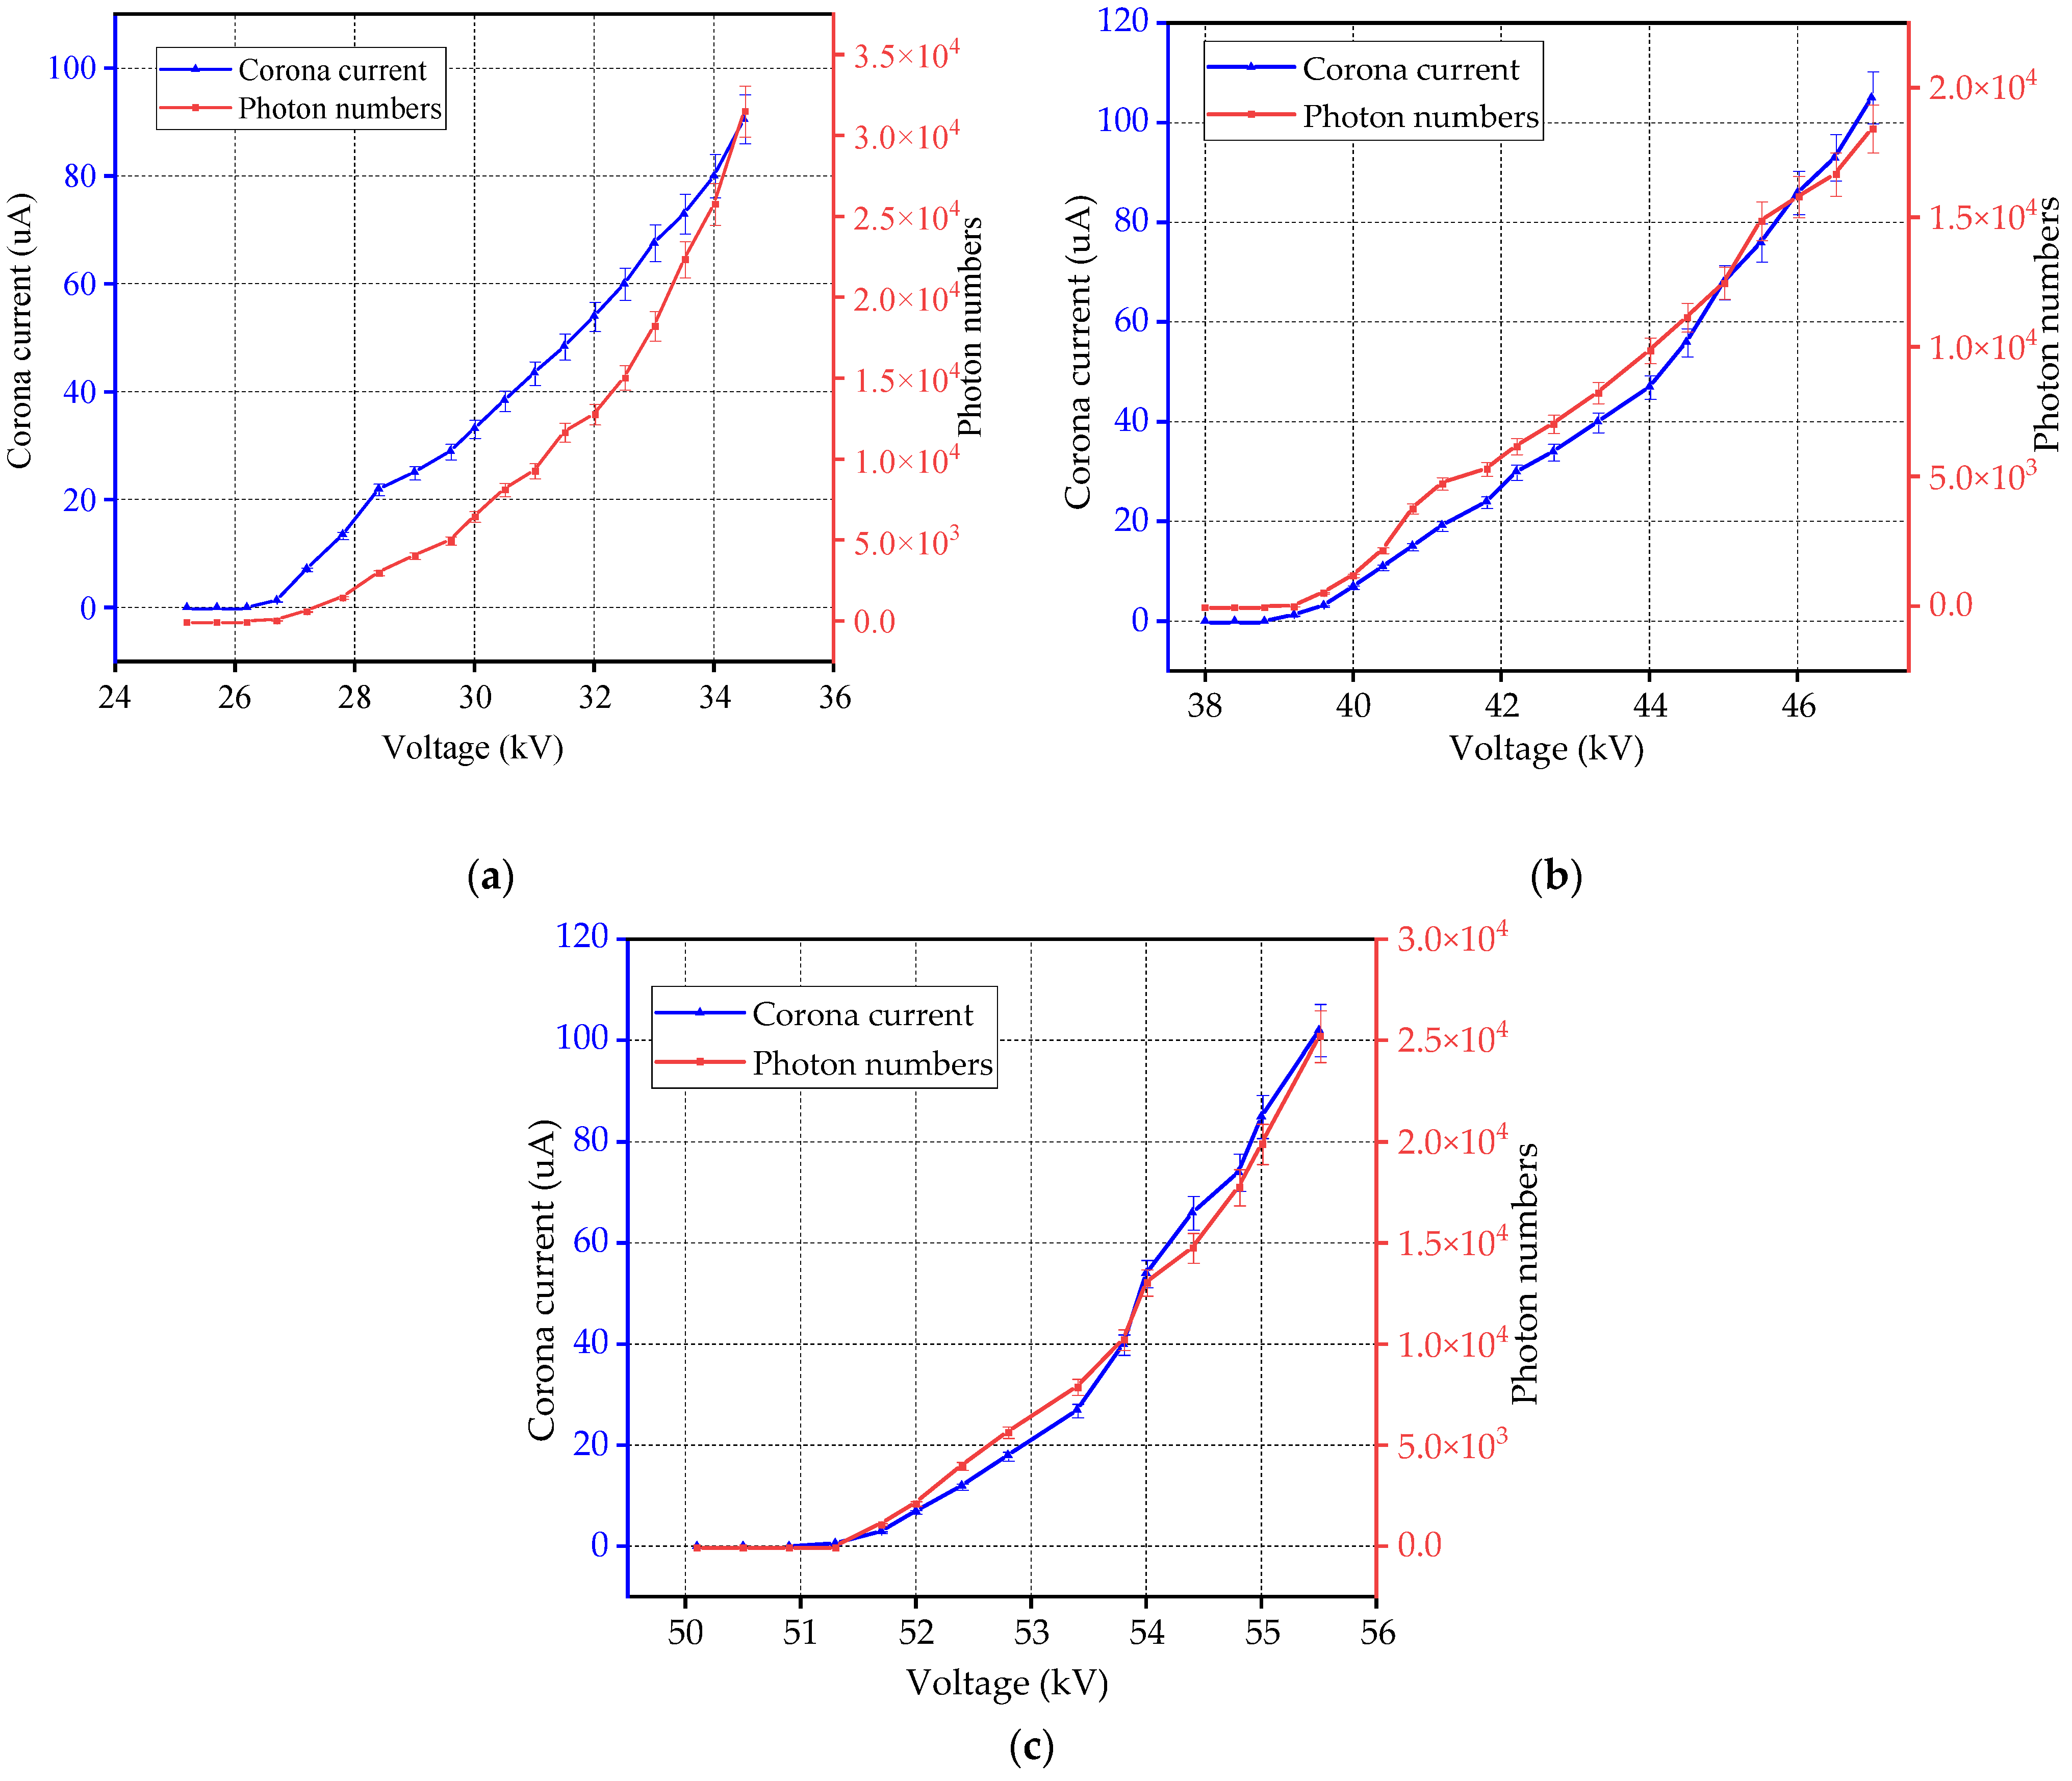
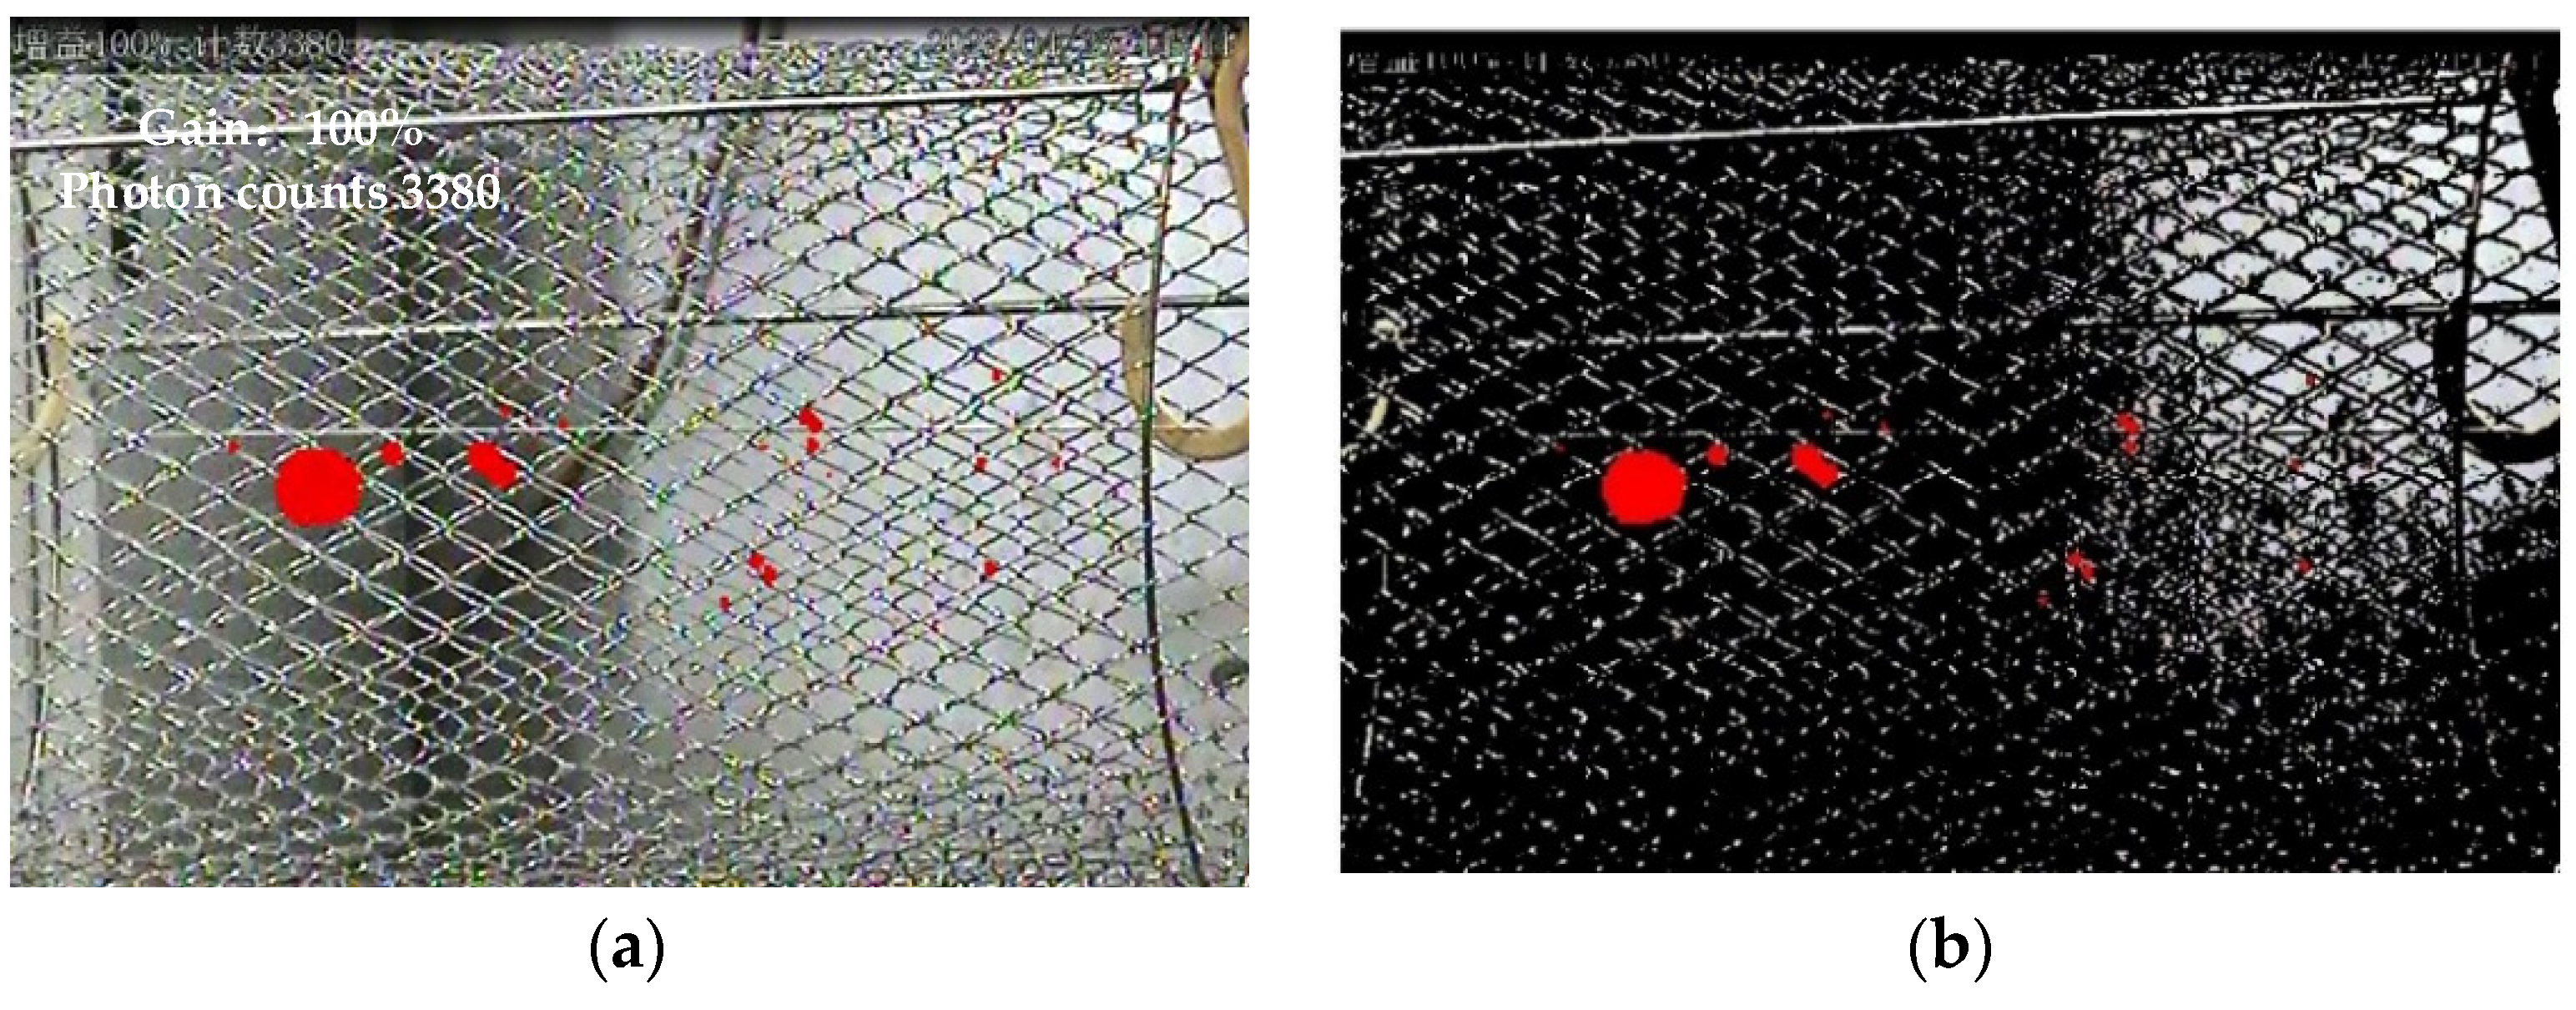
The experimental results presented earlier indicate that the stronger the discharge intensity, the higher the photon count. The discharge point around the conductor appears as a spot in the ultraviolet image. Therefore, the area of the ultraviolet spot can be used to reflect the discharge intensity of the discharge location. As shown in
Figure 8a, the ultraviolet detection images captured by the ultraviolet detector are RGB images. Their characteristic is that each pixel can be represented by three equally sized 2D arrays: R (red), G (green), and B (blue). To simplify the subsequent processing, the RGB image was converted into a grayscale image, as it contains more image information. Additionally, the k-means clustering algorithm was employed to segment the ultraviolet detection image. Unlike traditional image segmentation methods, the primary idea behind the k-means algorithm is to iteratively classify the data set into different clusters to achieve optimal clustering capability [
26]. Therefore, it is more suitable for segmenting ultraviolet detection images that are complex in shape and lack regularity.
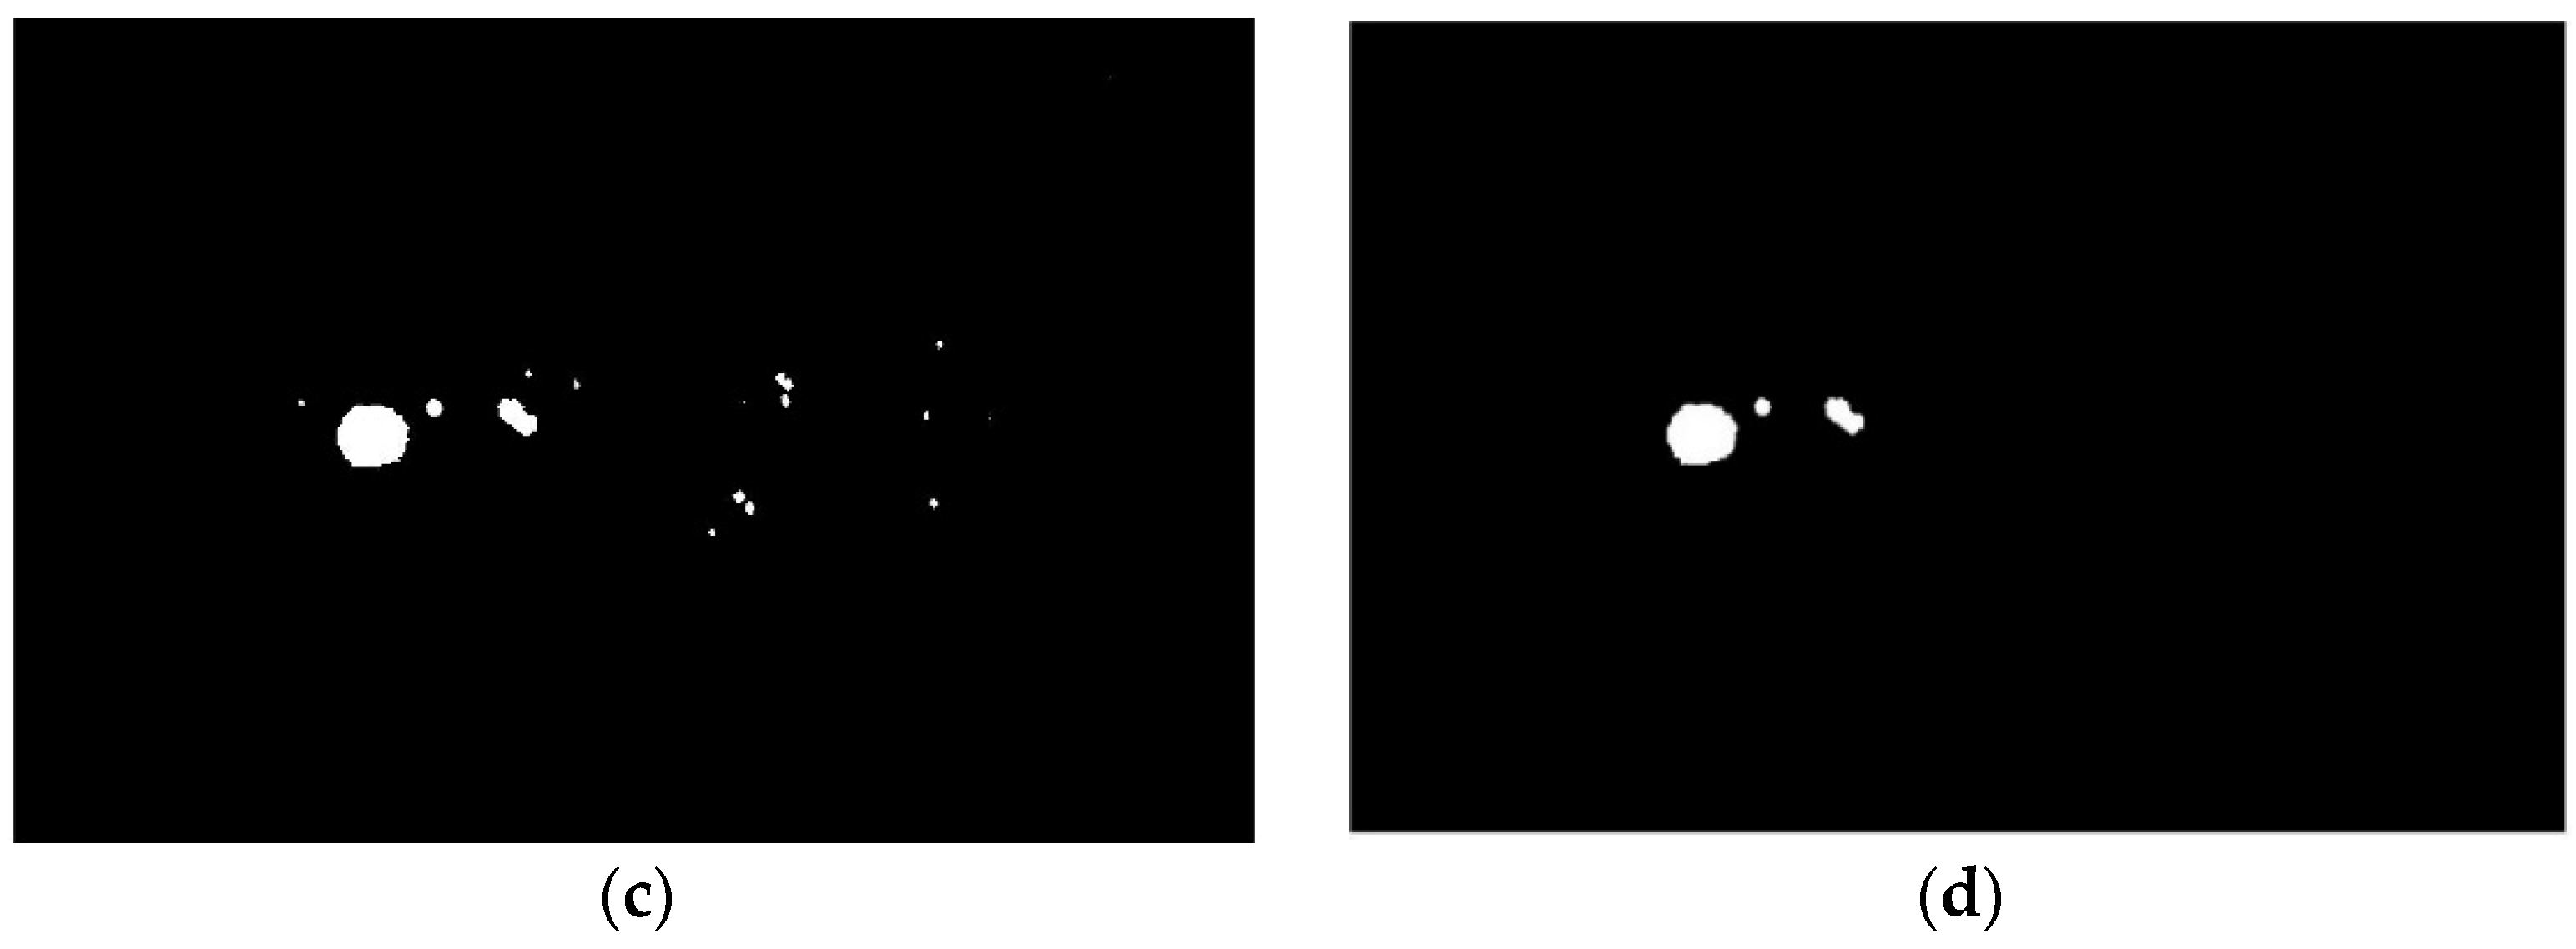
In practical situations, when performing ultraviolet detection on power transmission lines, there are various challenges due to the complex field conditions and the presence of high-voltage electrical equipment. The ultraviolet images obtained from the ultraviolet imaging device are susceptible to interference, resulting in the presence of many noise points in the images. This interference can make it difficult for detection personnel to accurately determine the discharge locations on the power transmission lines. Therefore, this study employed mathematical morphological filtering algorithms to filter the ultraviolet detection images. The algorithm utilizes the opening operation to dilate the segmented ultraviolet image, eliminating discrete discharge points smaller than the structural element around the discharge area. It then applies the closing operation to fill in the cracks and concave regions outside of the discharge area, smoothing the discharge region [
27]. The process of handling the ultraviolet detection image is illustrated in
Figure 8.
4.2. Calculation of Discharge Area Parameters in Ultraviolet Detection Images
After grayscale conversion, image segmentation, and filtering, clear discharge area contours with smooth and non-adhesive boundaries were obtained in the ultraviolet detection images. At this point, the area of the light spot in the ultraviolet detection image can be calculated using a function. In this study, the light spot area is defined as the number of white pixels in the image after spot recognition, measured in pixels. By applying Equation (7), the number of white pixels in the image can be counted to obtain the area of the corona discharge light spot. In the equation,
M and
N represent the rows and columns of the processed RGB image matrix, respectively.
B (
x,
y) represents the number of white pixels, where
x and
y are the horizontal and vertical coordinates of the pixels in the processed matrix.
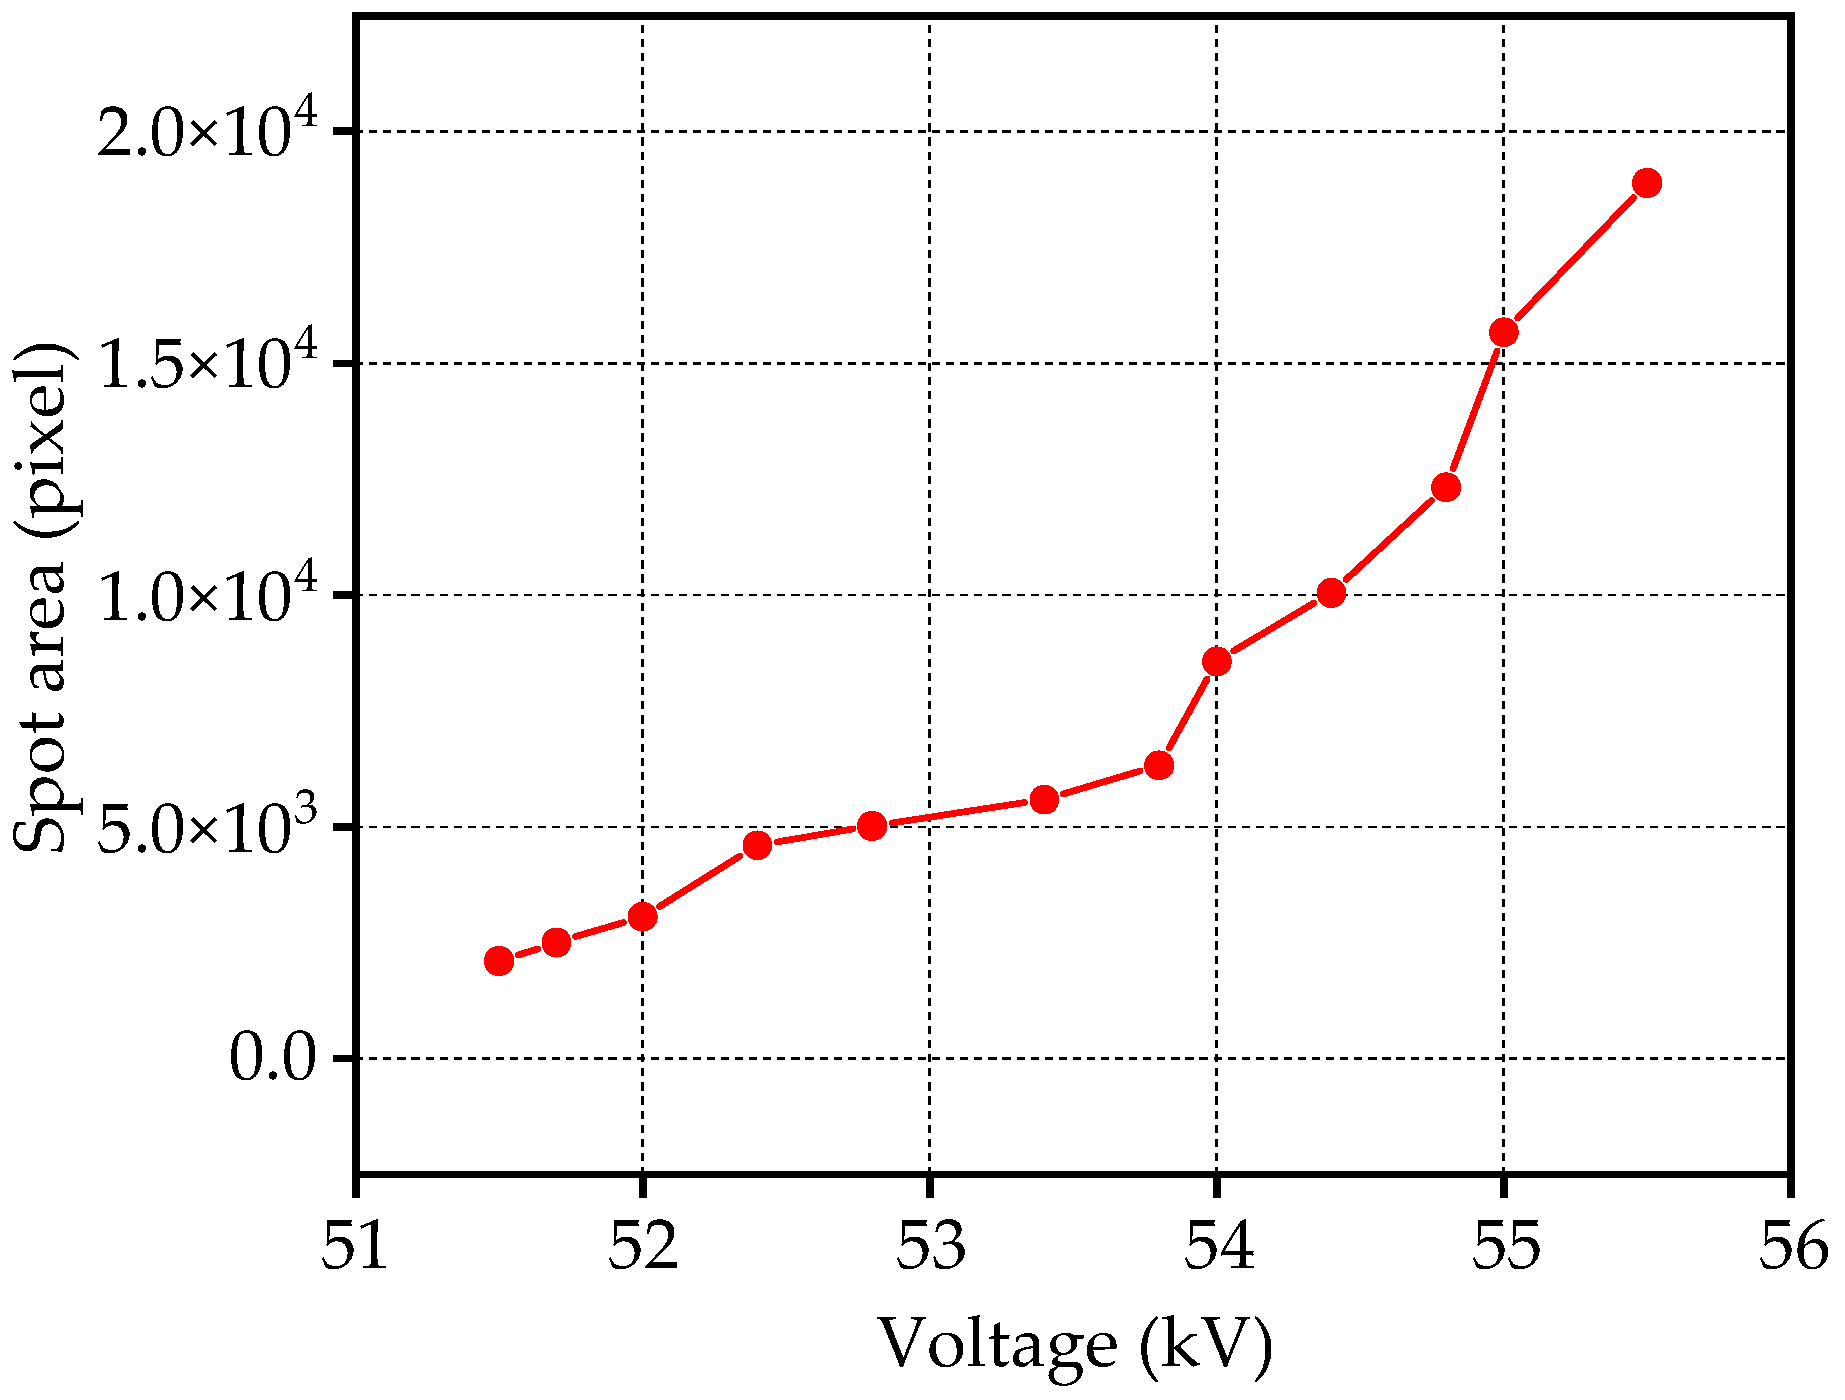
Through the above process, the obtained images from the experiment were processed, and the following conclusions were drawn. For the 5 mm diameter conductor, when the gain of the UV imager was set to 100% and the observation distance was set to 2 m, the variation of the spot area with the voltage was observed. The relationship between the spot area and the voltage for the 5 mm conductor is depicted in
Figure 9.
The voltage and its corresponding UV spot area were fitted using the least squares fitting algorithm, and the obtained function relationship is shown in Equation (8). The calculated fitting coefficient for the function relationship is 0.9735, indicating a good fitting result. From the fitting results, it can be observed that the relationship between the spot area and the conductor voltage follows a quadratic function.
In the equation, U represents the applied voltage on the conductor, the unit is kV, and S represents the spot area.
4.3. Characteristics of the Spot Area in Relation to Gain and Observation Distance Variations
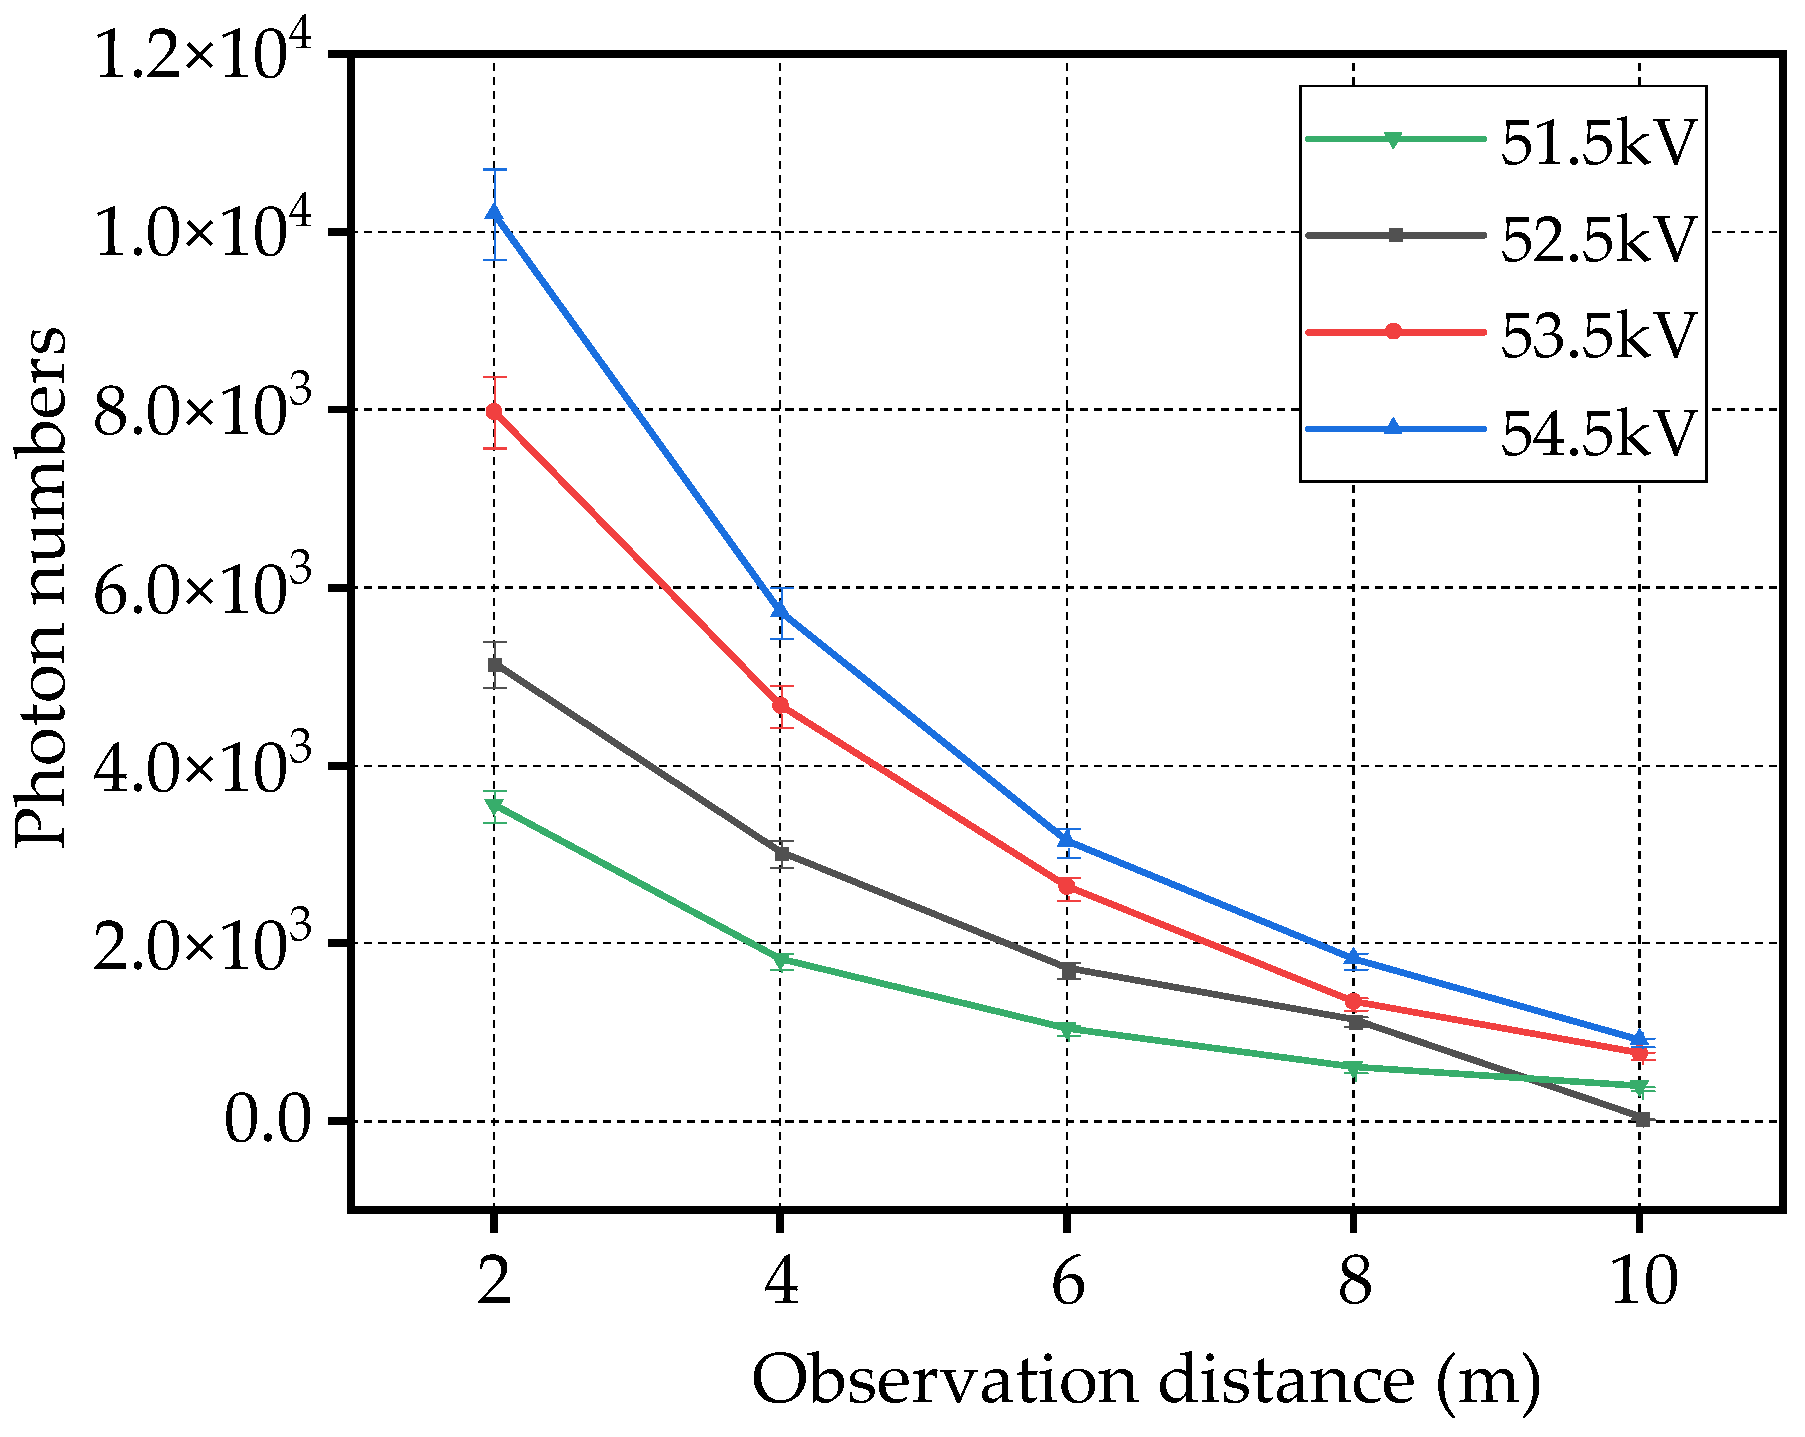
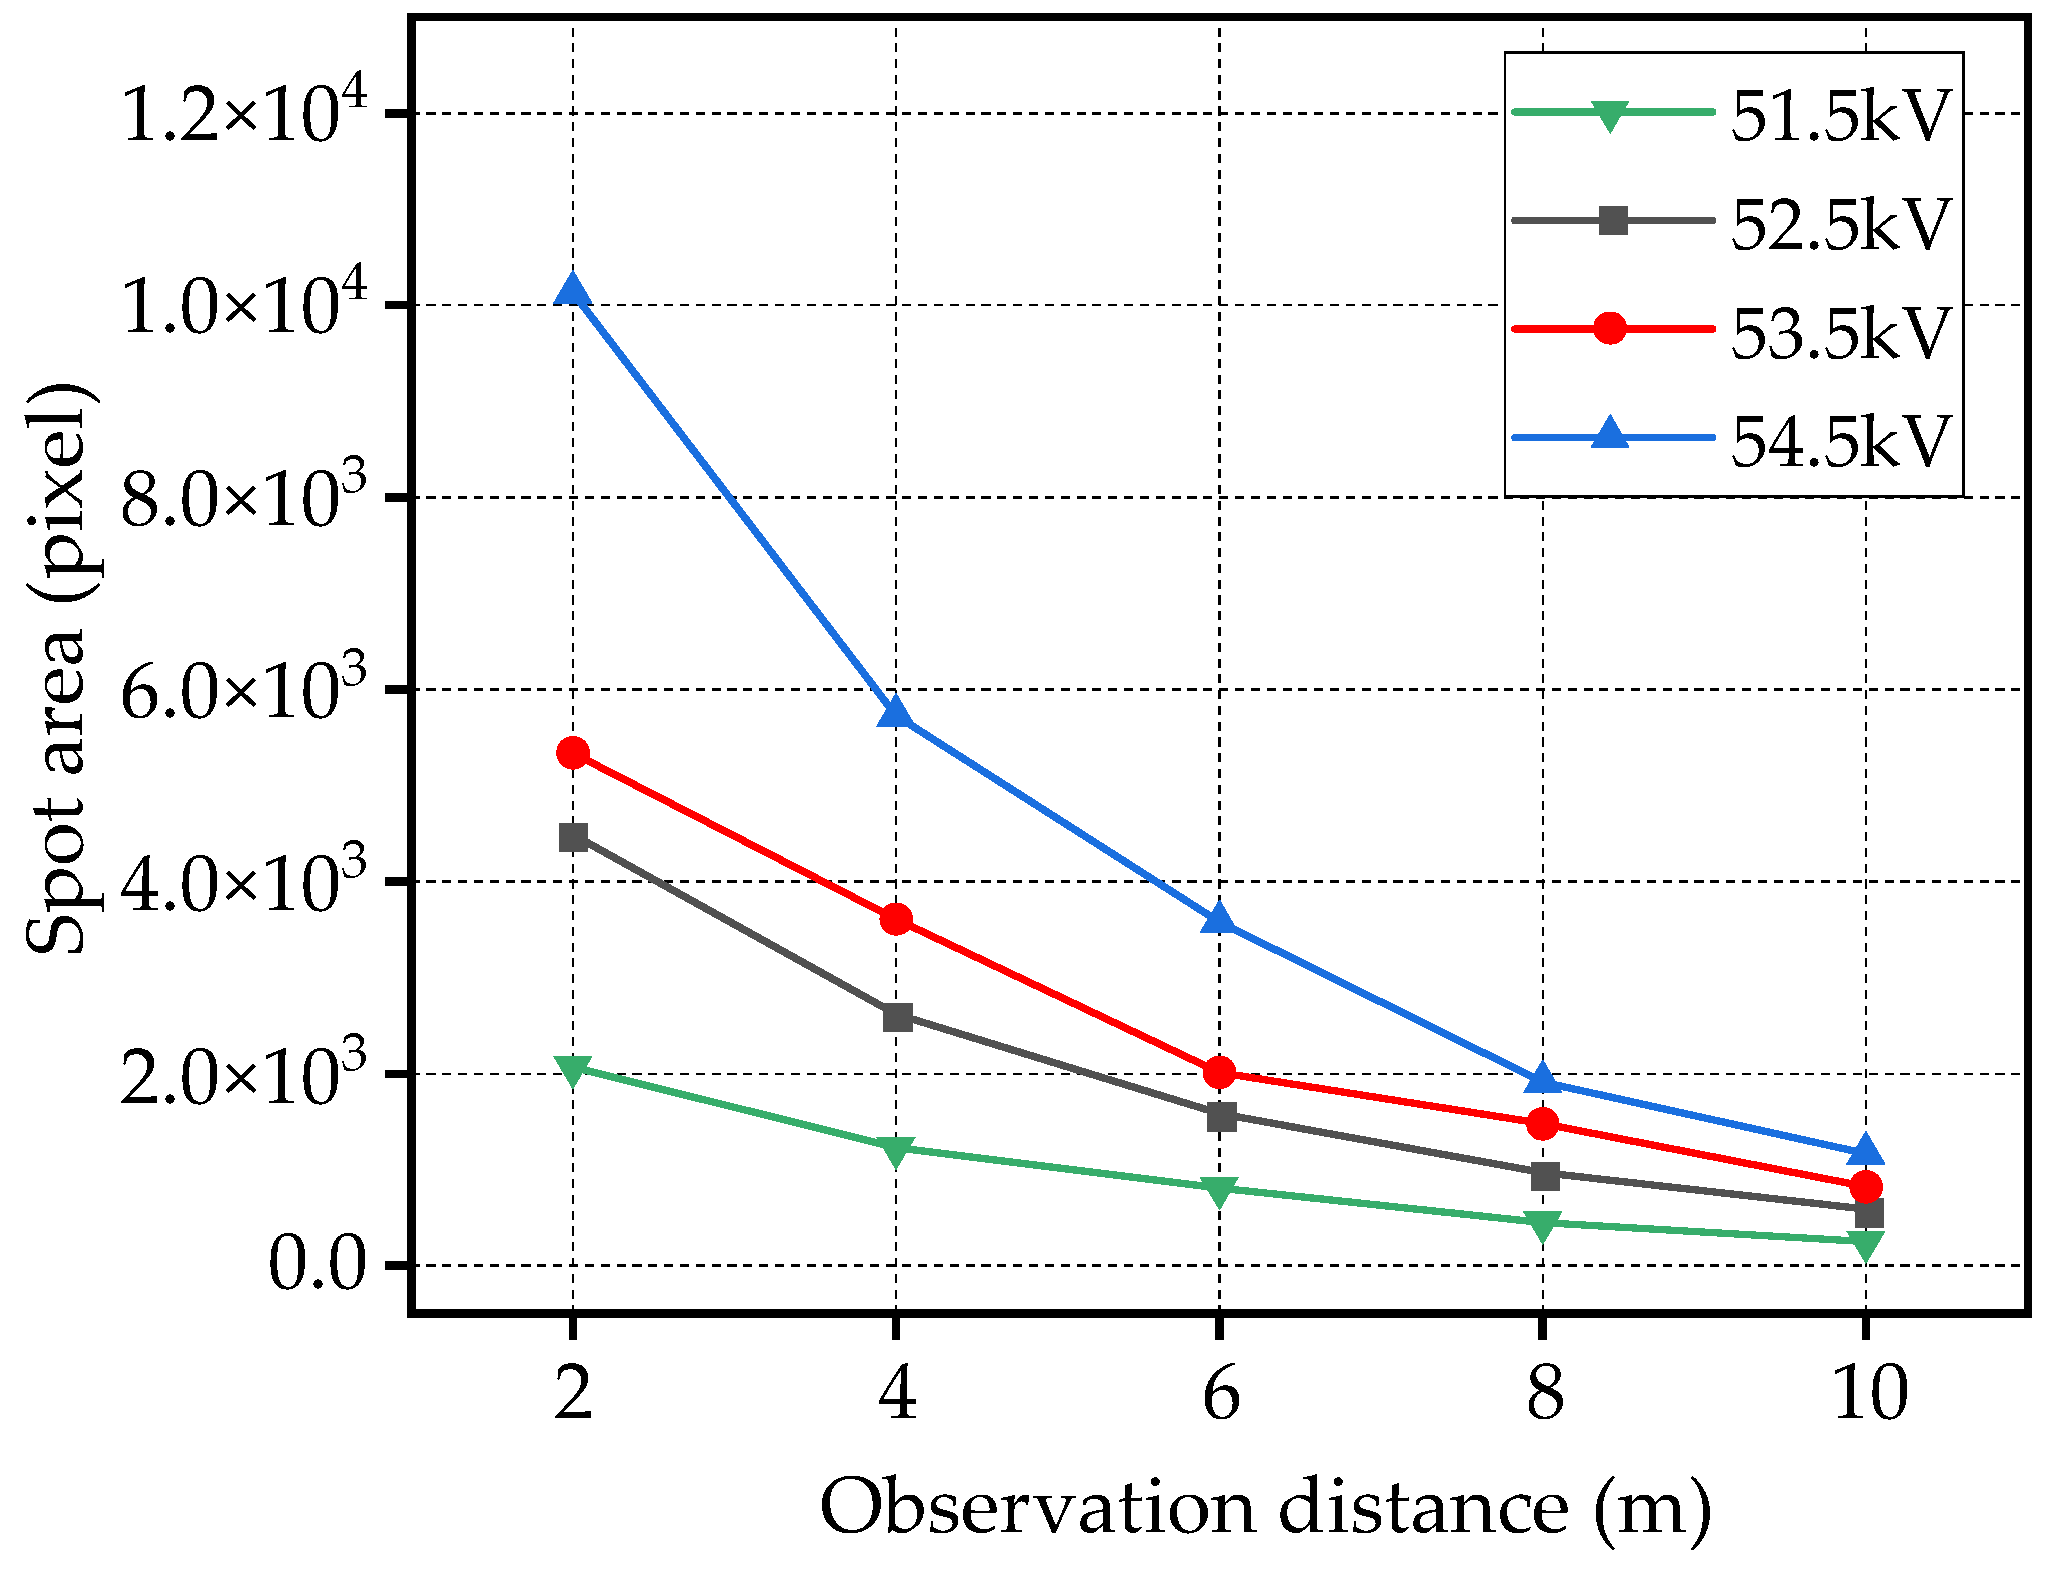
Figure 10 shows the variation of the spot area with changing observation distance while keeping the gain at 100%. Similar to the variation pattern of the UV photon count, the spot area decreased exponentially with increasing observation distance.
Using the least squares method, the data points in
Figure 10 were fitted, and the fitted function expression for the spot area as a function of the observation distance is shown in
Table 5. In the table,
S represents the spot area in pixels, and
L represents the observation distance in meters.
From
Table 5, it can be observed that the fitted function expressions for the discharge area as a function of the observation distance have high fitting coefficients for each voltage level. The spot area exhibited an exponential relationship with the observation distance. Similarly to the process of Equations (3)~(6), we can obtain the correction of the spot area, with
S at the actual observation distance to the spot area and
S0 at the reference observation distance.
In the above equation, L is the actual observation distance, S is the spot area obtained from the actual observation, L0 is the reference distance in this paper, which is taken as 2 m in this paper, and S0 is the corrected spot area.
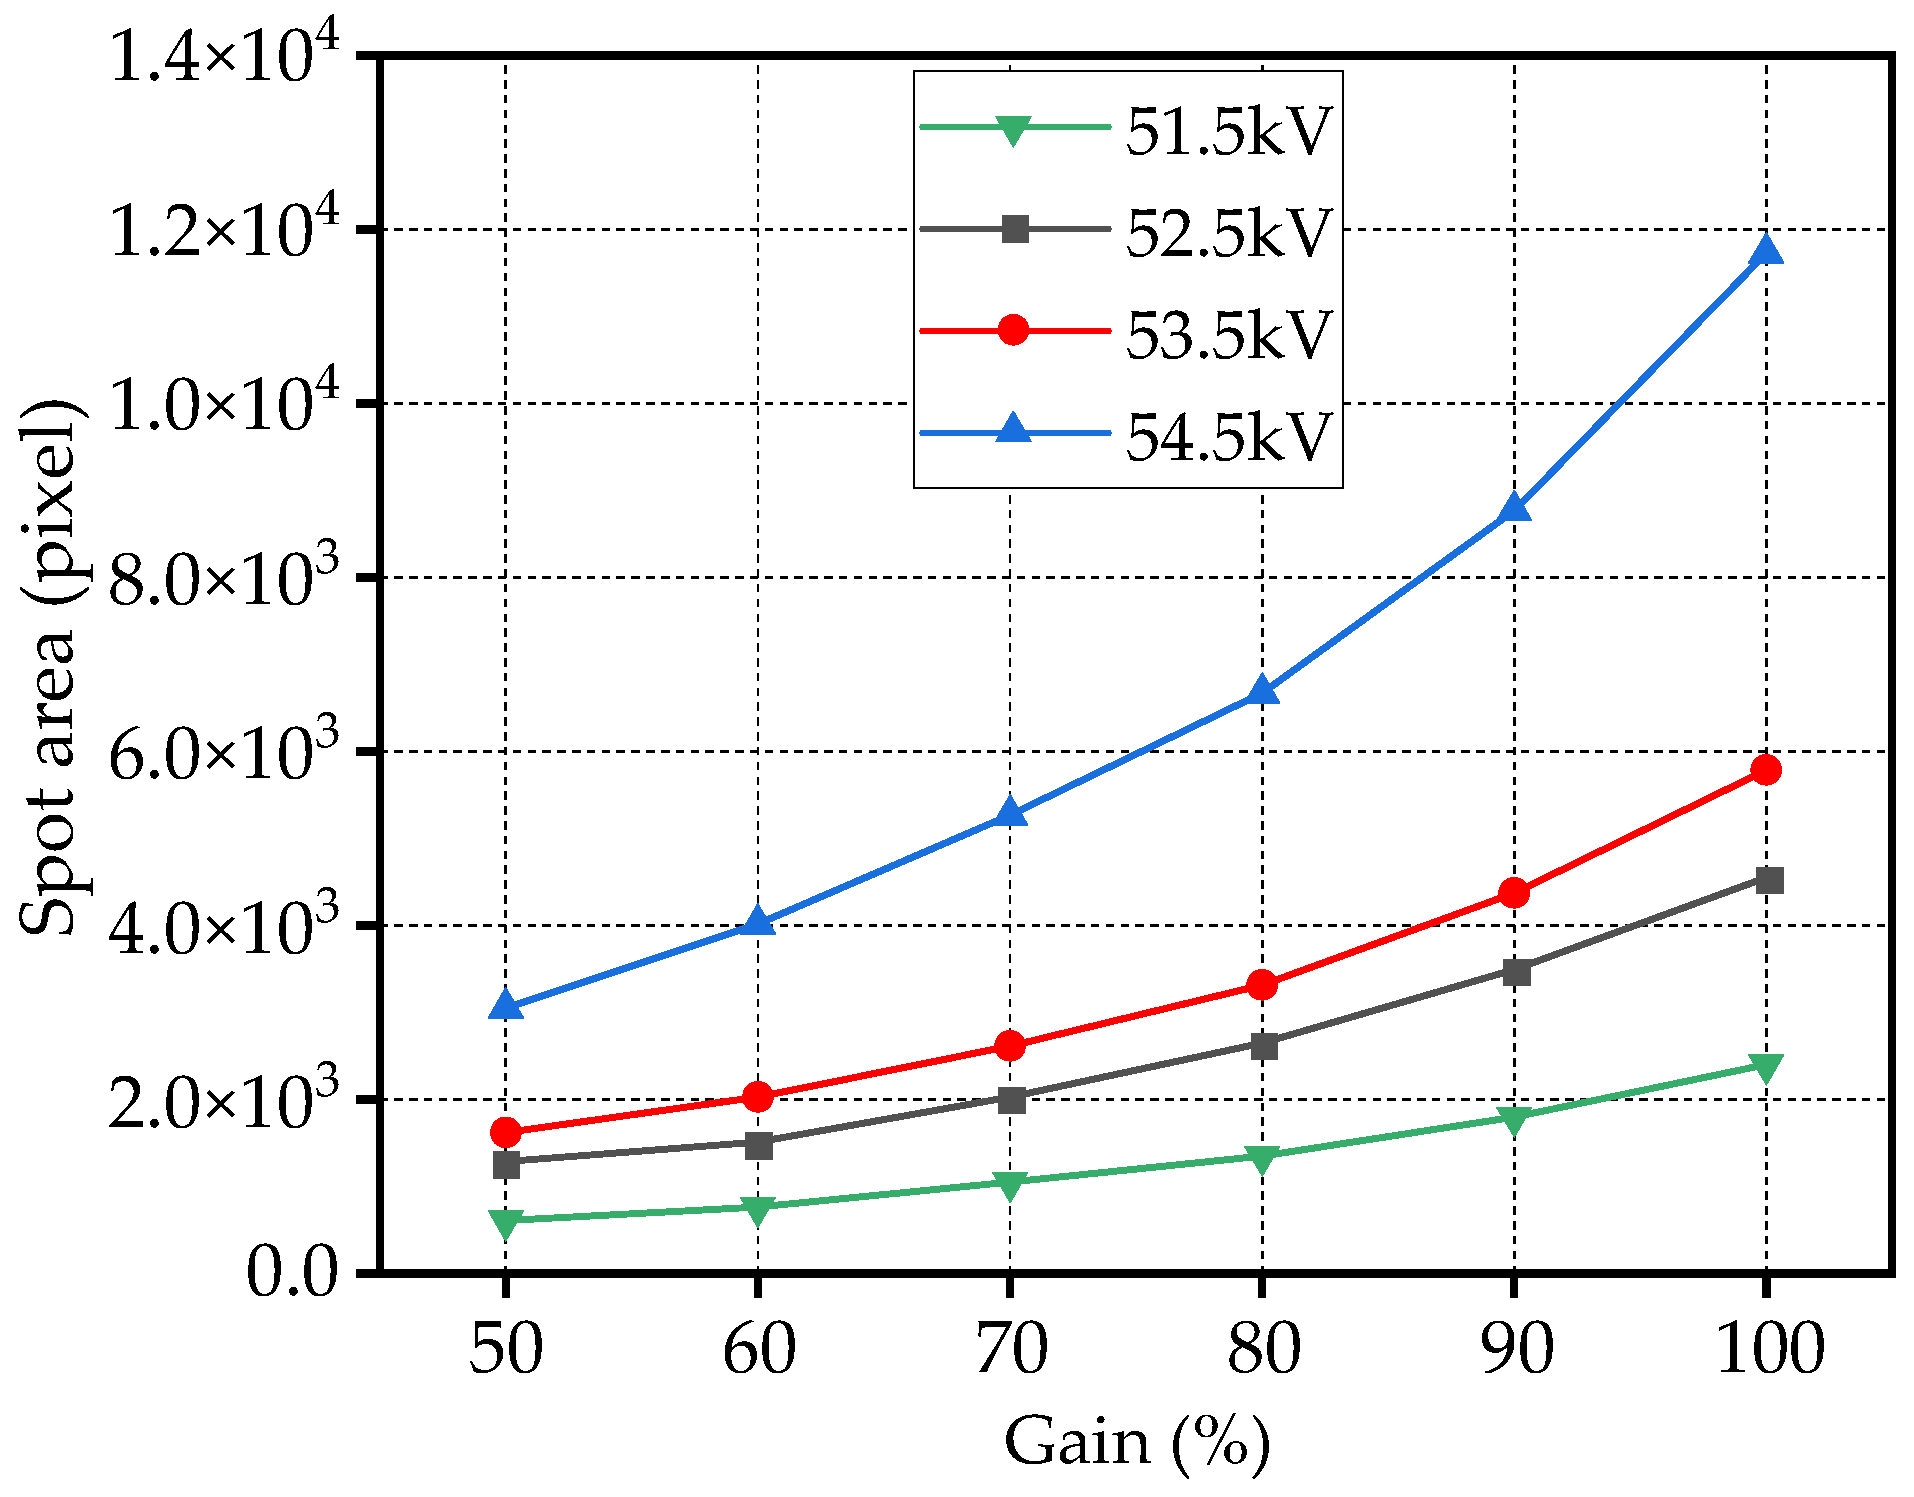
Keeping the observation distance constant at 2 m, and setting the gain of the UV detector between 50 and 100, the changed in the UV spot area with gain under different voltages could be observed, as shown in
Figure 11.
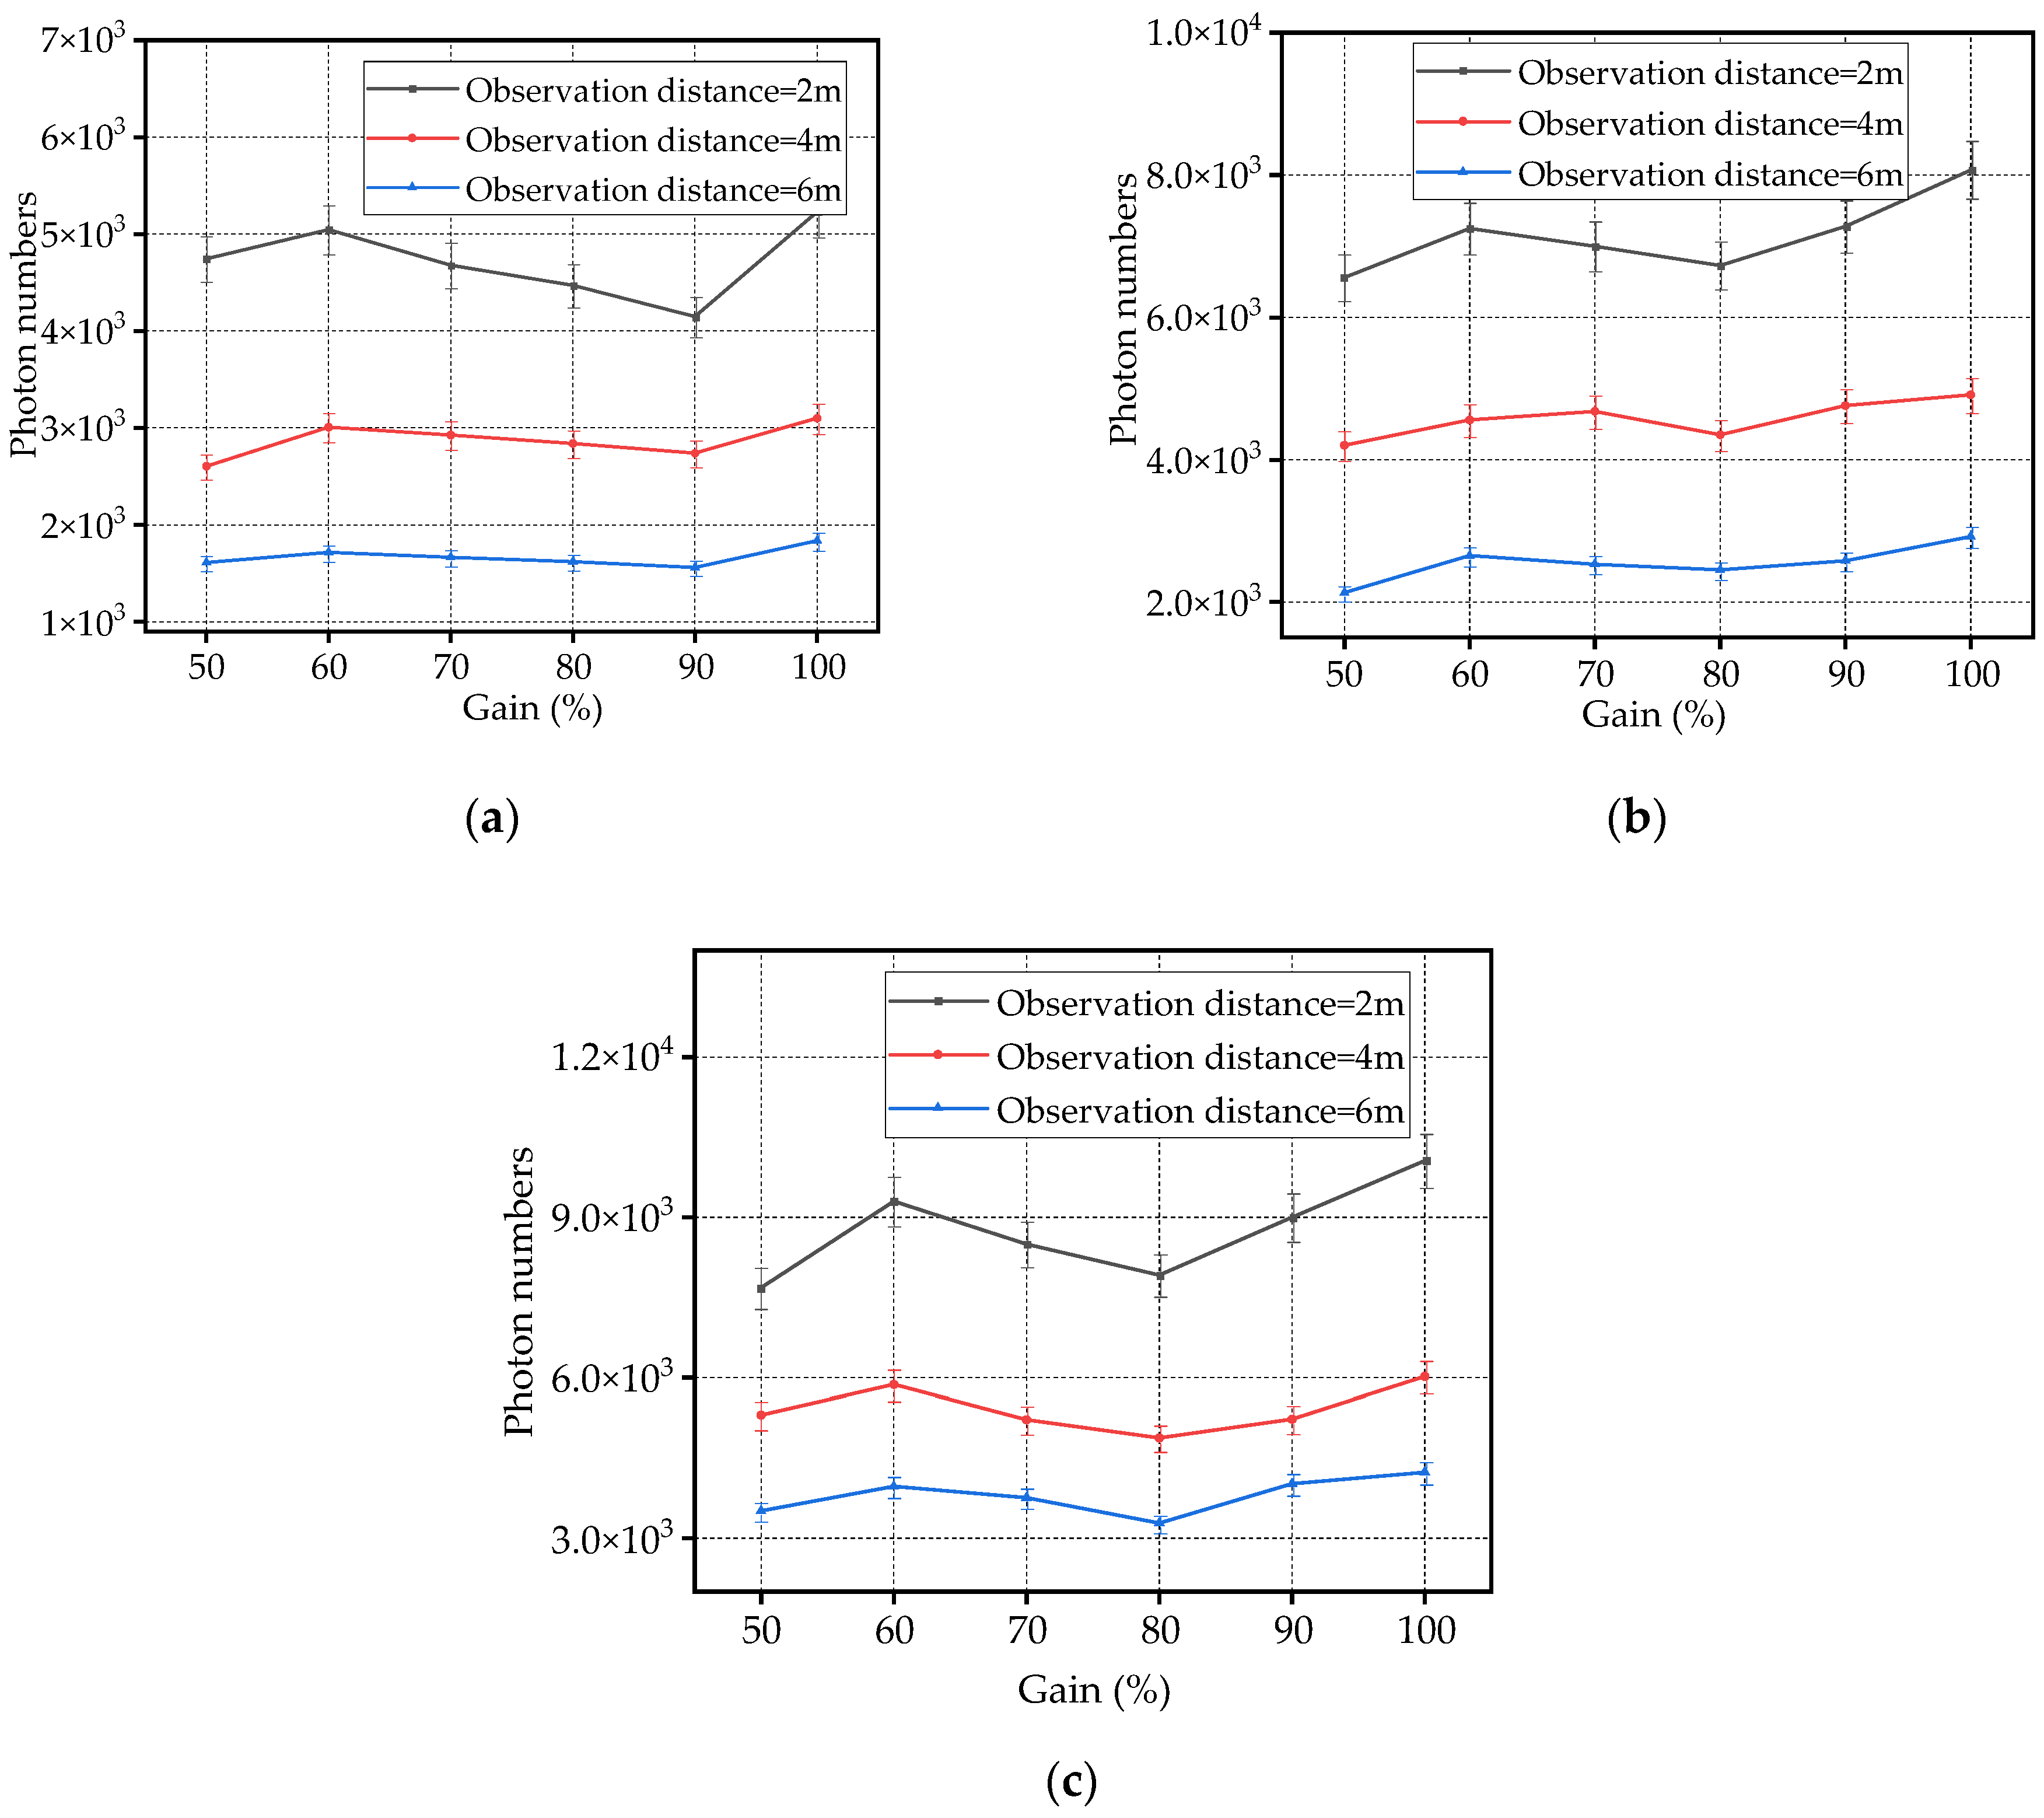
Comparing
Figure 7 and
Figure 11, it can be observed that under the same experimental conditions, the effects of gain on the photon count and spot area were different. The spot area shows a monotonous increase with the increase in the instrument gain. However, the photon count does not follow the same trend. When the gain increased from low to high, it did not monotonously increase with the gain. Instead, it exhibited a pattern of initial increase, followed by a decrease, and then an increase again. By observing the different characteristics of the photon count and spot area with respect to the instrument gain, it can be concluded that when the corona discharge is relatively stable, if the spot area is used as the reference factor for detection, the detection results will correspond directly to the instrument gain. If the photon count is used as the reference factor for detection, it is possible to have similar detection results at different instrument gains. Therefore, more accurate results can be obtained by combining the two to detect discharge.
By using the least squares method to fit the data points in
Figure 11, the fitting function expression for the relationship between the spot area (
S) and the gain (
g) was obtained and is shown in
Table 6.
From
Table 6, it can be seen that the fitting coefficients of the function expressions for the photon count with respect to the observation distance are relatively high for each voltage level. The photon count is related to the observation distance in a power function relationship. Similarly to the process in Equations (3)~(6), the correction of the actual gain for the spot size to the reference gain can be obtained, as shown in Equation (10).
In the above equation, g is the actual gain, S is the spot area obtained from the actual observation, g0 is the reference gain, which is taken as 100% in this paper, and S0 is the corrected spot area.
The formula to calibrate the spot size obtained at any detection distance and gain for a 5 mm conductor to the spot size at a gain of 100% and a detection distance of 2 m is as follows:
By combining Equations (8) and (11), the corresponding spot size at the reference detection distance and the reference gain for any detection distance and gain of the ultraviolet imaging device can be obtained, along with the corresponding voltage on the conductor. This allows for the evaluation of the discharge level of the conductor. To validate the correctness of this approach, using a UV imager, the UV photon count and spot area of a conductor with a diameter of 5 mm were measured at a detection distance of 7 m and a gain of 100. The voltage was then varied, and the measured UV photon counts and spot areas were obtained. These values were then corrected to obtain the reference photon counts and spot areas. The fitted voltage was determined by combining the reference photon counts and spot area with a voltage fitting function.
From
Table 7, it can be seen that with the correction method and voltage fitting function proposed in this paper, accurate observations of corona discharge can be obtained. The error of the fitted voltage and the actual voltage was within 5%.


