Abstract
This study delves into the analysis of a vineyard in Carinthia, Austria, focusing on the automated derivation of ecosystem structures of individual vine parameters, including vine heights, leaf area index (LAI), leaf surface area (LSA), and the geographic positioning of single plants. For the derivation of these parameters, intricate segmentation processes and nuanced UAS-based data acquisition techniques are necessary. The detection of single vines was based on 3D point cloud data, generated at a phenological stage in which the plants were in the absence of foliage. The mean distance from derived vine locations to reference measurements taken with a GNSS device was 10.7 cm, with a root mean square error (RMSE) of 1.07. Vine height derivation from a normalized digital surface model (nDSM) using photogrammetric data showcased a strong correlation (R2 = 0.83) with real-world measurements. Vines underwent automated classification through an object-based image analysis (OBIA) framework. This process enabled the computation of ecosystem structures at the individual plant level post-segmentation. Consequently, it delivered comprehensive canopy characteristics rapidly, surpassing the speed of manual measurements. With the use of uncrewed aerial systems (UAS) equipped with optical sensors, dense 3D point clouds were computed for the derivation of canopy-related ecosystem structures of vines. While LAI and LSA computations await validation, they underscore the technical feasibility of obtaining precise geometric and morphological datasets from UAS-collected data paired with 3D point cloud analysis and object-based image analysis.
1. Introduction
Precision agriculture is focused on the use of various technologies to monitor the spatial and temporal variability related to agricultural management, yield maximization, and economic and environmental benefits [1]. In precision viticulture, the technological advances used in precision agriculture are used to improve yield forecasting, harvesting management, water management, and the improvement of grape quality, which then in turn influences the quality of the bottled product, namely, wine. In recent decades, the development of uncrewed aerial systems (UAS) technology and satellite technology for remote sensing has experienced an increase in spatial resolution, temporal availability, and the capability to describe the physiological, geometrical, and morphological parameters of plants [2].
Vegetation indices, calculated based on multispectral sensor data from UAS or multispectral satellite data, are used to monitor plant status, stress levels, and vineyard variability. The index values are correlated to chlorophyll content within leaves, nitrogen concentration, and plant water status for vine variability and vigor monitoring [3]. Besides vineyard variability monitoring, the estimation of vine row area and leaf area, disease detection, and vineyard vigor mapping, yield estimation is another important topic [1]. Yield estimation is used for wine cellar management and to calculate the grape purchases from external sources if the forecast of the yield is below the needs of the winery, or to intensify the selling of grapes if the yield is above the expectations. Therefore, it is of great importance to monitor the yield of a vineyard to work profitably and accurately. However, optimizing yield estimation requires current and georeferenced vineyard information regarding the parameters, including crop height, canopy architecture, and fruit weight [4]. From all collectable datasets within a vineyard, data related to yield estimation stand out for their economic relevance and for being of great importance for optimizing plant growth and fruit quality [5].
The optimization of vineyard management techniques often requires efficient and automated or semi-automated methods in order to identify vine-specific morphological and geometric parameters like canopy architecture, vine heights, vine row geometry, and vine location within rows. UAS-based imagery offers the capability of modeling the plant-specific morphological parameters using photogrammetric processing [6]. Photogrammetry can provide a non-contact 3D reconstruction of objects that can be beneficial if the objects are spread over a large area or are difficult to reach. Structure from motion (SfM) processing combines photogrammetric data acquisition techniques with computer vision in order to reconstruct 3D surfaces [7]. The algorithm uses a technique of comparing recurring points in image sets to reconstruct the UAS camera positions. The process results in a sparse point cloud, containing the triangulated locations of points that were matched across the images [8]. The generated output requires imagery from different angles and viewpoints to reliably reconstruct the geometry of the area under study. The image acquisition and the photogrammetric processing are followed by the output creation. The outputs of the digital image processing are a dense 3D point cloud, a textured 3D model, a digital surface model (DSM), and an orthomosaic [9].
UAS are among the most important sensor platforms in modern precision agriculture. They show great potential in precision viticulture thanks to their capacity to produce very high spatial, spectral, and temporal resolution with a ground sampling distance (GSD) up to 1 cm; the possibility to apply multispectral sensors; and the option of a high repeatability rate. Sensors onboard UAS can collect a variety of different data sets that are used to calculate vegetation indices for monitoring the vitality and the geometric and morphological characteristics of the objects under study. Müllerová et al. [10] presented a comprehensive framework where common rules in the domain of UAS-based monitoring of ecosystems are identified. By analyzing studies, the researchers found similarities in workflows according to the character of the vegetative properties under investigation. Properties concerning biodiversity, ecosystem structure, plant status, and dynamics were defined. Successful UAS surveys accounted for the choices of sensor and platform, knowledge about the phenomenon under study, and use of the desired resolution and analytical methods. In the study presented herein, the ecosystem structure of vines is monitored. Parameters like leaf surface area (LSA), leaf area index (LAI), and vine height are derived from UAS-collected multispectral and RGB datasets. According to Müllerová et al. [10], vineyard rows appear as distinct objects that are highly dissimilar to the surrounding objects. In terms of UAS data acquisition, the unique structural appearance of planted rows should lead to a high spatial resolution and low spectral resolution. The preferable classification method comprises an object-based image analysis (OBIA) framework. In order to derive the targeted vegetation heterogeneity components, a passive sensor should be used with a high overlap, followed by SfM processing. By using the resulting 3D point cloud and the respective analytical methods, the heterogeneity parameters of vine height, LSA, and LAI can be derived [10].
Matese et al. [11] proposed the effectiveness of low-cost UAS systems for vigor mapping in vineyards. UAS-collected data can serve as the baseline for photogrammetric processing workflows that are then used to create a variety of 3D datasets. RGB data are useful for spatial variability monitoring within a vineyard when accurately segmented and properly analyzed. However, manually segmenting and digitizing individual vines is a time-consuming and error-prone task. Poblete et al. [12] provided a framework for vine canopy recognition using different automatic classification methods like K-means, Ann, random forest, and spectral indices. The results showed that the spectral index method provided the best results for vine canopy detection, since this method is automatic and does not require specific software to calculate the indices. The 2G_RBi index was obtained from the difference of the divergency of the red and blue bands from the green band of the original RGB orthomosaic.
The very high resolution of UAS images can also be a challenge in classification due to the high spectral variability between different vegetation classes. In the study of de Castro et al. [13], the researchers proposed a method for the automated detection of grapevine 3D canopy structures based on high-resolution UAS imagery. An algorithm was developed where the 3D morphology of vines was investigated, a height estimation was conducted, and missing plants within a row were detected. The algorithm needs no training and is self-adaptive to different crop field conditions. The researchers used a random forest (RF) classification environment where the RF randomly selected a training set, gathered the optimal feature values, and classified weeds and crop rows [13]. The research carried out by Mesas-Carrascosa et al. [14] shows an approach to plant variability monitoring that uses RGB point clouds for the recognition and classification of plants to investigate the geometric structure of vines using the soil points as a reference and calculating differences to the canopy tops. To obtain information about the tree canopy, a series of 3D point clouds was generated using the SfM technique on images acquired with an RGB sensor on board a UAS. Together with the geometry, each point of the cloud stored the information from the RGB color space. This information was used by the researcher to distinguish vegetation from bare soil and to perform an automatic classification of the point clouds where the soil points were subtracted from the vine points, resulting in a vegetation index-based automatic calculation of canopy heights within the research areas.
The monitoring of the vine’s ecosystem structure is a labor-intensive task and is mostly performed manually. Manual measurements are often inconsistent, leading to errors in the metrics, and only small regions can be sampled [15]. The ecosystem structures of vines correlate with plant growth, health status, and potential yield [16]. UAS-based remote sensing methods for data acquisition have the benefit of delivering sub-centimeter spatial resolution imagery in a fast and efficient way in comparison to proximal sensing. Satellite-based imagery provides valuable insights at a landscape scale, but the spatial resolution is often too coarse for precision viticulture [17]. In the review paper of Moreno and Andújar [15], the researchers state that future research should investigate the optimal flight angles of UAS-mounted sensors in order to collect valuable data for the geometric characterization of vines. In the current study, 3D point cloud analysis combined with object-based image analysis is used to detect and segment single vines. The derivation of single plants in the research area enables the calculation of ecosystem structures at the single-plant level. The study’s contribution to precision viticulture involves accurately identifying individual plant locations and extracting the geometric parameters of vines associated with the identified individual plants using high-resolution, UAS-based 3D point clouds.
2. Materials and Methods
2.1. Research Area
The study area (Figure 1) was a 0.7 ha vineyard located in Carinthia, Austria, on a south/west-facing slope with an average incline of 17.4°, at an average elevation of 750 m. Here, white wine grape varieties and red wine grape varieties have been cultivated since the year 2012, and the end-products are distributed locally. The vineyard contains about 1200 vines, planted with an average between-vine spacing of 1 m. The vines are organized in rows, which are arranged into seven blocks. The main cultivars are ‘Bianca’, ‘Regent’, and ‘Jura’. Vines are not irrigated; only lime is used to increase the nutrient supply, and no chemical pesticides or fertilizers are applied.
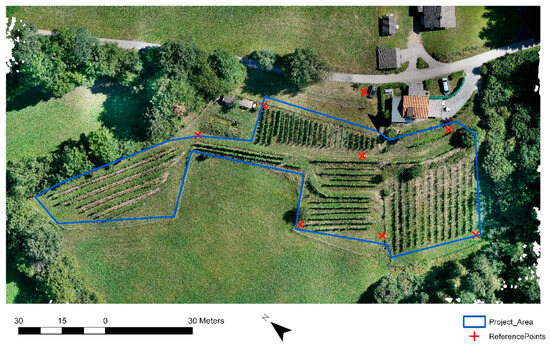
Figure 1.
Study area in Carinthia showing seven blocks of wine grapes across the 0.7 ha parcel.
2.2. Data Collection
Various terrestrial measurements were conducted in the field, primarily involving the collection of ground control points (GCPs) and reference measurements for the subsequent validation of the analysis results. The reference measurements include vine height measures and the measurement of vine stem locations. The primary device employed for point data collection was the Leica Viva GS16 GNSS Rover (Leica Geosystems, St. Gallen, Switzerland). Eight GCPs were measured with this rover. This process was integral in georeferencing the results of photogrammetric processing, ultimately enabling their transformation into a projected coordinate system, specifically the ETRS89/Austria Lambert (EPSG-3416). The GCPs were installed across the entire study site, encompassing varying topographic levels, including locations both above and below steep slopes. Due to the foliage cover of the vines and to the plants’ developmental stages, different UAS missions were necessary in order to derive the desired data. The usage of the different datasets is described in the methodological part of this manuscript. RGB and multispectral data were collected in the field. Different flight altitudes were tested in order to achieve ground sample distances (GSD) close to 1 cm. The flight angle of the UAS varied from full nadir to 45° oblique in order to scan the sidewalls of the vines. For UAS data collection, an automated flight plan was used with a forward image overlap of 80% and a side overlap of 90%.
Figure 2 displays the camera positions alongside the 3D point cloud, generated following the completion of photogrammetric processing steps. The first UAS mission was conducted in April of 2023, when the plants had not developed full leaf coverage, being in the phenological stage EL 1–3 following the Modified EL system [18]. The absence of foliage made it possible to photogrammetrically record the stems of the individual vine plants, which was important for derivation of the stem positions in a later step. For the first flight, the DJI M600 (DJI, Shenzhen, China) was used, equipped with a Sony A7riii camera with 42.4 megapixels and a Sony 50 mm f1.8 lens (Sony Corporation, Tokyo, Japan). The second flight was conducted in September 2023, when the vines were in phenology stage EL 38, 1 h before the grapes were harvested. Here, the foliage was in its final pruning stage [18]. The data from the second flight were used to derive the ecosystem structures of the plants (LSA, LAI, and vine height). For the second flight, the same UAS was used as for the first flight, but a multispectral data set was also recorded in order to be able to base the derivation of the vine plants on their spectral signature. The multispectral sensor used was the Micasense Dual (Micasense Inc., Seattle, WA, USA). The Micasense is capable of recording 10 spectral bands with a spatial resolution of 7 cm. Before and after each flight, the Micasense Dual was calibrated using the reference images provided with the sensor [19]. For both flights, a cross-grid pattern was used and supplemented with oblique flights. The flight altitude of the UAS was 30 m for oblique flights and 50 m for the nadir cross-grid. The automated flight plan was executed automatically, with the terrain following an underlying digital elevation model (DEM).
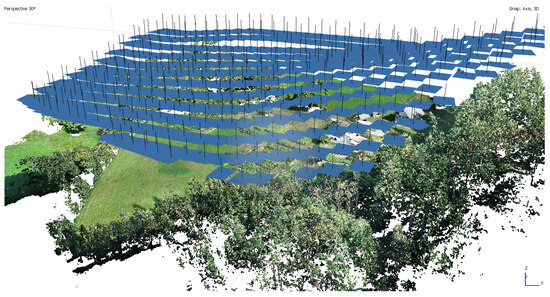
Figure 2.
Three-dimensional point cloud together with the camera positions.
2.3. Data Processing
A photogrammetric workflow was used in order to generate outputs from the conducted UAS missions. The UAS data collection missions were complemented by the measurement of 8 GCPs for georeferencing.
The data were processed in Agisoft Metashape Version 1.8 (Agisoft, St. Petersburg, Russia), a SfM processing software used for the processing of 3D spatial datasets. The software was used to generate georeferenced orthomosaics, DSMs, dense point clouds, and 3D textured meshes of the study vineyard. The first task was to visualize the data to determine sufficient coverage of the research area [20]. The UAS images were stored and aligned based on matching points. The alignment was achieved with regard to the interrelations of the images, and the software oriented them spatially with the result of a sparse point cloud [21]. The algorithm automatically found the camera positions. After tie point creation, the alignment optimization and the georeferencing were carried out, after which the dense point cloud was created. The root mean square error (RMSE) of the input GCP locations and their estimated positions was 0.034. This total error was computed as the RMSE of all input GCP locations relative to their estimated positions, shown in meters [20]. The dense point cloud was built by using the connecting points between the single images and the respective depth information [20]. The created dense cloud was checked for possible outliers and edited accordingly. By using the georeferenced dense point clouds, DSMs were created. Those DSMs served as the database for the creation of georeferenced orthomosaics. Textured 3D models were additional outputs of the photogrammetric processing.
2.4. Data Analysis and Respective Results
Using the georeferenced outputs from the photogrammetric processing, the ecosystem structures of the vines were extracted together with the locations of individual plants. In Figure 3, the methodological workflow diagram is shown, which includes all necessary analytical steps.
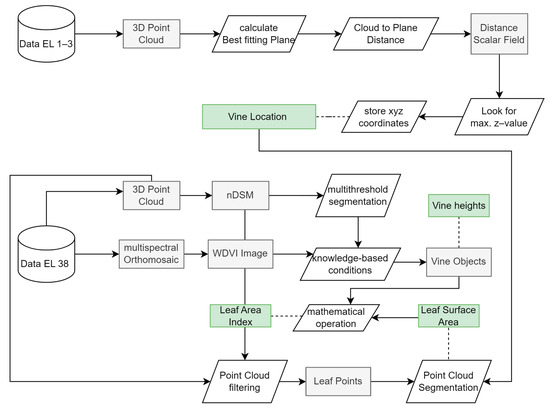
Figure 3.
Methodical workflow diagram showing the analysis steps that lead from the processed data sets ready for analysis to the derived vine-related parameters: LSA, LAI, vine height as indicated by the green boxes.
2.4.1. Vine Location
The geolocation of individual vines within a vineyard holds significant importance in the field of viticulture. The spatial data concerning the distribution of individual plants offer valuable assistance during vineyard replanting procedures, enabling viticulturists to establish an accurate inventory of plant count within the vineyard. This information proves instrumental in assessing the current state of the vineyard’s plant population. In this study, the exact location of individual vines was derived by analyzing the 3D point cloud recorded from the mission on 8 April 2023 (Figure 3). At this time of the year, the plants are in the phenological stage EL 1–3, where only leaf tips are visible and the rest of the plant is represented by woody plant parts [18].
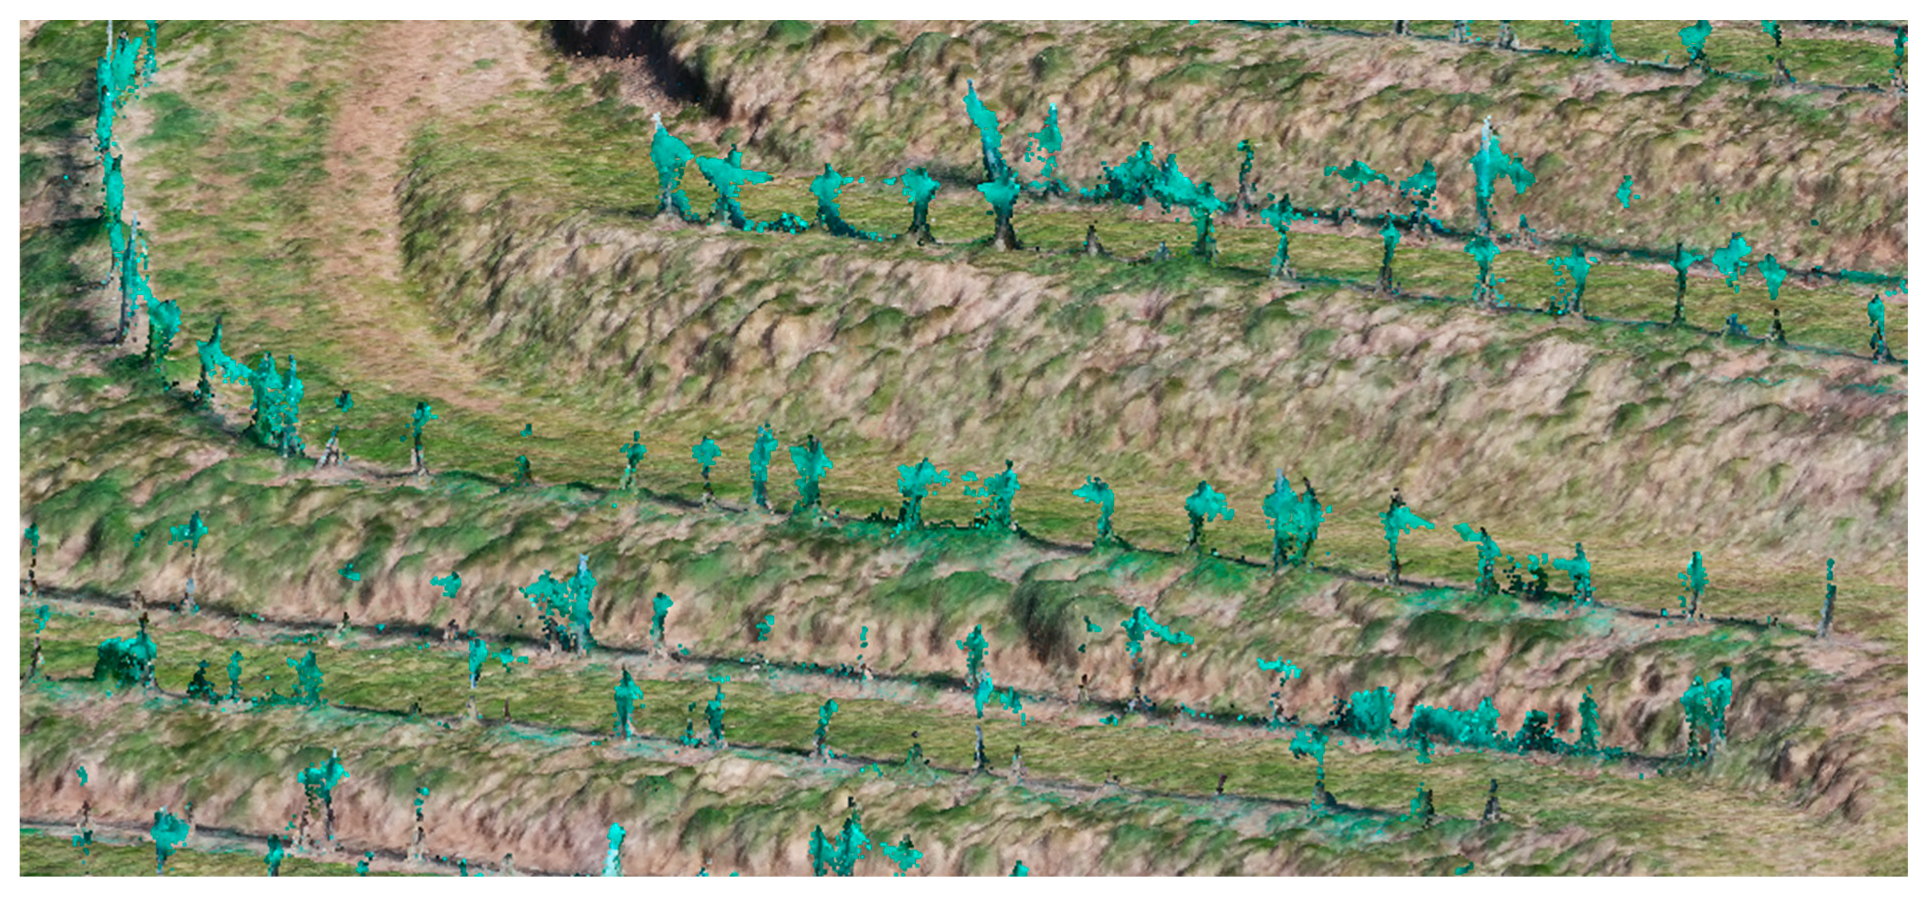
In Figure 4, a portion of the 3D point cloud used for vine location detection is shown.
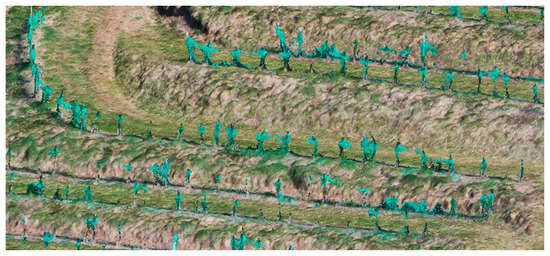
Figure 4.
Portion of the 3D point cloud recorded in April 2023 showing the vine in the phenological stage EL 1-3. Bird exclusion netting is placed around the trunks of the vines all year around.
Bird exclusion netting is folded around the trunks all year around. For the task of deriving single vine locations, oblique UAS missions were performed together with nadir missions, where the camera angle was set to 45° and 90°, respectively. In order to keep the computing time of the devices within the limits, a smaller part of the point cloud was used for the derivation of the individual positions of the vines. This part consisted of a series of vines with different spacing. A planar mesh surface was adapted to the 3D point cloud, which should form the base surface for the further analysis. Subsequently, the distance of the point cloud to the automatically generated mesh surface was calculated, with the maximum values of this calculation reflecting the top of the vine stems. In the scalar field of the individual vine stems, all X, Y, and Z values of the individual points were stored. The maximum Z values of the grapevine trunk clusters were used, and the X and Y coordinates of the maximum Z-values were stored, respectively.
The exported coordinates of the maximum distance between the surface and point cloud are georeferenced in the Austrian geodetic system Lambert ETRS 1989, and they show the locations of the individual vines at heights of about 20 cm (Figure 5). Up to this distance, the vine trunks are vertical and do not show any significant slope angles.
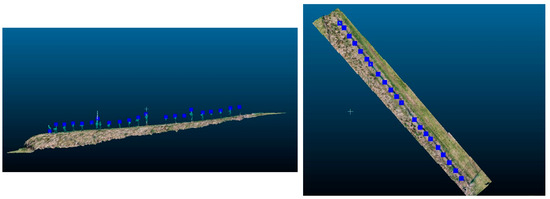
Figure 5.
(Left): The maximal values of the mesh to cloud distance calculation represent the tips of the individual vine trunks. (Right): The nadir view of the calculated maximal values of the mesh to cloud distance calculation.
2.4.2. Leaf Surface Area, Leaf Area Index, and Vine Height Derivation
The canopy architecture of the vines plays an important role in the domain of precision viticulture. Having geometric parameters of the vines at hand enables viticulturists to perform biomass calculations to assess vine heights and leaf surface area metrics that are of great importance when applying the right amount of fertilizer and for the optimization of canopy treatment practices. Information about canopy architecture at the vine level enables farmers to undertake regulation procedures targeted at a vine-specific location rather than a larger scale of their vineyard [11].
Automated derivations of vine heights were produced for the entire study area. In an effort to obtain canopy-associated metrics, a specific row of grapevines was designated as the experimental area. Rather than conducting a comprehensive analysis covering the entire vineyard, this targeted approach was based on considerations of time efficiency and the limitations posed by finite computational resources. Vine row localization is an important first task in precision viticulture that enables researchers to shift the focus from the vineyard level to the single-vine level by determining the exact extent of the plants under investigation [22]. To discriminate the vine rows from other objects in the scene, the 3D point cloud was used. A cloth filter algorithm was applied to the 3D point cloud that extracted ground from non-ground points by applying a cloth simulation [23]. The scene selection was utilized to illustrate relief-like terrain, with the cloth resolution adjusted to 1.5 cm to match the cell size of the DSM. A z-classification threshold of 0.15 m was set. The algorithm flipped the original point cloud and then constructed a flexible plane over the surface, turning it “upside down”. By analyzing the distances between the knots of the cloth and the points in the 3D point cloud, the final shape of the cloth could be determined and used for point cloud classification in two sets, namely, ground and non-ground points [24]. Two surfaces were generated. A digital terrain model (DTM) indicated the topography of the ground surface and a DSM indicated the total height of objects, stored per pixel. Both surfaces had a cell size of 1.5 cm. By performing a raster difference calculation, a normalized digital surface model (nDSM) was created. The nDSM represented the relative height of objects above the bare ground surface [25]. The DTM represented the absolute heights relative to mean sea level, referenced to a reference geoid. In the current study, the reference geoid was the GRS80 ellipsoid. The nDSM surface showed the absolute heights of all objects in the research area. In order to distinguish the vine vegetation from other objects in the scene, a multi-threshold segmentation approach was used. The multi-threshold segmentation algorithm was implemented in eCognition Developer 10.3 (Trimble, Munich, Germany). This procedure segments image objects in a top-down segmentation approach based on pixel value thresholds. The thresholds are user-defined and are based on the knowledge that all elevated objects are possible candidate vines, and all non-elevated objects are not considered for further analysis.
The scene was segmented to isolate elevated image objects from non-elevated ones. To classify the vine row image objects and analyze their geometric and spectral features, a class assignment method was utilized. This approach involved employing multiple thresholds for the classification of the image objects. Classes were assigned to the elevated image objects. The classification algorithm makes use of the nDSM raster surface and the respective standard deviation values. Pruned vineyard rows were assigned nDSM standard deviations < 1. Bushes and trees were assigned nDSM standard deviations > 1 because of their free-growing nature, where no pruning takes place. The algorithm classified all image objects above 4 m as high vegetation. Therefore, high trees were >4 m in height, indicating a height-based threshold set by the user. The algorithm then assigned classes to the elevated image objects and isolated the vine vegetation from other entities in the scene. To make the algorithm for vineyard row classification more robust, a multispectral orthomosaic was used. The weighted difference vegetation index (WDVI) was calculated as shown in Equations (1) and (2):
where NIR represents the processed reflection values of the NIR-band; a represents the slope of the soil line; and red represents the processed reflection values of the red-band.
The WDVI aided in distinguishing between non-vegetated objects and vegetation, assisting in the classification algorithm by considering the spectral properties specific to grape vines. The index especially considered that the ratio between NIR and red spectral values on bare soil pixels was consistent and independent of soil moisture. Furthermore, the WDVI (Equations (1) and (2)) was less sensitive to inter-row vegetation in comparison to the normalized difference vegetation index (NDVI). Because of this, UAS-based WDVI imagery could yield a better separation of soil and vine pixels [26]. WDVI values > 0 correlated with vegetation and values < 0 correlate with bare soil or human-made objects [27]. Taken together, the mean nDSM values, the nDSM standard deviation, and the WDVI-values were used to create image objects representing vines. In Figure 6, the calculated vine heights are shown. The image objects representing vines were used to mask the nDSM raster surface, resulting in a vine height raster (Figure 7).
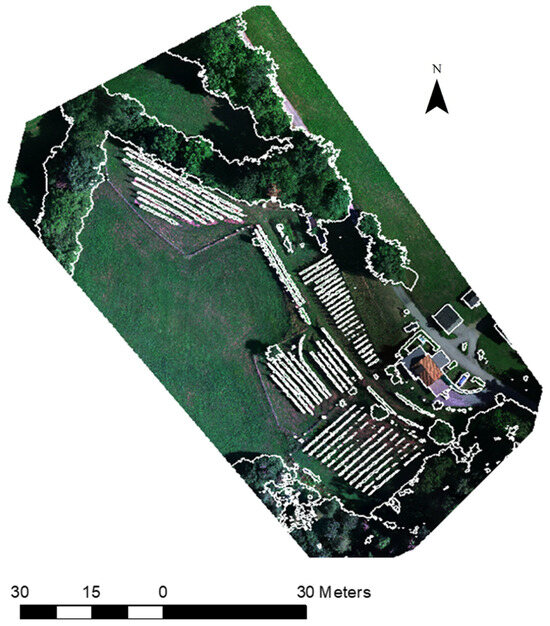
Figure 6.
The image objects created with the multi-threshold segmentation approach.
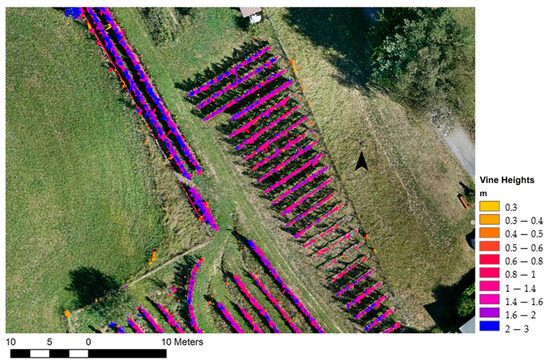
Figure 7.
The automatically derived vine heights in meters for possible nutrient supply calculation or other resource optimization problems, like pruning management.
To isolate the leaf surface points in the 3D point cloud while excluding grape clusters, a color filtering algorithm was employed. This algorithm allowed for the selection of points within the point cloud that exhibited colors within the violet to blue spectrum ((red: 99; green: 81; blue: 122)–(red: 50; green: 62; blue: 114)) to represent grape clusters. Points within the green to yellow color range ((red: 69; green: 114; blue: 66)–(red: 160; green: 156; blue: 67) were categorized as leaf points, representing the vine canopy. Additionally, to facilitate precise analysis at the individual vine level as opposed to a row-based metric, the knowledge of vine trunk locations was utilized. The 3D point cloud was segmented into individual vines based on the locations of trunks derived beforehand. This segmentation approach enabled the computation of geometric parameters for each individual vine. A strip threshold of 0.5 m was applied to the point cloud, resulting in the subdivision of the point cloud into discrete segments, each centered around a detected trunk. This approach ensured that the analysis was conducted at a fine-grained level, allowing for the derivation of accurate leaf surface measurements for each vine.
In Figure 8, a snippet of the 3D point cloud is shown. The right image shows the detected grape clusters based on their RGB values that were subtracted from the point cloud in order to calculate the LSA of leaf points only.
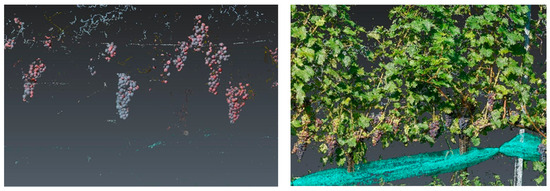
Figure 8.
(Left): Three-dimensional point cloud collected 1 h before harvest. (Right): The filtered grape cluster points from the same point-cloud at the same location.
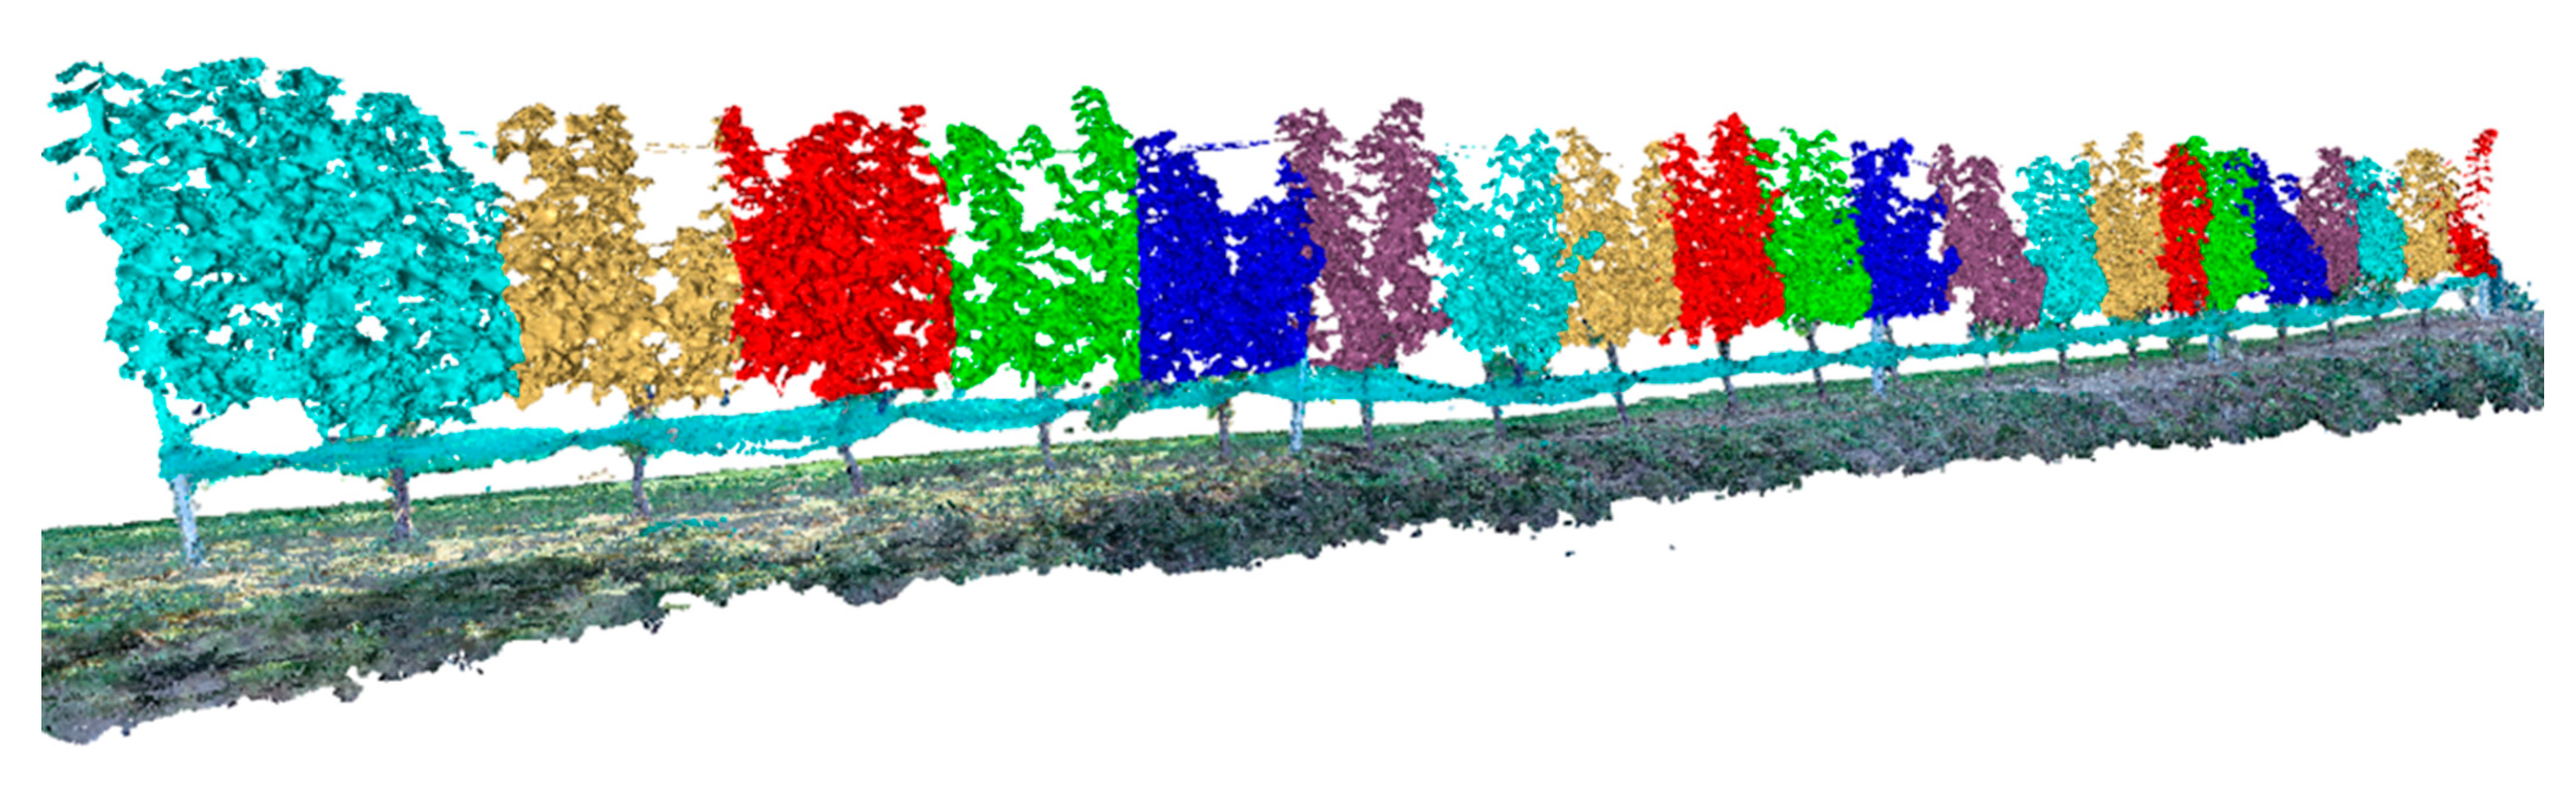
Leaf points were segmented using a 0.5 m threshold, delineating them between the detected trunk locations. Subsequently, a mesh representing the entire canopy of the vineyard row was generated (Figure 9). This process yielded a segmented mesh for each individual vine within the investigated row. The mesh was then employed to determine the LSA. For further analysis, the one-sided leaf area was used. The LSA was therefore divided by a factor of 2. The LSA calculation was automated through the use of Leica Cyclone 3DR Software (Leica Geosystems AG, St. Gallen, Switzerland). The algorithm computed the surface area in square meters for each mesh segment corresponding to every vine in the row and their leaf canopy without grape cluster areas. Those metrics were then used to determine the LAI for every vine along the row under investigation. The LAI is an important metric when characterizing the canopy–atmosphere relation where the energy of the plant is exchanged [28]. By using the estimated LSA per plant and the shape area of the vine segmentation results collected with the OBIA approach, it was possible to calculate the LAI for every vine using the following Equation (3):
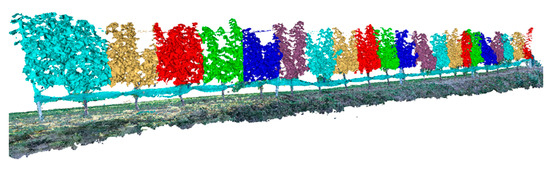
Figure 9.
The created mesh computed with the leaf points only, used for the calculation of canopy-related metrics like leave surface area and LAI.
According to Equation (3) [29], the overshadowed ground area corresponds to the results of the vine segmentation determined using the nDSM and the calculated WDVI, together with a multi-threshold segmentation approach and the class assignment of the OBIA framework. Those metrics contained the ground surface that the vine occupied from the soil area underneath in a nadir viewing angle.
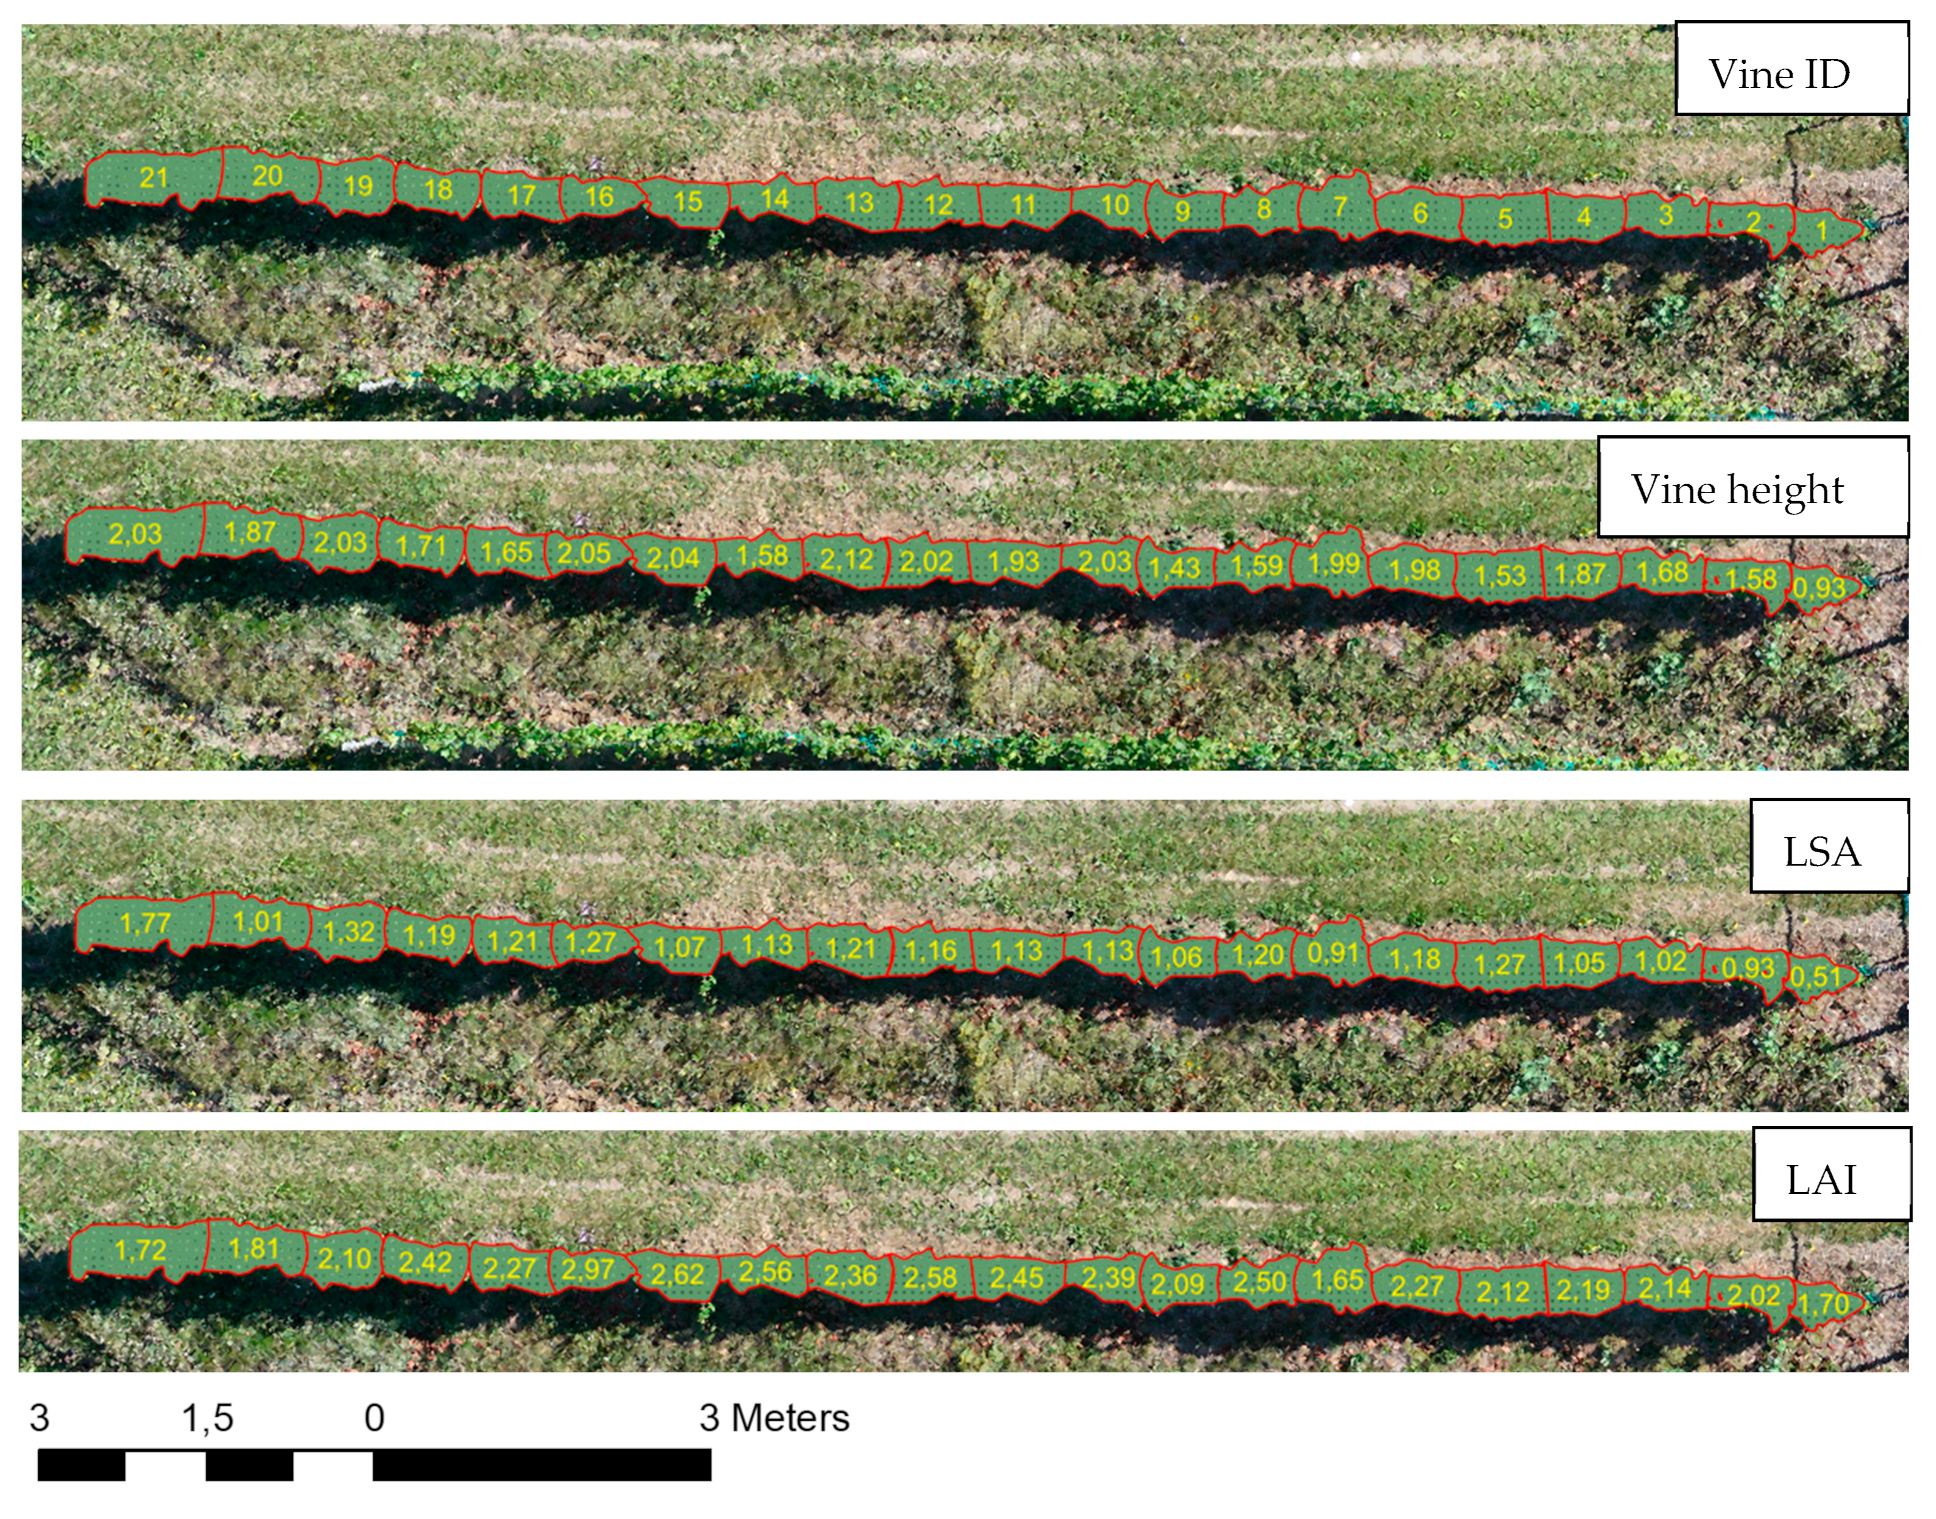
The parameters shown in Figure 10 were derived at a single-vine level by going through the analysis steps shown in the methodological diagram (see Figure 3). The findings and results are validated and discussed in the following sections.
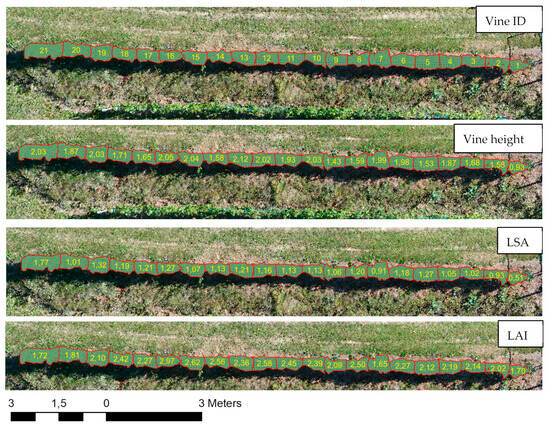
Figure 10.
Parameters derived at the vine level.
3. Validation
The estimation of vine parameters is pivotal in viticulture for informed decision making. The vine-related parameters could serve as indicators of vine health, growth, and productivity, offering valuable insights for optimizing vineyard management practices. Validation is a critical step in ensuring the robustness and applicability of the derived values to real-world vineyard conditions. It involves a comprehensive assessment against ground truth measurement. Through this validation process, the aim is to assess the accuracy, precision, and overall performance of the employed techniques, ultimately enhancing the reliability of the findings. Here, a systematic approach to validation, encompassing field data collection, statistical analyses, and comparative studies, is presented. Specific challenges encountered during the validation process are highlighted, and potential sources of error that may influence the accuracy of the derived parameters are discussed. Through this validation framework, a solid foundation is established for the subsequent interpretation and application of the derived ecosystem structures of vines.
In Figure 11, the reference vine points are visually displayed together with the derived vine points using the 3D point cloud approach, where the maximum z coordinate of the mesh to cloud distance was used to report the respective X and Y coordinates, which resulted in the X, Y, Z location of the top of the vine trunks.
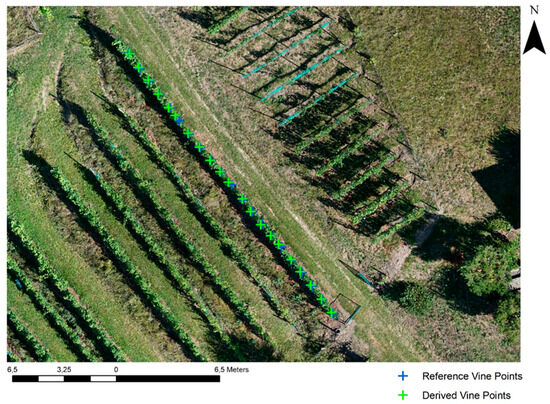
Figure 11.
Comparison of the derived vine points and the reference vine points.
The average distance from the reference points to the observed vine points measured 10.7 cm (Table 1). The vine detection method offers an automated solution, making it highly practical for applications in vineyards. It enables the efficient counting of single vines, precise vine localization for yield and vigor assessments, and the tracking of missing plants over successive years. This is a solution to the task that proves challenging with manual approaches due to the intertwining growth of plants, making the clear delineation of single plants difficult. For the derivation of vine locations, a root mean square error (RMSE) was calculated as follows:
where n is the number of distances observed, di is the distance between a reference point and the derived vine location for each vine, and mean(d) is the mean overall distance. For the vine location calculation, an RMSE of 1.707 was calculated, which represents the average discrepancy between the derived vine points and the reference measurements.

Table 1.
Euclidian distance from the derived vine location to the reference measurement.
The validation of the automatically derived vine height, using an OBIA framework approach that included several analysis steps within a ruleset built using eCognition Developer 10.3 Software, was performed by comparing the derived vine heights to manual measurements across the whole vineyard. Measurement locations were measured using the Leica Viva GS16 GNSS-Rover with an accuracy of 10 mm. The reference measurements were compared to the derived vine heights at the same location.
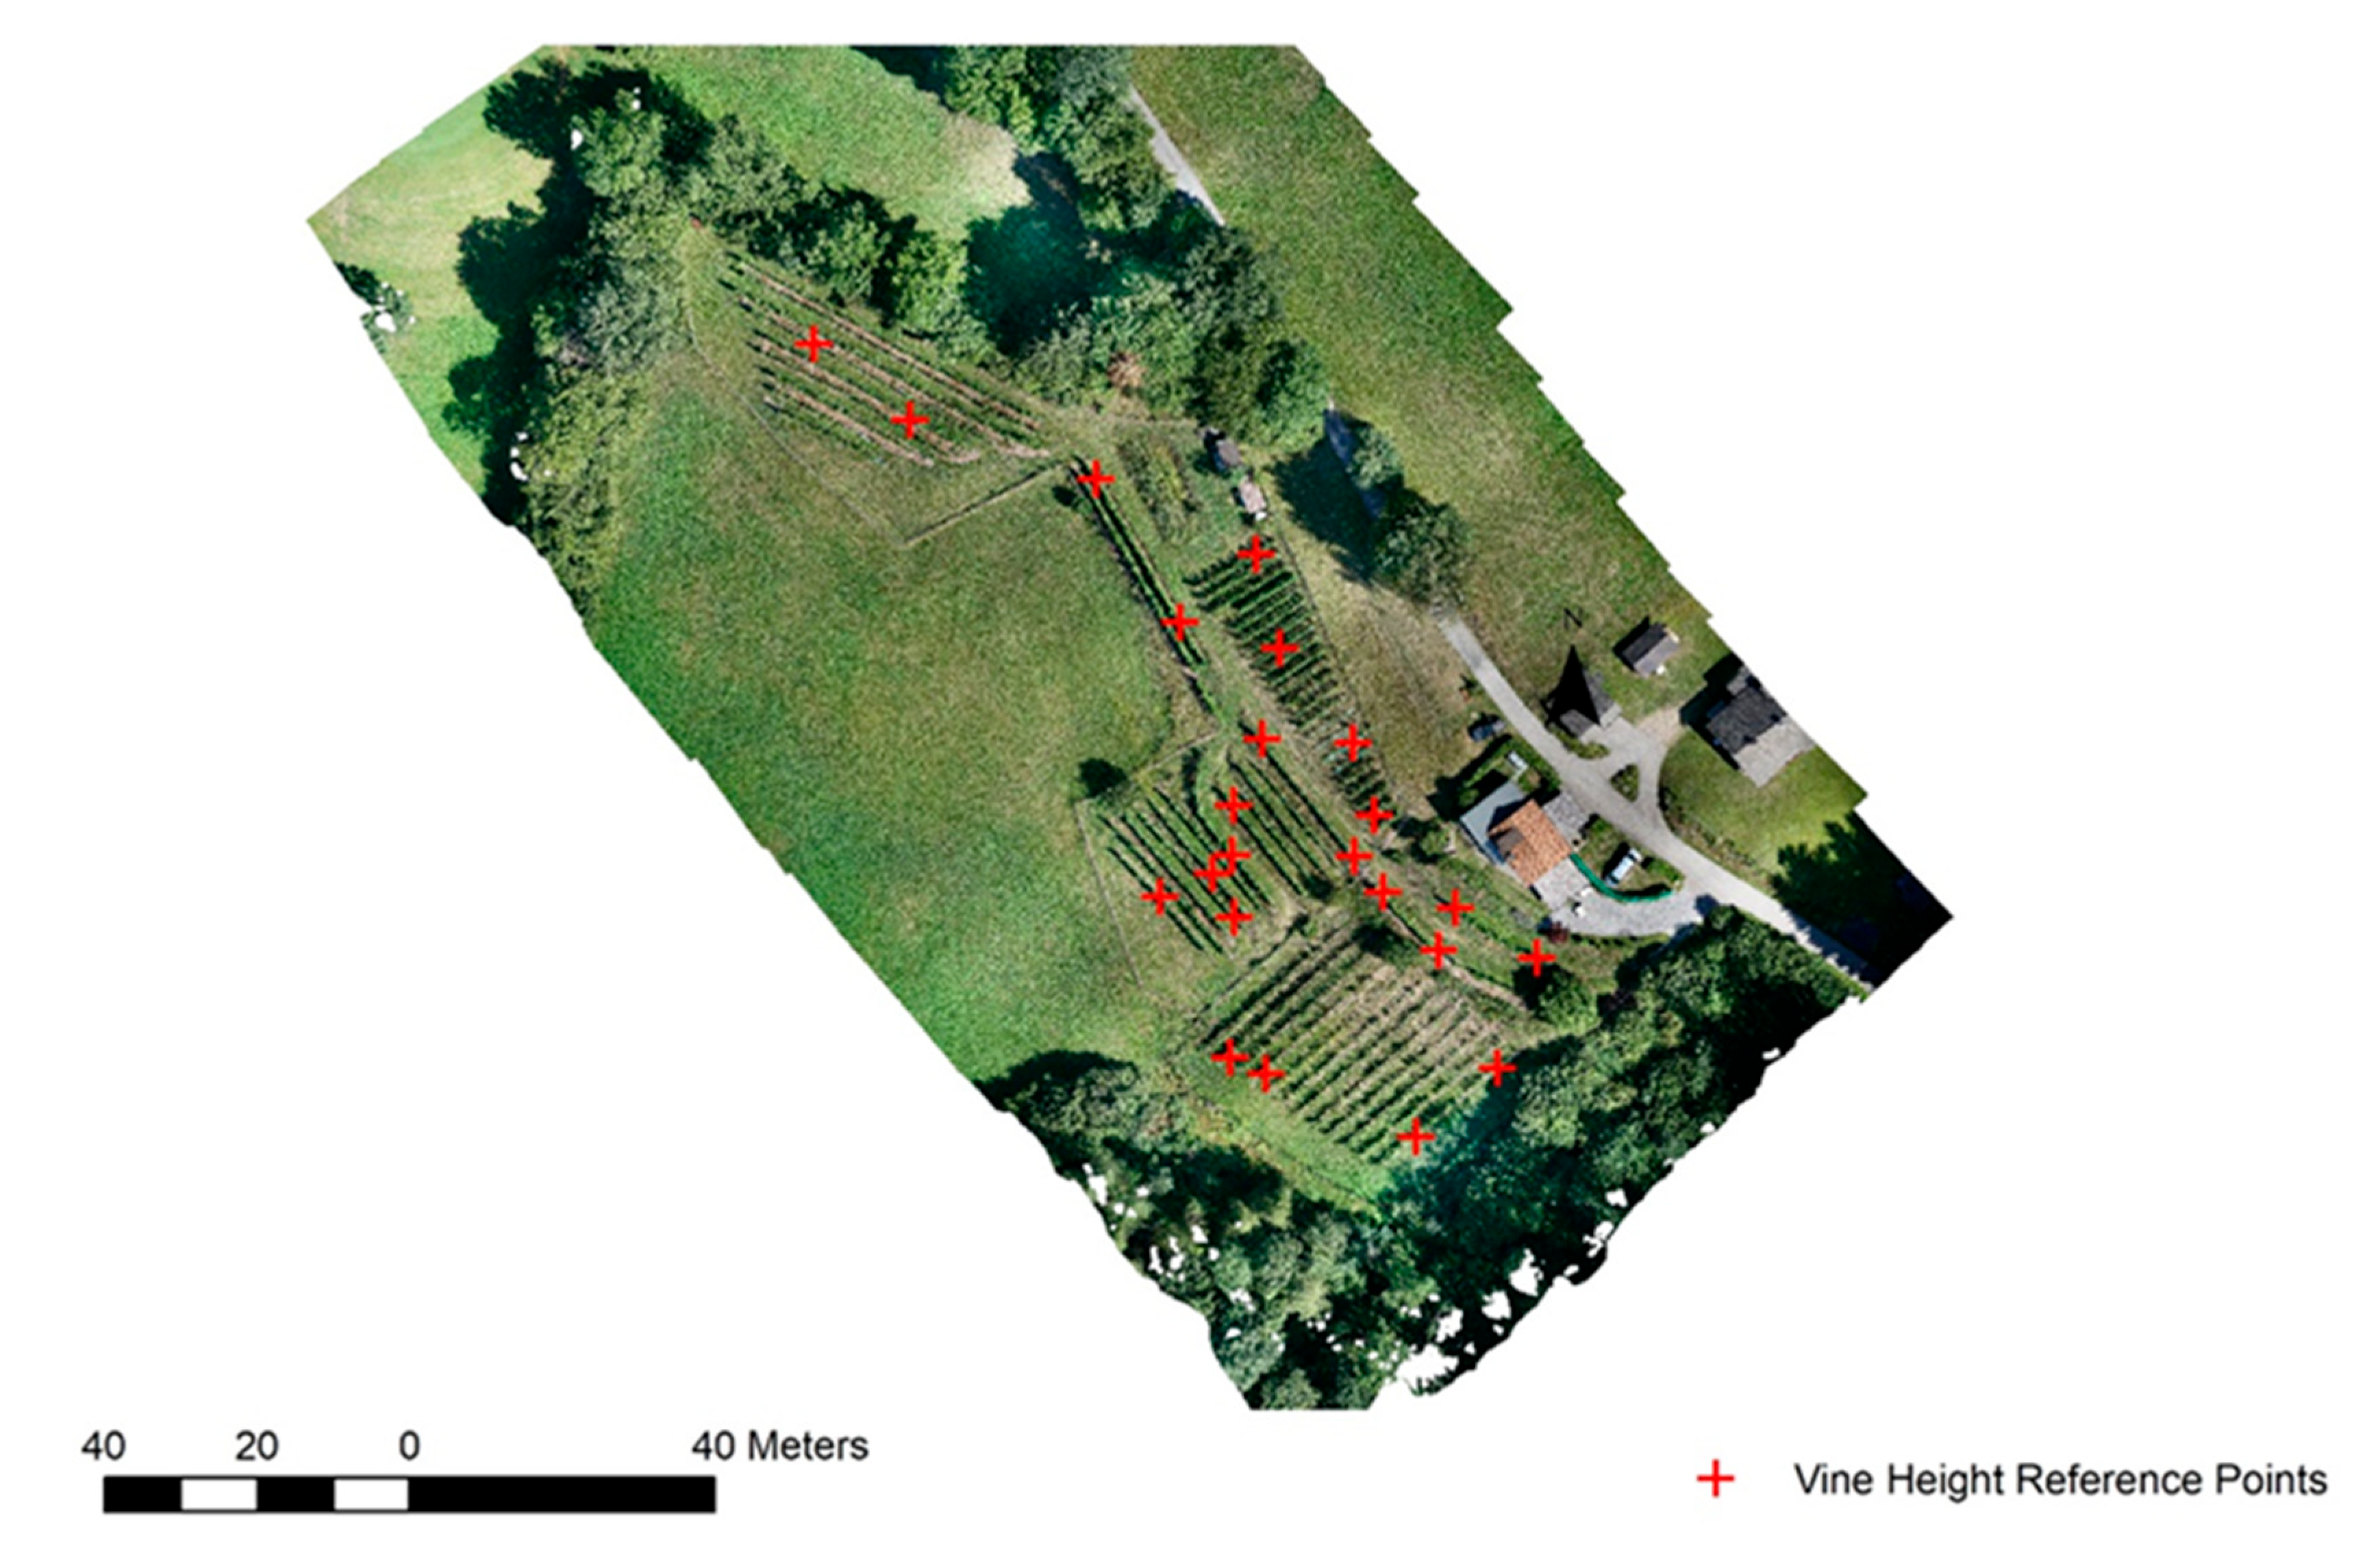
Ground-level measurements were conducted at 23 different points across the vineyard, as shown in Figure 12, to assess the accuracy of the derived vine heights. This evaluation also aimed to gauge the effectiveness of the OBIA approach in segmenting the vine vegetation. Field measurements were specifically taken at locations with active vine growth. In areas without vine growth, the nDSM yielded a value of 0. A vine height reference point registering a value of 0 may signify potential bias in the segmentation process, warranting further scrutiny and refinement.

Figure 12.
Locations of the 23 vine height reference measurements.
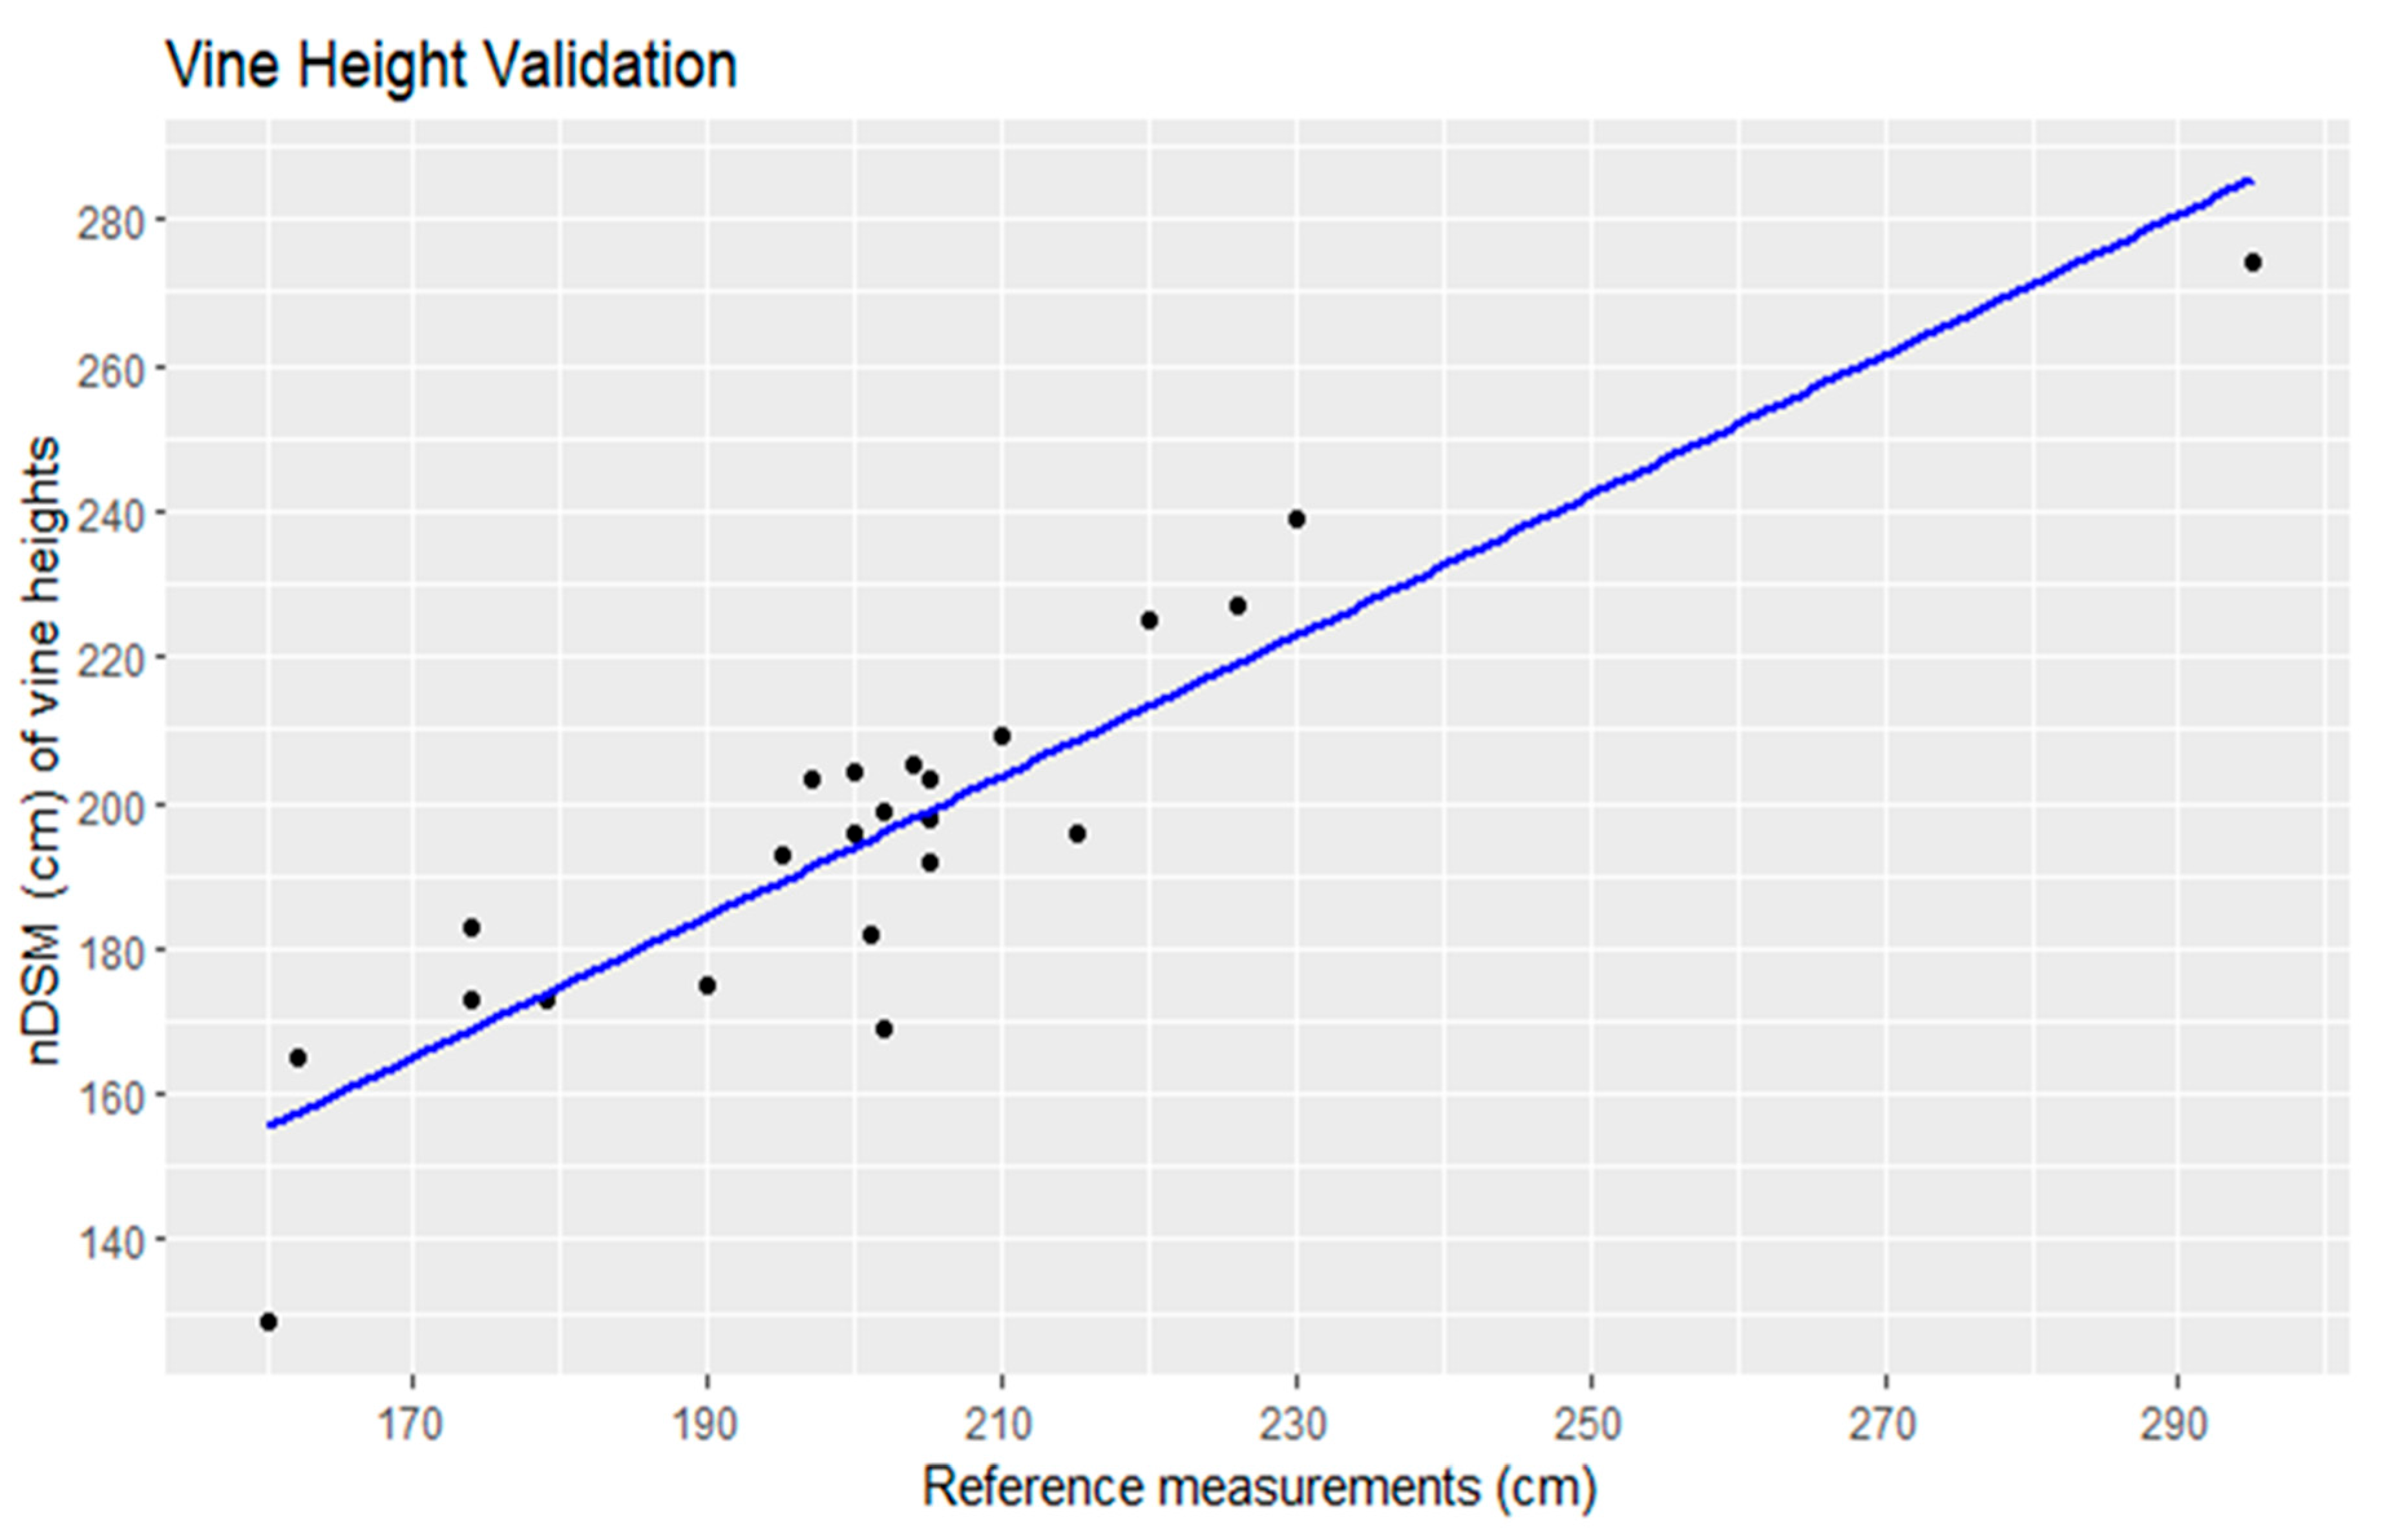
Linear regression analysis comparing manually measured vine heights to heights automatically derived from a nDSM was performed on a dataset comprising 23 data points (Figure 13). The coefficient of determination (R2) was found to be 0.83, indicating a strong positive correlation between the two sets of measurements. This suggests that the derived vine heights were highly predictive of the manually measured values. The regression equation provides a mathematical representation of this relationship. Specifically, for every unit increase in the automatically derived vine height, there was an associated 0.96 cm increase in the manually measured vine height, with an additional constant offset of 1.37 cm [30]. These findings affirm the validity and accuracy of the vine height estimation approach and underscore its potential utility in vineyard management and related applications.
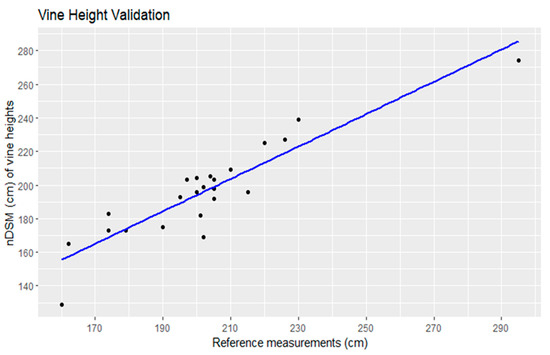
Figure 13.
Linear regression of the vine height validation.
The validation of the leaf area index (LAI) in the vineyard will be deferred to a subsequent stage due to the unavailability of an LAI measurement device, such as a ceptometer or LAI-2200 Plant Canopy Analyzer. Similarly, the validation of the leaf area will also be postponed. This is attributed to the labor-intensive nature of obtaining analog measures of one-sided leaf area, which will be addressed in subsequent phases of the study. It is important to note that these measures, while currently assumed, are based on established methodologies and demonstrate technical feasibility within the scope of this research.
4. Discussion
This study has delved into various aspects of vineyard ecosystem analysis, encompassing the derivation of the location of single vines, vine heights, computation of the LAI, and determination of the LSA. Each of these steps presented its own set of challenges and considerations, from the segmentation processes to the technical nuances of data acquisition. One objective is to discern any patterns or relationships among these parameters that could potentially illuminate the dynamics of the vineyard environment. A correlation matrix analysis holds promise in providing valuable insights into the interplay of these variables.
The detection of individual grape vines was based on the 3D point cloud of the study vineyard generated in April 2023. In early spring, the vines did not show any leaves, making it possible to scan the woody part of the plants for structure. Based on the assumption that every vine trunk belonged to a single vine, a surface was generated and applied at the base of the trunks. The computation of the distance from the base surface to the top of the trunks made it possible to extract the z maximum for every vine and the respective X, Y, Z coordinates. The validation showed a mean distance from the reference points to the observed location of 10.7 cm. This value shows the real possibility of detecting vines using UAS techniques. Because of computing power constraints, the algorithm was tested on one vineyard row containing 21 vines. In future work, it would be of great interest to test this approach in a different vineyard to check the robustness of the method. One methodological issue is that vines do not grow perfectly vertically. A height-based threshold of 25 cm from the surface was introduced to make sure that the z maximum value would be derived from the trunk and not any branch of the vine. But if the stem were to have an extreme growing angle, the distance to the reference point, which is taken at the ground level of the stems, would be higher.
The derivation of vine heights was based on the computation of the NDVI and an OBIA approach for the classification of vines. The surface model was established using a DTM together with a DSM. Usually, to compute a DTM, a LiDAR device is used, since the laser has the ability to penetrate through the tree cover and record the bare soil [31]. For this project, no UAS-LiDAR was available, which made it necessary to compute the nDSM based on photogrammetric UAS datasets. The use of the cloth filtering algorithm in CloudCompare v2.12.4, together with an interpolation method to close holes, made it possible to generate a DTM from the photogrammetry data. This method shows that it is possible to perform a task that is typically performed using a LiDAR device with lower-cost equipment. After the use of the OBIA framework to distinguish the vine morphology from all other objects, it was possible to use the image object outlines to mask the nDSM and obtain the height values only for vine vegetation across the whole vineyard. The R2 value of the linear regression on the reference measurements and the observed vine heights was 0.83, indicating a strong correlation of the automatically derived vine heights with the real-world scenario. The computation of the LAI and the LSA could not be validated over the course of this study. A follow-up study on LAI and LSA is currently in progress. This procedure can only be carried out post-harvest, since the removal of all leaves could impede grape development. As shown in Figure 14, correlation matrix was used to display possible relationships among the collected parameters in the vineyard. The matrix was computed using the R-Studio software and an applicable R scripting language. Upon examination of the correlation matrix, some associations emerged. The LAI had a correlation coefficient of 0.22 to the observed LSA. The correlation was not strong, but could still imply that the LAI changes with changing leaf cover and pruning techniques. The overshadowed area, which is the areal extent of the vine plants from the nadir view (polygonal area of the OBIA segmentation) and leaf area, demonstrated a notably strong positive correlation, registering at 0.79. This relationship suggests a significant interdependence between these two variables, signifying that, as the overshadowed area increases, so does the leaf area. Further, a correlation coefficient of 0.58 was observed between the vine height and the leaf area, indicating a moderate positive correlation. This finding suggests that, as the vine height increases, there is a tendency for leaf area to also increase, albeit with a moderate strength of association.
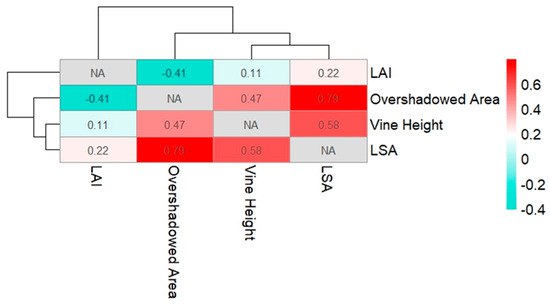
Figure 14.
The matrix displays the correlation coefficients between the variables. Strong correlations are shown in dark red shades.
The initial correlation coefficients extracted from the correlation matrix serve as a foundation for a more in-depth exploration of relationships within the vineyard ecosystem. This study lays the groundwork for the development of a yield prediction model, leveraging the observed correlations between key variables. By employing these coefficients as a starting point, a future aim will be to construct a predictive framework that can forecast harvest weight based on factors such as leaf area, vine height, and other relevant metrics. This paper demonstrates the technical feasibility of the study’s approaches, demonstrating the potential for advanced analytics to inform precision viticultural practices and enhance decision making in vineyard management.
5. Conclusions and Future Work
Over the course of this study, a multitude of ecosystem structure parameters were systematically collected at the studied vineyard. The precise localization of individual vines was achieved through the analysis of a 3D point cloud generated at an early phenological stage, focusing exclusively on the woody structures of the plants. Subsequently, vine heights spanning the entire vineyard were extracted from the resultant nDSM, which was computed from a DTM using a robust cloth filtering method. The segmentation of vine vegetation and its differentiation from other objects in the scene were executed through an OBIA framework, leveraging the geometrical attributes of the vines. Additionally, the computation of LAI and LSA was predicated using 3D point cloud analyses, capitalizing on the high-resolution data obtained through cross-grid flights and oblique data-capturing methods. Although timing constraints precluded the validation of the latter parameters, these methodologies demonstrate technical feasibility in acquiring geometric and morphological datasets from RGB-equipped UAS platforms. Looking ahead, the research will extend into the incorporation of multispectral data, soil-specific data, and satellite data, promising to further enrich our understanding of vineyard dynamics and providing a more comprehensive assessment of physiological parameters. The correlation matrix shows the interaction of the derived parameters at a single time point in the development cycle of the vine plants. Future projects will analyze the monthly changes in the vine plants and thus create a basic concept for a harvest prediction model.
Author Contributions
Conceptualization, S.R., S.L. and G.P.; methodology, S.R. and G.P.; software, S.R.; validation, S.R., S.L. and G.P.; formal analysis, S.R.; investigation, S.R., S.L. and G.P.; resources, G.P.; data curation, S.R.; writing—original draft preparation, S.R.; writing—review and editing, S.R.; visualization, S.R.; supervision, S.L. and G.P.; project administration S.L. and G.P.; All authors have read and agreed to the published version of the manuscript.
Funding
This research received no external funding.
Institutional Review Board Statement
Not applicable.
Informed Consent Statement
Not applicable.
Data Availability Statement
Datasets available on request from the authors.
Acknowledgments
The authors want to thank Harald Lagger for making it possible to access the vineyard at any time for data capturing and reference measurements, and for providing valuable reference datasets at the harvest stage of the vines. Thanks to Ulf Scherling from the SIENA research Team, for performing the data collection missions in the field. The printing costs were kindly supported by the Paris Lodron University Salzburg.
Conflicts of Interest
The authors declare no conflict of interest.
References
- Sassu, A.; Gambella, F.; Ghiani, L.; Mercenaro, L.; Caria, M.; Pazzona, A.L. Advances in Unmanned Aerial System Remote Sensing for Precision Viticulture. Sensors 2021, 21, 956. [Google Scholar] [CrossRef] [PubMed]
- Karakizi, C.; Oikonomou, M.; Karantzalos, K. Spectral Discrimination and Reflectance Properties of Various Vine Varieties from Satellite, UAV and Proximate Sensors. Int. Arch. Photogramm. Remote Sens. Spat. Inf. Sci. 2015, XL-7/W3, 31–37. [Google Scholar] [CrossRef]
- Giovos, R.; Tassopoulos, D.; Kalivas, D.; Lougkos, N.; Priovolou, A. Remote Sensing Vegetation Indices in Viticulture: A Critical Review. Agriculture 2021, 11, 457. [Google Scholar] [CrossRef]
- Torres-Sanchez, J.; Mesas-Carrascosa, F.J.; Santesteban, L.G.; Jimenez-Brenes, F.M.; Oneka, O.; Villa-Llop, A.; Loidi, M.; Lopez-Granados, F. Grape Cluster Detection Using UAV Photogrammetric Point Clouds as a Low-Cost Tool for Yield Forecasting in Vineyards. Sensors 2021, 21, 3083. [Google Scholar] [CrossRef] [PubMed]
- Dunn, G.M.; Martin, S.R. Yield prediction from digital image analysis: A technique with potential for vineyard assessments prior to harvest. Aust. J. Grape Wine Res. 2008, 10, 196–198. [Google Scholar] [CrossRef]
- Jurado, J.M.; Pádua, L.; Feito, F.R.; Sousa, J.J. Automatic Grapevine Trunk Detection on UAV-Based Point Cloud. Remote Sens. 2020, 12, 3043. [Google Scholar] [CrossRef]
- Tinkham, W.T.; Swayze, N.C. Influence of Agisoft Metashape Parameters on UAS Structure from Motion Individual Tree Detection from Canopy Height Models. Forests 2021, 12, 250. [Google Scholar] [CrossRef]
- Manousakis, J.; Zekkos, D.; Saroglou, F.; Clark, M. Comparison of uav-enabled photogrammetry-based 3D point clouds and interpolated dsms of sloping terrain for rockfall hazard analysis. Int. Arch. Photogramm. Remote Sens. Spat. Inf. Sci. 2016, XLII-2/W2, 71–77. [Google Scholar] [CrossRef]
- Marín-Buzón, C.; Pérez-Romero, A.; López-Castro, J.L.; Ben Jerbania, I.; Manzano-Agugliaro, F. Photogrammetry as a New Scientific Tool in Archaeology: Worldwide Research Trends. Sustainability 2021, 13, 5319. [Google Scholar] [CrossRef]
- Müllerová, J.; Gago, X.; Bučas, M.; Company, J.; Estrany, J.; Fortesa, J.; Manfreda, S.; Michez, A.; Mokroš, M.; Paulus, G.; et al. Characterizing vegetation complexity with unmanned aerial systems (UAS)—A framework and synthesis. Ecol. Indic. 2021, 131, 108156. [Google Scholar] [CrossRef]
- Matese, A.; Di Gennaro, S.F.; Miranda, C.; Berton, A.; Santesteban, L.G. Evaluation of spectral-based and canopy-based vegetation indices from UAV and Sentinel 2 images to assess spatial variability and ground vine parameters. Adv. Anim. Biosci. 2017, 8, 817–822. [Google Scholar] [CrossRef]
- Poblete, T.; Ortega-Farias, S.; Moreno, M.A.; Bardeen, M. Artificial Neural Network to Predict Vine Water Status Spatial Variability Using Multispectral Information Obtained from an Unmanned Aerial Vehicle (UAV). Sensors 2017, 17, 2488. [Google Scholar] [CrossRef]
- de Castro, A.; Jiménez-Brenes, F.; Torres-Sánchez, J.; Peña, J.; Borra-Serrano, I.; López-Granados, F. 3-D Characterization of Vineyards Using a Novel UAV Imagery-Based OBIA Procedure for Precision Viticulture Applications. Remote Sens. 2018, 10, 584. [Google Scholar] [CrossRef]
- Mesas-Carrascosa, F.-J.; de Castro, A.I.; Torres-Sánchez, J.; Triviño-Tarradas, P.; Jiménez-Brenes, F.M.; García-Ferrer, A.; López-Granados, F. Classification of 3D Point Clouds Using Color Vegetation Indices for Precision Viticulture and Digitizing Applications. Remote Sens. 2020, 12, 317. [Google Scholar] [CrossRef]
- Moreno, H.; Andújar, D. Proximal sensing for geometric characterization of vines: A review of the latest advances. Comput. Electron. Agric. 2023, 210, 107901. [Google Scholar] [CrossRef]
- Llorens, J.; Gil, E.; Llop, J.; Escolà, A. Variable rate dosing in precision viticulture: Use of electronic devices to improve application efficiency. Crop Prot. 2010, 29, 239–248. [Google Scholar] [CrossRef]
- Jiang, R.; Wang, P.; Xu, Y.; Zhou, Z.; Luo, X.; Lan, Y.; Zhao, G.; Sanchez-Azofeifa, A.; Laakso, K. Assessing the Operation Parameters of a Low-altitude UAV for the Collection of NDVI Values Over a Paddy Rice Field. Remote Sens. 2020, 12, 1850. [Google Scholar] [CrossRef]
- Westover, F. Grapevine Phenology Revisited. Available online: https://winesvinesanalytics.com/features/article/196082/Grapevine-Phenology-Revisited (accessed on 1 July 2022).
- Daniels, L.; Eeckhout, E.; Wieme, J.; Dejaegher, Y.; Audenaert, K.; Maes, W.H. Identifying the Optimal Radiometric Calibration Method for UAV-Based Multispectral Imaging. Remote Sens. 2023, 15, 2909. [Google Scholar] [CrossRef]
- Agisoft. Agisoft Metashape User Manual: Professional Edition, Version 2.0; Agisoft LLC.: Saint Petersburg, Russia, 2023. [Google Scholar]
- Westoby, M.J.; Brasington, J.; Glasser, N.F.; Hambrey, M.J.; Reynolds, J.M. ‘Structure-from-Motion’ photogrammetry: A low-cost, effective tool for geoscience applications. Geomorphology 2012, 179, 300–314. [Google Scholar] [CrossRef]
- Biglia, A.; Zaman, S.; Gay, P.; Ricauda Aimonino, D.; Comba, L. 3D point cloud density-based segmentation for vine rows detection and localisation. Comput. Electron. Agric. 2022, 199, 107166. [Google Scholar] [CrossRef]
- Pricope, N.G.; Halls, J.N.; Mapes, K.L.; Baxley, J.B.; Wu, J.J. Quantitative Comparison of UAS-Borne LiDAR Systems for High-Resolution Forested Wetland Mapping. Sensors 2020, 20, 4453. [Google Scholar] [CrossRef] [PubMed]
- Zhang, W.; Qi, J.; Wan, P.; Wang, H.; Xie, D.; Wang, X.; Yan, G. An Easy-to-Use Airborne LiDAR Data Filtering Method Based on Cloth Simulation. Remote Sens. 2016, 8, 501. [Google Scholar] [CrossRef]
- Njambi, R. nDSMs: How Digital Surface Models and Digital Terrain Models Elevate Your Insights. Available online: https://up42.com/blog/ndsms-how-digital-surface-models-and-digital-terrain-models-elevate-your (accessed on 8 August 2023).
- Heidarian Dehkordi, R.; Denis, A.; Fouche, J.; Burgeon, V.; Cornelis, J.T.; Tychon, B.; Placencia Gomez, E.; Meersmans, J. Remotely-sensed assessment of the impact of century-old biochar on chicory crop growth using high-resolution UAV-based imagery. Int. J. Appl. Earth Obs. Geoinf. 2020, 91, 102147. [Google Scholar] [CrossRef]
- Comba, L.; Biglia, A.; Ricauda Aimonino, D.; Gay, P. Unsupervised detection of vineyards by 3D point-cloud UAV photogrammetry for precision agriculture. Comput. Electron. Agric. 2018, 155, 84–95. [Google Scholar] [CrossRef]
- Comba, L.; Biglia, A.; Ricauda Aimonino, D.; Tortia, C.; Mania, E.; Guidoni, S.; Gay, P. Leaf Area Index evaluation in vineyards using 3D point clouds from UAV imagery. Precis. Agric. 2019, 21, 881–896. [Google Scholar] [CrossRef]
- Zheng, G.; Moskal, L.M. Retrieving Leaf Area Index (LAI) Using Remote Sensing: Theories, Methods and Sensors. Sensors 2009, 9, 2719–2745. [Google Scholar] [CrossRef] [PubMed]
- Kumari, K.; Yadav, S. Linear regression analysis study. J. Pract. Cardiovasc. Sci. 2018, 4, 33–36. [Google Scholar] [CrossRef]
- Smreček, R.; Danihelová, Z. Forest stand height determination from low point density airborne laser scanning data in Roznava Forest enterprise zone (Slovakia). Iforest—Biogeosci. For. 2013, 6, 48–54. [Google Scholar] [CrossRef]


Disclaimer/Publisher’s Note: The statements, opinions and data contained in all publications are solely those of the individual author(s) and contributor(s) and not of MDPI and/or the editor(s). MDPI and/or the editor(s) disclaim responsibility for any injury to people or property resulting from any ideas, methods, instructions or products referred to in the content. |
© 2024 by the authors. Licensee MDPI, Basel, Switzerland. This article is an open access article distributed under the terms and conditions of the Creative Commons Attribution (CC BY) license (https://creativecommons.org/licenses/by/4.0/).