1. Introduction
Pharmacovigilance plays a critical role in ensuring the safety of medicinal products. In particular, the prediction of the seriousness level of adverse drug events can significantly aid in the monitoring of drug safety, leading to enhanced healthcare outcomes. This necessitates the development of robust, efficient, and accurate predictive models that leverage the wealth of data available in databases such as the FDA’s Adverse Event Reporting System (FAERS). The FAERS dataset provides a rich source of information, including active substance fields, patient demographics, and event-specific data. However, the multi-dimensional and heterogeneous nature of these data presents unique challenges in model development. Traditionally, such problems have been tackled through the selection of a subset of features that are deemed to be most relevant based on prior knowledge or statistical analysis. However, these methods do not fully exploit the potential of the entire dataset.
As presented in [
1], the primary goal of forecasting the severity of drug effects is to significantly improve the safety and effectiveness of new therapeutic treatments. This objective centers on recognizing and addressing severe adverse events that may arise during the drug development process. It is of paramount importance due to the frequent occurrence of unanticipated adverse events, which is a leading cause of high attrition rates in drug development. These unexpected occurrences, such as organ failure, cancer development, and even fatalities, are key factors contributing to the failure of clinical trials. The authors of [
2] explored nurses’ knowledge, attitudes, and behaviors concerning pharmacovigilance and the reporting of adverse drug reactions (ADRs), as well as the barriers they encounter. Among the barriers identified from the nursing perspective, the most prominent is a deficiency in knowledge and training, with nearly half of the respondents recognizing this as a significant issue. In [
3], the authors introduced a method for identifying additional patterns related to the chemical classes and biological target interactions of drug pairs. This entailed conducting an extra level of analysis on a substantial portion of the FAERS dataset to gain further insights into these interactions. As explained in [
4], AI progress holds promise in allowing for the automatic detection of adverse events in real time. Recent breakthroughs in deep learning and computer vision algorithms have already proven their ability to identify high-risk anatomical regions and possible surgical mistakes during the real-time analysis of laparoscopic surgical videos. Recently, natural language processing (NLP) has emerged as a powerful tool for extracting valuable information from textual data, enhancing the potential for greater insight from active substance fields. Additionally, the use of demographic and event information such as patient sex, healthcare provider qualification, and drug characterization can provide complementary information that bolsters the predictive power of the model.
In this study, we introduce a novel approach that combines layer-static-weighted attention and ascending feature selection techniques. Our ascending feature selection approach iteratively adds features based on their importance, aiming to exploit the wealth of available data. Simultaneously, our layer-static-weighted attention technique adjusts the model’s focus between NLP-derived and demographic features, emphasizing their relative importance in predicting the seriousness level of adverse drug events. Through this innovative integration of techniques, we aim to create a robust and effective model for predicting the seriousness level of adverse drug events within the FAERS dataset. This could lead to significant improvements in drug safety monitoring and ultimately contribute to enhanced patient care. The following are the contributions of the proposed paper:
Introduce and present a novel combination of layer-static-weighted attention and ascending feature selection techniques for the prediction of the seriousness level of adverse events within the FDA Adverse Event Reporting System (FAERS);
Utilize natural language processing (NLP) to analyze the terms within active substance fields and incorporate demographic and event-related information, including patient gender, healthcare provider qualifications, and drug characterization;
Demonstrate the continuous enhancement in prediction performance through the ascending feature selection method;
Apply the layer-static-weighted attention technique to dynamically adjust the model’s focus between NLP and demographic features, with optimal performance achieved at a balanced weight of 50%;
Construct a robust model that effectively predicts the seriousness levels of adverse events, offering significant potential for improving pharmacovigilance and enhancing drug safety monitoring.
The remaining paper is organized as follows:
Section 2 explains the major literature review for major drug event interactions and the prediction of adverse drug reactions.
Section 3 provides an explanation of the FAERS dataset with seriousness and non-seriousness of adverse events and word cloud visualization for top substances.
Section 4 explains the proposed methodology for data preprocessing, feature selection, and ascending feature selection for substance features and layered weighted attention.
Section 5 highlights the proposed model architecture for using different deep learning models with NLP to identify ADRs.
Section 6 explores the proposed algorithm of hybrid ascending feature selection with layer-static-weighted attention.
Section 7 provides the conducted results of ascending feature selection and layer-static-weighted attention.
Section 8 explores the conclusion and future works.
2. Related Works
The field of pharmacovigilance has experienced remarkable advancements with the advent of machine learning and natural language processing (NLP). Several studies have proposed different methodologies to harness the rich information present in adverse event reporting databases like the FAERS. The application of NLP in adverse event detection and classification has been a prominent trend. For instance, the authors of [
5] developed an approach using NLP and machine learning to automatically classify clinically relevant drug-related entities from medical case reports. However, these approaches predominantly focus on NLP features, often neglecting the value of other structured data present in such databases.
The authors of [
6] introduced a decision tree-based stratification approach that takes into account both patient and drug-related variables. This method excelled in signal detection compared to alternative methods, highlighting its efficacy in tackling data masking concerns and improving the precision of adverse drug reaction detection. The authors of [
7] explained the difficulty healthcare organizations face in predicting and preventing adverse events (AEs), which can result in severe harm or even death. While the United States has established systems like the FDA and FARES to track AEs, many countries, notably in the Middle East, lack such infrastructure. In [
8], the authors aimed to improve patient safety by addressing the issue of drug–drug interactions (DDIs). Their study aimed to reduce alert fatigue in healthcare settings by developing a machine learning framework to identify high-priority DDIs by extracting information from FDA adverse event reports. The method uses stacked autoencoders, weighted support vector machines, and an autoencoder-based semi-supervised learning algorithm to improve classification performance, outperforming other approaches. In [
9], the authors enhanced the pharmacovigilance’s ability to predict ADEs. They applied an information component-guided pharmacological network model (IC-PNM) as a novel approach to test the data from the FDA Adverse Event Reporting System (FAERS). To increase the precision of medication ADE predictions, the IC-PNM combines the advantages of two approaches. The researchers developed a method to predict which drugs are more likely to cause side effects.
In [
10], a new model was applied to identify medications that are more likely to result in side effects. Data were extracted from a bipartite network, where nodes stand for drugs and ADEs, and edges represent their connections. Their study aims to demonstrate the superior predictive capabilities using different ML models. The difficulty of predicting adverse drug reactions (ADEs) using electronic health records (EHRs) was presented in [
11]. EHRs are frequently too large and complex for conventional analysis techniques. Therefore, the dimensionality of the EHR data is reduced by using random indexing. Next, the authors evaluated the effect of random indexing on prediction accuracy by predicting ADEs using the RF model. Another method for detecting adverse drug events was presented in [
12]. The paper reported on a set of experiments that were carried out using clinical measurements from EHRs to identify patients with adverse drug events (ADEs). The accuracy and AUC of the predictive models the researchers created were assessed using the random forest algorithm. Initially, the researchers contrasted various approaches to clinical measurement representation in the EHR data. The significance of each representation for ADE prediction was then investigated. The authors contrasted various classifiers to determine which performed the best across the various representations. The study in [
13] aimed to use ML algorithms to identify risk factors for renal adverse events caused by renin–angiotensin–aldosterone system inhibitor (RAASi) medications. The researchers will use these findings to develop predictive models that can be used to identify patients at high risk of developing these adverse events so that they can be monitored and treated more closely.
According to [
14], using electronic patient record (EPR) data, deep learning models can predict ADEs with a high degree of accuracy. Two cutting-edge medical code-based models performed noticeably worse than the top-performing model. The study also discovered that deep learning models for ADE prediction could be made more interpretable by utilizing attention mechanisms. The model was able to determine which features in the EPR data were most crucial for ADE prediction thanks to the attention mechanism. Clinicians can utilize this information to create more successful preventative plans and gain a better understanding of how ADEs occur. Furthermore, the authors of [
15] highlighted the importance of using interactive support tools to reduce the number of ADEs and prevent unnecessary prescribing cascades in older adults. Instead of just predicting whether ADEs will occur in cancer patients, the authors of [
16] attempted to develop a new method for timing ADEs. A range of machine learning algorithms, including both conventional and cutting-edge methods, were used in the study to evaluate how well these algorithms predict the onset of ADEs in these patients. Graph-based embedding is a novel technique employed in this study that has not been used to predict ADE onset times before. In addition, the authors of [
17] discussed the importance of extracting ADEs from informal text data, such as tweets and forum posts, for digital pharmacovigilance. They emphasized the growing use of large pretrained language models, such as BERT, for this task, but acknowledged that it is unclear which transformer-based models are the most effective.
In [
18], the authors introduced a new ADE association network that uses a large dataset of known drug–ADE associations and a scoring system to predict new drug–ADE combinations. The study shows that the network works well by both finding known drug–ADE relationships and predicting new ones, which shows that this comprehensive toxicological approach is valuable. A novel ML model named MTMA is presented in [
19]. It has the potential to forecast drug interactions that may result in unfavorable outcomes. Two aspects of drugs are taken into account by MTMA: adverse effects and molecular structure. It can aid in our understanding of how drug interactions function by capturing the interactions between medications using a unique kind of tensor. The authors of [
20] performed a comprehensive study about the use of the FAERS database, which has adverse event reports from different parts of the world, to assess drug-induced itching. It is important to note that this study is the first in-depth attempt to identify and evaluate the relative risks of medications that induce itching. In addition, a novel classification scheme based on the place of itch onset and mode of administration was presented in the study, which may help to clarify the mechanisms underlying drug-induced itching.
Another research methodology regarding the measurement of the adverse effects of the COVID-19 vaccine is presented in [
21]. The primary objective of this work was to analyze vaccine adverse event data using ontologies and ML. To make it simple for users to access and obtain these data, the researchers also created an intuitive user interface. Lastly, the researchers employed machine learning to forecast the main symptoms linked to post-vaccination hospitalization and therapy. This study sheds important light on the side effects and safety of vaccines. Furthermore, the authors of [
22] created a novel ML model that can precisely forecast drug–drug interactions, particularly those involving histamine antagonists. The early stages of drug development can benefit from the early application of this model, which outperforms earlier models and has the potential to increase medication safety and streamline the process.
Table 1 provides an overview of various research studies that aim to address different objectives related to the prediction and assessment of adverse drug events (ADEs) and drug interactions. The common theme among these objectives is the use of diverse datasets and machine learning or analytical techniques to improve our understanding of ADEs and related factors.
The application of ascending feature selection, as proposed in our work, has been relatively unexplored, providing an innovative means to gradually increase model complexity and understand how model performance varies accordingly. Moreover, while attention mechanisms have been widely used in the NLP field, their application in weighing the importance of different types of features in a dataset has been limited. Our work leverages such attention mechanisms to balance the importance of NLP-derived features and demographic features, presenting a novel approach in this domain.
Our research introduces an innovative layer-static-weighted attention mechanism that significantly enhances the predictive capability of neural network models in pharmacovigilance applications. This mechanism is ingeniously designed to allow for differential focus distribution between two distinct types of features: those derived from natural language processing (NLP) and demographic features. The novelty of our approach lies in the dynamic adjustment of the attention ratio, offering a granular control that tailors the model’s computational focus to the most predictive features at each learning phase.
3. Dataset Analysis and Description
The Food and Drug Administration Adverse Event Reporting System (FAERS) dataset [
23] is an exhaustive repository detailing drug-related adverse events over a span of almost three decades, from 1989 to 2017. The dataset encapsulates a substantial count of 5,948,514 events, making it one of the most comprehensive datasets in its domain.
3.1. FAERS Dataset Key Features
The FAERS dataset contains detailed information about patients, drugs, and adverse events, which can be used to find new safety signals and track trends in adverse events. Researchers and healthcare professionals use the FAERS dataset to improve drug safety monitoring, inform regulatory decisions, and improve patient care. The following are some of the key features of the major categories of the FAERS dataset:
Temporal Span: The data chronicle adverse drug events spanning from the year 1989 to 2017. This broad timespan allows for a deep historical analysis, uncovering patterns and trends across different eras of drug administration and healthcare practices.
Rich Textual Information: One of the salient features of the dataset is its incorporation of textual data, especially from active substance fields. This offers potential insights into the specific substances or drug combinations that might be associated with particular adverse events.
Demographic Data: The dataset is not just limited to events but also envelops demographic data. These data include the gender of the patient, which can be critical in understanding the differential effects of drugs across sexes, potentially aiding in gender-specific drug recommendations or precautions.
Qualification of Healthcare Provider: By including the qualification of the healthcare provider who reported the event, the dataset allows for nuanced analyses of the reliability and depth of the reported data. For instance, reports from specialized doctors might be weighed differently than those from general practitioners or nurses.
3.2. Statistical Figures on Seriousness and Non-Seriousness
For a more granular understanding, we segregated the dataset based on the severity of the adverse events into serious and non-serious categories. Subsequently, we analyzed the frequency of these categories in association with the top substances, providing insights into which substances are commonly linked with severe adverse reactions and which ones predominantly report milder, non-serious events.
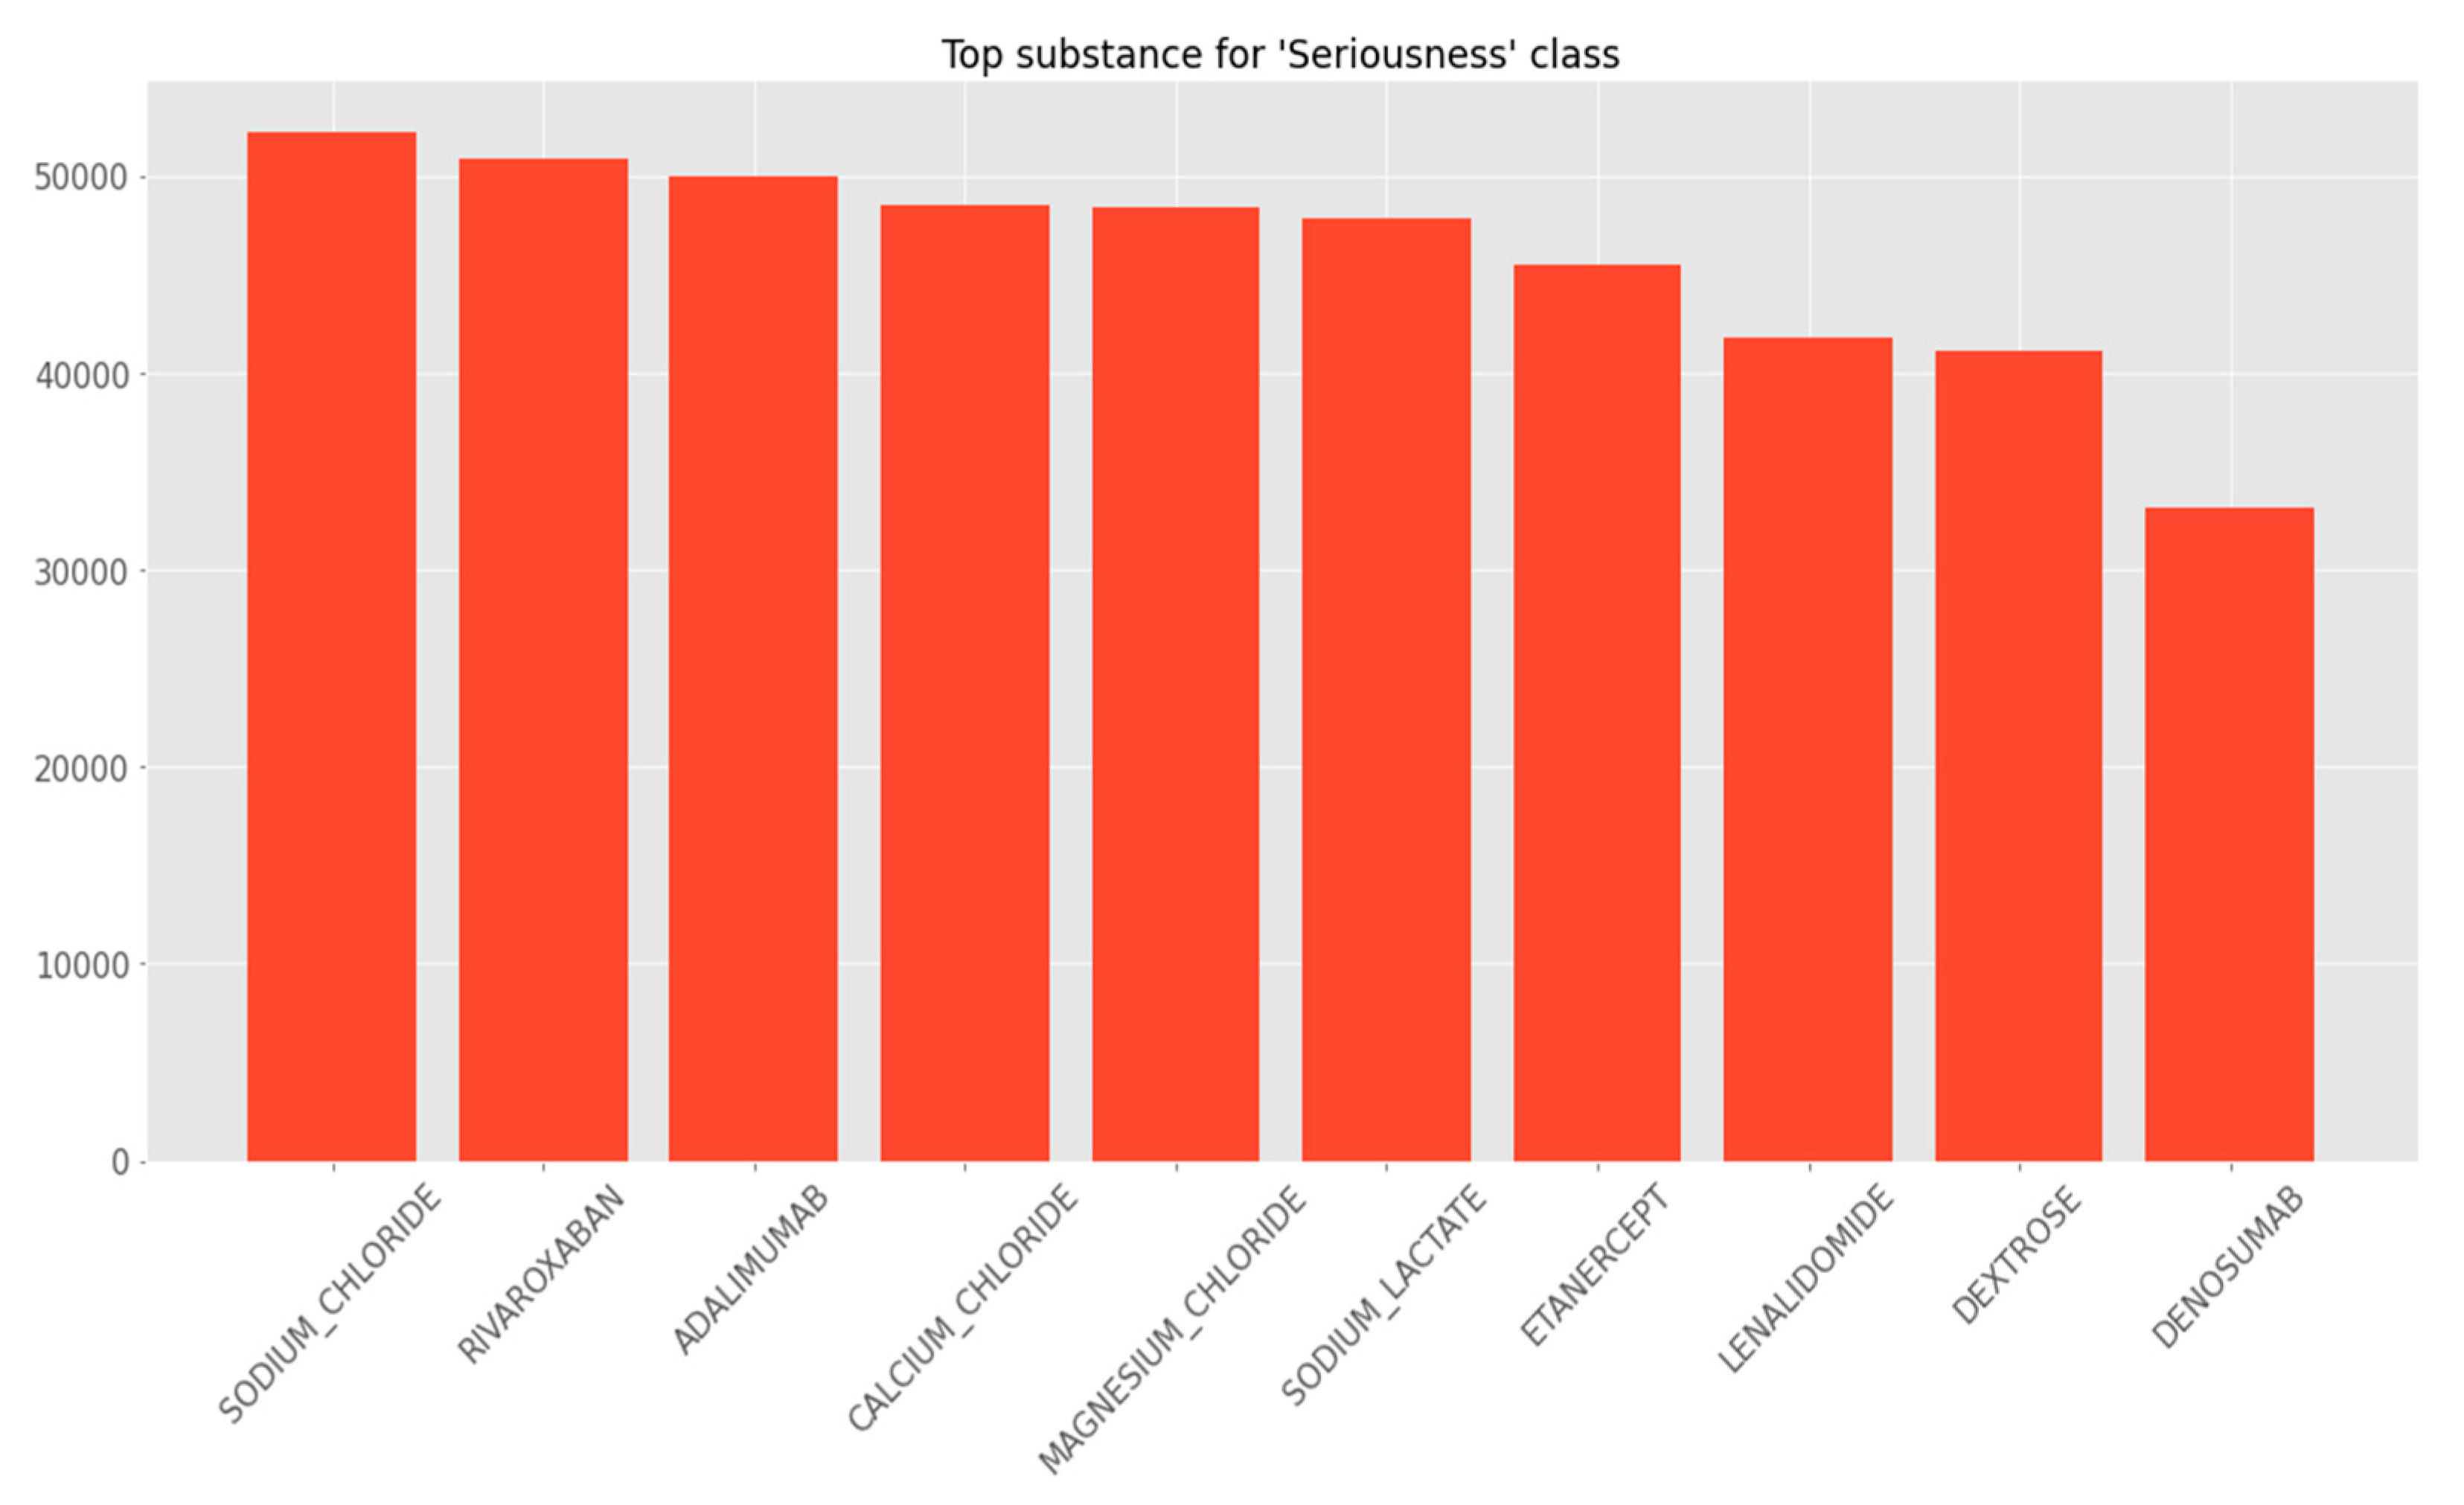
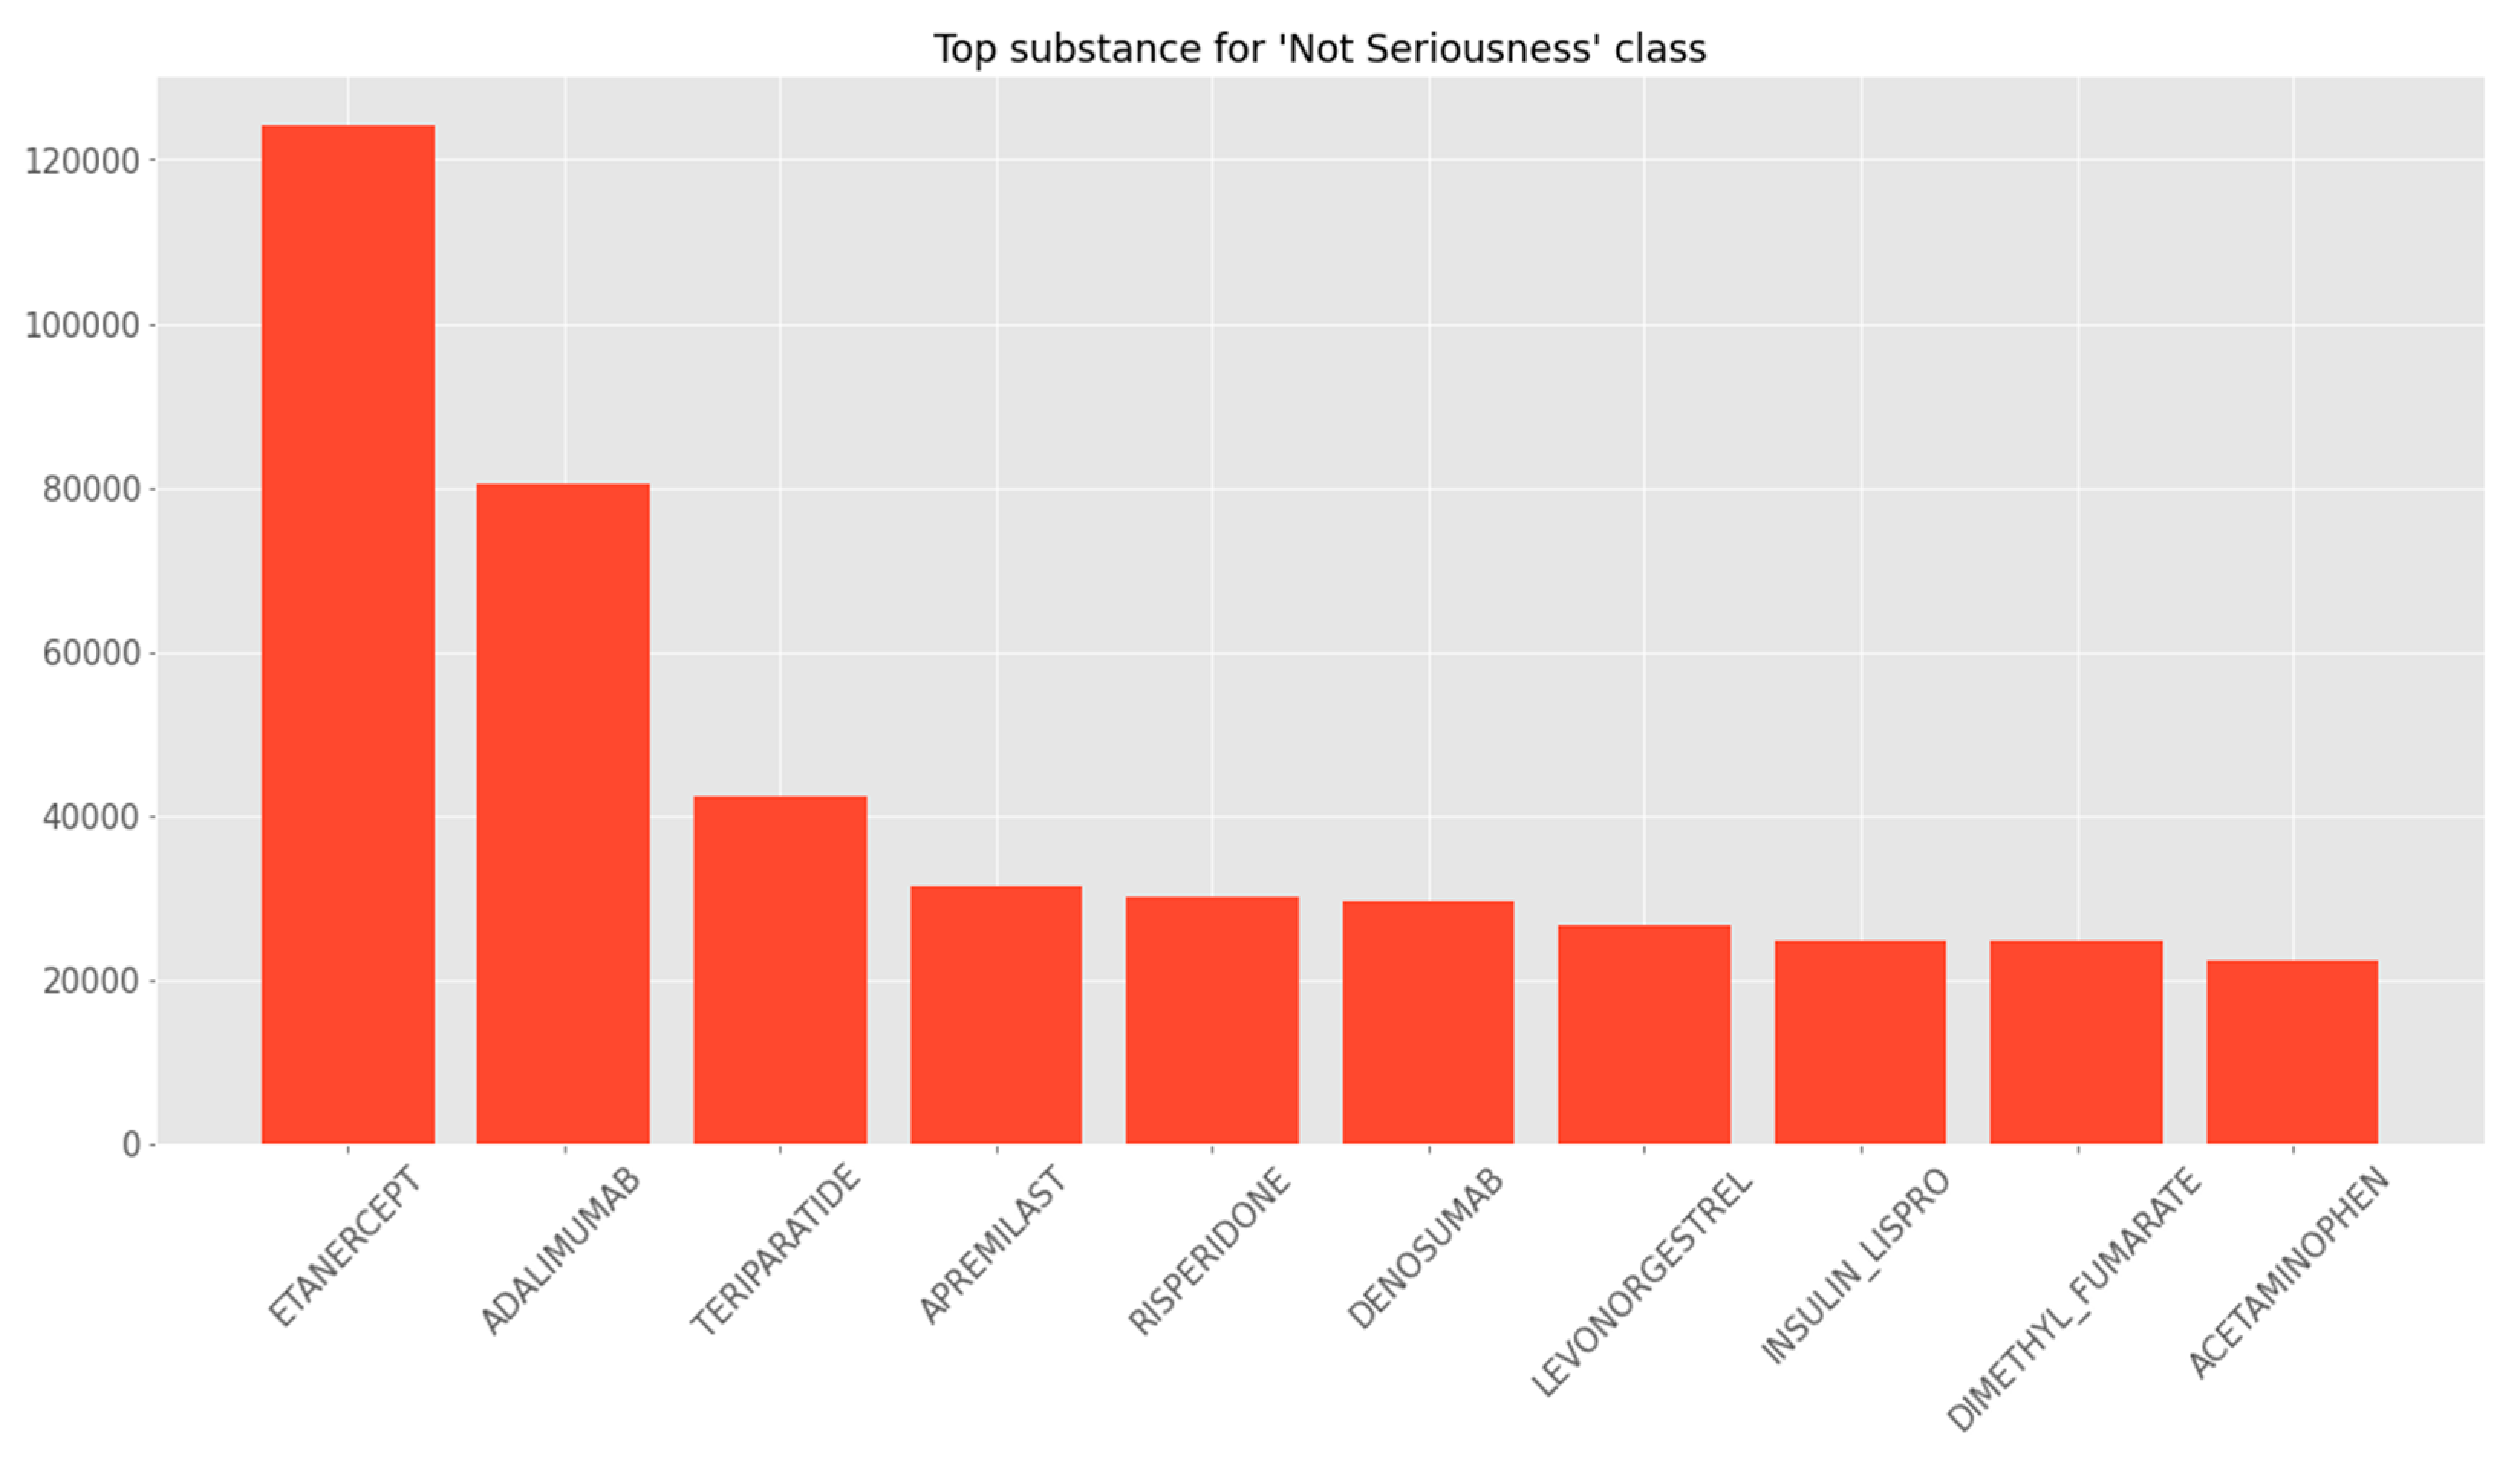
3.2.1. Bar Graph Representation for Seriousness and Non-Seriousness of Substances
As presented in
Figure 1 and
Figure 2, two bar graphs were constructed to visually depict the number of serious and non-serious events for the top substances. The y-axis represented the number of events, while the x-axis enumerated the top substances. One graph denotes serious events, and the other illustrates non-serious events. This allowed for an instant visual comparison. In terms of a statistical summary, for each of the top substances, we provided a succinct summary detailing the exact number of serious and non-serious adverse events, along with the respective percentages. This numerical breakdown augmented the visual bar graphs, offering precise figures for comprehensive analysis.
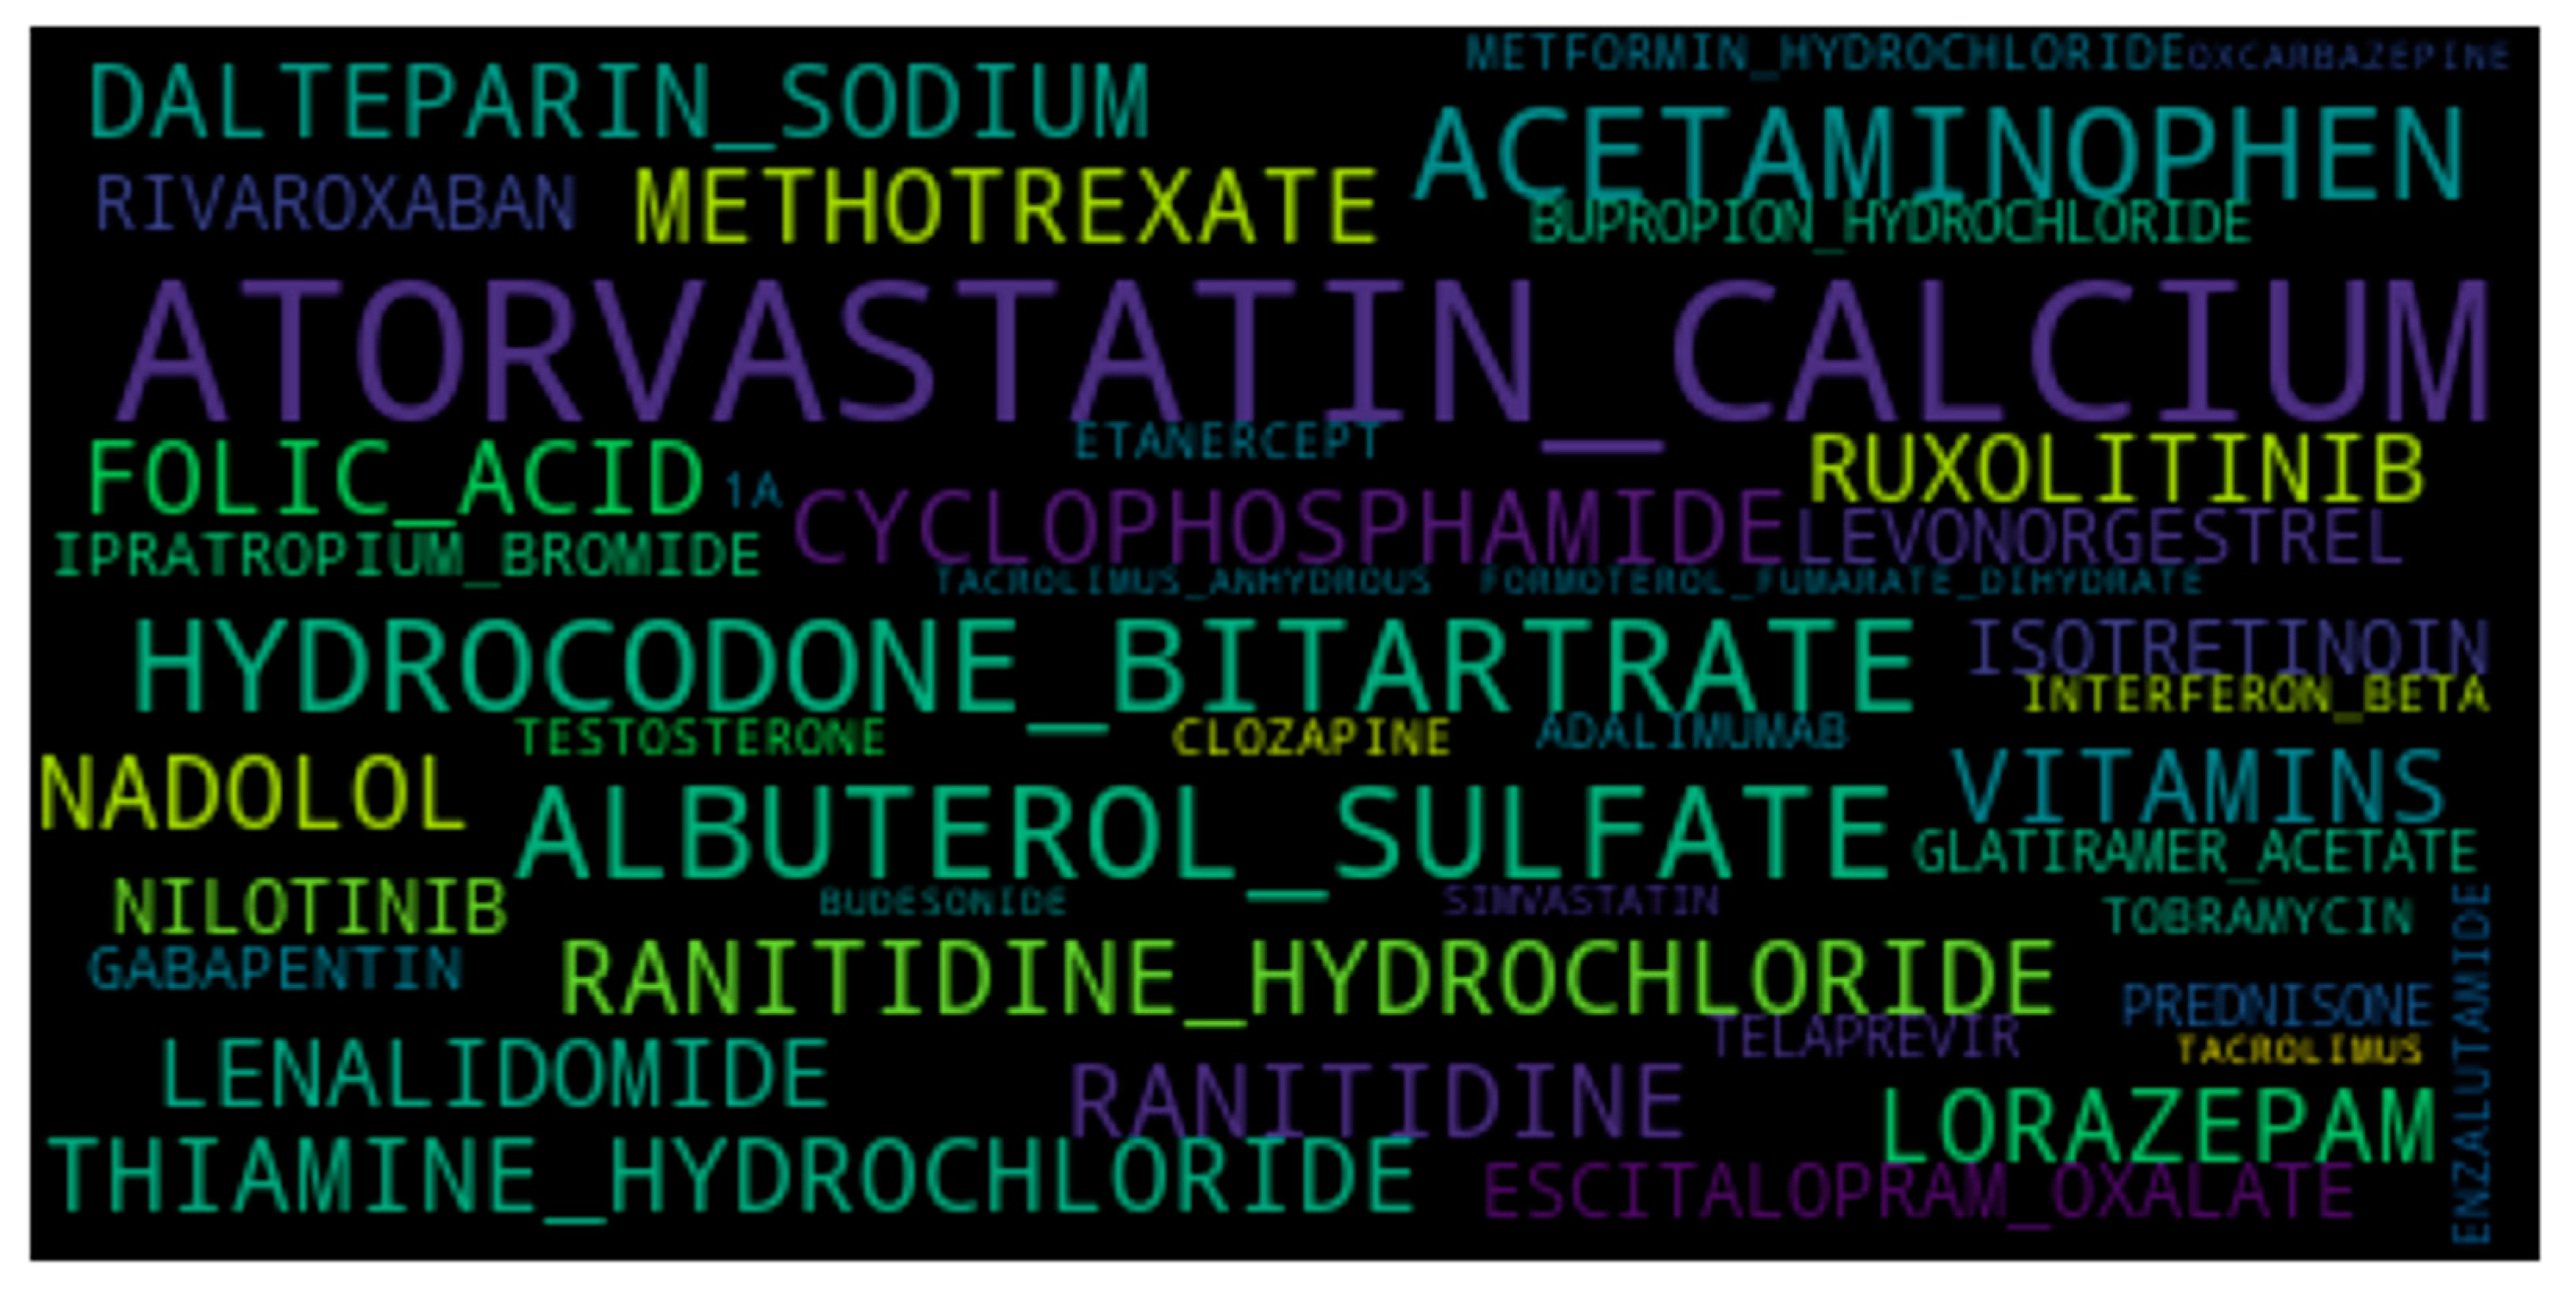
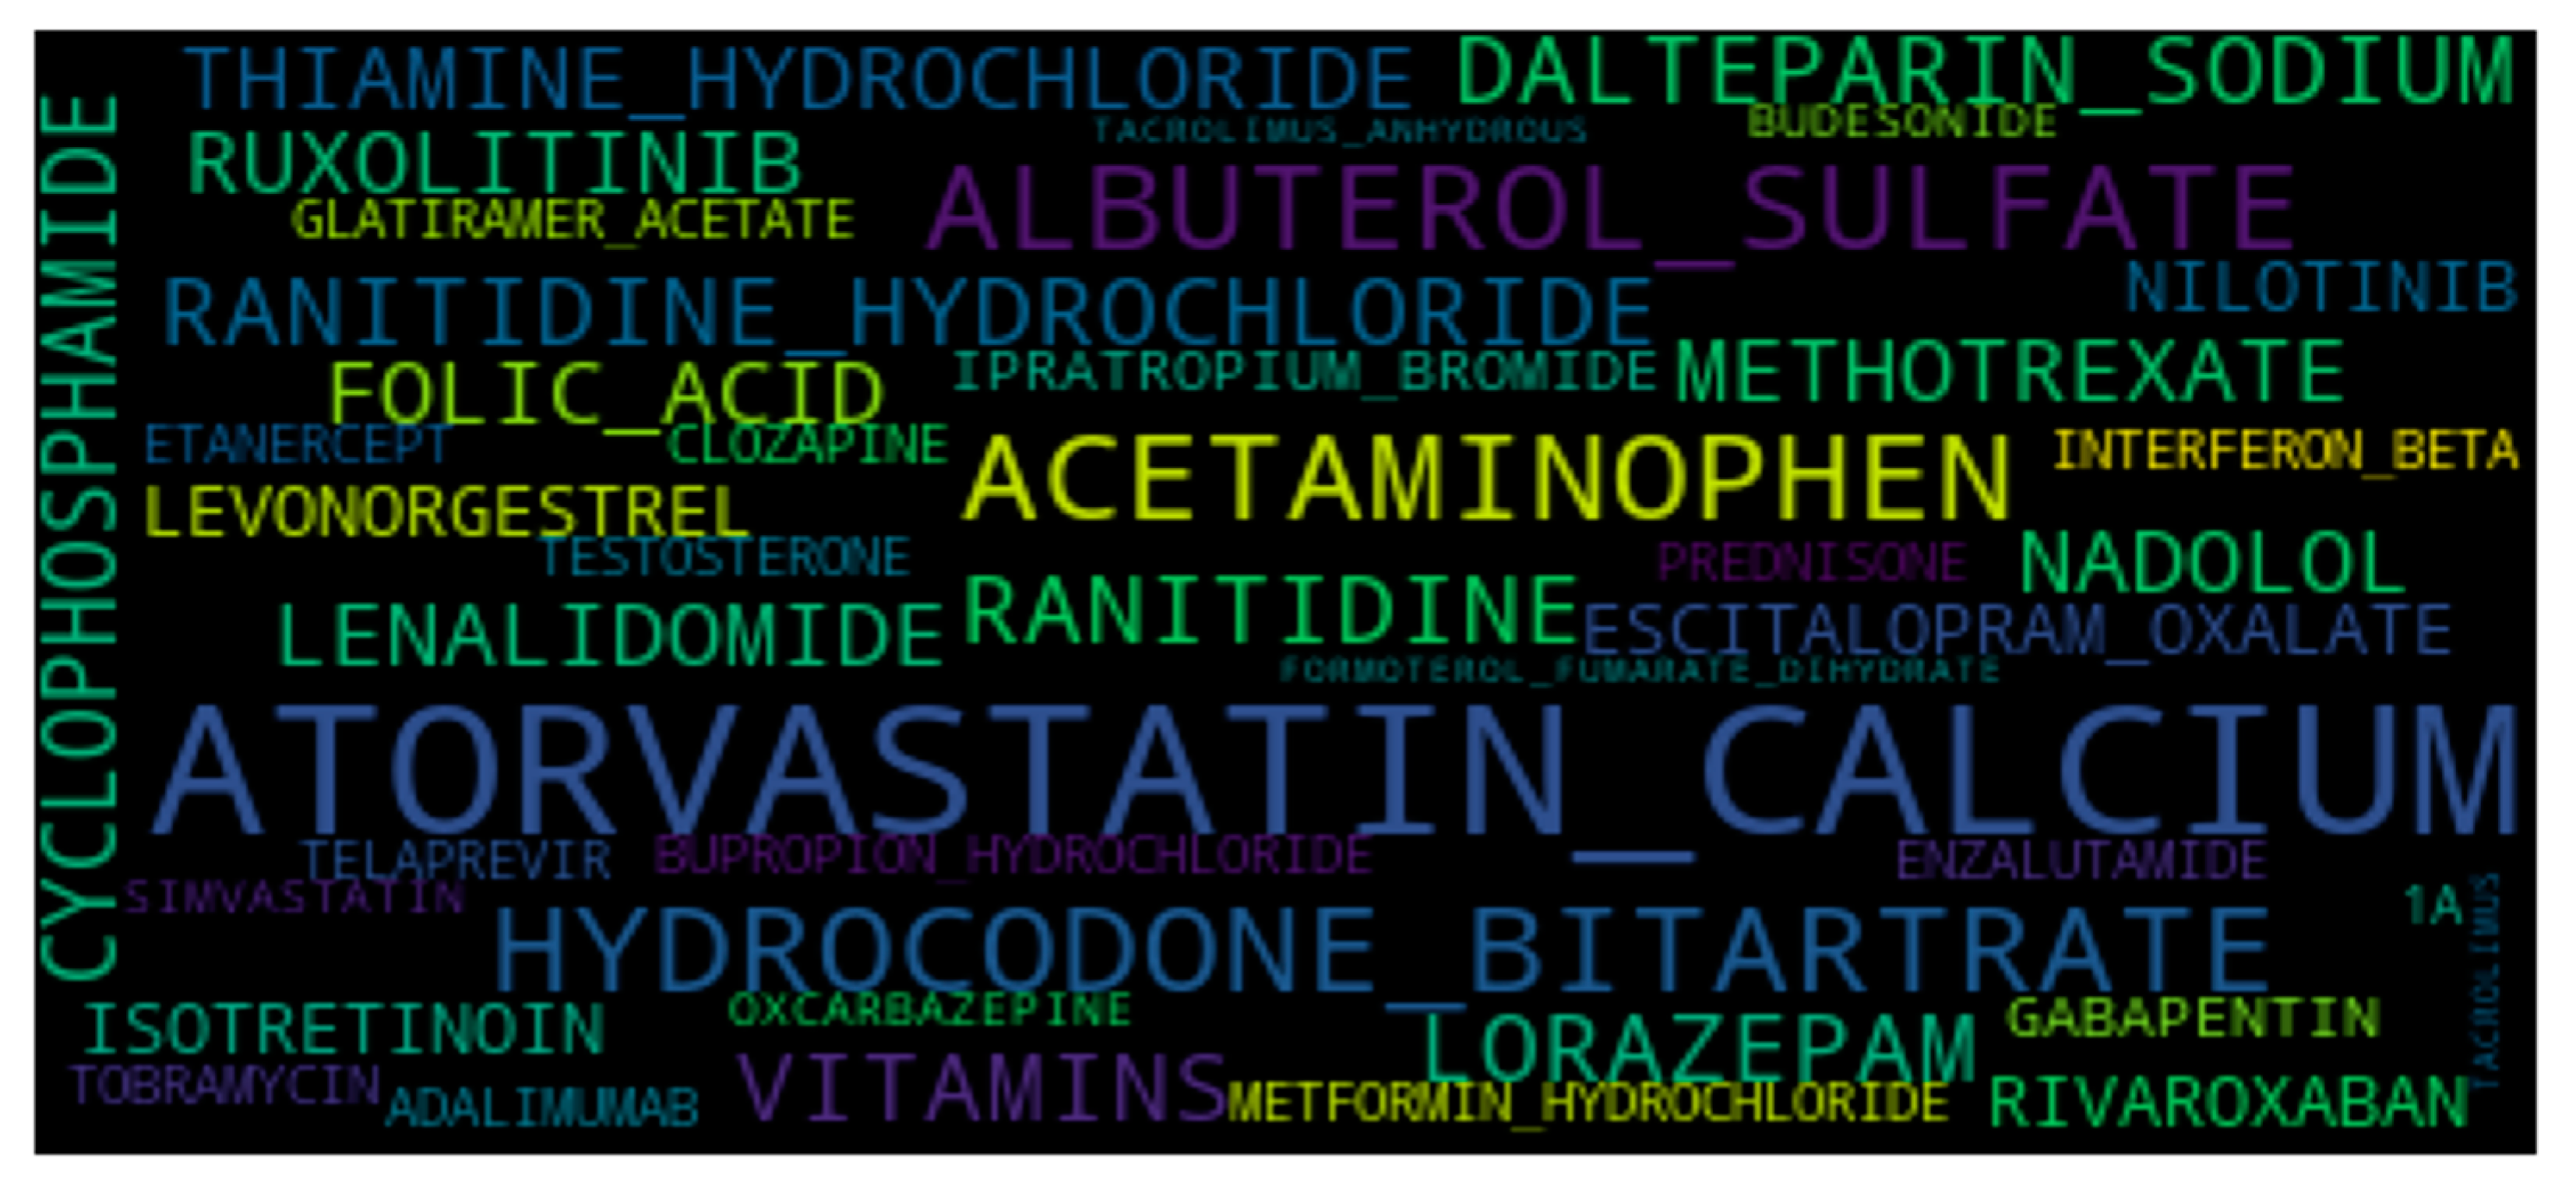
3.2.2. Word Cloud Visualization for Top Substances
To offer a visually appealing and immediate grasp of which substances are most frequently reported in the FAERS dataset, a word cloud was developed. In the word cloud, as depicted in
Table 2, the size of each word (substance) is directly proportional to its frequency in the dataset. This means that substances that are reported more frequently in adverse events appear larger and more prominently in the word cloud, while less frequent ones are smaller. Word clouds are particularly useful for stakeholders who wish to gain a rapid understanding of the dataset without delving into detailed statistics. It provides a snapshot of the most influential substances in terms of adverse event reporting. As presented in
Figure 3 and
Figure 4, the word count of text about the severity and characteristics of adverse drug reactions (ADRs) is a quantitative measure of the depth of information and research on the impact and attributes of active substances in ADRs. This information is crucial for pharmacovigilance and drug safety analysis, and it can help researchers and healthcare professionals to better understand and prevent ADRs.
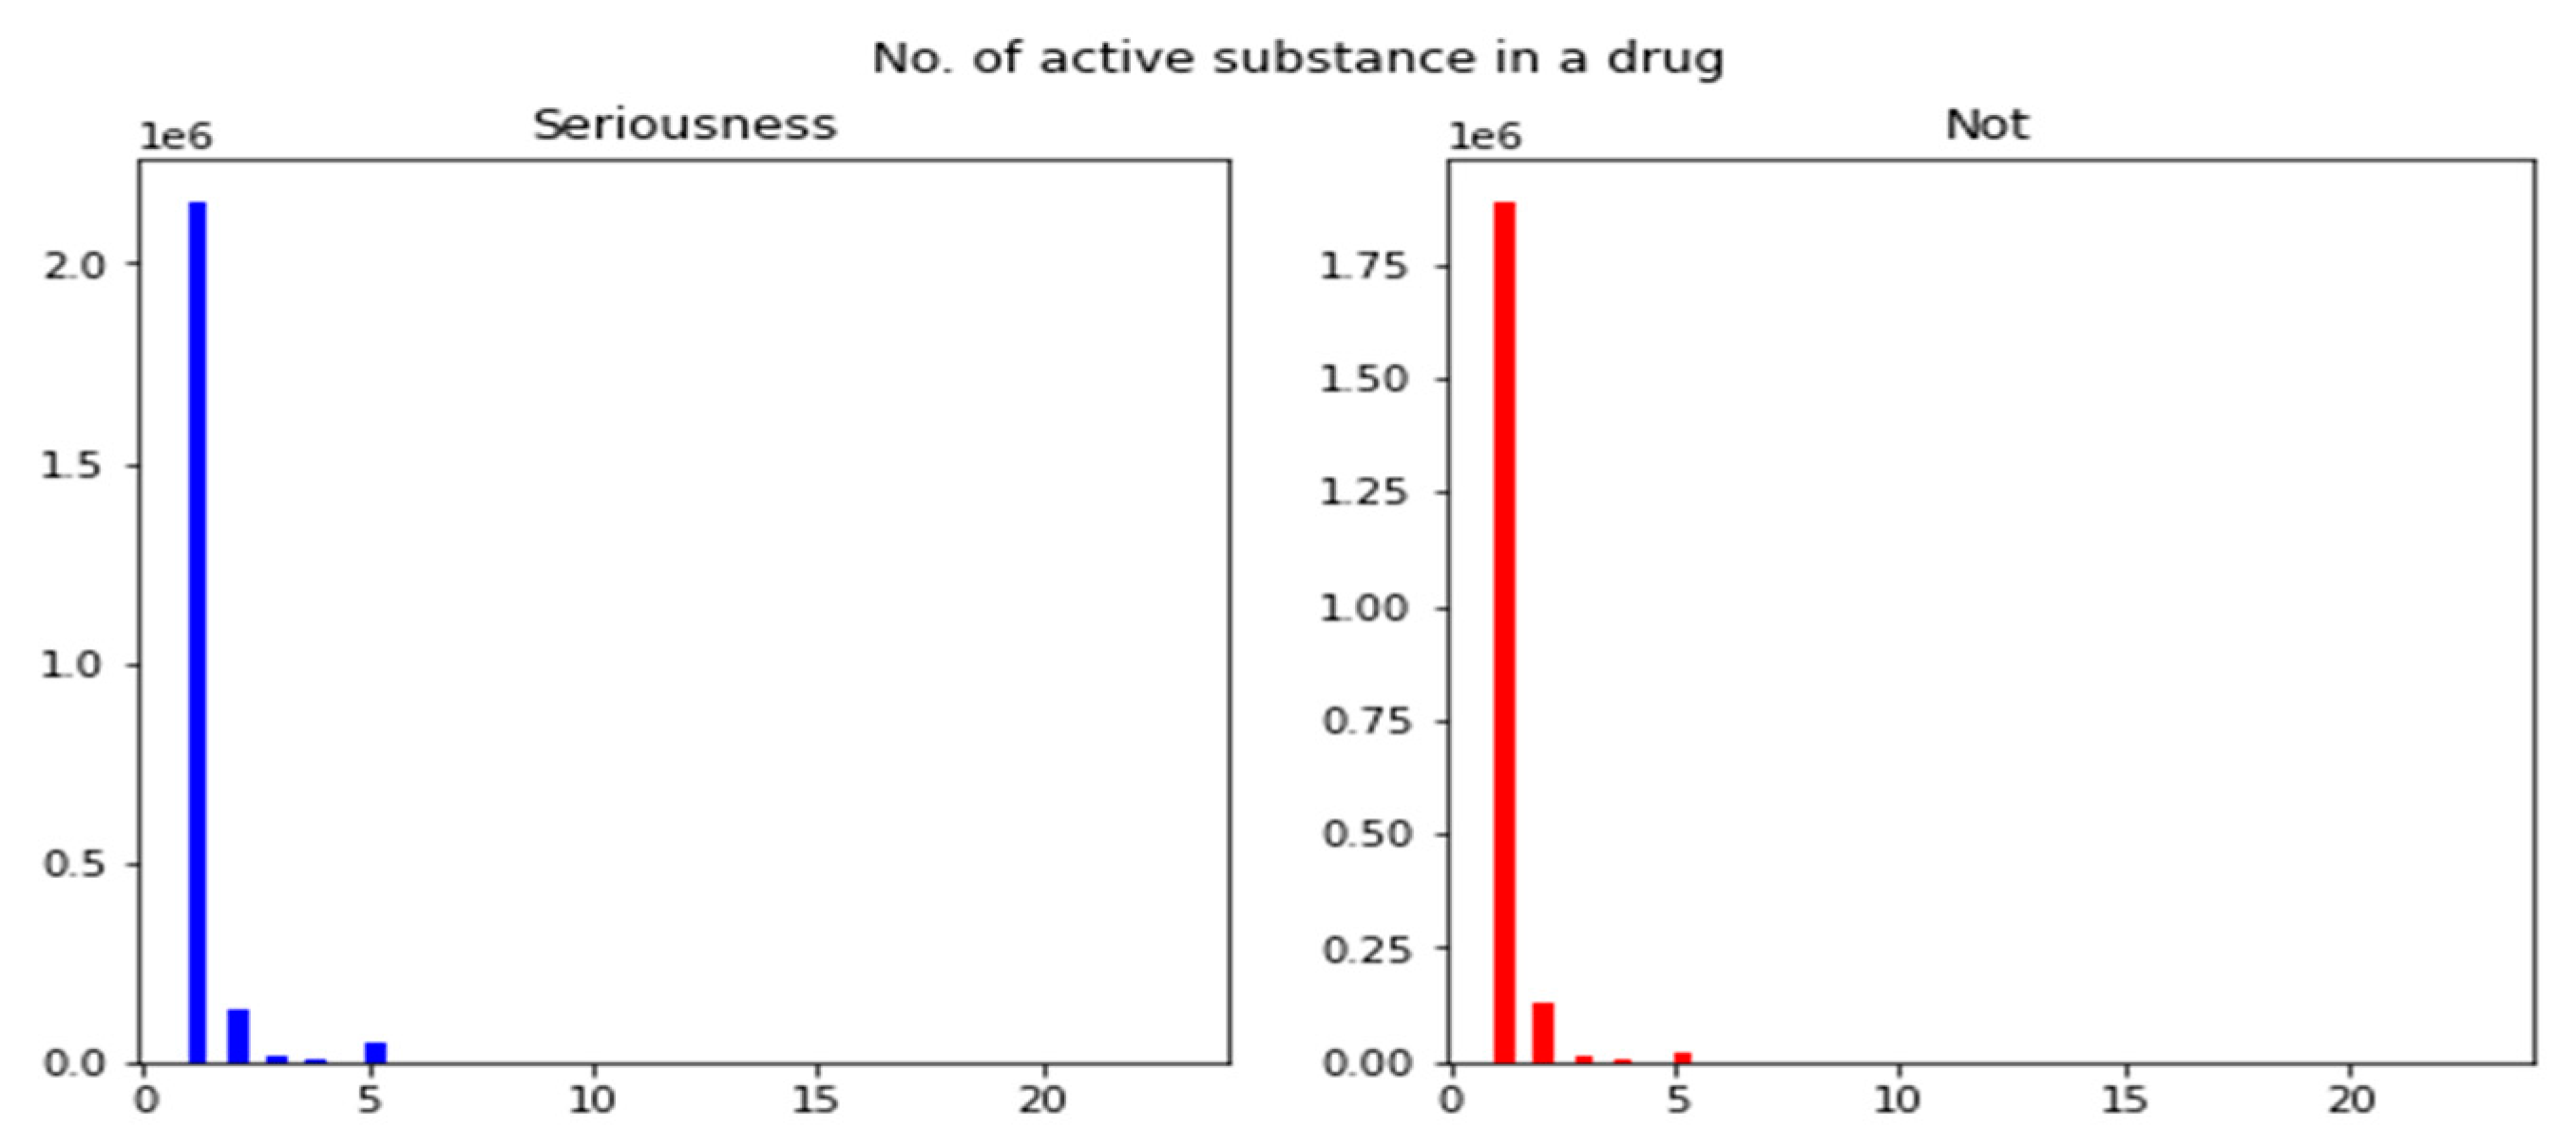
3.2.3. Histogram on Number of Active Substances in Drugs
To understand the distribution of active substances present in drugs and their correlation with adverse events, as shown in
Figure 5, a histogram was plotted. The histogram’s x-axis represents the number of active substances present in a drug, while the y-axis indicates the count of drugs. Each bar in the histogram showcases how many drugs contain a particular number of active substances. For instance, if a bar corresponding to ‘2’ on the x-axis reaches ‘500’ on the y-axis, it suggests that 500 drugs in the dataset contain two active substances. This visual representation can shed light on multiple facets:
- –
Predominant Composition: If the taller bars of the histogram are centered around a specific number, it indicates that most drugs in the dataset contain that particular number of active substances.
- –
Complexity of Drugs: If the histogram has a broad spread, it suggests that the dataset includes drugs with a wide range of complexity in terms of active substance count.
- –
Potential Correlations with Adverse Events: By juxtaposing this histogram with the serious vs. non-serious statistics, researchers might discern patterns. For example, if drugs with a higher count of active substances tend to have more serious adverse events, it could indicate potential interactions between substances leading to severe reactions.
Together, the bar graph, word cloud, and histogram collectively provide a multifaceted perspective on the FAERS dataset. These visual tools, juxtaposing quantitative figures with qualitative representations, deliver profound insights into the seriousness of adverse events and the complexity of active substances in drugs. Such comprehensive visualization aids are essential for researchers and stakeholders, enabling them to grasp the depth and nuances of drug-related adverse events within the FAERS dataset.
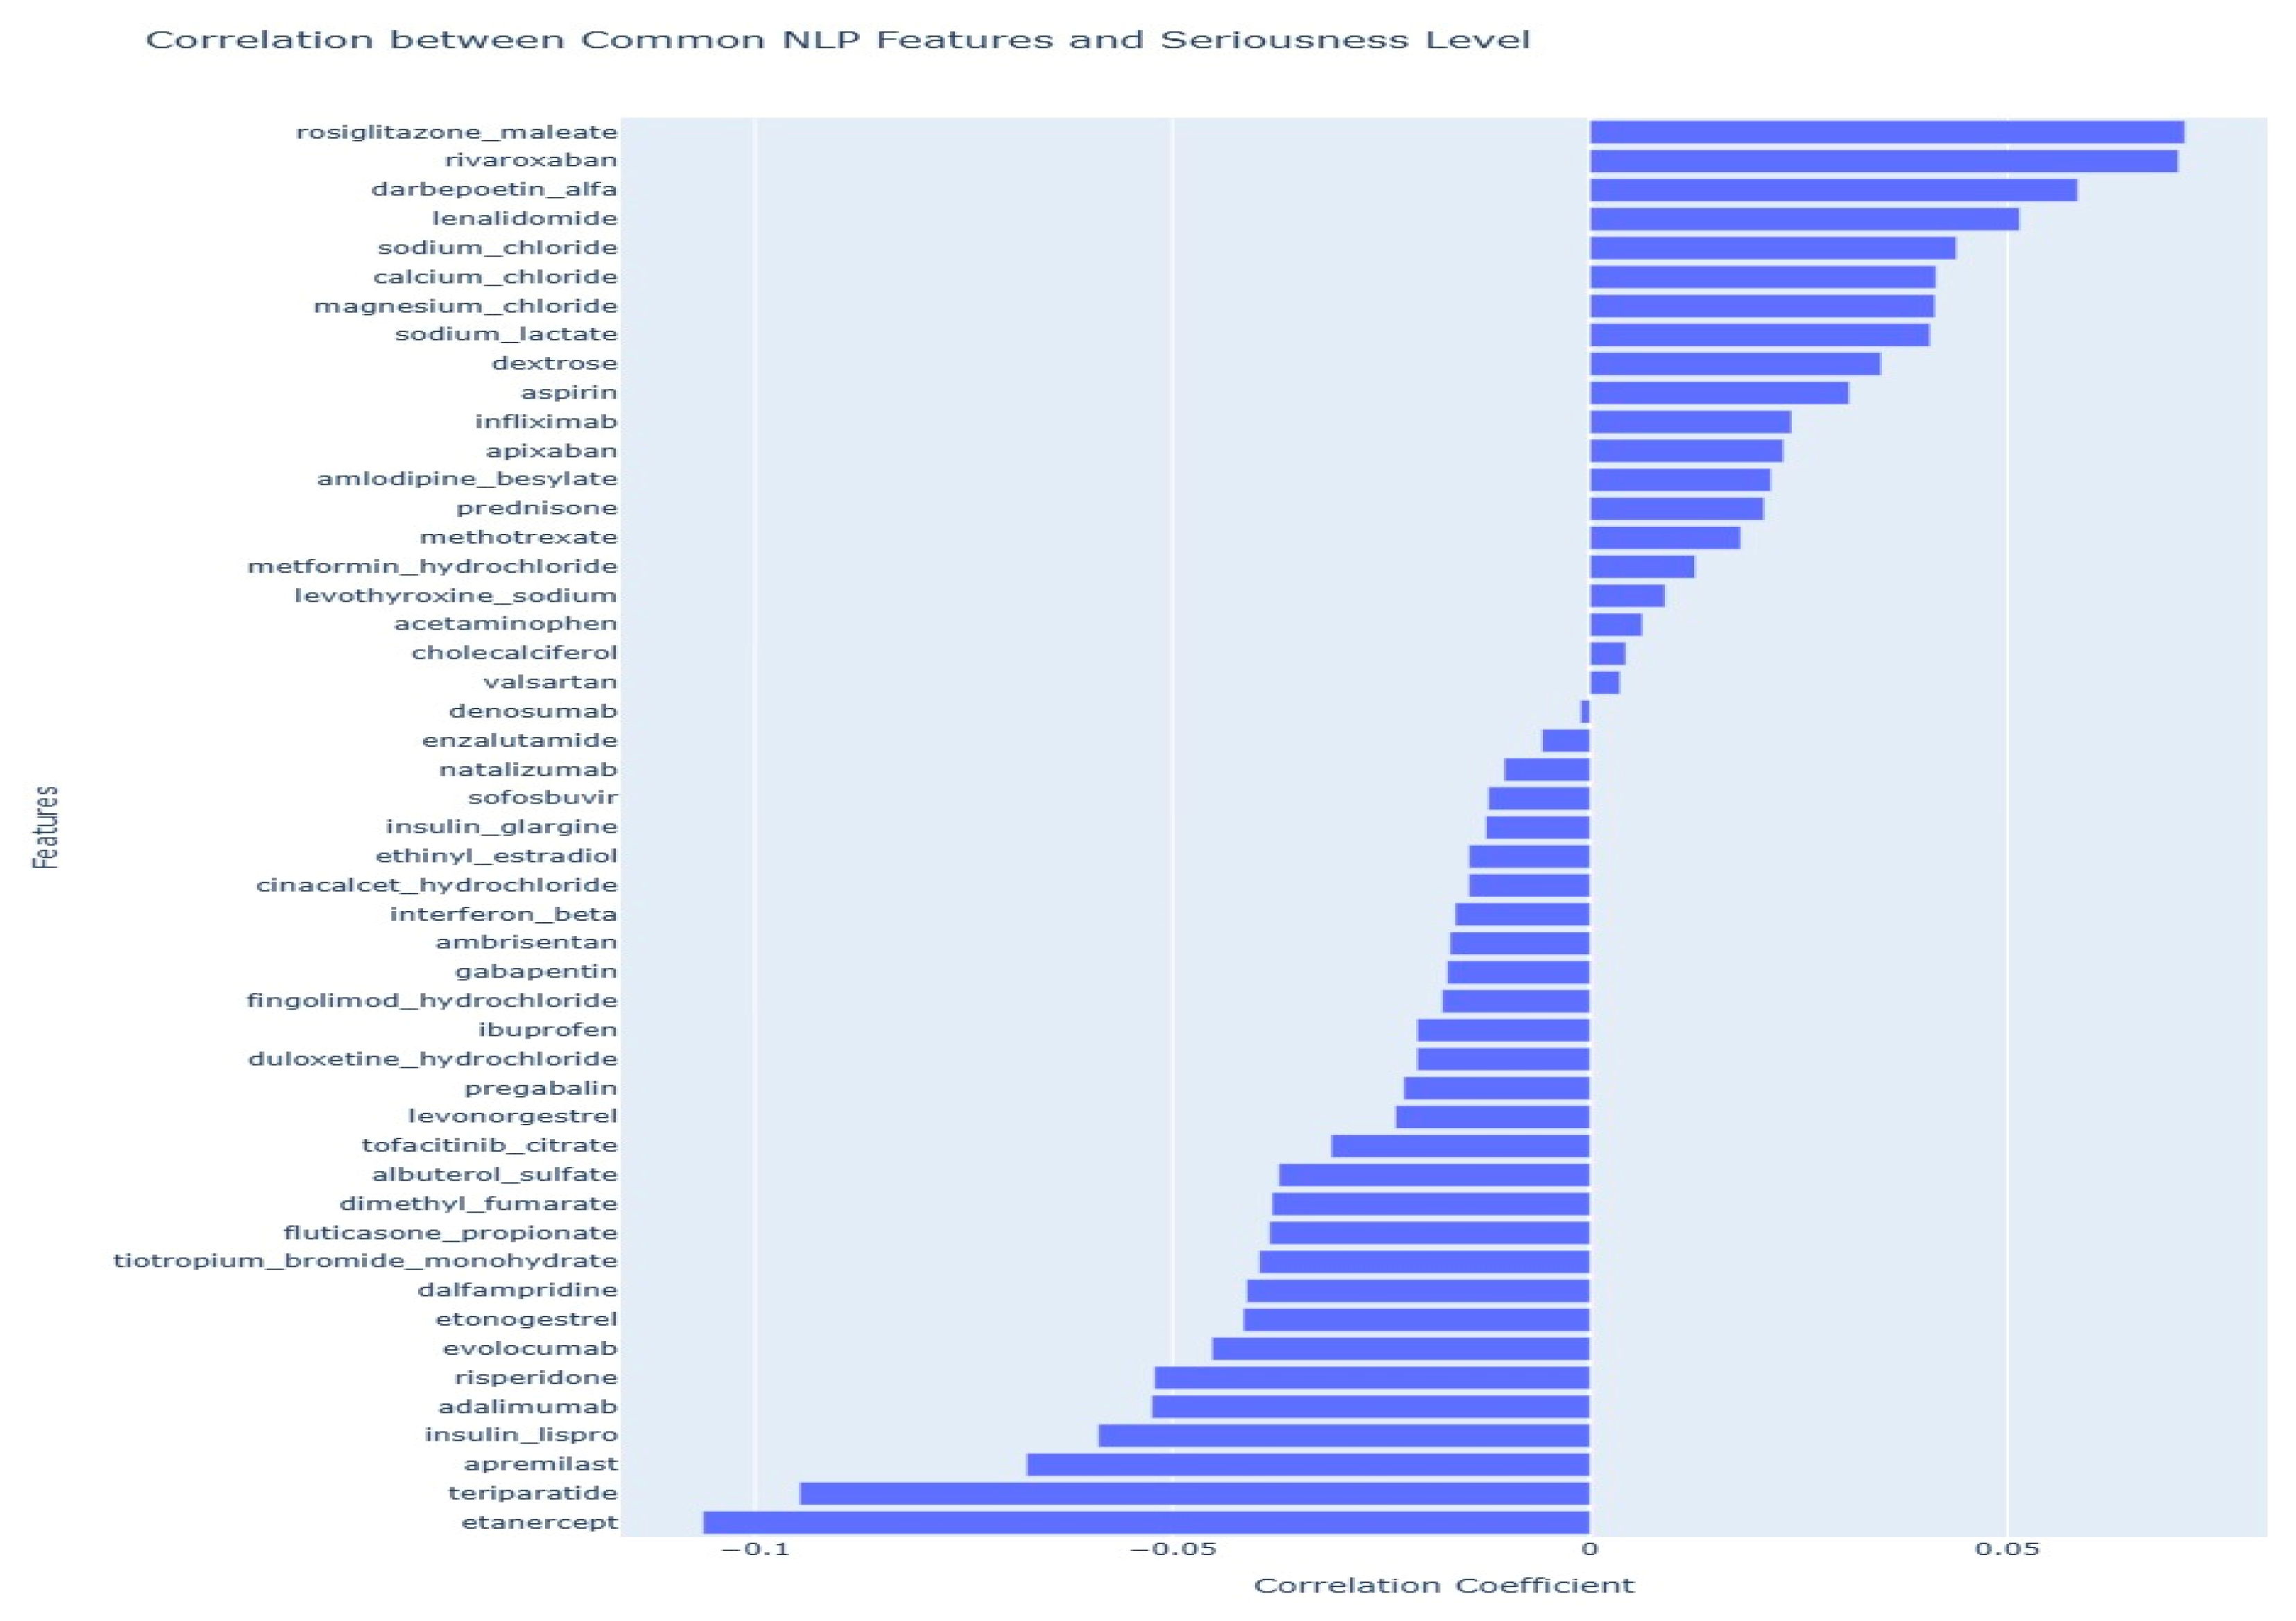
3.2.4. Application of the PERSONA Technique for Visualization of Key NLP Features
In our analysis, we applied the PERSONA technique, which is a systematic statistical method to visualize the relationship between NLP features and the seriousness level of adverse events reported in the FAERS dataset. As depicted in
Figure 6, we conducted a statistical analysis to determine the correlation of over 5400 NLP features against the seriousness of events. Utilizing the PERSONA technique, we were able to prioritize and select the top 50 features that exhibited the strongest correlation, either positive or negative, with the seriousness of adverse events. This visualization is pivotal as it clearly demonstrates which features have the most substantial relationship with event seriousness, thus providing valuable insights into predictive factors of adverse drug reactions. By highlighting the 50 most correlated features, the PERSONA technique significantly contributed to our understanding and interpretation of the data, emphasizing those attributes that were most critical for our predictive model’s focus on enhancing drug safety monitoring.
4. Proposed Methodology
As proposed in [
24], different methods of ML algorithms were investigated in a comprehensive review to predict the networks in pharmacosafety where the FAERS dataset was applied. The main objective was to predict adverse drug events by splitting the dataset based on the interaction between drugs and ADEs. Furthermore, the authors of [
25] highlighted the role of ADEs as an essential target for predictive models. However, building accurate predictive models for ADEs is challenging because healthcare data are heterogeneous from different sources and formats, high-dimensional with many features, sparse with many missing values, and temporal that may change over time. The objective of our research lies in an integrated methodology combining ascending feature selection with the innovative layer-static-weighted attention mechanism. This strategic workflow is initiated with an intricate preprocessing phase and culminates in the judicious selection of a model anchored on its performance metrics on validation datasets.
4.1. FAERS Dataset
Serving as our primary fountain of information, the FAERS dataset unfolds a plethora of intricate and diversified data points revolving around drug-induced adverse events. It is imbued with textual intricacies drawn from active substance fields and is enriched with demographic nuances like patient gender and the academic credentials of the event-reporting healthcare professional. This dataset underwent rigorous preprocessing, encompassing tokenization, and encoding tailored for NLP operations, along with one-hot encoding for categorical demographic variables.
4.2. Data Preprocessing
From the mammoth-sized initial dataset harboring 4,413,507 records, we distilled the derived features through the NLP processing of active substance narratives, coupled with demographic markers like ‘patientsex’, ‘qualification’, and ‘drugcharacterization’. The preprocessing suite comprised the following steps:
- –
Data Cleaning: Events with null active substance names were purged, bringing down the count from 5,948,514 to 4,413,507.
- –
Token Consolidation: Spaces between multi-token substance names were replaced with underscores, ensuring that they were treated as singular entities. For instance, DALTEPARIN SODIUM transformed to DALTEPARIN_SODIUM.
- –
Substance Separator Refinement: Compound substance separators, represented as ‘\\’, were transitioned to spaces, making RANITIDINE\\RANITIDINE_HYDROCHLORIDE metamorphose into RANITIDINE RANITIDINE_HYDROCHLORIDE.
4.3. Feature Selection
Feature selection is paramount in refining the predictive power of a model by narrowing it down to the most salient features while discarding the redundant or less informative ones. In this study, we relied on the robust capabilities of the Select_K_Best method. Paired with the chi2 function, a method celebrated for its proficiency in selecting optimal features, especially for categorical targets, it provided a refined lens to sift through the extensive features at our disposal. What sets the chi2 function apart is its ability to determine the dependence of variables, making it a quintessential choice for our dataset, where the relationships between the features and the target variable are nuanced. This strategy allowed us to mathematically rank features based on their relevance and potential impact on the model’s predictive power. Moreover, this rigorous selection procedure was particularly applied to the NLP features of active substances. The complexity and richness inherent in text-based data, like NLP features, make it crucial to employ a meticulous selection process. By focusing on the active substance features, we ensured that the most critical textual information was harnessed, optimizing the balance between model simplicity and predictive accuracy.
4.4. Ascending Feature Selection for Substance Features
The metric gauging feature importance was employed to sequence all available features. Initiating with a model encapsulating the 500 paramount features, its performance was assessed, succeeded by the incremental addition of features in tranches of 500, progressing up to 4500 features. This strategy was sculpted to optimize model performance by leveraging the most pivotal features and calibrating model complexity to its zenith.
4.5. Layer-Static-Weighted Attention
In this work, we refined our model architecture with the layer-static-weighted attention mechanism, a strategic approach to balance the contribution of NLP-derived features and demographic data. This technique systematically adjusts neuron allocation, exploring ratios from 10% (NLP)/90% (demographic) to 90% (NLP)/10% (demographic), aiming for an optimal blend that enhances model performance. Through this methodical exploration, we identified configurations that harnessed the complementary strengths of diverse data sources, ensuring that each feature type contributed effectively to our model’s predictive capabilities.
5. Proposed Model Architecture
In recent research methodologies, different deep learning models have been developed with NLP to identify ADRs to enhance the detection of drug events by utilizing automated ADR reporting as an alternative method to increase reporting rates. As a result, pharmacovigilance efforts can be improved based on the model’s performance. In addition, the use of deep learning facilitates the prediction of drug side effects that may not have been identified during clinical trials and the development of different architectures to predict potential side effects for drugs in the clinical development stage. Different ensemble deep learning networks can be improved for the predictive performance of ADRs that help in supporting medical decisions and drug development [
26,
27,
28].
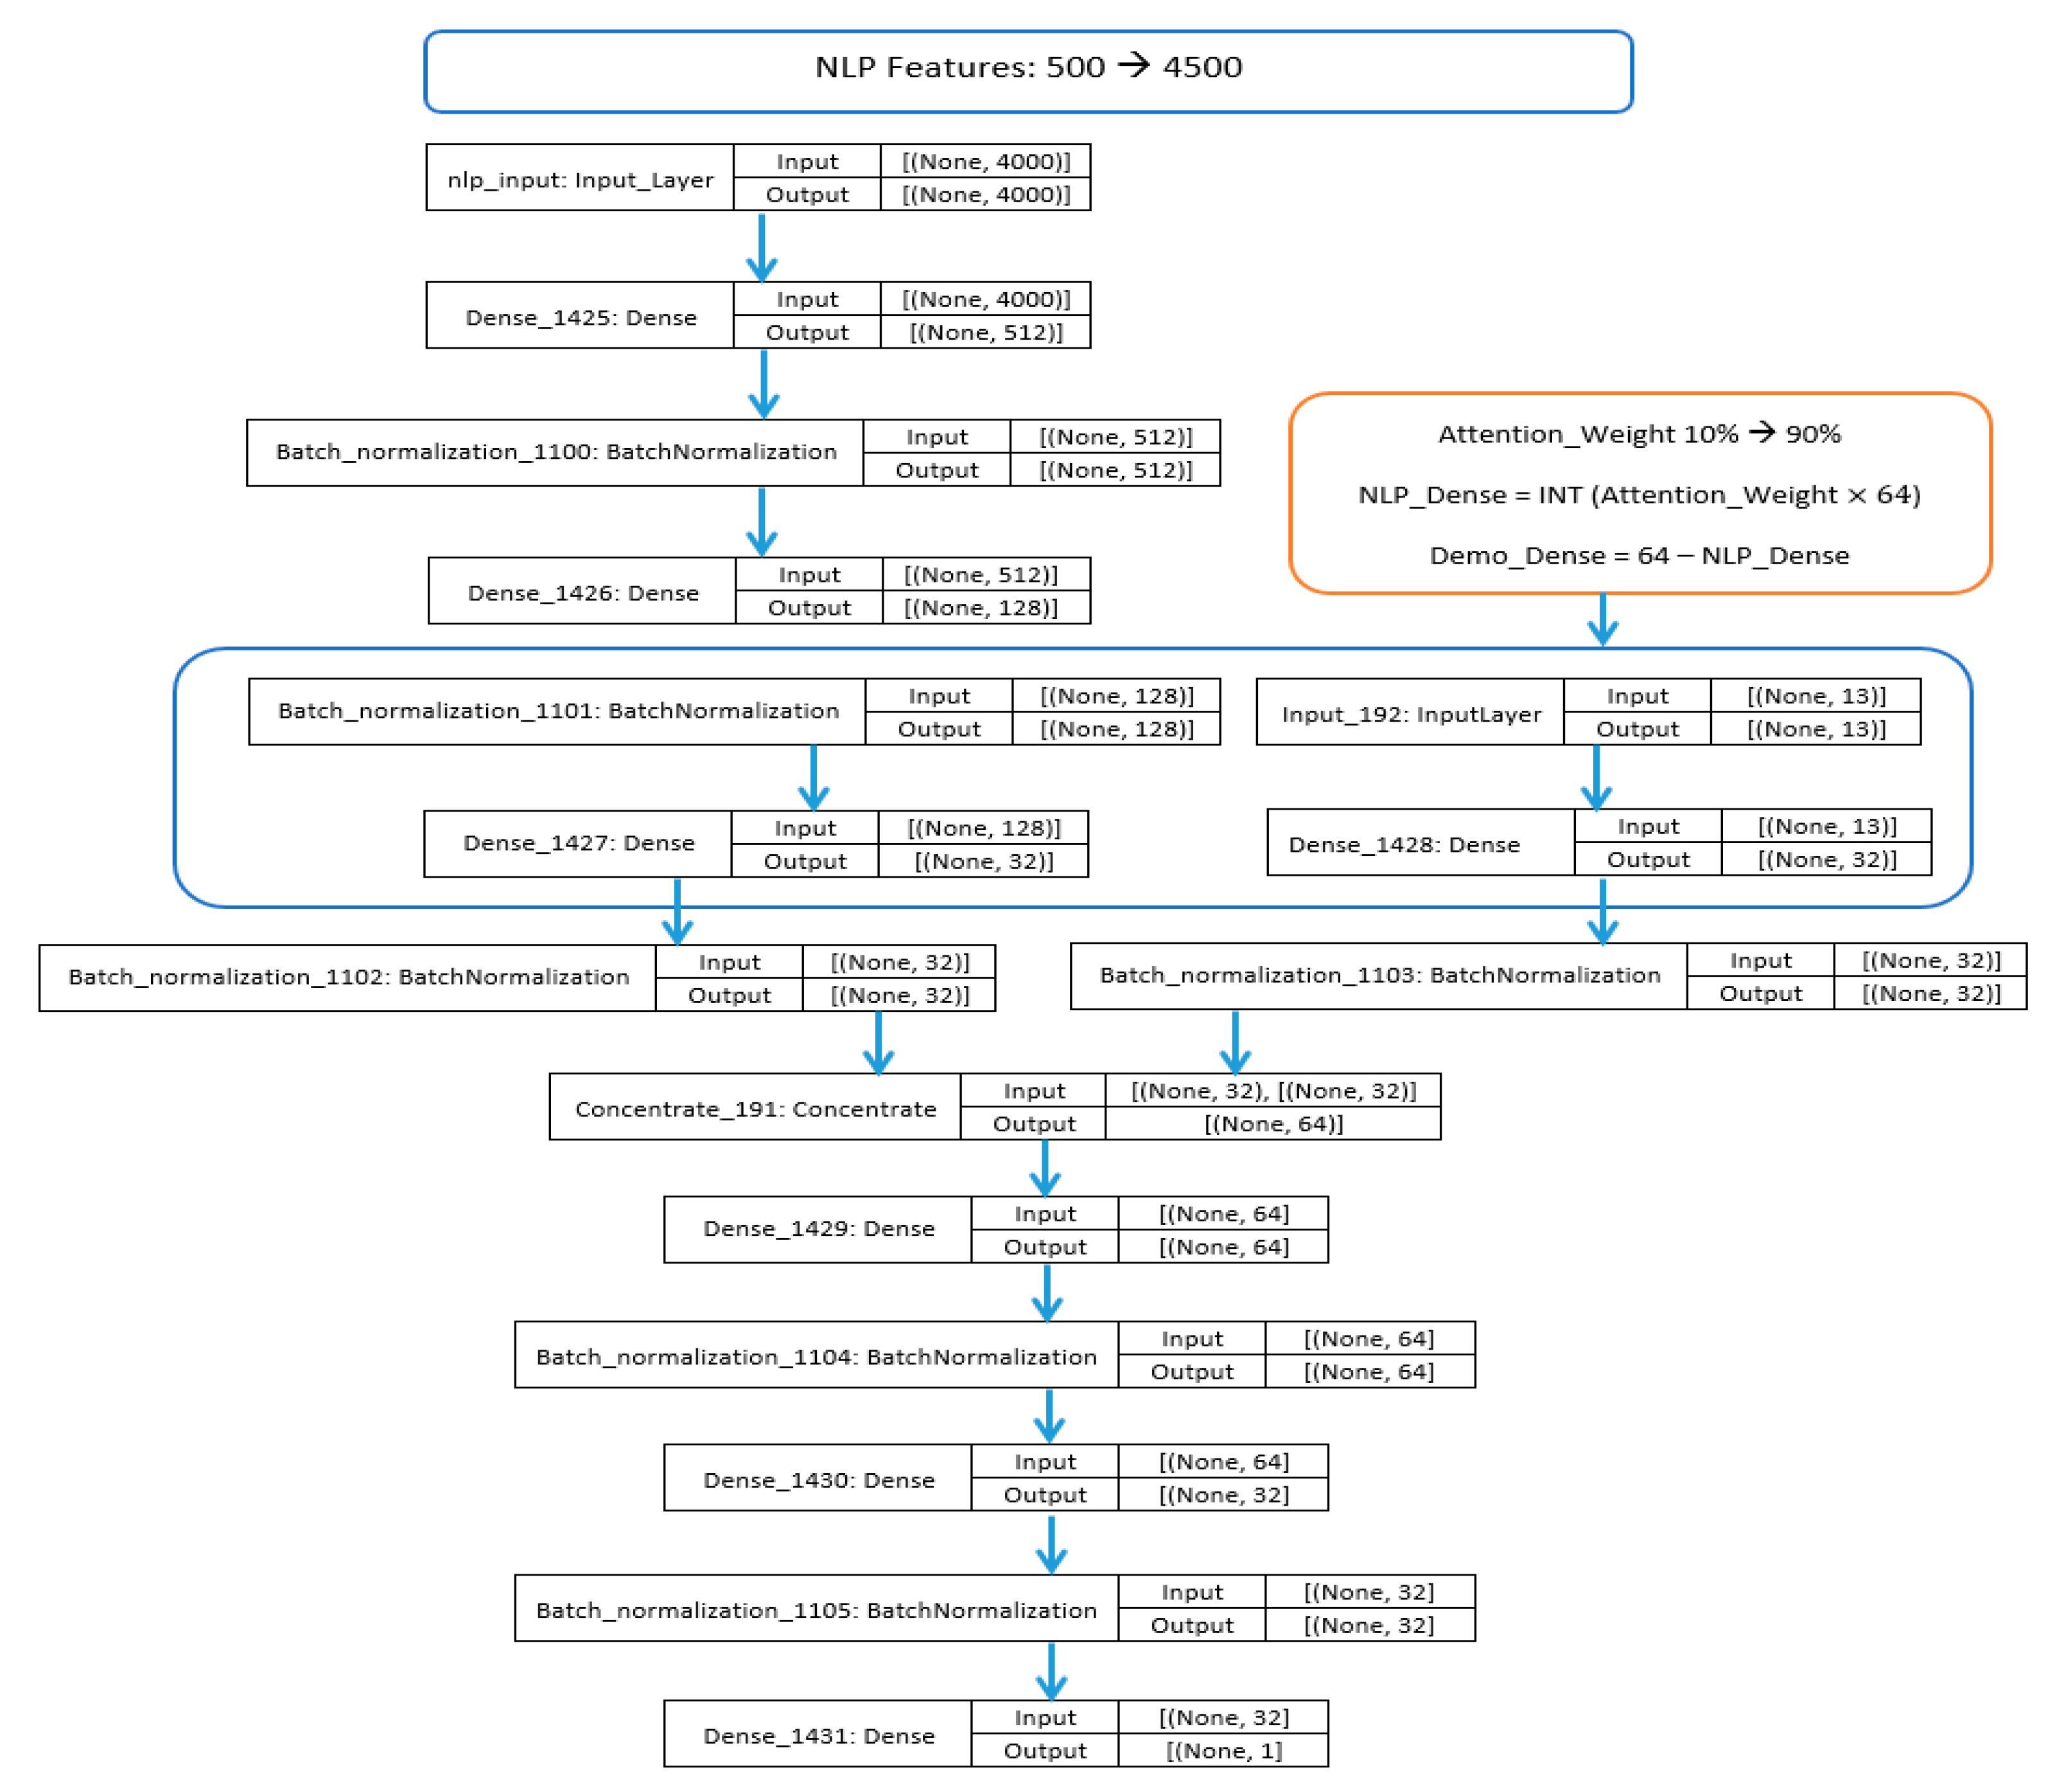
As presented in
Figure 7, our architectural canvas comprised a deep learning blueprint, with the inception layer fine-tuned to seamlessly accommodate sparse data, a hallmark of text processed via NLP. Successive layers, dense in nature, housed 512 and 128 nodes, interlaced with activation functions introducing non-linearity. BatchNormalization was incorporated as a touchstone, bolstering network stability. The node count of subsequent dense layers was influenced by the attention ratio. With the Adam optimizer at its heart and the binary cross-entropy loss function dovetailed for our binary classification paradigm, the model’s design balanced intricacy and efficacy, equipped to discern convoluted inter-feature relationships while thwarting overfitting.
5.1. Model Training and Validation
Utilizing a stratified methodology, we divided our dataset into distinct training, validation, and test segments. A significant portion, around 80%, was dedicated to training, empowering the model to decipher intricate patterns and correlations intrinsic to the data. The validation set, representing 10%, was instrumental in fine-tuning hyperparameters and optimizing the model’s architecture, which was further enriched through cross-validation techniques. The remaining 10%, designated as the test set, served as a definitive measure to gauge our model’s proficiency on novel data.
5.2. Performance Metrics
Post-training, our model’s effectiveness was gauged using an array of metrics. These included the classic accuracy, precision, recall, and the F1 score. Additionally, the area under the receiver operating characteristic (ROC-AUC) curve was also computed, given its importance in understanding the model’s ability to distinguish between the positive and negative classes in our binary classification task.
5.3. Interpretation and Insights
Beyond the quantitative metrics, our methodology also emphasized the qualitative interpretation of results. The layer-static-weighted attention mechanism, in particular, furnished insights into how the model prioritized NLP-derived features against demographic markers. This not only validated the model’s decisions but also enriched our understanding of the underlying patterns and relationships in the data.
5.4. Iterative Refinement
Drawing inspiration from an agile approach, our methodology was inherently iterative. After each model evaluation, insights and feedback were looped back into the initial stages, instigating a cycle of continuous improvement. This iterative refinement, coupled with ascending feature selection, ensured that the model’s complexity and performance were harmoniously balanced throughout the research journey.
6. Hybrid Ascending Feature Selection with Layer-Static-Weighted Attention Algorithm (HAFS-LWA)
As presented in
Figure 8, the proposed HAFS-LWA flowchart aims to find the best model for predicting adverse drug events using the FAERS dataset. First, data are preprocessed by tokenizing and encoding text data and one-hot encoding categorical data. Then, features are selected by ranking them based on their importance. Next, the model is trained iteratively, selecting the top features and performing cross-validation at each step. The algorithm uses layer-static-weighted attention to dynamically adjust the focus between natural language processing and demographic features. Finally, the model with the best average performance across validation folds is selected and evaluated on test data. This systematic approach helps to optimize the model’s performance.
Our proposed methodological landscape, crafted with a blend of advanced techniques and iterative refinement, was sculpted to derive the most meaningful and actionable insights from the FAERS dataset. This holistic approach, encompassing data preprocessing to model interpretation, lays a robust foundation for any future research endeavors in the domain of drug-related adverse events.
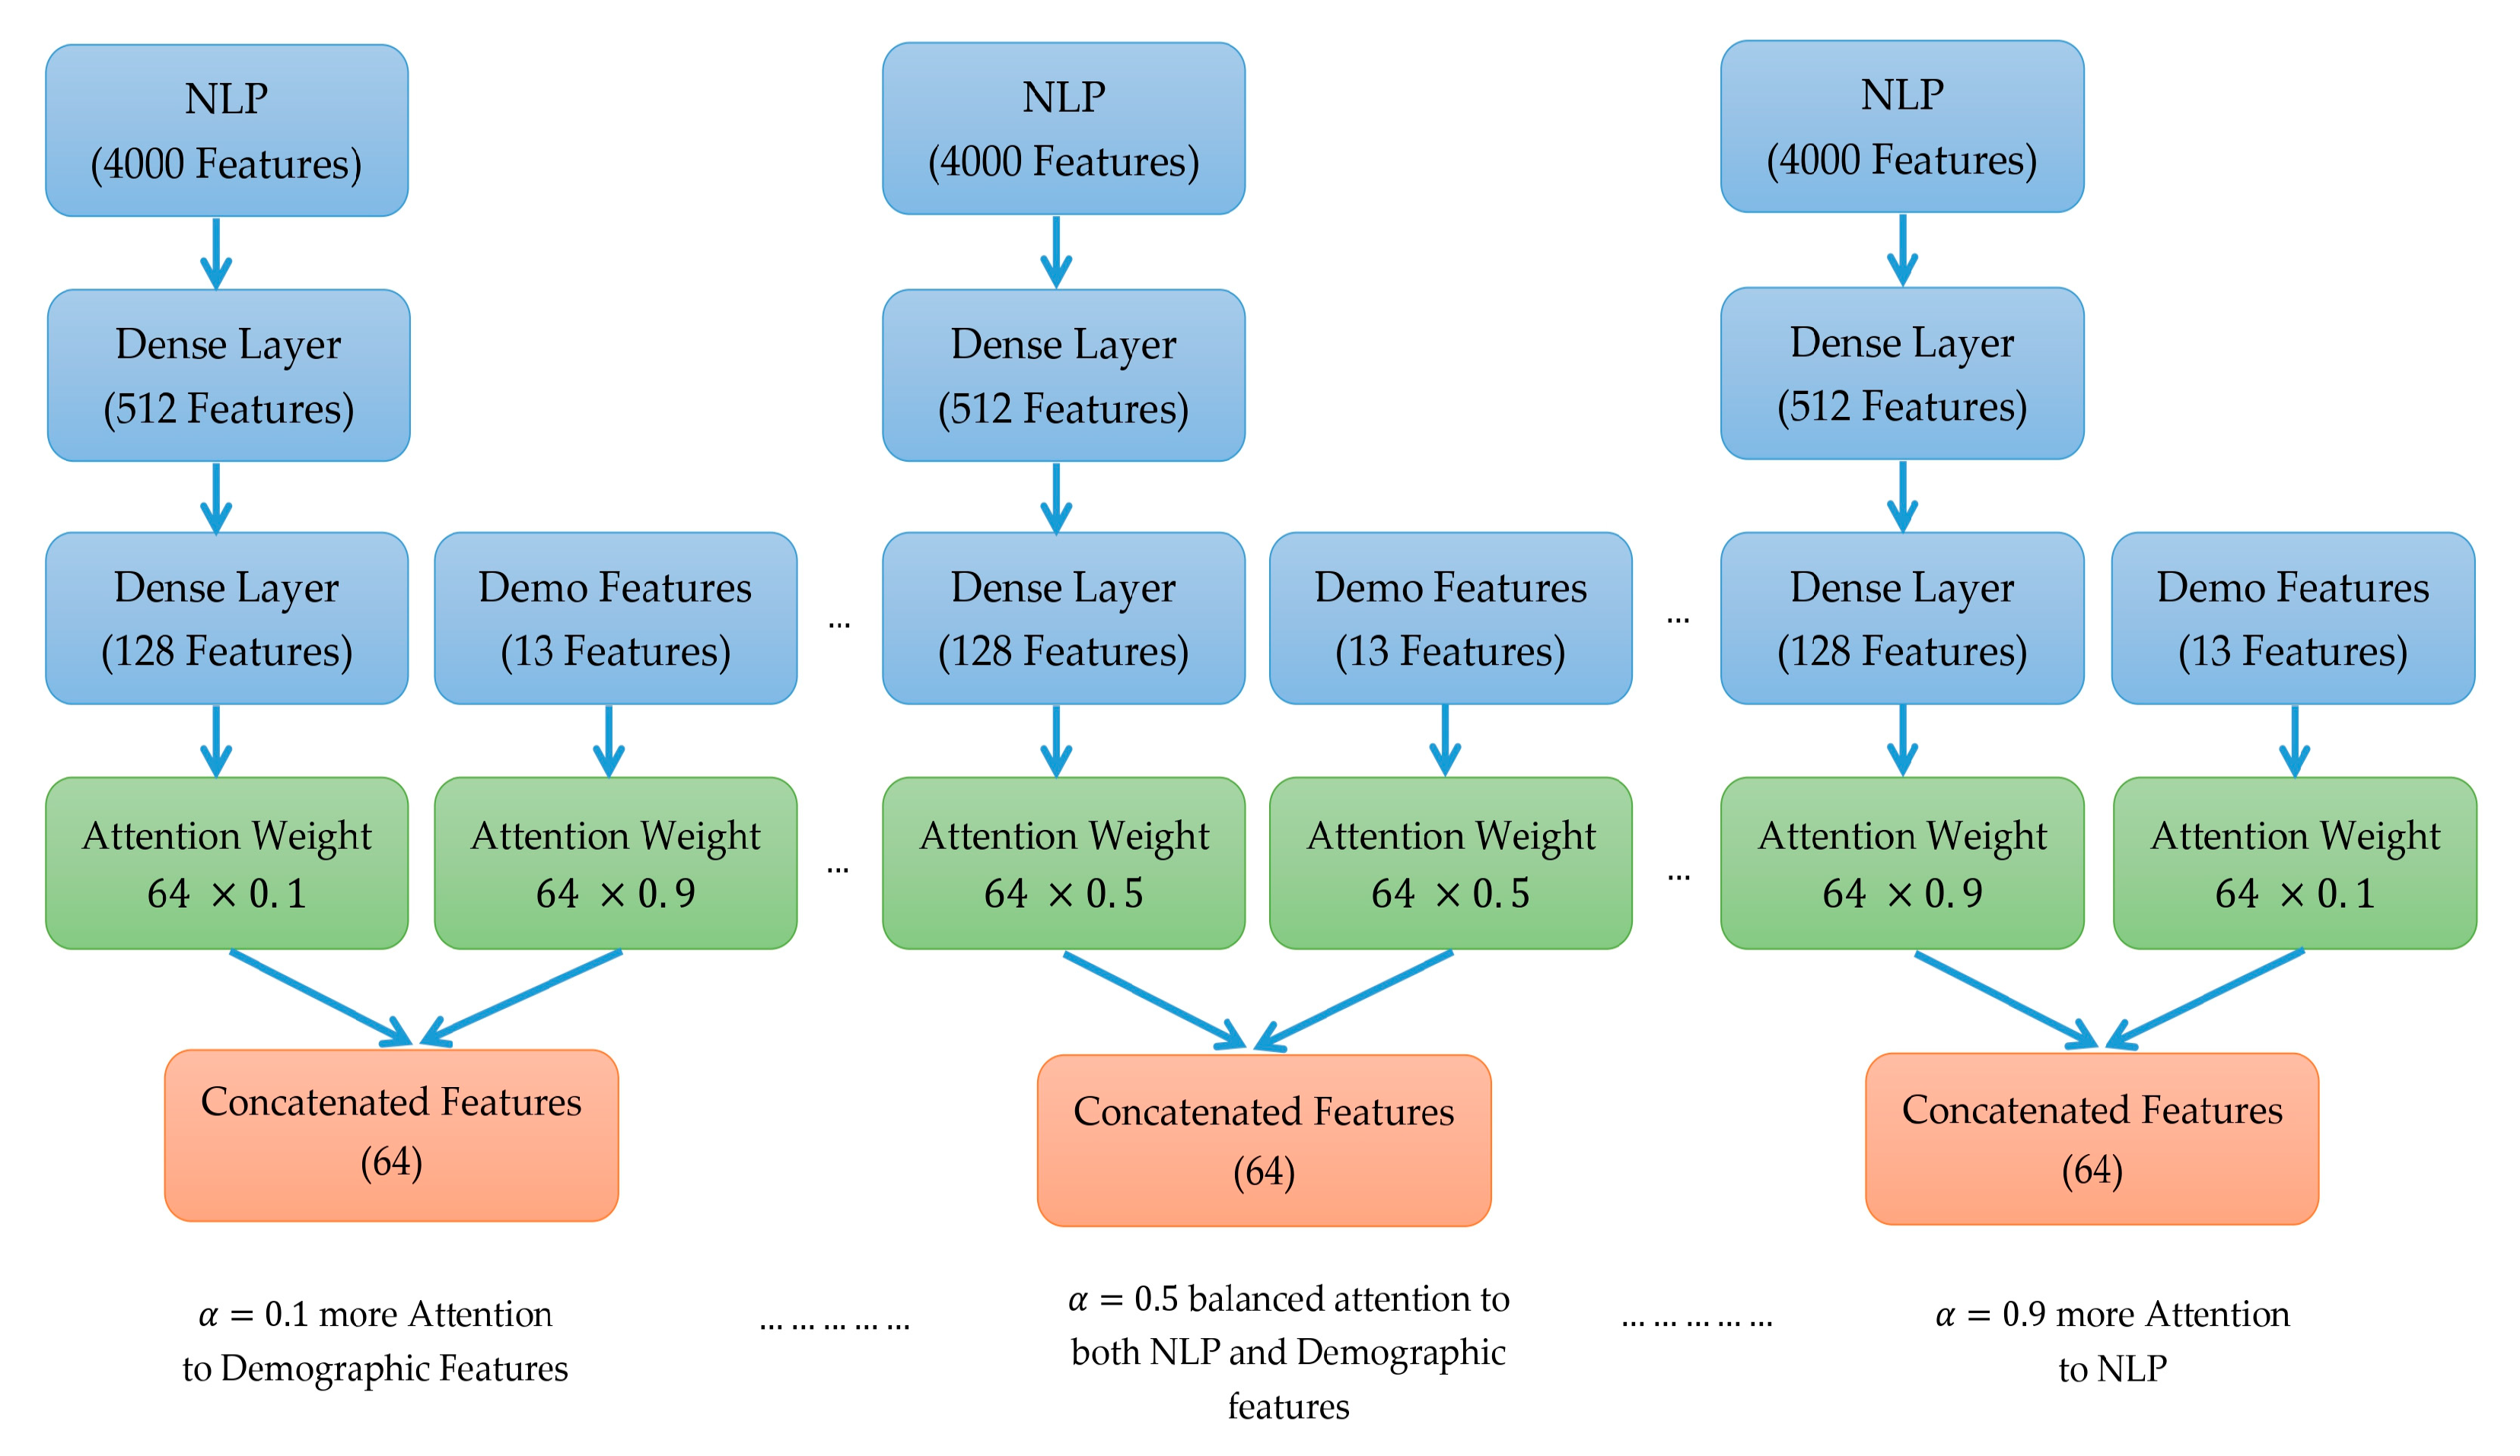
Figure 9 explains three separate NLP models, each with 4000 features. Each NLP model then passes through three dense layers, which are artificial neural network layers that take in a set of inputs and produce a set of outputs. The number of features in each dense layer decreases through the network. For example, the first dense layer in each model has 512 features, the second dense layer has 128 features, and the third dense layer has 13 features. After the third dense layer, each model splits into two branches.
One branch goes to a “demographic features” block, which contains some additional features that are specific to the task. The other branch goes to an “attention weight” block. The attention weight block calculates a weight for each of the 64 features in the input. This weight represents how important that feature is for the task. The weights are then used to combine the features from the “NLP” and “demographic features” blocks into a single vector of 64 features.
Initially, the attention distribution was set with a ratio of
for NLP features and
for demographic features. We mathematically modeled this attention allocation through a performance function
, which was rigorously designed to quantify the model’s classification accuracy. To ensure an exhaustive search for the optimal feature balance, we iteratively adjusted
in increment of 0.1, systematically exploring the performance landscape as explained in the following equations:
This iterative process is the crux of our optimization methodology, continuing until the improvement in plateaus, indicating the achievement of the optimal attention ratio. It is crucial to note that this methodical adjustment of is not merely a linear search; it is a strategic exploration that accounts for non-linear interactions between features. The optimal captures the most effective distribution of attention, fine-tuning the model to exploit the intricate patterns and dependencies within the data.
Our layer-static-weighted attention mechanism is a significant departure from traditional static weighting schemes.
By dynamically reallocating attention, our model adaptively learns which features yield the most significant predictive power. This is particularly beneficial in the context of adverse drug event reporting, where the interplay between the textual descriptions of ADRs and demographic information can be complex and highly variable.
Moreover, the empirical results obtained through this innovative approach demonstrate superior performance compared to static models. The dynamic reallocation of weights allows our model to adjust to the heterogeneity of the data, reflecting a deeper understanding of the underlying feature space. By emphasizing the most relevant features, our model shows improved generalization capabilities, reducing the likelihood of overfitting, which is often a challenge in high-dimensional NLP feature spaces.
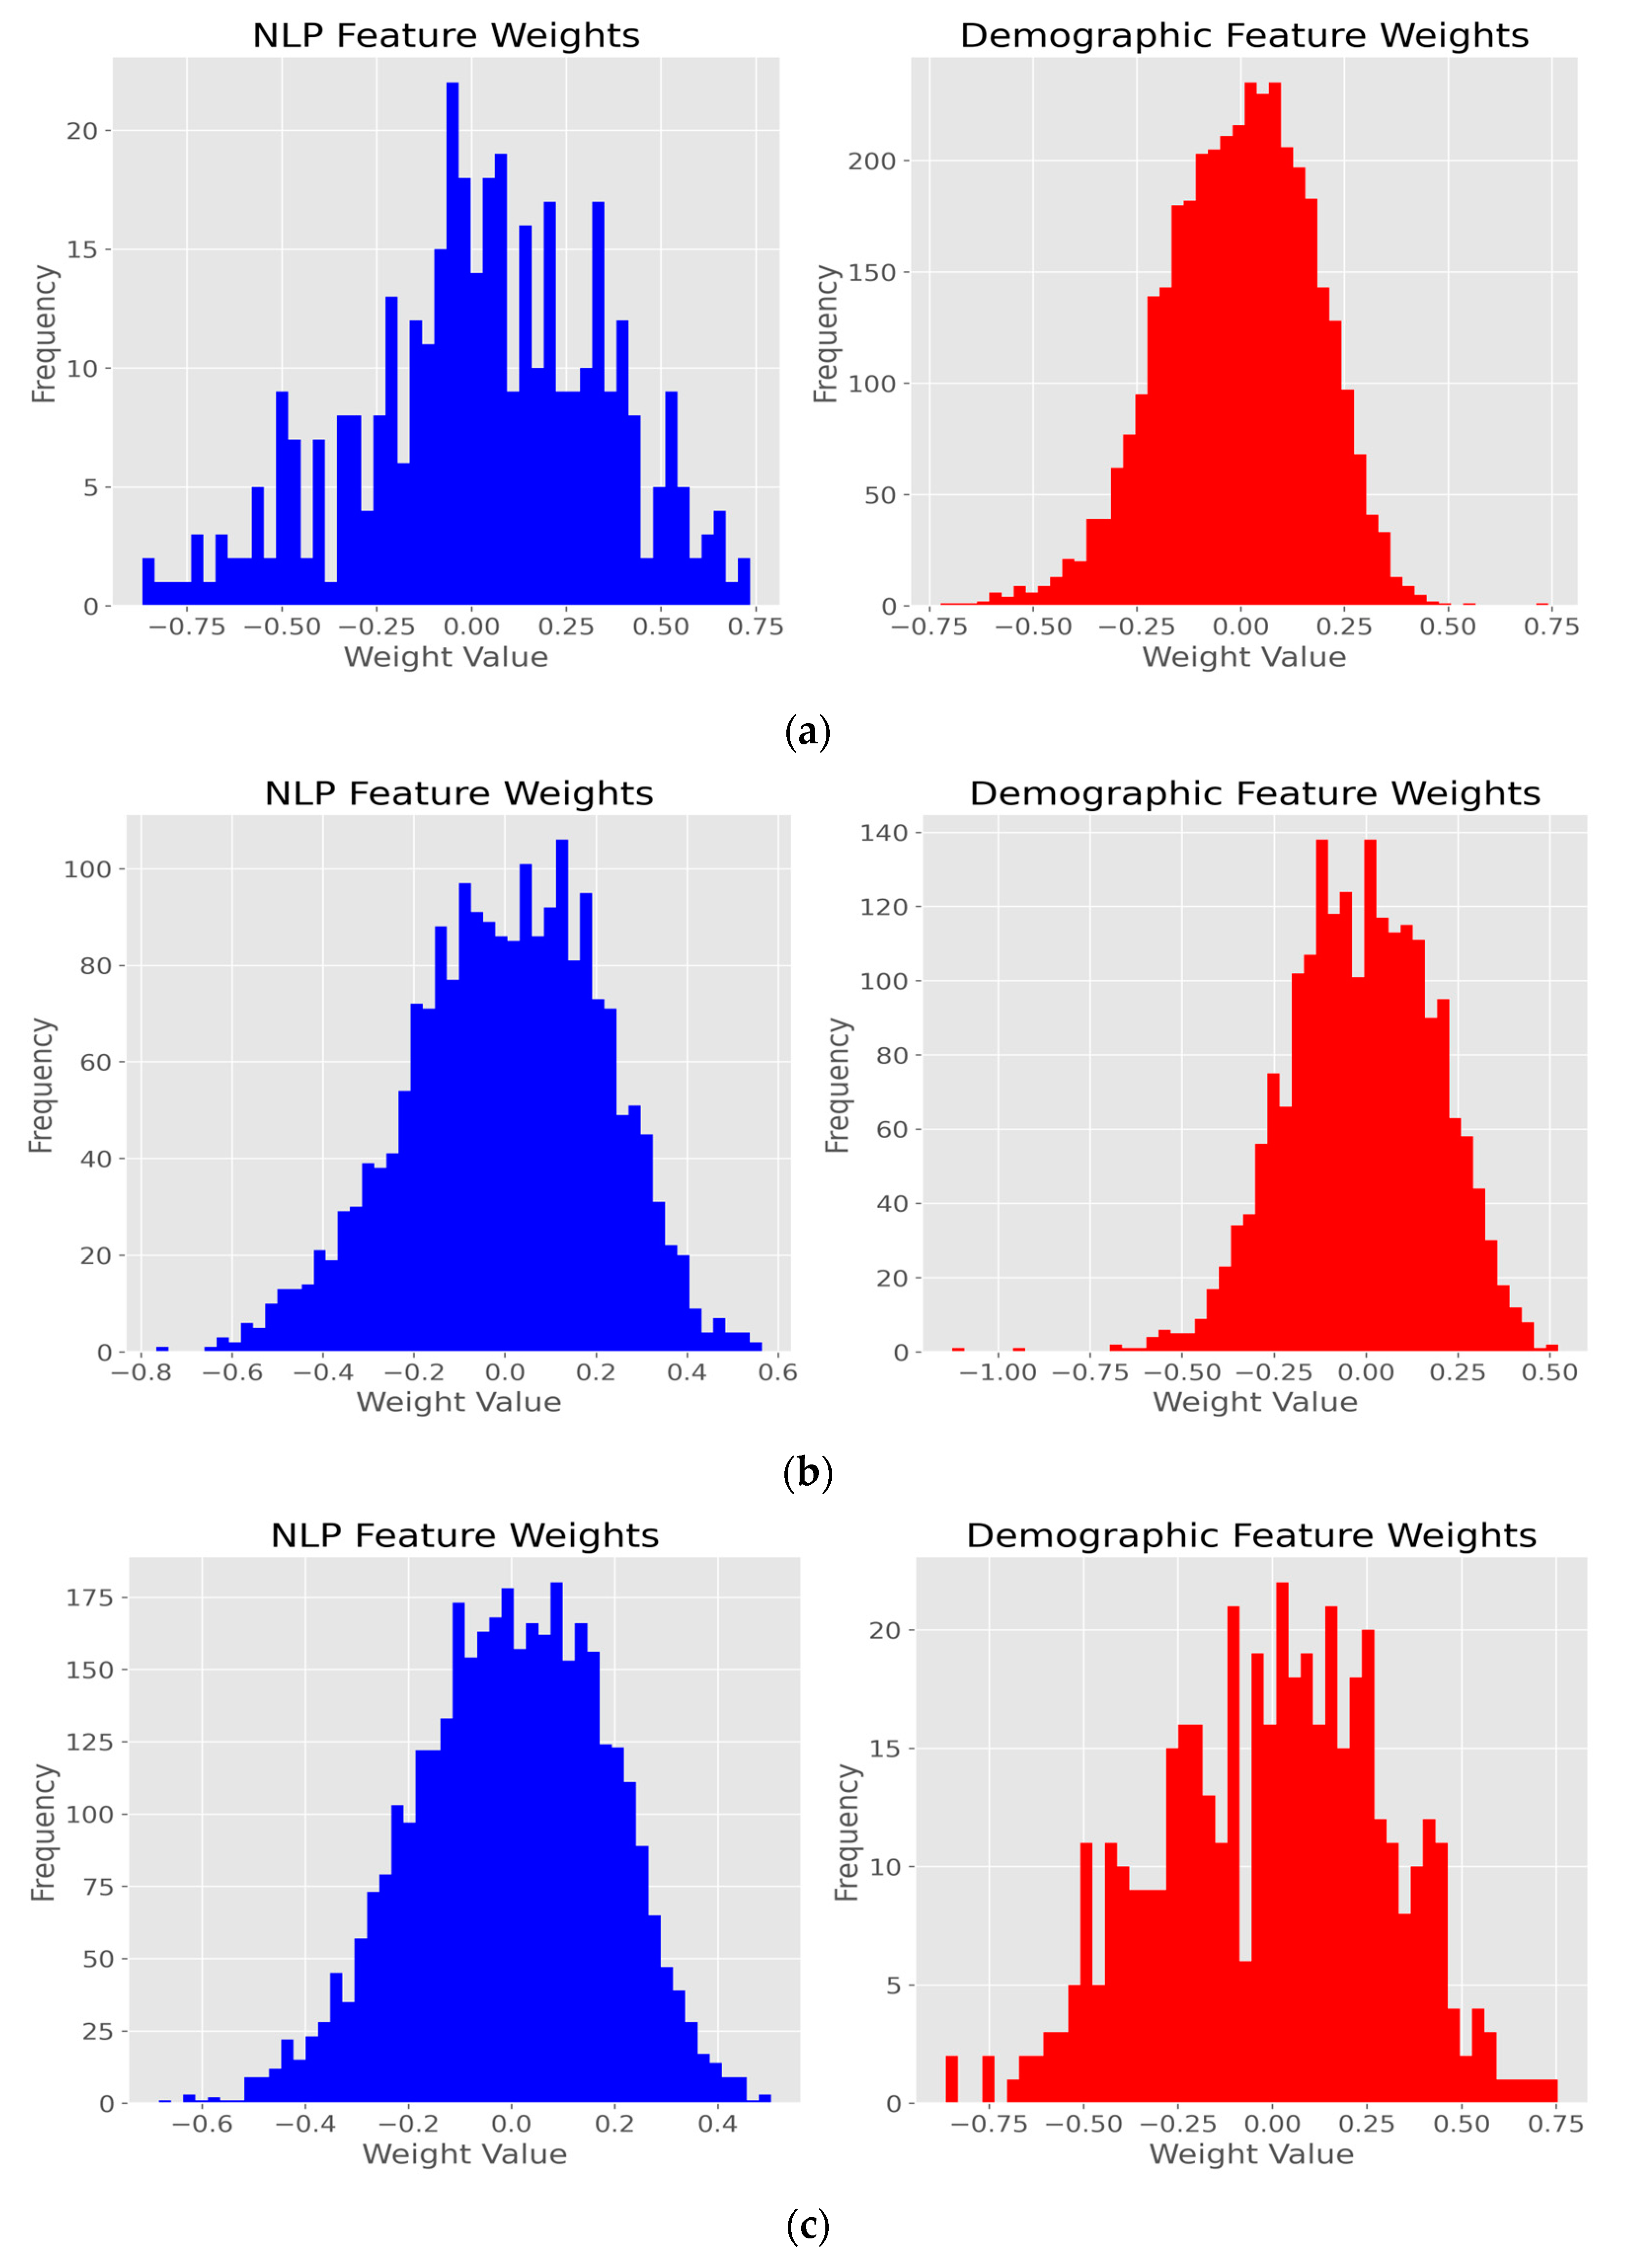
Figure 10 displays the weight distributions for the deep learning model’s features at three distinct attention weights (α = 0.1, 0.5, and 0.9), with each row of histograms corresponding to a different attention weight setting that balances the focus between NLP and demographic features. At α = 0.1 (
Figure 10a), the attention weight favors demographic features (90%) over NLP features (10%), which is evidenced by the broader and more pronounced histogram for demographic features and the narrower one for NLP features, indicating a lesser emphasis on the latter. Conversely, at α = 0.9 (
Figure 10c), the NLP features receive 90% of the attention weight, resulting in a wider distribution of weights and a higher frequency, signifying their increased importance in the model’s decision-making process. The demographic features, receiving only 10% of the weight, show a constricted histogram, reflecting their diminished impact.
The balanced scenario, α = 0.5 (
Figure 10b), provides an equitable distribution of attention, with both NLP and demographic features influencing the model to a similar degree. This is visible in the histograms’ comparable spreads and frequencies of weights, suggesting a harmonized contribution of both feature sets to the model’s outputs. Given these observations, the most balanced and potentially most effective model is achieved at α = 0.5, where neither feature set is disproportionately weighted, allowing the model to leverage a more integrated and potentially more robust feature representation for prediction tasks.
In summary, our layer-static-weighted attention mechanism is a transformative step in the development of predictive models for pharmacovigilance, offering a robust, mathematically grounded approach that significantly improves upon state-of-the-art methods. This methodical recalibration of feature focus provides a profound leap forward in how deep learning models can discern and prioritize information, promising to refine the accuracy of adverse drug reaction predictions and enhance the safety profiles of pharmaceuticals.
7. Results and Discussion
In this section, we elucidate the outcomes derived from various modeling techniques and their comparative performances. These results represent a culmination of our rigorous efforts to optimize model efficiency, particularly when dealing with the vast and complex FAERS dataset. The main objective was to improve the predictive accuracy of a model on a specific dataset by exploring different techniques, such as ascending feature selection and layer-static-weighted attention, and combining them to outperform the baseline model. The main goal was to optimize the model’s accuracy and ability to predict outcomes based on the features in the dataset, especially natural language processing (NLP) and demographic features.
Baseline Model: Our foundational model, hinged solely on NLP features capped at 5000 features, marked a validation accuracy of 70.27%. Concurrently, it registered a test accuracy of 70.28%, including all extracted NLP features without filtering out any feature.
Ascending Feature Selection: With the deployment of ascending feature selection, there was an observable progression in the model’s performance commensurate with the amplification of features.
Table 3 presents the results of an ascending feature selection process, detailing how the average validation and test accuracies evolve as the number of features increases from 500 to 5000. Initially, both accuracies improve as more features are added, reflecting the model’s enhanced ability to generalize from the training data to unseen data. This trend continues up to 4000 features, beyond which we observe a plateau and even a slight decline in performance when reaching 4500 features, indicating a point of diminishing returns. Despite incorporating the largest set of features, the model with 4500 features does not achieve the best performance according to the provided metrics. The peak in performance occurs with 4000 features, where both validation and test accuracies are the highest. The slight decrease in accuracy with 4500 features suggests that the model may be overfitting, capturing noise, or irrelevant patterns in the additional data. Therefore, the model with 4000 features emerges as the optimal choice, striking a balance between high accuracy and avoiding the complexity and potential overfitting associated with the maximum number of features. This model provides effective and reliable predictions without unnecessary complications. To further enhance the model’s performance, especially on the optimal set of 4000 features, implementing a “layer-static-weighted attention” mechanism could be the next stage. Layer-static-weighted attention is an advanced technique in deep learning models, particularly useful in complex models, where it allows the model to focus more effectively on the most informative parts of the input data. By weighting the importance of different layers’ outputs, this approach can help in capturing more nuanced patterns and relationships in the data, potentially improving the model’s accuracy and generalization ability. This technique is especially promising for refining the model’s understanding and processing of the optimal feature set, thereby potentially surpassing the current state-of-the-art results.
Layer-Static-Weighted Attention: The application of layer-static-weighted attention to the model brings a nuanced improvement in performance, emphasizing the importance of a balanced focus between NLP-sourced and demographic features.
Table 4 illustrates the progression of the model’s average validation and test accuracies as the attention weight shifts. The strategic adjustment of attention weights showcases a clear trend: As the weight approaches a 50-50 distribution between the two categories of features, both validation and test accuracies improve, reaching peak performance the optimal decided based on the highest validation accuracy of 74.54%. This balanced approach, with equal weightage to NLP-sourced and demographic features, results in the highest test accuracy of 74.56% and a closely matched cross-validation (CV) ROC score of 74.49%. The data indicate that the model achieves optimal performance at this equilibrium, underscoring the significance of a harmonized attention mechanism for both types of features. The layer-static-weighted attention mechanism enhances the model’s ability to extract and prioritize relevant information from both feature sets, leading to a more effective and discriminating predictive model. Such a targeted focus on maintaining an equal importance level across diverse feature types not only improves the model’s accuracy but also its generalizability. This is particularly evident in the consistent increase in performance metrics up to the 50% attention weight mark, after which the performance begins to plateau and then slightly declines. This pattern suggests that an overly skewed focus toward one type of feature over the other diminishes the model’s effectiveness, highlighting the critical role of balanced attention in achieving superior model performance.
The performance with the amalgamation of ascending feature selection and layer-static-weighted attention remarkably transcended that of the baseline model. This augmentation not only epitomizes the potency of a synergized approach but also accentuates that an astute capitalization on the comprehensive nuances of the FAERS dataset, coupled with a meticulous calibration of the model’s emphasis on varied feature dimensions, can be instrumental in fortifying predictive accuracy.
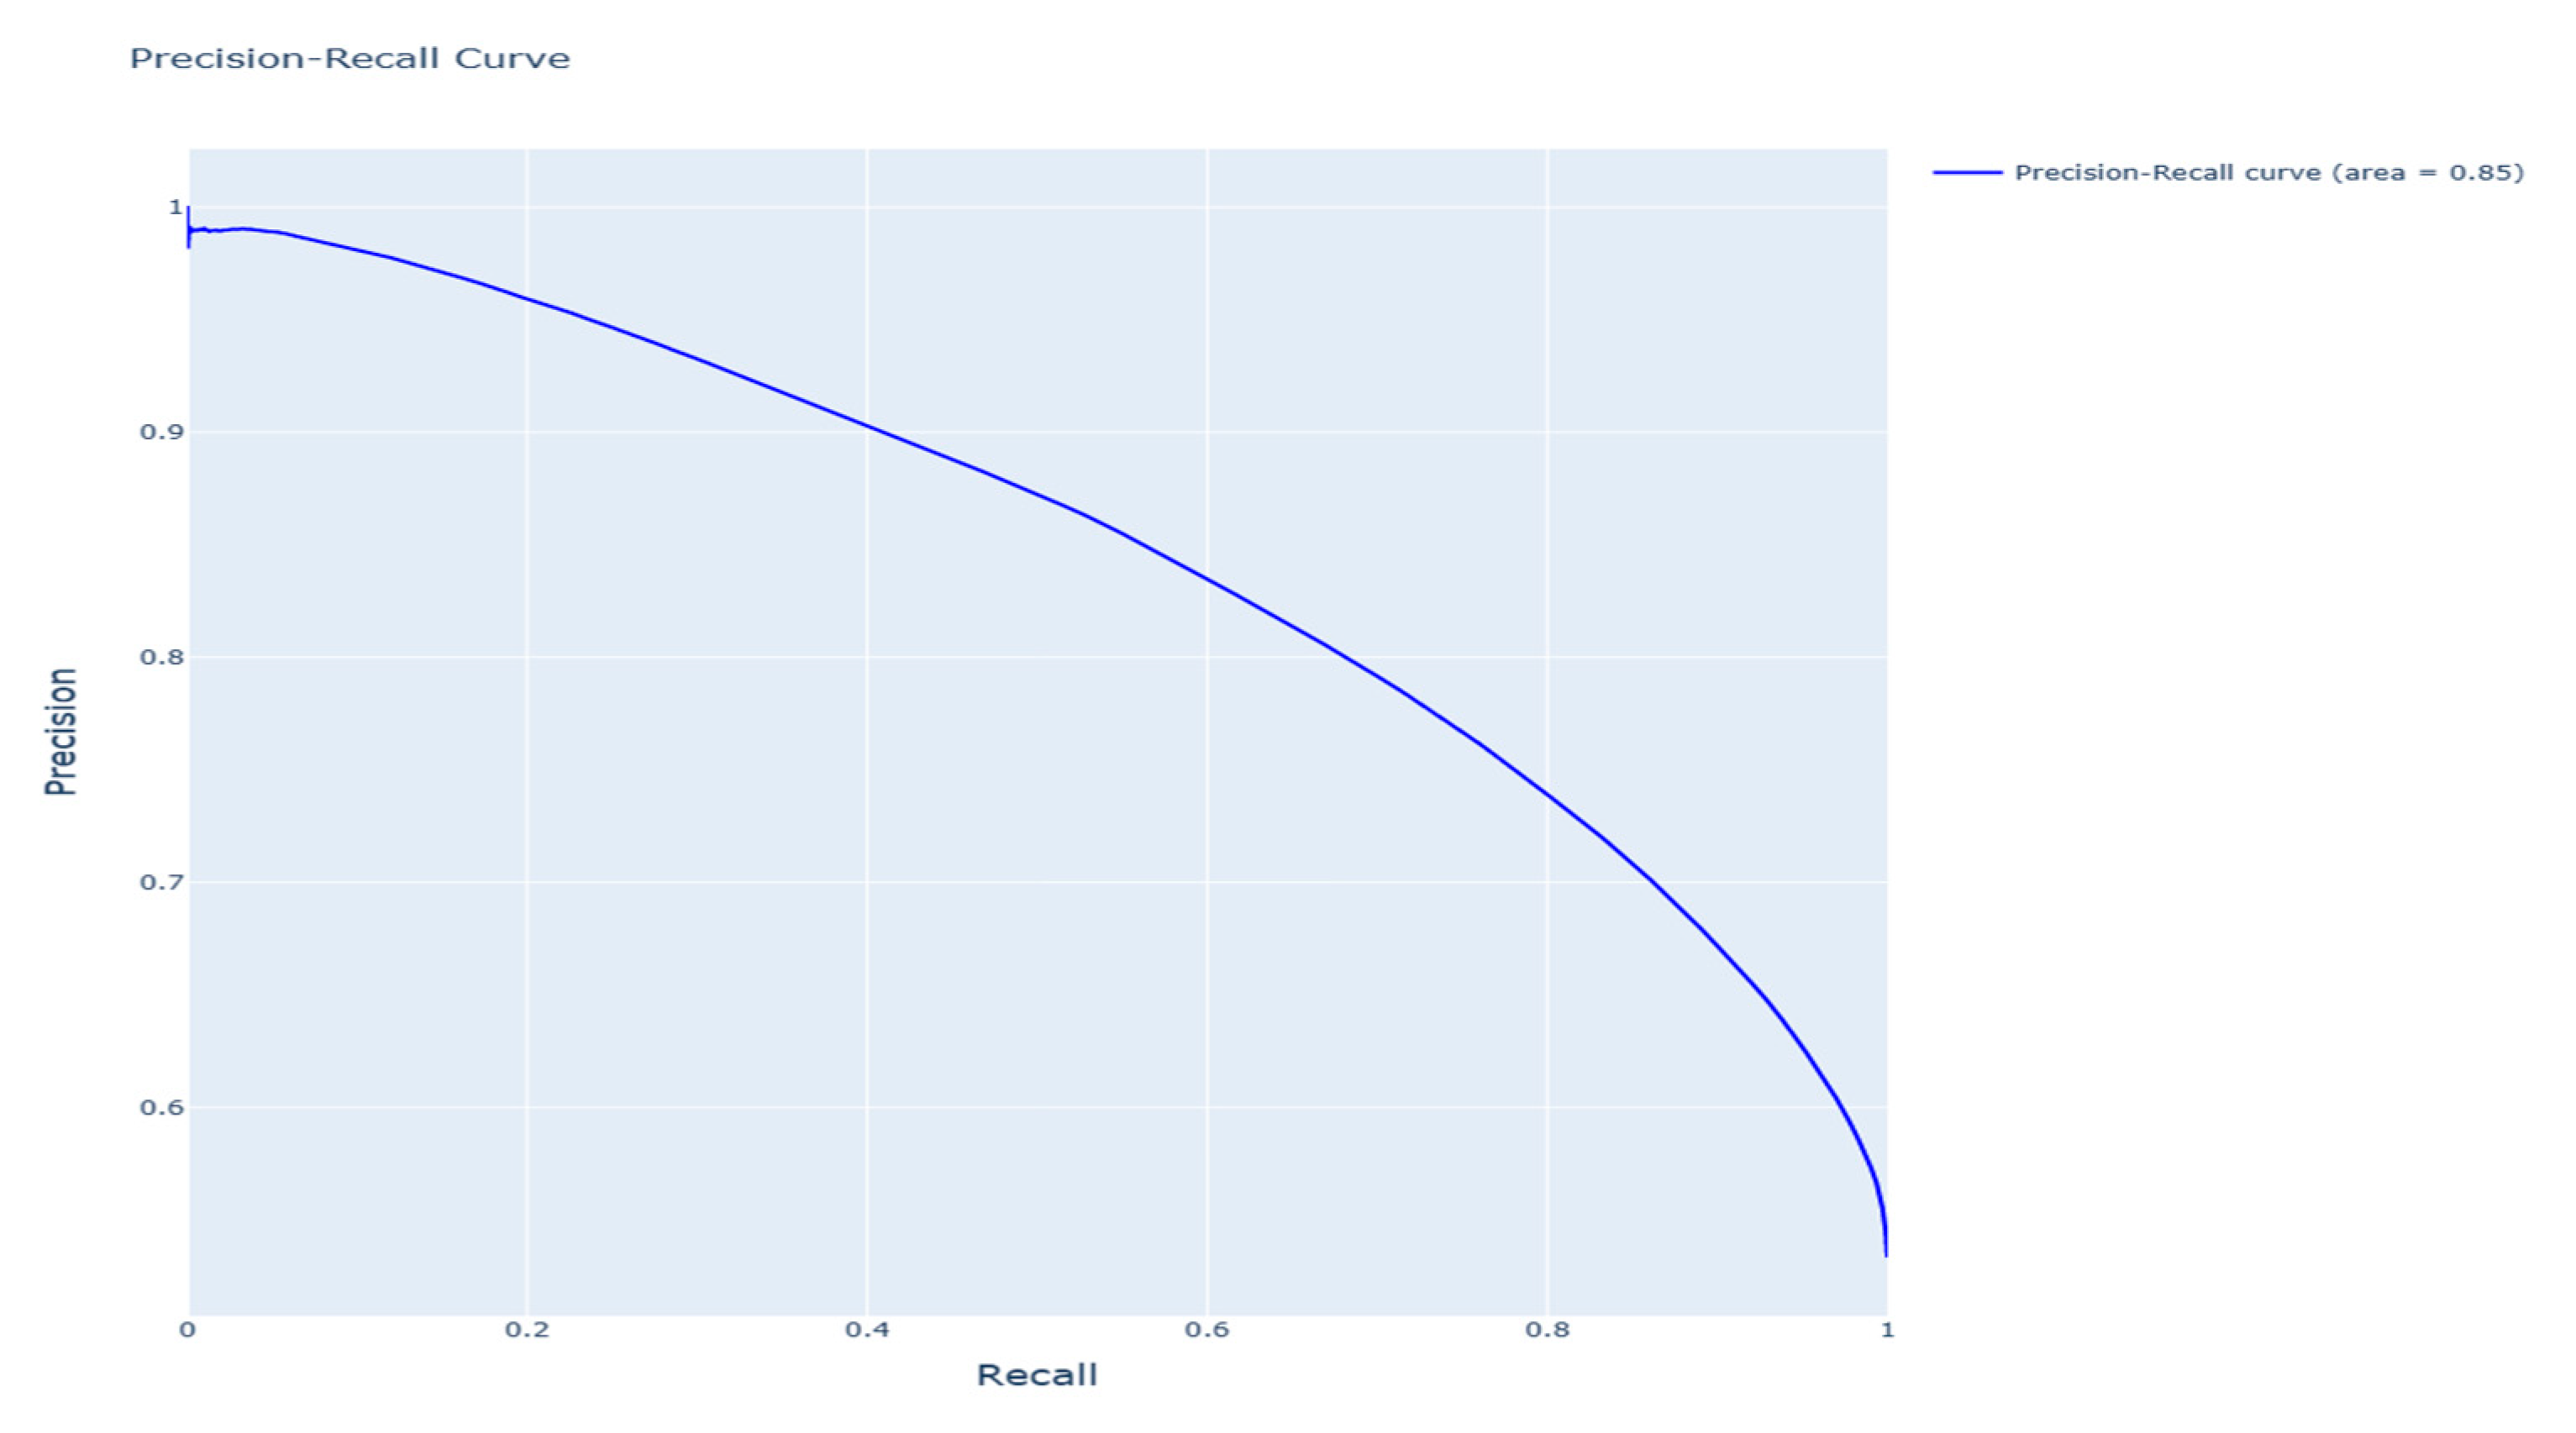
The evaluation of the classification model’s ability to discern the seriousness of drug events was comprehensively carried out by employing precision–recall (PR) and receiver operating characteristic (ROC) curves, showcased, respectively, in
Figure 11 and
Figure 12. The precision–recall curve elucidated in
Figure 10 presents an impressive area under the curve (AUC) of 0.83, denoting a commendable balance of precision and recall within the classification task, thereby underscoring the model’s proficiency in accurately classifying serious and non-serious drug events. Meanwhile, the ROC curve depicted in
Figure 11 presents an AUC of 0.83, signifying a respectable level of discrimination, although it also hints at potential areas for refinement, notably in diminishing the rate of false positives. Further elucidation of the model’s classification performance is provided with a confusion matrix, which reveals a true-positive rate, or sensitivity, of 75.76% for predicting serious drug events and a true-negative rate, or specificity, of 73.19% for non-serious drug events.
Figure 11 and
Figure 12 align closely with the precision and recall values of 0.76 for the positive class, suggesting the model’s balanced competency in identifying both serious and non-serious events. The classification report sheds light on nuanced aspects of predictive performance: The model demonstrates an equal capacity, as indicated by an F1 score of 0.73, for predicting non-serious events, while it exhibits marginally superior precision and recall values of 0.76 for serious event predictions. Collectively, the model attains an overall accuracy of 0.75, with both macro and weighted averages for precision, recall, and F1 scores hovering around 0.74 and 0.75, reflective of the model’s robustness and uniform performance across the dual categories of drug event severity. These statistical figures and graphical representations articulate the model’s current capabilities and boundaries, suggesting that despite its effective differentiation between serious and non-serious drug events, there remains an avenue for enhancement, particularly pertinent in scenarios characterized by an imbalanced dataset.
Our methodological exploration into modeling with the FAERS dataset displayed definitive improvements as we progressed from basic modeling strategies to more nuanced approaches. From the ascending feature selection results, it is evident that as we escalated the number of features, the model performance saw a marked improvement. Beginning with 500 features, the model exhibited an average test accuracy of 69.259%. With the augmentation to 4000 features, the accuracy bolstered to a promising 70.286%. The trend in the CV ROC score validated this progression, moving from an initial 72.53% with 500 features to 74.49% with 4500 features. The layer-static-weighted attention method demonstrated the intricate balance required between NLP-driven and demographic features. Intriguingly, the results peaked when both feature types were given equal emphasis, registering the highest average test accuracy of 70.286% and CV ROC score of 74.49% at a 50% weightage. In light of the empirical data, a clear takeaway emerges: While the sheer volume of features plays a pivotal role in enhancing performance, the judicious weighting between different feature categories is equally crucial. This dual strategy ensures not only a granular understanding of the data but also a model that is attuned to the nuanced variances within.
In
Table 5, we summarize the performance of recent and related methods applied to the FAERS dataset with our proposed model. Some studies achieved higher AUROC scores for identifying high-risk medications (0.82–0.92), while our proposed model used a combination of NLP and demographic data, achieving a test accuracy of 74.56% and CV ROC score of 0.83 for predicting the seriousness level of ADEs.
8. Discussion and Future Work
This study represents a substantial stride in the application of advanced predictive modeling techniques within the domain of pharmacovigilance, utilizing ascending feature selection and layer-static-weighted attention to refine the prediction accuracy of adverse drug events. While the results underscore a marked improvement over the baseline model, this investigation also brings to light several limitations and challenges inherent in our approach, alongside a detailed contemplation of its theoretical and practical implications.
8.1. Drawbacks and Constraints
Our methodology, while innovative, encounters the challenge of balancing the addition of complex techniques like ascending feature selection and layer-static-weighted attention with the need for model interpretability. These advanced techniques may be useful, but the process becomes more robotic and complicated, and at the same time, they make the models more complicated and less transparent. This complication increases suspicion of the model’s acceptance in clinical environments. Therefore, understanding and trusting the mechanism of the model’s prediction is mandatory.
In addition, the existence of bias in the FAERS dataset, which covers a wide range of patients notwithstanding, results in the limitation that the model may fail to detect the true range of patient demographics and conditions, which will tremendously compromise its generalization. It is therefore crucial to develop a comprehensive approach that considers these factors while maintaining the balance between the use of complex and interpretable models. An approach with diverse data sources, including algorithms, can reduce the built-in bias, which will make the model more relevant and embraced in the current pharmacovigilance practice. The goal is still to refine the strategies well enough to find their place in drug safety monitoring, and that is why we are constantly working on new ideas and developing the existing approaches to remain valid contributors to an already complex work of clinicians and researchers.
8.2. Theoretical Implications
Theoretically, our study advances the understanding of feature selection and attention mechanisms within the context of deep learning applied to pharmacovigilance. By delineating the impact of feature amplification and the strategic weighting of different types of features, our research contributes to the broader discourse on model optimization and complexity in machine learning. The exploration of diminishing returns in feature selection offers valuable insights into the balance between model complexity and predictive performance, highlighting the nuanced trade-offs that must be considered in the design of predictive models.
8.3. Practical Implications
Practically, the enhanced predictive accuracy afforded by our methodologies holds significant promise for the field of drug safety monitoring. The potential to streamline FDA data processes and improve the identification of adverse drug events could markedly benefit public health by enabling more timely and accurate safety interventions. However, the implementation of these advanced models in real-world pharmacovigilance systems necessitates careful consideration of operational challenges, including the integration with existing IT infrastructures and the ongoing maintenance and updating of the models in response to new data.
8.4. Future Work
Future research endeavors should focus on addressing the identified drawbacks and exploring alternative methodologies that could mitigate the computational and scalability challenges. This includes the development of more efficient feature selection techniques that can further refine the feature set without compromising model performance. Furthermore, incorporating other datasets, like DrugBank, and investigating the possibilities of combining data from several sources could improve the model’s precision and comprehensiveness. A more in-depth analysis of the trade-offs between model complexity and generalizability is warranted. This could involve investigating other machine learning and deep learning architectures that may offer improved performance or efficiency. Furthermore, the practical deployment of these models should be closely examined, with studies aimed at assessing their performance in diverse healthcare settings and their integration into existing pharmacovigilance workflows.
In summary, while our study presents a significant advancement in predictive modeling for drug safety, it also opens up numerous avenues for further research and development. Addressing the limitations and expanding upon the theoretical and practical implications of our work will be crucial for harnessing the full potential of advanced machine learning techniques in the enhancement of pharmacovigilance systems.
9. Conclusions
In conclusion, to enhance the predictability of the severity of adverse drug events, we ventured into the intricacies of the FAERS dataset. We introduced an innovative and composite methodology, amalgamating ascending feature selection with layer-static-weighted attention. The essence of this methodology was to underscore that, while individual feature sets might provide valuable insights, a holistic approach that integrates diverse feature sets offers richer perspectives and enhanced predictive accuracy. The clear demarcation in the results between our methodology and the baseline model, which was predominantly anchored on NLP features, speaks volumes. Our model’s pronounced progression accentuates the profound merits of meticulously blending diverse features and systematically sieving through them. This harmonized approach resulted in an impressive average test accuracy of 74.56% and a CV ROC score of 0.83. In comparison, the baseline’s performance—a test accuracy of 70.31% and an AUC score of 0.70—exemplifies the gaps that can arise when relying on a singular data facet. This research offers insight into the transformative potential of methodological innovation. In a domain as critical as drug safety and pharmacovigilance, even marginal improvements in predictive accuracy can have substantial real-world implications. Enhanced predictability could translate to more timely interventions, potentially safeguarding countless individuals from severe adverse drug reactions. Furthermore, this study serves as a testament to the idea that harnessing the full breadth and depth of available data, combined with intelligent model architectures, can lead to significant advancements in performance. This dynamic calibration and attention mechanism are especially relevant in today’s data-abundant world, where discerning the signal from the noise is more challenging and yet more crucial than ever. In summary, this investigation not only contributes a robust analytical framework to the field of drug safety but also beckons a paradigm shift toward embracing multifaceted data-driven approaches. Our findings will be a touchstone for future research endeavors, inspiring deeper dives and further innovations in this pivotal domain.


 ,
, 


