Abstract
Using industrial by-products to replace cement is an important way to reduce carbon emissions in the cement industry. The purpose of this article is to understand the effect of quartz powder on the properties of cement-based materials. Experimental studies were conducted on the macroscopic and microscopic properties of cement-based materials mixed with quartz powder to evaluate their feasibility as a replacement for cement. The substitution rates of quartz powder were 0% (Qu0), 7.5% (Qu7.5), and 15% (Qu15). The test time was from 1 day to 28 days, and the main results are as follows: In the early stage of the hydration reaction, as the amount of quartz powder substitution increases, the cumulative hydration heat increases. This is mainly because the nucleation effect of quartz powder accelerates the hydration reaction of cement. In the later stage of the hydration reaction, as the amount of quartz powder substitution increases, the cumulative heat of hydration decreases. This is mainly due to the diluting effect of quartz powder. For Qu0, Qu7.5, and Qu15, the decrease in compressive strength after 1 day is not obvious. The decrease in compressive strength at 28 days is more obvious. Overall, there are exponential relationships between the UPV measurement or surface resistivity results and the compressive strength measurement results at 1, 3, 7, and 28 days. The XRD test results show that the main products of the reaction are AFt, CH, Hc, and Mc. From Day 1 to Day 28, the content of Mc becomes evident. The test results for TG showed that, as the amount of quartz powder substitution increases, the mass loss decreases. For different specimens of Qu0, Qu7.5, and Qu15 at different test times (3 and 28 days), there is an exponential function relationship between chemically bound water and strength. A numerical hydration model is proposed for cement–quartz binary blends. The parameters of the hydration model are determined based on the hydration heat normalized by the cement mass. Moreover, the hydration heat at 28 days is calculated using the proposed model. The strength development of all specimens and all test ages can be expressed as an exponential function of hydration heat.
1. Introduction
While the development of the concrete industry has satisfied its functional requirements, its environmental performance requirements have become more and more important [1,2,3,4]. Cement is an important component of concrete, and the carbon emissions of concrete mainly come from cement [5,6,7]. The amount of CO2 released from the production of 1 kg of cement is roughly between 0.8 kg and 1 kg [5,8,9].
To reduce the carbon emissions of the cement industry, researchers have adopted many methods, for example, using mineral admixtures to replace cement [10,11,12]. Zhao et al. used alkali to chemically activate cement–slag binary blends and found that Na2SO4 can improve strength at all curing ages [13]. Amran et al. found that high-fineness slag can improve the microstructural properties and achieve a higher compressive strength [14]. Yi et al. reported that CO2 mineralization slag can be used as a sustainable building material [15]. Lothenbach and Gruskovnjak [16] thermodynamically modeled alkali-activated slag. In addition to work on slag-blended concrete, some studies have investigated fly-ash-blended concrete. Matos found that high-volume fly ash can enhance the long-term properties of self-compositing concrete and lower CO2 emissions for 1-cubic-meter concrete with a strength of 1 MPa [17]. Luan proposed that activating fly ash was critical in estimating the CO2 emissions of fly ash geopolymer concrete [18]. Wang simulated an optimal design method for high-volume fly-ash-blended concrete and determined its strength and durability control values [19,20]. Gloaaer et al. [21] determined the reactivity of fly ash based on glass content and thermodynamic calculations. In addition, Franco et al. [22] suggested that limestone filler can react with the aluminate phase in the binder and form carbonaluminate, which can develop finer pores in concrete.
Quartz powder is a by-product of the quartz industry, and its main component is crystalline silica [23]. Compared with the large number of studies on slag and fly ash [24], the research on quartz powder in concrete is insufficient [25]. The main shortcomings can be summarized as follows: First, previous research has mainly focused on mechanical properties and microscopic properties, and there are deficiencies in the correlation between macroscopic properties and microscopic properties [23]. Second, when other scientists have studied macroscopic properties, such as compressive strength, they have often used compressive strength experiments. Recently, many non-destructive testing experimental methods, such as ultrasonic velocity test methods, have also been used to detect compressive strength [26]. Third, when others have studied durability performance, they have mostly used destructive experimental methods. During testing, the specimen is cut open. Recently, many non-destructive testing experimental methods, such as the surface resistivity method, have also been used to evaluate durability [27]. These non-destructive testing methods have the advantages of convenience, simplicity, and speed. Fourth, most previous studies have focused on experimental work. The studies on numerical models of cement–quartz binary blends are very limited.
To overcome the shortcomings of previous studies, we conducted a series of macro- and micro-experimental studies and created a numerical hydration model on the mixture of quartz powder and cement. It mainly covers mechanics (compressive strength), temperature (hydration heat), chemistry (chemical composition of the product), durability (surface resistivity), and hydration modeling. These relatively comprehensive experimental analyses can clarify various relationships between macroscopic and microscopic properties, such as the direct relationship between the strength and heat of hydration and the relationship between strength and chemically bound water, and they can clarify the relationships between various macro-attributes, such as the direct relationship between strength and ultrasonic speed and the relationship between strength and surface resistivity. With these systematic analyses, construction units and researchers can comprehensively understand the various macro- and micro-effects of quartz powder on cement-based materials and make contributions to environmental performance, energy savings (the energy used for quartz is very small because quartz powder is an industrial by-product), and emission reductions in the cement industry.
2. Materials and Methods
2.1. Material Characterization
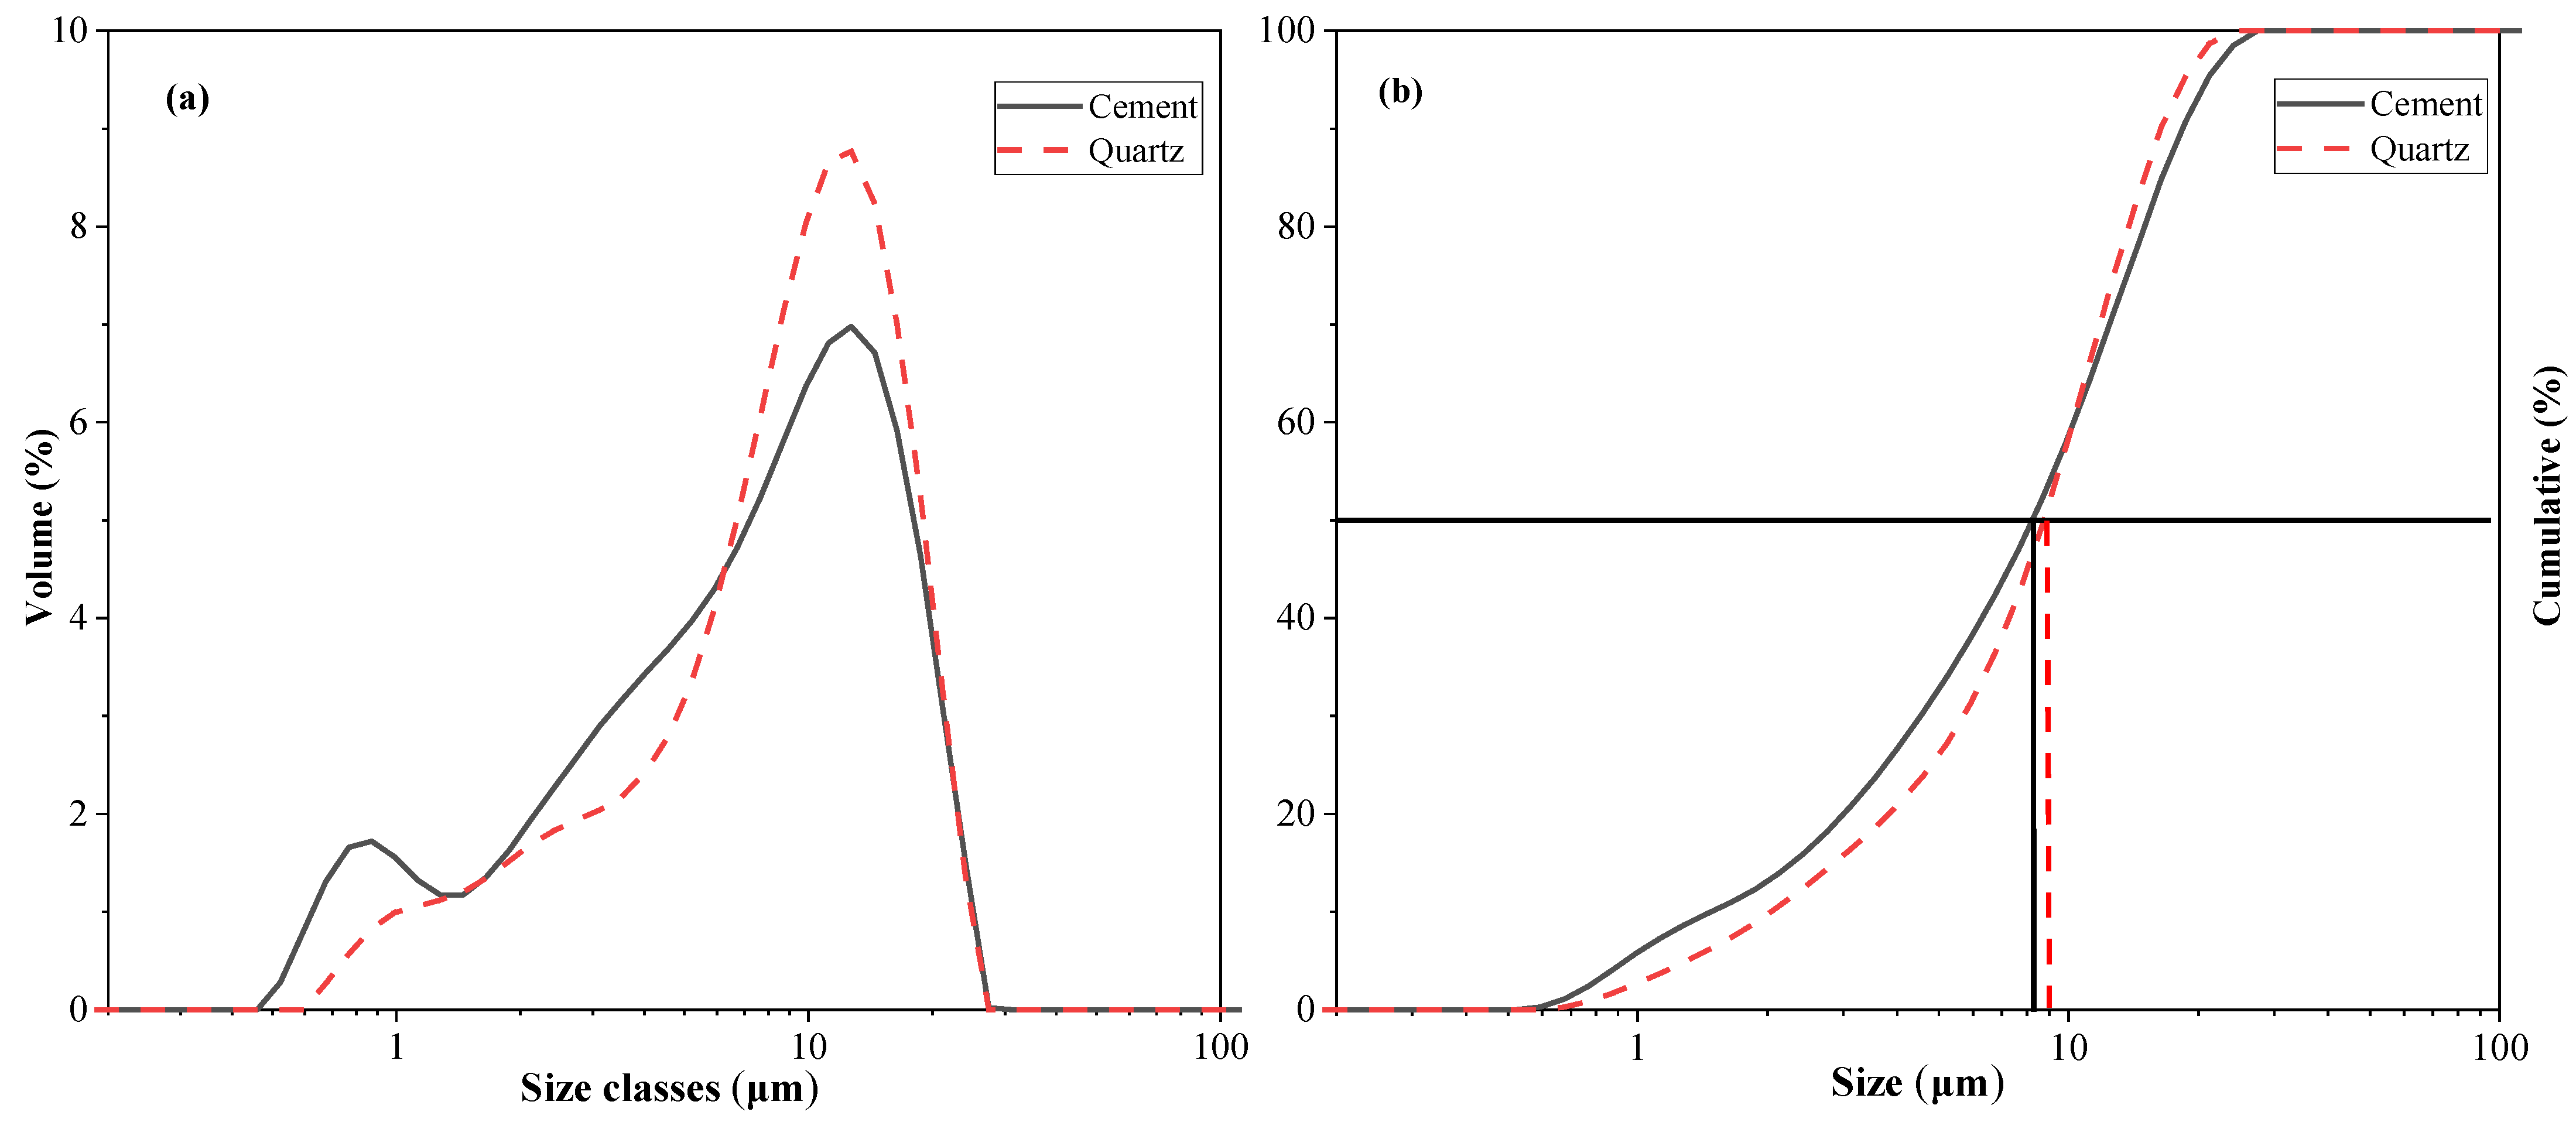
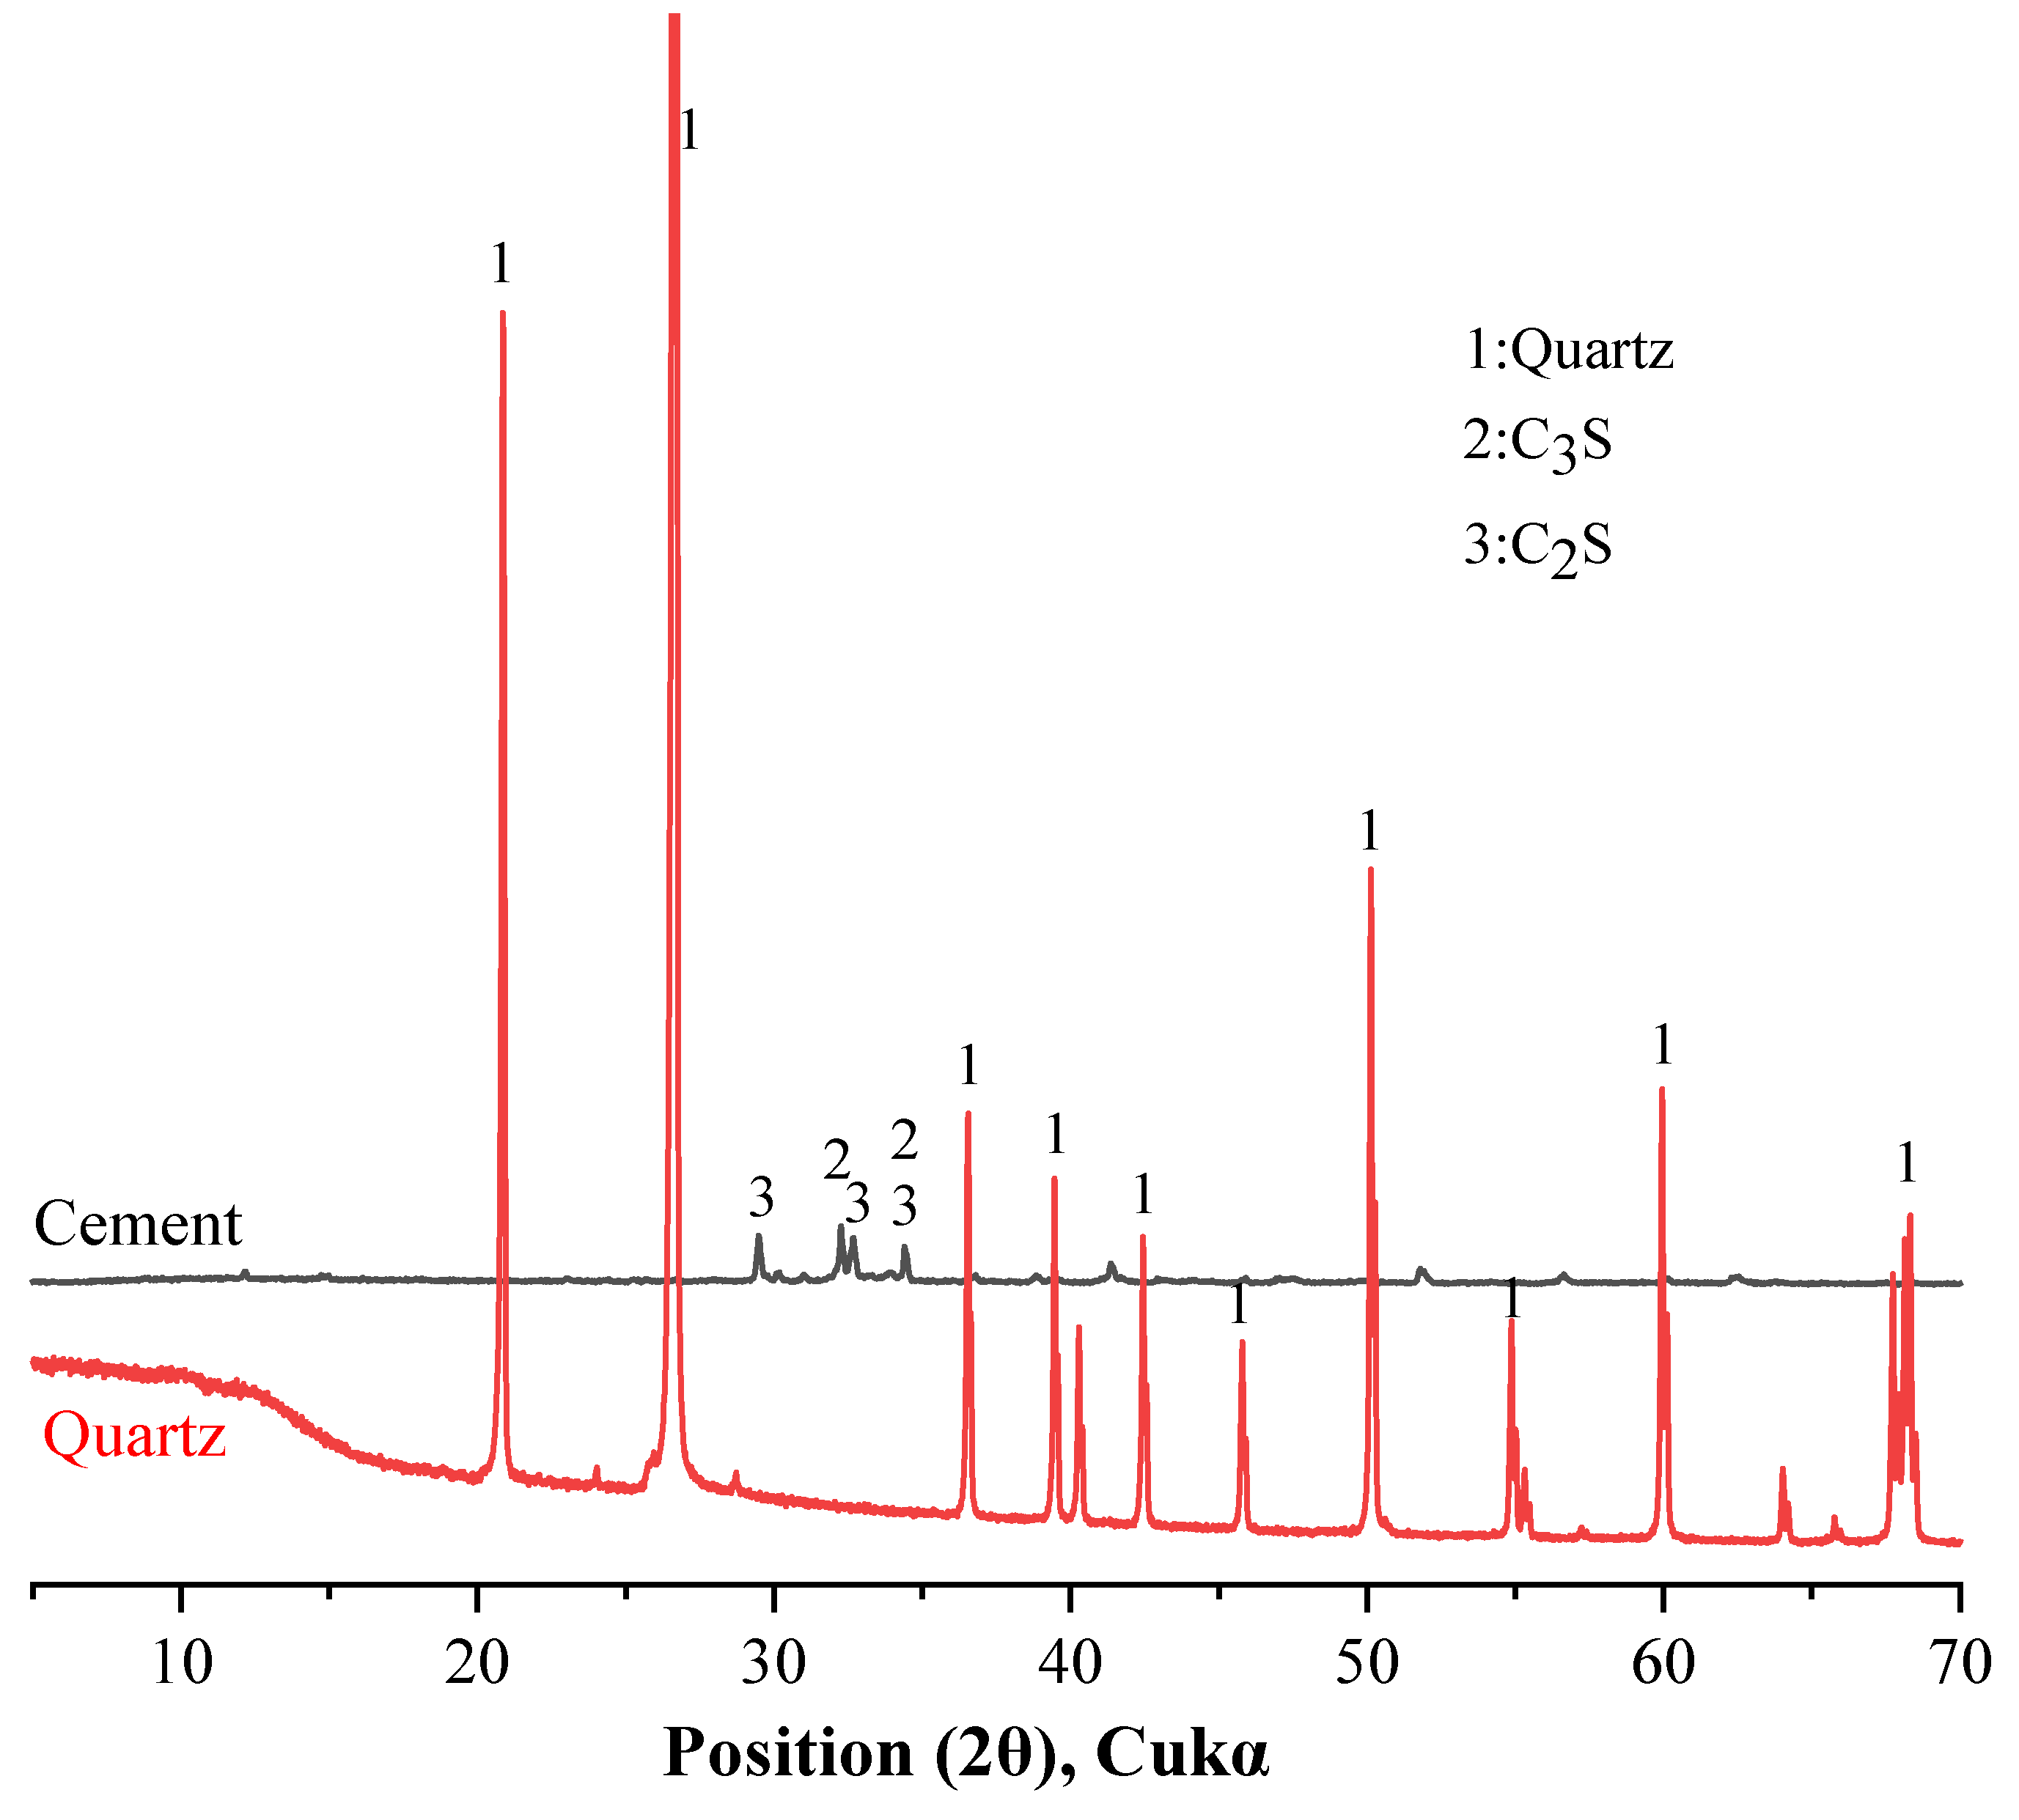
This study evaluated the effect of quartz on cement hydration properties. Binary mixtures were prepared from cement and quartz. The cement type is Type I ordinary Portland cement, supplied by Sung Shin Cement Company (Seoul, Republic of Korea). The particle size distribution and cumulative particle size distribution of the cement and quartz powder were measured with a particle size distribution (PSD) analyzer and are shown in Figure 1. The average particle size of the cement is 8.23 μm, and the average particle size of the quartz powder is 9.12 μm. Table 1 shows the chemical composition of the cement and quartz measured via XRF. The calcium oxide content in the cement is 64.2%. The composition of the quartz powder is about 99% silica. The densities of the cement and quartz powder are 3.14 and 2.65, respectively, according to the ASTM C188 standard. The XRD patterns of the cement and quartz are shown in Figure 2. Figure 2 also shows that the main crystal components of the cement are C3S and C2S [28,29], and the main crystal component of quartz powder is silica. The strength of the peak of the quartz powder material is higher than those of the peaks of C3S and C2S, the main components of cement.
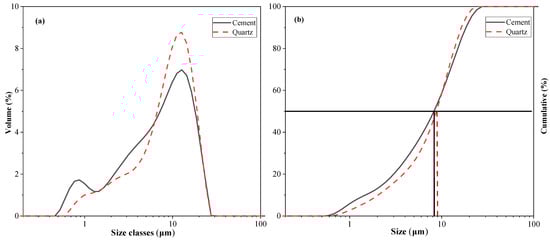
Figure 1.
(a) Particle size distributions of cement and quartz; (b) cumulative curve of cement and quartz.

Table 1.
Chemical compositions of cement and quartz.
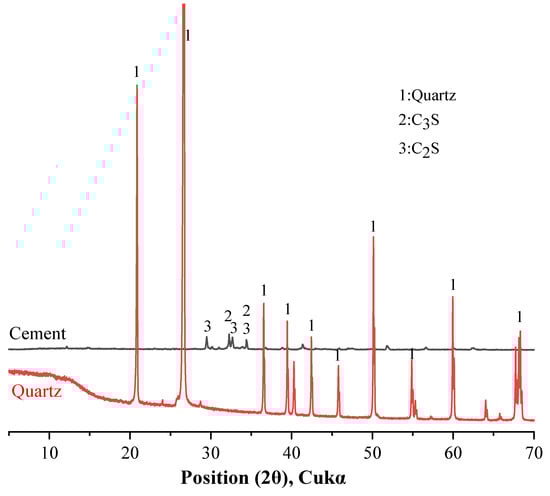
Figure 2.
XRD patterns of cement and quartz.
2.2. Sample Mix Ratio
The specimens used in this study can be divided into two categories: cement paste and mortar. Table 2 lists the detailed mixing proportions of cement, quartz powder, and water in all mixtures. The water–cement ratio of the specimen is 0.5. For specimens Qu0, Qu7.5, and Qu15, the substitution rates of the quartz powder are 0%, 7.5%, and 15%, respectively. The ratio of sand to cementitious material in the mortar specimen is 2:1 [30]. After the cement and mortar specimens were mixed and formed, they were sealed and cured until required for each step of the test.
Table 2.
Mixture of samples.
2.3. Test Methods
The ultrasonic pulse velocity (UPV) of the hardened mortar (4 × 4 × 16 cm) was measured using an ultrasonic tester (Pundit Lab, Schwerzenbach, Switzerland) according to AASHTO T 358 [31]. The resistivity of the mortar (4 × 4 × 16 cm) was tested using a four-point resistance meter (Pundit Lab, Schwerzenbach, Switzerland) according to the ASTM C597 standard [31]. The specimens were sealed for curing. The relative humidity of the 0.5 water–cement specimens was about 95%. Surface resistivity and chloride ion intrusion durability are closely related, and research [32] shows that as the chloride ion diffusion coefficient increases, the surface resistivity decreases, and the intrusion of chloride ions becomes easier.
Hydration heat was measured using a multichannel isothermal calorimeter (TAM Air, New Castle, DE, USA). Approximately 5 g of stirred fresh cement paste was dropped in a glass container, sealed, and placed in a TAM Air for 168 h.
The hardened paste was ground to a powder with a particle size of less than 75 µm. To stop hydration, the powder was soaked in isopropanol for 15 min [33]. The solution was stirred and filtered to obtain a powdered sample for microscopic characterization. The powders were scanned using an X-ray diffractometer (PANalytical X’Pert Pro MPD, Almelo, The Netherlands) in a range of 5°–50° 2θ at a scan rate of 0.05° 2θ/s. A thermogravimetric analyzer was used to test the ignition loss of the powder in a nitrogen atmosphere within a temperature range of 50–900 °C and with a heating rate of 15 °C/min.
3. Experimental Results
3.1. Heat of Hydration
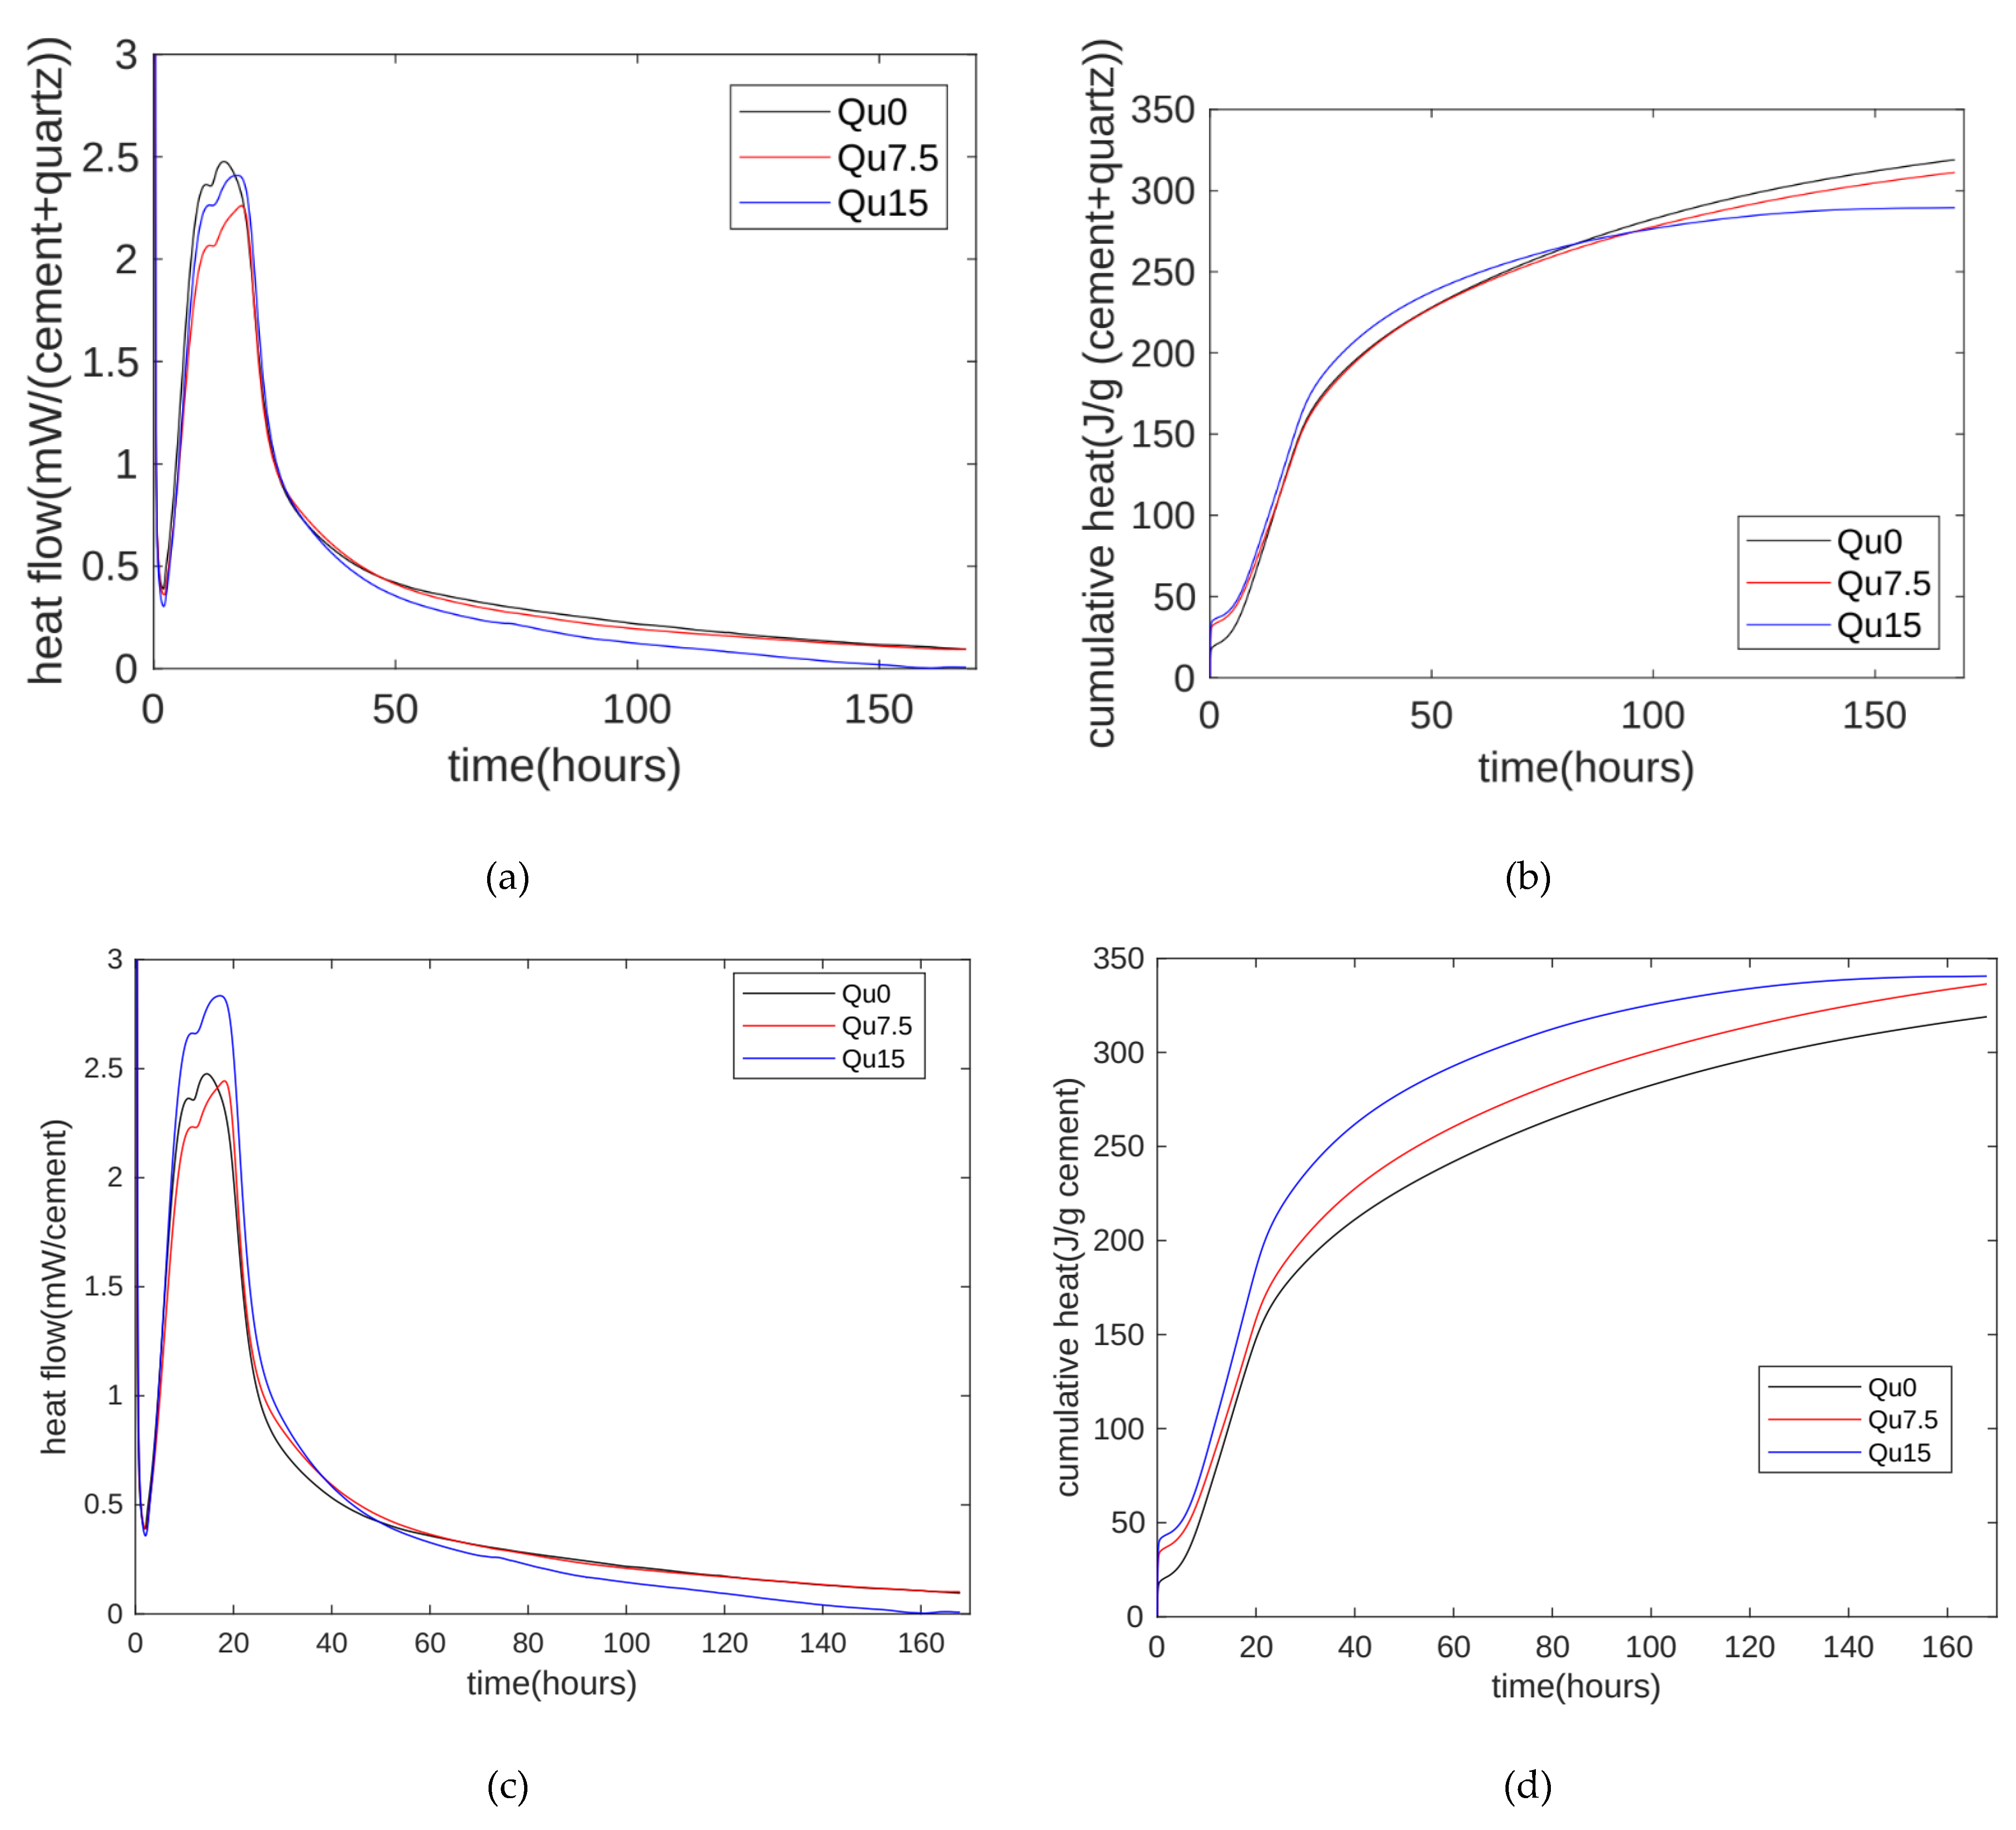
The hydration heat results are shown in Figure 3. The hydration heat release rate test results are shown in Figure 3a. Overall, the hydration heat release can be divided into an initial rapid heat release stage, a latent period, an accelerated reaction period, and a diffusion-controlled deceleration period. The first peak of the accelerated reaction period occurs at around 12 h, which is mainly due to the hydration reaction of C3S. Next, there is a higher exothermic peak, which is due to the exotherm caused by the secondary dissolution of C3A. In addition, we can see that the heat release rate decreases when the substitution rate of the quartz powder increases from 0 to 7.5% and 15%. This is mainly due to the dilution effect of the quartz powder [31]. In addition, when the substitution rate increases from 7.5% to 15%, we can see that the heat release rate increases during the accelerated reaction period. This may be because the cement we used contains about 5% calcium carbonate [34]. In the early stages of the hydration reaction, calcium carbonate basically does not react. Therefore, calcium carbonate and quartz powder are both non-reactive admixtures. Cement with mineral admixtures generally contains at least two components. When the reactivity of mineral admixtures is much weaker than that of cement, such as limestone powder or quartz powder, the less reactive substances may become nucleation sites for the cement hydration process, thereby accelerating the hydration reaction of cement. The nucleation sites are related to the physical and chemical properties of the mineral admixture. Compared with quartz powder, limestone powder will produce calcium ions after dissolution. Therefore, when the particle size distribution is the same, the nucleation effect of limestone powder is stronger than that of quartz powder. In addition, the nucleation effect becomes obvious as the surface area of the filler increases. The nucleation effects of calcium carbonate and quartz powder are different. Therefore, when the substitution rate of quartz powder increases from 0 to 7.5% and 15%, the exothermic trend of hydration heat is inconsistent with the substitution rate trend of the quartz powder.
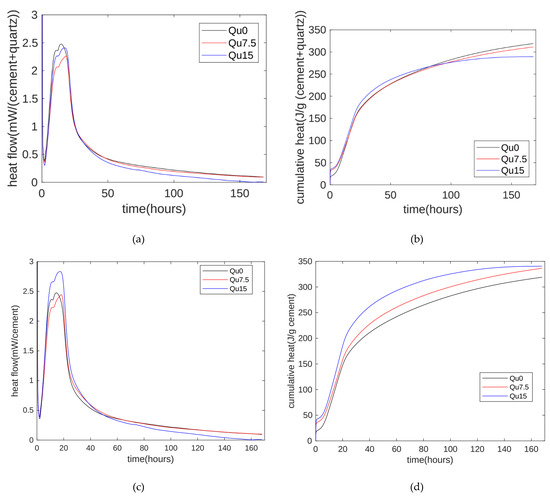
Figure 3.
Hydration heat. (a) Heat flows of Qu0, Qu7.5, and Qu15; (b) cumulative hydration heat of Qu0, Qu7.5, and Qu15; (c) heat flows of cement mass of Qu0, Qu7.5, and Qu15; (d) cumulative hydration heat of cement mass of Qu0, Qu7.5, and Qu15.
The measurement results for the cumulative hydration heat are shown in Figure 3b. In the early stage of the hydration reaction (the first three days), as the substituted amount of quartz powder increases, the cumulative hydration heat increases. This is mainly because the nucleation effect of the quartz powder accelerates the hydration reaction of the cement. In the later stage of the hydration reaction (about seven days), as the substituted amount of quartz powder increases, the cumulative hydration heat decreases. This is mainly due to the diluting effect of the quartz powder, and this is consistent with research by Lin et al. [23]. The nucleation effect and dilution effect of the quartz powder exist at the same time. In the early stage, the nucleation effect dominates, and in the later stage, the dilution effect dominates.
In the binary system of cement and quartz powder, hydration heat is released by the chemical reaction of the cement. We can thus normalize the hydration heat measurements to the mass of the cement. The results are shown in Figure 3c. After normalization by the cement mass, the heat release value of the 7.5% quartz powder is similar to that of the standard specimen. The nucleation effect of the 15% quartz powder is more obvious, and the hydration heat is significantly higher than that of the standard specimen [35,36].
In cement–quartz binary blends, quartz is a chemically inert filler, and all hydration comes from cement hydration. The results for the cement’s cumulative hydration heat per gram are shown in Figure 3d. Overall, as the amount of substitution increases, the heat release per gram of cement increases. This can mainly be attributed to the nucleating effect of the quartz powder.
3.2. Compressive Strength
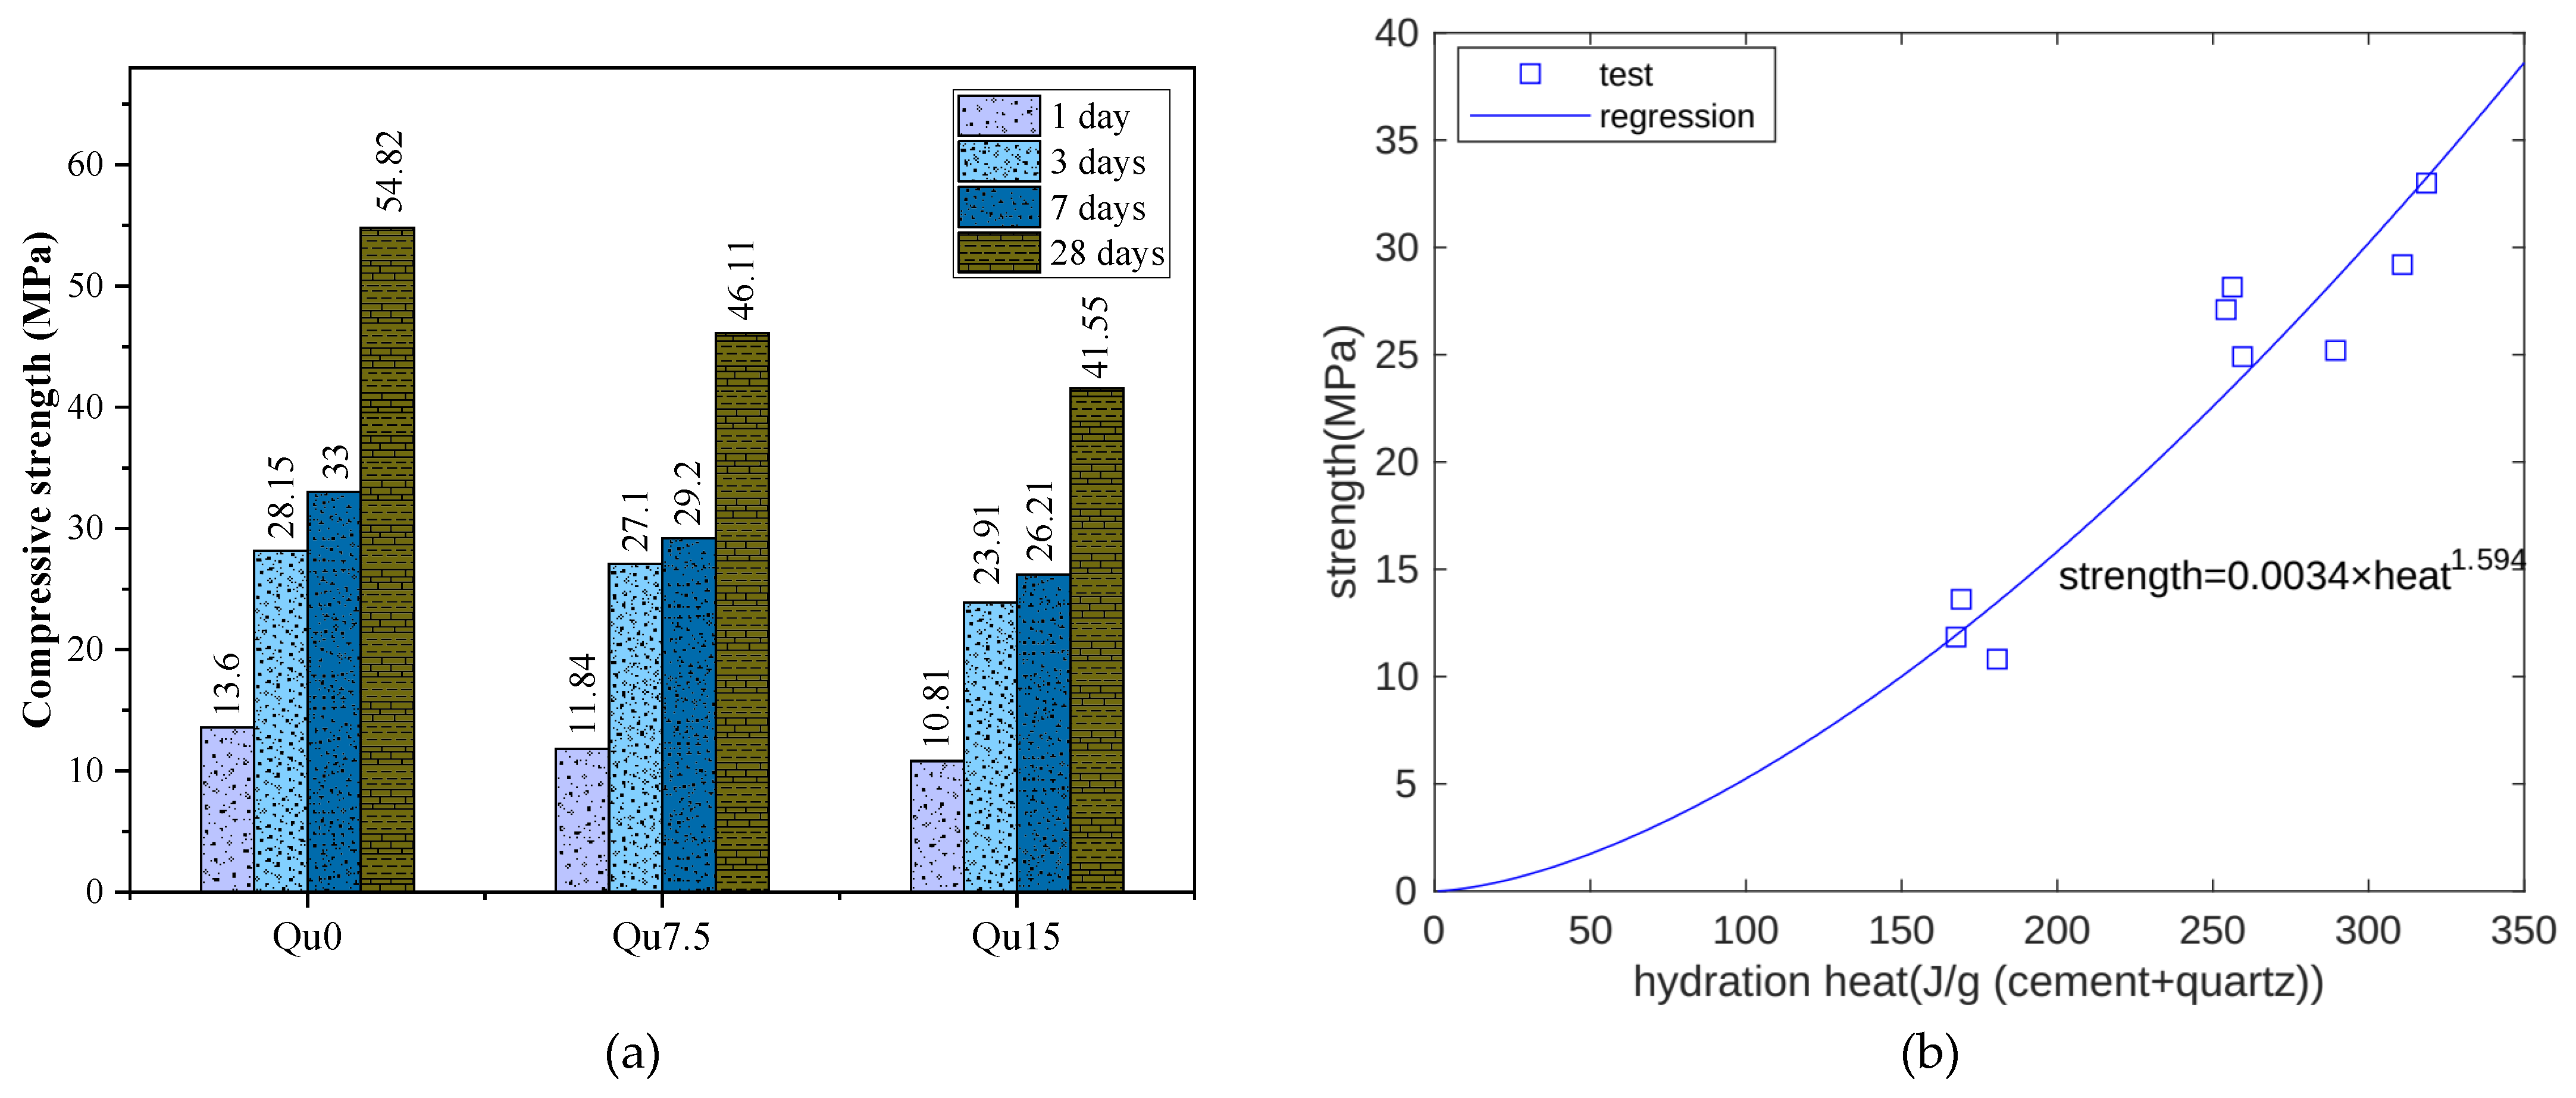
Figure 4a shows the compressive strength test results. For Qu0, Qu7.5, and Qu15, the 1-day compressive strength values are 13.6, 11.84, and 10.81 MPa, respectively, and from Qu0 to Qu15, at 1 day, the reduction in compressive strength is about 20%. The compressive strengths at 28 days are 54.82, 46.11, and 41.55 MPa, respectively. Compared with 1 day, the compressive strength at 28 days decreases more obviously.
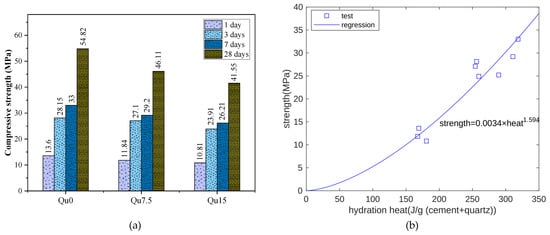
Figure 4.
(a) Compressive strength results for Qu0, Qu7.5, and Qu15 at different ages; (b) compressive strength and heat relation.
As cement hydration proceeds, hydration heat is released. Hydration products fill pore spaces, and strength increases. Hence, hydration heat is closely related to strength development. Figure 4b shows the relationship between the measurement results for hydration heat and compressive strength at 1, 3, and 7 days. Overall, there is an exponential function relationship between the two results. In this test, the compressive strength unit is MPa and the hydration heat unit is J.
3.3. Ultrasonic Pulse Velocity
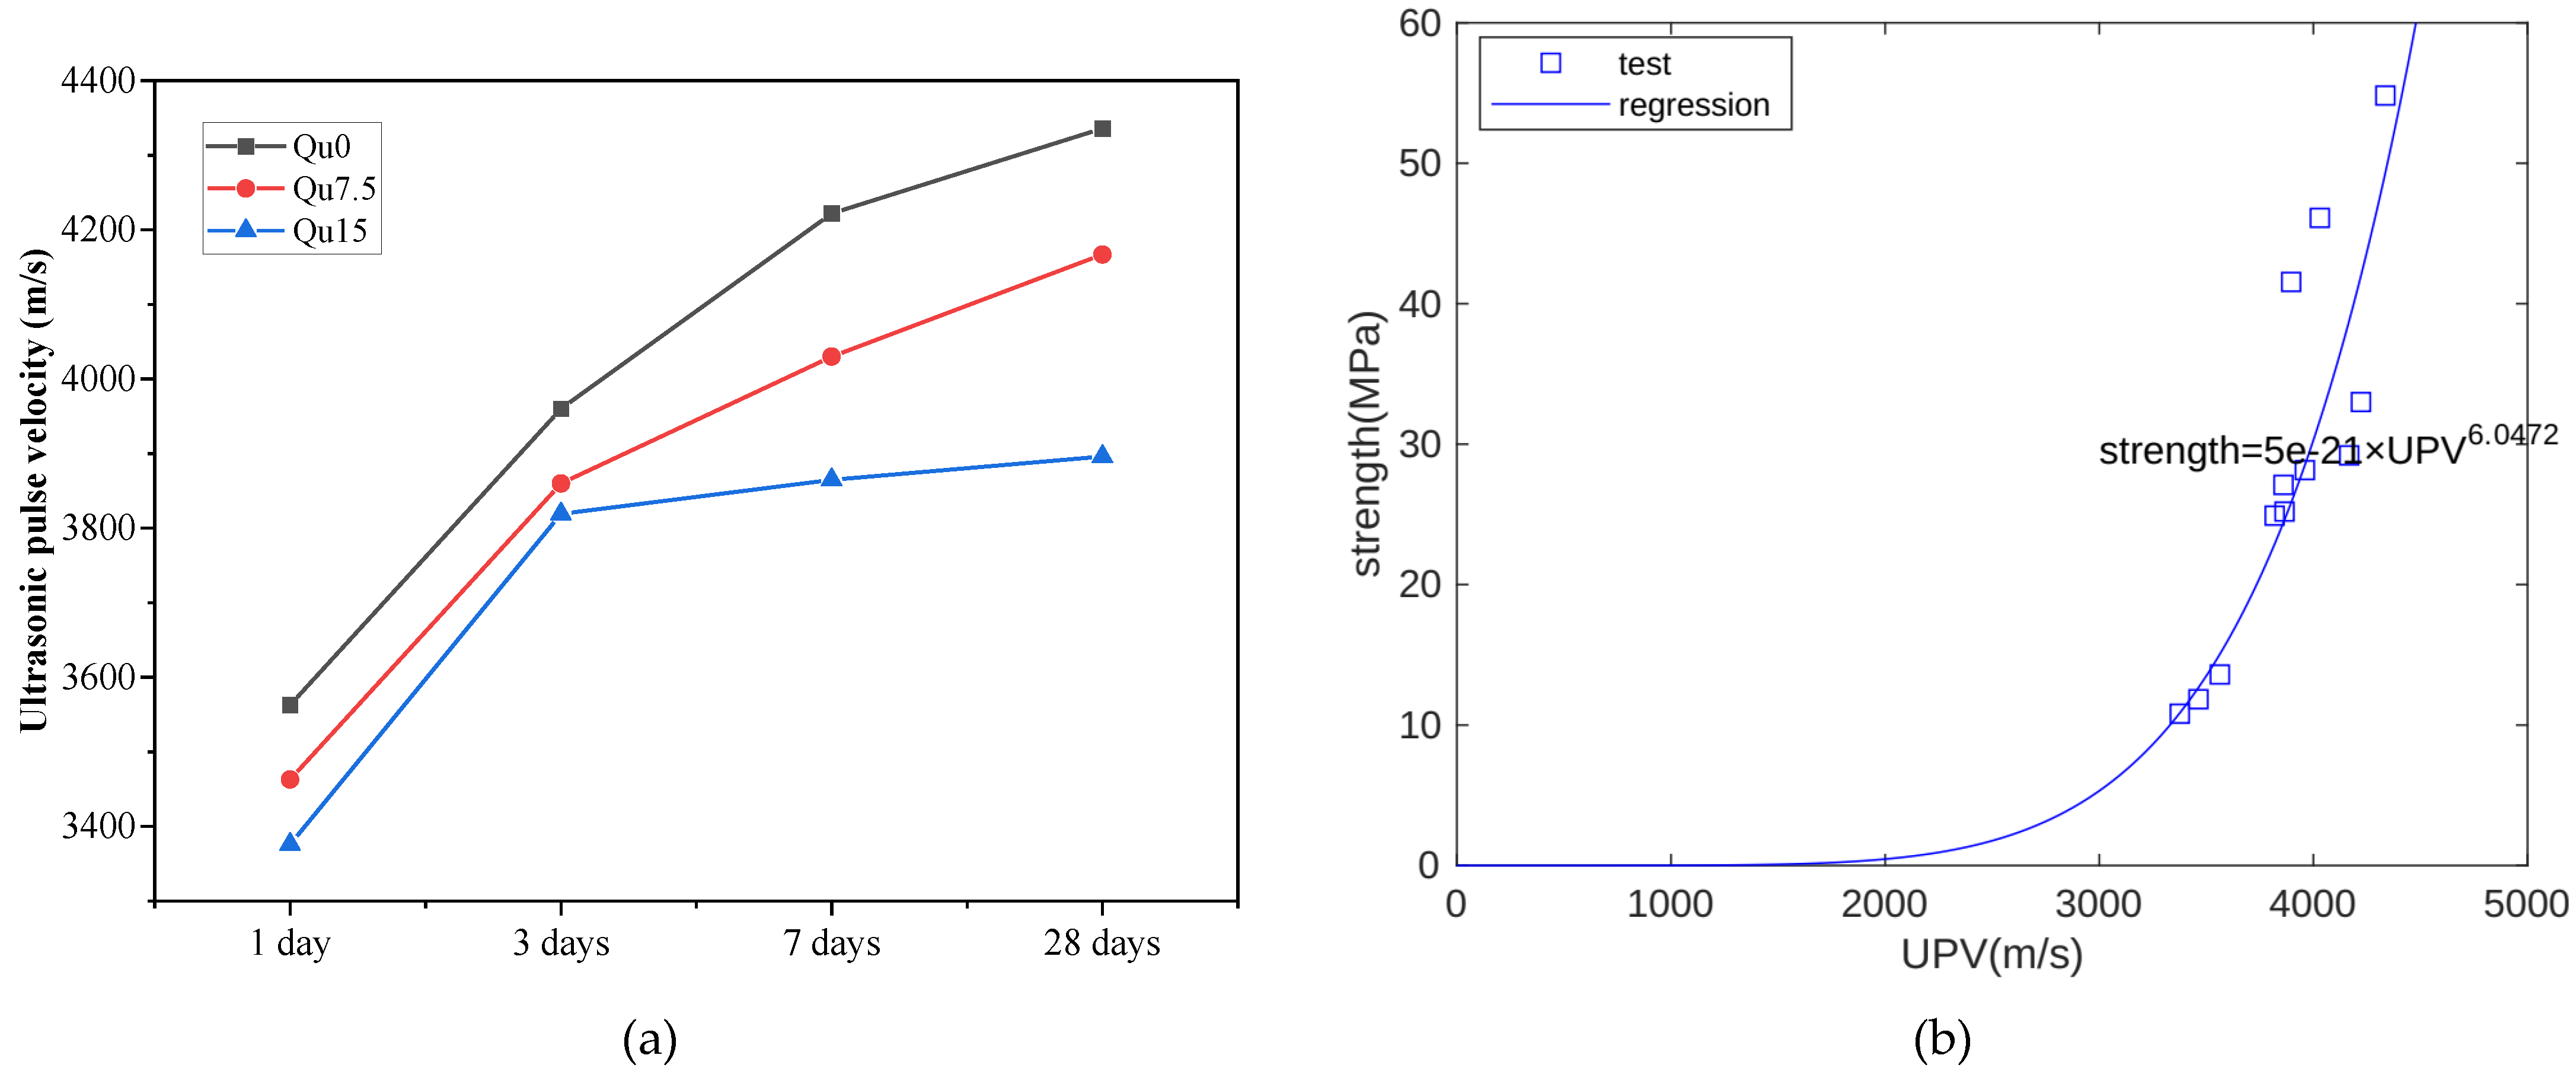
The ultrasonic wave velocity measurement results are shown in Figure 5a. At each age, we can see that the ultrasonic velocity also decreases as the amount of quartz powder substitution increases. In the early period (1 day), the ultrasonic velocity measurements are relatively close. Later (28 days), the differences in ultrasound velocity measurements are larger. In other words, the development trend of ultrasonic velocity is similar to that of compressive strength. During the hydration process, solid hydration products can fill capillary pores. As the solid hydration products increase, the UPV and strength increase. Hence, strength is closely related to UPV. Figure 5b shows the relationship between the UPV and compressive strength measurement results at 1, 3, 7, and 28 days. Overall, there is an exponential function relationship between the two [37]. In this test, the compressive strength unit is MPa and the UPV unit is m/s.
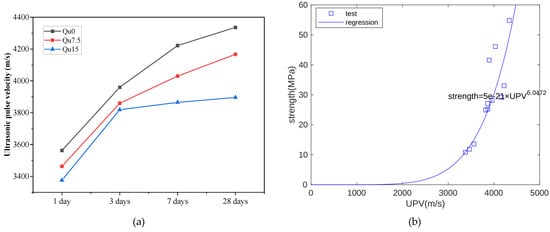
Figure 5.
(a) Ultrasonic pulse velocity of Qu0, Qu7.5, and Qu15; (b) the relationship between compressive strength and UPV.
3.4. Surface Resistivity
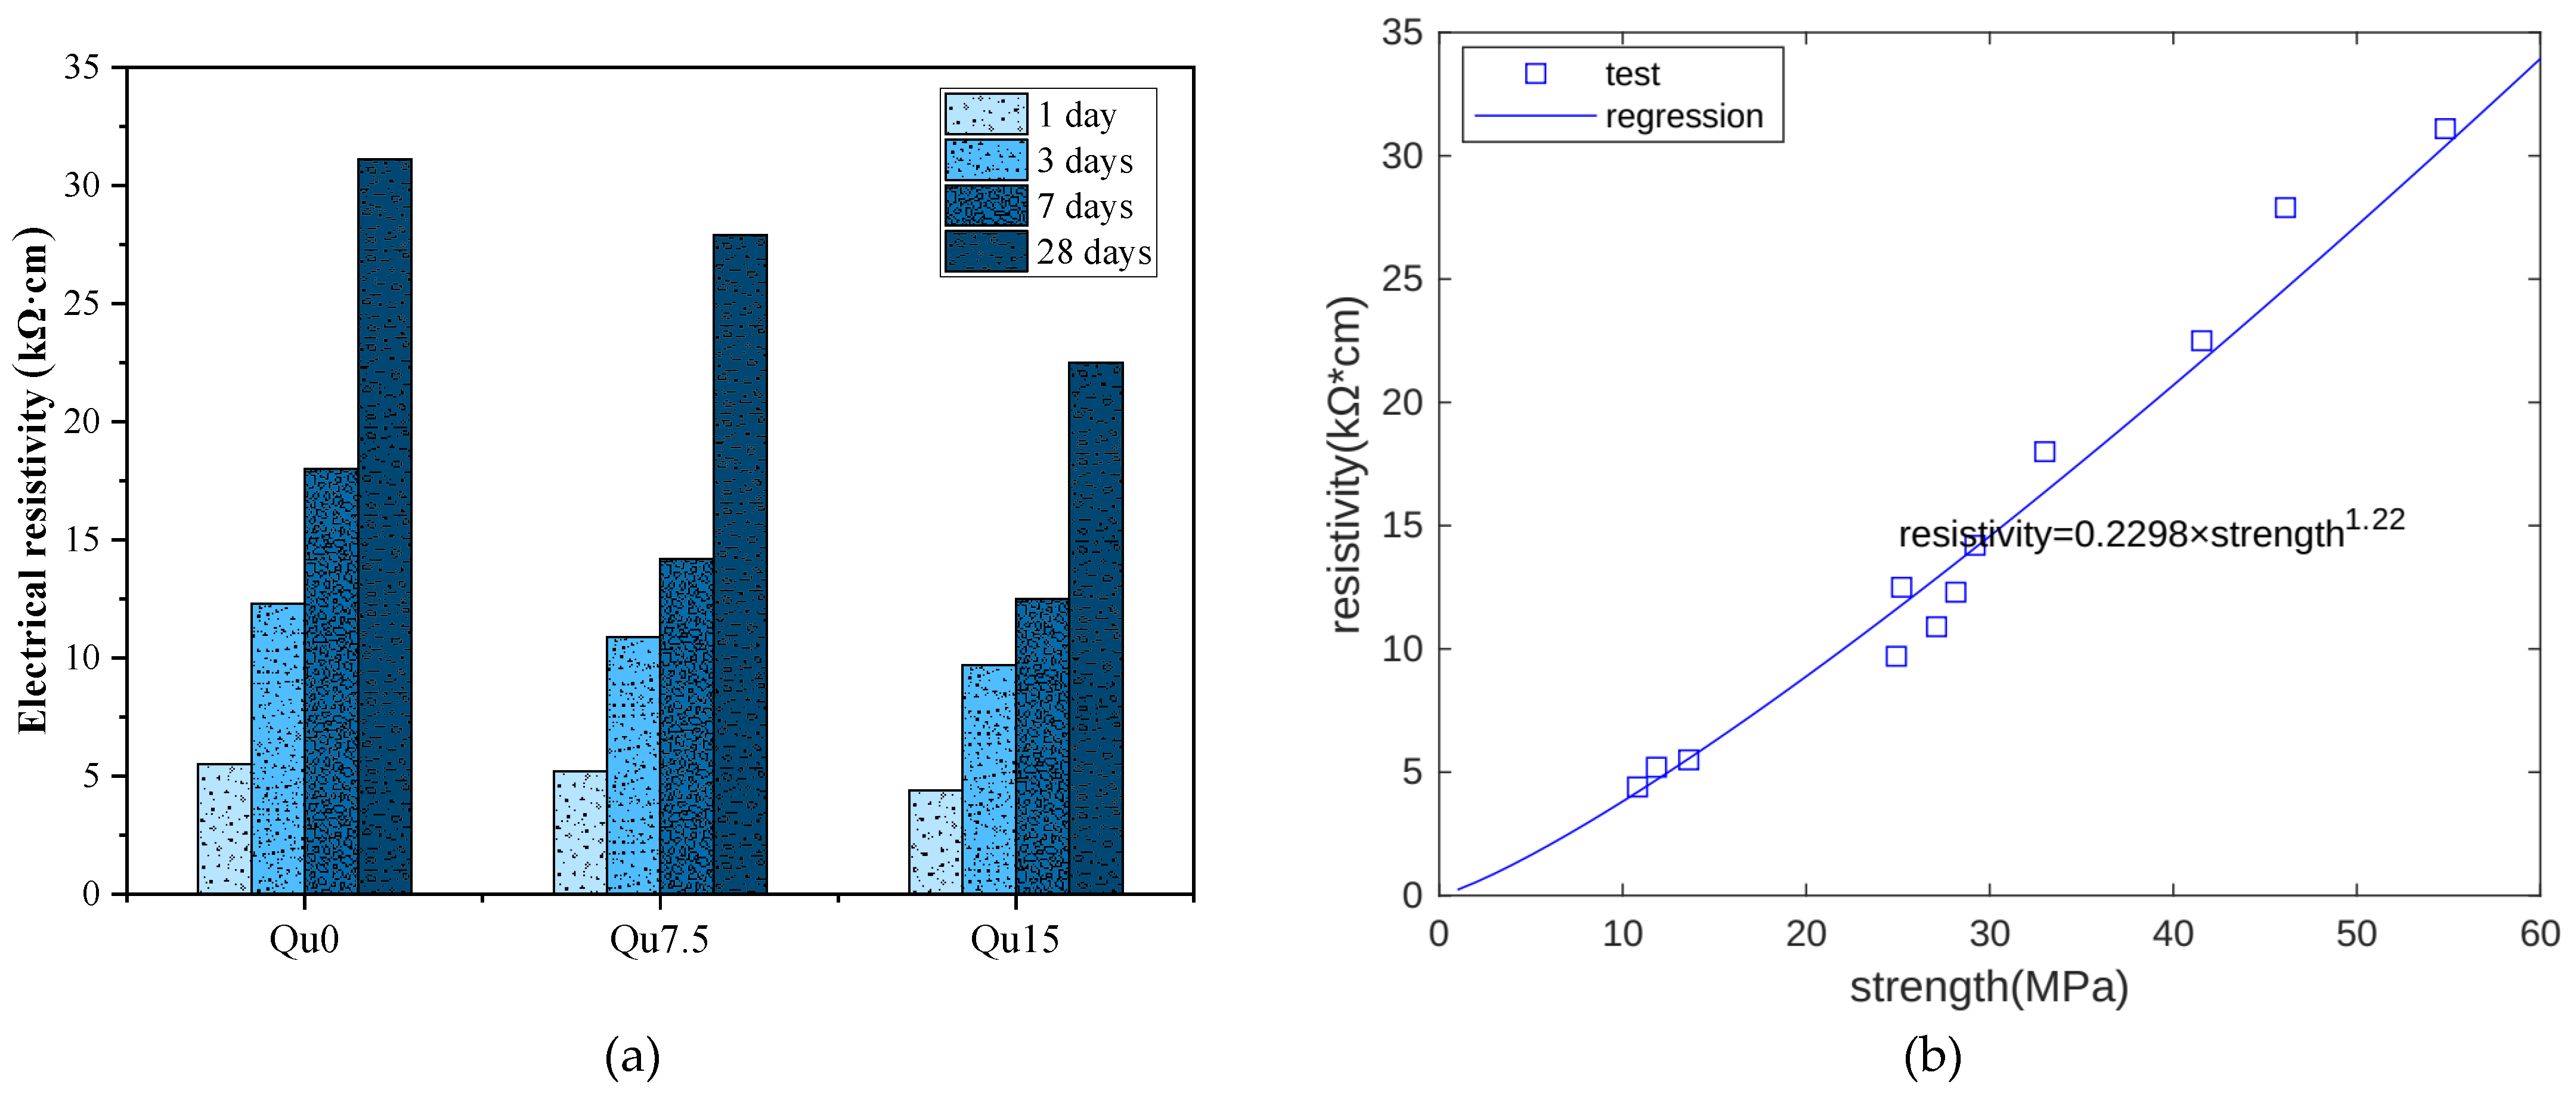
Figure 6a shows surface resistivity measurement results. At each age, we can see that the surface resistivity decreases as the amount of quartz powder substitution increases. This is because quartz powder is not chemically reactive. As the quartz powder content increases, the capillary water content also increases, resulting in a decrease in the resistivity of the specimen. The relationship between the resistivity measurement results and the compressive strength measurement results at 1, 3, 7, and 28 days is shown in Figure 6b. Overall, there is an exponential function relationship between the two. In this test, the compressive strength unit is MPa and the resistivity unit is kΩ·cm.
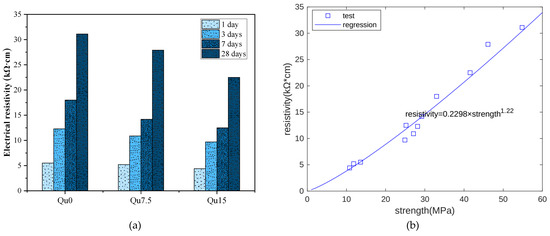
Figure 6.
(a) Resistivity test results for Qu0, Qu7.5, and Qu15; (b) resistivity and strength relationship.
3.5. XRD
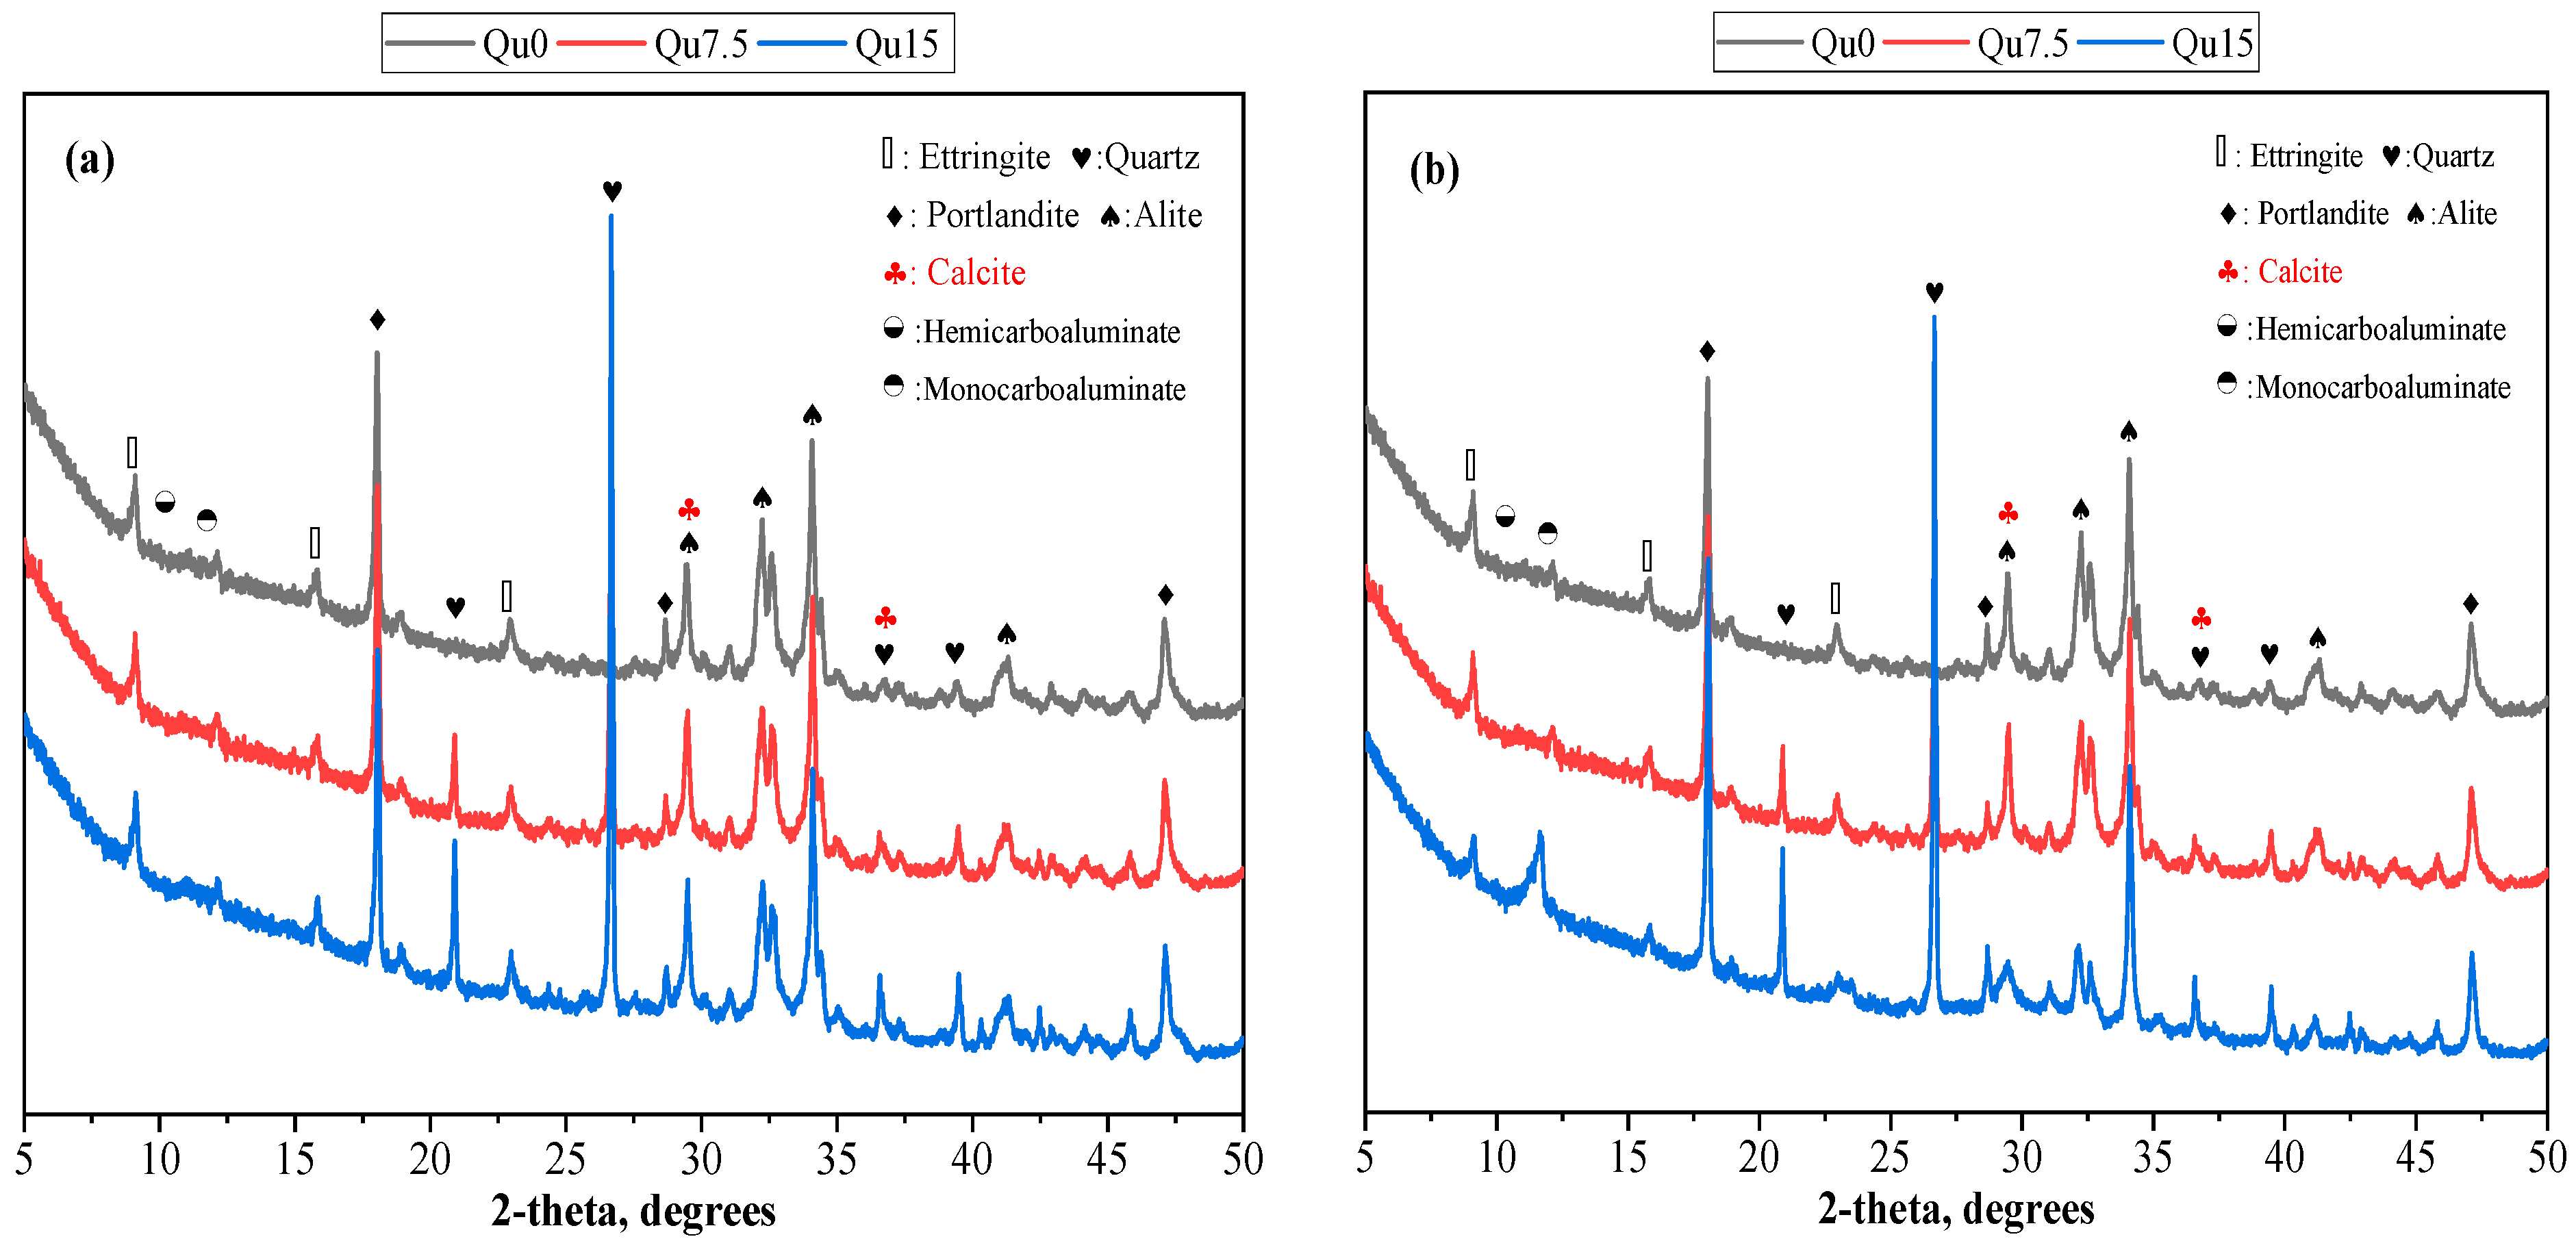
The XRD test results for Day 1 are shown in Figure 7a. We can see that the main products of the reaction are ettringite (Aft), calcium hydroxide (CH), hemicarboaluminate (Hc), and monocarboaluminate (Mc). We can also see calcium carbonate peaks [33]; this is because the cement we used contains a small amount of calcium carbonate. In other words, what we used was not pure Portland cement in the traditional sense. In addition, Hc and Mc formed because calcium carbonate reacts with the aluminum phase in cement to generate Hc and Mc [38]. It also contains unreacted C3S, which mainly comes from cement that has not undergone a hydration reaction. In XRD testing, one crystal may correspond to multiple peaks. The peaks of alite and calcite overlap at about 30 degrees, so one peak corresponds to two substances.
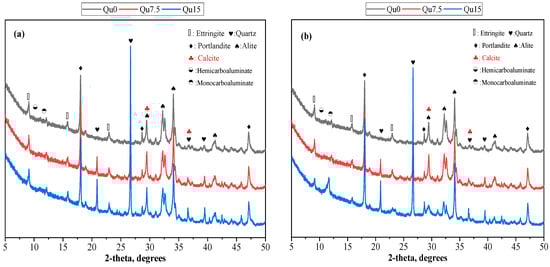
Figure 7.
XRD patterns forQu0, Qu7.5, and Qu15: (a) 1 day; (b) 28 days.
The 28-day XRD test results are shown in Figure 7b. By comparing Figure 7a,b, we can see that the types of reaction products are similar, but from 1 day to 28 days, the AFt content becomes less obvious, which is due to the transformation of AFt into AFm. In addition, from 1 day to 28 days, the Mc content becomes obvious because, compared with Hc, Mc has a better chemical stability. Over time, part of Hc is transformed into Mc [20,36]. In addition, we can see that the strength of the C3S peak decreases from 1 day to 28 days. This is because the hydration reaction of C3S occurs, and the C3S content in the solid product decreases. From 1 day to 28 days, the strength of the quartz peaks basically does not change. This shows that quartz is a chemically inert filler and does not chemically react with cement components.
3.6. TG
The results of the 3-day thermogravimetric (TG) and differentiated thermogravimetry (DTG) tests are shown in Figure 8a,b, respectively. Figure 8a shows that the loss of ignition in the sample decreases as the amount of quartz powder substitution increases. This is because quartz powder is basically non-chemically reactive, resulting in a reduction in the quality of chemically bound water. Figure 8b shows that the mass loss peak at around 100 degrees corresponds to the decomposition of C-S-H and AFt. The mass loss peak at around 180 degrees corresponds to the decomposition of Hc and Mc. The mass loss peak between 400 and 500 degrees corresponds to the decomposition of CH. The mass loss peak between 550 and 900 degrees corresponds to the decomposition of various forms of calcium carbonate, which mainly comes from the cementitious materials used [39]. Based on the results of our TG testing, we can calculate the contents of chemically bound water and calcium hydroxide, as shown in Equations (1) and (2), respectively [23]:
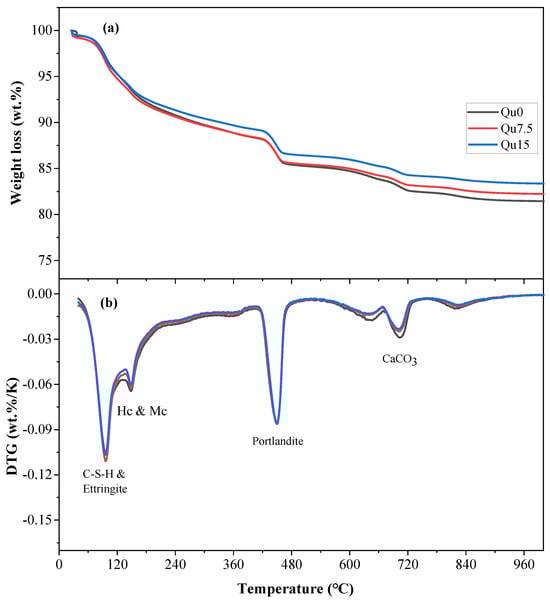
Figure 8.
Curves of Qu0, Qu7.5, and Qu15 over 3 days: (a) TGA; (b) DTG.
M40, M400, and M500 correspond to the quality of the sample at 40 degrees, 400 degrees, and 500 degrees, respectively. The calculation results for the chemically bound water and calcium hydroxide after 3 days are shown in Table 3, where we can see that both of their masses decreased as the substitution amount increased.
Table 3.
Combined water and portlandite in Qu0, Qu7.5, and Qu15 after 3 days.
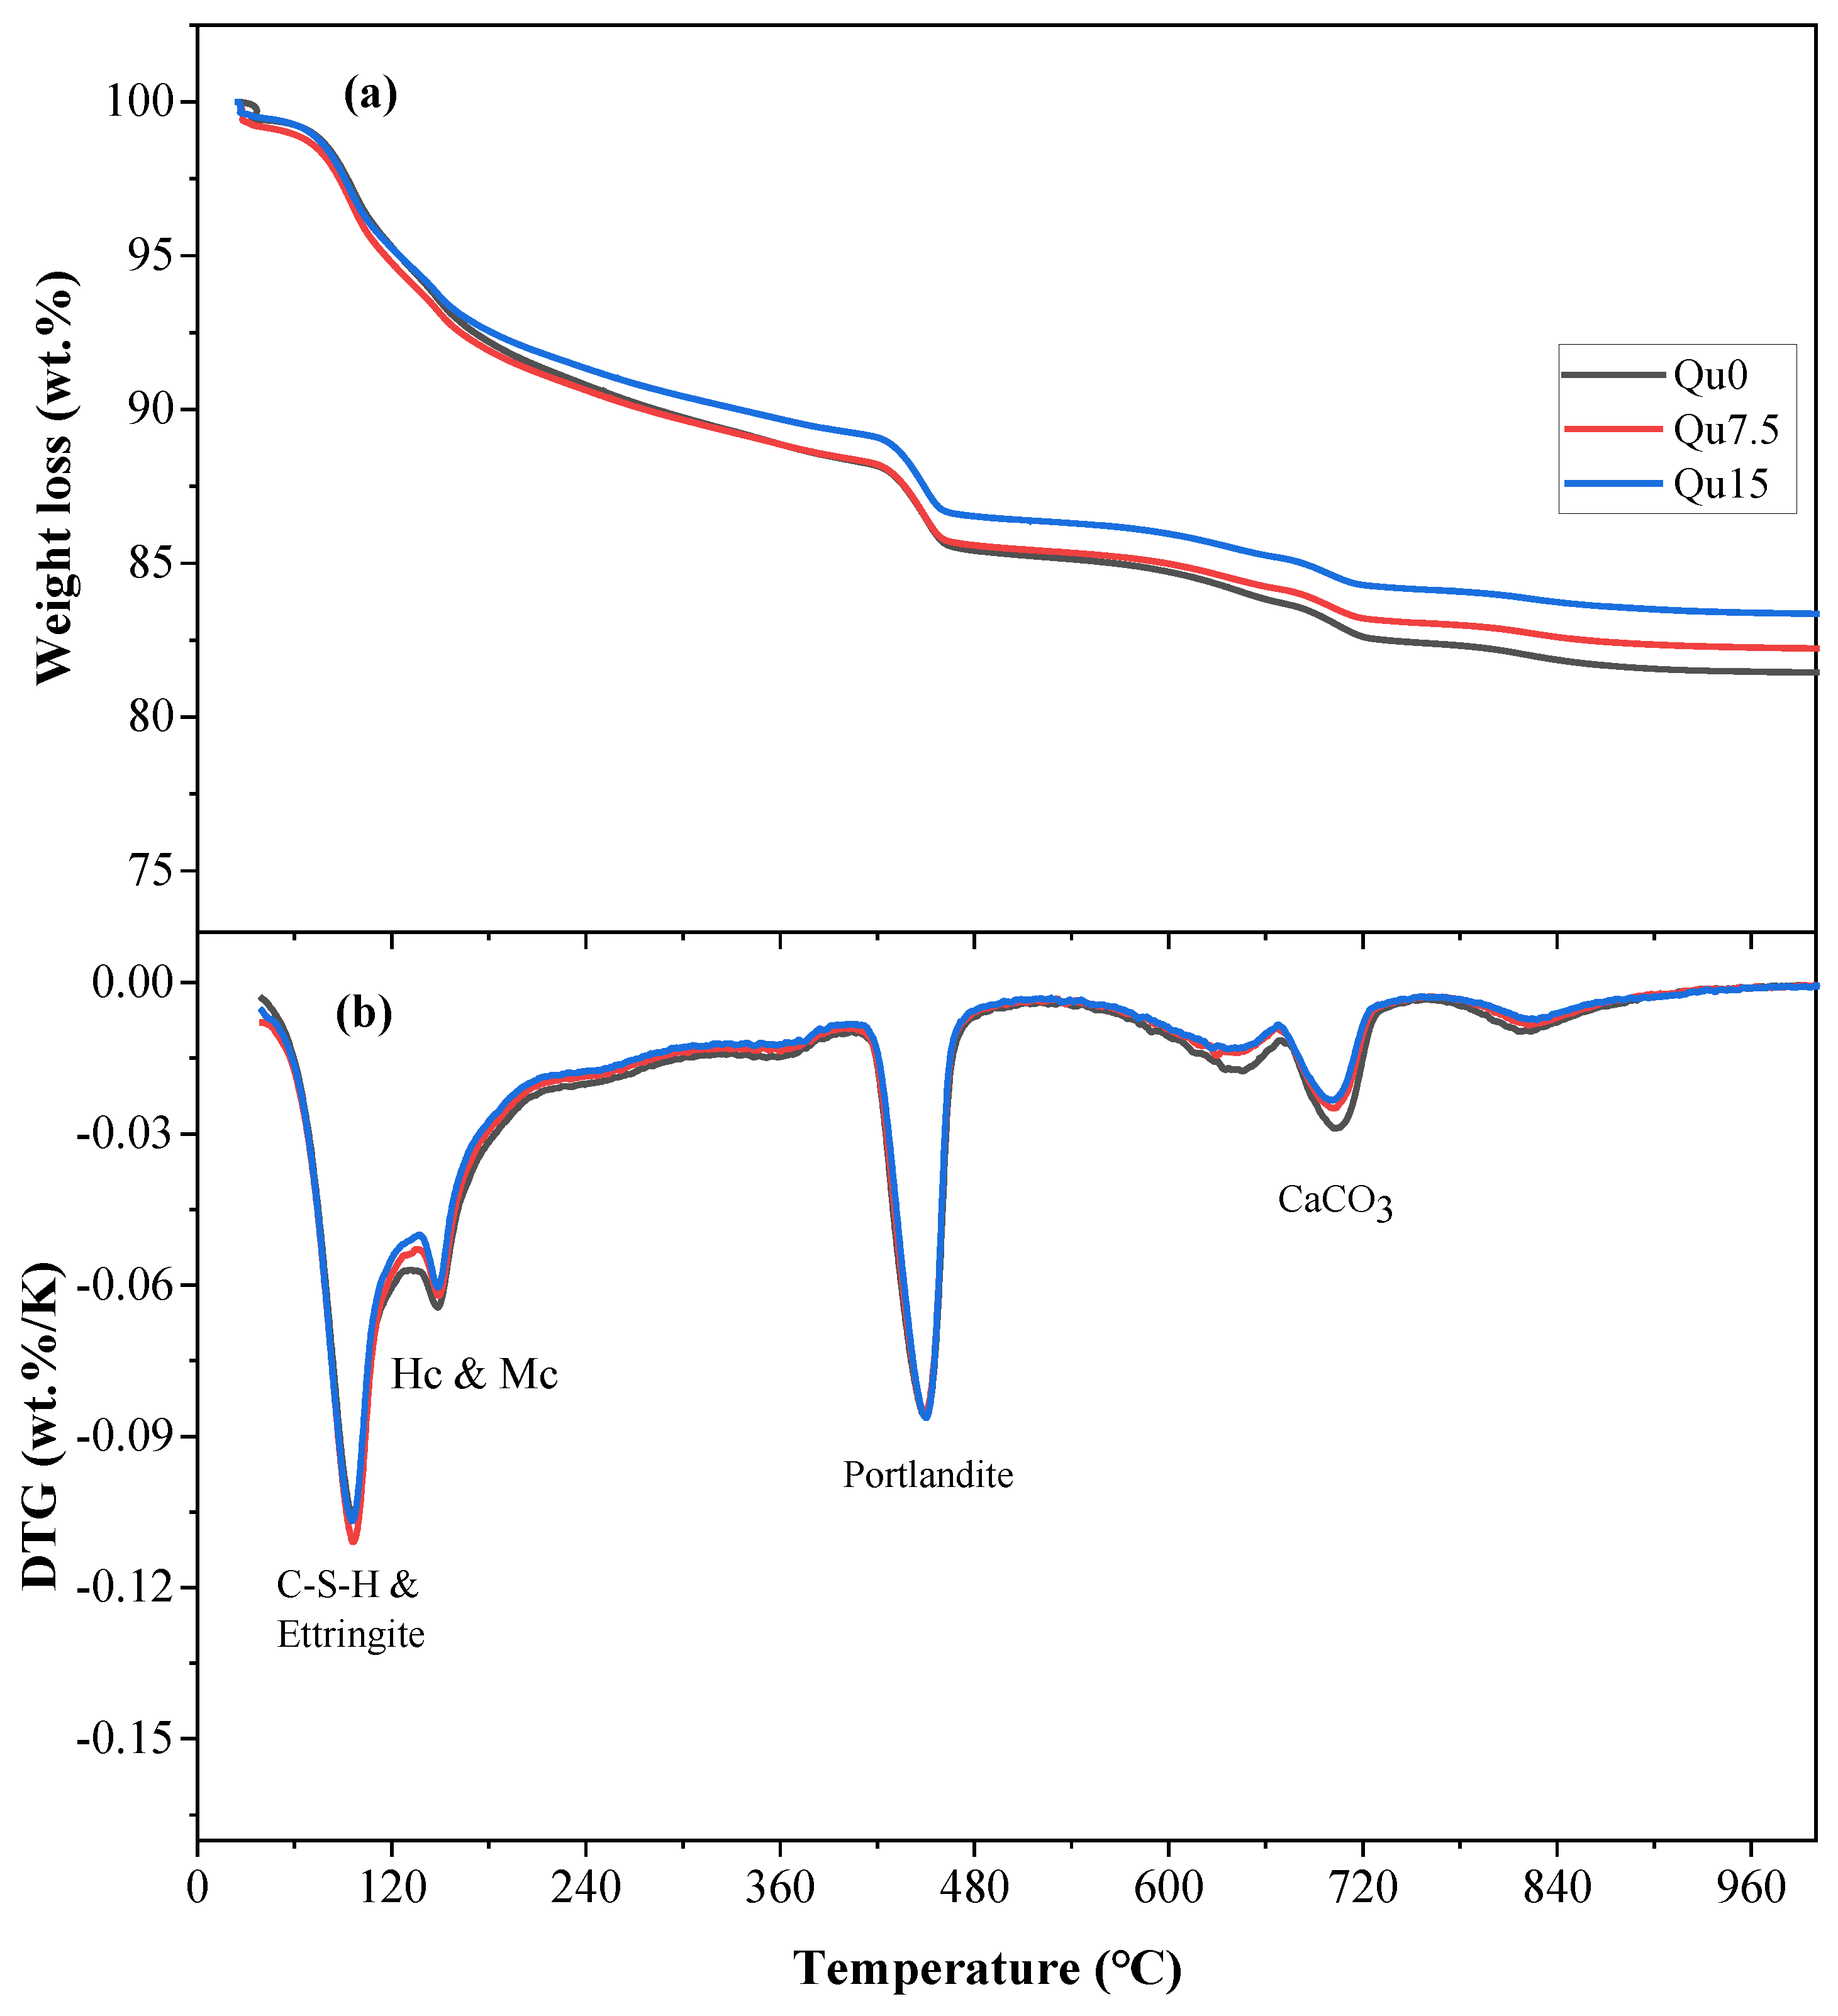
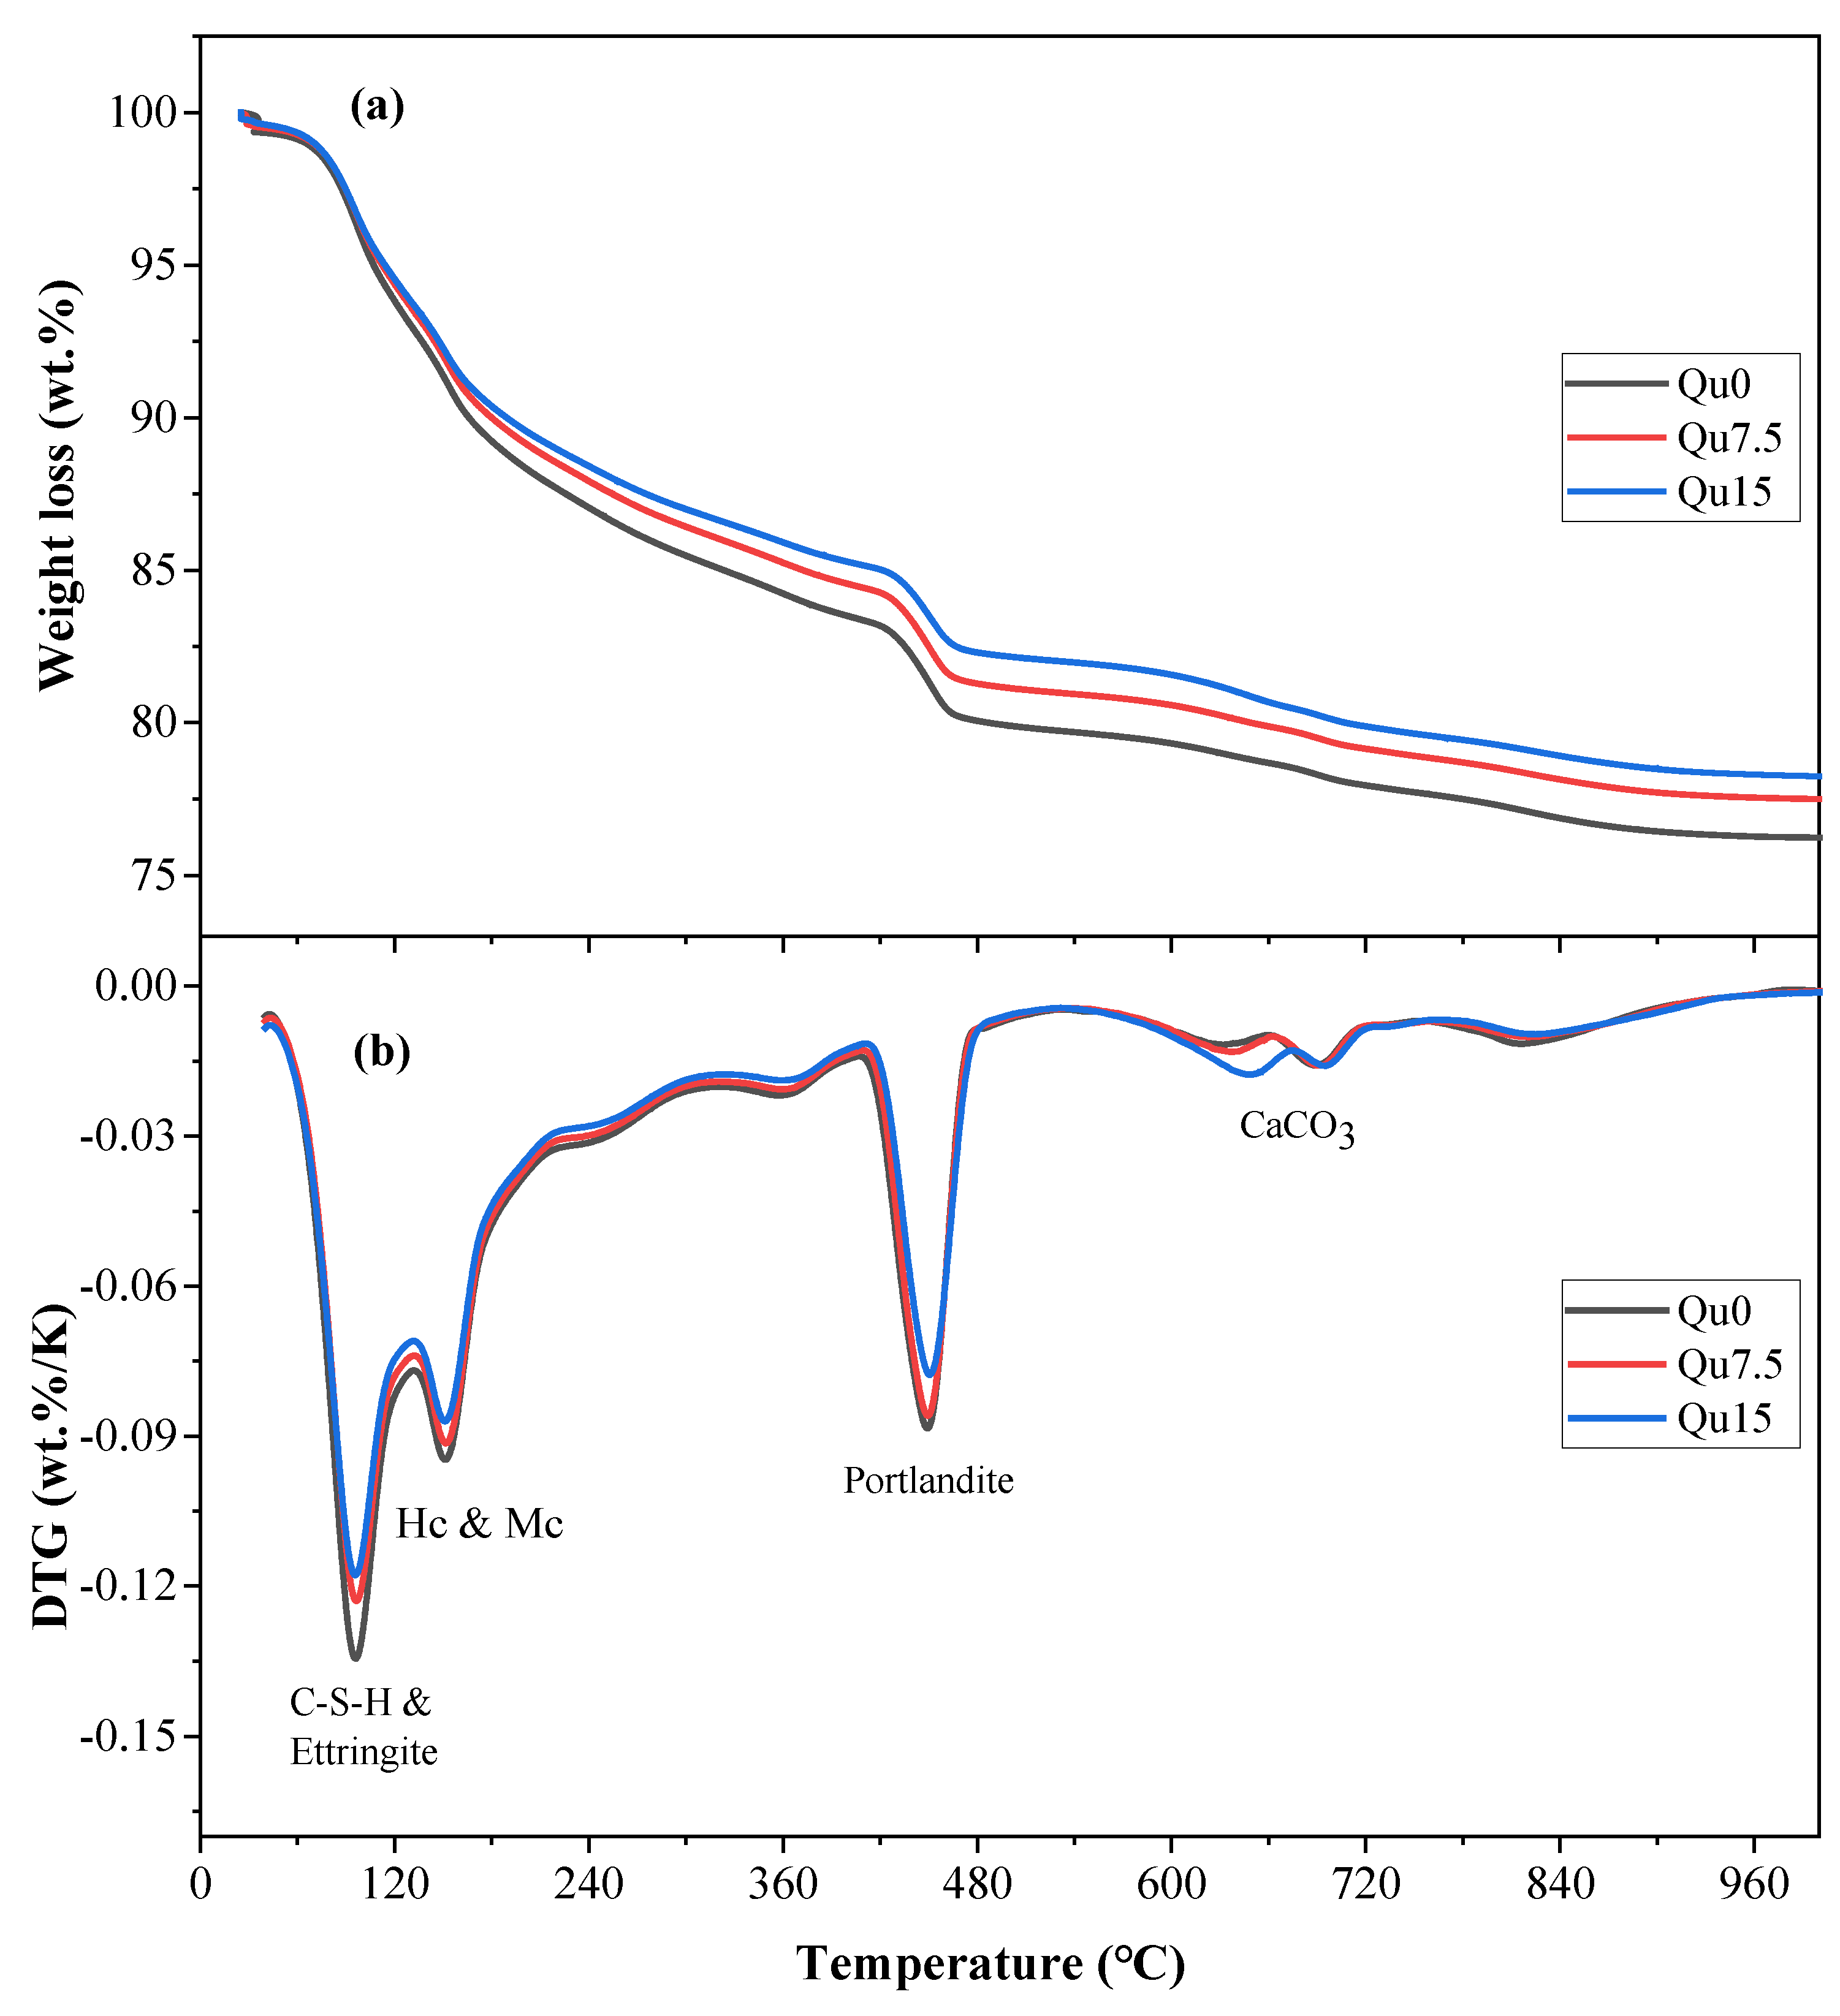
Figure 9a,b show the calculation results for the 28-day TG and DTG tests, respectively. Comparing Figure 8a and Figure 9a, we can see that the overall trend is similar. As the amount of quartz powder substitution increases, the mass loss decreases. From Day 1 to Day 28, the amount of mass loss increases because of an increase in hydration products, which generates more chemically bound water. Figure 9b shows that the hydration product contents, that is, CH and CSH, decrease as the amount of quartz powder substitution increases.
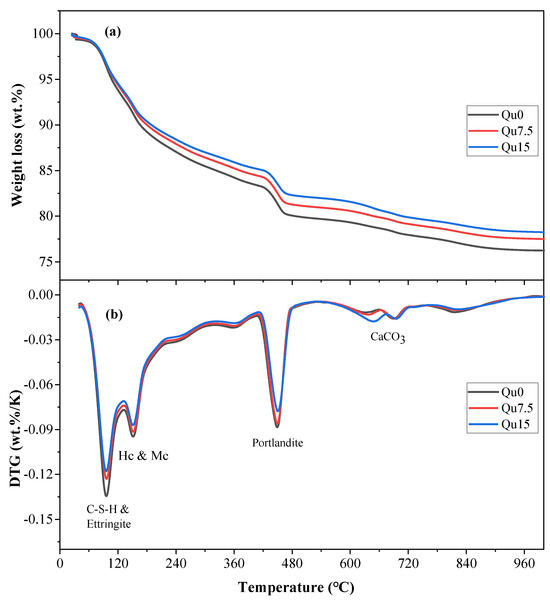
Figure 9.
Curves of Qu0, Qu7.5, and Qu15 after 28 days: (a) TGA; (b) DTG.
Calculations for chemically bound water and calcium hydroxide at 28 days are shown in Table 4. As the amount of quartz powder substitution increases, the chemically bound water and CH contents decrease, which indicates that the dilution effect of quartz powder plays a dominant role in those 28 days.
Table 4.
Combined water and portlandite in Qu0, Qu7.5, and Qu15 over 28 days.
The development of macro-properties can reflect the evolution of concrete’s microstructure. As combined water increases, hydration products form, and strength also increases. Hence, combined water and strength have a close relation. Figure 10 shows the relationship between chemically bound water and strength. We can see that for different specimens (Qu0, Qu7.5, and Qu15) at different test times (3 and 28 days), there is an exponential function relationship between chemically bound water and strength [31,32]. The chemically bound water unit is g/g binder, and the strength unit is MPa.
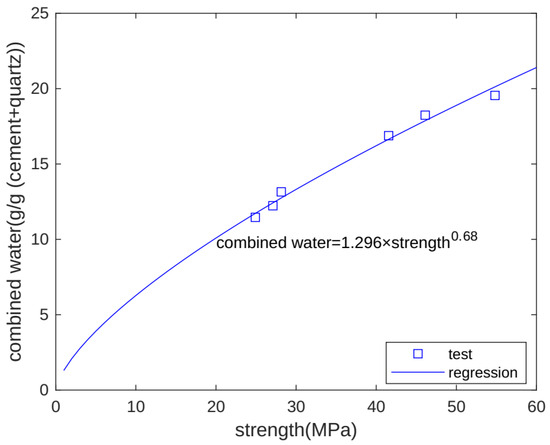
Figure 10.
Relationship between combined water and strength.
4. Hydration Model for Cement–Quartz Binary Blends
4.1. Calibration of Hydration Model Parameters
A three-parameter equation (TPE) for hydration heat is shown as follows [40]:
where Q(t) is the test results for hydration heat, Q0 is the hydration heat of 1 g of fully hydrated cement, b is the reaction rate parameter, and c is the shape parameter.
Q(t) = Q0 × exp(−b × (tc))
Given the test results for the hydration heat normalized by cement mass (shown in Figure 3d), the parameters of the hydration model can be determined (shown in Table 5) as follows.
Table 5.
Parameters of the hydration model.
b0, b7.5, and b15 are the reaction rate parameters, b, for the control, 7.5% quartz, and 15% quartz specimens, respectively. The steps for parameter regression are as follows: First, based on the experimental results of 7.5% quartz powder, the values of the parameters Q0, b7.5, and c are obtained. Then, keeping the values of Q0 and c unchanged, the value of b0 is obtained based on the experimental results without quartz powder. In the same way, based on the experimental results of 15% quartz powder, the value of b15 is obtained.
In this way, the values of the five parameters can be obtained, and these values can describe the curve of the cumulative heat of hydration of the three mix ratios with time.
For these three specimens, the values of Q0 and c are the same, and only the values of b are different. This means that quartz can accelerate the hydration of cement, but it does not change the essence of cement hydration.
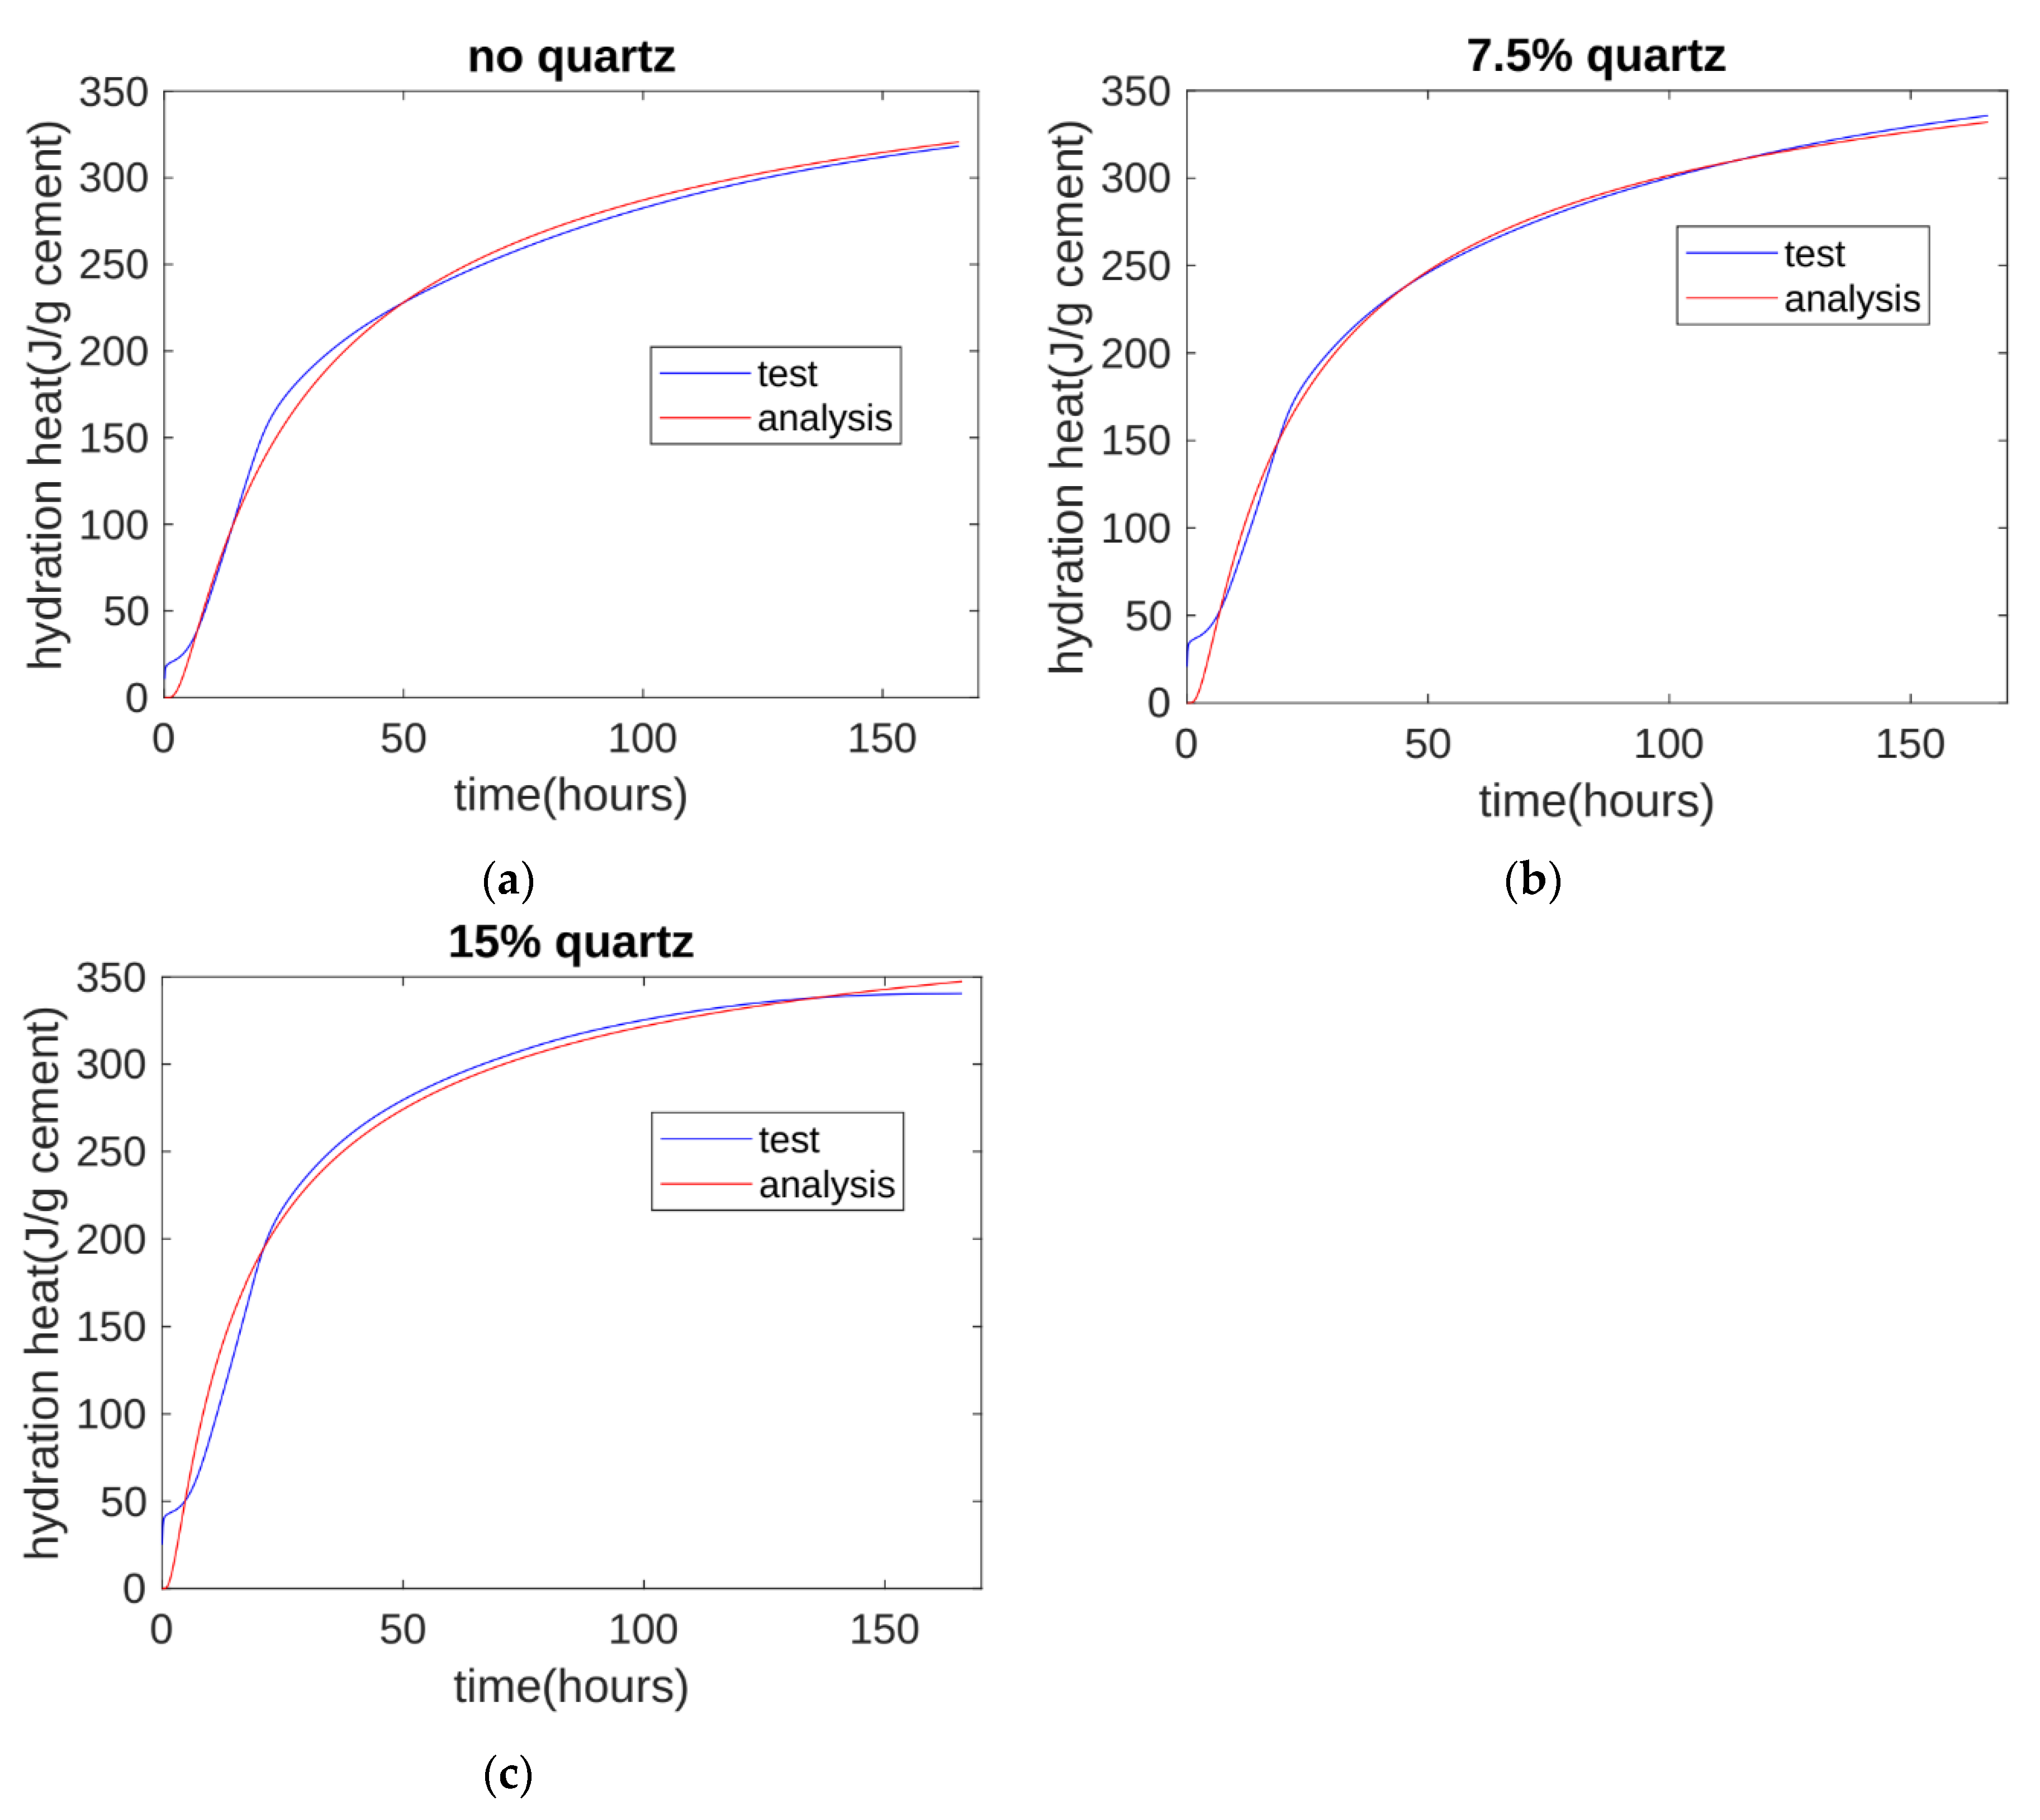
A comparison of the test and analysis results is shown in Figure 11. The analysis results generally agree with the test results. At about 10 h, the test results are slightly higher than the analysis results. This is because the three-parameter equation model does not consider the hydration heat from the initial contact period.
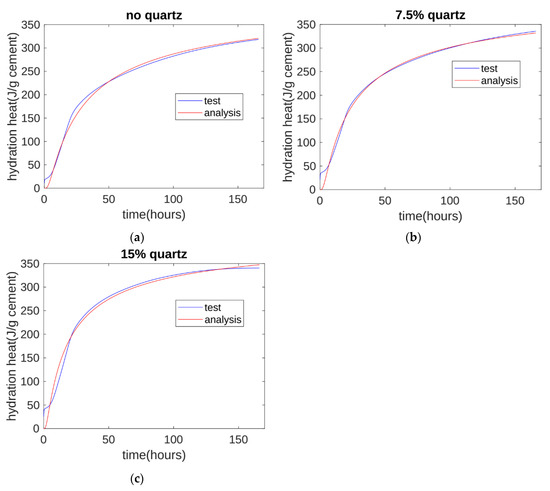
Figure 11.
Hydration heat analysis: (a) analysis results for control specimen; (b) analysis results for 7.5% quartz specimen; (c) analysis results for the 15% quartz specimen.
4.2. Evaluating Strength Development Using the Hydration Model
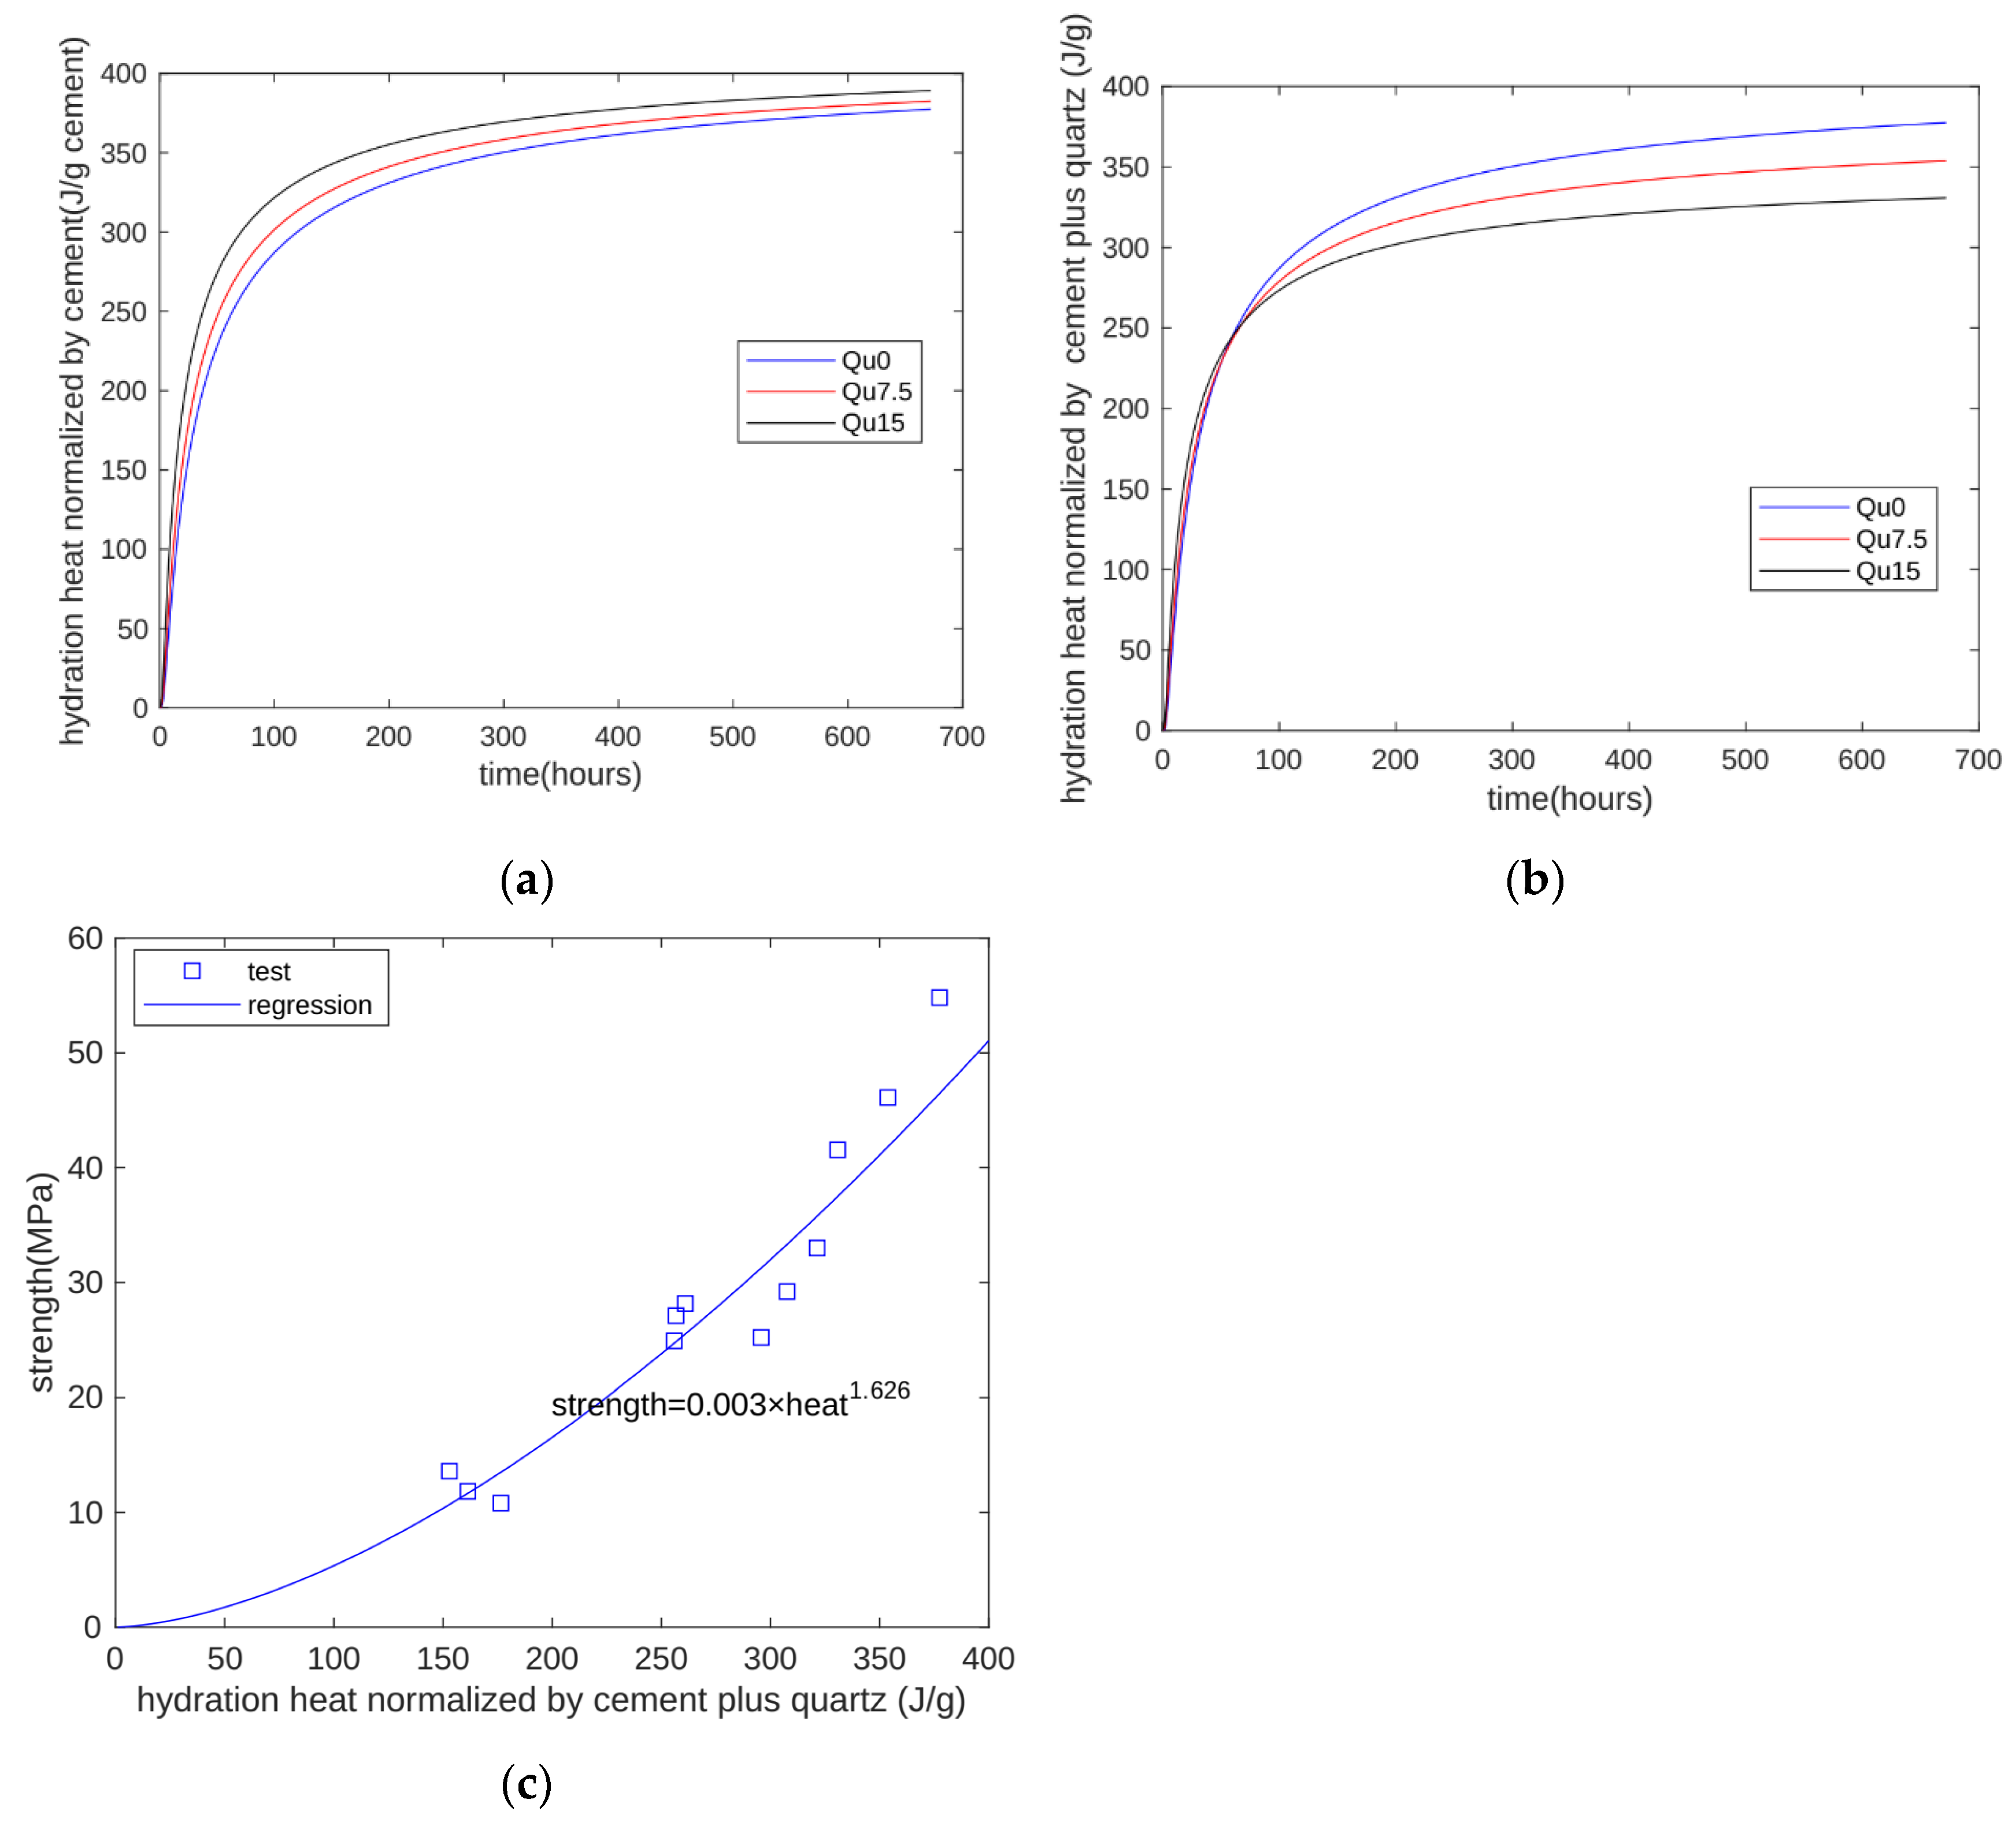
In cement–quartz blends, quartz is a chemically inert filler. In hydration heat tests, given the limits of testing equipment, only the first 7 days of heat can be measured. However, with the proposed model, we can calculate hydration heat beyond 7 days. The calculated results are shown in Figure 12. Figure 12a shows the heat normalized by the cement mass. As quartz content increases, heat normalized by the cement mass increases because of the nucleation effect. Figure 12b shows the heat normalized by the cement-plus-quartz mass. As quartz content increases, heat normalized by the cement-plus-quartz mass decreases because of the dilution effect. This means that although the nucleation effect can accelerate cement hydration, it cannot compensate for the reduction caused by the dilution effect.
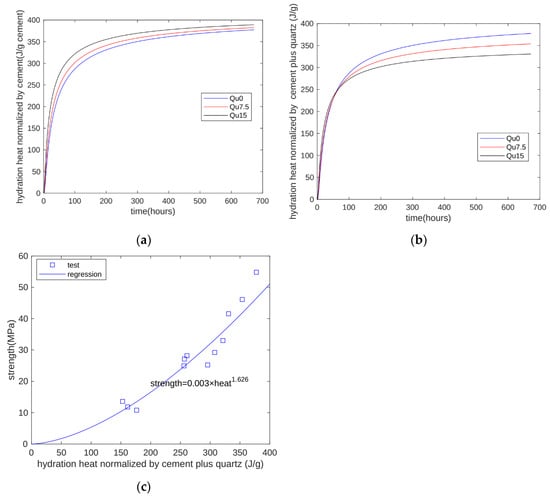
Figure 12.
Prediction of strength development using the proposed model: (a) heat normalized by cement mass; (b) heat normalized by cement-plus-quartz mass; (c) relationship between strength and hydration heat.
Figure 12c shows the relationship between strength and the calculated hydration heat. For all three specimens at all test ages (1, 3, 7, and 28 days), strength is generally an exponential function of hydration heat. The coefficient of determination of regression is 0.9163. In summary, our proposed model can overcome the weakness of hydration heat test machines and expand test results for hydration heat over a longer period.
5. Conclusions
The goal of this investigation is to measure the influence of the amount of quartz powder substitution on various properties of concrete (i.e., hydration heat, strength, hydration products, and electrical resistivity). We conducted a series of micro- and macro-experimental studies and created a numerical hydration model of binary mixtures of quartz powder and cement. The substitution rates of the quartz powder were 0% (Qu0), 7.5% (Qu7.5), and 15% (Qu15). The main conclusions are as follows:
- In the early stage of the hydration reaction (the first three days), as the amount of quartz powder substitution increased, the cumulative hydration heat also increased. This is mainly because the nucleation effect of quartz powder accelerated the hydration reaction of cement. In the later stage of the hydration reaction (about seven days), as the amount of quartz powder substitution increased, the cumulative hydration heat decreased. This is mainly due to the diluting effect of quartz powder.
- For Qu0, Qu7.5, and Qu15, the 1-day compressive strength values were 13.6, 11.84, and 10.81 MPa, respectively, and the reduction in compressive strength was not obvious. The compressive strengths at 28 days were 54.82, 46.11, and 41.55 MPa, respectively. Compared with that at Day 1, the compressive strength at 28 days decreased more obviously.
- Overall, there was an exponential relationship between the measurement results for UPV and compressive strength at 1, 3, 7, and 28 days. There was also an exponential relationship between the measurement results for resistivity and compressive strength at 1, 3, 7, and 28 days.
- The XRD test results showed that the main products of the reaction were AFt, CH, Hc, and Mc. From Day 1 to Day 28, the AFt content became insignificant because of the transition from AFt to AFm. In addition, from 1 day to 28 days, the Mc content became obvious because, compared with Hc, Mc has a better chemical stability.
- The TG test results showed that the mass loss decreased as the amount of quartz powder substitution increased. From 1 day to 28 days, the amount of mass loss increased. This is because the increase in hydration products resulted in the generation of more chemically bound water. As the amount of quartz powder substitution increased, the hydration product content decreased.
- For different specimens (Qu0, Qu7.5, and Qu15) at different test times (3 and 28 days), there was an exponential function relationship between chemically bound water and strength. The correlation coefficient between the test and regression results was 0.98.
- A numerical hydration model was proposed for cement–quartz binary blends. The parameters of the hydration model were determined based on hydration heat normalized by cement mass. Moreover, the hydration heat at 28 days was calculated using the proposed model. The strength development of all specimens and all test periods can be expressed as an exponential function of the hydration heat. The coefficient of determination of the regression was 0.9163.
Author Contributions
G.-Y.Z.: investigation, data curation, writing—original draft. S.O.: data curation, investigation. C.L.: data curation, investigation. Y.H.: investigation, data curation. R.-S.L.: data curation, investigation. X.-Y.W.: supervision, methodology, funding acquisition. All authors have read and agreed to the published version of the manuscript.
Funding
This work was supported by a National Research Foundation of Korea grant funded by the Korean government (MSIT) (No. RS-2023-00208720).
Institutional Review Board Statement
Not applicable.
Informed Consent Statement
Not applicable.
Data Availability Statement
The raw data supporting the conclusions of this article will be made available by the authors on request.
Conflicts of Interest
The authors declare no conflicts of interest.
References
- Supriya; Chaudhury, R.; Sharma, U.; Thapliyal, P.C.; Singh, L.P. Low-CO2 emission strategies to achieve net zero target in cement sector. J. Clean. Prod. 2023, 417, 137466. [Google Scholar] [CrossRef]
- Li, P.; Gao, X.; Wang, K.; Tam, I.W.Y.; Li, W. Hydration mechanism and early frost resistance of calcium sulfoaluminate cement concrete. Constr. Build. Mater. 2020, 239, 117862. [Google Scholar] [CrossRef]
- Chen, X.; Gruyaert, E.; Li, J. Modelling the effect of coarse recycled concrete aggregate on compressive strength of Portland cement concrete using volume fraction-based approach. Constr. Build. Mater. 2021, 309, 125159. [Google Scholar] [CrossRef]
- Zhang, D.; Zhang, S.; Huang, B.; Yang, Q.; Li, J. Comparison of mechanical, chemical, and thermal activation methods on the utilisation of recycled concrete powder from construction and demolition waste. J. Build. Eng. 2022, 61, 105295. [Google Scholar] [CrossRef]
- Gartner, E.; Hirao, H. A review of alternative approaches to the reduction of CO2 emissions associated with the manufacture of the binder phase in concrete. Cem. Concr. Res. 2015, 78, 126–142. [Google Scholar] [CrossRef]
- Bilal, H.; Chen, T.; Ren, M.; Gao, X.; Su, A. Influence of silica fume, metakaolin & SBR latex on strength and durability performance of pervious concrete. Constr. Build. Mater. 2021, 275, 122124. [Google Scholar]
- Hong, W.Y. A techno-economic review on carbon capture, utilisation and storage systems for achieving a net-zero CO2 emissions future. Carbon Capture Sci. Technol. 2022, 3, 100044. [Google Scholar] [CrossRef]
- Yang, K.-H.; Song, J.-K.; Song, K.-I. Assessment of CO2 reduction of alkali-activated concrete. J. Clean. Prod. 2013, 39, 265–272. [Google Scholar] [CrossRef]
- Giergiczny, Z.; Król, A.; Tałaj, M.; Wandoch, K. Performance of Concrete with Low CO2 Emission. Energies 2020, 13, 4328. [Google Scholar] [CrossRef]
- Wang, Y.; Lu, B.; Hu, X.; Liu, J.; Zhang, Z.; Pan, X.; Xie, Z.; Chang, J.; Zhang, T.; Nehdi, M.L.; et al. Effect of CO2 surface treatment on penetrability and microstructure of cement-fly ash–slag ternary concrete. Cem. Concr. Compos. 2021, 123, 104194. [Google Scholar] [CrossRef]
- Krithika, J.; Ramesh Kumar, G.B. Influence of fly ash on concrete—A systematic review. Mater. Today Proc. 2020, 33, 906–911. [Google Scholar] [CrossRef]
- Mena, J.; González, M.; Remesar, J.C.; Lopez, M. Developing a very high-strength low-CO2 cementitious matrix based on a multi-binder approach for structural lightweight aggregate concrete. Constr. Build. Mater. 2020, 234, 117830. [Google Scholar] [CrossRef]
- Zhao, Y.; Qiu, J.; Xing, J.; Sun, X. Chemical activation of binary slag cement with low carbon footprint. J. Clean. Prod. 2020, 267, 121455. [Google Scholar] [CrossRef]
- Amran, M.; Murali, G.; Khalid, N.H.A.; Fediuk, R.; Ozbakkaloglu, T.; Lee, Y.H.; Haruna, S.; Lee, Y.Y. Slag uses in making an ecofriendly and sustainable concrete: A review. Constr. Build. Mater. 2021, 272, 121942. [Google Scholar] [CrossRef]
- Yi, Z.; Wang, T.; Guo, R. Sustainable building material from CO2 mineralization slag: Aggregate for concretes and effect of CO2 curing. J. CO2 Util. 2020, 40, 101196. [Google Scholar] [CrossRef]
- Lothenbach, B.; Gruskovnjak, A. Hydration of alkali-activated slag: Thermodynamic modelling. Adv. Cem. Res. 2007, 19, 81–92. [Google Scholar] [CrossRef]
- Matos, P.R.d.; Foiato, M.; Prudêncio, L.R. Ecological, fresh state and long-term mechanical properties of high-volume fly ash high-performance self-compacting concrete. Constr. Build. Mater. 2019, 203, 282–293. [Google Scholar] [CrossRef]
- Luan, C.; Zhou, A.; Li, Y.; Zou, D.; Gao, P.; Liu, T. CO2 avoidance cost of fly ash geopolymer concrete. Constr. Build. Mater. 2024, 416, 135193. [Google Scholar] [CrossRef]
- Wang, X.-Y. Simulation for optimal mixture design of low-CO2 high-volume fly ash concrete considering climate change and CO2 uptake. Cem. Concr. Compos. 2019, 104, 103408. [Google Scholar] [CrossRef]
- Wang, X.-Y. Design of low-cost and low-CO2 air-entrained fly ash-blended concrete considering carbonation and frost durability. J. Clean. Prod. 2020, 272, 122675. [Google Scholar] [CrossRef]
- Glosser, D.; Suraneni, P.; Isgor, O.B.; Weiss, W.J. Using glass content to determine the reactivity of fly ash for thermodynamic calculations. Cem. Concr. Compos. 2021, 115, 103849. [Google Scholar] [CrossRef]
- Zunino, F.; Martirena, F.; Scrivener, K. Limestone Calcined Clay Cements (LC3). ACI Mater. J. 2021, 118, 49–60. [Google Scholar]
- Mayhoub, O.A.; Nasr, E.S.A.; Ali, Y.A.; Kohail, M. The influence of ingredients on the properties of reactive powder concrete: A review. Ain Shams Eng. J. 2021, 12, 145–158. [Google Scholar] [CrossRef]
- Krishnan, A.; Nighojkar, A.; Kandasubramanian, B. Emerging towards zero carbon footprint via carbon dioxide capturing and sequestration. Carbon Capture Sci. Technol. 2023, 9, 100137. [Google Scholar] [CrossRef]
- Tavares, L.R.C.; Junior, J.F.T.; Costa, L.M.; da Silva Bezerra, A.C.; Cetlin, P.R.; Aguilar, M.T.P. Influence of quartz powder and silica fume on the performance of Portland cement. Sci. Rep. 2020, 10, 21461. [Google Scholar] [CrossRef] [PubMed]
- Huang, L.; Tang, L.; Löfgren, I.; Olsson, N.; Babaahmadi, A.; Esping, O.; Li, Y.; Yang, Z. Non-destructive test system to monitor hydration and strength development of low CO2 concrete. Constr. Build. Mater. 2023, 408, 133774. [Google Scholar] [CrossRef]
- Hornbostel, K.; Larsen, C.K.; Geiker, M.R. Relationship between concrete resistivity and corrosion rate—A literature review. Cem. Concr. Compos. 2013, 39, 60–72. [Google Scholar] [CrossRef]
- Li, T.; Chen, H.; Zhang, T.; Liu, L.; Zheng, Y. Thermodynamic study on phase composition of hardened Portland cement paste exposed to CaCl2 solution: Effects of temperature, CaCl2 concentration, and type and dosage of supplementary cementitious materials. Cem. Concr. Res. 2024, 178, 107437. [Google Scholar] [CrossRef]
- Liu, C.; Li, Z.; Nie, S.; Skibsted, J.; Ye, G. Structural evolution of calcium sodium aluminosilicate hydrate (C-(N-)A-S-H) gels induced by water exposure: The impact of Na leaching. Cem. Concr. Res. 2024, 178, 107432. [Google Scholar] [CrossRef]
- Kumar Mehta, P.; Monteiro, P.J.M. Concrete: Microstructure, Properties, and Materials, 4th ed.; McGraw-Hill: London, UK, 2014; p. 675. [Google Scholar]
- Sabireen; Butt, F.; Ahmad, A.; Ullah, K.; Zaid, O.; Shah, H.A.; Kamal, T. Mechanical performance of fiber-reinforced concrete and functionally graded concrete with natural and recycled aggregates. Ain Shams Eng. J. 2023, 14, 102121. [Google Scholar] [CrossRef]
- Azarsa, P.; Gupta, R. Electrical Resistivity of Concrete for Durability Evaluation: A Review. Adv. Mater. Sci. Eng. 2017, 2017, 8453095. [Google Scholar] [CrossRef]
- Scrivener, K.; Snellings, R.; Lothenbach, B. A Practical Guide to Microstructural Analysis of Cementitious Materials; CRC Press: Boca Raton, FL, USA, 2016. [Google Scholar]
- Kim, S.Y.; Eum, D.; Lee, H.; Park, K.; Terada, K.; Han, T.S. Evaluating tensile strength of cement paste using multiscale modeling and in-situ splitting tests with micro-CT. Constr. Build. Mater. 2024, 411, 134642. [Google Scholar] [CrossRef]
- Shi, J.; Liu, B.; He, Z.; Liu, Y.; Jiang, J.; Xiong, T.; Shi, J. A green ultra-lightweight chemically foamed concrete for building exterior: A feasibility study. J. Clean. Prod. 2021, 288, 125085. [Google Scholar] [CrossRef]
- Scrivener, K.; Martirena, F.; Bishnoi, S.; Maity, S. Calcined clay limestone cements (LC3). Cem. Concr. Res. 2018, 114, 49–56. [Google Scholar] [CrossRef]
- Zhang, G.-Y.; Ahn, Y.-H.; Lin, R.-S.; Wang, X.-Y. Effect of Waste Ceramic Powder on Properties of Alkali-Activated Blast Furnace Slag Paste and Mortar. Polymers 2021, 13, 2817. [Google Scholar] [CrossRef] [PubMed]
- Sharma, M.; Bishnoi, S.; Martirena, F.; Scrivener, K. Limestone calcined clay cement and concrete: A state-of-the-art review. Cem. Concr. Res. 2021, 149, 106564. [Google Scholar] [CrossRef]
- De Weerdt, K.; Haha, M.B.; Le Saout, G.; Kjellsen, K.O.; Justnes, H.; Lothenbach, B. Hydration mechanisms of ternary Portland cements containing limestone powder and fly ash. Cem. Concr. Res. 2011, 41, 279–291. [Google Scholar] [CrossRef]
- Sargam, Y.; Wang, K. Hydration kinetics and activation energy of cement pastes containing various nanoparticles. Compos. Part B Eng. 2021, 216, 108836. [Google Scholar] [CrossRef]

Disclaimer/Publisher’s Note: The statements, opinions and data contained in all publications are solely those of the individual author(s) and contributor(s) and not of MDPI and/or the editor(s). MDPI and/or the editor(s) disclaim responsibility for any injury to people or property resulting from any ideas, methods, instructions or products referred to in the content. |
© 2024 by the authors. Licensee MDPI, Basel, Switzerland. This article is an open access article distributed under the terms and conditions of the Creative Commons Attribution (CC BY) license (https://creativecommons.org/licenses/by/4.0/).