Article

Physical and Chemical Methods to Assess Performance of TPO-Modified Asphalt Binder

by
Rebecca M. Herndon
1,*,
Jay Balasubramanian
2,
Klaus Woelk
3 and
Magdy Abdelrahman
1,*
1
Department of Civil Engineering, Missouri University of Science and Technology, Rolla, MO 65409, USA
2
Department of Chemical and Biomedical Engineering, Missouri University of Science and Technology, Rolla, MO 65409, USA
3
Department of Chemistry, Missouri University of Science and Technology, Rolla, MO 65409, USA
*
Authors to whom correspondence should be addressed.
Appl. Sci. 2024, 14(8), 3300; https://doi.org/10.3390/app14083300
Submission received: 27 February 2024 / Revised: 4 April 2024 / Accepted: 5 April 2024 / Published: 14 April 2024

Abstract

:
The demand for effective asphalt additives is growing as road infrastructure ages and more sustainable pavement solutions are needed. Tire pyrolysis oil (TPO) is an example material that has been gaining attention as a potential asphalt additive. While physical performance grade (PG) temperatures are the predominant performance requirements for asphalt binders, chemical properties are also significant in the evaluation of asphalt performance. There is a need to chemically characterize the aging of asphalt binders modified with TPO and link chemical changes in binder components to binder performance. This study compares 2%, 4%, and 8% TPO and asphalt binder blends via dynamic shear rheometry (DSR), Fourier-transform infrared (FTIR) spectroscopy, and nuclear magnetic resonance (NMR) relaxometry. The variability in the modified blends was seen by both physical and chemical testing during four different blending times (1, 60, 120, and 240 min). After blending, high and intermediate PGs were determined by physical testing. The 8% TPO blend reduced the high PG of the binder from 64 °C to 58 °C. This effect was confirmed by chemical testing through changes in carbonyl indices and NMR relaxation times. With more oil present in the binder matrix, the binder’s resistance to rutting was reduced. While the high PG was hindered, the intermediate PG remained unchanged for all TPO blends. This physical similarity was mirrored in chemical testing. The chemical and physical variability along with the hindrance of the high PG temperature indicate that more treatment may be needed before TPO can be effectively applied to asphalt binders. This study suggests a correlation between physical performance and key chemical indicators.

1. Introduction

Different materials have been used over the years as asphalt binder additives [1,2,3]. Oils are one of the biggest categories of asphalt additives. Oil additives can enhance asphalt performance by reducing binder stiffness [4]; however, oils can also make binders too soft, reducing their high-temperature performance [5]. Tire pyrolysis oil (TPO) is obtained by heating tires between 300 and 1000 °C without the presence of oxygen. Although many studies have focused on using pyrolysis to produce liquid fuels [6,7,8], recently, some studies have added pyrolysis oils into asphalt binders [9,10,11,12]. Chemically dense and reactive additives like TPO are likely to change the physical and chemical performance of the asphalt binder. While the standardized physical performance of materials is important, a standard for chemical evaluation is still needed. This study will use both physical and chemical testing to compare standardized aging performance on TPO-modified binders.
Tire pyrolysis oil could be a good asphalt additive if properly processed to contain minimal pollutants and effectively interact with a binder’s matrix. Tires have desirable components, but their strong cross-polymerization makes it difficult to separate and maximize profitable products [10,13,14,15,16]. Some tires are physically processed and used recreationally, but this can release environmental pollutants [17]. The chemical processing of tires depends heavily on processing variables like temperature, pressure, heating rate, and residence time [14]. TPO has been tested and chemically characterized, though due to the high variability in the source material and processing, it is unknown how similar TPO compositions are [9]. Catalysts and optimum production parameters are still being developed for a better chemical processing of TPO [13]. While proper processing is an economic investment, there are potential economic advantages. Tires are essential to road systems, creating and maintaining a large feedstock of materials. Additionally, TPO has been used in asphalt binders as a rejuvenator [9,12]. Rejuvenators can reverse and prevent the effects of aging, making the recycling of pavements economically sustainable. One study found that TPO blends reduced the stiffness of aged binders and enhanced fatigue resistance. Additionally, carbonyl indices, an indication of aging, were reduced with the addition of TPO [9]. Another study found that the rejuvenated binder’s storage stability depended on the type of rejuvenator and the aging of the blend. The thermal stability and chemical compatibility of blends are needed for an effective asphalt matrix [18]. While many factors can influence the quality and physical performance of TPO, recycling pavements involves both physical and chemical changes. Therefore, it is important to have more chemical performance testing to understand how aging affects TPO-modified blends.
In contrast to the high variability of TPO, an asphalt binder has existing standards to characterize its physical aging. Standardized physical methods like the rolling thin-film oven test (RTFOT) and pressure aging vessel (PAV) are used to compare asphalt binder blends by mimicking short-term and long-term aging in the field, respectively. Modified asphalt is tested via the RTFOT to determine the mass loss and viscoelastic changes due to modeled mixing and compaction. Since some additives have highly volatile components, it is important to see if the additive will remain in the blend or be released into the environment. The stiffness parameter G*/sin(δ) is obtained for unaged and RTFOT-aged samples to determine the high PG temperature. After the RTFOT, PAV testing is conducted to mimic 7–10 years of service life aging. This testing indicates how well the modified blend will perform in the field. The stiffness parameter changes to G*·sin(δ) and indicates the intermediate PG temperature. These parameters are measured by the dynamic shear rheometer (DSR) in standardized procedures. While the current methodology relies on standardized, bulk physical testing, testing for chemical changes could provide additional valuable information.
Asphalt research has considered many modes of data acquisition outside the standardized methods. Fourier-transform infrared (FTIR) spectrometry can analyze the presence of functional groups in an analyte [19], and the quantitative determination of carbonyl and sulfoxide groups has been used to indicate aging [20,21]. Nuclear magnetic resonance (NMR) has been used to identify chemical changes caused by rejuvenation through the analysis of T2 relaxation times [22]. Other methods of characterization include energy-dispersive X-ray spectroscopy [23], atomic force microscopy [24], differential scanning calorimetry, SARA fraction analysis, and gel permeation chromatography [25,26]. Optical methods like scanning electron microscopy and other imaging techniques can also be used to see changes in the structure of asphalt [27,28]. All in all, there are many chemical techniques, but no consensus can be reached regarding standardization.
While some studies consider individual chemical compounds, few consider chemical environments that may affect the microstructure of the material. In this study, physical and chemical methods were used to indicate the blend quality and performance of TPO as an asphalt additive. DSR, FTIR, and NMR relaxometry were used to compare TPO-modified asphalt binders. DSR testing revealed bulk macrostructure properties (G*/sinδ) and was compared with chemical testing that indicated changes in the asphalt binder microstructure. While FTIR testing displays the presence of chemical functional groups that make up the microstructure, NMR relaxometry directly probes into the microstructure itself.

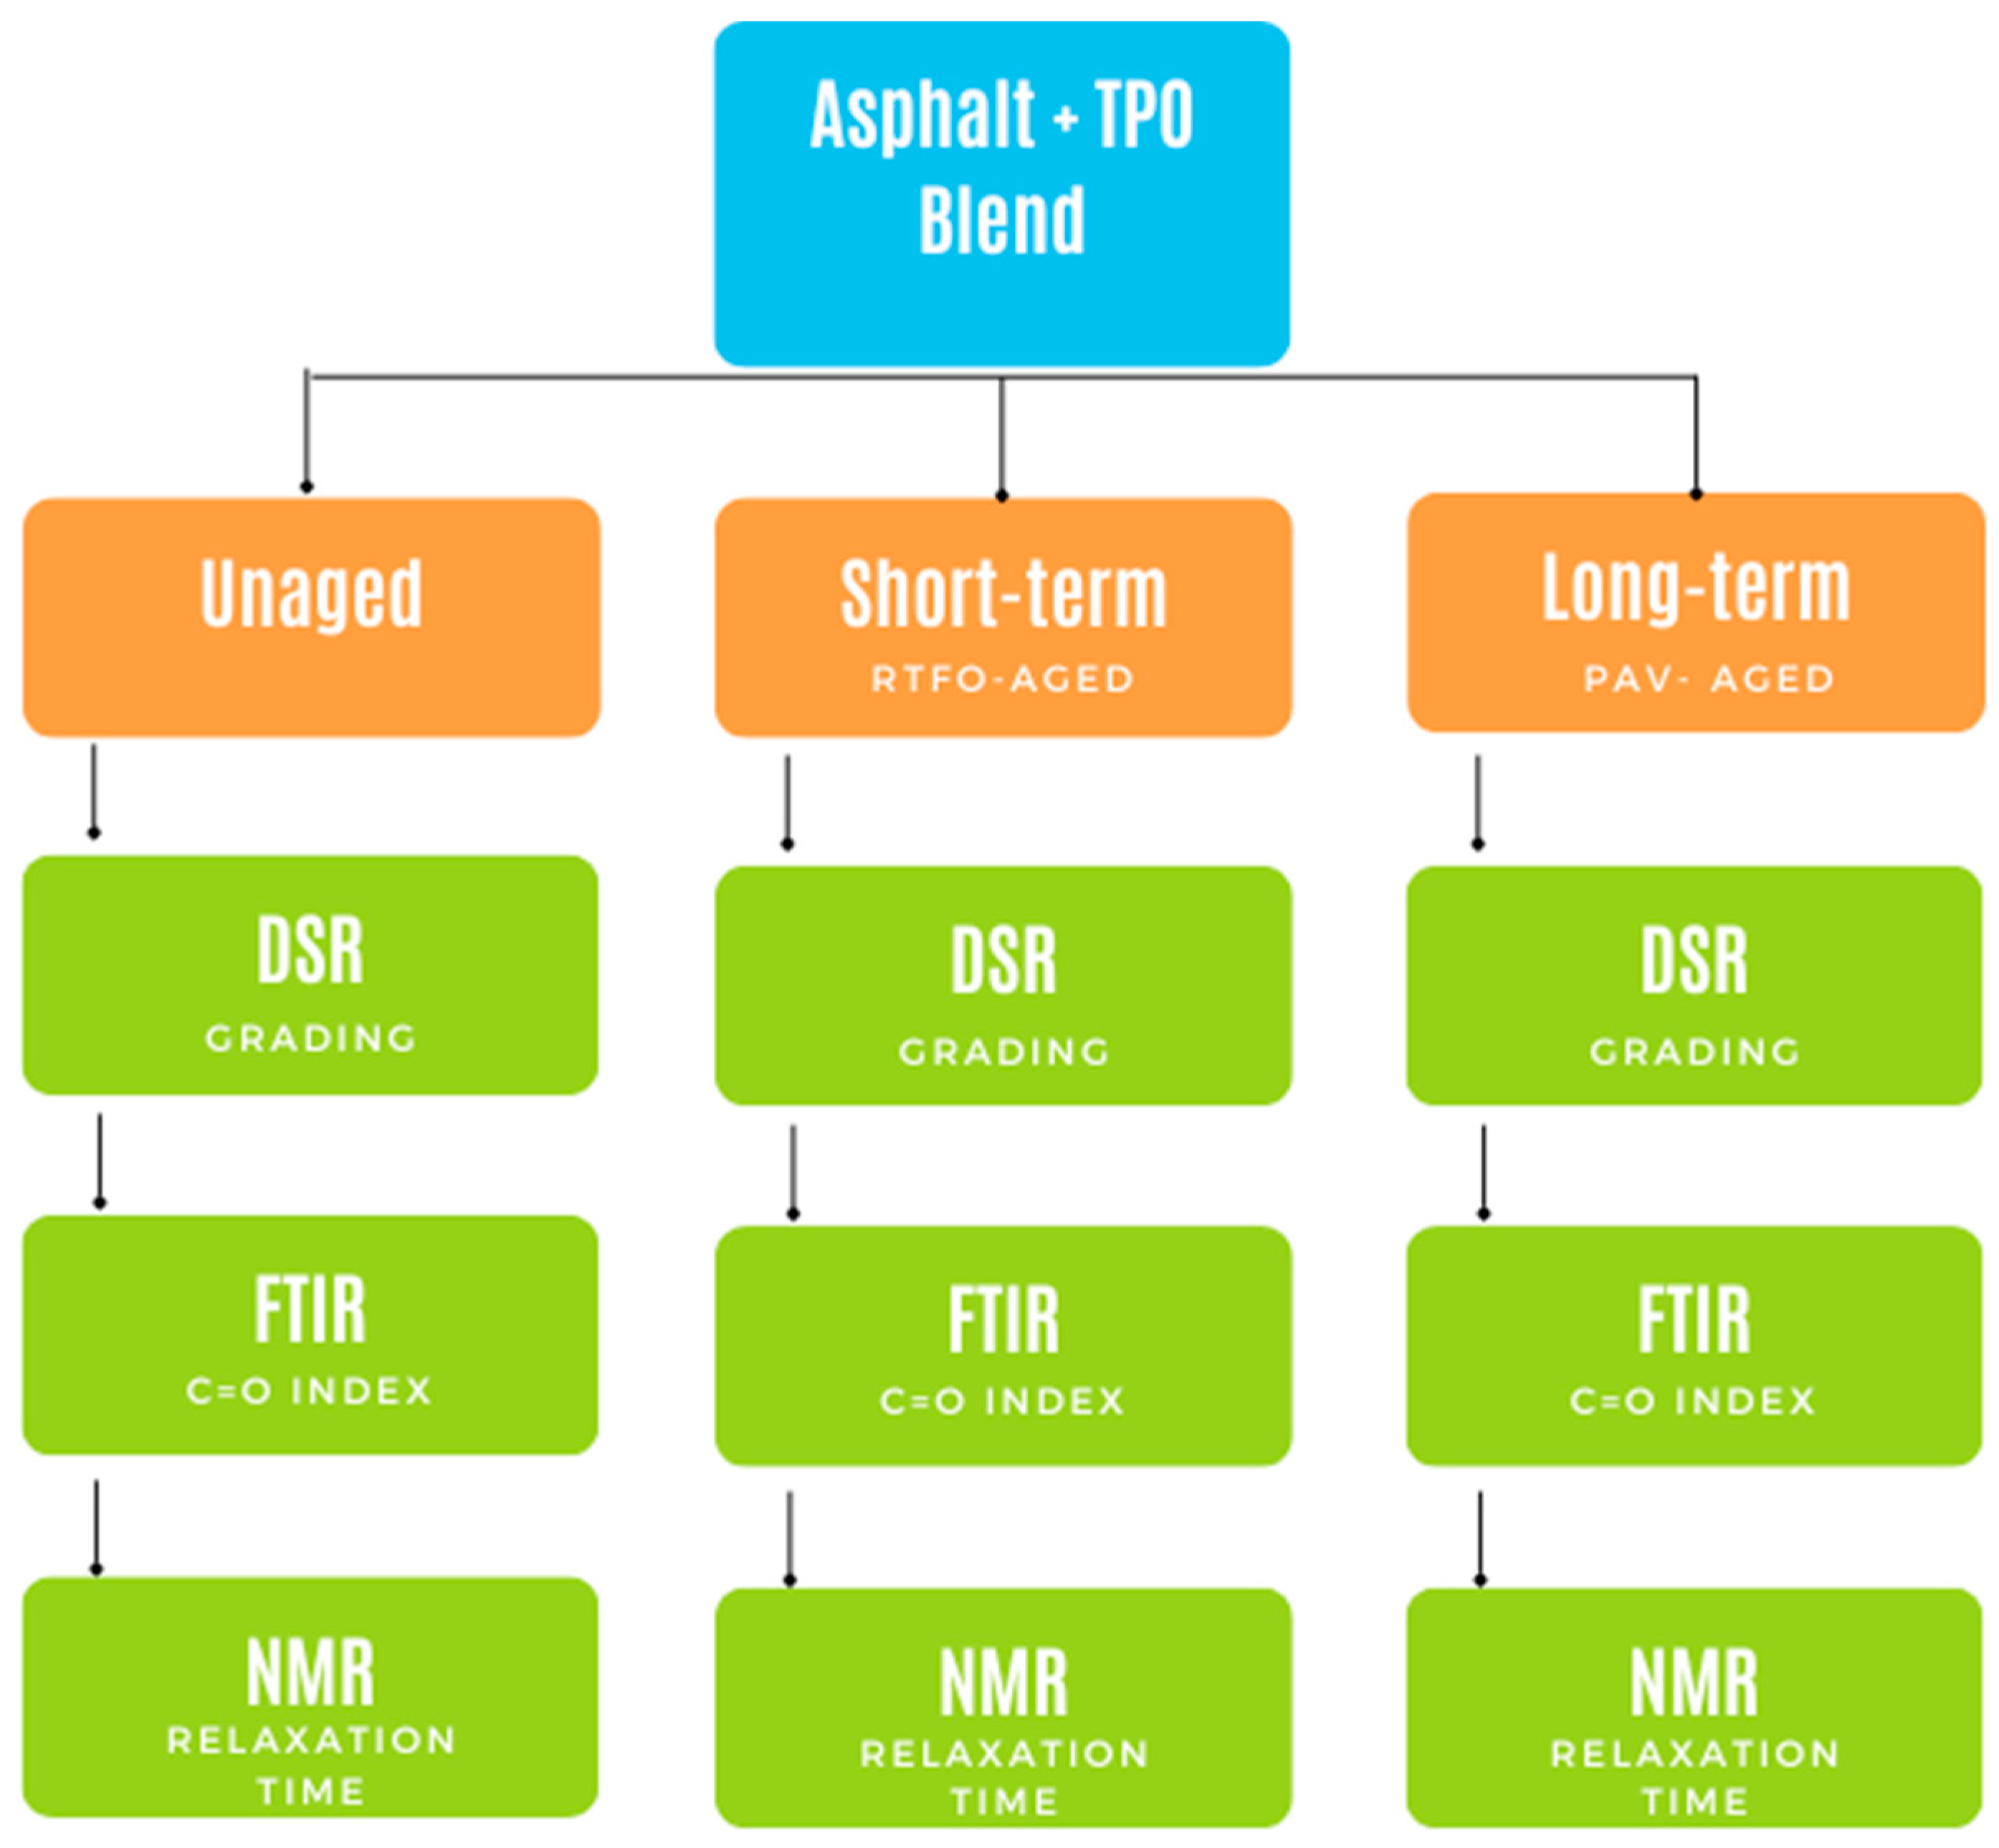
2. Materials and Methods

Holmes-sourced PG 64–22 asphalt binder was mixed at 120 °C at 1800 rpm for four hours with three different percentages (2, 4, 8%) of tire pyrolysis oil. Samples were taken at 1, 60, 120, and 240 min while blending. The properties of the TPO are below in Table 1. The viscosity of the TPO was taken at room temperature due to the violent bubbling when heated. The flash point was determined using AASHTO T 48 and ASTM D 92. The flash point of TPO was close to the mixing and compaction temperatures of asphalt, presenting a safety concern.
After blending, unaged, short-term aged (ASTM D2872 or AASHTO T240), and long-term aged (ASTM D6521 or AASHTO R28) samples were tested further according to the experimental design in Figure 1. DSR data were collected with an Anton Parr device using the standardized approach for high and intermediate performance grading. A Thermo Scientific Nicolet iS50 FT-IR (Waltham, MA, USA) was used to collect the FTIR data. Spectra were created with 32 scans in absorbance mode using an ATR crystal. The spectra were normalized to the peak at 2920 cm−1, as it was the most prominent and consistent across all spectra. Carbonyl indices were found according to the method used by Lamontagne et al. [29].
1H NMR T1 relaxation spectra were acquired using a Bruker Avance DRX 200-MHz spectrometer (Billerica, MA, USA). Samples were prepared by dipping a 2 mm O.D. capillary tube into the heated binder. The capillary tube was then placed inside a standard 5 mm NMR tube. The samples were not diluted, and measurements were taken at ambient temperatures. NMR spin–lattice relaxation data were recorded with the SIP-R method [30], a recently introduced modification of the traditional inversion recovery technique [31]. 256 1H SIP-R spectra of four scans each were collected at an NMR spectral width of 750 kHz, showing a single large resonance with a half-height linewidth of 35 ppm (7 kHz). A five-second pre-delay was used to allow for nuclear magnetization to return to thermodynamic equilibrium before each scan. The recovery delay t was varied on an exponential time scale (i.e., sampled equidistantly on a logarithmic t-axis) between 50 µs and 10 s. The integrated intensities of the relaxation delay-dependent signals were then processed with an Inverse Laplace Transform (ILT) fitting the coefficients for 128 predefined T1 relaxation times. In a sample, there is usually one relaxation time that accounts for a majority of the sample (>85%); this is called a primary T1 time. The next majority is called the secondary T1 time, which can range from 1 to 30% of the sample. Since the primary decay occurred between 0.005 and 5 s, the relaxation curves are shown as such. The relaxation times can be identified as the inflection points in the relaxation curves.

3. Results

3.1. Blending Homogeneity

Samples were tested via DSR and FTIR testing to determine how the blends changed over time. DSR testing was performed to compare the standardized physical viscoelastic properties. FTIR testing was conducted to determine if new chemical functional groups were created when blending. Due to the high amount of variability and chemical noise, NMR analysis was not conducted on the blending time samples.

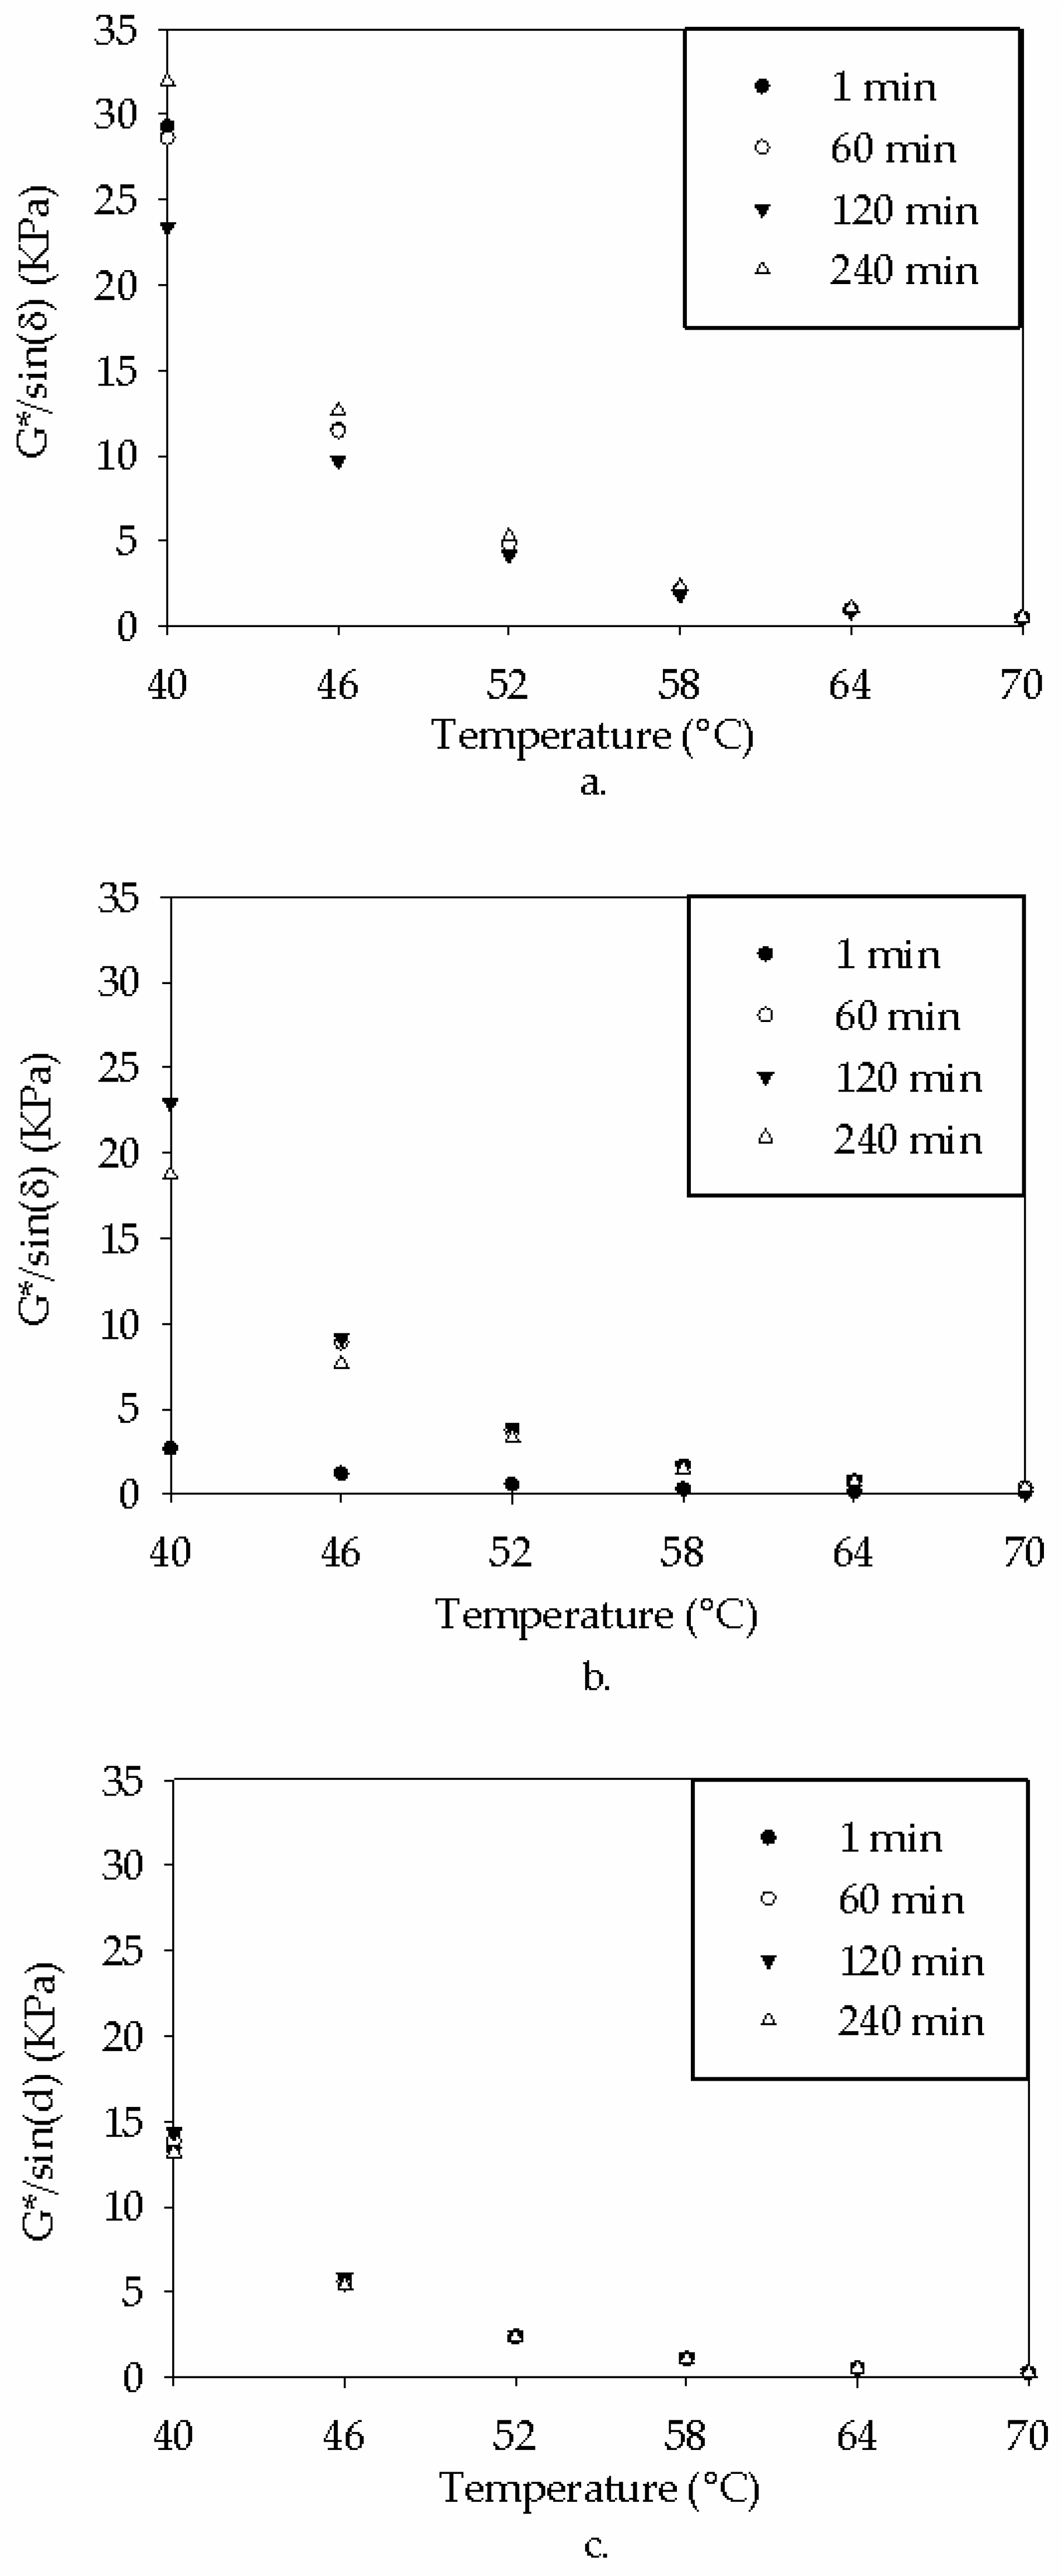
3.1.1. Standardized Physical Testing (DSR) on Blending Homogeneity

Due to the reactive nature of the added tire pyrolysis oil, these samples experienced viscoelastic variability, as seen in Figure 2. The inhomogeneity of each sample decreased as the testing temperature increased. The 8% TPO sample did have some variability at lower testing temperatures (40 °C), but the matrix was quickly homogenized during the blending times. In contrast, the 2% and 4% TPO samples experienced an increase and decrease in stiffness as blending time increased. This inhomogeneity was seen most at testing temperatures less than 64 °C. The highest stiffness for the 2% TPO blend was at 240 min while the lowest occurred at 120 min. The highest stiffness for the 4% sample occurred at 120 min and the lowest was at 1 min. The variability in the stiffness parameter G*/sinδ was due to the amount of oil in the sample matrix. At lower testing temperatures and blending times, the interaction between the TPO and asphalt binder was reduced and resulted in more variability. For all samples, testing temperature had a greater role in determining the blended homogeneity; physical DSR testing temperatures higher than 58 °C were needed to homogenize the blended matrix.

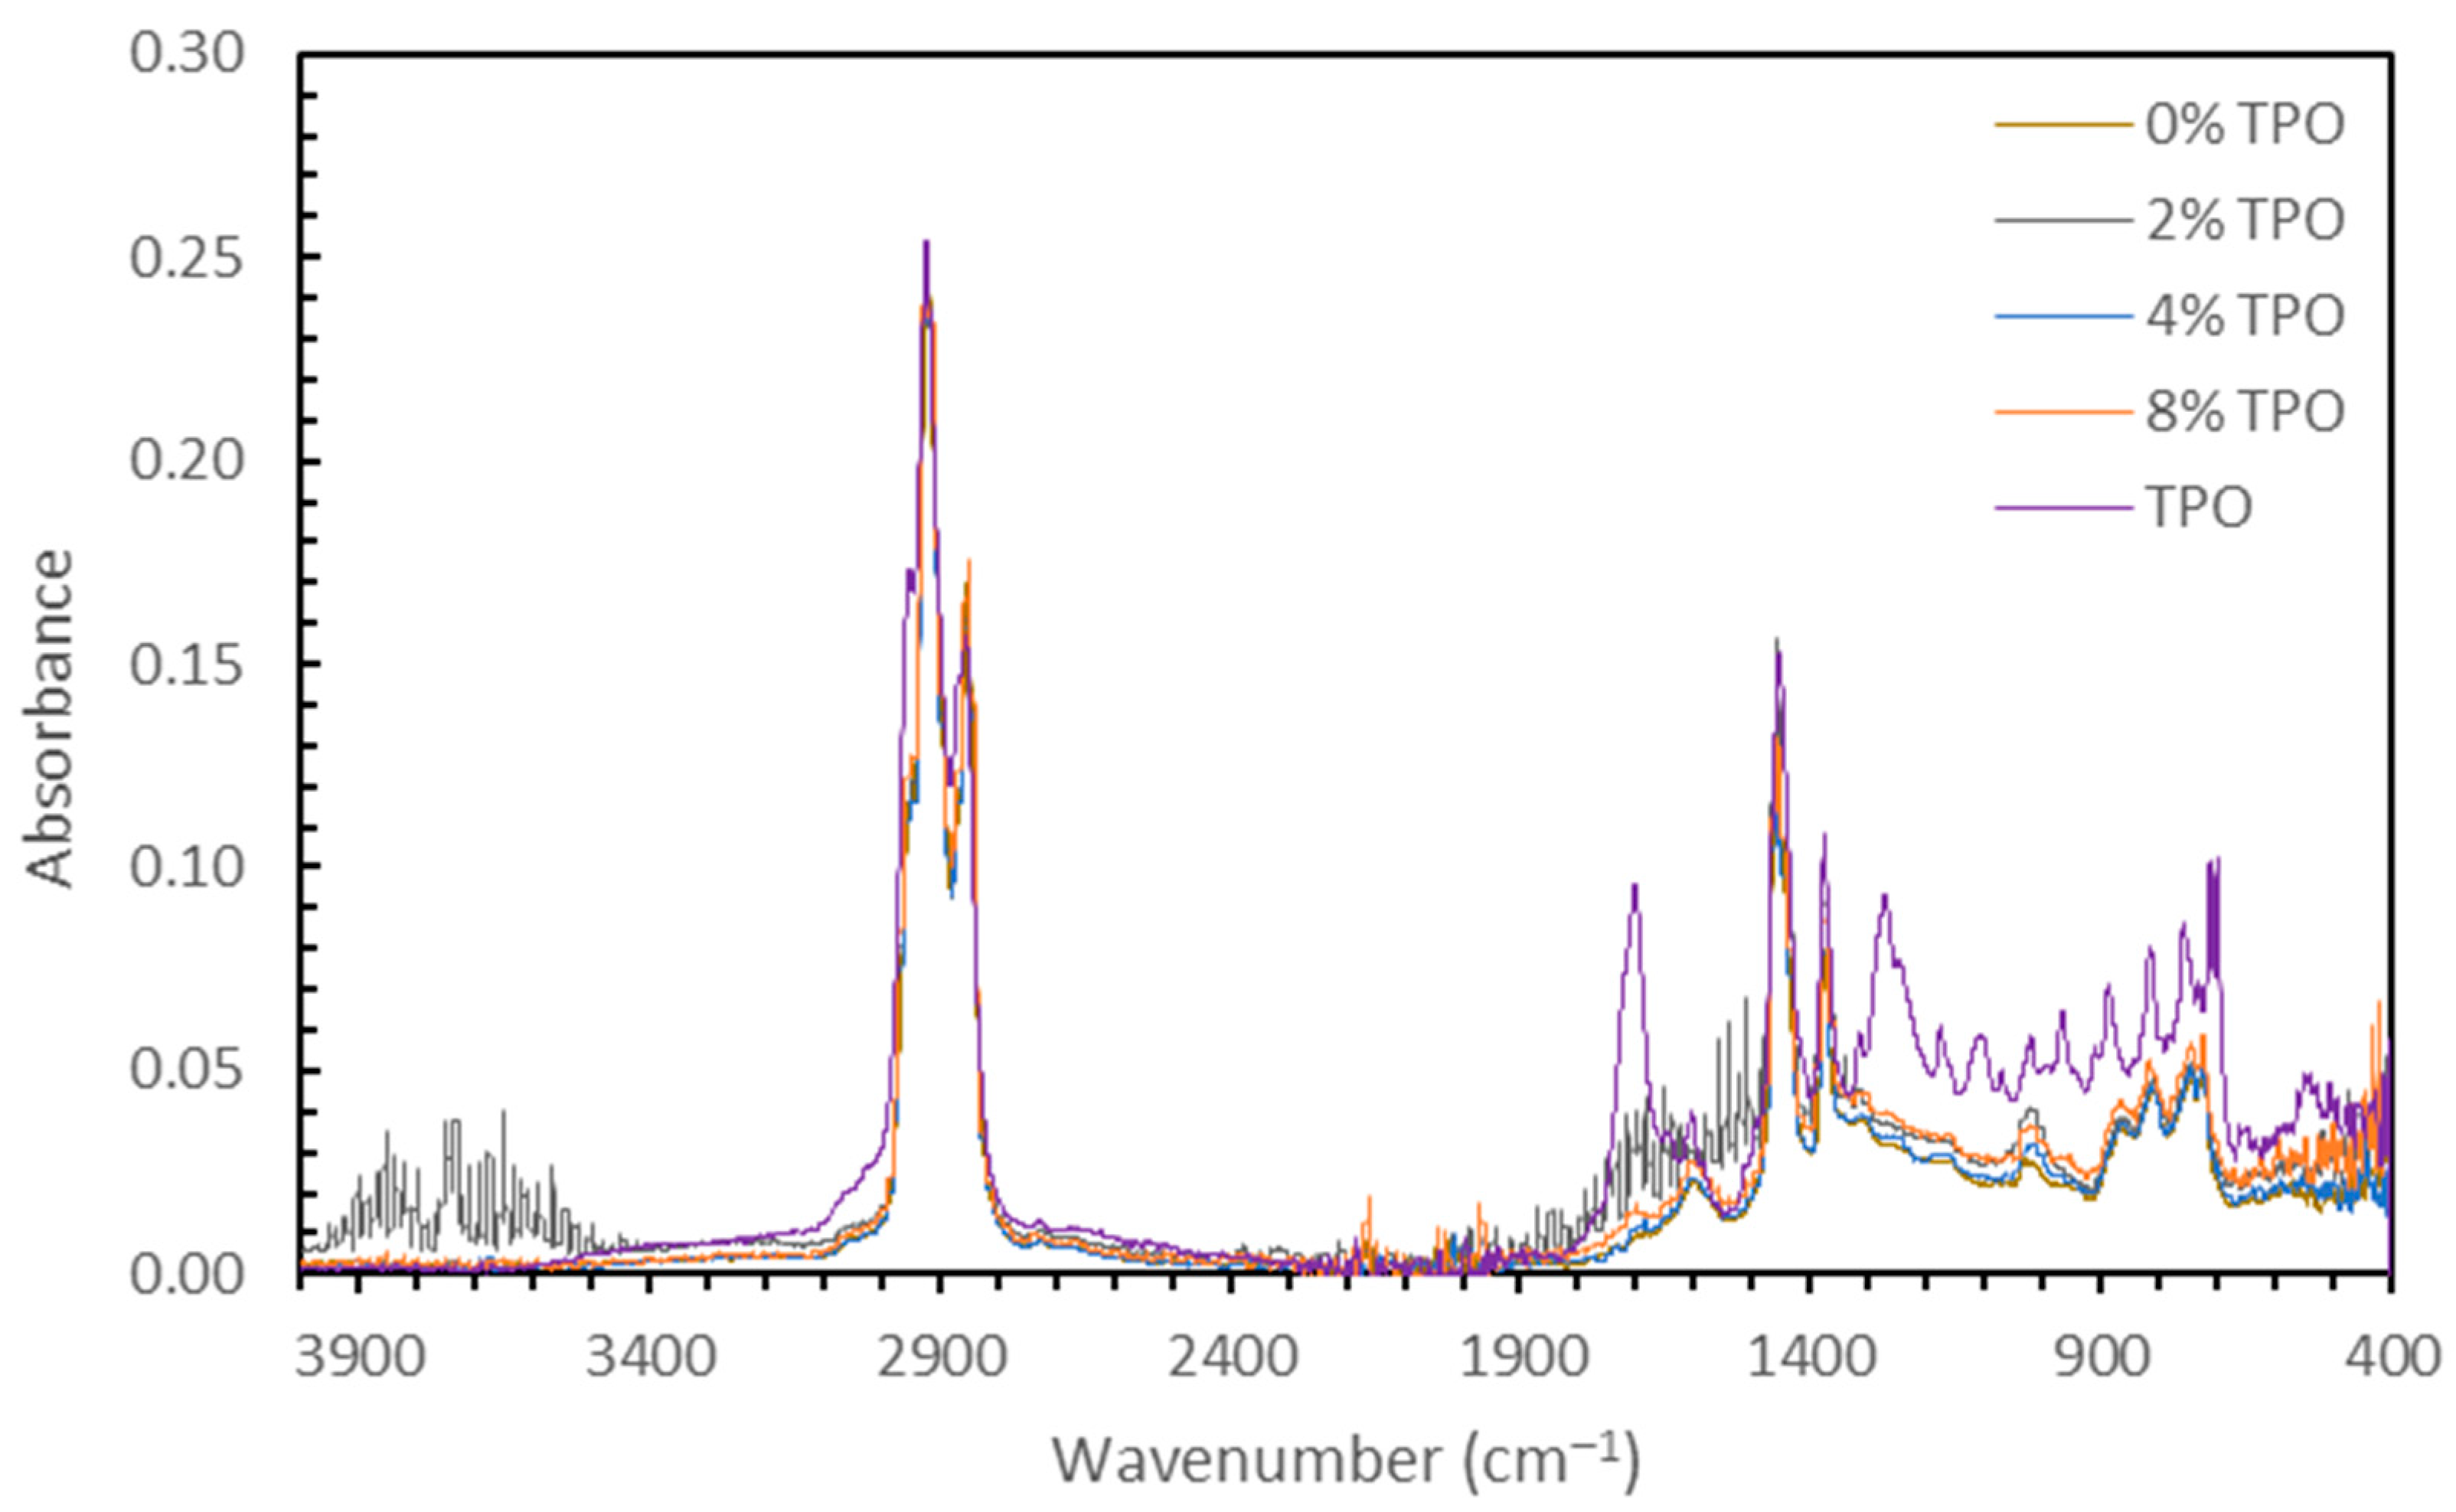
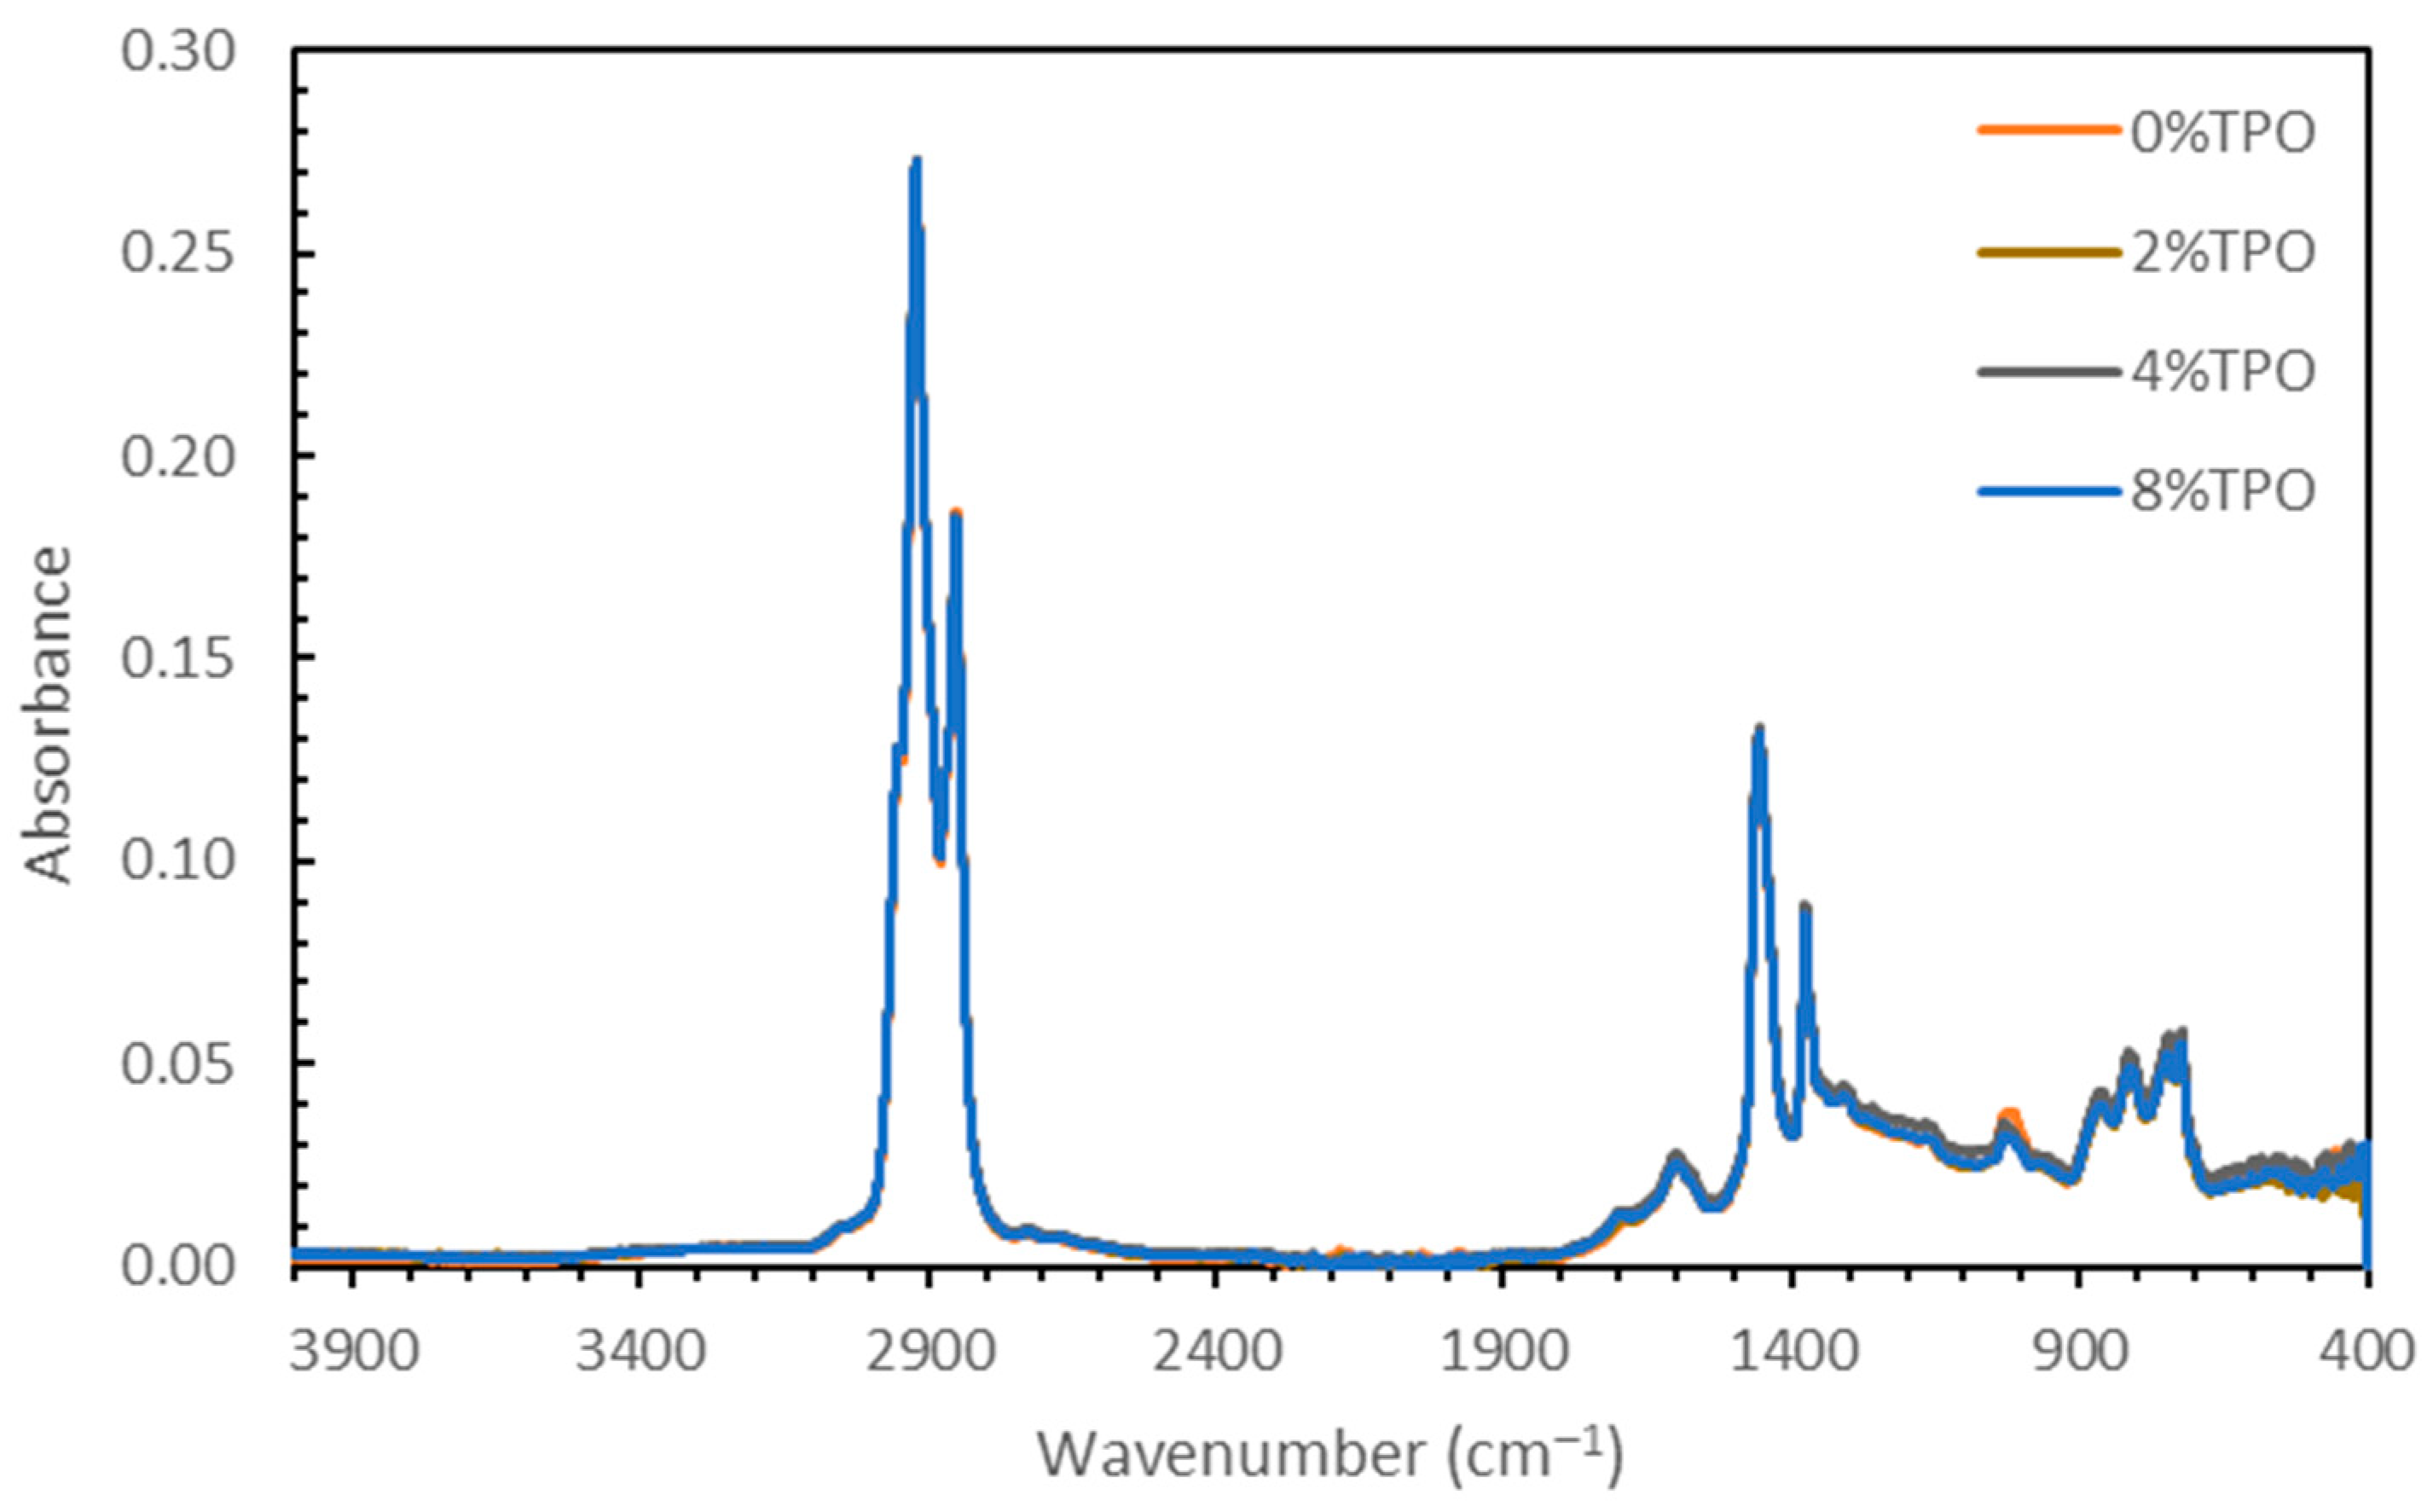
3.1.2. Chemical Testing (FTIR) on Blending Homogeneity

The data in Figure 3 show the FTIR results from the samples obtained during blending at 1, 60, and 120 min. Adding TPO to asphalt binder did not drastically change the functional chemistry of the binder. There were not many differences in the spectra apart from some alteration in the fingerprint region and the C=O peak of the 4% TPO at 120 min. The similarity of the FTIR spectra indicated that no additional IR-sensitive functional groups were formed during the blending process. Due to the relatively large alkane peaks, the binder blends were mostly made of C-H groups. There was noise present in the region of 1800–2500 cm−1 for all samples, and the 8% 120 min sample was exaggerated due to the normalization used. Considering the peaks of the noise were small, they were most likely artifacts rather than authentic peaks, thus they were disregarded. Similar to the aforementioned noise, the noise towards the end of the spectra (400 cm−1) could also be disregarded, as there was no relevant peak information contained in it [32,33].

3.2. Unaged Blends

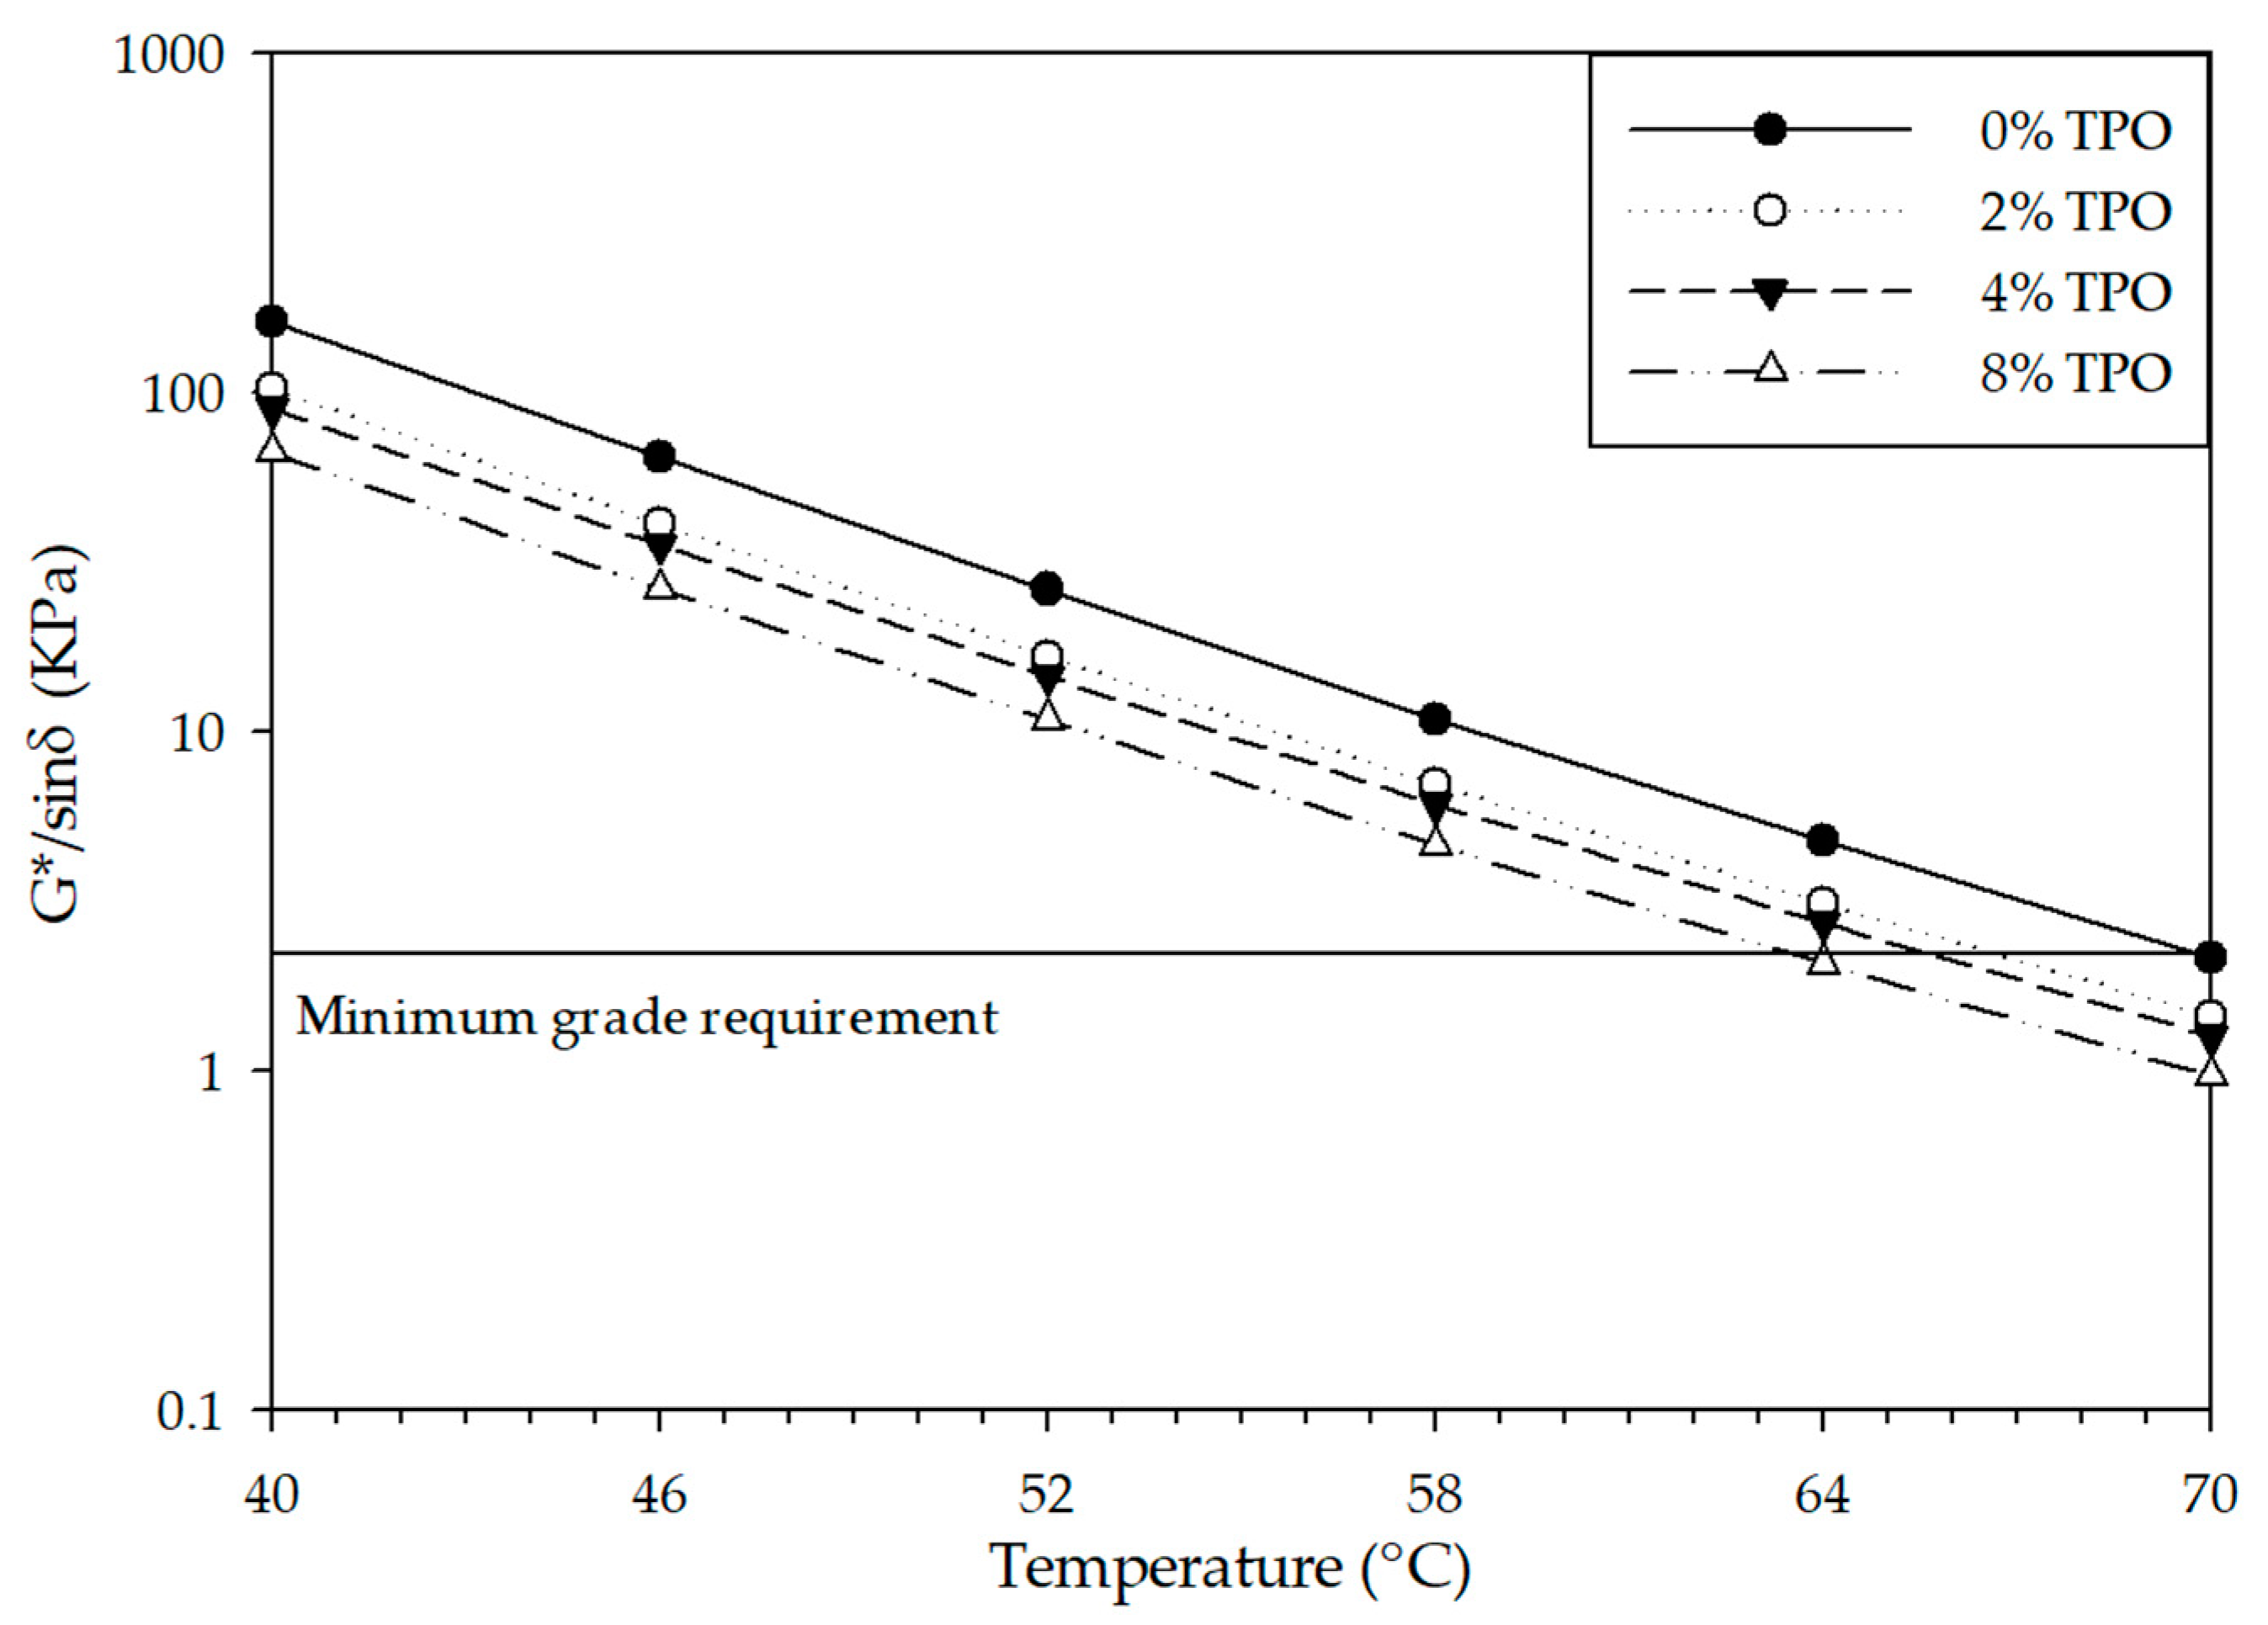
3.2.1. Standardized Physical Testing (DSR) of Unaged Blends

After 240 min of blending, the unaged grade was determined for each sample. The grades of the unaged modified binder (G*/sinδ ≥ 1.0 kPa) are shown in Figure 4. All unaged binder blends kept the quality performance grade at 64 °C. While more oil would usually result in a softer material, the 2% TPO sample increased in stiffness. This unexpected result is further explained by the chemical methods and discussed in depth in the Discussion section. The 4% TPO blend was consistent with the unmodified binder, and the 8% TPO blend decreased the stiffness parameter. This indicated that there may be a minimum amount of TPO needed to impact the binder matrix.

3.2.2. Chemical Testing (FTIR and NMR) of Unaged Blends

After the standardized unaged performance quality was determined, the 240 min blended samples were compared with chemical procedures. Since pure TPO has a low viscosity, physical DSR data could not be obtained, but chemical testing could be conducted. As shown in Figure 5, there were a lot of similarities between the TPO and the asphalt binder. They both share the 1450, 2850, and 2900 alkane peaks, as well as the peak at 1370 which is not associated with any group [32,33]. The TPO and asphalt binder differ at 1700 cm−1, an oxygen-containing compound, and the fingerprint region (1200–700 cm−1). The noise in the 2% TPO sample is attributed to water vapor with the main peak around 3700. The increase in the stiffness of the 2% sample may be attributed to this inhomogeneity.
NMR relaxometry was performed on the TPO samples, as shown in Figure 6. The NMR data as a function of recovery time are displayed on a logarithmic time scale, showing a consistent inflection point for the binder blends around 0.47 s. The primary relaxation time of the 2% TPO sample was longer than the rest of the binders, indicating a stiffer sample. Additionally, the 2% TPO sample showed another substantial peak around 0.3 s. This secondary relaxation time was found in the 2 and 8% samples and is consistent with the relaxation time of the pure TPO. The 4% TPO sample had both primary and secondary relaxation times similar to the virgin binder, which could indicate a more homogenous blending. The 8% TPO sample had a similar primary T1 time to the asphalt binder, but the secondary relaxation time was similar to the pure TPO.

3.3. Short-Term Aged Blends

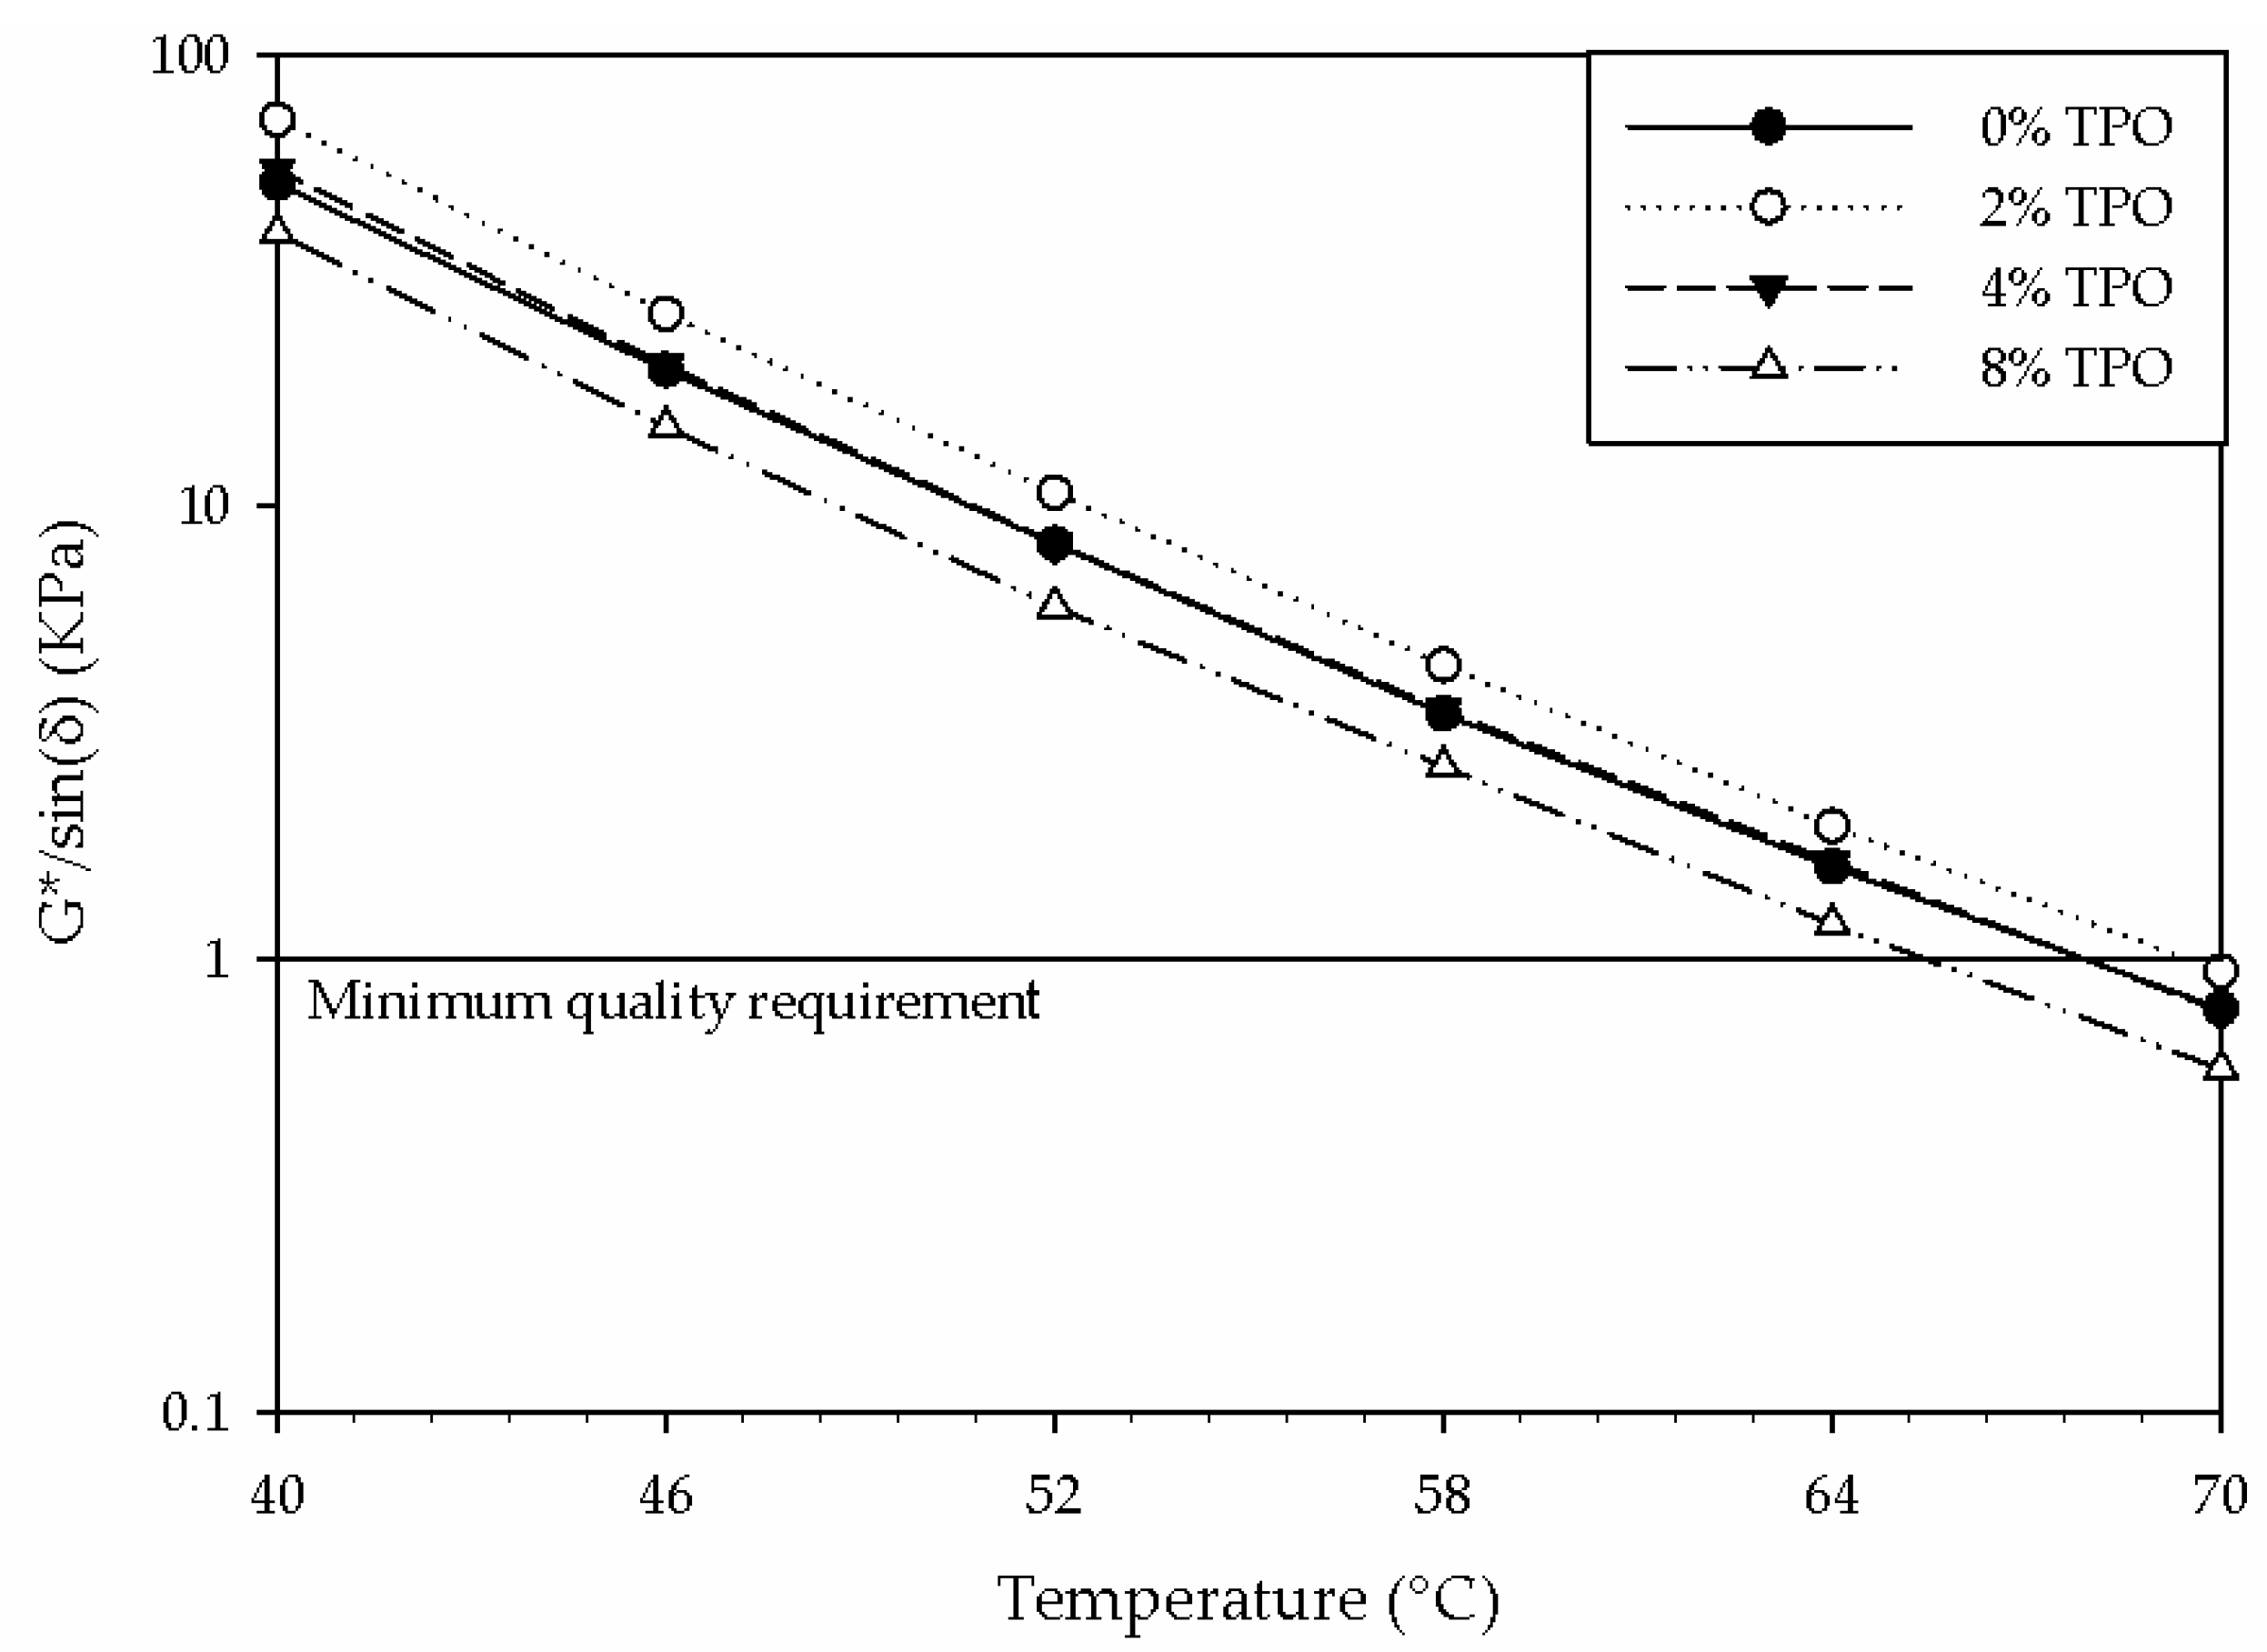
3.3.1. Standardized Physical Testing (DSR) of Short-Term Aged Blends

After unaged properties were evaluated, the sample was short-term aged, and the mass loss and high PG were determined (G*/sinδ ≥ 2.2 kPa) as shown in Figure 7 and Figure 8, respectively. The mass loss increased as the TPO percentage increased and fit within specifications of less than 1%. The mass loss indicated that some components were lost from the TPO at mixing and compaction temperatures. For the rolling thin-film oven test, the 2% and 4% tire pyrolysis oil blends kept a high PG at 64 °C, but the 8% TPO blend reduced the PG to 58 °C. Since the oil makes the binder softer, it is expected that the PG would be lowered, but this effect is undesirable for binder quality and resistance to high-temperature failures like rutting.

3.3.2. Chemical Testing (FTIR and NMR) of Short-Term Aged Blends

After the standardized physical performance was determined, an FTIR analysis was conducted on short-term aged blends, as shown in Figure 9. All FTIR spectra had similar peaks and intensities. This indicated that the TPO did not make new IR-sensitive functional groups when short-term aged.
The NMR relaxation curves were calculated and are displayed in Figure 10. While the unaged samples had similar relaxation curves, the short-term aged samples displayed some differences. The 2% and 4% samples had similar relaxation curves and viscoelastic properties as seen in physical testing. The inflection point of the 8% TPO sample occurs before the other samples, indicating a softer blend. This is also reflected in physical testing.

3.4. Long-Term Aged Blends

3.4.1. Standardized Physical Testing (DSR) of Long-Term Aged Blends

After the initial and short-term aged physical properties were gathered, the samples were long-term aged via the pressure aging vessel (PAV), and the intermediate PG was determined (G*·sin(δ) ≤ 5000 kPa), as shown in Figure 11. Like the previous grades, the 2% and 4% TPO blends did not change the intermediate PG. The 8% TPO blend also did not change or enhance the intermediate PG. It is preferred that the intermediate PG temperature be as low as possible to resist fatigue cracking, and it is expected that oil-based additives should reduce the intermediate PG temperature. However, all blends had an intermediate PG of 22 °C.

3.4.2. Chemical Testing (FTIR and NMR) of Long-Term Aged Blends

After the standardized performance was determined, FTIR testing was used to see how the IR-sensitive functional groups changed after long-term aging in Figure 12. Similar to the short-term aged samples, long-term aging did not create new functional groups when TPO was present.
The NMR relaxation curves of long-term aged blends were calculated and are displayed in Figure 13. The similarities in blends were seen by both physical and chemical testing. After long-term aging, the TPO percentage had less of an impact on the physical and chemical properties of the blends since all blends exhibited similar properties.

4. Discussion

The testing conducted in this study examined the performance and quality of unaged, short-term aged, and long-term aged TPO-modified asphalt binder blends. The blending times showed a high variability in most of the blends. This variability resulted from different amounts of TPO present in each sample. Higher DSR testing temperatures created a more homogenous blend matrix. The 8% TPO sample had the most homogenous matrix as seen in both the standardized DSR testing and nonstandard FTIR testing. The 2% and 4% TPO samples had more variability in their matrix. The 2% TPO sample had its highest stiffness at the end of the 240 min blending. This could indicate that more than 2% TPO is needed to interact with the binder’s matrix. In contrast, the 4% TPO sample at 1 min of blending time had a much lower stiffness than the rest of the samples. This could be correlated to the higher amount of C=O functional groups found in the sample, an indication of more TPO present in the sample. All samples showed physical homogeneity when DSR testing temperatures above 58 °C were used. After evaluating the blending variability, high and intermediate PG temperatures were determined and a correlation with FTIR and NMR testing was established. This correlation was seen across unaged, short-term aged, and long-term aged blends.

4.1. DSR Testing Comparison

After blending 2, 4, and 8% TPO, standardized physical properties were determined by DSR testing for unaged, short-term aged, and long-term aged blends. DSR testing was performed to determine the high and intermediate PG temperatures. The high PG indicates the blend’s resistance to rutting, a common asphalt failure during the beginning of service life at elevated temperatures. The high PG depends on the highest temperature where the parameter G*/sinδ is greater than or equal to 1.0 kPa (unaged) or 2.2 kPa (short-term aged). Both unaged and short-term aged samples were considered for the high PG. The intermediate PG indicates a blend’s resistance to fatigue during the end of service life at intermediate temperatures. The intermediate PG is determined after short-term (RTFOT) and long-term aging by the PAV and depends on the lowest temperature when the parameter G*·sin(δ) is less than 5000 kPa. The grades are summarized in Table 2. Adding tire pyrolysis oil at 8% made the binder softer and decreased the high PG, meaning the blend had a higher susceptibility to rutting failure. Additionally, adding more oil did not change the intermediate temperature, suggesting the binder did not retain the softening effect of the oil to have better fatigue resistance. Therefore, according to the DSR standard testing, adding TPO at or above 8% would result in a blend that is more susceptible to rutting and has no enhancement in fatigue resistance.

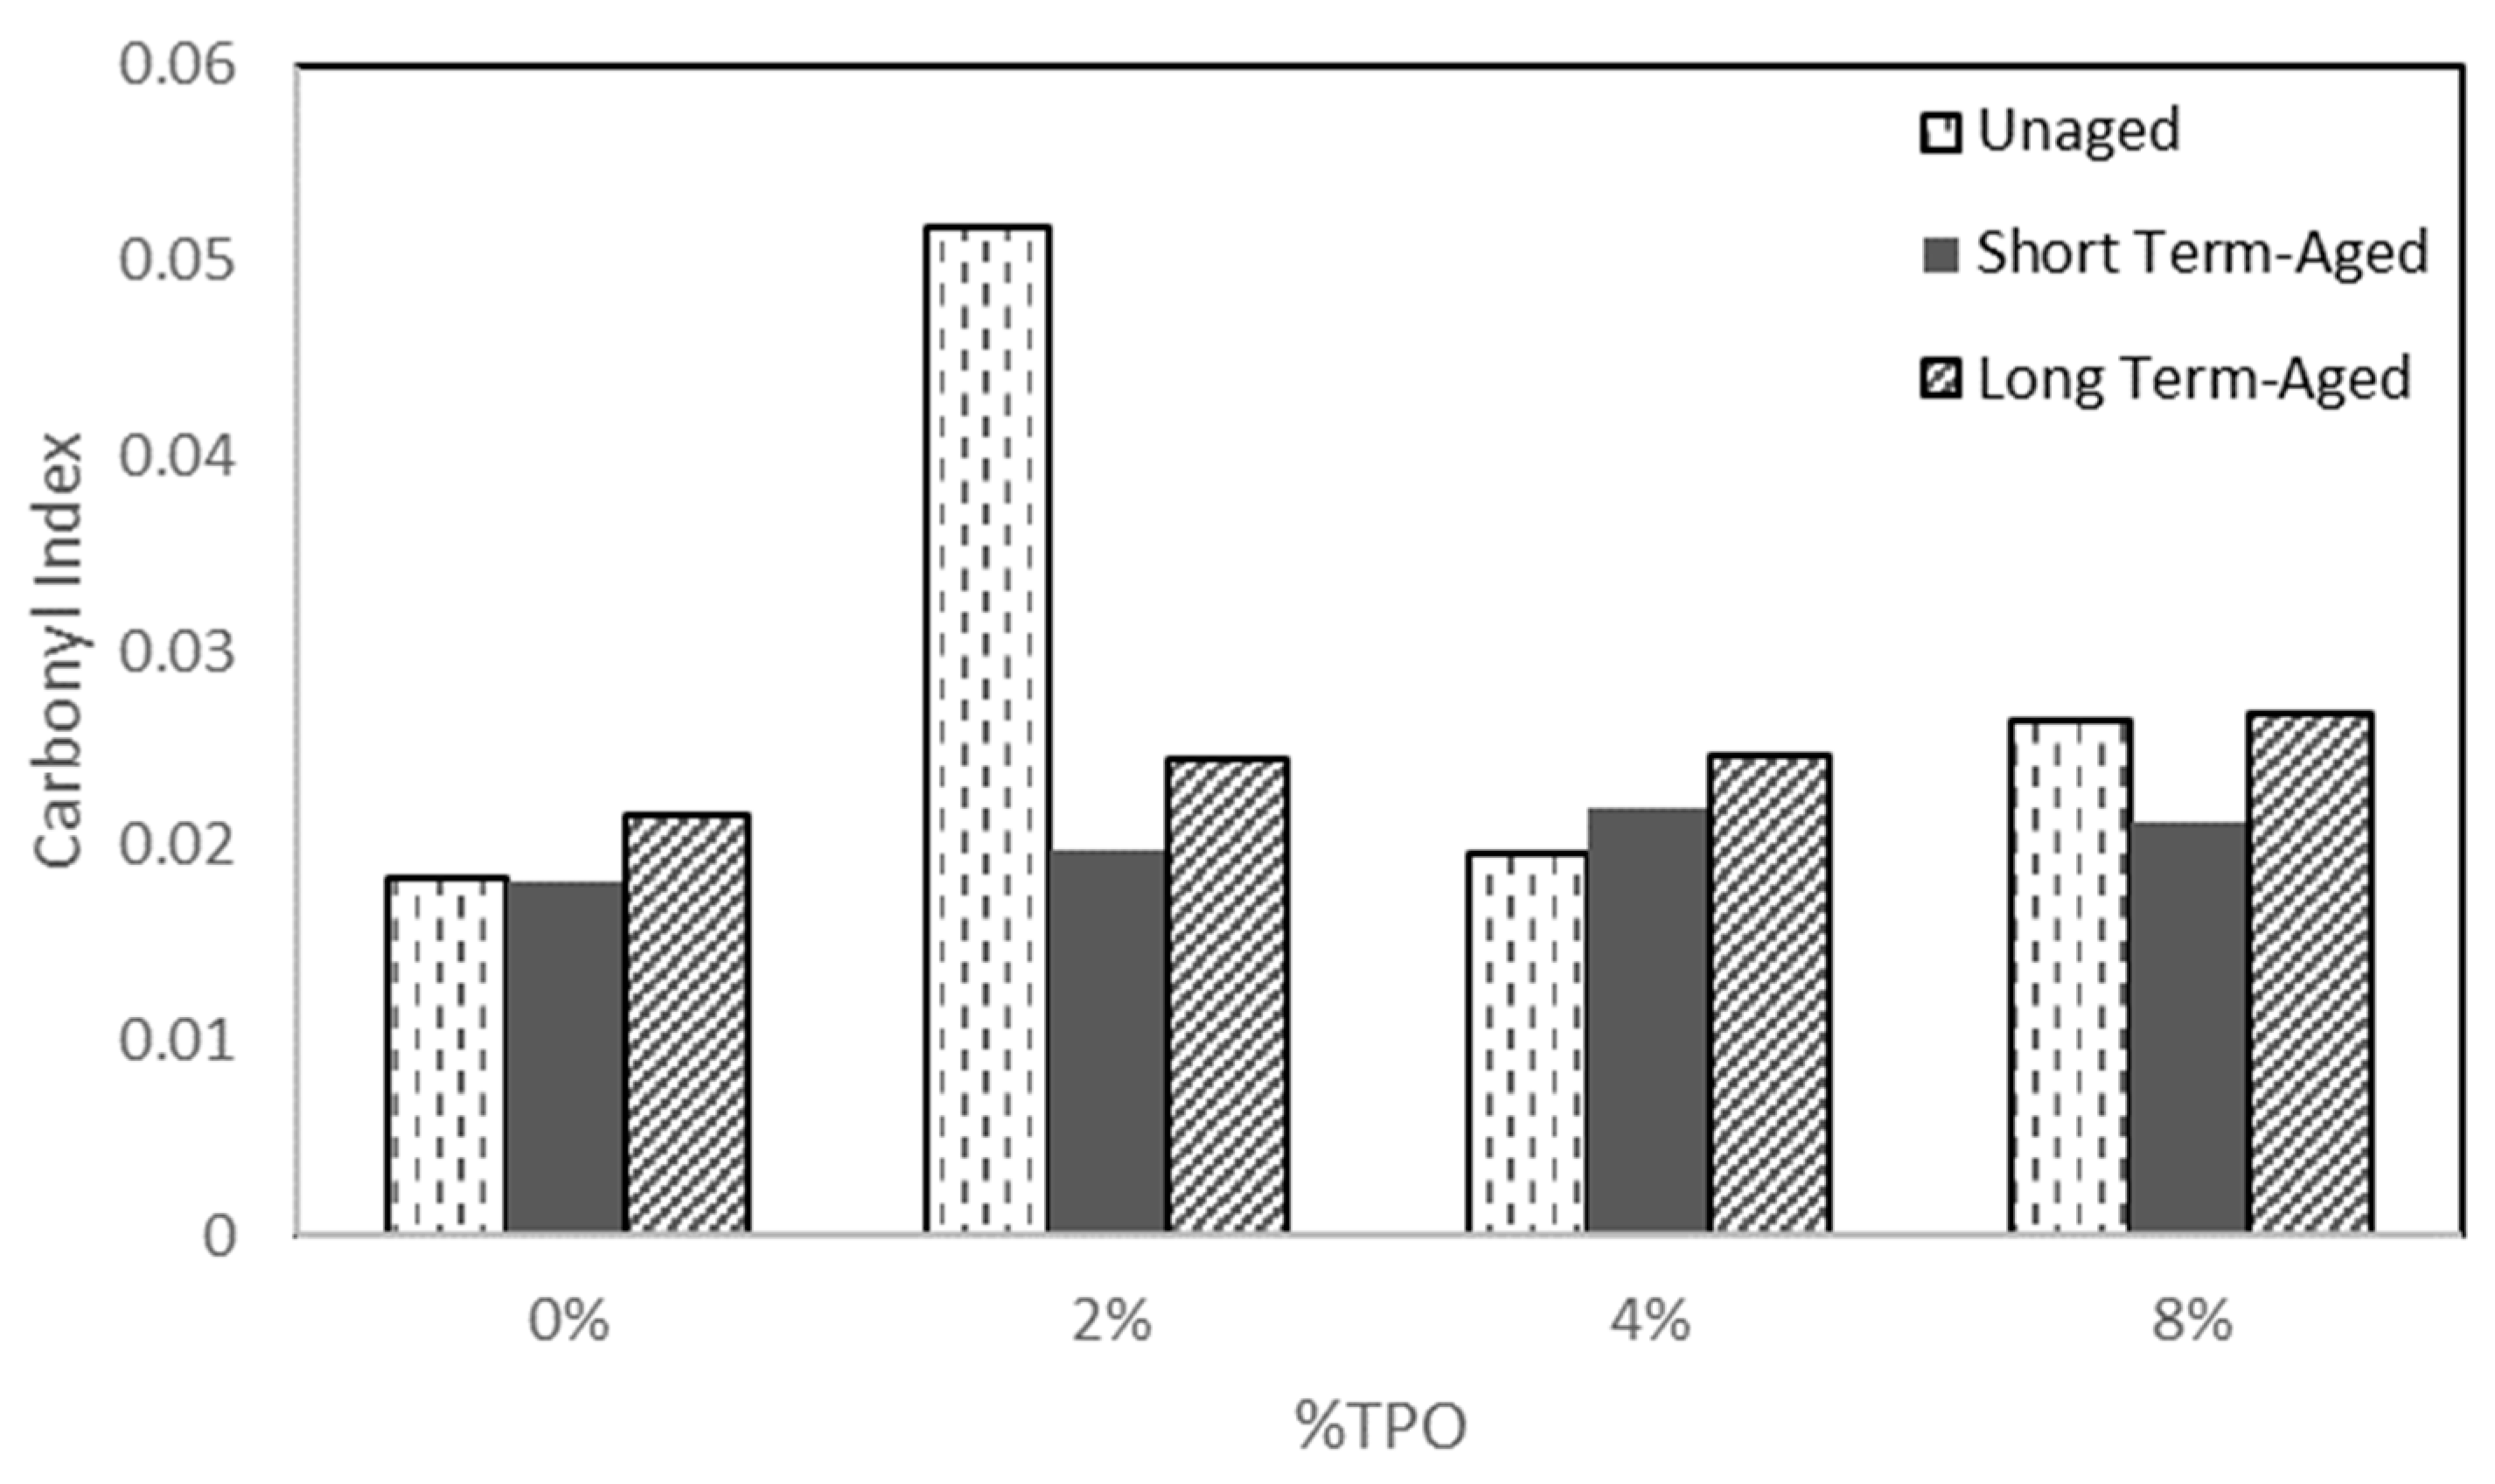
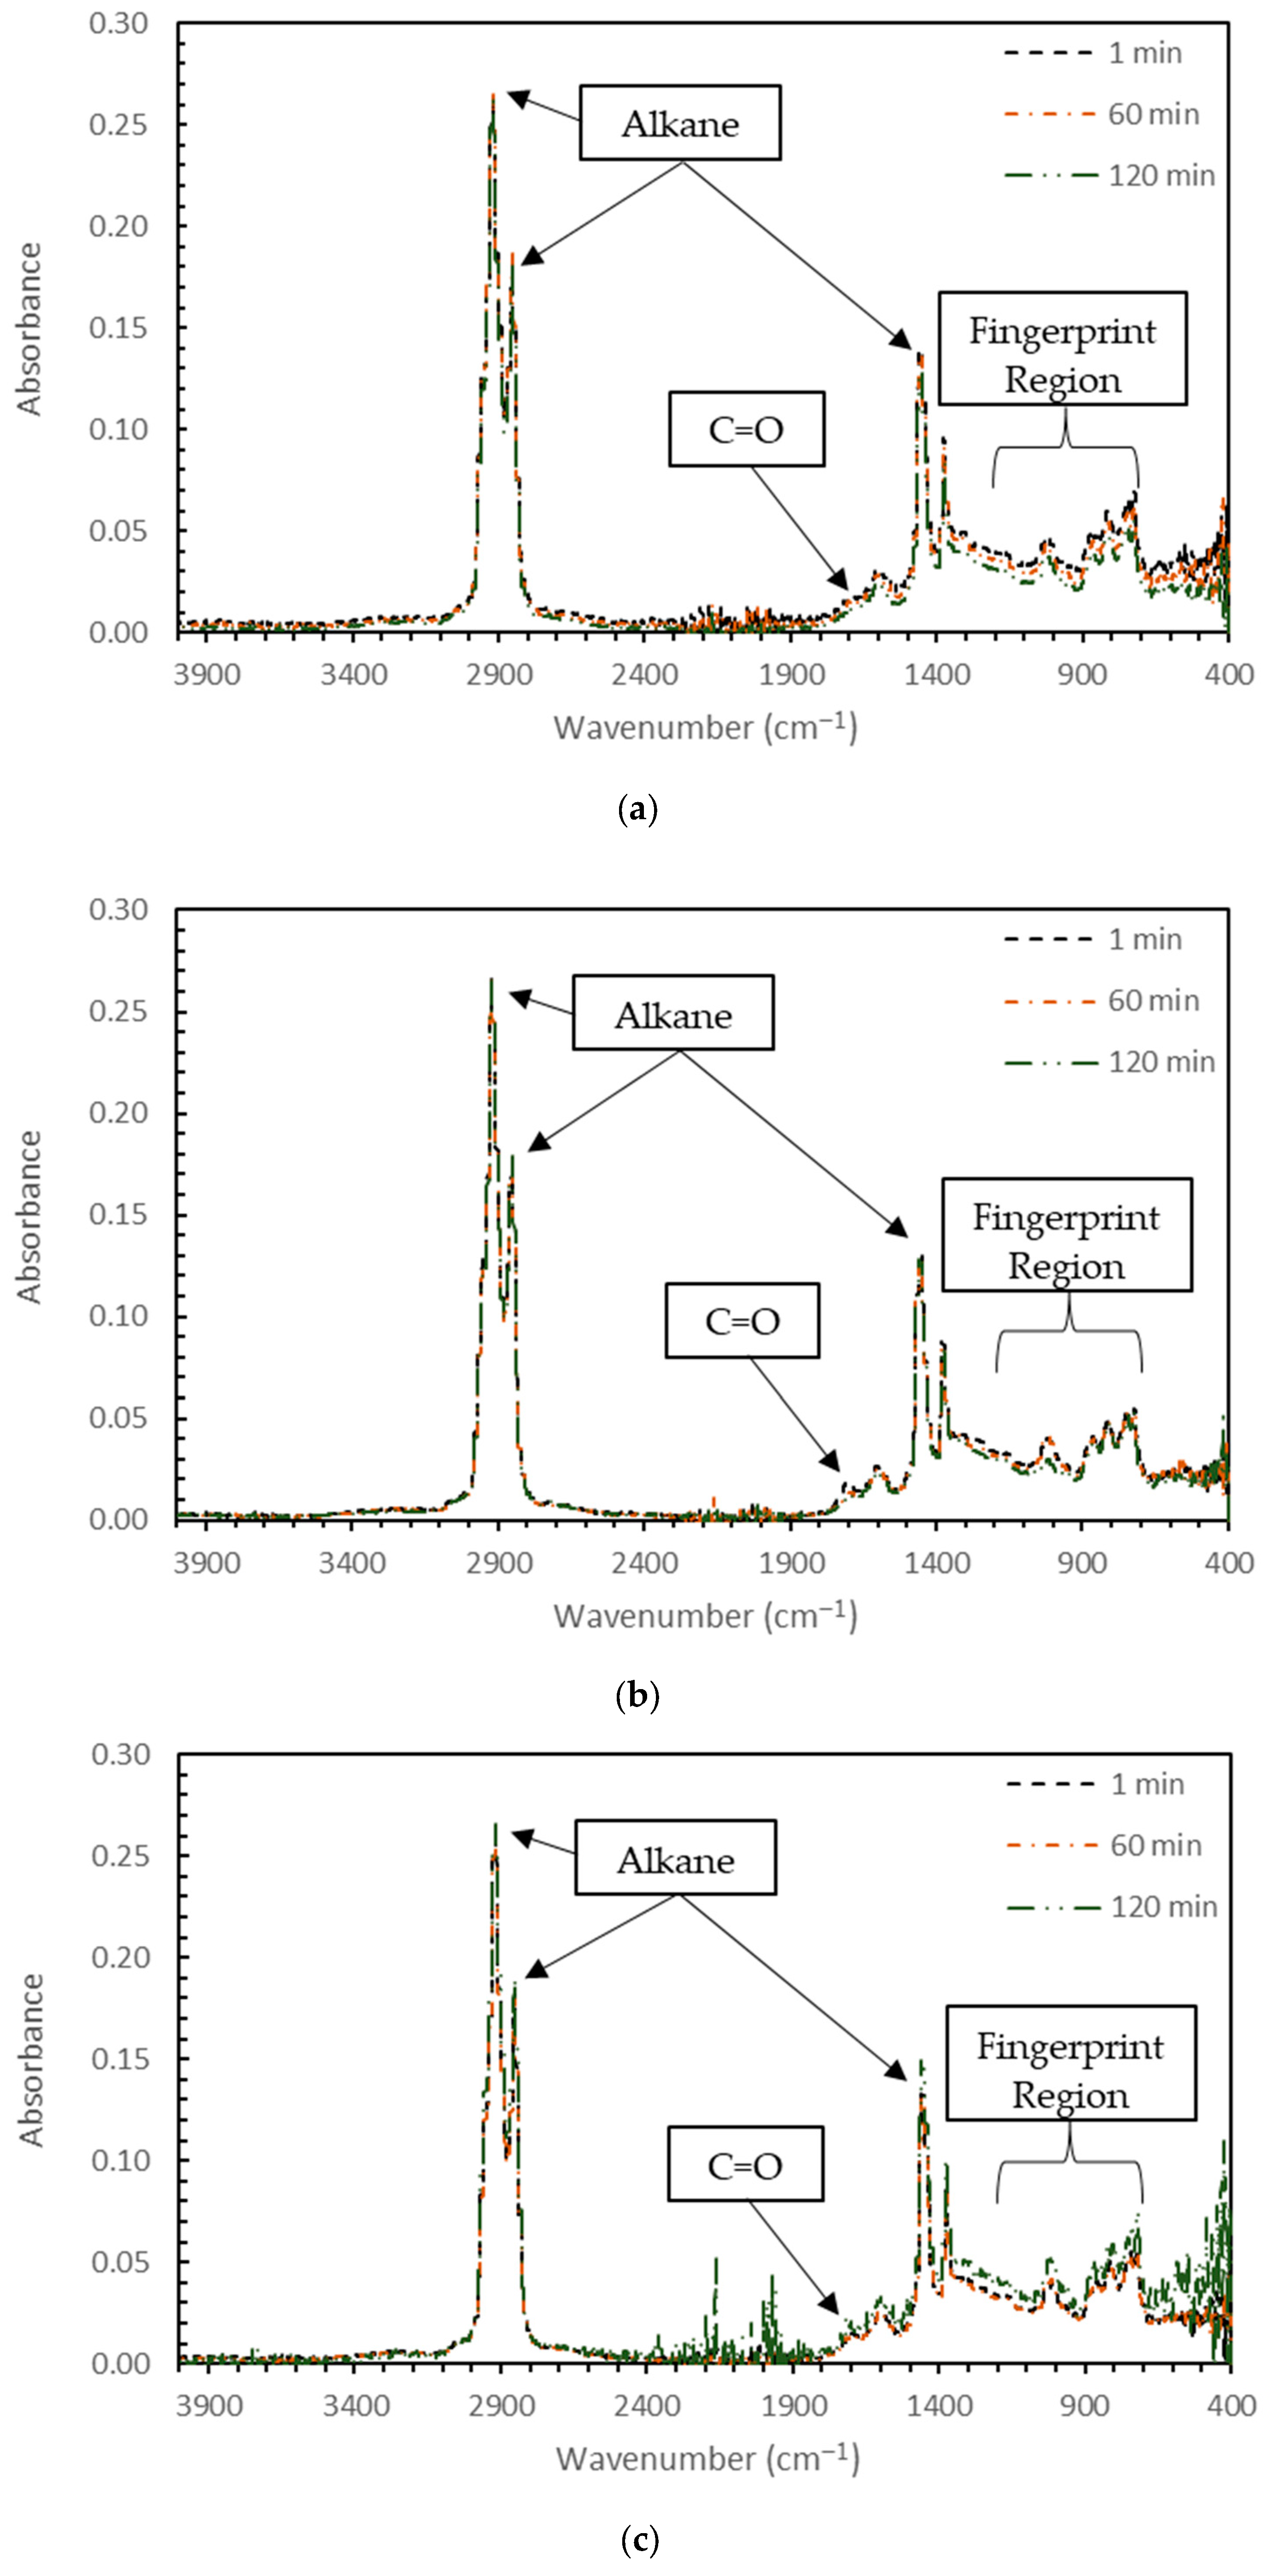
4.2. FTIR Testing Comparison

After standardized DSR testing was performed, the FTIR results were gathered and compared. The FTIR spectra were evaluated based on the absorbance in different regions, as shown in Figure 2. The hardest to analyze was the fingerprint region because of the numerous overlapping peaks that were difficult to resolve. In this study, the fingerprint region did not change significantly with an increase in TPO percentage, resulting in little to no changes in the functional groups present. This could be due to a few reasons: (1) The TPO already contains similar functional groups to the asphalt binder. While there are some differences, there may not be sufficient TPO present to significantly alter the chemical compounds in the binder, (2) research has shown that TPO is sensitive to heat and that components can decompose even under mild conditions [10]. The reduced chemical changes as detected by FTIR analysis could be due to the TPO converting or decomposing during blending and aging, and (3) the TPO is only interacting with one of the colloidal phases, and the effects are too small to significantly be detected.
Other research has shown that TPO could contain alkene groups at 3000–3100 cm−1 or 1575–1675 cm−1 in moderate fractions [6]. However, there does not seem to be any evidence of a noticeable fraction of alkene groups in the TPO used in this experiment. This could be a result of the loss of double bonds through chemical reactions or specific production conditions. There are no production quality standards for TPO, resulting in highly variable TPO products. Because of the complexity of the asphalt binder and TPO’s structures, unknown interactions or reaction mechanisms could be taking place which could be addressed in future research projects.
While the fingerprint region is chemically dense, other peaks are more distinguishable. Water vapor was detected in the 2% blend which could be the reason for the enhanced stiffness detected by DSR testing. The alkane peaks are the strongest peaks of each sample and were similar for every blend. TPO itself shows a strong peak around 1700 cm−1. Therefore, it may be obvious that the TPO-modified blends show a slightly larger peak around that region compared to the original asphalt binder. This impact on the C=O peak complicates the comparison of the widely used carbonyl index.
Because aging does not seem to affect the functional groups of the binder blends as seen in Figure 5, Figure 9 and Figure 12, a further analysis into the relative ratio of the carbonyl groups was a more useful way to analyze the impacts of TPO on short- and long-term aging. The carbonyl information in Figure 14 indicated that other than the 2% sample, long-term aging had the largest ratio of carbonyl groups compared with the other aging methods. This was expected for long-term aged samples since PAV aging occurs under increased air pressure which increases the exposure to oxygen and the formation of carbonyl groups. The unaged and short-term aged blends had varying results. The 0% TPO blend had about equal carbonyl indices for the unaged and short-term aged samples. However, as the percentage of TPO increased in the unaged samples, the carbonyl index also increased due to the amount already present in the TPO. The 2% blend had a much higher unaged carbonyl index, most likely due to water contamination from the TPO. The short-term aged carbonyl indices were more similar across the TPO blends. The 8% TPO blend had the lowest short-term aged carbonyl index compared to its unaged value. This supports the reduction in the high PG since more of the TPO was present. While FTIR by itself is not enough to determine the efficacy of the TPO as an additive, it can be used as a tool. Most of the chemistry was unchanged, which correlates to the mainly unchanged performance grades. In addition, unexpected changes like the increase in the stiffness of the 2% TPO sample and the decrease in high PG from the 8% TPO blend could be explained by FTIR analysis.

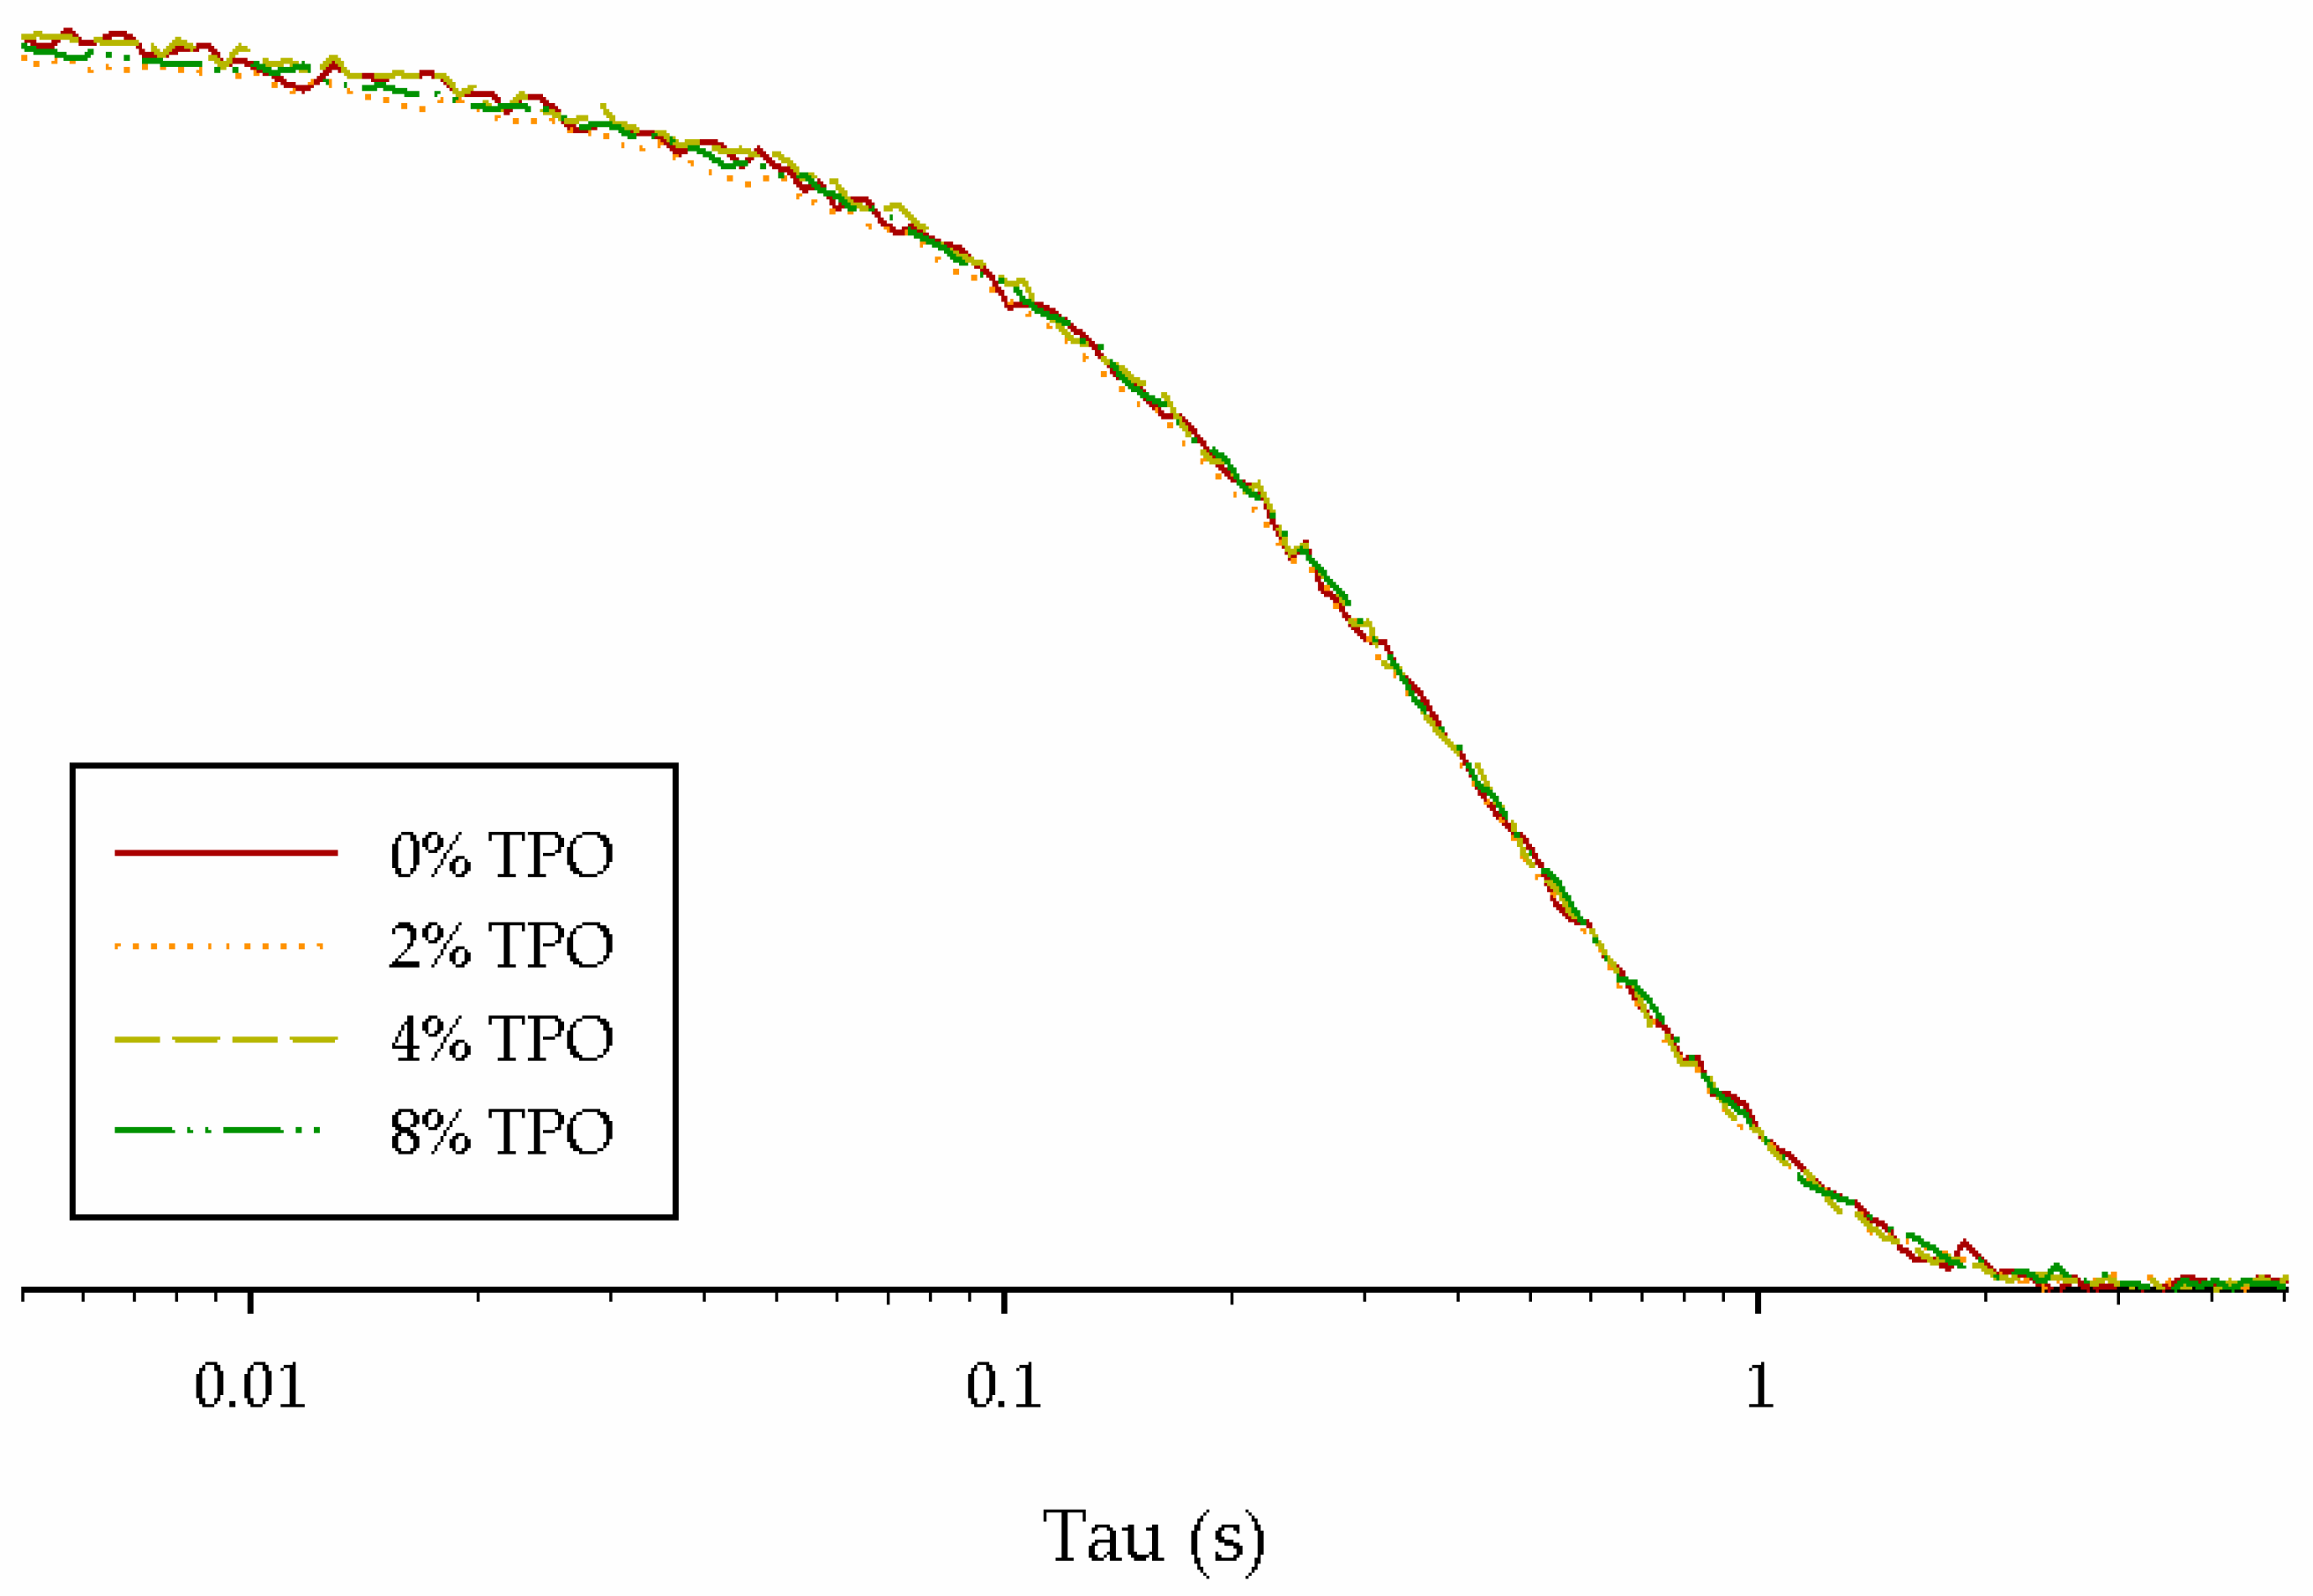
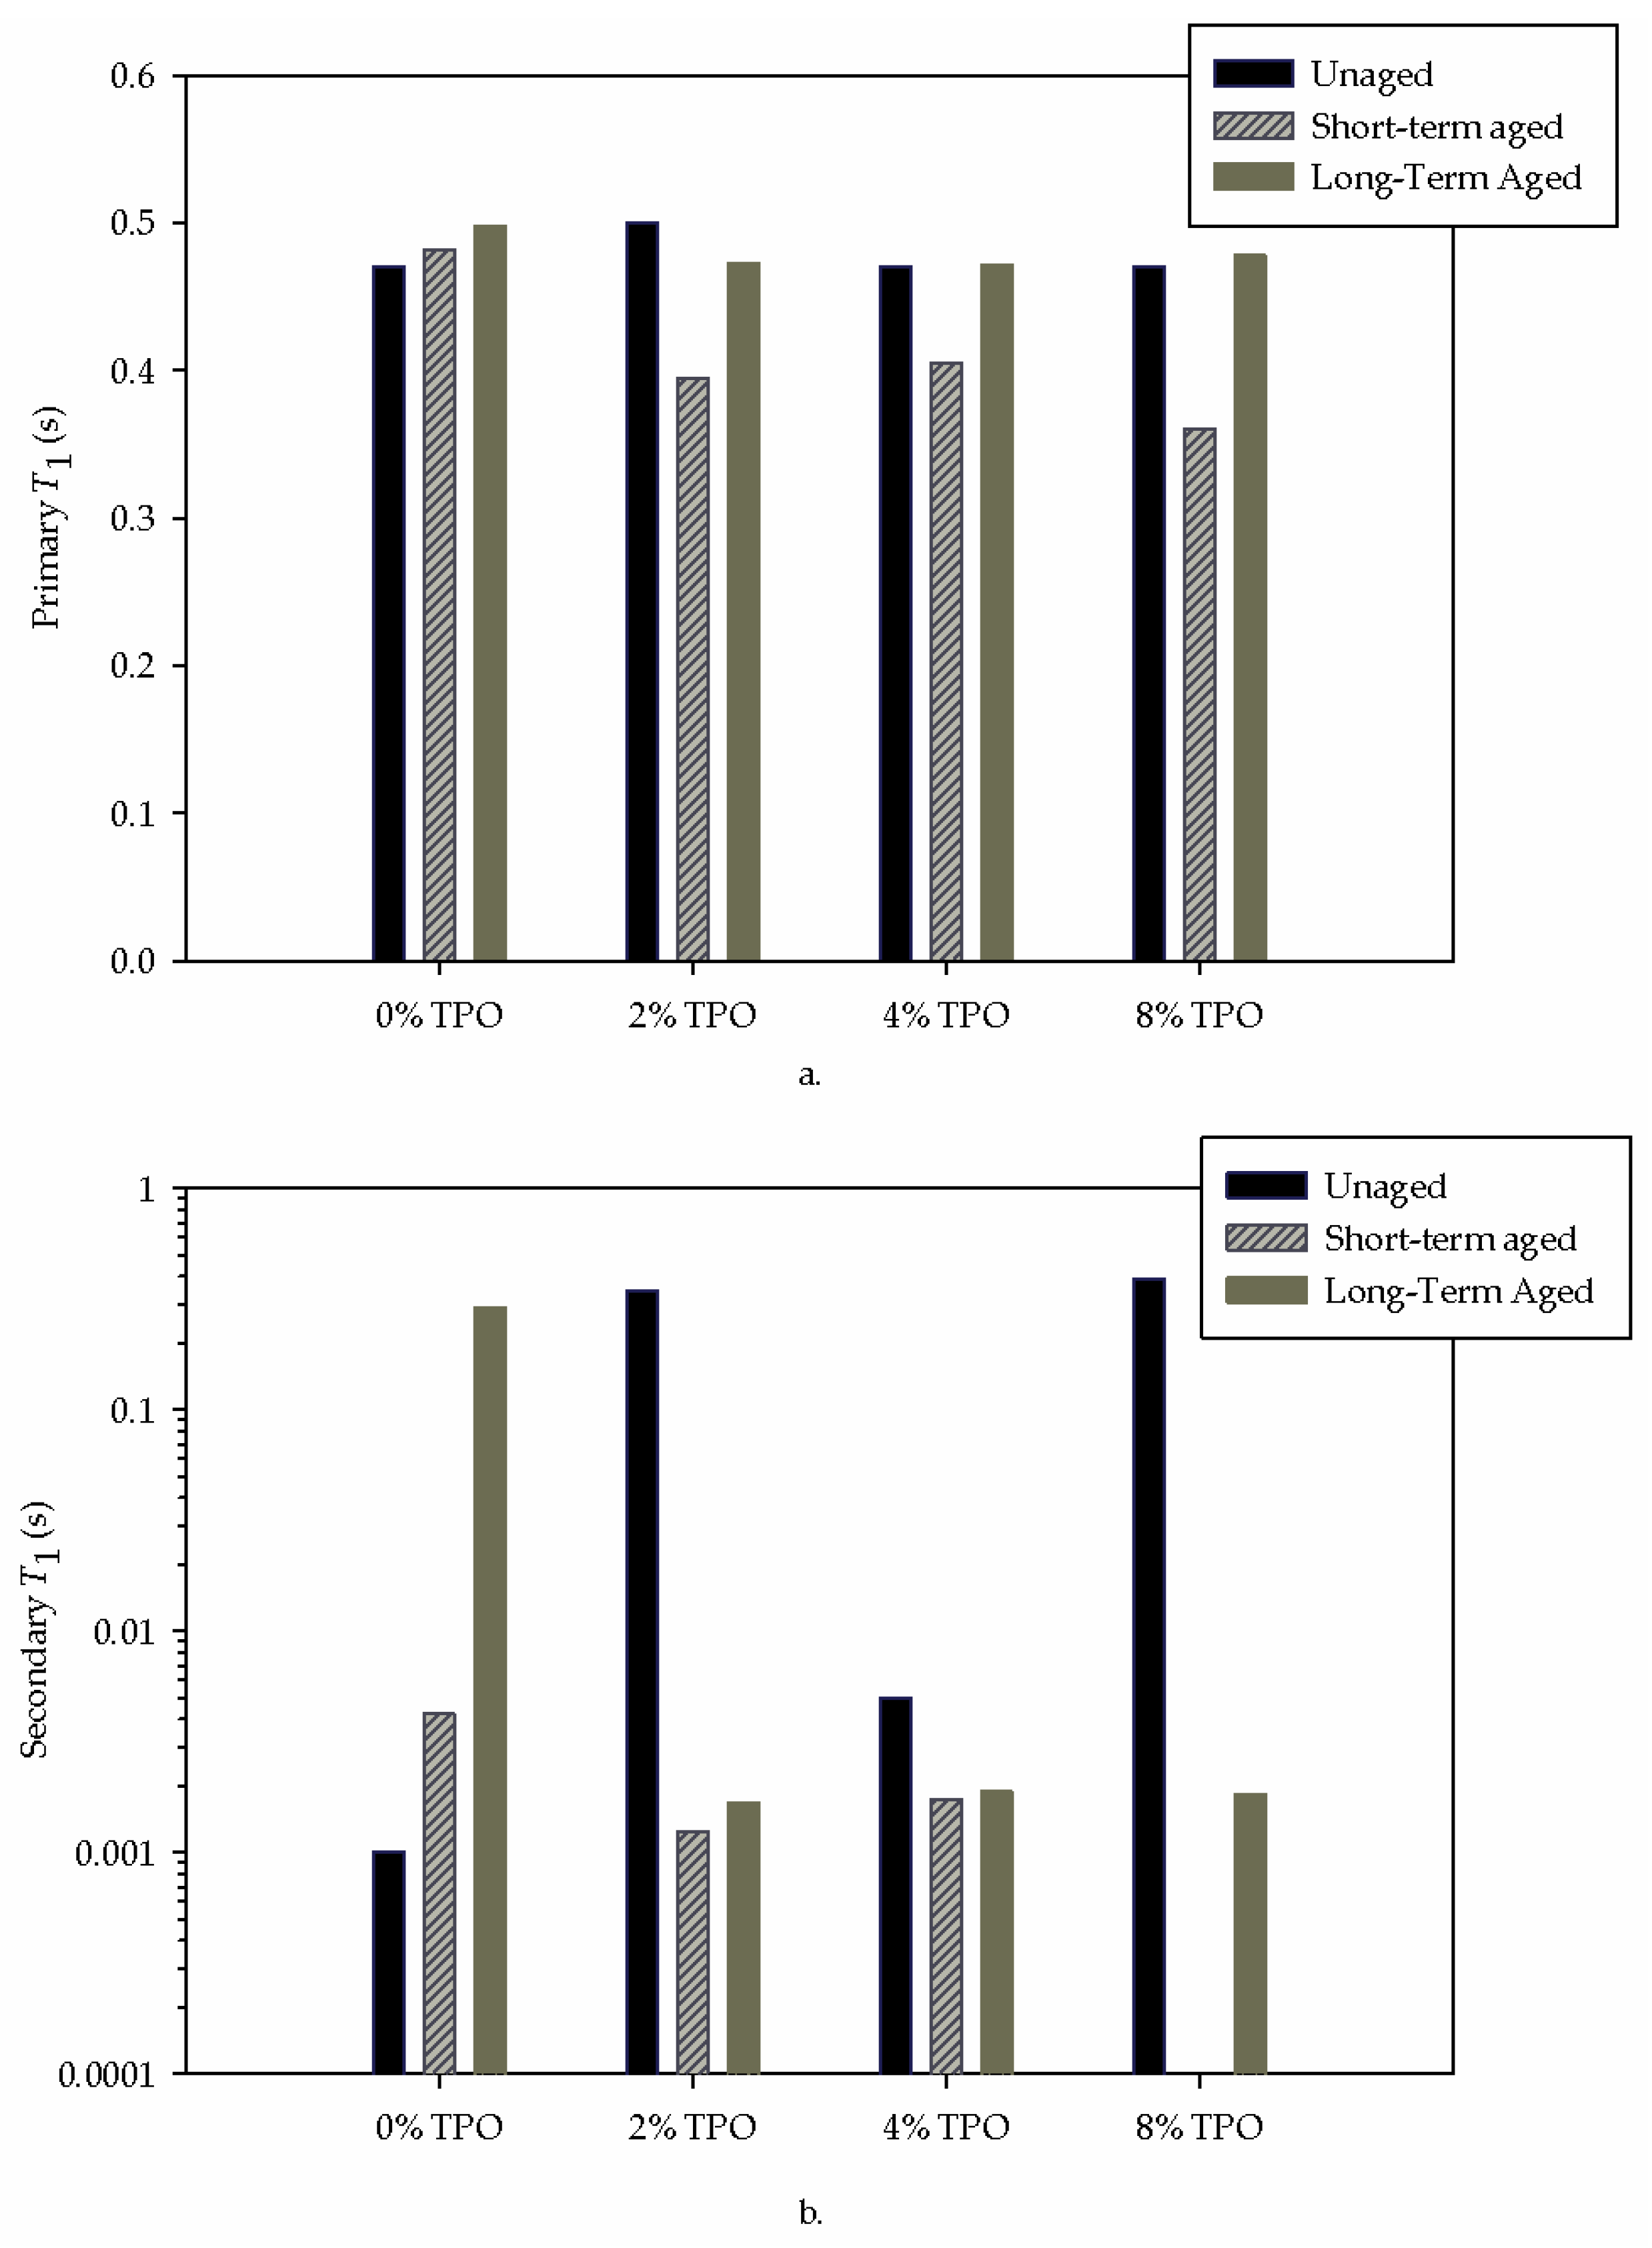
4.3. NMR Testing Comparison

Since aging has an impact on the chemical microstructure environment in the blends, the T1 relaxation times of unaged, short-term aged, and long-term aged blends were used to determine asphalt aging effects as seen in Figure 15. Pure TPO has a primary relaxation time around 0.27 s and a secondary relaxation time around 0.57 s. The impact of TPO on binder blends was most visible from changes in the secondary relaxation times of the unaged 2% and 8% TPO blends. The unaged 2% TPO sample had an increase in physical stiffness and resulted in a water vapor peak in the FTIR spectra. The unaged and short-term aged 8% TPO samples were less stiff due to the TPO present in the blend. This impact of the TPO in the 2% and 8% binder blends was seen as a secondary relaxation time around 0.27 s which is close to the characteristic relaxation time of pure TPO. While the secondary relaxation times are similar, the effect is different. This difference can be explained by the primary relaxation time.
The primary relaxation time of the 2% sample was closer to the 0.57 s characteristic peak of the TPO. This less mobile chemical environment indicated that the 2% blend would be stiffer, while the 8% sample did not share this increase in primary relaxation time. The 4% sample had similar physical and chemical properties to the original PG 64–22 binder (0% TPO).
Aging also influences relaxation times due to the changing chemical microstructure environment. The primary relaxation time of the original binder sample increased as it aged which was consistent with the increase in physical stiffness. NMR relaxometry relies on the mobility of the asphalt matrix. It takes more time for the relaxation of hydrogen nuclear spins when the binder is stiffer and less mobile. Therefore, a longer relaxation time results in a “stiffer” blend. The original short-term aged sample had the longest primary relaxation time while the 8% TPO blend had the shortest. Furthermore, the long-term aged samples had similar primary relaxation times which were echoed by their similar physical stiffness and carbonyl indices.

5. Conclusions

The road to sustainable infrastructure must include effective asphalt binder additives. Currently, only physical properties are considered for performance standards, but asphalt modification and aging can affect physical and chemical properties. Through this study, physical and chemical testing were performed on unaged, short-term aged, and long-term aged TPO-modified asphalt binders.
The main conclusions are as follows:
-
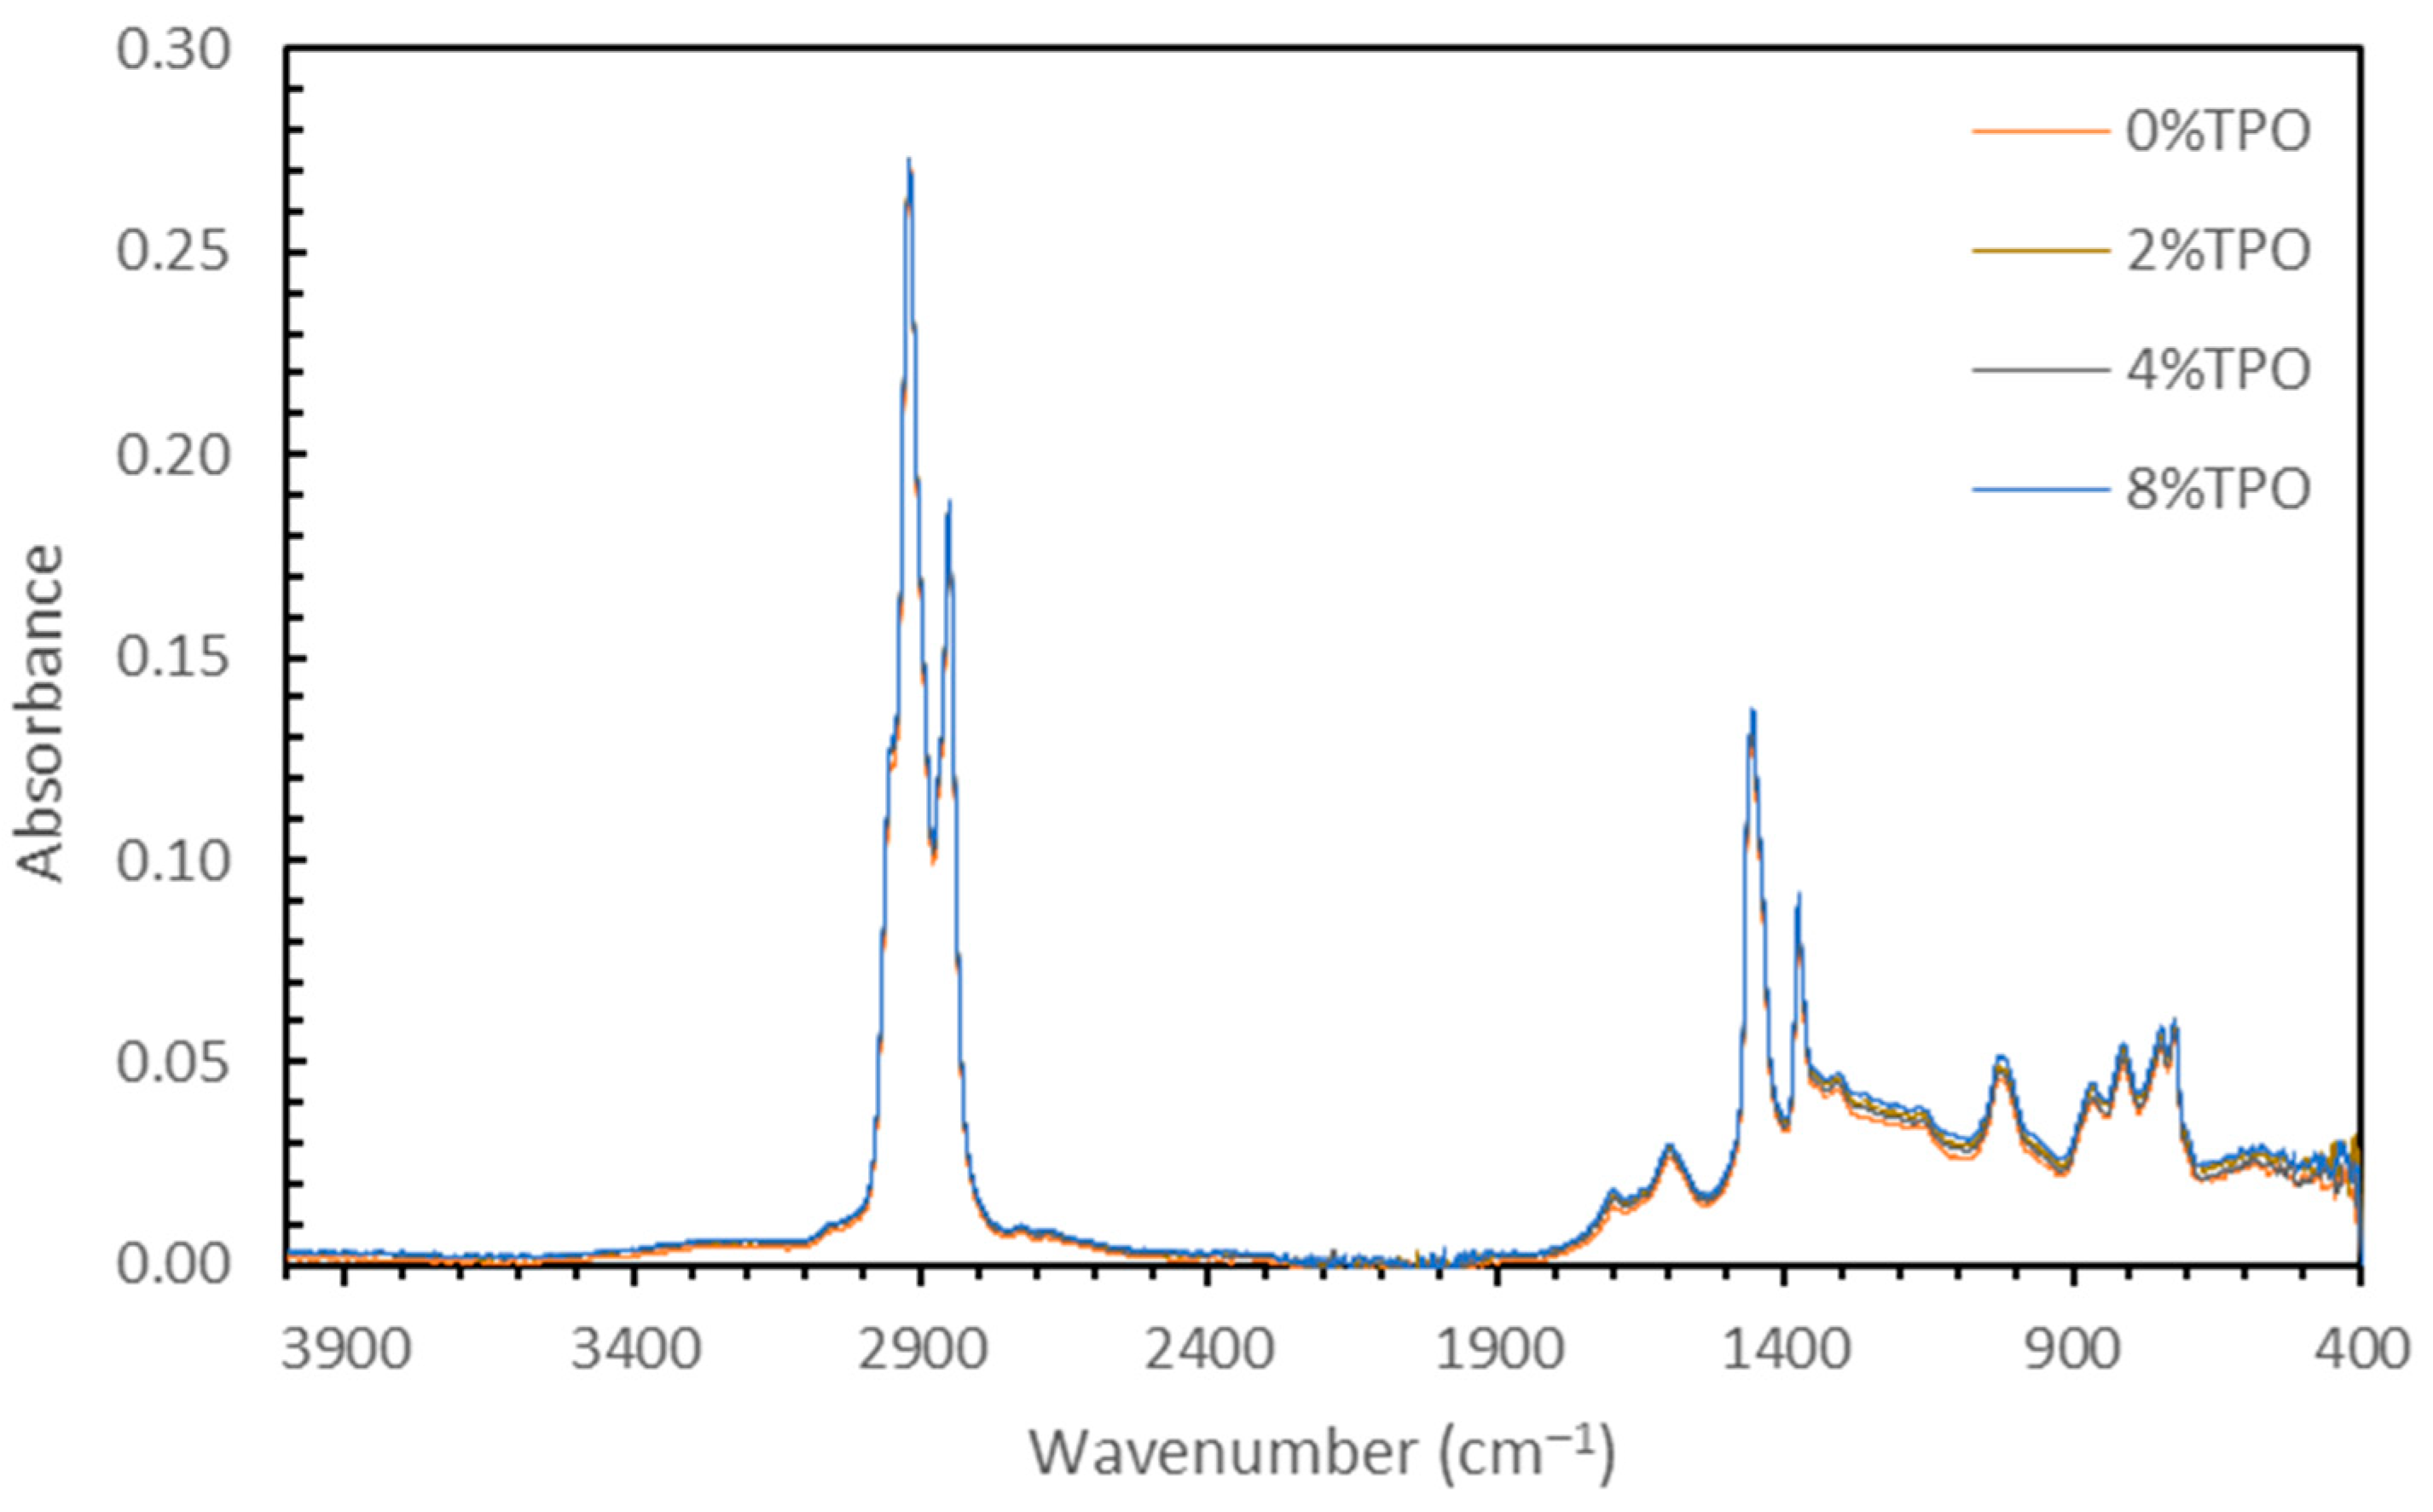
Due to the reactivity of TPO, blending the material resulted in physical and chemical variability. The physical variability was reduced as the testing temperature increased. Physical testing temperatures above 58 °C are recommended to homogenize the modified binder matrix. The chemical variability was more subtle, but FTIR analysis indicated that no new IR-sensitive functional groups were formed during mixing.
-
Physical testing alone could not explain the unexpected stiffening of the 2% sample. FTIR testing indicated a higher amount of water and C=O in the blend. NMR analysis resulted in an increased primary relaxation time, indicating a less mobile system. These chemical results indicate that some TPO components introduced water and stiffened the binder matrix.
-
Adding 8% TPO hindered the high PG from 64 °C to 58 °C, reducing the resistance to rutting. This physical testing was supported by the decrease in the NMR primary relaxation time, indicating a more mobile system.
-
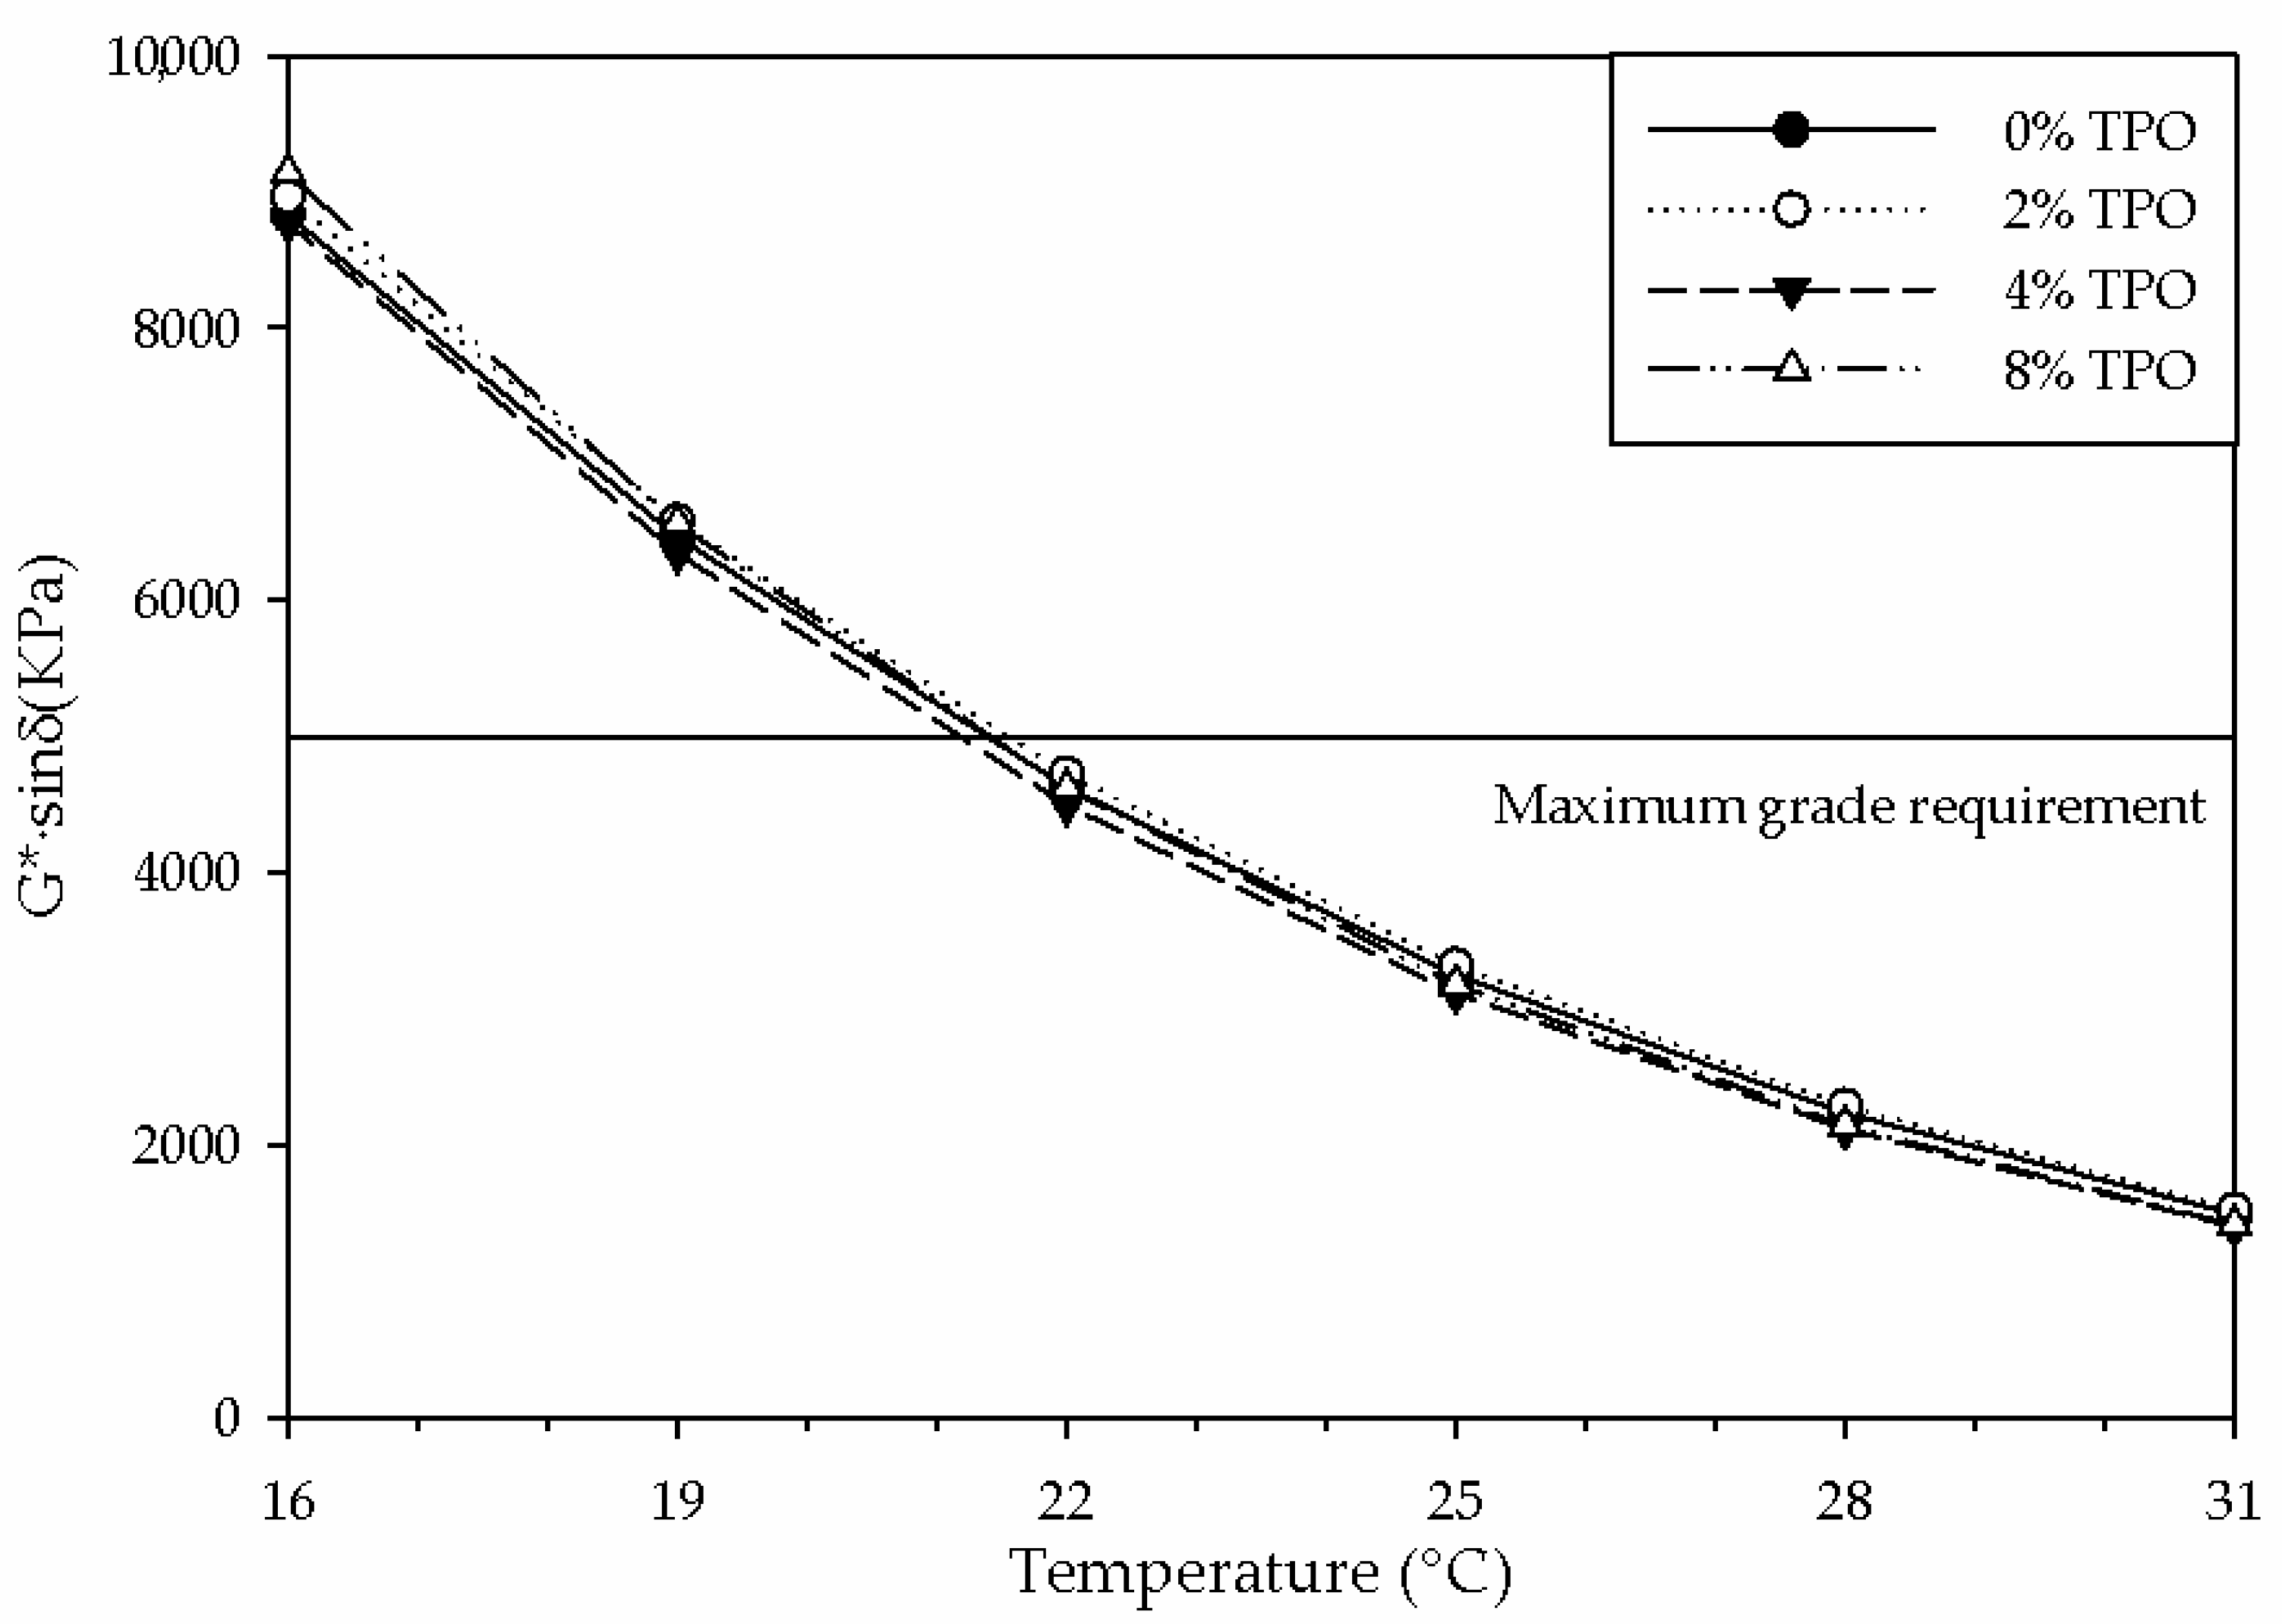
None of the TPO blends enhanced the intermediate PG. The similar physical properties were supported by the similarities in chemical testing.
-
FTIR analysis showed little variation from aging. The carbonyl indices indicated that long-term aging had the largest carbonyl content across most samples. Further analysis was complicated due to the carbonyl groups present in the TPO.
-
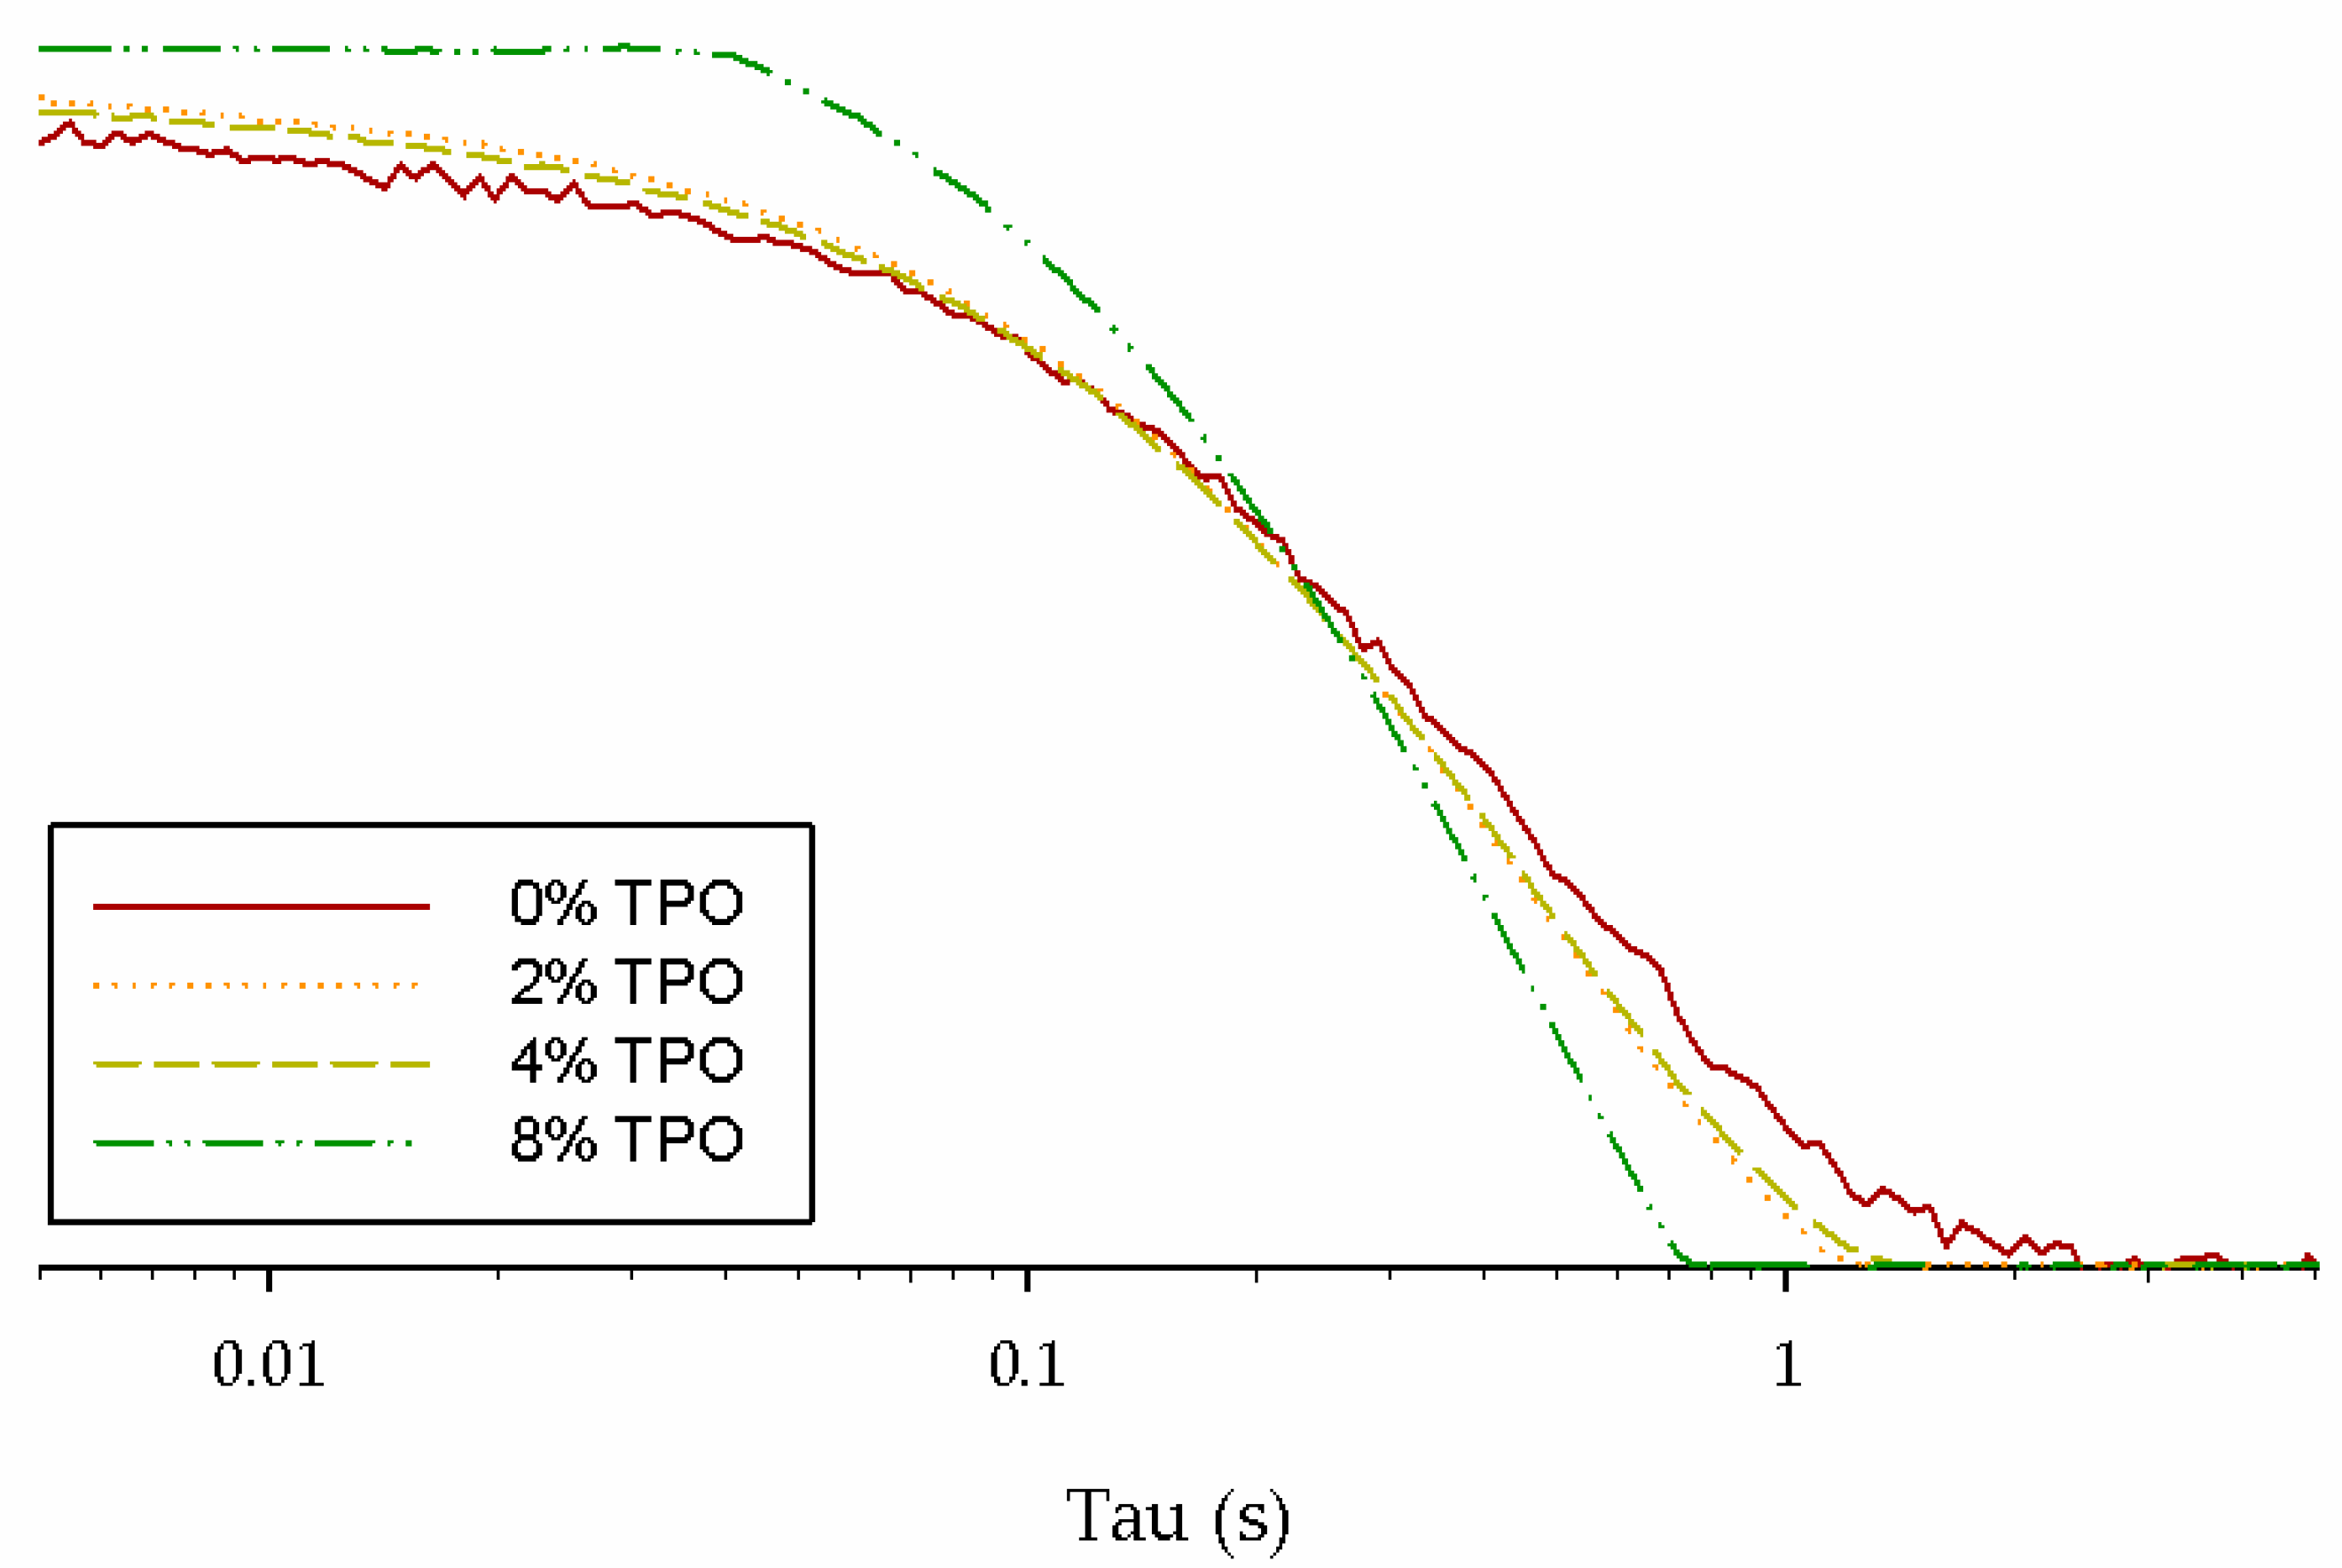
The primary NMR relaxation times indicated a connection to physical testing. Since NMR depends on the binder matrix, the impact of the TPO and aging could be seen. Some connections could be made between the secondary relaxation times, but more testing is needed to determine a correlation.
This testing showed a correlation between physical and chemical testing that can be applied to other asphalt additive materials. Chemical testing was shown to be a useful tool to indicate additive quality and binder performance. While chemical testing cannot be used in all situations due to noisy samples, ineffective indices, or unknown reactions, further research should focus on chemically characterizing the quality and performance, including low PG, of other modified asphalt blends. Chemical testing should be further developed as a tool to better understand the impact of chemical microstructure environments on physical pavement performance.

Author Contributions

Conceptualization, R.M.H. and M.A.; methodology, R.M.H. and K.W.; formal analysis, R.M.H. and J.B.; writing—original draft preparation, R.M.H. and J.B.; writing—review and editing, M.A. All authors have read and agreed to the published version of the manuscript.

Funding

This research received no external funding.

Institutional Review Board Statement

Not applicable.

Informed Consent Statement

Not applicable.

Data Availability Statement

The dataset is available on request from the authors.

Acknowledgments

The authors would like to acknowledge both the civil engineering and chemistry departments for this collaborative effort. The S&T NMR Institute also played a role in providing chemical materials for this study. Specifically, we would like to acknowledge Zac Mayes, Gabriel Riddle, Kait Miles, and Rosalee Brown. We would like to thank Evan Collins, Josh Burris, Ahmed El-Ashwah, and Eslam Deef Allah for their help in the civil department.

Conflicts of Interest

The authors declare no conflicts of interest.

References

  1. Colunga-Sánchez, L.M.; Salazar-Cruz, B.A.; Rivera-Armenta, J.L.; Morales-Cepeda, A.B.; Ramos-Gálvan, C.E.; Chávez-Cinco, M.Y. Evaluation of Chicken Feather and Styrene-Butadiene/Chicken Feather Composites as Modifier for Asphalts Binder. Appl. Sci. 2019, 9, 5188. [Google Scholar] [CrossRef]
  2. Cao, Z.; Chen, M.; Liu, Z.; He, B.; Yu, J.; Xue, L. Effect of Different Rejuvenators on the Rheological Properties of Aged SBS Modified Bitumen in Long Term Aging. Constr. Build. Mater. 2019, 215, 709–717. [Google Scholar] [CrossRef]
  3. Hemida, A.; Abdelrahman, M. Component Analysis of Bio-Asphalt Binder Using Crumb Rubber Modifier and Guayule Resin as an Innovative Asphalt Replacer. Resour. Conserv. Recycl. 2021, 169, 105486. [Google Scholar] [CrossRef]
  4. Flávia Justino Uchoa, A.; da Silva Rocha, W.; Peter Macedo Feitosa, J.; Lopes Nogueira, R.; Hellen Almeida de Brito, D.; Barbosa Soares, J.; de Aguiar Soares, S. Bio-Based Palm Oil as an Additive for Asphalt Binder: Chemical Characterization and Rheological Properties. Constr. Build. Mater. 2021, 285, 122883. [Google Scholar] [CrossRef]
  5. Alattieh, S.A.; Al-Khateeb, G.G.; Zeiada, W.; Shanableh, A. Performance Assessment of Bio-Modified Asphalt Binder Using Extracted Bio Oil from Date Seeds Waste. Int. J. Syst. Assur. Eng. Manag. 2020, 11, 1260–1270. [Google Scholar] [CrossRef]
  6. Banar, M.; Akyildiz, V.; Özkan, A.; Çokaygil, Z.; Onay, Ö. Characterization of Pyrolytic Oil Obtained from Pyrolysis of TDF (Tire Derived Fuel). Energy Convers. Manag. 2012, 62, 22–30. [Google Scholar] [CrossRef]
  7. Campuzano, F.; Abdul Jameel, A.G.; Zhang, W.; Emwas, A.H.; Agudelo, A.F.; Martínez, J.D.; Sarathy, S.M. Fuel and Chemical Properties of Waste Tire Pyrolysis Oil Derived from a Continuous Twin-Auger Reactor. Energy Fuels 2020, 34, 12688–12702. [Google Scholar] [CrossRef]
  8. Williams, P.T. Pyrolysis of Waste Tyres: A Review. Waste Manag. 2013, 33, 1714–1728. [Google Scholar] [CrossRef]
  9. Kumar, A.; Choudhary, R.; Kumar, A. Evaluation of Waste Tire Pyrolytic Oil as a Rejuvenation Agent for Unmodified, Polymer-Modified, and Rubber-Modified Aged Asphalt Binders. J. Mater. Civil. Eng. 2022, 34, 04022246. [Google Scholar] [CrossRef]
  10. Zhang, G.; Chen, F.; Zhang, Y.; Zhao, L.; Chen, J.; Cao, L.; Gao, J.; Xu, C. Properties and Utilization of Waste Tire Pyrolysis Oil: A Mini Review. Fuel Process. Technol. 2021, 211, 106582. [Google Scholar] [CrossRef]
  11. Al-Sabaeei, A.M.; Napiah, M.B.; Sutanto, M.H.; Alaloul, W.S.; Yusoff, N.I.M.; Khairuddin, F.H.; Memon, A.M. Evaluation of the High-Temperature Rheological Performance of Tire Pyrolysis Oil-Modified Bio-Asphalt. Int. J. Pavement Eng. 2022, 23, 4007–4022. [Google Scholar] [CrossRef]
  12. Ržek, L.; Ravnikar Turk, M.; Tušar, M. Increasing the Rate of Reclaimed Asphalt in Asphalt Mixture by Using Alternative Rejuvenator Produced by Tire Pyrolysis. Constr. Build. Mater. 2020, 232, 117177. [Google Scholar] [CrossRef]
  13. Han, W.; Han, D.; Chen, H. Pyrolysis of Waste Tires: A Review. Polymers 2023, 15, 1604. [Google Scholar] [CrossRef]
  14. Campuzano, F.; Abdul Jameel, A.G.; Zhang, W.; Emwas, A.H.; Agudelo, A.F.; Martínez, J.D.; Sarathy, S.M. On the Distillation of Waste Tire Pyrolysis Oil: A Structural Characterization of the Derived Fractions. Fuel 2021, 290, 120041. [Google Scholar] [CrossRef]
  15. Kebritchi, A.; Firoozifar, H.; Shams, K.; Jalali-Arani, A. Effect of Pre-Devulcanization and Temperature on Physical and Chemical Properties of Waste Tire Pyrolytic Oil Residue. Fuel 2013, 112, 319–325. [Google Scholar] [CrossRef]
  16. Benallal, B.; Roy, C.; Pakdel, H.; Chabot, S.; Poirier, M.A. Characterization of Pyrolytic Light Naphtha from Vacuum Pyrolysis of Used Tyres Comparison with Petroleum Naphtha. Fuel 1995, 74, 1589–1594. [Google Scholar] [CrossRef]
  17. Jan Kole, P.; Löhr, A.J.; Van Belleghem, F.G.A.J.; Ragas, A.M.J. Wear and Tear of Tyres: A Stealthy Source of Microplastics in the Environment. Int. J. Environ. Res. Public Health 2017, 14, 1265. [Google Scholar] [CrossRef]
  18. Ren, S.; Liu, X.; Lin, P.; Gao, Y.; Erkens, S. Insight into the Compatibility Behaviors between Various Rejuvenators and Aged Bitumen: Molecular Dynamics Simulation and Experimental Validation. Mater. Des. 2022, 223, 111141. [Google Scholar] [CrossRef]
  19. Hofko, B.; Alavi, M.Z.; Grothe, H.; Jones, D.; Harvey, J. Repeatability and Sensitivity of FTIR ATR Spectral Analysis Methods for Bituminous Binders. Mater. Struct./Mater. Constr. 2017, 50, 187. [Google Scholar] [CrossRef]
  20. Durrieu, F.; Farcas, F.; Mouillet, V. The Influence of UV Aging of a Styrene/Butadiene/Styrene Modified Bitumen: Comparison between Laboratory and on Site Aging. Fuel 2007, 86, 1446–1451. [Google Scholar] [CrossRef]
  21. Ren, S.; Liu, X.; Lin, P.; Jing, R.; Erkens, S. Toward the Long-Term Aging Influence and Novel Reaction Kinetics Models of Bitumen. Int. J. Pavement Eng. 2022, 24, 2024188. [Google Scholar] [CrossRef]
  22. Caputo, P.; Loise, V.; Ashimova, S.; Teltayev, B.; Vaiana, R.; Oliviero Rossi, C. Inverse Laplace Transform (ILT)NMR: A Powerful Tool to Differentiate a Real Rejuvenator and a Softener of Aged Bitumen. Colloids Surf. A Physicochem. Eng. Asp. 2019, 574, 154–161. [Google Scholar] [CrossRef]
  23. He, X.; Hochstein, D.; Ge, Q.; Ali, A.W.; Chen, F.; Yin, H. Accelerated Aging of Asphalt by UV Photo-Oxidation Considering Moisture and Condensation Effects. J. Mater. Civil. Eng. 2018, 30, 04017261. [Google Scholar] [CrossRef]
  24. Yu, X.; Zaumanis, M.; Dos Santos, S.; Poulikakos, L.D. Rheological, Microscopic, and Chemical Characterization of the Rejuvenating Effect on Asphalt Binders. Fuel 2014, 135, 162–171. [Google Scholar] [CrossRef]
  25. Abe, A.A.; Rossi, C.O.; Eskandarsefat, S.; Porto, M.; Loise, V.; Venturini, L.; Caputo, P. Reclaimed Asphalt Recycling Agents: Looking into the Blueprint of Their Mechanisms of Action. Constr. Build. Mater. 2023, 363, 129843. [Google Scholar] [CrossRef]
  26. Hu, Y.; Si, W.; Kang, X.; Xue, Y.; Wang, H.; Parry, T.; Airey, G.D. State of the Art: Multiscale Evaluation of Bitumen Ageing Behaviour. Fuel 2022, 326, 125045. [Google Scholar] [CrossRef]
  27. Mazumder, M.; Ahmed, R.; Wajahat Ali, A.; Lee, S.J. SEM and ESEM Techniques Used for Analysis of Asphalt Binder and Mixture: A State of the Art Review. Constr. Build. Mater. 2018, 186, 313–329. [Google Scholar] [CrossRef]
  28. Sun, P.; Zhang, K.; Han, S.; Liang, Z.; Kong, W.; Zhan, X. Method for the Evaluation of the Homogeneity of Asphalt Mixtures by 2-Dimensional Image Analysis. Materials 2022, 15, 4265. [Google Scholar] [CrossRef]
  29. Lamontagne, J.; Dumas, P.; Mouillet, V.; Kister, J. Comparison by Fourier Transform Infrared (FTIR) Spectroscopy of Different Ageing Techniques: Application to Road Bitumens. Fuel 2001, 80, 483–488. [Google Scholar] [CrossRef]
  30. Mayes, Z.G.; Rice, W.H.; Chi, L.; Woelk, K. A Robust Freeman-Hill-Inspired Pulse Protocol for Ringdown-Free T1 Relaxation Measurements. J. Magn. Reson. 2023, 352, 107490. [Google Scholar] [CrossRef]
  31. Keeler, J. Chapter 8. In Understanding NMR Spectroscopy; John Wiley & Sons: Hoboken, NJ, USA, 2010. [Google Scholar]
  32. OChemOnline Infrared Spectroscopy Absorption Table. Available online: https://chem.libretexts.org/Ancillary_Materials/Reference/Reference_Tables/Spectroscopic_Reference_Tables/Infrared_Spectroscopy_Absorption_Table (accessed on 14 February 2024).
  33. MilliporeSigma IR Spectrum Table. Available online: https://www.sigmaaldrich.com/US/en/technical-documents/technical-article/analytical-chemistry/photometry-and-reflectometry/ir-spectrum-table (accessed on 14 February 2024).
Figure 1. Experimental design after blending.
Applsci 14 03300 g001
Figure 2. Physical DSR blending variability in (a) 2%, (b) 4%, and (c) 8% TPO samples.
Applsci 14 03300 g002
Figure 3. FTIR blending variability in (a) 2%, (b) 4%, and (c) 8% TPO samples.
Applsci 14 03300 g003
Figure 4. Grade determination of unaged blends.
Applsci 14 03300 g004
Figure 5. FTIR spectra of unaged binder blends and pure TPO.
Applsci 14 03300 g005
Figure 6. NMR relaxation curves of unaged blends.
Applsci 14 03300 g006
Figure 7. Mass loss of short-term aged blends.
Applsci 14 03300 g007
Figure 8. Grade determination of short-term aged blends.
Applsci 14 03300 g008
Figure 9. FTIR spectra of short-term aged blends.
Applsci 14 03300 g009
Figure 10. NMR results of short-term aged blends.
Applsci 14 03300 g010
Figure 11. Grade determination of long-term aged binder blends.
Applsci 14 03300 g011
Figure 12. FTIR spectra of long-term aged blends.
Applsci 14 03300 g012
Figure 13. NMR results of long-term aged blends.
Applsci 14 03300 g013
Figure 14. Carbonyl indices for aged and unaged samples.
Applsci 14 03300 g014
Figure 15. NMR relaxation times for TPO blends’ (a) primary relaxation times and (b) secondary relaxation times.
Applsci 14 03300 g015
Table 1. TPO properties.
PropertyTPO
Production Temp (°F)400
Flash Point (°C)130
Viscosity (cP)53
Table 2. Performance grades of TPO-modified binder blends.
SampleUnaged Grade
(°C)
RTFOT Grade
(°C)
High PG
(°C)
Intermediate PG
(°C)
0% TPO64646422
2% TPO64646422
4% TPO64646422
8% TPO64585822
Disclaimer/Publisher’s Note: The statements, opinions and data contained in all publications are solely those of the individual author(s) and contributor(s) and not of MDPI and/or the editor(s). MDPI and/or the editor(s) disclaim responsibility for any injury to people or property resulting from any ideas, methods, instructions or products referred to in the content.

