Featured Application
This work specifically applies to the development and validation of a cardiac simulation model that will facilitate the understanding of and mitigate tricuspid regurgitation (TR). The model employs diagnostic tools and a computational analysis to identify the medical conditions under which TR occurs and assesses the efficacy of potential interventions, notably the Pivot-TR device, in restoring normal heart valve function.
Abstract
Tricuspid regurgitation (TR) resulting from valve abnormalities necessitates precise diagnostic tools and interventions. We employed a simulated heart movement device to examine the performance of heart valve functions and analyzed internal pressure changes to provide a quantitative guide for TR treatment. We developed a simulator capable of replicating the flow profile, mimicking natural heart movements, with sensors installed for measuring internal pressure changes. We conducted an ex vivo experiment on a porcine heart to assess tricuspid valve functionality. An endoscope was installed, with a sensor and endoscopic images to detect abnormalities. TR became evident when the heart rate spectrum exceeded an average of 85.2 bpm (standard deviation, 1.3 bpm) and showed an amplitude higher than an average of 12.3 mmHg (standard deviation, 3.2 mmHg). This critical threshold consistently indicated TR onset. The application of the Pivot-TR attenuated this specific spectral area. We confirmed TR disappearance by reducing the intensity of the Tricuspid Regurgitation Generator or employing the Pivot-TR. The Pivot-TR’s ability to attenuate specific spectral areas associated with TR onset and its effectiveness in restoring normal heart functionality has implications for managing and treating TR, particularly that resulting from age-related structural changes in the heart.
1. Introduction
Recently, tricuspid regurgitation (TR) has become increasingly prevalent among patients over the age of 75, significantly impacting their quality of life [1]. Particularly, TR during this period often progresses to a severe stage with a very poor prognosis. With human life expectancy now extending beyond 80 years, this represents a significant issue. Surgical approaches to addressing this, compared to mitral or aortic surgery, are associated with higher postoperative mortality rates, necessitating a non-surgical approach [2,3]. Therefore, this study aims to suppress TR through non-surgical means and approach the phenomenon of TR from a signal analysis perspective.
From a biomechanics standpoint, the tricuspid valve (TV) displays anisotropic elasticity. Its elasticity is lower in the forward flow direction but higher in the reverse. As the heart undergoes age-related structural changes, there is a drop in its forward elasticity and a rise in the reverse elasticity. This shift hinders the heart from effectively preventing retrograde flow, resulting in a dysfunctional valve. Moreover, arteriosclerosis shows that blood vessel fluid resistance escalation obstructs blood egress from the heart. Consequently, there is blood buildup, enlarging the heart’s volume. These compounded issues strain the valve, causing heart and valve malfunctions, such as TR [4,5].
TR arises due to structural abnormalities of the TV. The causes can include valve leaflet prolapses, TV annular dilation, or ruptures in the chordae tendineae. The extent of TR’s severity is gauged based on the regurgitation magnitude and its effects on a patient’s hemodynamics. Diagnosis and assessment tools include echocardiography, cardiac catheterization, and Doppler ultrasound [6,7,8].
Prior to this study, we had developed a membrane-based structure to manage TR and successfully tested its effectiveness in controlling TR in in vivo porcine hearts [9]. We named this structure the Pivot-TR device (TAU MEDICAL Inc., Yangsan, Republic of Korea). A simulator was needed to mimic the heart’s structure mechanically for a quantitative performance evaluation of this device and its aging tests. This paper encompasses the development of this simulator and methods to evaluate the performance of the tricuspid-valve assistive structure device (Pivot-TR) by atrial-pressure–time data and STFT, along with its limitations and potential improvements.
During the development of Pivot-TR, it became evident that indirect imaging methods, like magnetic resonance imaging (MRI) and ultrasound, have limitations in capturing the biomechanical behavior of the Pivot-TR. This realization necessitated optical imaging methods like endoscopy [10]. Thus, this study needed to begin and create a test bench suitable for experiments in ex vivo conditions. This test bench should be able to provide an environment in which atrial pressure and heart rate can be tested as control variables [11].
In this research, we aim to develop a flow simulator that represents the basic appearance of hemodynamics in the heart affected by TR. Using the simulator and ex vivo porcine hearts, we aim to observe changes in blood pressure and flow. The research verifies the reproducibility of these observations and, when inserting a structure to alleviate TR and assist the valve function, determines how much the valve function is restored and how blood flow and pressure are adjusted.
2. Materials and Methods
In this section, we aim to describe the TR-alleviating Pivot-TR device and the heart simulator’s various components and operating methods.
2.1. Materials
2.1.1. Pivot-TR
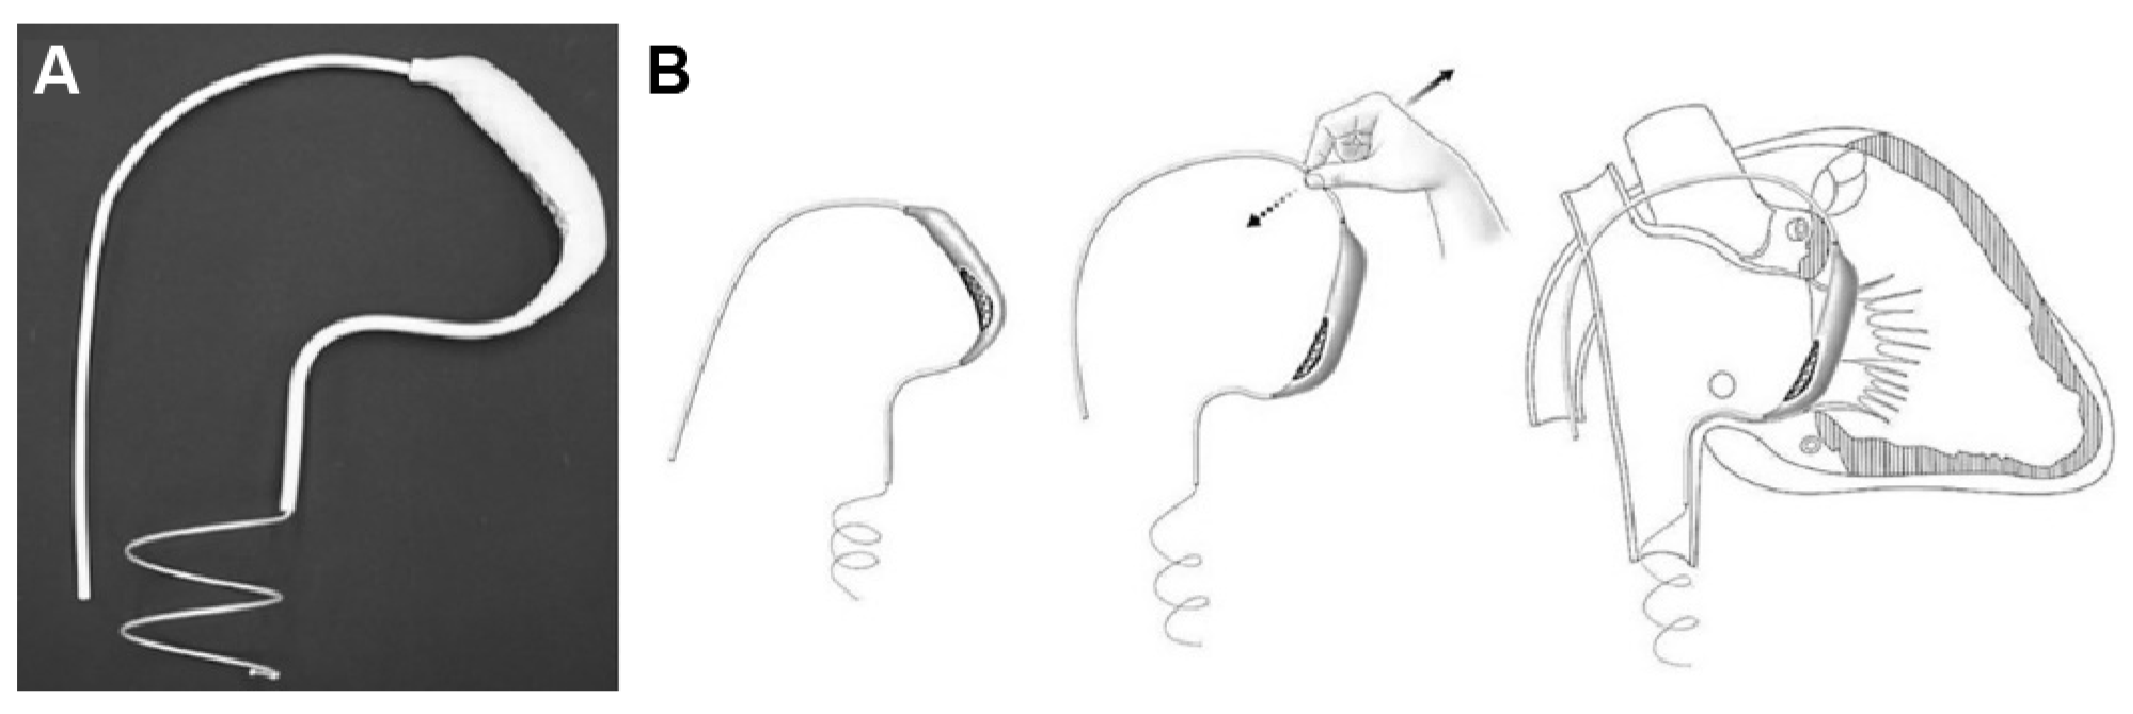
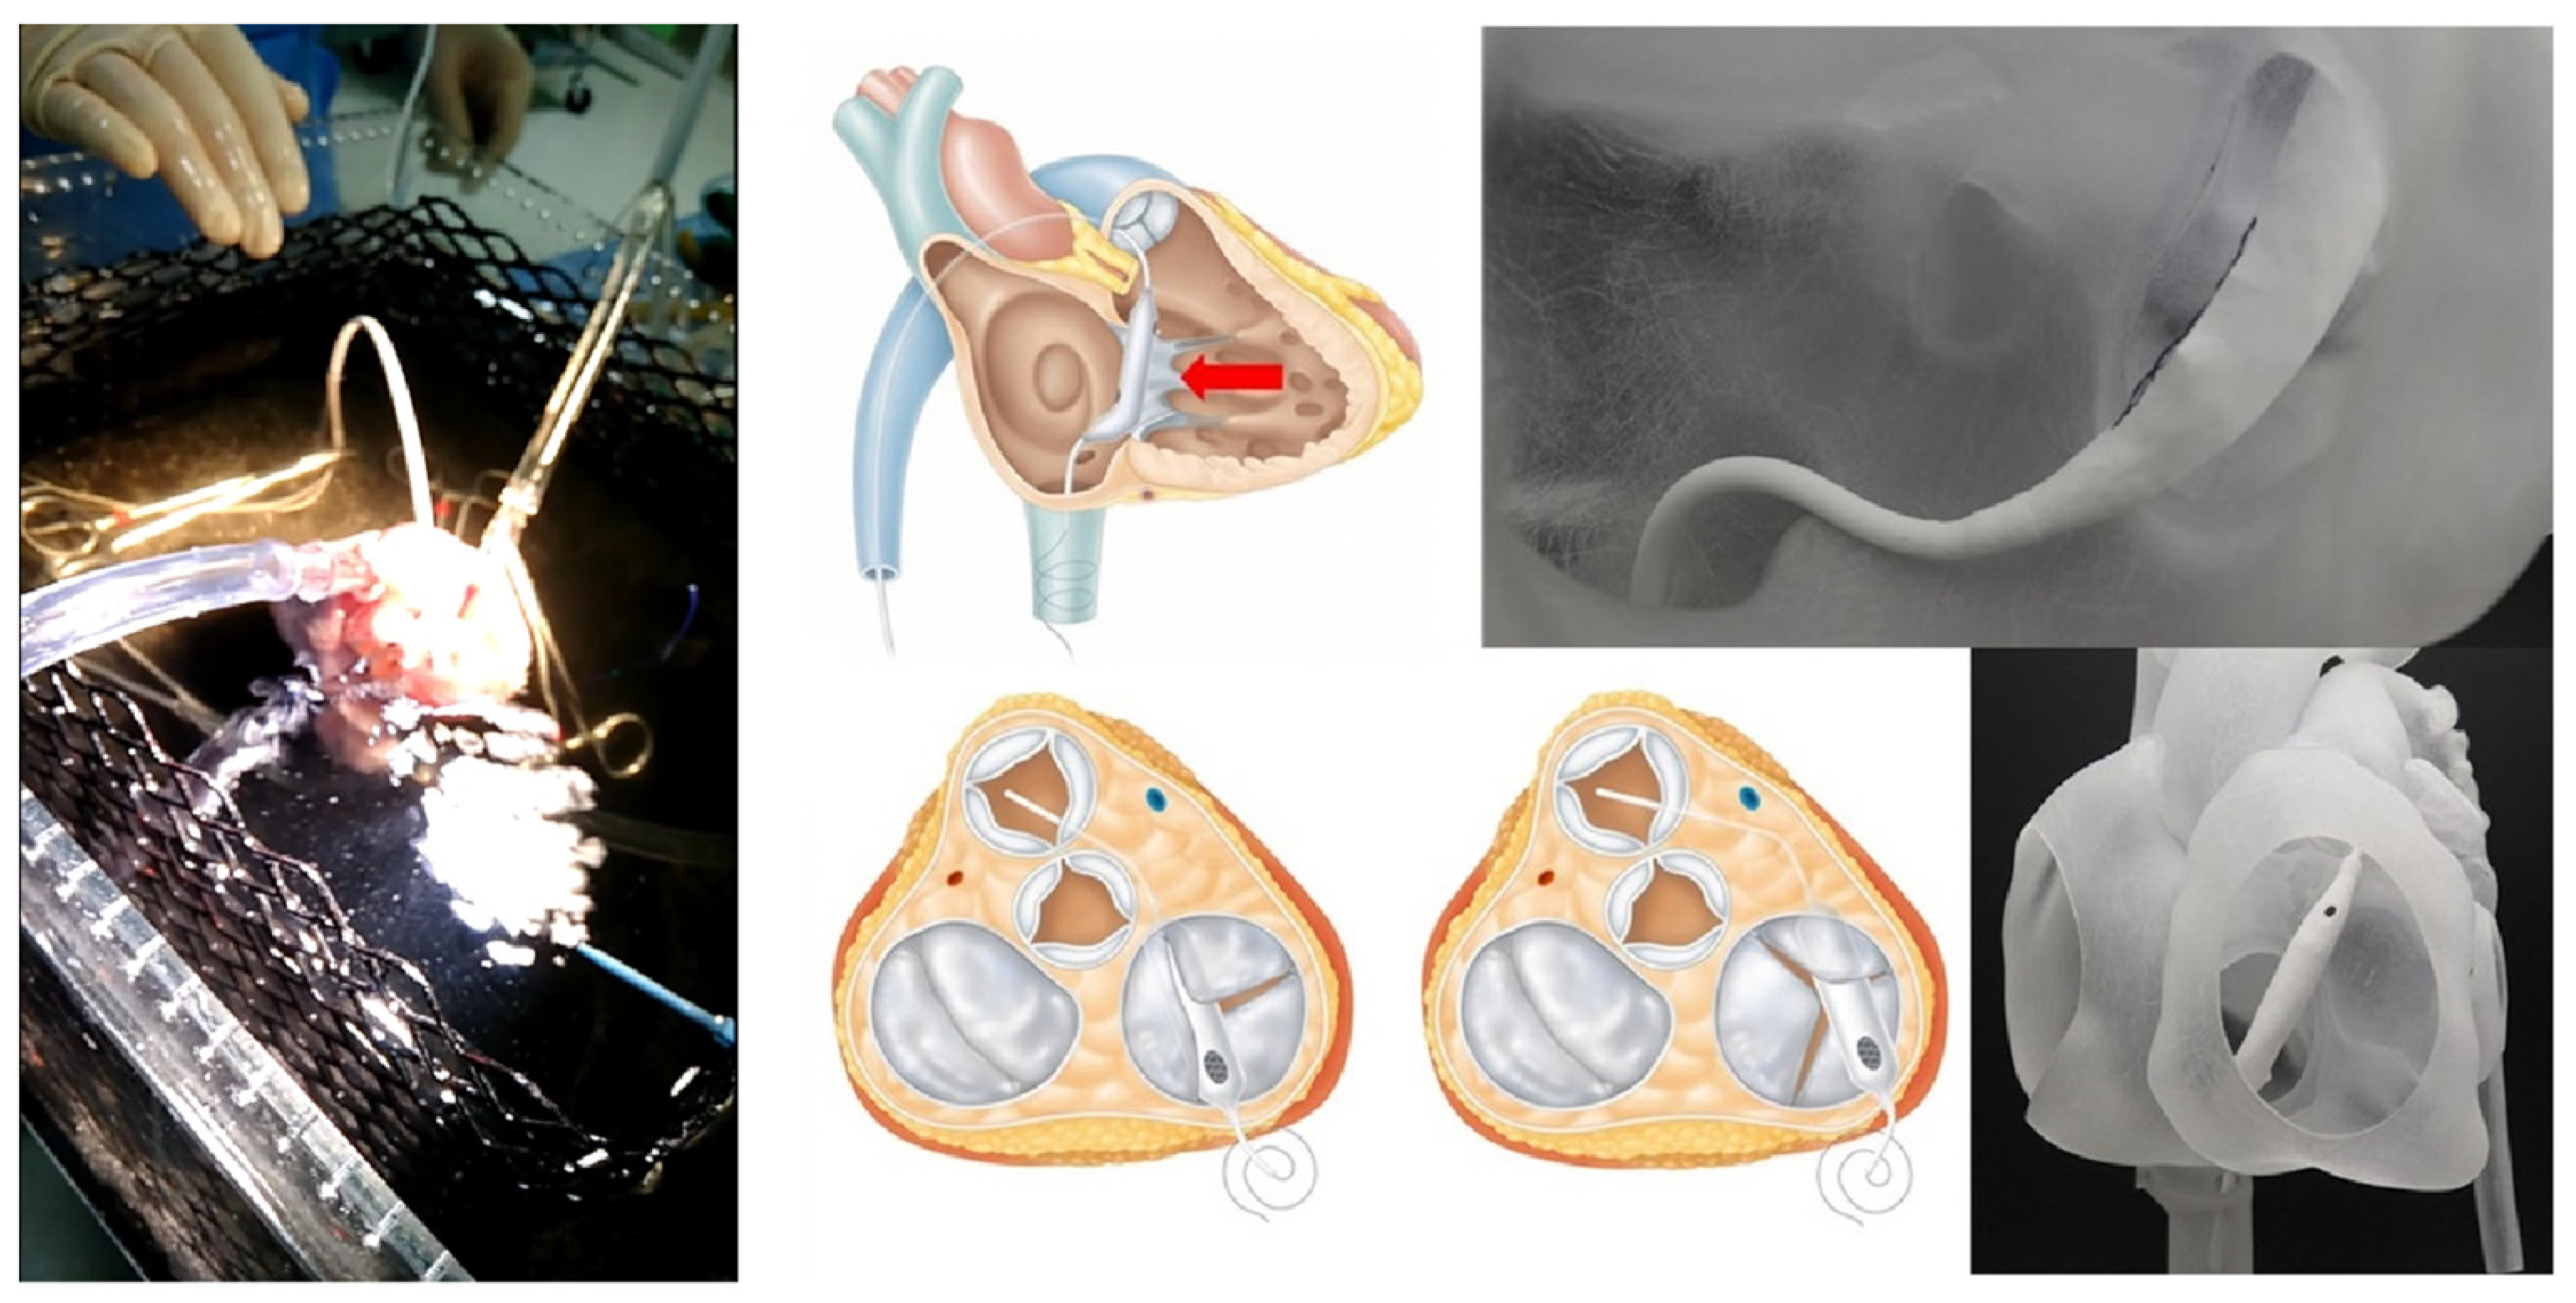
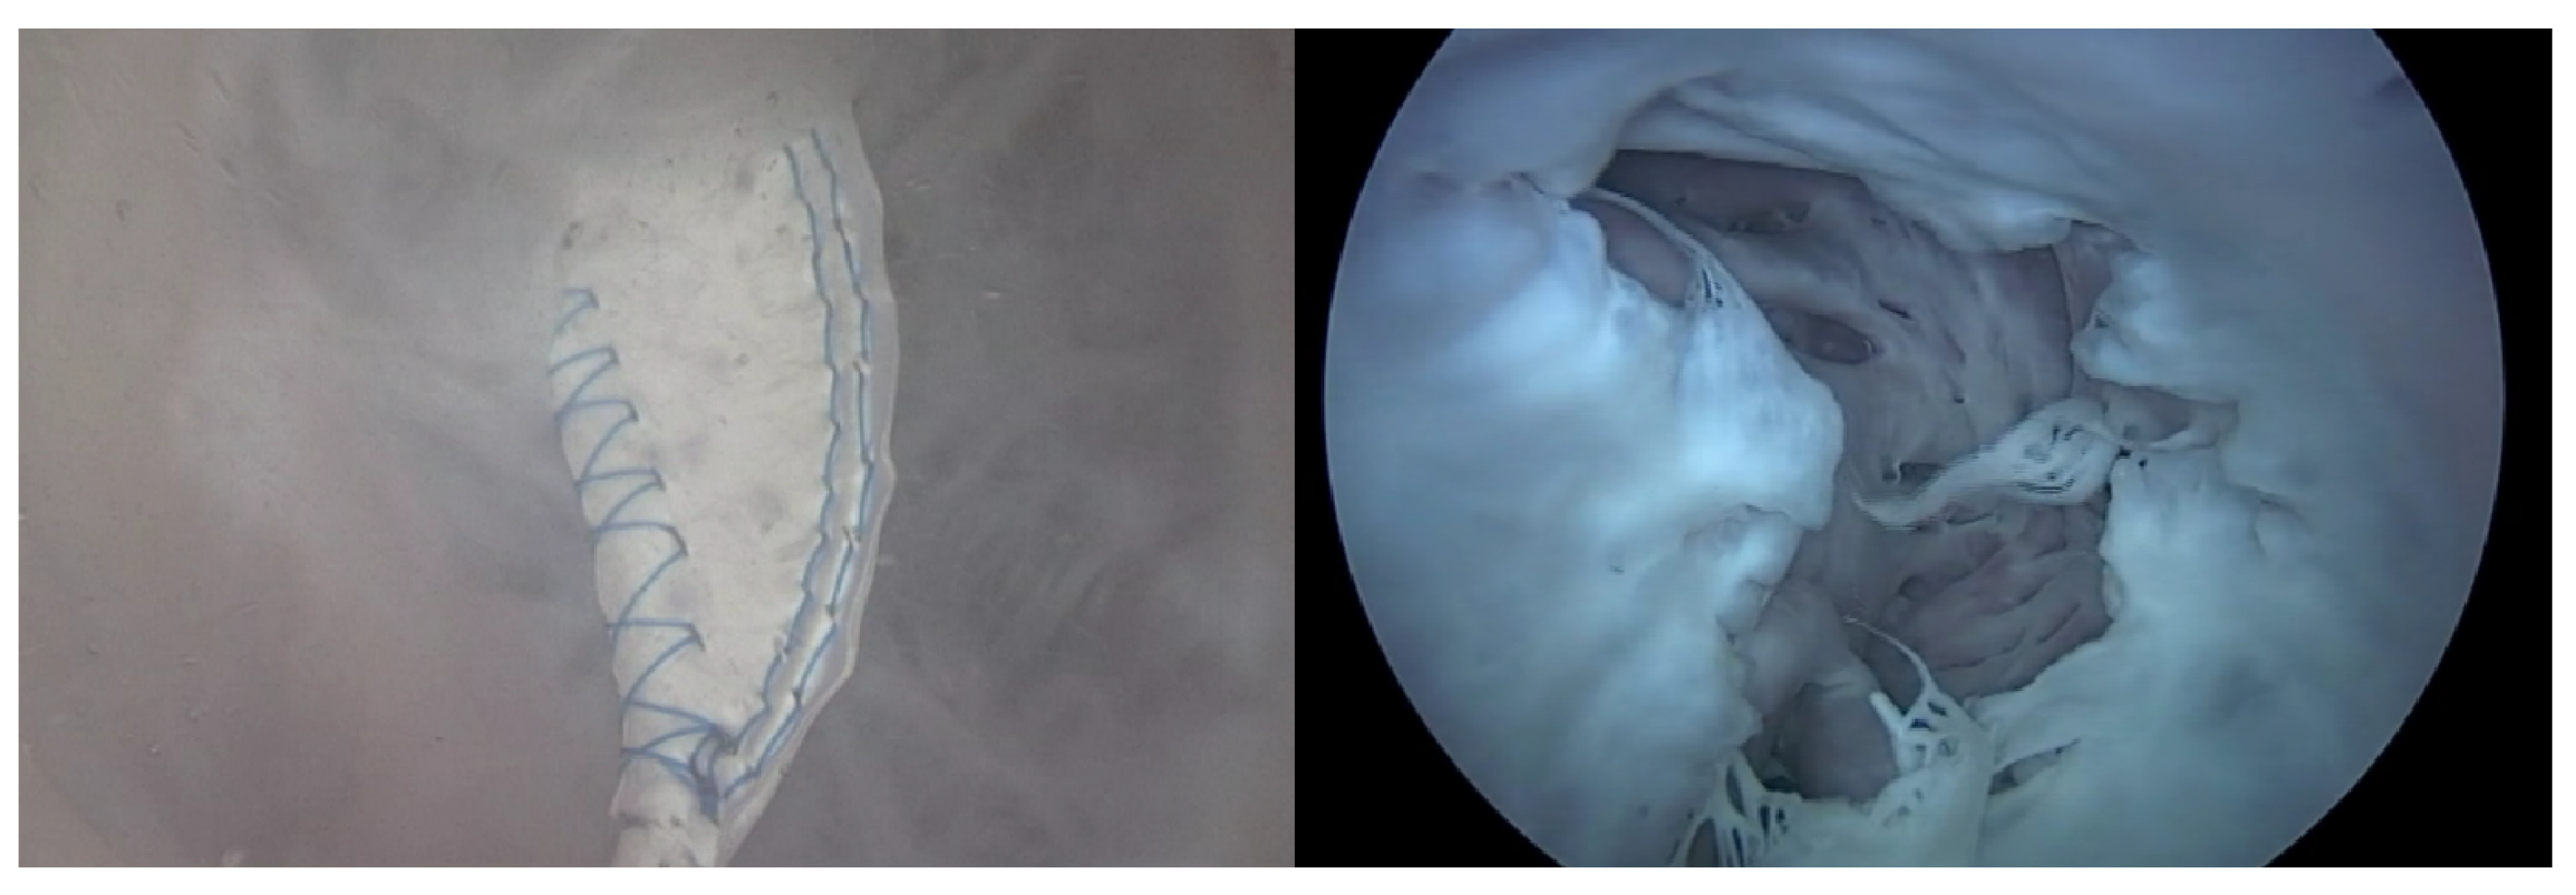
The Pivot-TR (Figure 1 and Figure 2), developed by Tau-PNU Medical Co. in Yangsan, Republic of Korea, is an innovative device designed to mitigate TR. It comprises a pivot axis formed from a nitinol wire with components named “the elephant nose” and “the spiral anchor” and a 3D leaflet enveloped in an expanded polytetrafluoroethylene (ePTFE) coating. The spiral anchor is equipped with a hook at the proximal end to allow for the retrieval of the snare at a later time. Positioned at the TV’s intersection point, the device allows for real-time adjustments of its wire tension, enabling clinicians to optimize the angle and position of the pivot axis based on observed blood leakage, thereby reducing TR’s hemodynamic impact [9]. The diameter of the anchor in this study was 35 mm.

Figure 1.
Structure (A) and mechanism of Pivot-TR device (B) [9].

Figure 2.
The experimental setup and how to use the Pivot-TR device in a heart [9].
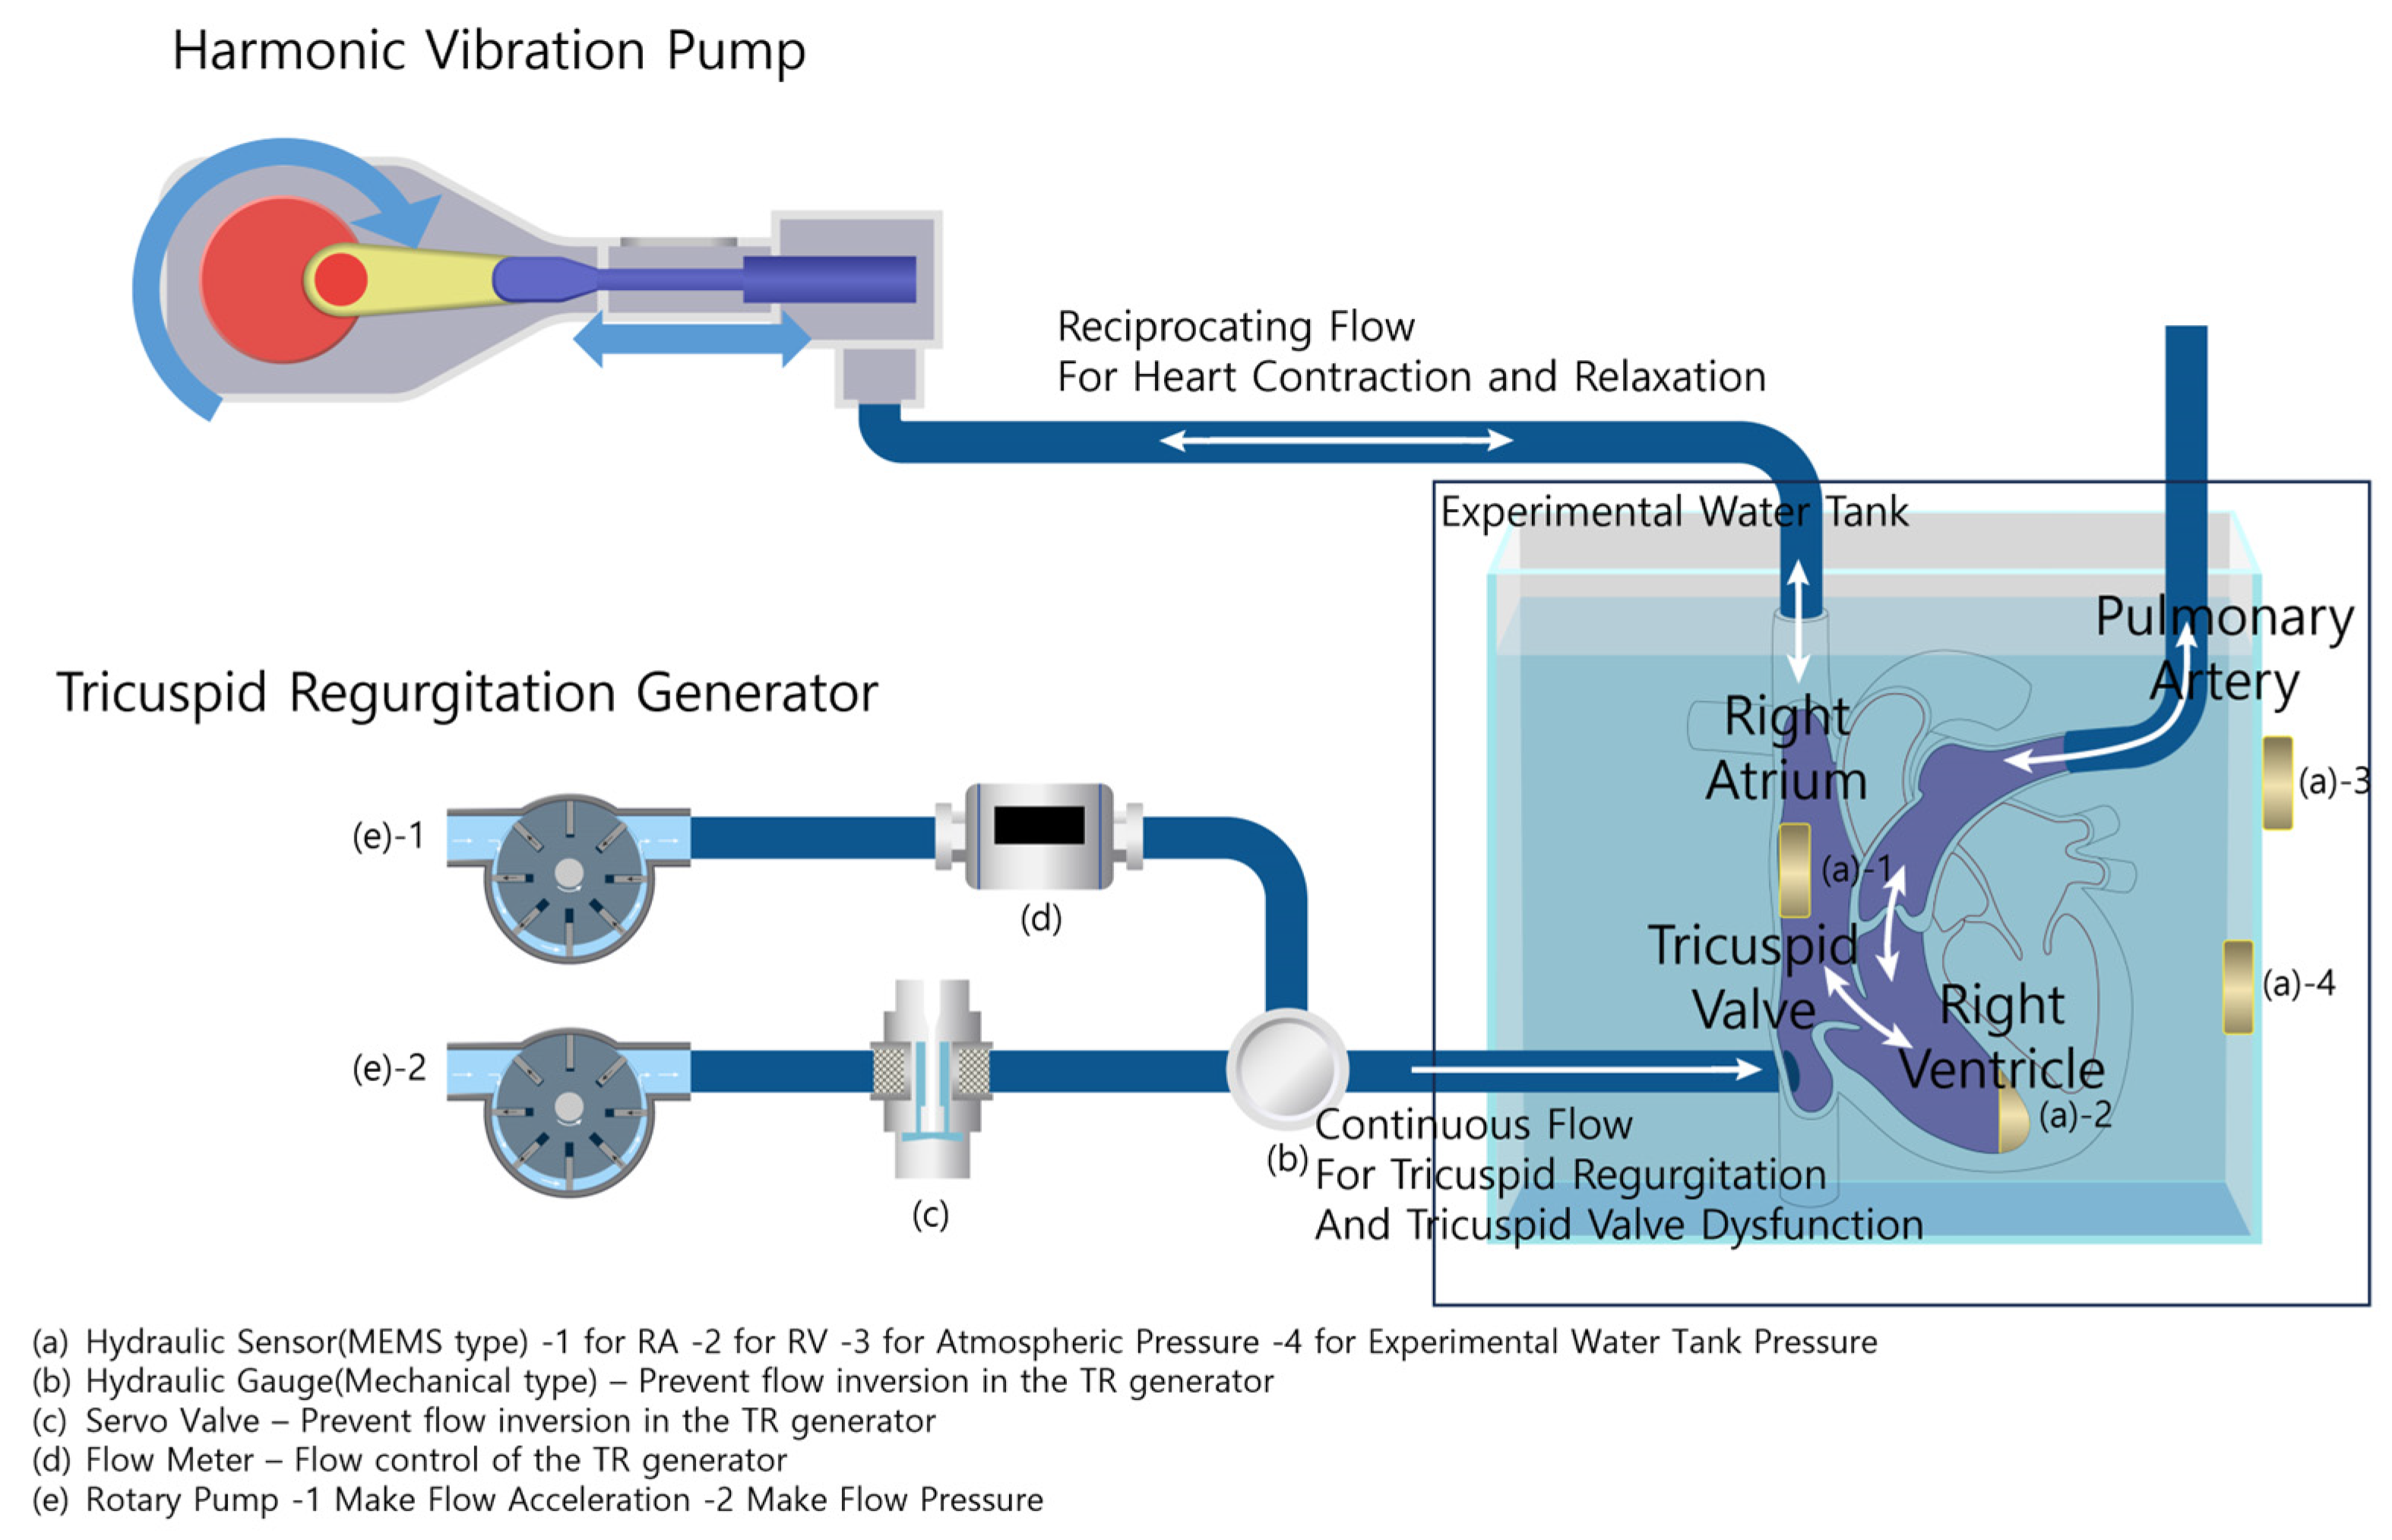
2.1.2. Harmonic Vibration Pump
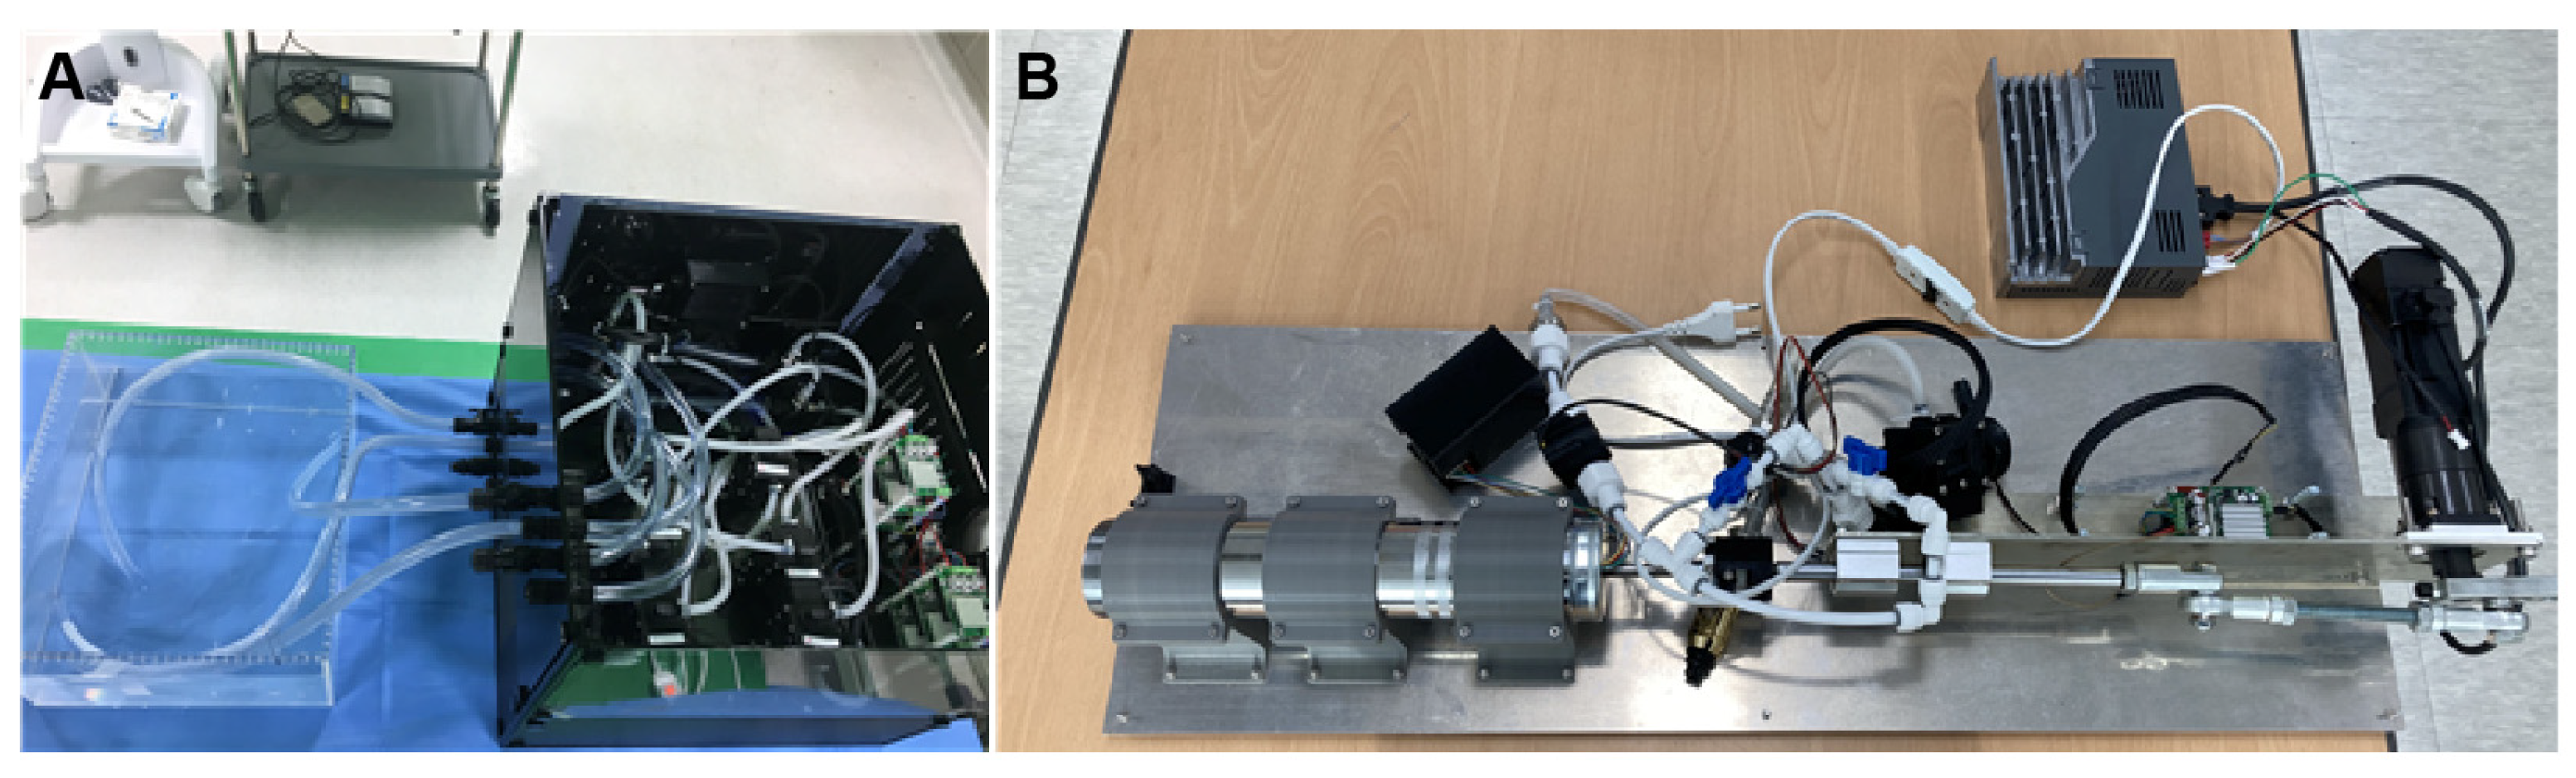
The Harmonic Vibration Pump schematically depicted in Figure 3 and real hardware in Figure 4A show that the system consists of a servo motor and an STS 304 piston. This system operates under a motion controller utilizing PID control, with feedback from a relative encoder. It is capable of generating heartbeats ranging from 0 to 100 bpm, and its flow profile emulates a half-cut sine wave, effectively replicating the volume systole and diastole of the right atrium and right ventricle.
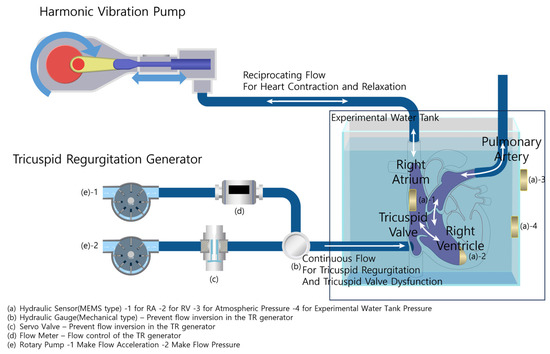
Figure 3.
Experimental configuration and heart simulator overview.

Figure 4.
Harmonic Vibration Pump (A) and Tricuspid Regurgitation Generator (B).
2.1.3. Tricuspid Regurgitation Generator and Data Acquisition System
The Tricuspid Regurgitation Generator schematically represented in Figure 3 and the real hardware in Figure 4B show that the system consists of two rotary pumps, a flow meter, and a rapid-response mechanical pressure sensor. The first pump ensures a consistent flow, while the second prevents backflow, facilitated by feedback mechanisms from the flow meter and the mechanical pressure sensor. The generated flow rate can be controlled in increments of 10 cc/min, representing various TR severities.
The system has four MEMS hydraulic sensors, all synchronized by a clock generator operating at 125 KHz. Subsequently, to calibrate each sensor, (a)-3 continuously measures atmospheric pressure, and (a)-4 measures the water pressure in the tank. The difference between these two readings corresponds to the pressure difference caused by the height of the experimental water tank; any pressure beyond this is considered noise and is used to real-time correct the values of the RA and RV sensors, (a)-1,2. Each sensor has a measurement range from 10 mbar to 1.1 bar. These sensors are strategically installed in the right atrium (RA), right ventricle (RV), the inner section of the water tank, and the outer water tank. This setup ensures a comprehensive capture of pressure dynamics across the simulation framework.
The system also incorporates synchronized endoscopic optical imaging to supplement the pressure data. This advanced imaging component offers the real-time visualization of the TV function. By correlating the acquired pressure data with visual observations of the valve, researchers can make informed judgments on whether the TV function is normal or abnormal. With a data capture rate of 100 Hz for pressure dynamics and simultaneous optical imaging, the DAQ system provides a holistic and detailed study of the pressure and visual aspects of valve functionality.
2.2. Methodology
A total of 15 porcine hearts were used in the experiment. Each heart was extracted shortly before the experiment, and the testing began within 60 min of extraction. Due to the onset of rigidity in the porcine hearts during the experiment duration, each heart was typically tested an average of three times. Any data collected from hearts that became rigid during the experiment were discarded.
Initialization and Harmonic Vibration Pump Activation
The ex vivo porcine heart in Figure 2 is securely positioned within a water-filled tank. The tank environment ensures optical clarity for observations while simulating the conditions surrounding the heart in vivo. The pump is started, and the servo motor, controlled by the motion controller with PID feedback from the relative encoder, begins to function.
This results in a flow that replicates a half-cut sine wave, mimicking the systolic and diastolic phases of the right atrium and right ventricle. The flow is introduced into the right atrium, creating a circulation representing normal heartbeats. The beats per minute (bpm) range can be adjusted from 0 to 100 bpm to simulate various heart rates.
2.3. Inducing Tricuspid Regurgitation (TR) and Data Acquisition
To simulate the condition of TR, the TRG and controller are activated. A hole in the middle of the right ventricle acts as the TR introduction point. A hose is attached here, and the connection area is stitched to prevent leakage. The first rotary pump, controlled by feedback from the flow meter, generates a continuous flow into the right ventricle. The second rotary pump, operating based on feedback from the rapid-response mechanical pressure sensor, ensures that the flow does not reverse, simulating the condition of TR.
During the simulation, the DAQ system continuously monitors pressure dynamics. The four MEMS pressure sensors, each with a resolution of 0.1 mbar and synchronized by a 125 KHz clock generator, capture pressure readings from the RA, RV, inner water tank, and outer water tank. These data are recorded at 100 samples per second and can be stored for a subsequent analysis. After the desired simulation duration, the collected data can be exported as .csv or .xlsx files for further examination.
3. Results
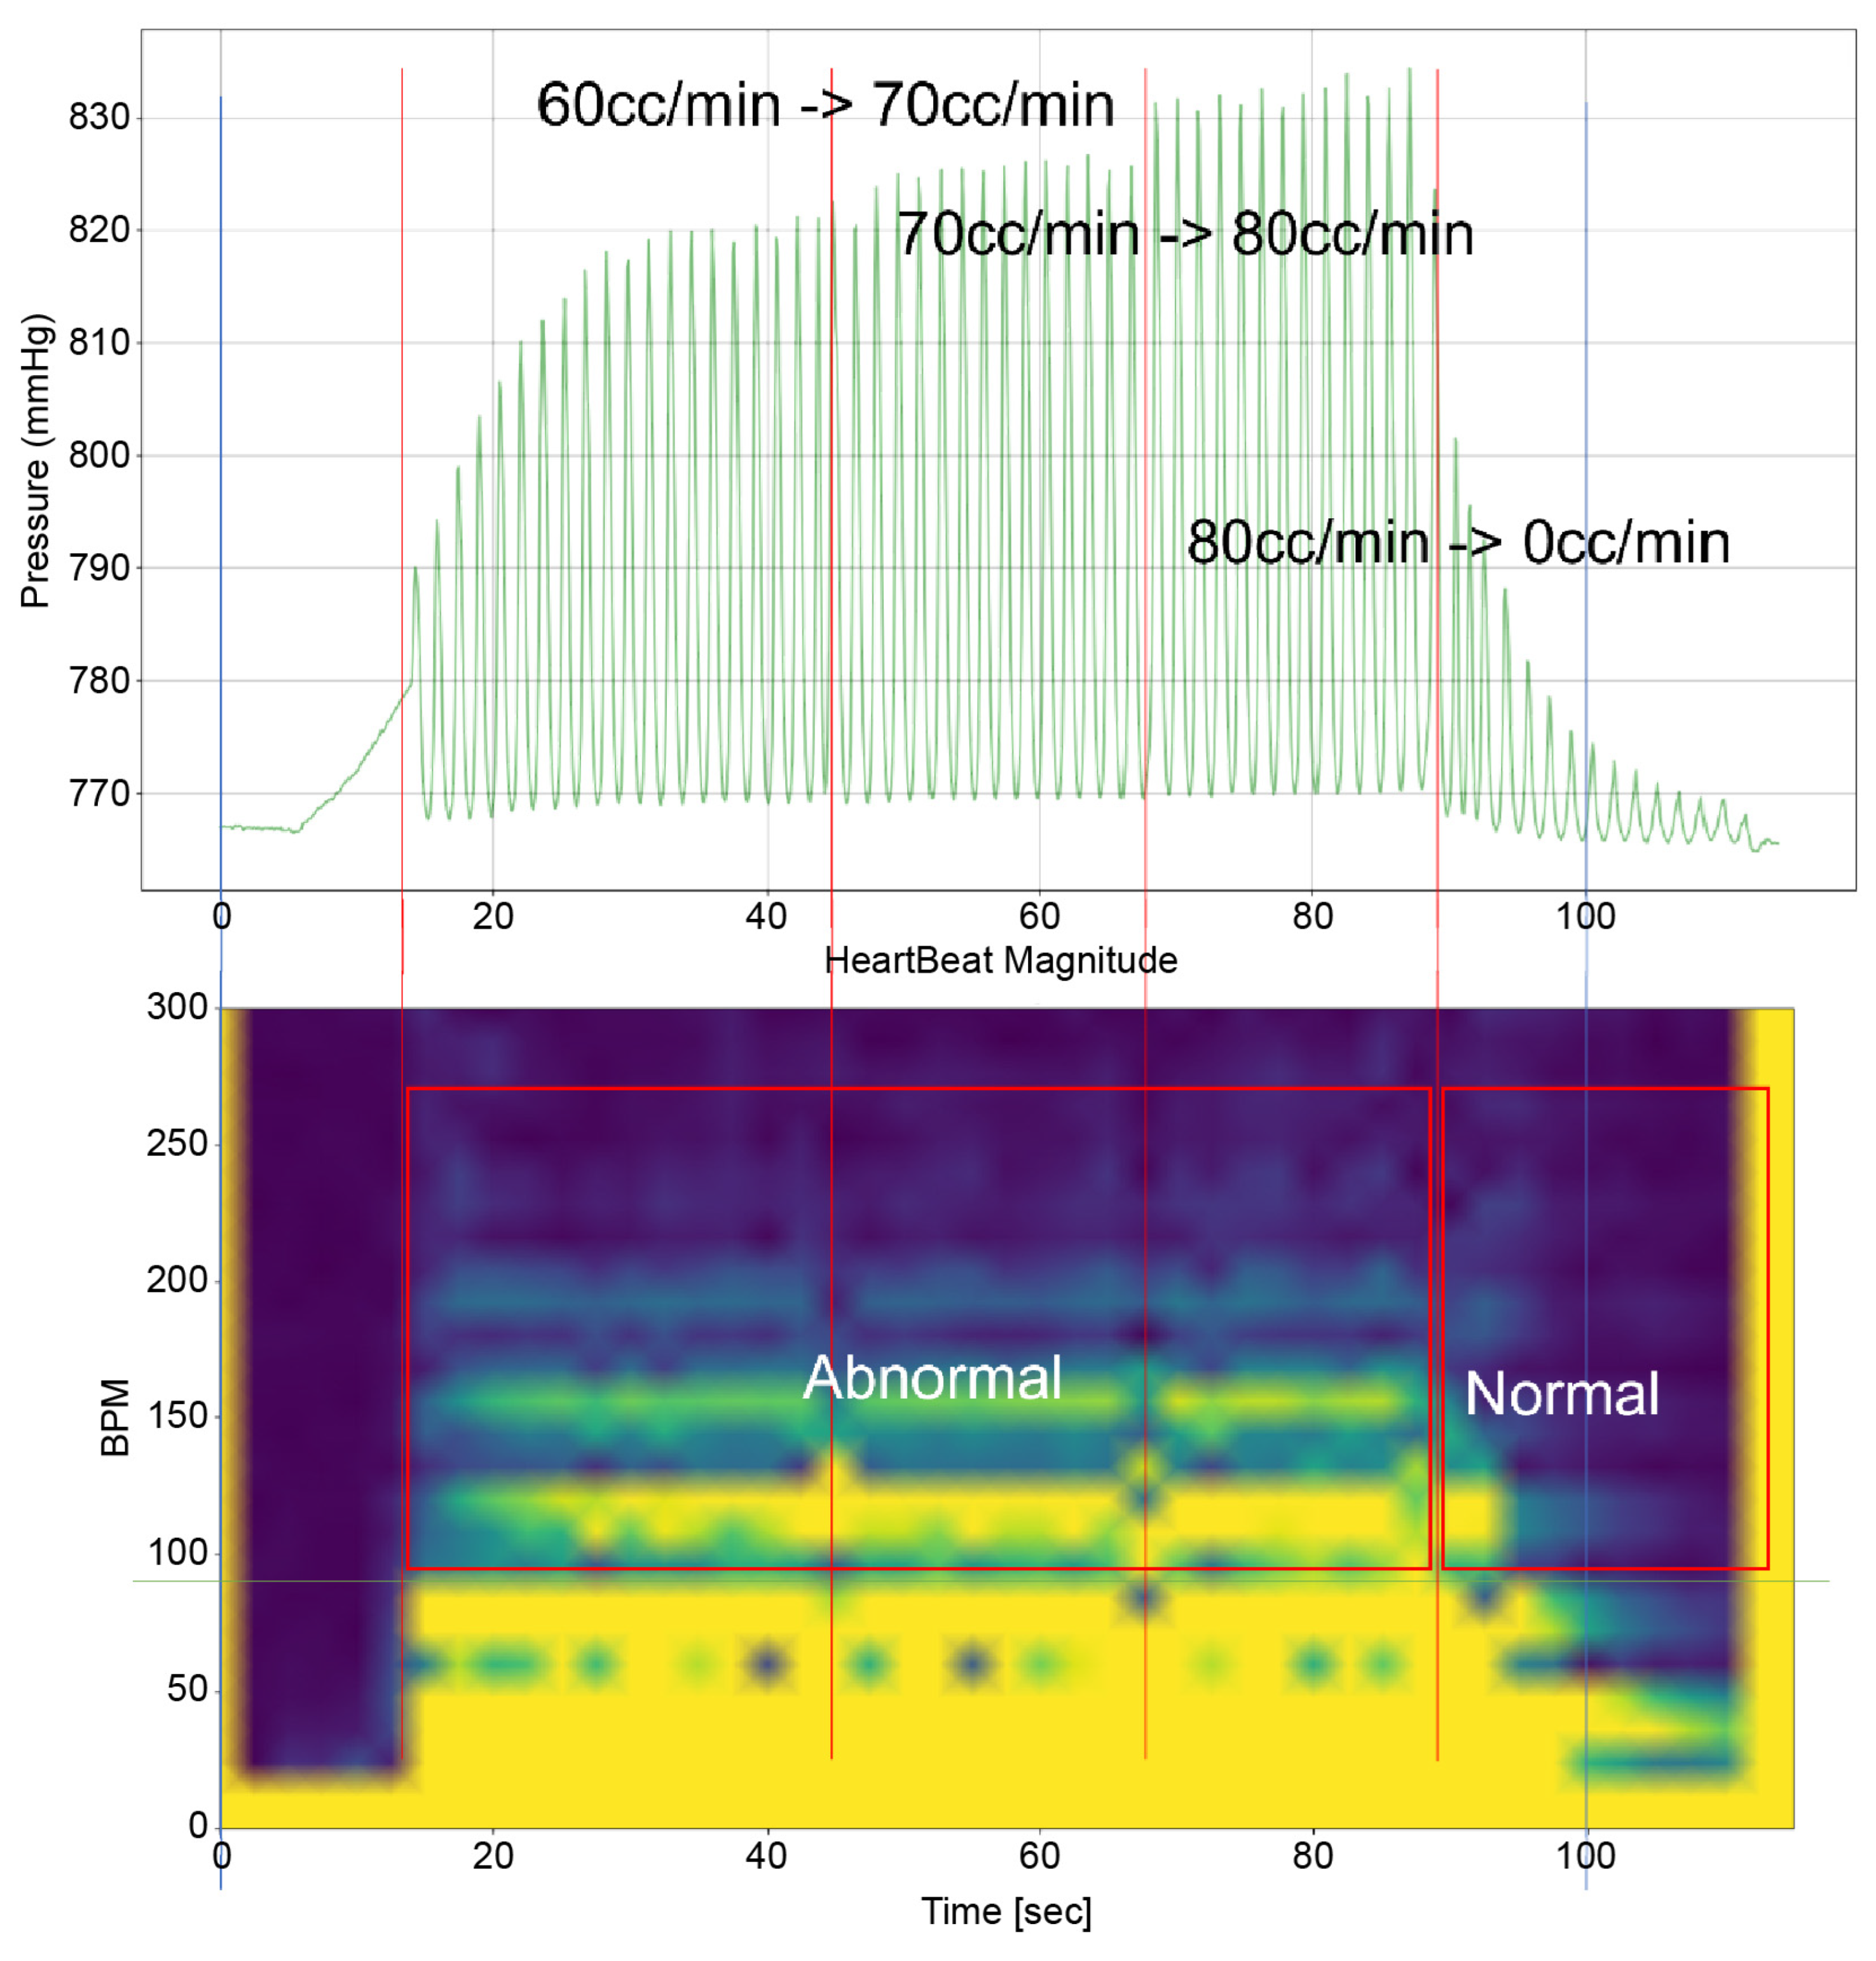
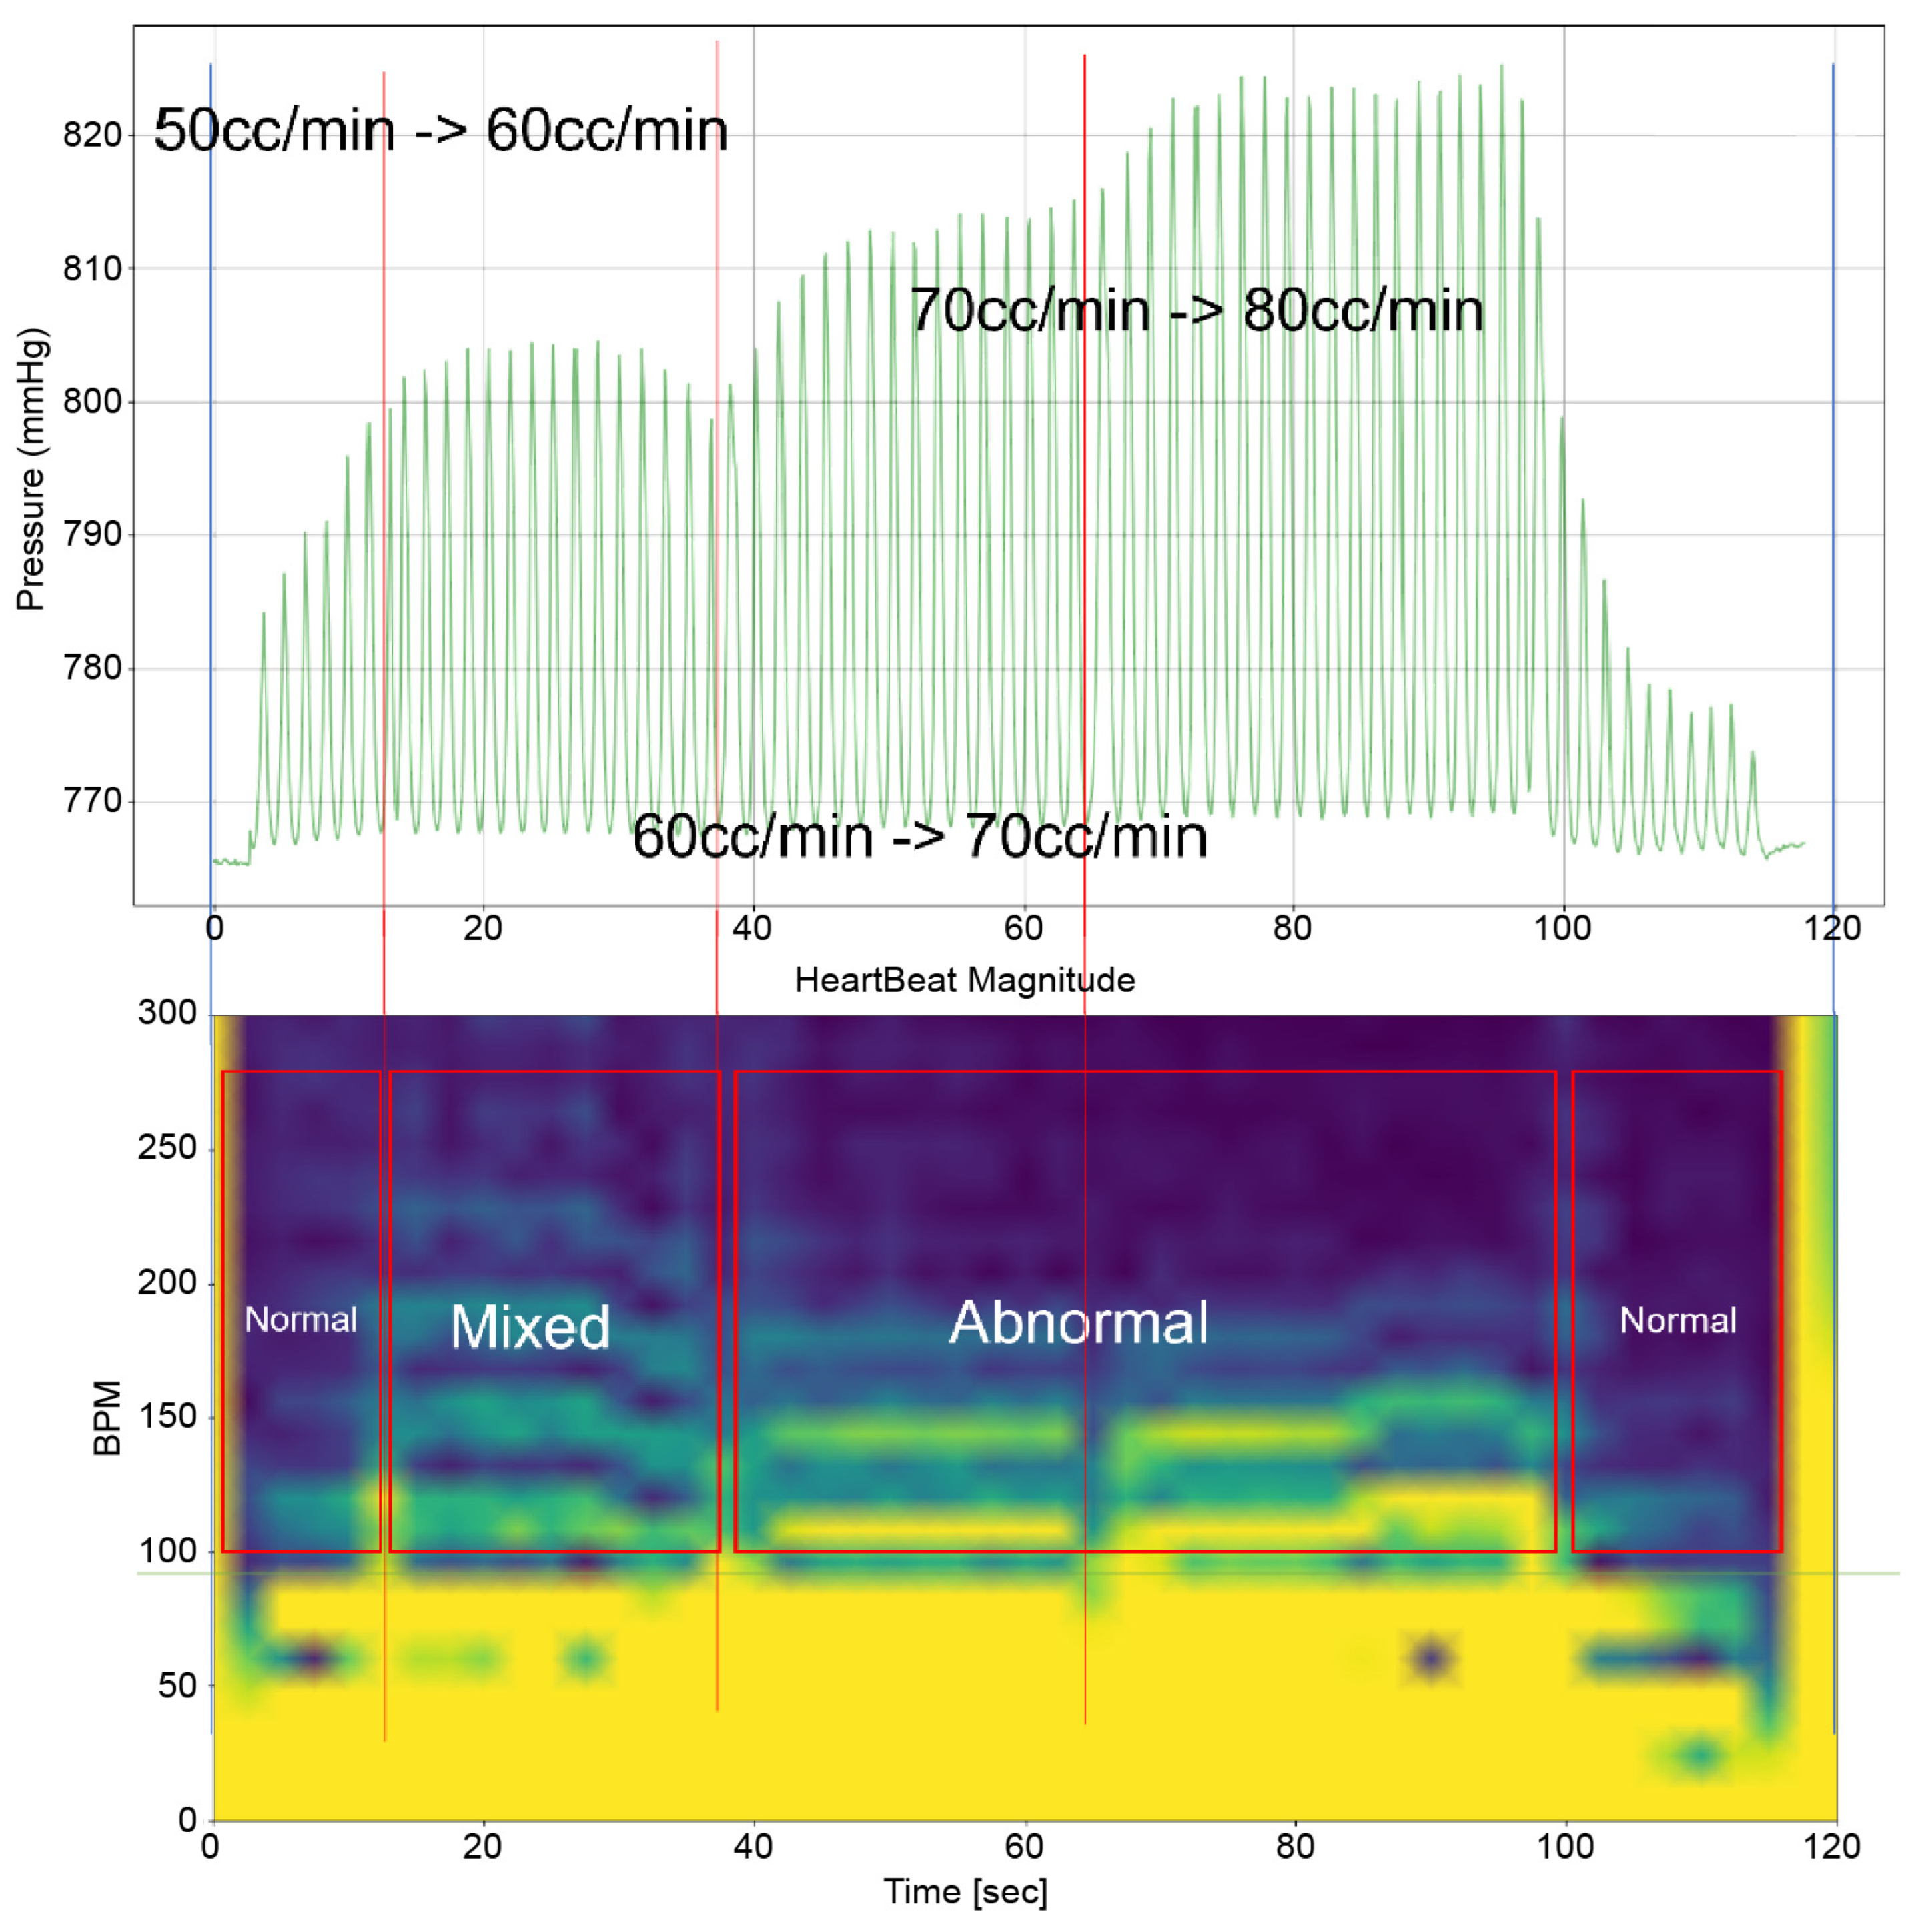
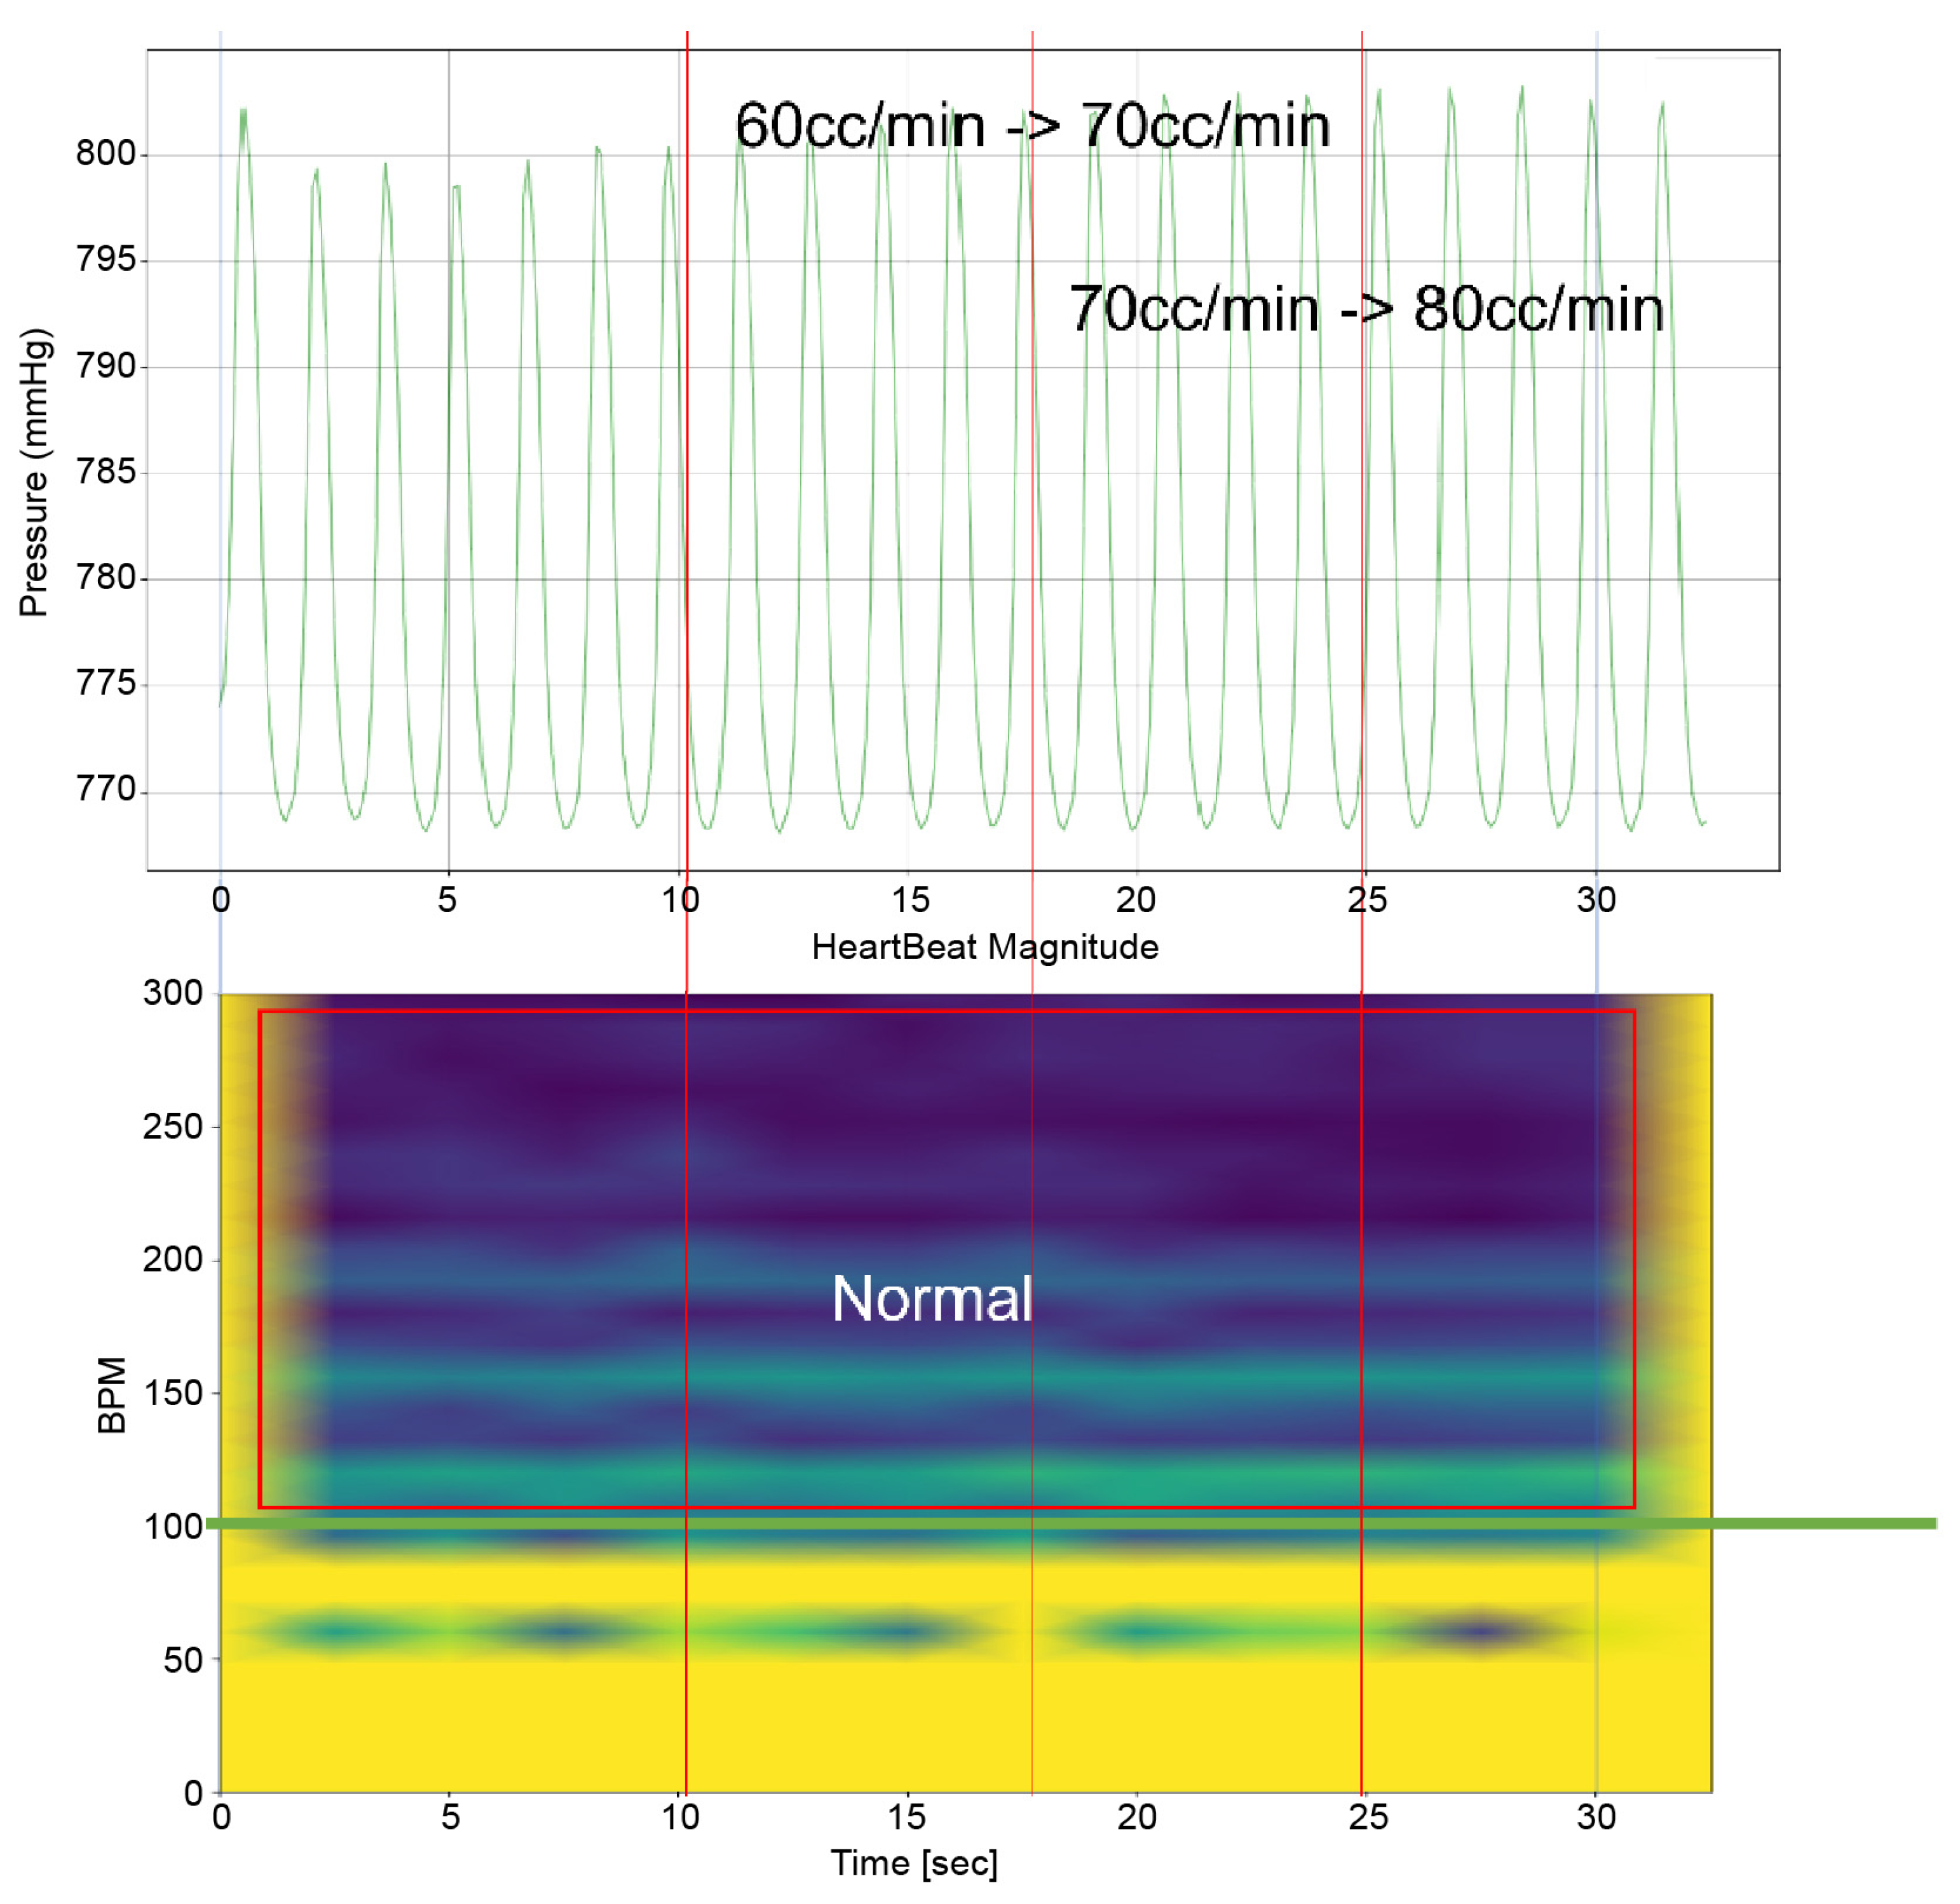
To analyze the results of this study, it is imperative to examine both the time-domain–pressure data graph for the atrium and the bpm-spectrum–time-domain data obtained through STFT(by python 3.9.9 scipy signal module 1.8.0) simultaneously. These data are exemplified in Figure 5. The pressure–time graph in this figure provides insights into the fluctuations in atrial pressure in response to changes in the intensity of the TRG. It allows us to observe the specific moments when the generator’s intensity changes and the resultant impact on atrial pressure.
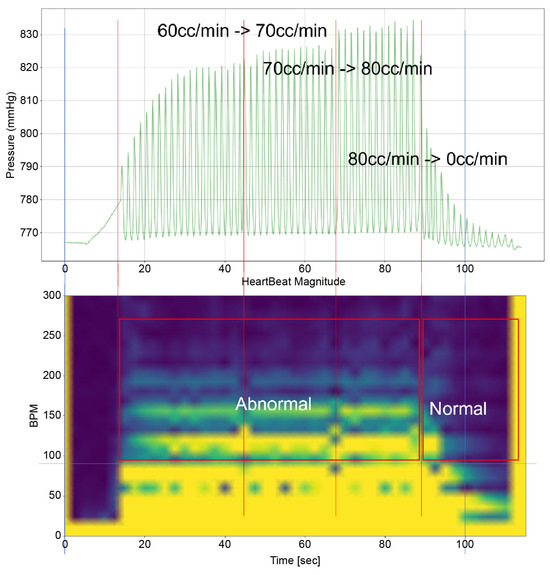
Figure 5.
An example of the heart simulation experiment result.
Furthermore, the bpm-spectrum–time graph depicted in Figure 5 enables the assessment of the distribution of atrial pressure amplitudes across different bpm at each moment. This analysis is crucial in identifying the bpm spectral regions that influence TR. Additionally, each spectral area in the graph is annotated to indicate the operational state of the TV—whether it is “Normal”, “Abnormal”, or in a “Mixed” state displaying both functionalities. This comprehensive approach, as illustrated in Figure 5, offers a nuanced understanding of the dynamic interplay between heart rate, atrial pressure, and TV functionality, which is pivotal in understanding the mechanisms of TR.
Time–Pressure Graph: This graph (upper graph in Figure 5) displays the pressure of the RA and RV over time. Superimposed on this graph is the flow rate from the TRG, indicating the severity of induced TR at various points. Red vertical lines highlight key moments, such as flow rate changes in the TRG. Each line signifies a specific adjustment time, with the corresponding flow rate changes annotated for reference.
Time–BPM Graph: This graph (lower graph in Figure 5) displays the frequency components of the RA and RV pressure signals over time, typically derived through the Short-Time Fourier Transform (STFT). The amplitude of these frequency components is expressed using a color gradient: blue denotes lower amplitude values; yellow represents higher amplitude values. This gradient provides an intuitive way to perceive the prominence of certain frequency components during the simulation.
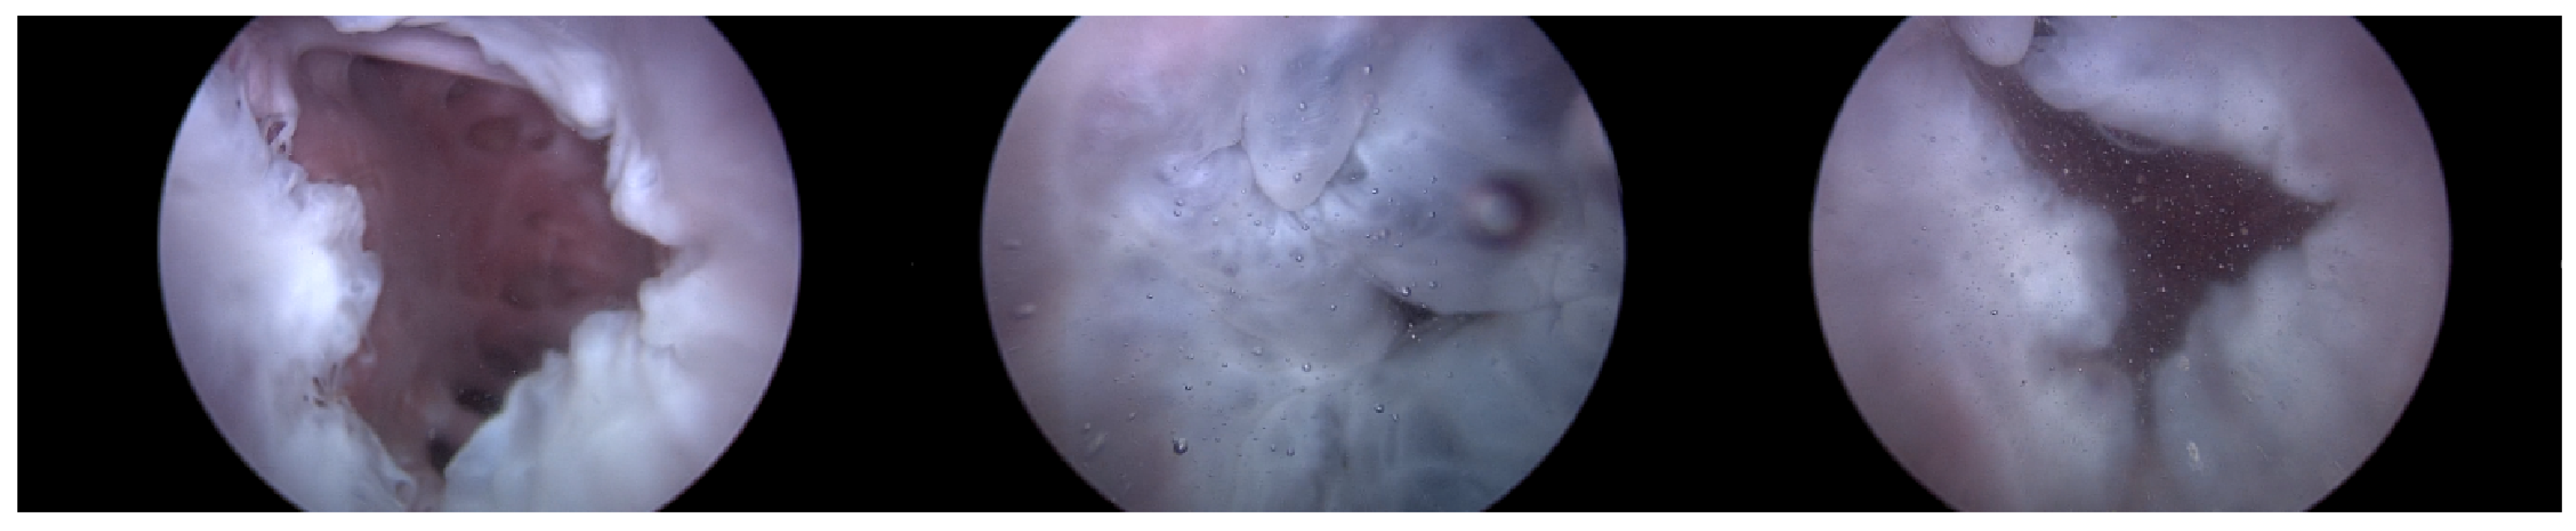
Endoscopic Image: During the experiment, the ability to adjust the intensity of TR using the TRG, as well as the changes made to the bpm, directly influenced the functionality of the TV. Real-time endoscopic imaging, as seen in Figure 6, was crucial in verifying the impact of these adjustments. This imaging technique allowed for the immediate observation of how alterations in the TR’s intensity or changes in the heart rate affected the TV’s performance. By providing a live visual feed, the endoscopic imaging enabled researchers to promptly ascertain whether the modifications being applied—either through the TRG or by adjusting the bpm—effectively influenced the valve’s operation. This real-time monitoring was essential for ensuring that the experimental conditions were accurately met and validating the immediate effects of these adjustments on the TV’s functionality.
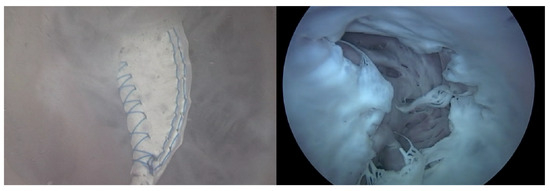
Figure 6.
Endoscopic image of tricuspid valve function.
Out of the data from these 15 hearts, recurring patterns in the atrial pressure signals were specifically noted. Heart 1 provided data representing a pure heart condition without the Pivot-TR device. Similarly, Heart 2 offered atrial pressure signal data in two scenarios: one without the Pivot-TR, akin to Heart 1, and the other with the Pivot-TR installed. These two scenarios were analyzed and are described separately to understand the differences and impacts of the Pivot-TR device.
3.1. First Scenario—Heart 1
Heart 1 in Figure 7 represents a porcine heart that exhibits normal cardiac activity. This heart was employed to determine if the heart simulator could induce the typical functionality of the TV. Furthermore, by adjusting the TRG’s flow rate, we intended to ascertain the boundary conditions under which TR is generated.
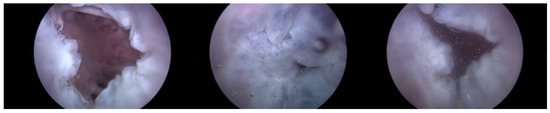
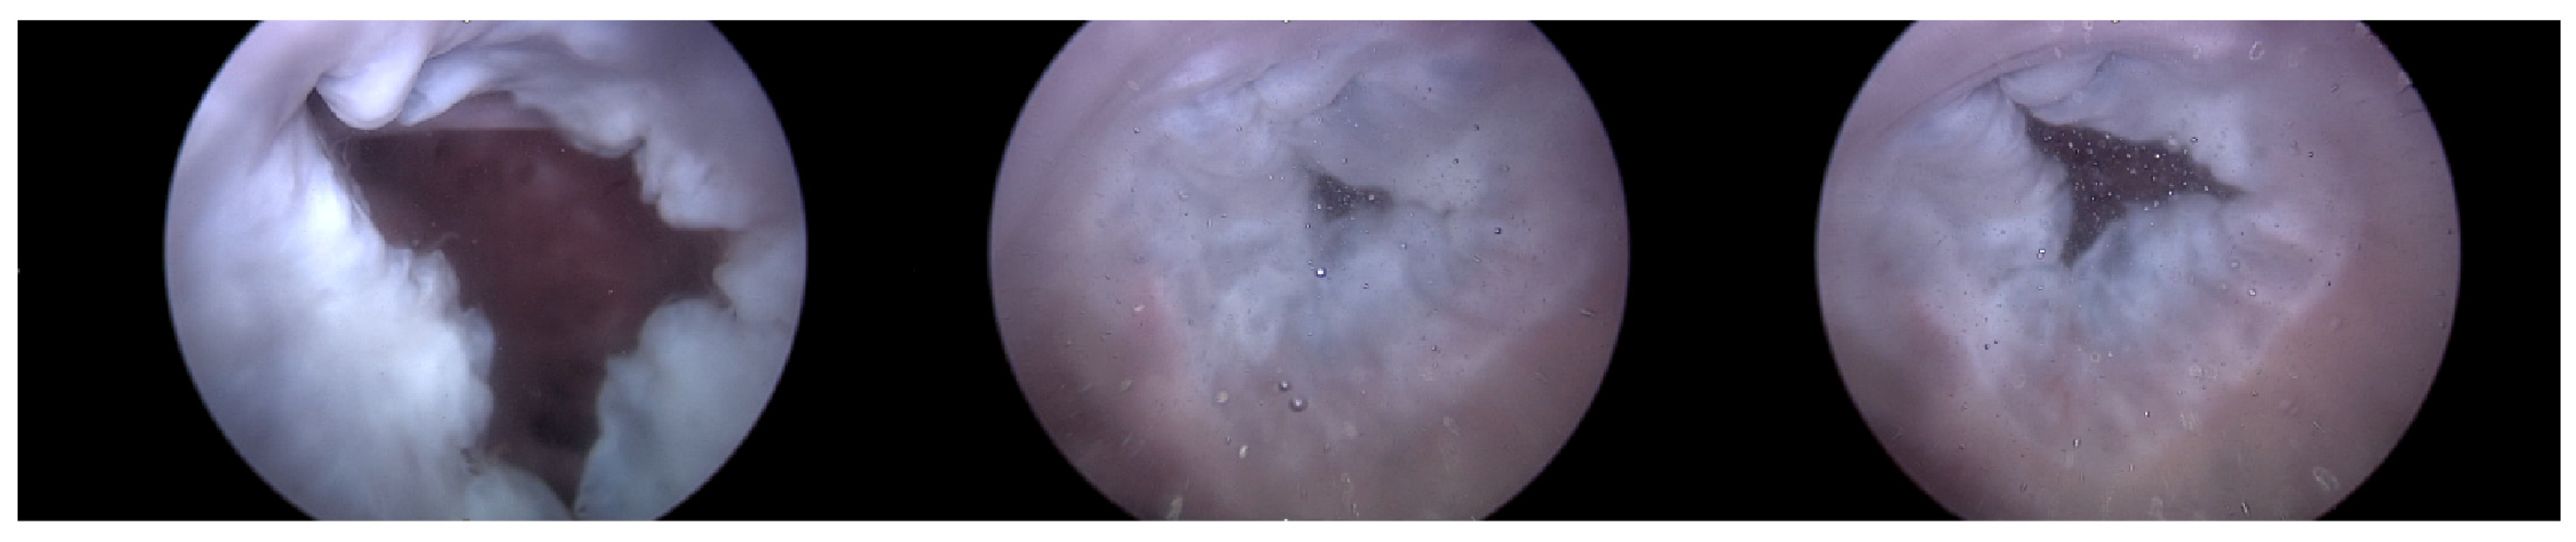
Figure 7.
Endoscopic image of Heart 1 (valve open, normal valve closed, abnormal valve closed).
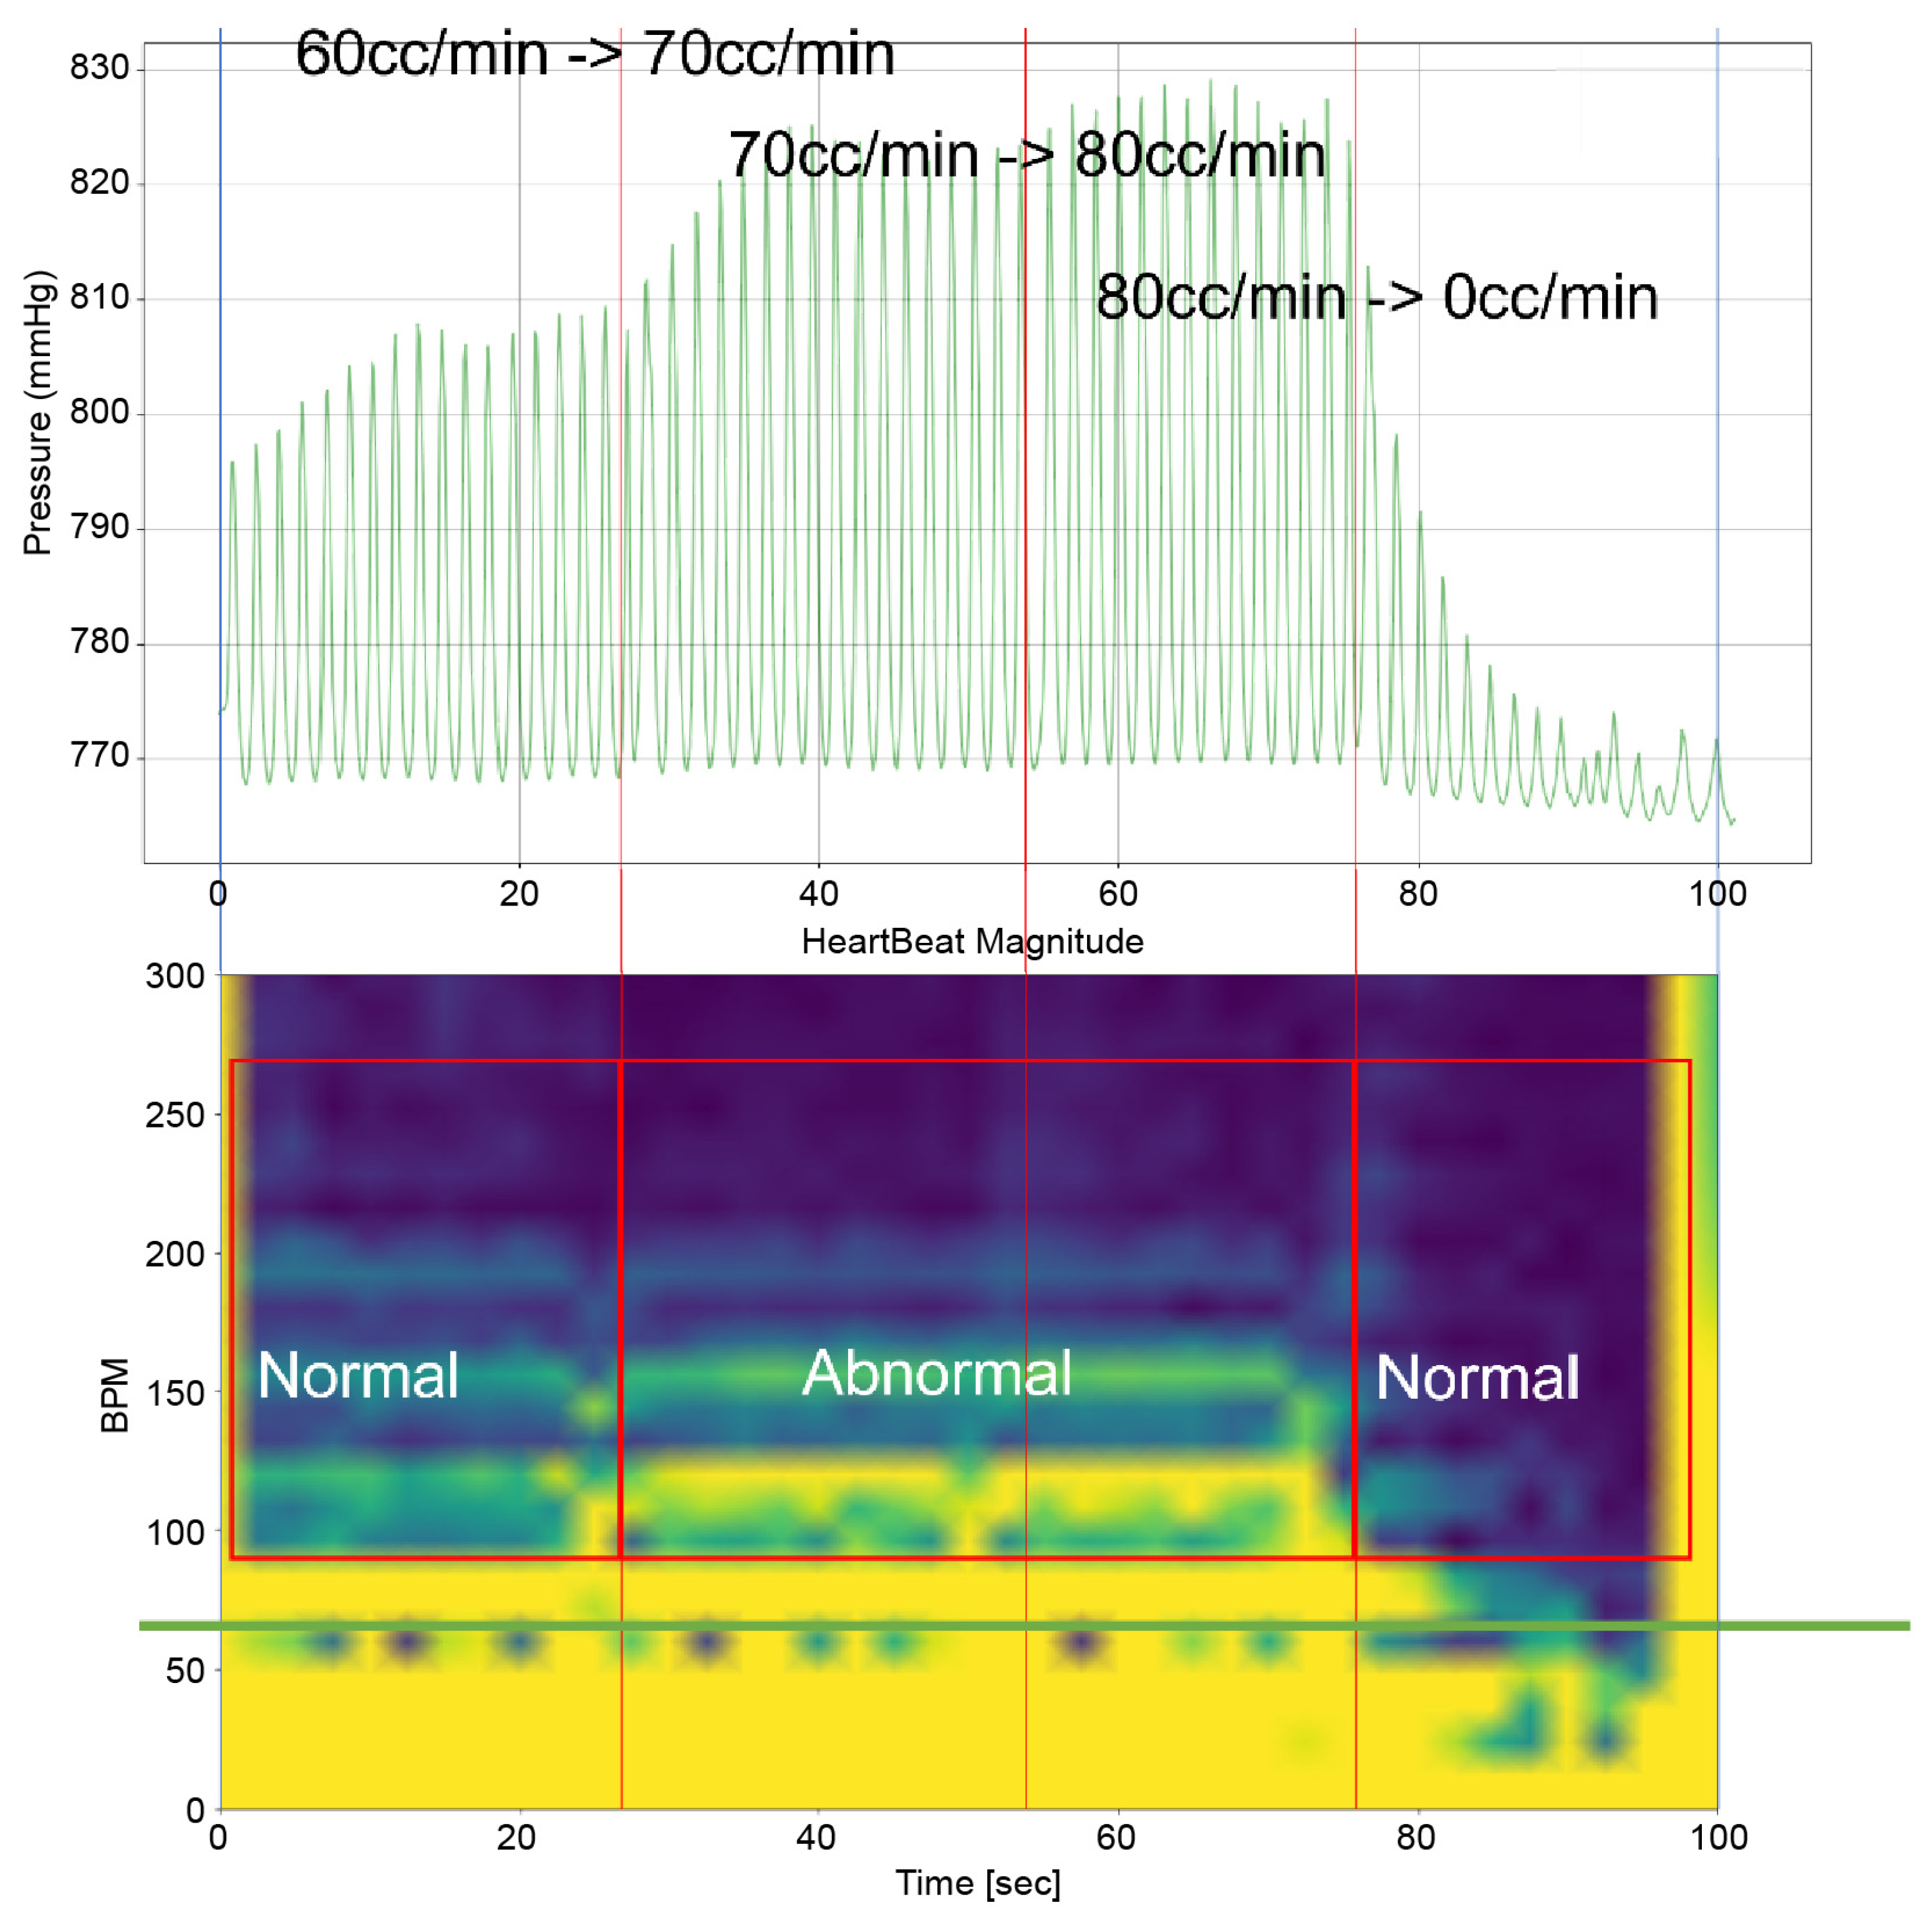
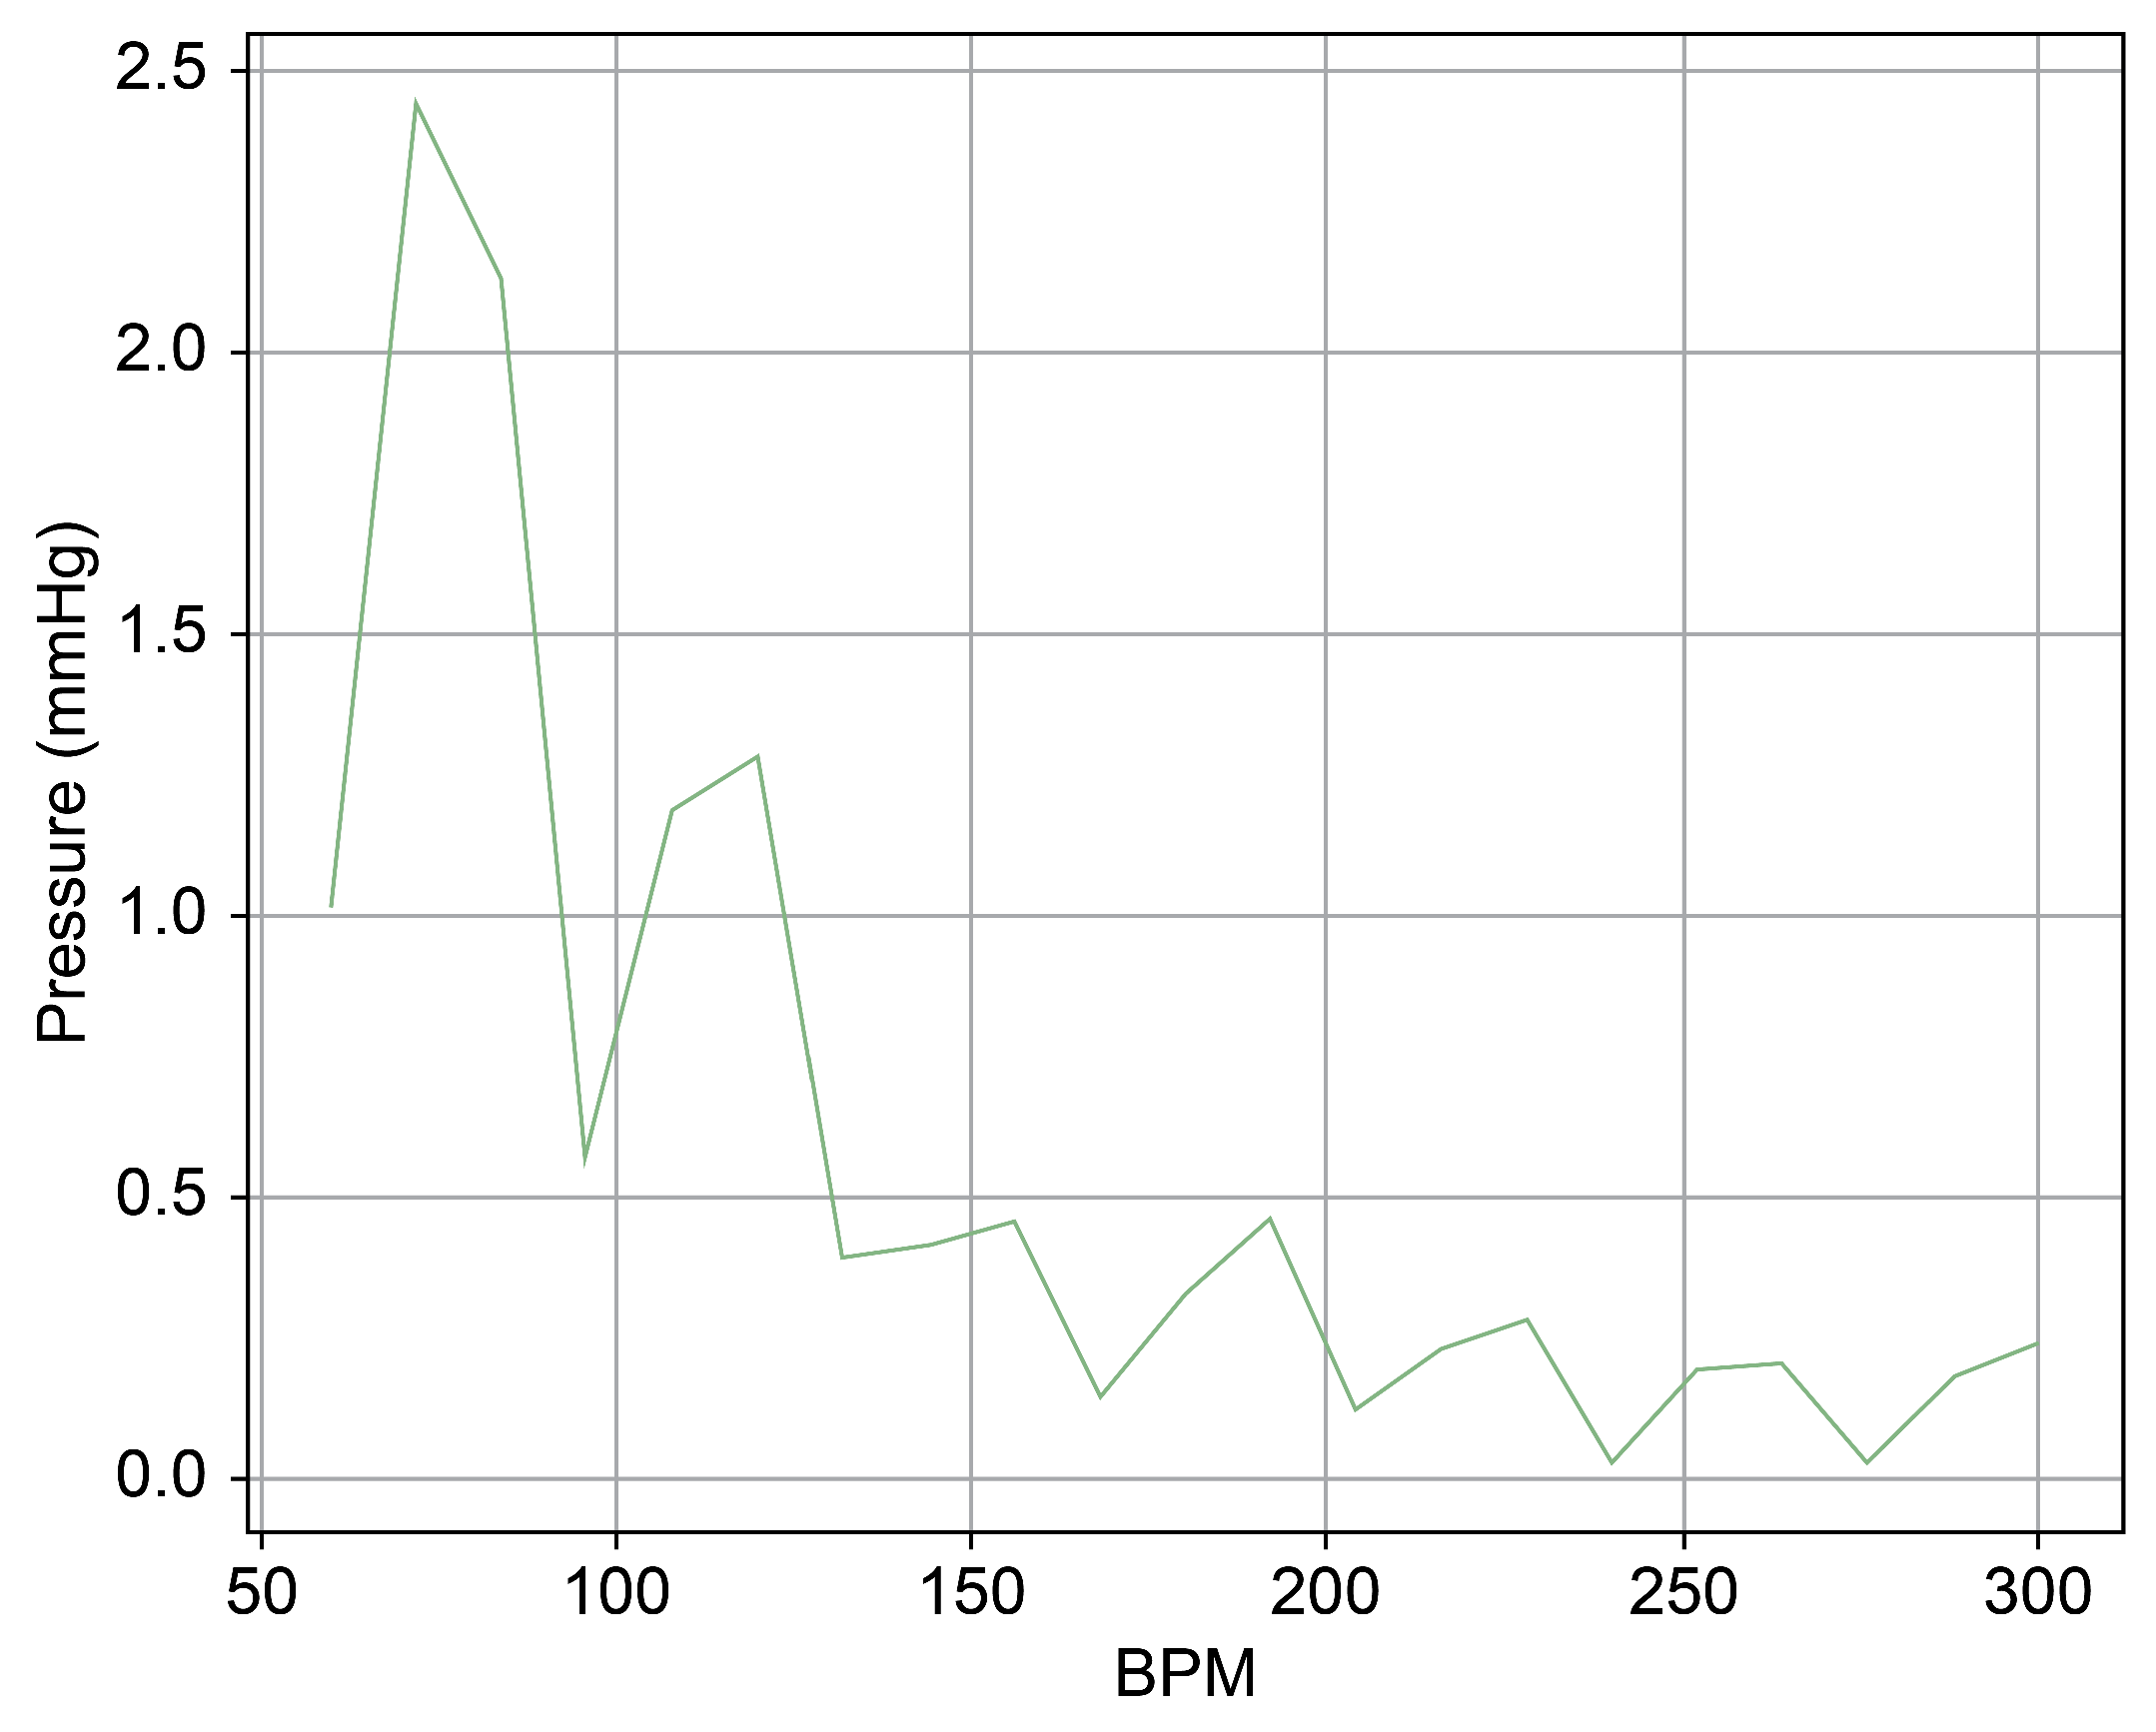
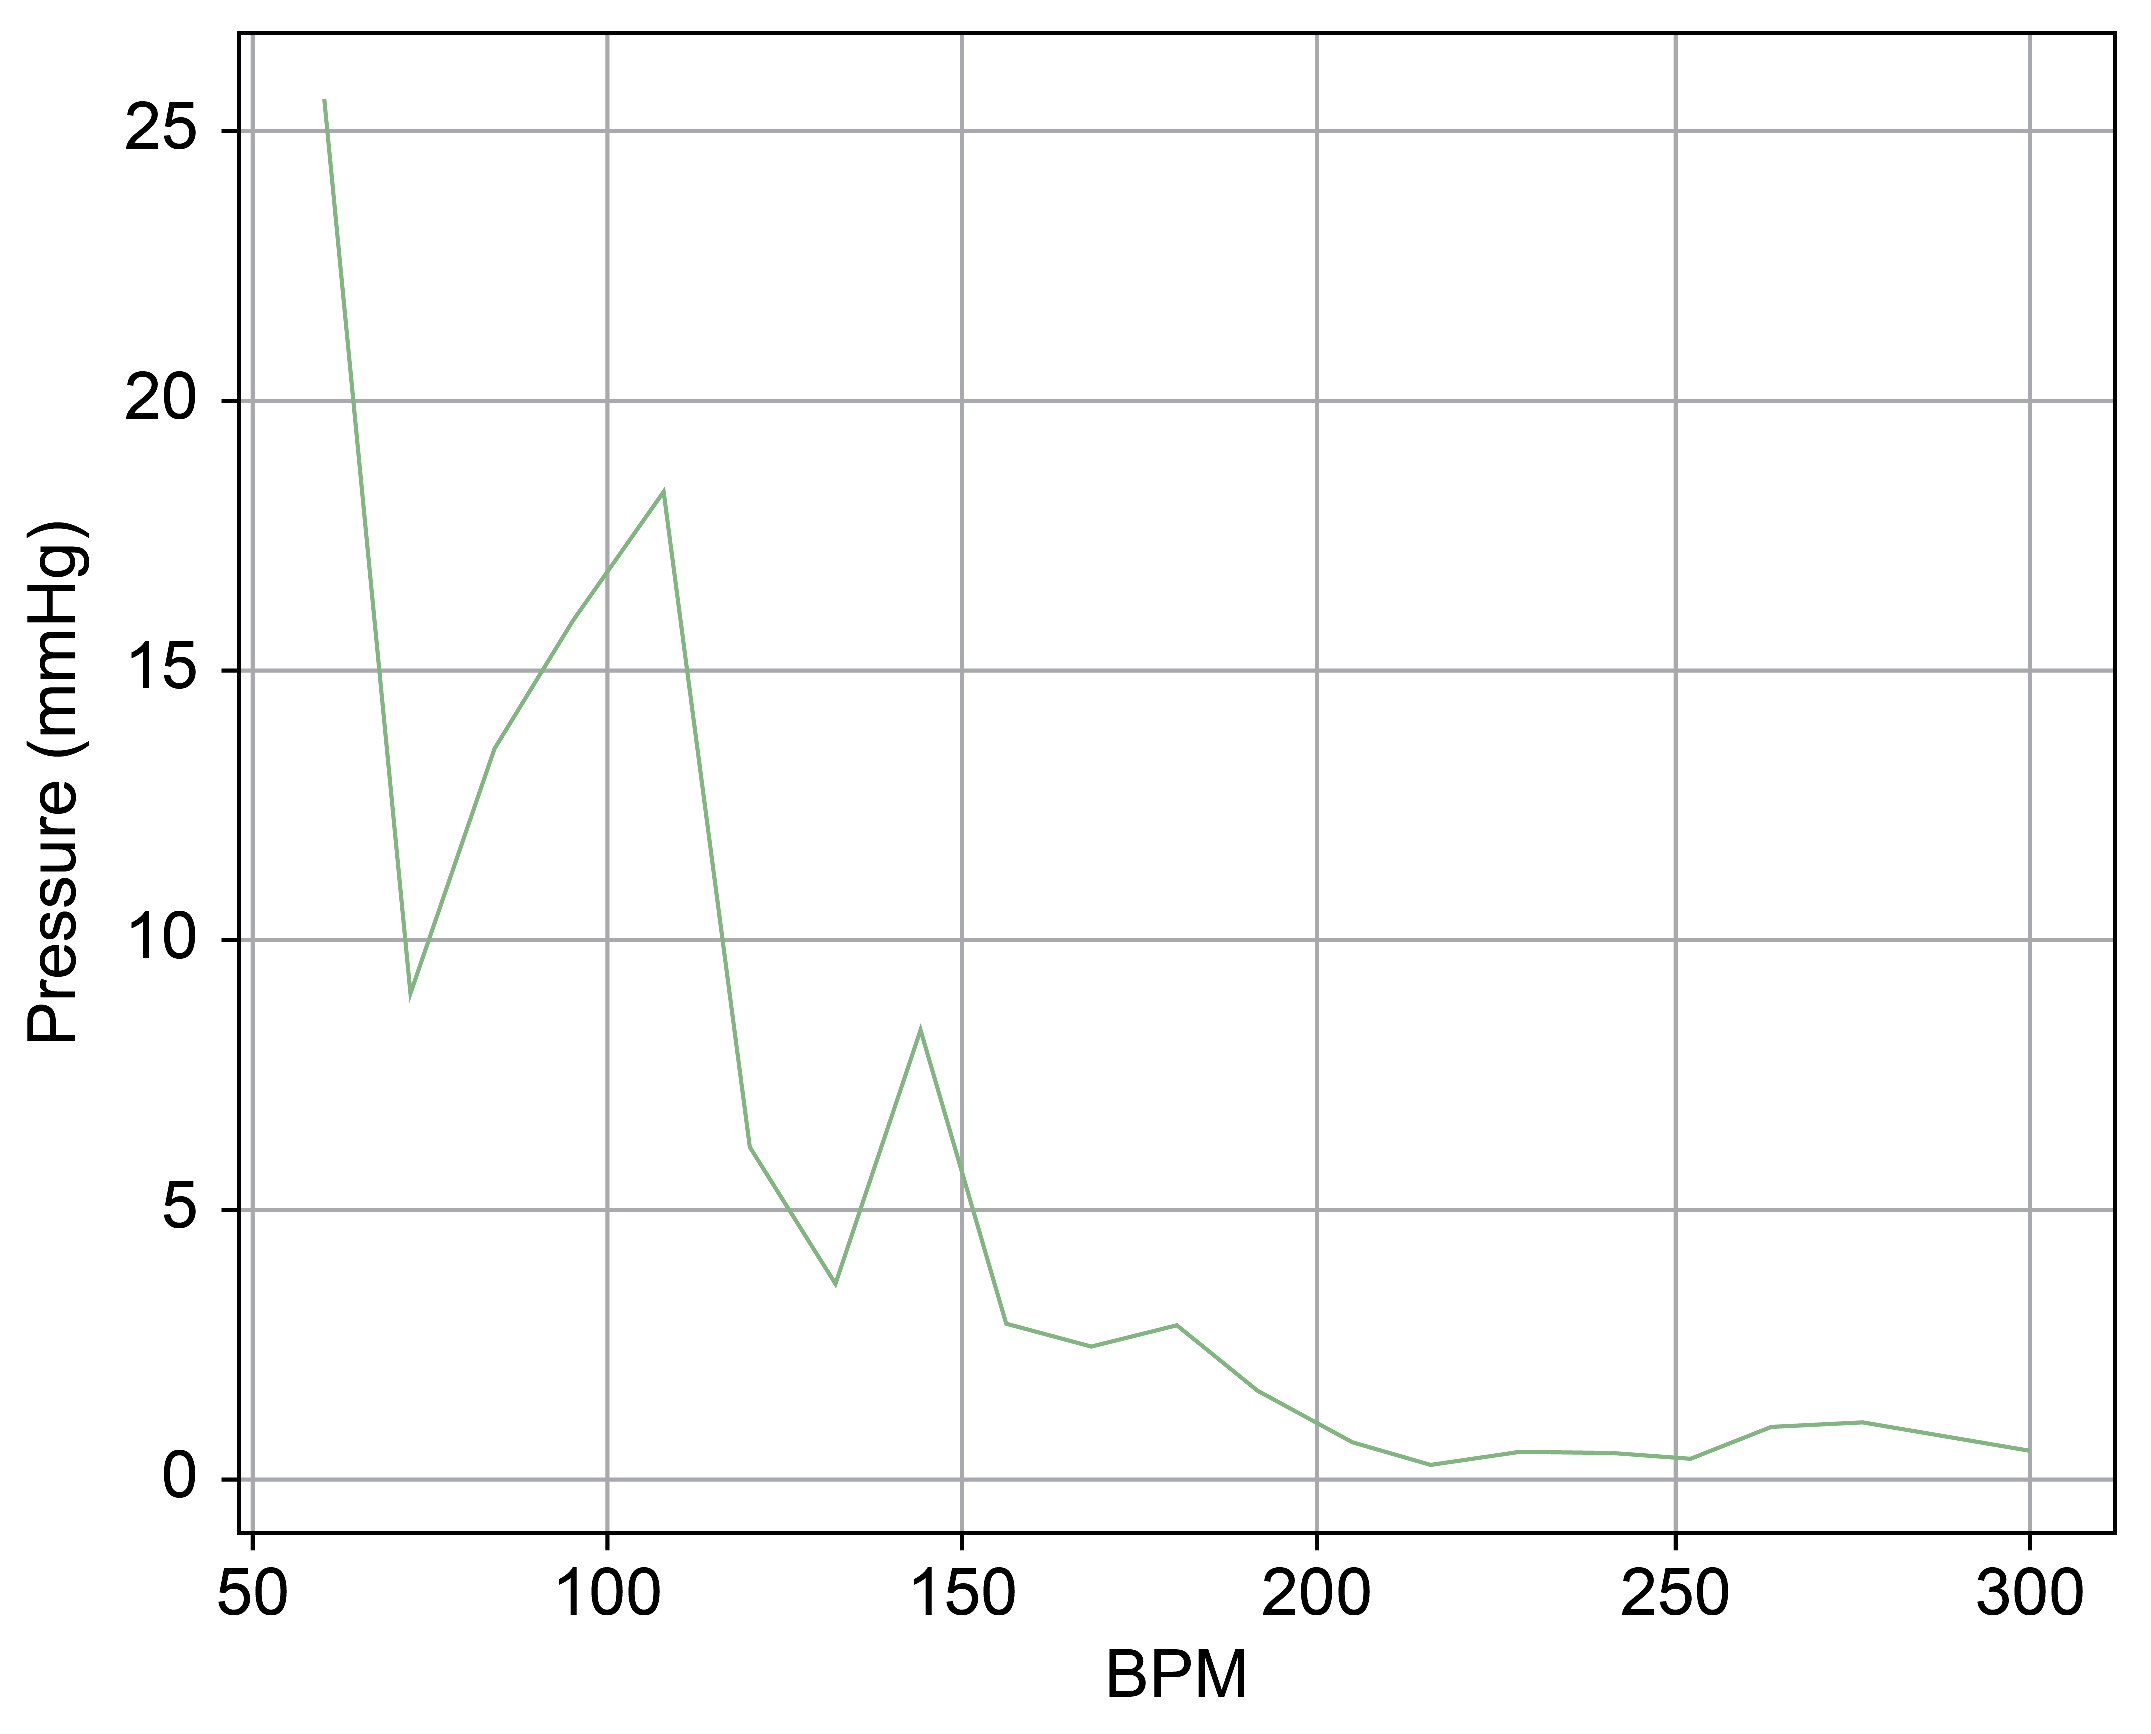
As can be observed in Figure 8, up to a flow rate of 60 cc/min from the TRG, the TV of Heart 1 maintained its normal functionality. This was validated by the endoscopic images, as displayed in Figure 7. An induction of TR was discernible on elevating the flow rate to 70–80 cc/min; however, upon turning off the TRG, the TV reverted to its normal function. This behavior was consistent, reaffirmed by subjecting the system to the same conditions thrice, with 10 min intervals between each test. Figure 9 presents a cross-sectional view of the spectrum graph from Figure 8 during the normal phase, while Figure 10 illustrates a similar cross-sectional view but during the abnormal phase. The two figures show a noticeable discrepancy in the amplitude values between 50 and 100 bpm. Specifically, the maximum amplitude values differ tenfold, registering approximately 2.4 mmHg in the standard phase and 25 mmHg in the abnormal phase.
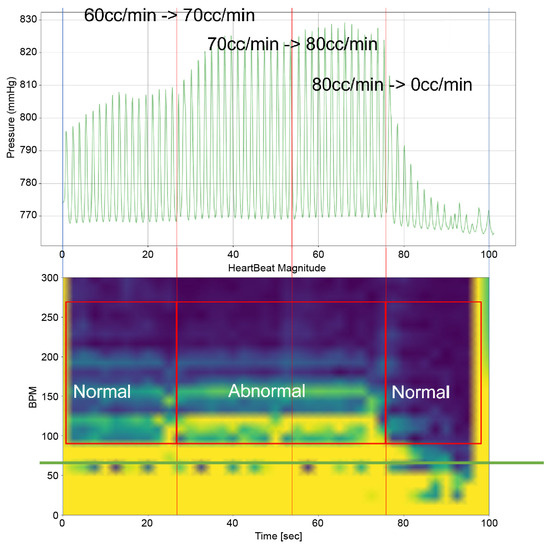
Figure 8.
Heart simulation experiment result of Heart 1.
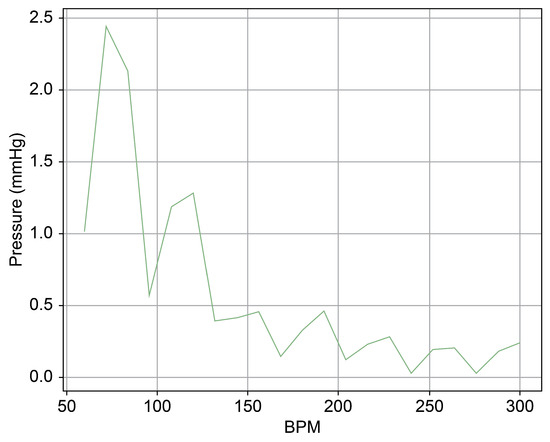
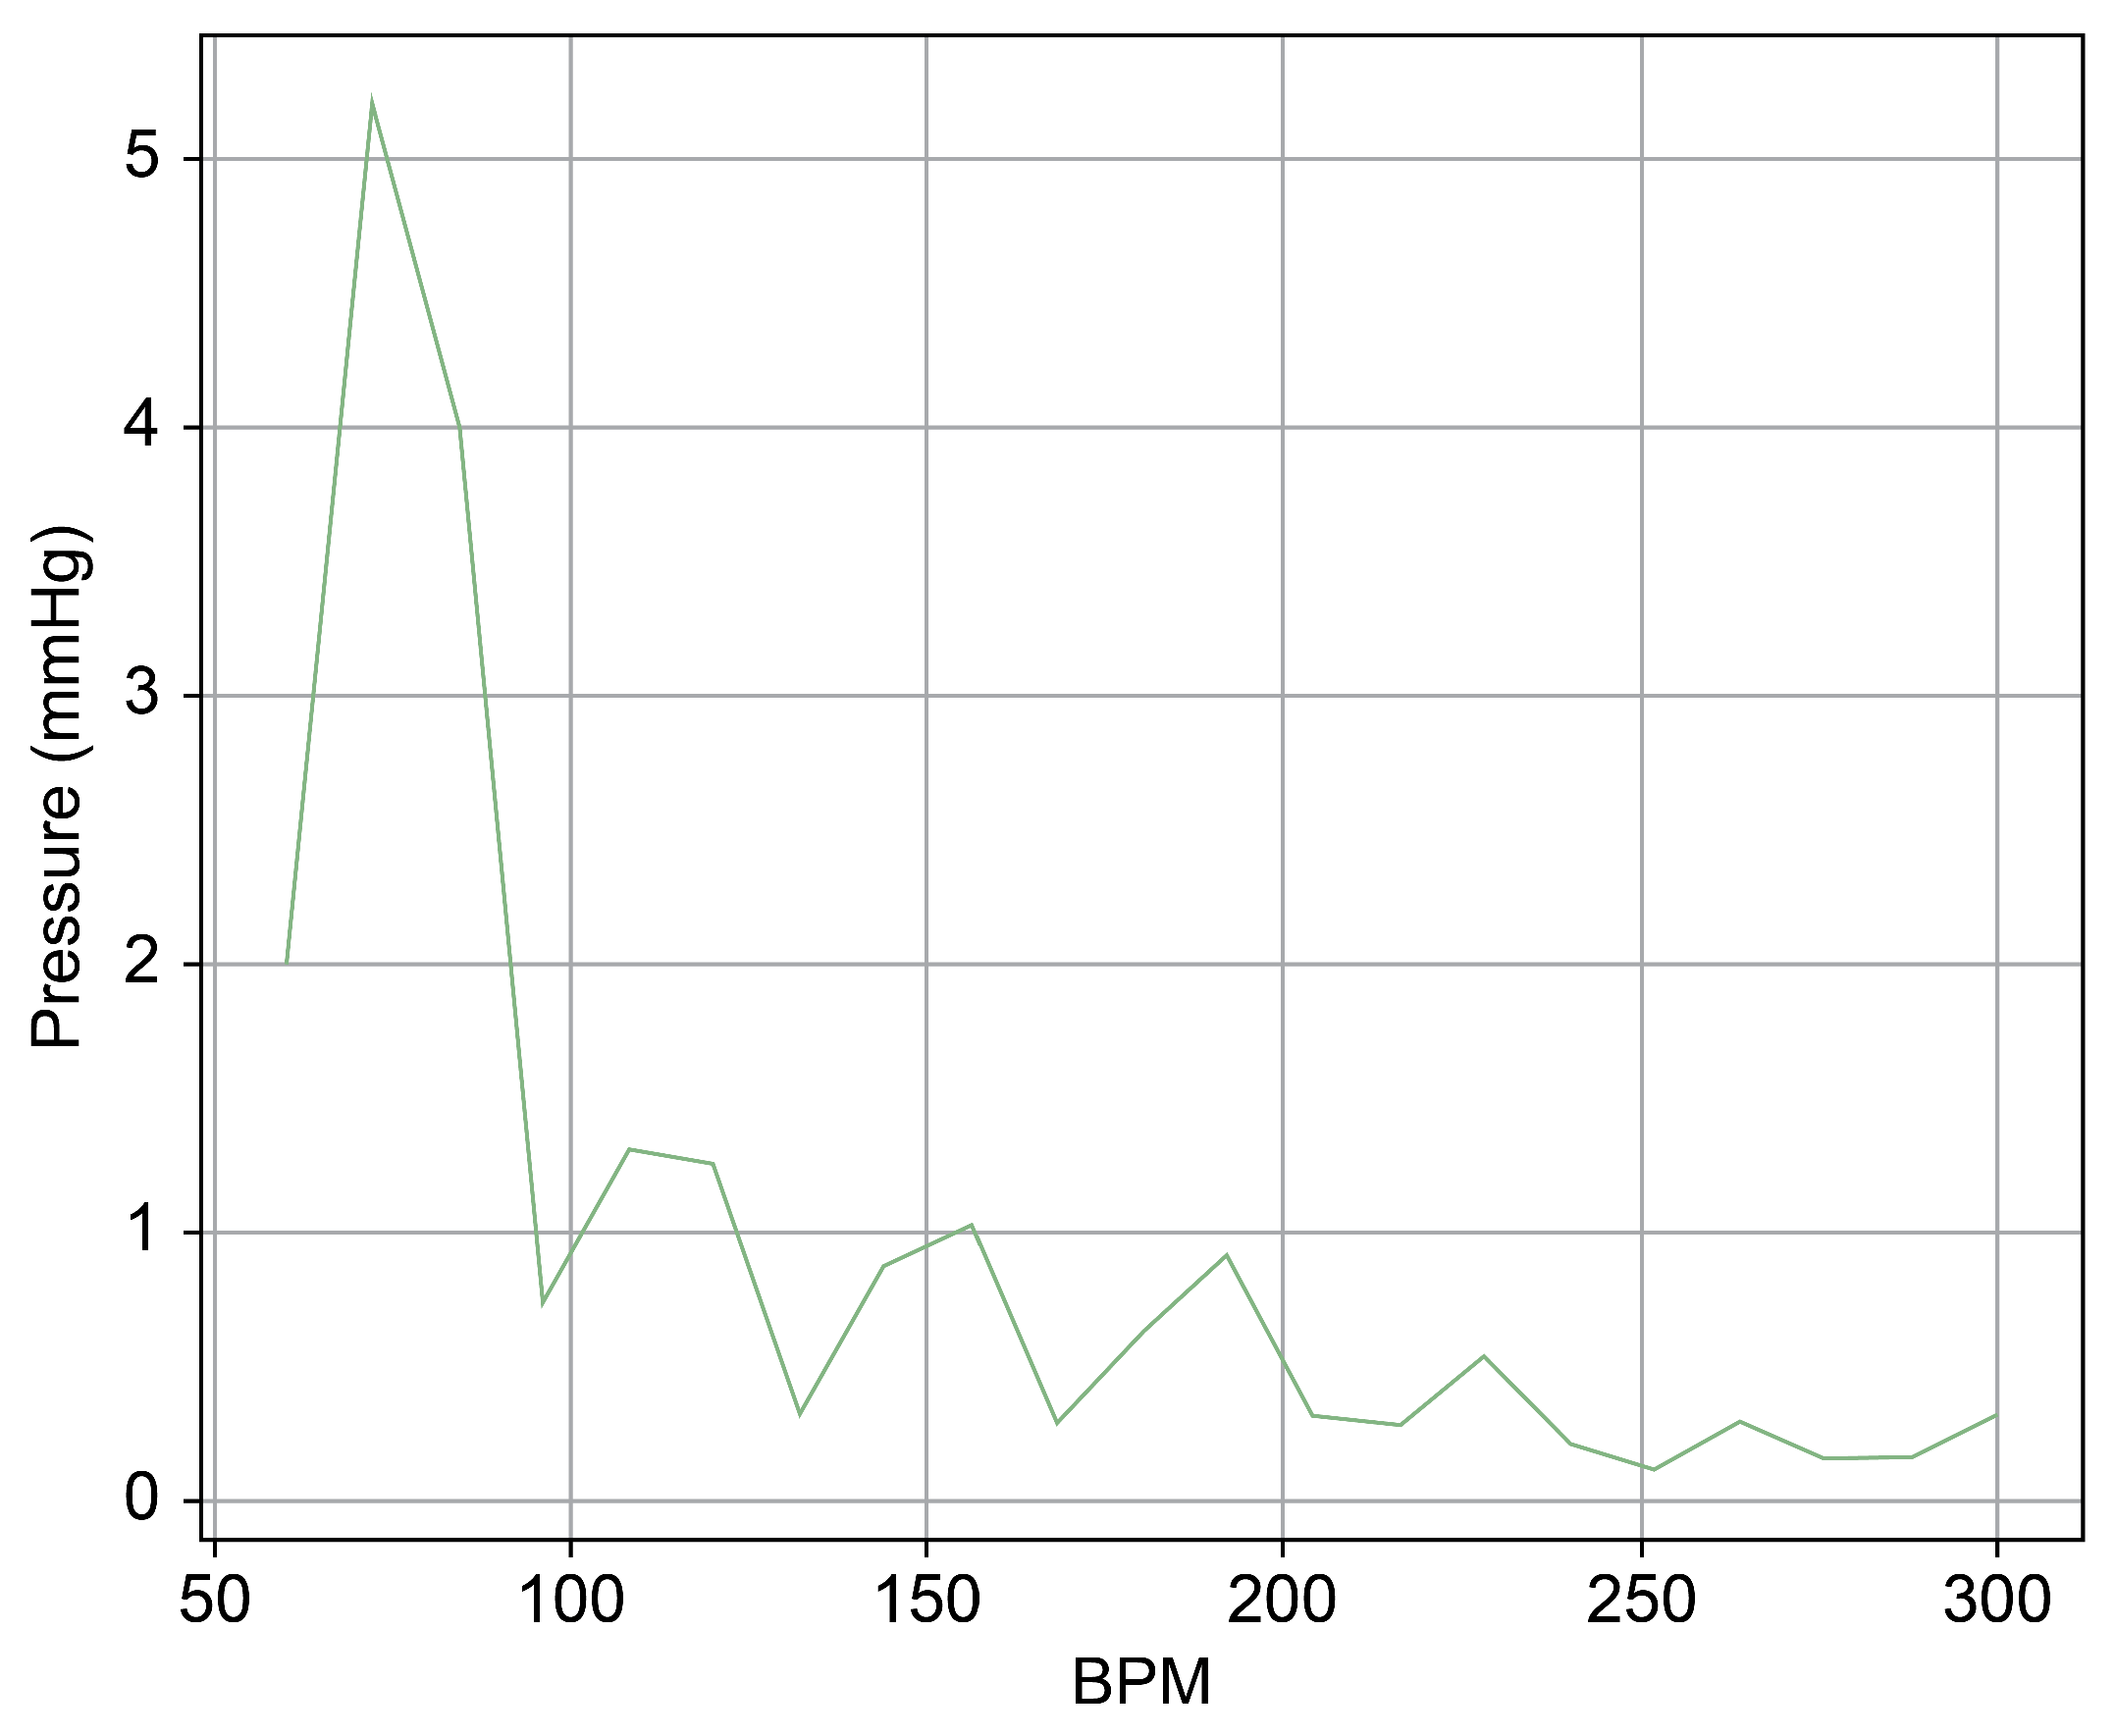
Figure 9.
Spectrum cross-section of normal phase of Heart 1.
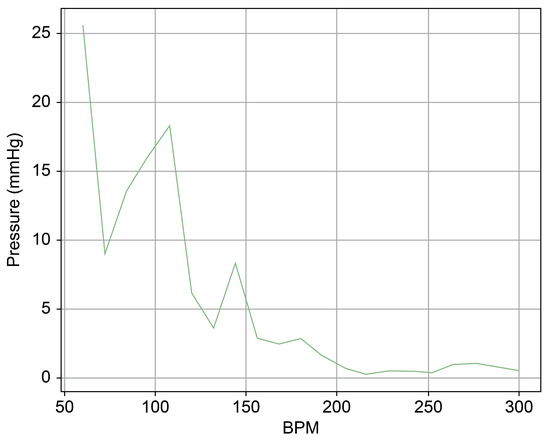
Figure 10.
Spectrum cross-section of abnormal phase of Heart 1.
In Figure 9 and Figure 10, the region below 50 bpm was deliberately omitted. This particular region predominantly represents the pressure created by the Harmonic Vibration Pump. As a result, discerning the influence of the TRG within this range becomes challenging. Furthermore, this region’s scale did not align congruently with the other ranges, complicating the comparative analysis. For the sake of clarity and coherence in representation, it was thus removed.
3.2. Second Scenario—Heart 2 without the Pivot-TR
Heart 2 in Figure 11, like Heart 1, represents a porcine heart exhibiting standard cardiac functions. It was employed to verify whether the heart simulator could consistently reproduce results comparable to those observed with Heart 1. Furthermore, experiments were planned with Pivot-TR installed. Figure 12 reveals results that closely resemble those of Figure 8. However, a distinct variation was observed with Heart 2. Unlike Heart 1, the TV displayed alternating patterns of normal and abnormal functionalities—a phenomenon subsequently termed the “Mixed phase”. A notable observation was that when the flow rate of the Harmonic Vibration Pump increased from 60 to 70 cc/min, only abnormal TV activity was evident.

Figure 11.
Endoscopic image of Heart 2 (valve open, normal valve closed, abnormal valve closed).
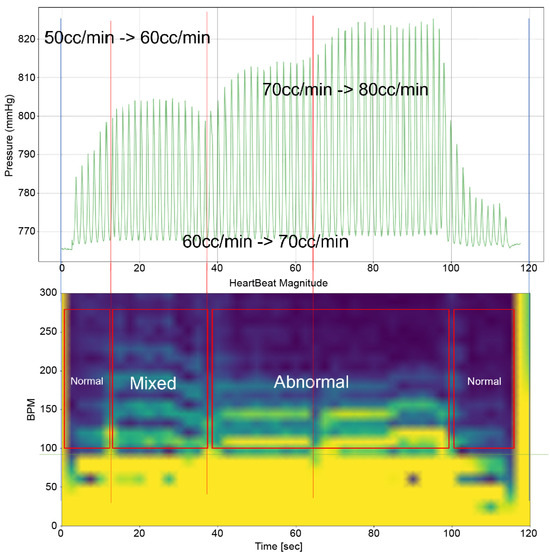
Figure 12.
Heart simulation experiment result of Heart 2.
This insight led to an inference. There are hearts, like Heart 1, where the boundary conditions for TR are narrowly distributed. In contrast, there are hearts, like Heart 2, where these conditions are more broadly dispersed.
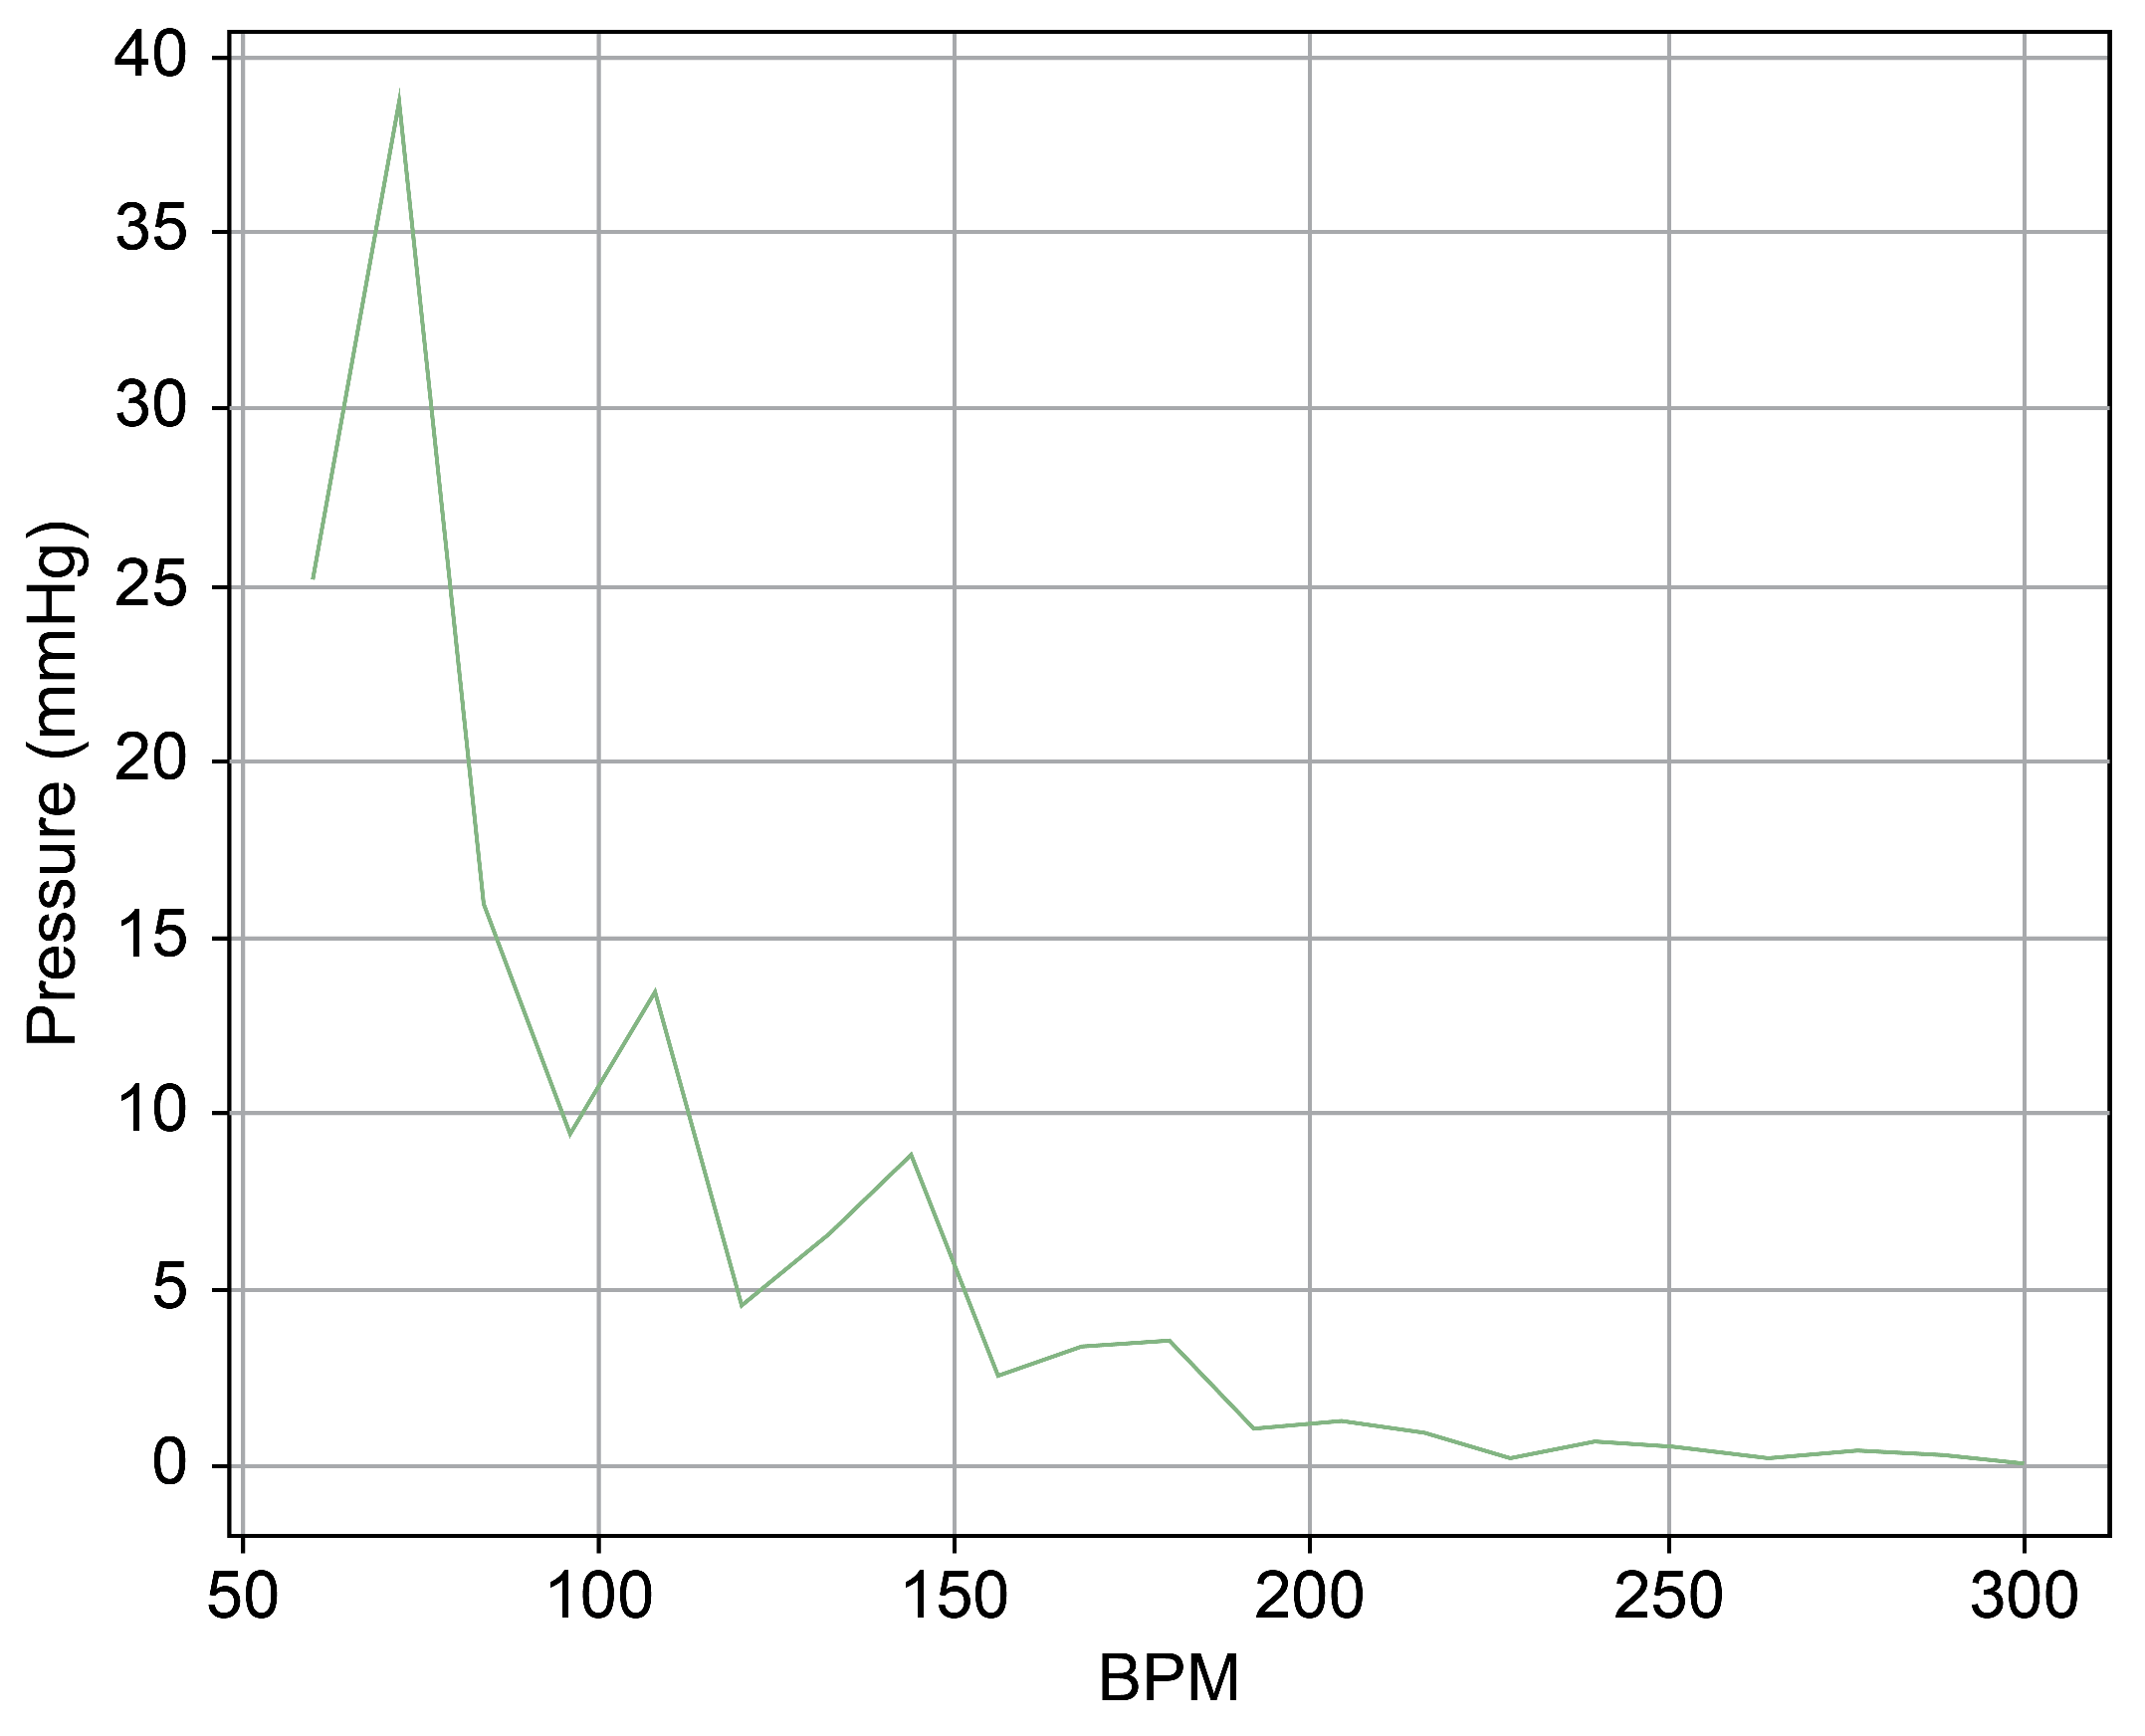
Figure 13 provides a cross-sectional view of the spectrum graph from Figure 12 during the normal phase. Similarly, Figure 14 represents the abnormal phase from the same spectrum graph. A comparative analysis between the two highlighted a significant deviation in amplitude values between 50 and 100 bpm. The peak amplitude values displayed a more than sevenfold disparity, measuring approximately 5.1 mmHg during the standard phase and 38 mmHg during the abnormal phase.
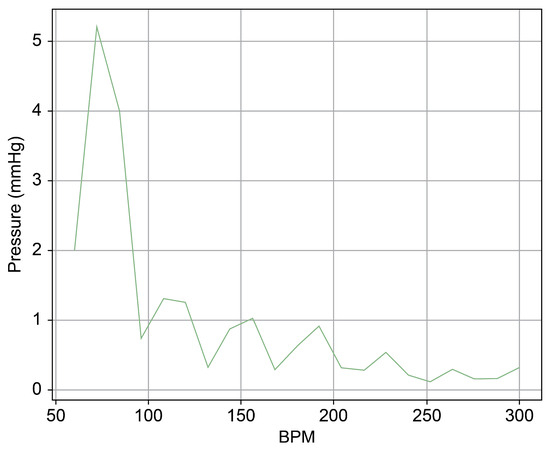
Figure 13.
Spectrum cross-section of normal phase of Heart 2.
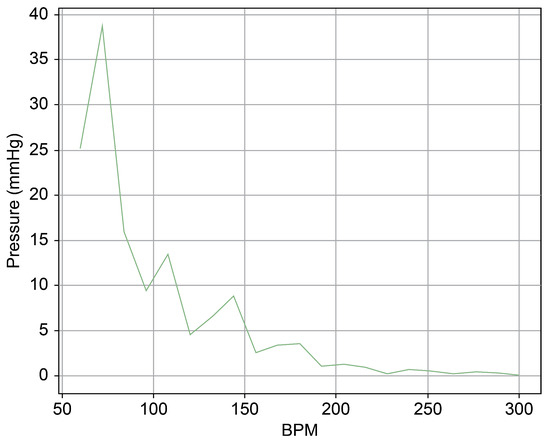
Figure 14.
Spectrum cross-section of abnormal phase of Heart 2.
Such findings underscore the intricate variances between different hearts and emphasize the importance of understanding these nuances for accurate simulation and research. The “Mixed phase” in Heart 2 introduced an additional dimension to this study, suggesting a spectrum of responses and the potential existence of multiple boundary conditions for TR across different hearts.
3.3. Second Scenario—Heart 2 with Pivot-TR
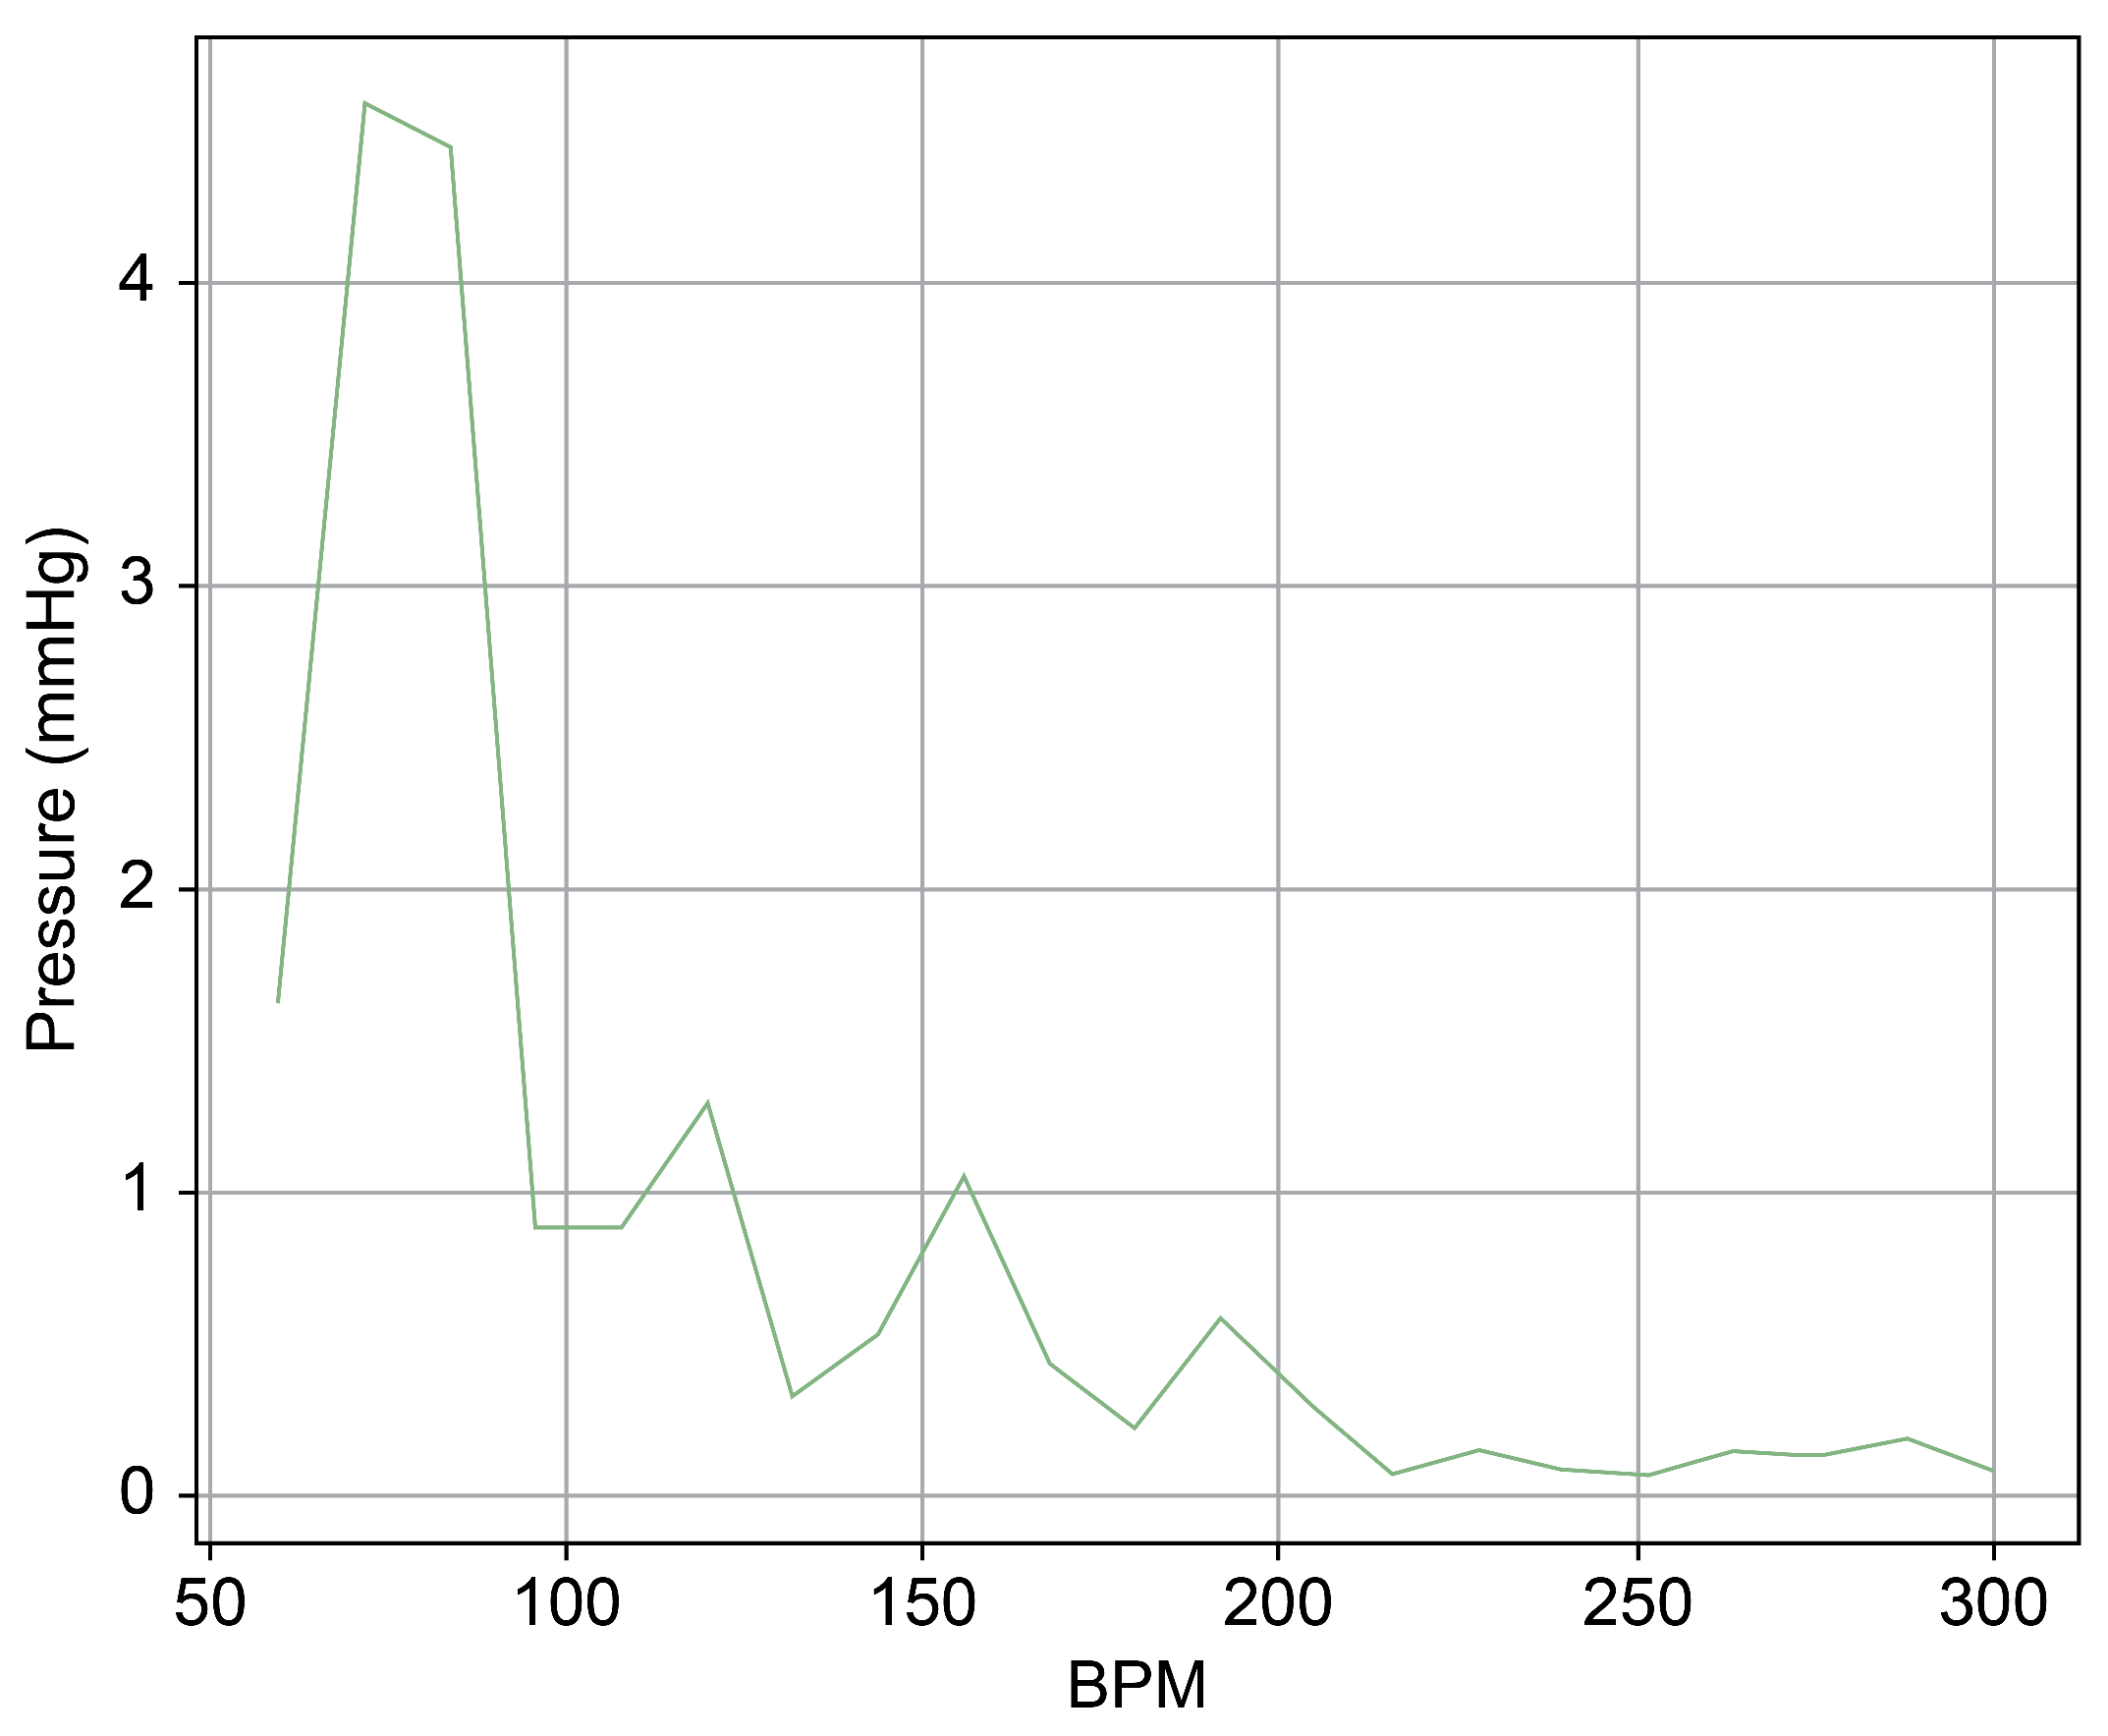
Heart 2 with Pivot-TR, as in Figure 15, was subjected to experimentation following the confirmation of the reproducibility of results of Heart 1 and Heart 2 without the Pivot-TR device; the difference in peak pressure values was revealed in the spectrum analysis between the normal and abnormal phases in Table 1. The ‘Dominant Pressure’ data shown in Table 1 were generated based on settings established by the simulator, while the ‘Peak Pressure’ values are simulated results induced by simulator and TRG settings. The main objective was to assess the extent to which Pivot-TR, when installed on the TV of a porcine heart, could alleviate the manifestation of TR. Unlike the previously observed conditions in Heart 1 and Heart 2 experiments where TR was evident, the presence of Pivot-TR significantly attenuated these conditions. As depicted in Figure 16 and Figure 17, the functionality of the TV consistently remained in the normal phase throughout.
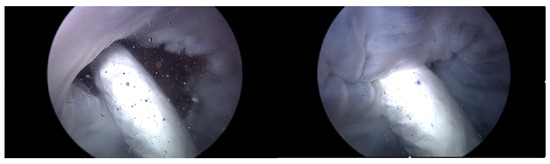
Figure 15.
Endoscopic image of Heart 2 with Pivot-TR (valve open, normal valve closed).

Table 1.
Pressure value for each heart scenario and each phase.

Figure 16.
Heart simulation experiment result of Heart 2 with membrane structure.
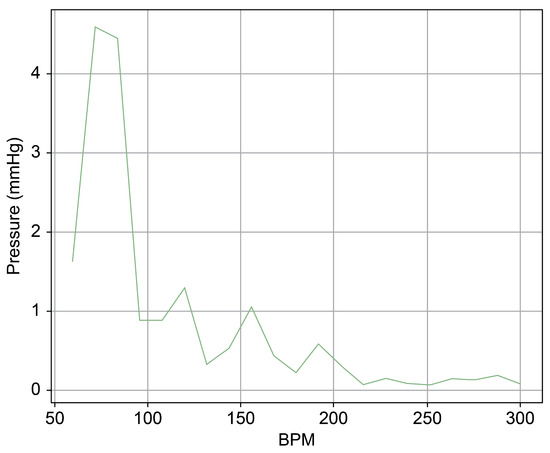
Figure 17.
Spectrum cross-section of normal area of Heart 2 with membrane structure.
Upon comparing the two scenarios of Heart 2, especially within the 50–100 bpm range, the amplitude was observed to be merely 10% in the second scenario (Figure 17) compared to that in the first (Figure 14). This suggests that Pivot-TR operates similarly to a low-pass filter, attenuating the blood pressure oscillations occurring in the RA and RV.
This significant attenuation in amplitude is compelling evidence that the Pivot-TR functions analogously to a low-pass filter in mitigating the blood pressure variations originating from the RA and RV.
In essence, these results demonstrate Pivot-TR’s capacity to serve as an effective intervention, acting like a low-pass filter, to reduce the manifestations of TR in porcine hearts. This highlights its potential as a promising solution for addressing TR-related cardiac research and treatment issues.
4. Discussion
This study aimed to develop a heart simulator that could accurately emulate the functions of the TV and intentionally induce TR. The subsequent goal was to utilize this simulator to assess the efficiency with which the previously developed Pivot-TR can reduce the TR and whether its effects could be quantified. During the initial phases of the Pivot-TR’s development [9], the primary observation mode was through MRI and ultrasound imaging of in vivo porcine hearts. This approach came with its constraints, including the inability to measure the pressures directly within the RA and RV. Moreover, the degree of TR varied across test subjects, rendering quantitative analyses challenging [12,13]. The average atrial pressure in peak pressure in the frequency domain area can be considered as a quantified indicator reflecting the severity of TR. The most accurate method to represent this would involve the measurement of the elasticity of the TV, but this requires mechanical property measurement processes, which are extremely challenging to perform surgically. Among the methods that can be used to represent indirect indicators, observing the movement of the TV through endoscopy or CT scans is possible [14,15]; however, it has been found that indicators based on atrial pressure are more economical and consistent across various uncontrollable environmental variables compared to accurate tracking of three-dimensional motions.
The introduction of the heart simulator has facilitated the quantitative assessment of TR. It permits experiments on the same heart, allowing for controlled alterations in TR severity, making it possible to determine the efficacy of Pivot-TR, even under extreme conditions. The pressure data recorded from MEMS pressure sensors installed in the RA and RV, when subjected to traditional signal processing methods, open avenues for a multifaceted extension of this research. Furthermore, the preliminary mechanical model that postulates the Pivot-TR as functioning akin to a low-pass filter shows promise. Although currently rudimentary, there is potential for developing a more sophisticated and nuanced mechanical model in the future. Moving forward, by expanding the capabilities of the heart simulator to emulate the long-term behavior of the Pivot-TR in the human body in the form of aging tests and concurrently researching the replication of individual heart characteristics, it is anticipated that this work will significantly contribute to the advancements in TR treatment methodologies.
Limitation
In this study, we used saline instead of a liquid with viscosity similar to blood, which is a significant limitation requiring improvement, as the health state of blood greatly impacts TR. The first version of our simulator does not accommodate high-viscosity liquids; hence, we are currently in the process of upgrading the simulator hardware to address this issue. These improvements will be incorporated into future research.
All heart experiments in this study were set to carry bpm between 40 and 60. This setting was chosen due to the lengthy preparation process and the potential for porcine hearts to become rigid due to post mortem rigidity, leading to heart rupture or leaks at the connection pipes at a higher carry bpm, thus preventing proper experimentation.
Currently, a significant issue is the dependency on a thoracic surgeon’s stitching skills for connecting the simulator’s pipe to the heart, which can consume up to an hour of work time. We aim to improve this by developing a mechanical structure for the heart connection that can be connected in a one-touch format. If the preparation process can be reduced to under 10 min, it would eliminate time constraints imposed by post mortem rigidity.
Furthermore, we do not have exact information of the three-dimensional orientation of the Pivot-TR. Knowing the precise 3D orientation would allow for an accurate inference of fluid resistance based on the direction of blood flow relative to the angle between the Pivot-TR and the TV plane. This information is anticipated to be an indicator for understanding how TR can be reduced.
5. Conclusions
Prior research has shown that the development of a heart simulator has facilitated the accurate evaluation of tricuspid function and the efficacy of Pivot-TR in treating TR [9,16,17]. The simulator employs pressure sensors and the endoscopic observation of the TV, allowing for applying existing engineering analysis methods and ensuring reliable research outcomes. The use of an STFT analysis has also provided more accurate and quantitative results. The generation of TR results from the superposition of the heart’s repetitive contraction and expansion, the harmonic oscillations, and the translational motion induced by the TRG. In particular, to analyze the heart’s resilience against TR and delineate the threshold of TR onset, employing a real-time signal analysis in the form of a Fourier Transform appeared prudent. This approach allows for the examination of how the interplay of these dynamic forces contributes to the emergence and intensity of TR. When simulating TR, the distribution of blood pressure in the high bpm range, which can be perceived as a type of high-frequency noise, suggests that TR may manifest when the mechanical low-frequency filter function of the TV is insufficient to effectively dampen this distribution of pressure. Consequently, the Pivot-TR device can be seen as a mechanical prophylactic low-pass filter, designed to reduce the increase in blood pressure distribution caused by factors such as the mechanical weakening of the TV’s damping capacity, aging deformities, hypertension, or other factors [15,18].
In particular, the STFT analysis played a role in estimating the threshold at which TR occurs. This allows for the provision of customized solutions for each patient through the key parameter of the low-pass filter and the damping ratio, and further enables the quantitative performance evaluation of the Pivot-TR. Moreover, through the standard Pivot-TR, it is anticipated that the reciprocal of the damping ratio could be used as a ‘TR Resistance Index’, serving as a health indicator for the heart. However, the simulator’s clinical significance is currently limited, and further research is necessary to create a profile of various heart states to increase its clinical relevance.
Nonetheless, this study marked distinct progress. Transitioning from indirect imaging techniques to optical endoscopic methods has significantly improved the resolution and clarity of images. The shift from previously low-resolution images, which provided limited insights into heart and Pivot-TR dynamics, to high-resolution endoscopic imaging has enriched our understanding.
In envisioning the future of this study, the integration of motion sensors into the Pivot-TR is a prime consideration. Furthermore, using 3D scanning technology to capture detailed structural aspects of a porcine heart and replicate it using silicone resin holds promise. This approach not only improves the reproducibility of the experiments but could also offer a more reliable and standardized test model, enhancing the robustness and reliability of subsequent studies.
Author Contributions
Conceptualization, S.A.; methodology, S.A.; software, H.Y.J. and S.-J.J.; formal analysis, S.-J.J.; writing—original draft preparation, H.Y.J.; writing—review and editing, S.A. and M.-K.C. All authors have read and agreed to the published version of the manuscript.
Funding
This research was funded by the Research Institute for Convergence of Biomedical Science and Technology, Pusan National University Yangsan Hospital, grant number 30-2019-016.
Institutional Review Board Statement
The study was approved by the Ethics Committee of Yangsan Pusan National University Hospital (2017-045, 2021-001-A1C1).
Informed Consent Statement
Informed consent was obtained from all subjects involved in the study.
Data Availability Statement
The raw data supporting the conclusions of this article will be made available by the author Hwan Yi Joo (poohc11@pusan.ac.kr) on request.
Acknowledgments
This study was supported by Research institute for Convergence of Biomedical Science and Technology (30-2019-016), Pusan National University Yangsan Hospital.
Conflicts of Interest
Author Su-Jin Jung was employed by the company TAU MEDICAL Inc. The author declares that the research was conducted in the absence of any commercial or financial relationships that could be construed as a potential conflict of interest.
References
- Enriquez-Sarano, M.; Messika-Zeitoun, D.; Topilsky, Y.; Tribouilloy, C.; Benfari, G.; Michelena, H. Tricuspid regurgitation is a public health crisis. Prog. Cardiovasc. Dis. 2019, 62, 447–451. [Google Scholar] [CrossRef] [PubMed]
- Vassileva, C.M.; Shabosky, J.; Boley, T.; Markwell, S.; Hazelrigg, S. Tricuspid valve surgery: The past 10 years from the Nationwide Inpatient Sample (NIS) database. J. Thorac. Cardiovasc. Surg. 2012, 113, 1043–1049. [Google Scholar] [CrossRef] [PubMed]
- Kim, J.B.; Jung, S.-H.; Choo, S.J.; Chung, C.H.; Lee, J.W. Clinical and echocardiographic outcomes after surgery for severe isolated tricuspid regurgitation. J. Thorac. Cardiovasc. Surg. 2012, 146, 278–284. [Google Scholar] [CrossRef] [PubMed]
- Ton-Nu, T.T.; Levine, R.A.; Handschumacher, M.D.; Dorer, D.J.; Yosefy, C.; Fan, D.; Hua, L.; Jiang, L.; Hung, J. Geometric determinants of functional tricuspid regurgitation: Insights from 3-dimensional echocardiography. Circulation 2006, 114, 143–149. [Google Scholar] [CrossRef] [PubMed]
- Song, J.M.; Jang, M.K.; Kim, Y.J.; Kim, D.H.; Kang, D.H.; Song, J.K. Right ventricular remodeling determines tricuspid valve geometry and the severity of functional tricuspid regurgitation: A real-time 3-dimensional echocardiography study. Korean Circ. J. 2010, 40, 448–453. [Google Scholar] [CrossRef] [PubMed]
- Lee, C.H.; Laurence, D.W.; Ross, C.J.; Kramer, K.E.; Babu, A.R.; Johnson, E.L.; Hsu, M.C.; Aggarwal, A.; Mir, A.; Burkhart, H.M.; et al. Mechanics of the tricuspid valve-from clinical diagnosis/treatment, in-vivo, and in-vitro investigations, to patient-specific biomechanical modeling. Bioengineering 2019, 6, 47. [Google Scholar] [CrossRef] [PubMed]
- Badano, L.P.; Muraru, D.; Enriquez-Sarano, M. Assessment of functional tricuspid regurgitation. Eur. Heart J. 2013, 34, 1875–1885. [Google Scholar] [CrossRef] [PubMed]
- Anwar, A.M.; Folkert, J.; Soliman, O.I. Clinical recognition of tricuspid valve disease. In Practical Manual of Tricuspid Valve Diseases; Springer: Berlin/Heidelberg, Germany, 2018; pp. 25–48. [Google Scholar]
- Chon, M.K.; Lee, S.W.; Hahn, J.Y.; Park, Y.H.; Kim, H.S.; Lee, S.H.; Shin, D.H.; Lee, P.H.; Kim, E.K.; Lee, J.H.; et al. A novel device for tricuspid regurgitation reduction featuring 3-dimensional leaflet and atraumatic anchor: Pivot-TR system. JACC Basic Transl. Sci. 2022, 7, 1249–1261. [Google Scholar] [CrossRef] [PubMed]
- Asmarats, L.; Puri, R.; Latib, A.; Navia, J.L.; Rodés-Cabau, J. Transcatheter tricuspid valve interventions: Landscape, challenges, and future directions. J. Am. Coll. Cardiol. 2018, 71, 2935–2956. [Google Scholar] [CrossRef] [PubMed]
- Dabiri, Y.; Yao, J.; Sack, K.L.; Kassab, G.S.; Guccione, J.M. Tricuspid valve regurgitation decreases after MitraClip implantation: Fluid structure interaction simulation. Mech. Res. Commun. 2019, 97, 96–100. [Google Scholar] [CrossRef] [PubMed]
- Fukuda, S.; Song, J.M.; Gillinov, A.M.; McCarthy, P.M.; Daimon, M.; Kongsaerepong, V.; Thomas, J.D.; Shiota, T. Tricuspid valve tethering predicts residual tricuspid regurgitation after tricuspid annuloplasty. Circulation 2005, 111, 975–979. [Google Scholar] [CrossRef] [PubMed]
- Matsuyama, K.; Matsumoto, M.; Sugita, T.; Nishizawa, J.; Tokuda, Y.; Matsuo, T. Predictors of residual tricuspid regurgitation after mitral valve surgery. Ann. Thorac. Surg. 2003, 75, 1826–1828. [Google Scholar] [CrossRef] [PubMed]
- Perlman, G.; Praz, F.; Puri, R.; Ofek, H.; Ye, J.; Philippon, F.; Carrel, T.; Pibarot, P.; Attinger, A.; Htun, N.M.; et al. Transcatheter Tricuspid Valve Repair With a New Transcatheter Coaptation System for the Treatment of Severe Tricuspid Regurgitation: 1-Year Clinical and Echocardiographic Results. Cardiovasc. Interv. 2017, 10, 1994–2003. [Google Scholar] [CrossRef]
- Vaturi, M.; Sagie, A.; Feldman, A.; Fink, N.; Strasberg, B.; Adler, Y. Impact of atrial fibrillation on clinical status, atrial size and hemodynamics in patients after mitral valve replacement. J. Heart Valve Dis. 2001, 10, 763–766. [Google Scholar] [PubMed]
- Tang, G.H.L.; David, T.E.; Singh, S.K.; Maganti, M.D.; Armstrong, S.; Borger, M.A. Tricuspid valve repair with an annuloplasty ring results in improved long-term outcomes. Circulation 2006, 114, I577–I581. [Google Scholar] [CrossRef] [PubMed]
- Tager, R.; Skudicky, D.; Mueller, U.; Essop, R.; Hammond, G.; Sareli, P. Long-Term Follow-Up of Rheumatic Patients Undergoing Left-Sided Valve Replacement With Tricuspid Annuloplasty—Validity of Preoperative Echocardiographic Criteria in the Decision to Perform Tricuspid Annuloplasty. Am. J. Cardiol. 1998, 81, 1013–1016. [Google Scholar] [CrossRef] [PubMed]
- Rommel, K.-P.; Besler, C.; Noack, T.; Blazek, S.; von Roeder, M.; Fengler, K.; Ender, J.; Gutberlet, M.; Desch, S.; Borger, M.A.; et al. Physiological and Clinical Consequences of Right Ventricular Volume Overload Reduction After Transcatheter Treatment for Tricuspid Regurgitation. Cardiovasc. Interv. 2018, 12, 1423–1434. [Google Scholar] [CrossRef] [PubMed]

Disclaimer/Publisher’s Note: The statements, opinions and data contained in all publications are solely those of the individual author(s) and contributor(s) and not of MDPI and/or the editor(s). MDPI and/or the editor(s) disclaim responsibility for any injury to people or property resulting from any ideas, methods, instructions or products referred to in the content. |
© 2024 by the authors. Licensee MDPI, Basel, Switzerland. This article is an open access article distributed under the terms and conditions of the Creative Commons Attribution (CC BY) license (https://creativecommons.org/licenses/by/4.0/).