Article

Experimental Investigation of the Effect of Fault Reactivation Induced by Water Injection

1
State Key Laboratory of Coal Mine Disaster Dynamics and Control, Chongqing University, Chongqing 400044, China
2
School of Resources and Safety Engineering, Chongqing University, Chongqing 400044, China
*
Author to whom correspondence should be addressed.
Appl. Sci. 2024, 14(8), 3322; https://doi.org/10.3390/app14083322
Submission received: 22 February 2024 / Revised: 10 April 2024 / Accepted: 11 April 2024 / Published: 15 April 2024
(This article belongs to the Section Earth Sciences)

Abstract

:
An understanding of fault reactivation induced by water injection is of great significance for geothermal energy development and utilization. We conducted a series of water injection shear tests on low-permeability granite samples that each contained a single saw-cut fault under locally undrained conditions. Slip characteristics were analyzed by varying the fluid pressurization rate, confining pressure, and stress state of the fault to understand fault reactivation. The experimental results demonstrated that at a high pressurization rate, a higher local fluid pressure was needed to reactivate the fault than had been estimated theoretically, and the required fluid pressure increased with an increase in pressurization rate. The fluid pressurization rate and confining pressure both controlled the slip mode of the fault. The slip mode changed from dynamic slip to quasi-static slip at a high pressurization rate, and the peak slip rate of dynamic slip increased with an increasing pressurization rate. The fault showed significant stick-slip characteristics under a high confining pressure, as fault locking and reactivation phenomena occurred repeatedly. Faults with different initial stress states had little influence on the slip mode after the onset of slip.

1. Introduction

With the rapid development of the global economy, conventional energy sources such as oil and coal have been consumed in large quantities, resulting in high total carbon emissions [1]. To reduce carbon emissions, many countries encourage the development and utilization of new energy [2,3,4]. Geothermal energy, as a kind of clean energy, has wide application prospects in energy supply due to its sustainable and recyclable nature. At present, enhanced geothermal systems (EGS) use hydraulic stimulation to create highly permeable flow paths to retrograde reservoirs and to extract geothermal energy by injecting cold water into injection wells to produce hot water or steam from production wells [5,6]. However, a series of earthquakes has occurred during geothermal exploration projects in many countries, which has become the primary obstacle to further geothermal energy exploration [7,8,9]. For example, in 1997, hundreds of earthquakes with a moment magnitude ( M W ) of 1.5 were induced by injection beneath The Geysers, a geothermal field in the United States. A cluster of earthquakes occurred in an EGS project in Basel, which brought the project to a shutdown [10]. The largest earthquake of M W ≈ 5.5 during an EGS project occurred in Pohang, Korea, as a result of the acquisition of geothermal energy by hydraulic stimulation, and 50 people were seriously injured [11].
The understanding of the mechanisms of fault reactivation is based on the Mohr–Coulomb criterion, which incorporates the effective stress principle, stating that whether a fault is reactivated or not is determined by the critical shear stress τ p and the shear stress τ . The fault reactivation criteria is as follows [12]:
τ τ p = μ ( σ n p )
where μ is the friction coefficient, σ n is the normal stress applied to the fault, and p is the fluid pressure on the fault. Equation (1) indicates that both an increase in fluid pressure and a decrease in the friction coefficient due to fluid lubrication effects [13] and chemical effects [14] drive the fault into an unstable state [15,16,17]. However, Seagull [18] suggested that a decrease in pore pressure in a reservoir may also induce fault reactivation and generate earthquakes through theoretical analysis. Field and in-situ tests have controlled the number of earthquakes in EGS to some extent by changing the injection parameters, indicating that fault slip reactivation may be sensitive to the pressure, rate, and volume of fluid injection [19,20,21,22]. Moreover, researchers have noted that earthquakes often occur when the injection stops [23,24,25]. Even though a large number of researchers have interpreted these field observations by building two-dimensional geological models, little is known about the influence of fluid injection parameters on fault reactivation [26,27,28]. On this basis, laboratory experiments can be further used to study the effects of injection parameters on fault reactivation. So far, most laboratory experiments have focused on direct shear tests or displacement-driven triaxial shear tests [29]. Neither of the above two experiments can reveal the real injection-induced fault slip behavior in EGS. Therefore, some scholars have carried out triaxial injection-driven shear slip experiments to characterize the mechanism of fault slip induced by water injection during geothermal exploitation. Passelègue [30] changed the fluid injection rate, and the results suggested that it was a higher injection pressure that induced fault reactivation. Ye [31] increased the fluid pressure stepwise on fault samples of different roughness levels, and the results suggested that the fluid pressure for fault slip initiation at high speeds was inconsistent with the theoretical value.
In the study of slip modes, Rutter [32] injected water into rocks with very different permeabilities and believed that fluid injected in impermeable rocks concentrated on the weak surface, resulting in dynamic slip. Ye [31] found that roughness controls the slip mode of faults, namely, quasi-static slip and dynamic slip. They pointed out that there is a strong correlation between fault slip and stress relaxation, and faster slip leads to faster stress relaxation. Noël [33] believed that fluctuating fluid pressure promotes stick-slip behavior rather than aseismic creep. Nemoto [34] observed a stepwise slip in the process of injection into granite. French [35] acknowledged that the increase in fluid pressure enhances the slip distance and slip rate caused by the change in normal stress, which is related to the pressurization rate and is independent of the fluid pressure. The fault mode is closely related to the pressure change, and the slip mode can determine the occurrence or not of earthquakes [36]. Therefore, the fault slip mode is important and needs to be studied to explore water-induced earthquakes.
Nevertheless, the theoretical model has been simplified based on friction laws and does not systematically consider the potential coupling. The analysis of seismic monitoring data and in situ test results shows that fluid injection is closely related to earthquakes induced by fault reactivation; however, the initiation condition and slip mode of fault reactivation are still unclear. Although the above laboratory studies have provided valuable insights, they are more focused on rock permeability, roughness, and injected pressure. The role of pressurization rate in fault reactivation induced by water injection is still controversial. The following aspects are still worthy of further investigation: the effects of pressurization rate on the initiation of fault slip, as well as the following slip mode, and the effects of crustal stress on the fault reactivation induced by water injection.
Therefore, in this study, the process of fault reactivation was reproduced by performing laboratory injection-driven triaxial shear tests on granite samples containing fault. We analyzed the deformation and stress characteristics under different fluid pressurization rates, confining pressures, and initial stress states. We discussed the condition of fault slip onset and the subsequent slip modes under water injection to further improve our understanding of induced seismic hazards.

2. Materials and Methods

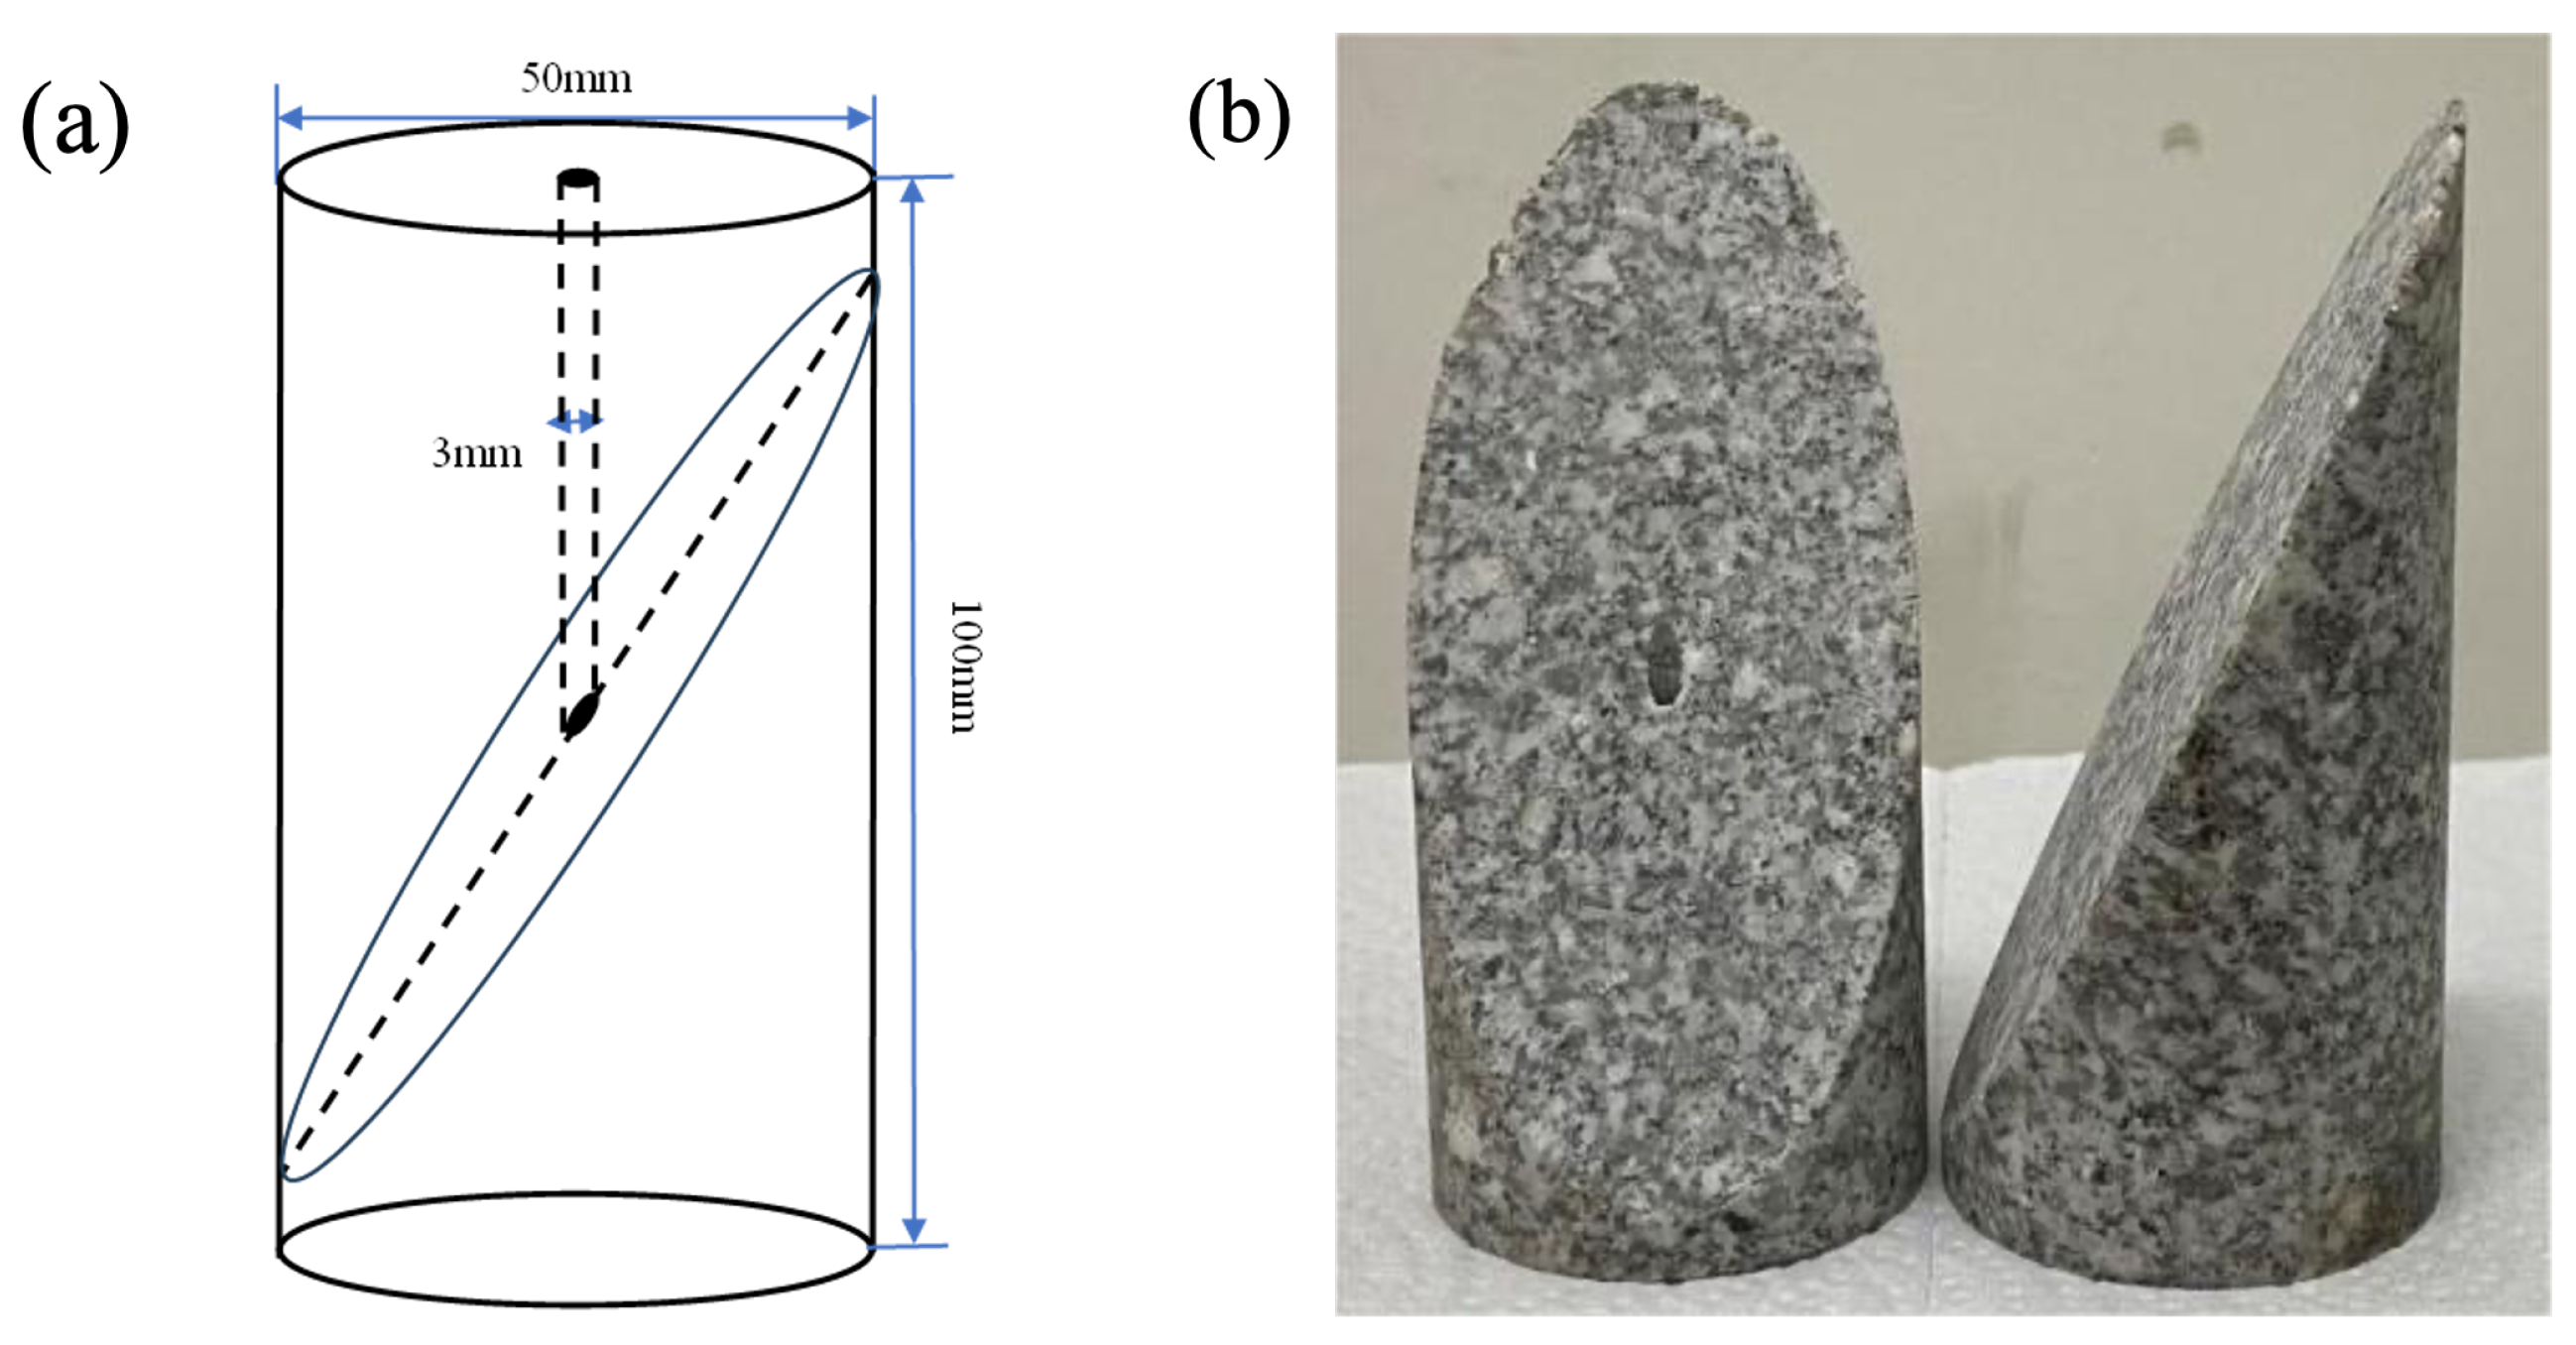
2.1. Sample Description and Preparation

The material used for samples is igneous granite. Table 1 summarizes the physical and mechanical properties of this granite.
Cylindrical samples that were 50 mm in diameter were cored and then cut to a length of 100 mm. Then, the cylinders were cut at an angle of 45° or 30° with respect to their axes to form an elliptical saw-cut fault interface. The fault interface was polished with 60 mesh sandpaper. Finally, we drilled a borehole of 3 mm in diameter in the middle to simulate an injection well that runs through the upper half of the rock sample to connect the upper surface and fault interface, allowing the injected distilled water to directly reach the fault interface (Figure 1).

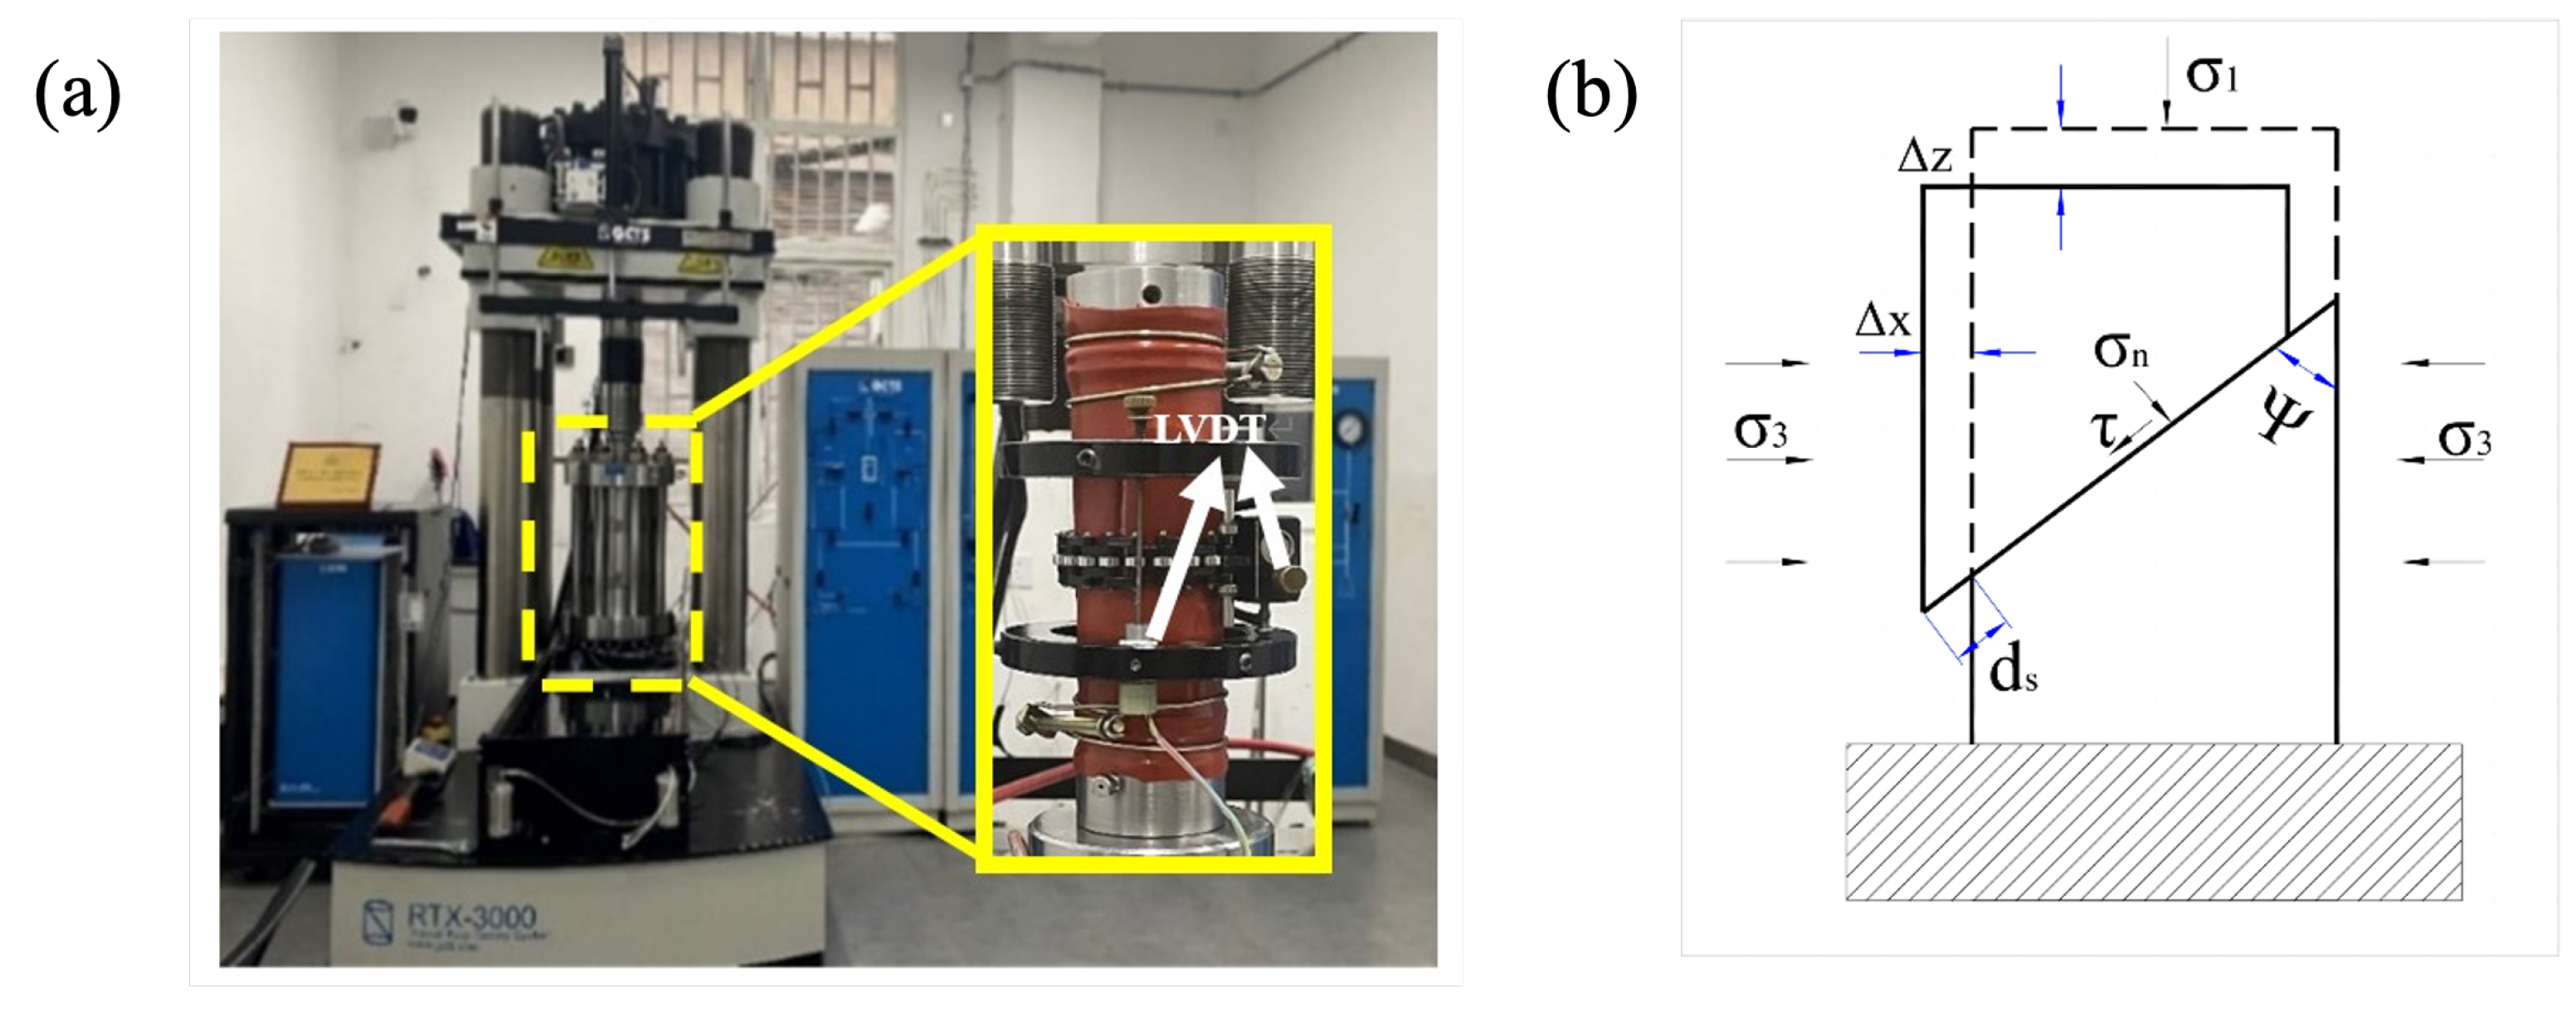
2.2. Experimental Configuration

A triaxial testing apparatus was utilized in this experiment, as shown in Figure 2. The maximum axial load of the test system is 3000 kN and the maximum confining pressure is 200 MPa with a triaxial cell. The pore systems have a capacity of 200 MPa, and the temperature can reach 200 °C, which meets the experimental requirements of injection-driven shear tests under triaxial conditions in this study. The axial stress σ 1 (MPa) and confining pressure σ 3 (MPa) can be monitored and obtained in real time within the GCTS. The deformation of a sample under stress is shown in Figure 2b. The normal stress σ n (MPa), effective normal stress σ n (MPa), and shear stress τ (MPa) on the fault are as follows:
σ n = σ 3 + σ 1 σ 3 s i n 2 ψ
σ n = ( σ 3 p ) + σ 1 σ 3 s i n 2 ψ
τ = σ 1 σ 3 sin ψ c o s ψ
where σ 1 (MPa) and σ 3 (MPa) are the axial stress and confining pressure, respectively; p (MPa) is injection fluid pressure; and ψ (°) is the fault inclination angle with respect to the core axis.
In this experiment, the axial deformation and radial deformation can be measured using two linear variable differential transformer (LVDT) position sensors, as shown in Figure 2a. Thus, slip distance d s ( μ m) and slip rate v s ( μ m/s) along the fault can be calculated as follows:
d S = Δ z c o s ψ + Δ x s i n sin ψ
v s = d s t
where Δ z ( μ m) is the axial deformation of the sample minus the compression deformation of the rock matrix, Δ x ( μ m) is the total radial deformation of the sample minus rock matrix, and t (s) represents time.

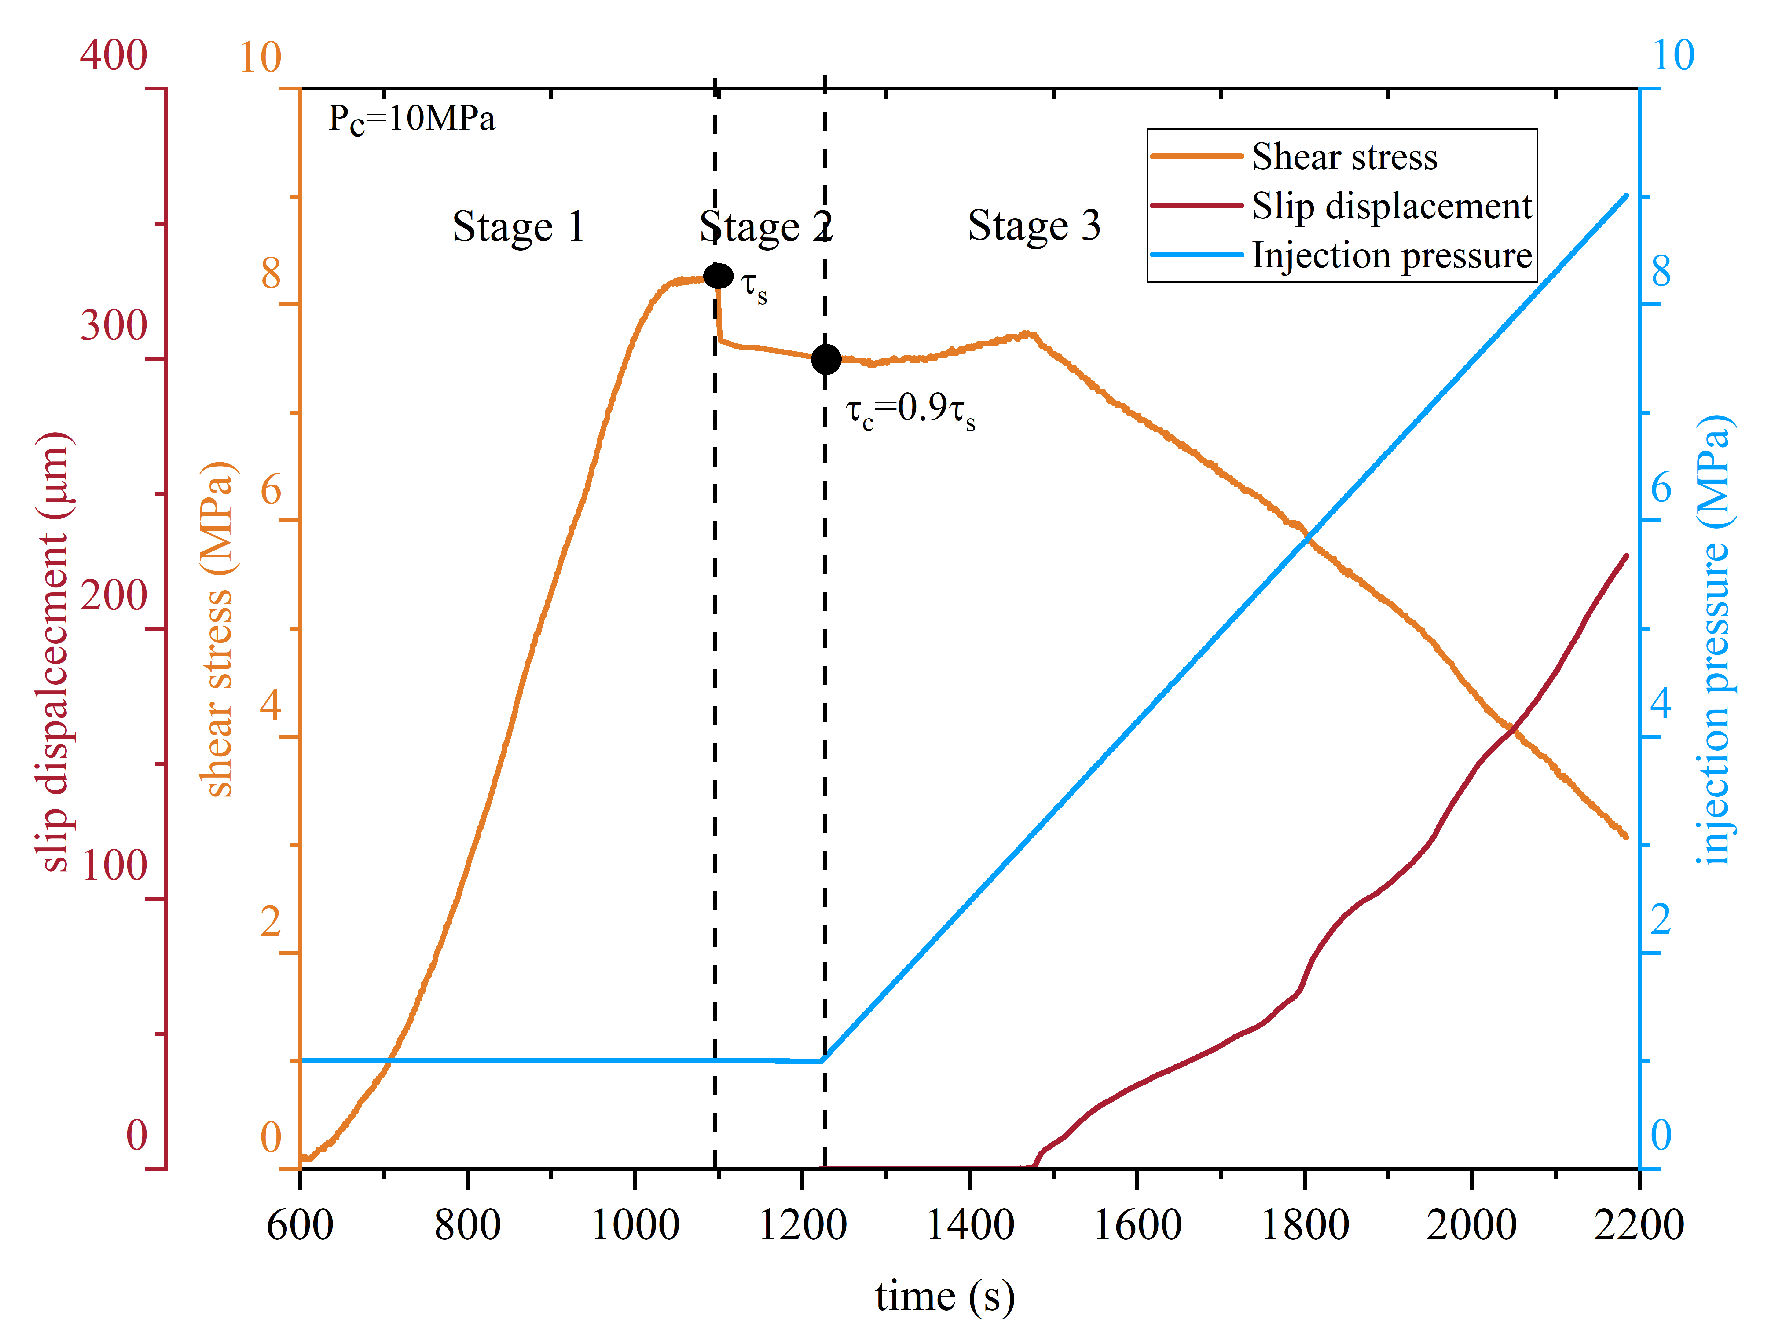
2.3. Experimental Procedure

The pre-test preparations are as follows. (1) Apply a layer of epoxy resin adhesive between the gasket and the rock sample to prevent water leakage. (2) Put the specimen into a heat shrink tube and heat it with a hot air gun. (3) Install the LVDT position sensors for measuring the axial and radial deformation and check whether the experimental device is available with no leakage. (4) Stall the sample on the base of the triaxial pressure chamber and then inject the silicone oil. (5) Set the confining pressure ( σ 3 ) to a predetermined value and give the initial injection pressure (p) to 1 MPa. Fluid pressure was applied from the top end of the sample by advancing the downstream syringe pump while the bottom end of the sample is connected to a closed reservoir (undrained condition).
The test procedure is shown in Figure 3. First, in Stage 1, the shear strength( τ s ) of the rock sample was obtained via a displacement-driven shear test at an axial displacement rate of 1 μ m/s. Then, we reduced the axial stress until τ = τ c (i.e., τ c = 0.8, 0.85, 0.9 times τ s ), as shown in Stage 2. At last, we kept the position of the piston constant and increased the fluid pressure at a certain pressurization rate (i.e., 0.5, 2, 8, or 32 MPa/min) through the injection-driven shear test, as shown in Stage 3. We increased the fluid pressure from 1 MPa to 9 MPa, where σ 3 = 10 MPa, to 18 MPa, where σ 3 = 20 MPa, and to 27 MPa, where σ 3 = 30 MPa. There were 9 groups of 27 specimens tested in this experiment, and each group was tested 3 times. The test scheme is shown in Table 2.

3. Results

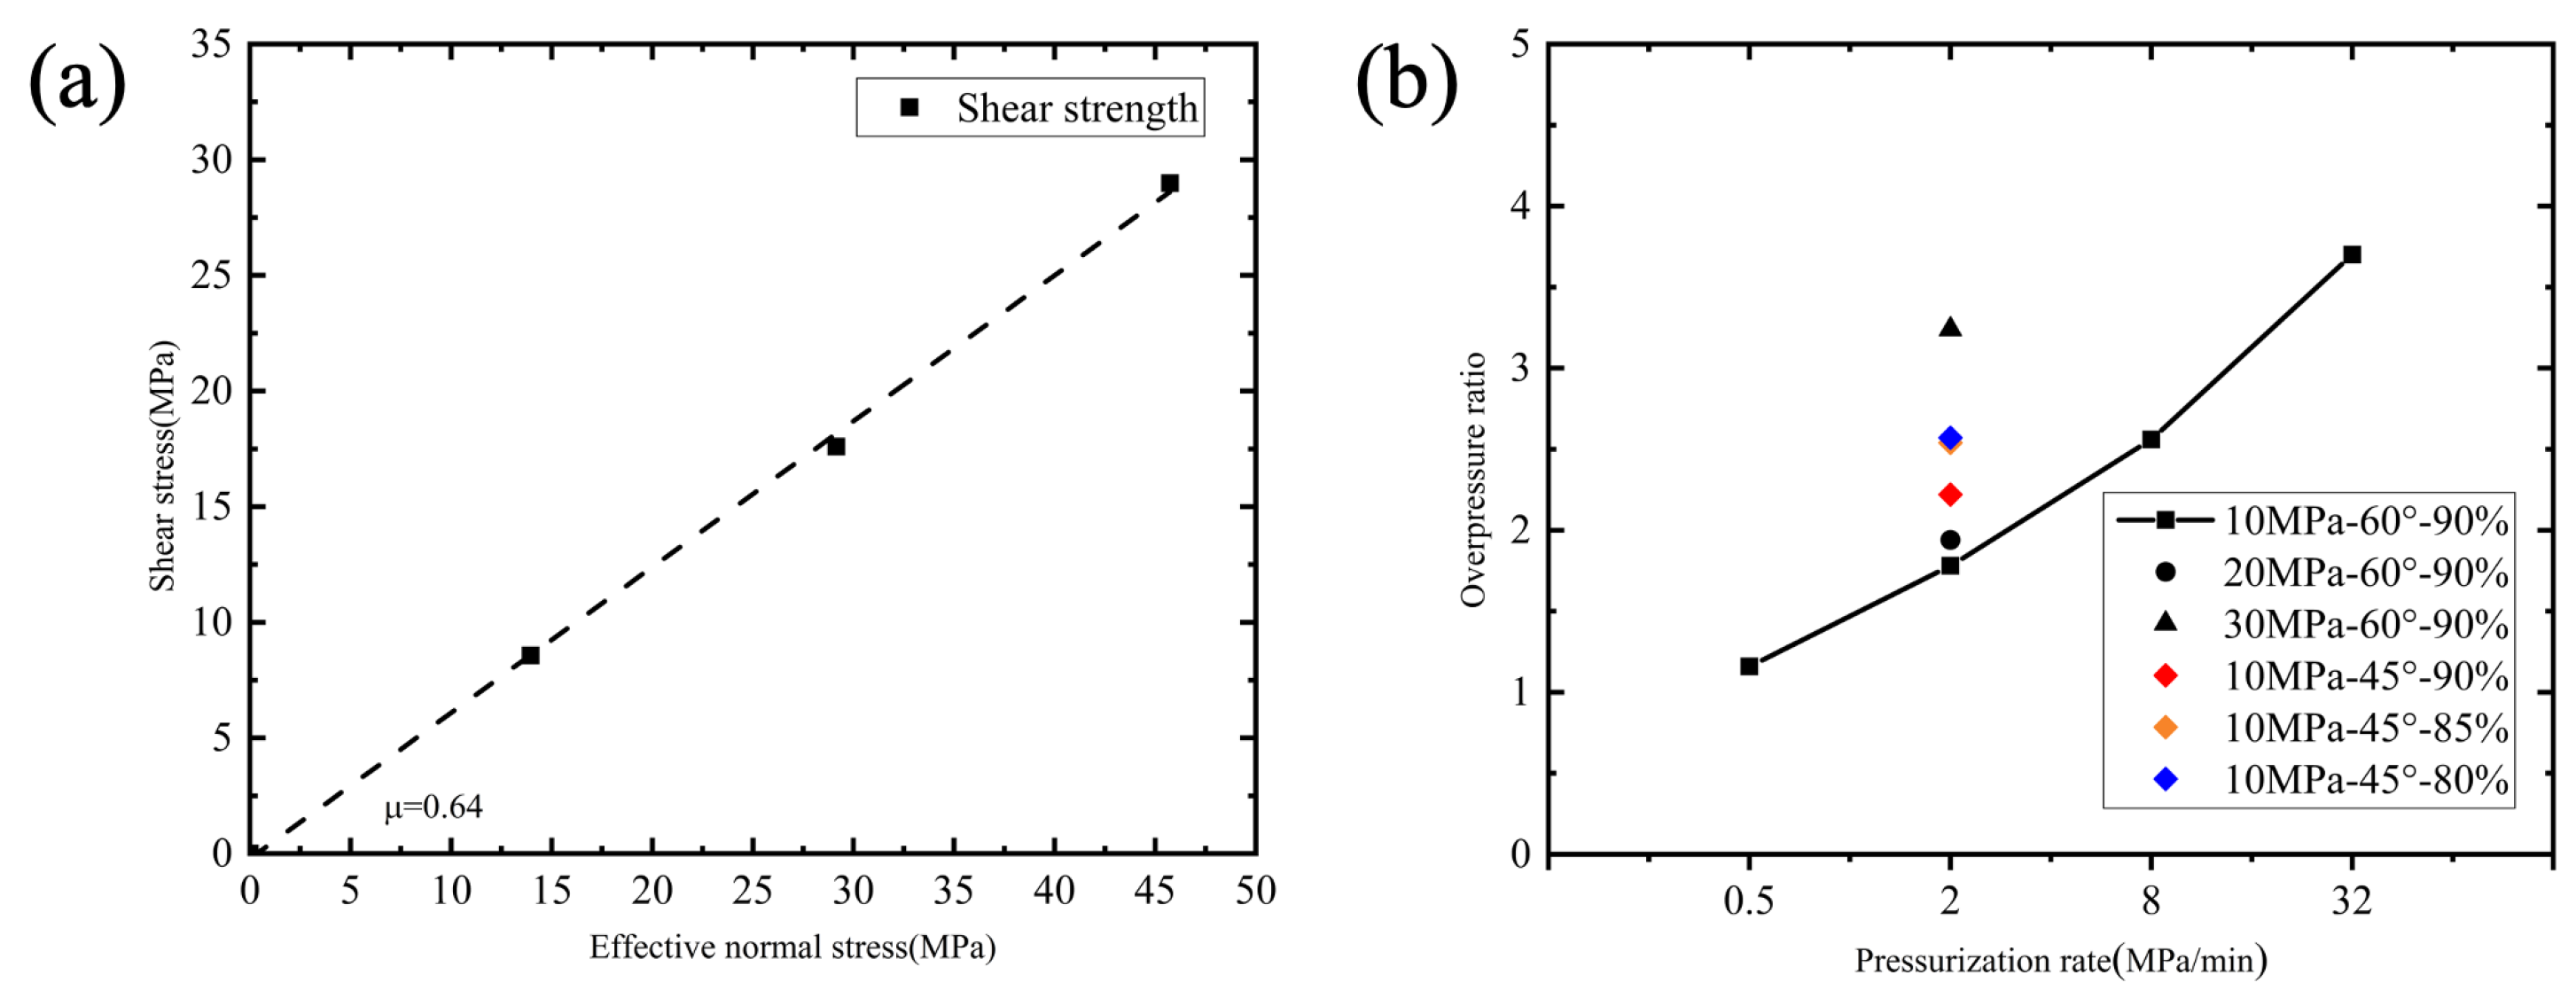
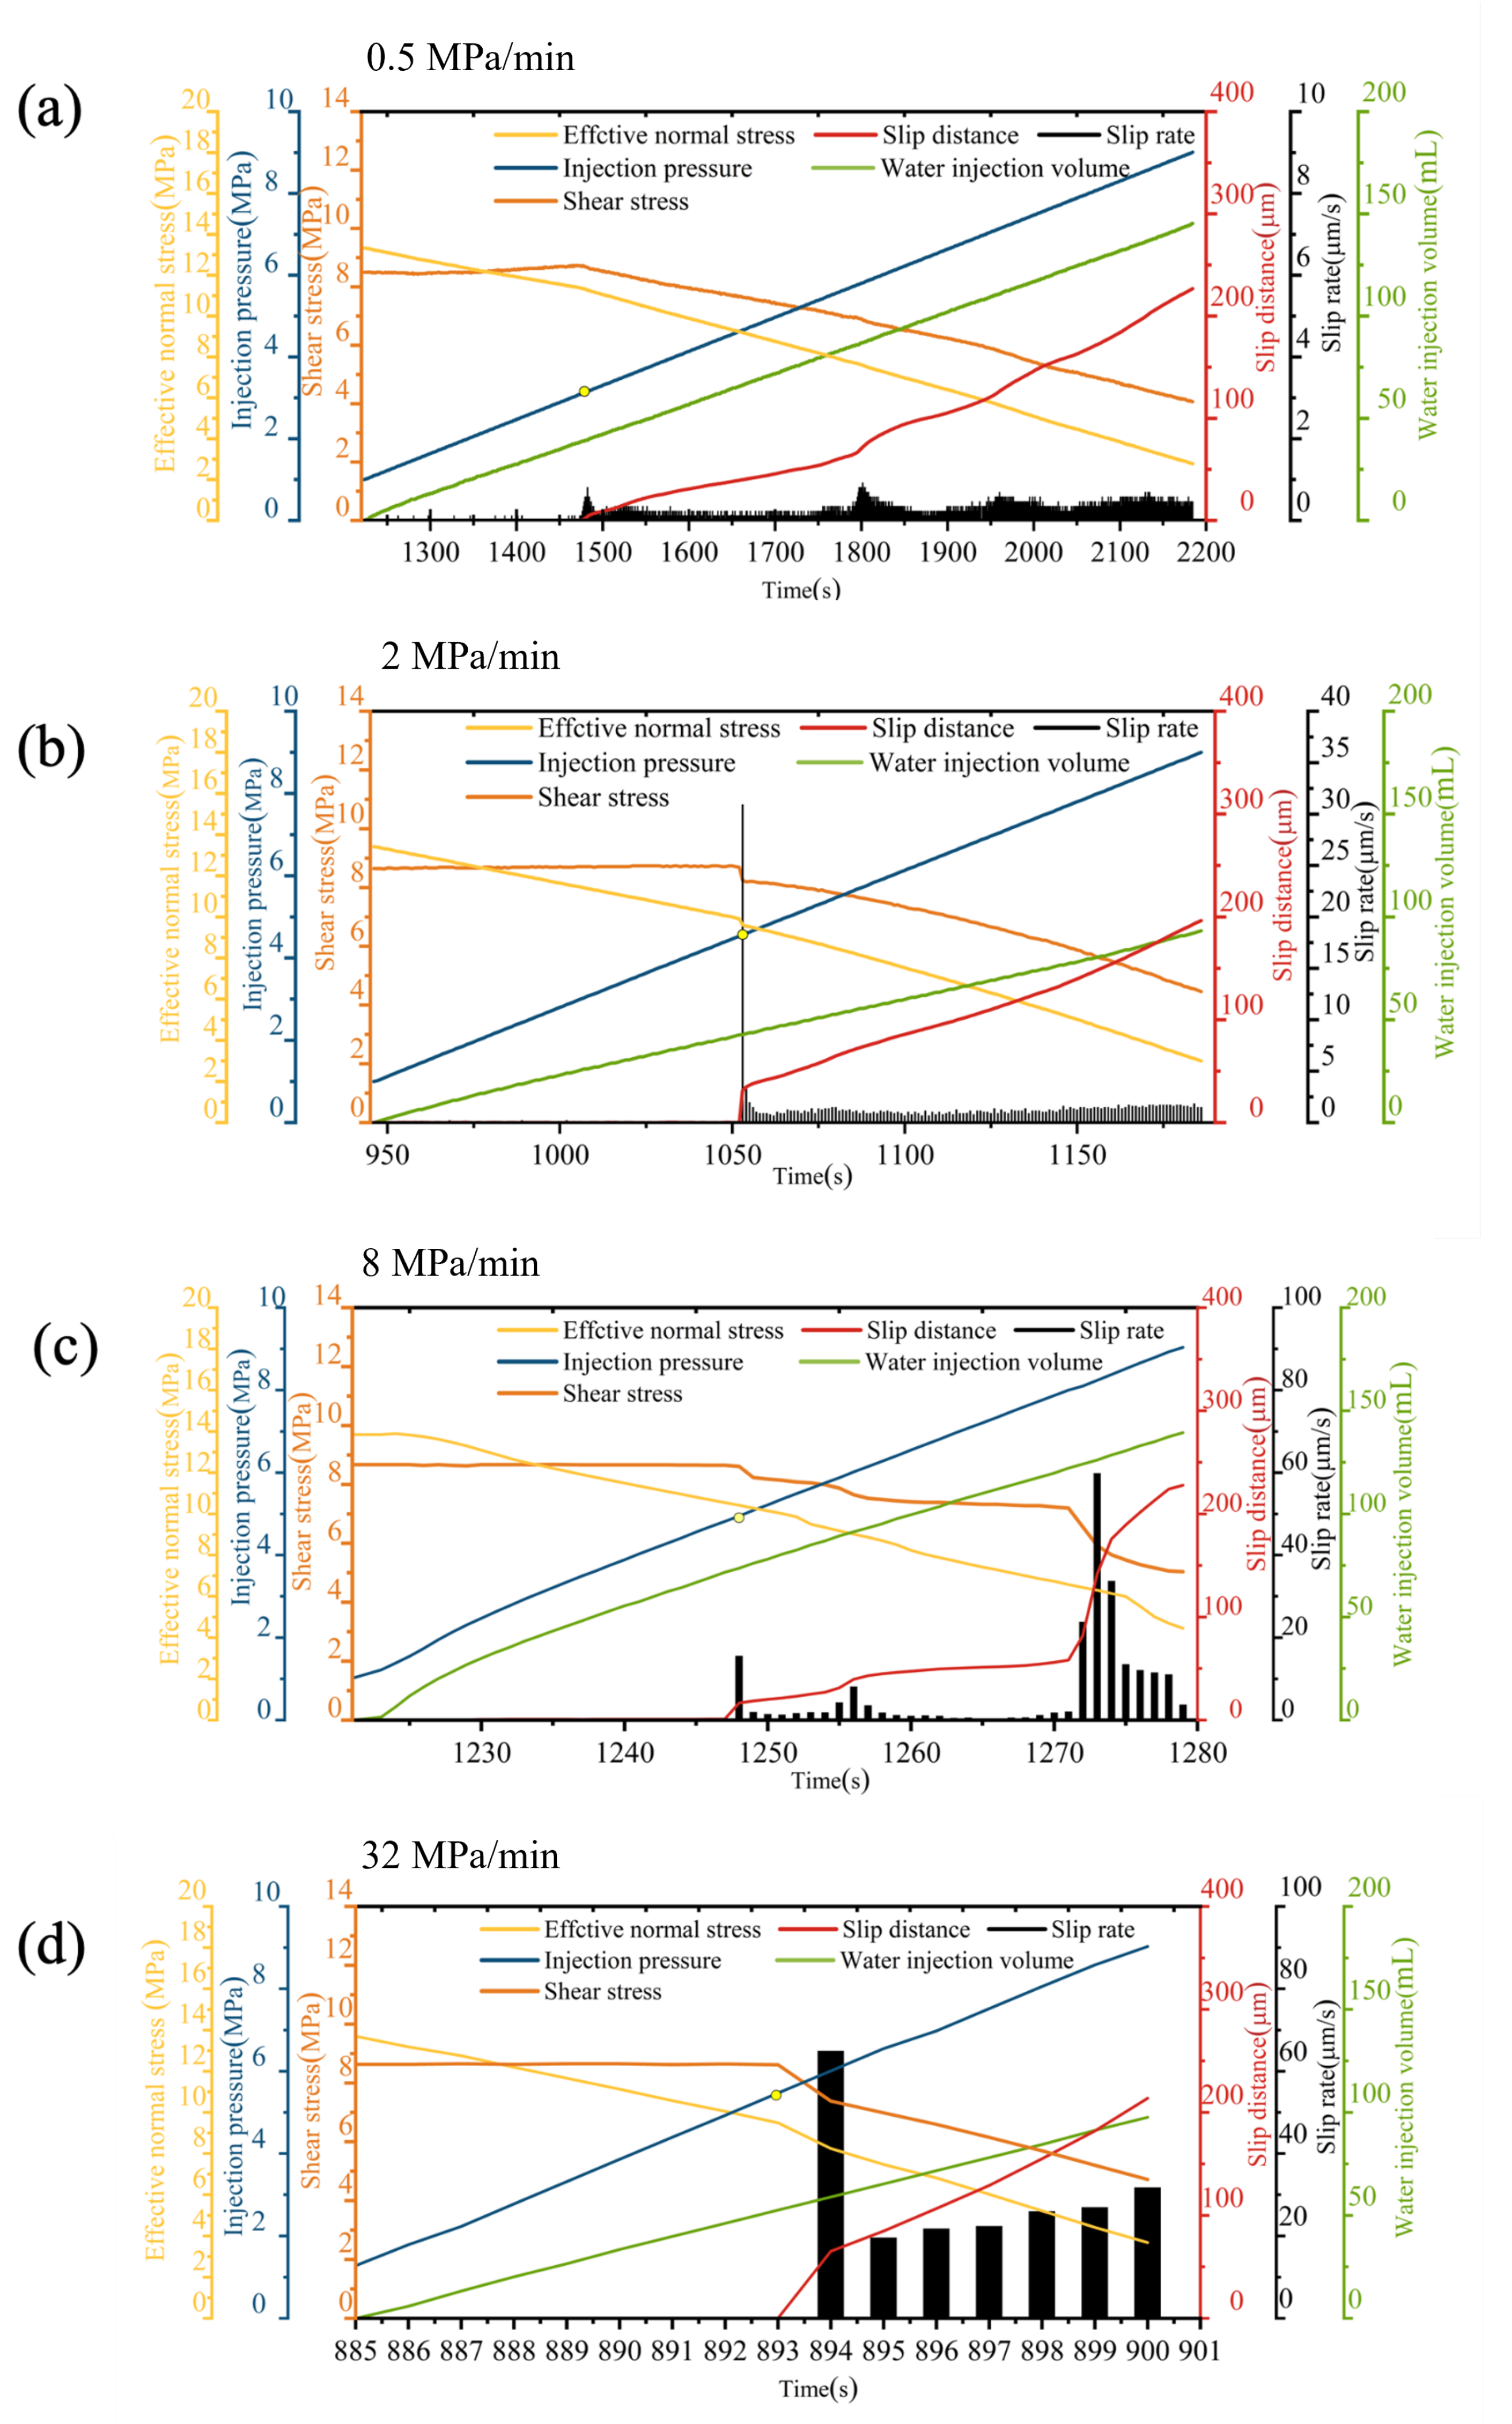
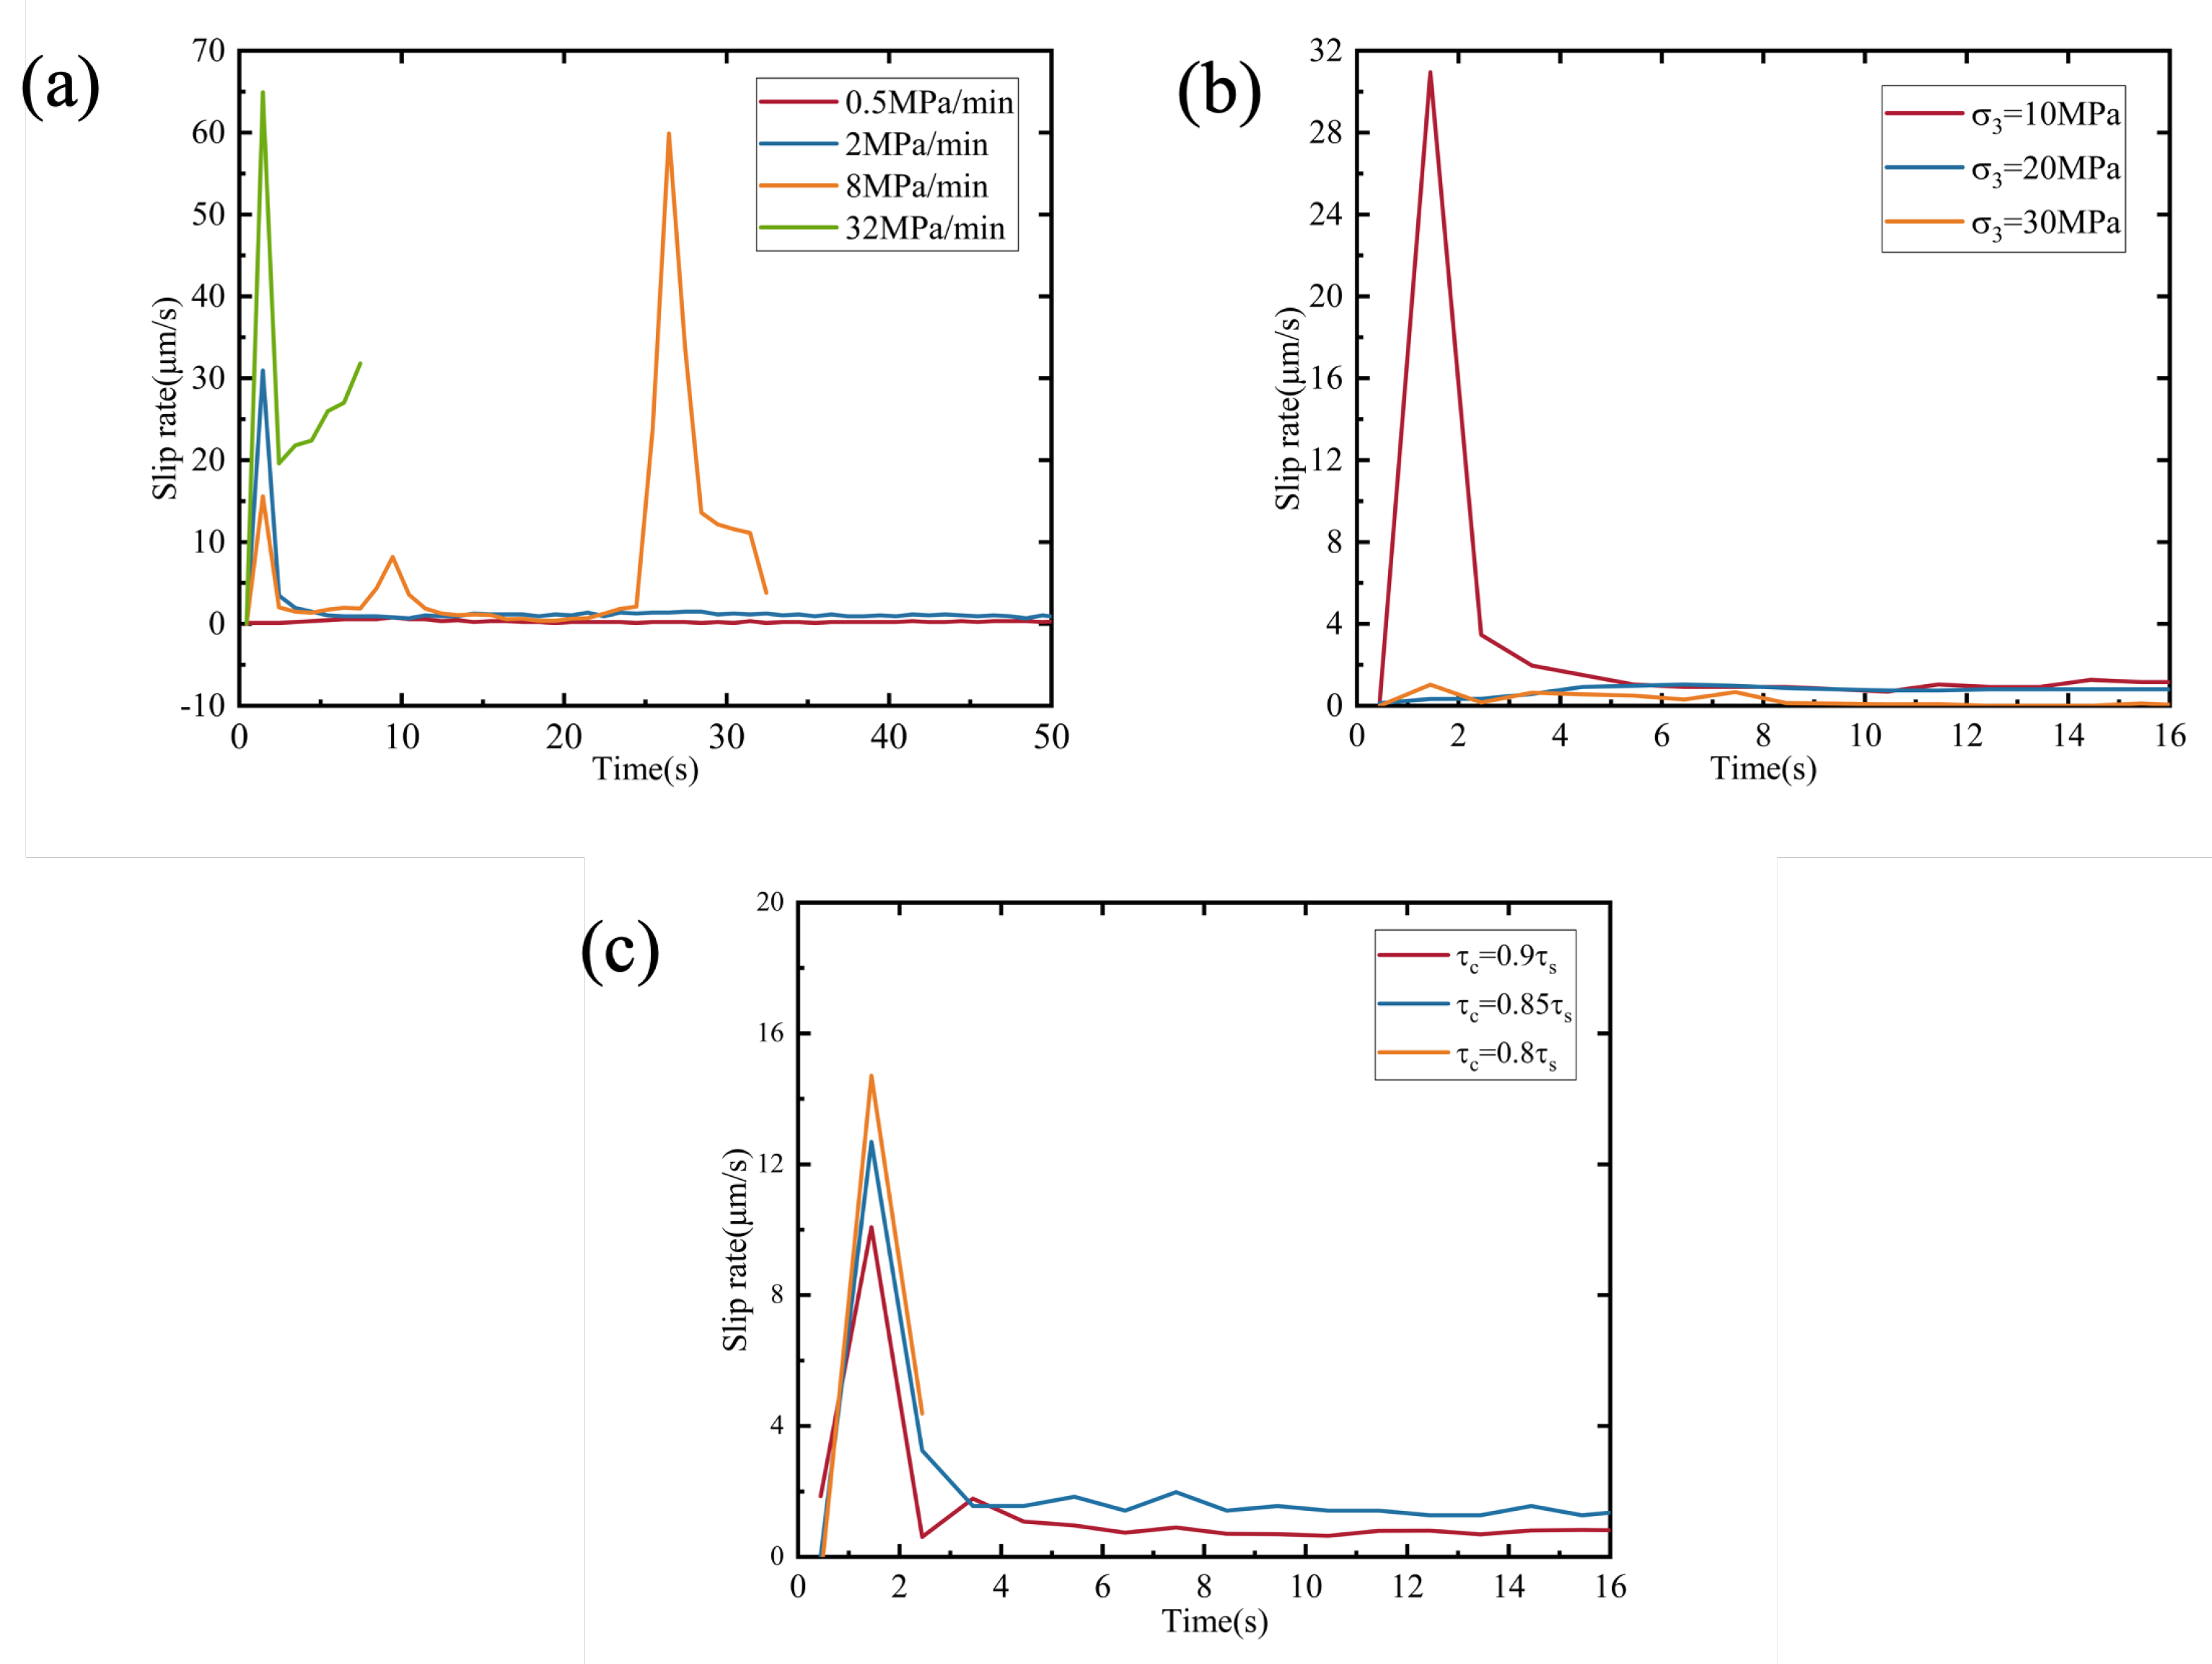
3.1. Cases of Different Pressurization Rates

The evolution of the shear stress τ , effective normal stress σ n , injection pressure p, slip distance d s , slip rate v s , and water injection volume under the different pressurization rates is shown in Figure 4. To study the effect of pressurization rate, four tests were conducted at the same initial stress state ( σ n ≈ 13.5 MPa, τ ≈ 8.5 MPa). According to the four slip distance curves in the figure, the fault remained locked (slip distance ≈ 0) in the initial of water injection.
According to the yellow circle in Figure 4a, at a pressurization rate = 0.5 MPa/min, fault slip onset (slip distance curve appears and shear stress began to go down) was detected at p = 3.08 MPa. As the pressurization rate increased, so did the injection pressure required for fault slip initiation, which was 4.57 MPa, 4.95 MPa, and 6.01 MPa, respectively (Figure 4a–c).
At 0.5 MPa/min, as the injection pressure increased, the fault continued to slip at a rate of no more than 1 μ m/s, and the effective normal stress and shear stress decreased linearly with the slip. The whole process resembled quasi-static slip (Figure 4a), as no locked phase appeared after slip initiation. In contrast, the slip process under higher pressurization rates (2 MPa/min, 8 MPa/min, and 32 MPa/min) showed a high peak slip rate (>15 μ m/s), indicating that a dynamic slip appeared and was accompanied by a sharp drop in shear stress and effective normal stress (Figure 4b–d). At the higher pressurization rate of 8 MPa/min, the slip process underwent two dynamic slip phases, and the peak slip rates of the two dynamic slips reached 15.57 μ m/s and 59.89 μ m/s, respectively, which were accompanied by two shear stress drops of 0.4 MPa and 0.64 MPa each (Figure 4c). Between the two dynamic slips, a fault locked phase was detected, which indicated that the fault stopped slipping. This embodied an obvious stick-slip characteristic. At 32 MPa/min, the highest slip rate of 64.6 μ m/s was detected among the four tested pressurization rates (Figure 4d). Cumulative slip distances under four conditions were similar, at approximately 0.2 mm, but the methods of cumulation are different. Under low pressurization rates (0.5 MPa/min and 2 MPa/min), cumulation occurred through slow slip over a long period of time. In contrast, rapid slip over a short period of time caused the cumulation of the slip distance when the pressurization rate was high.

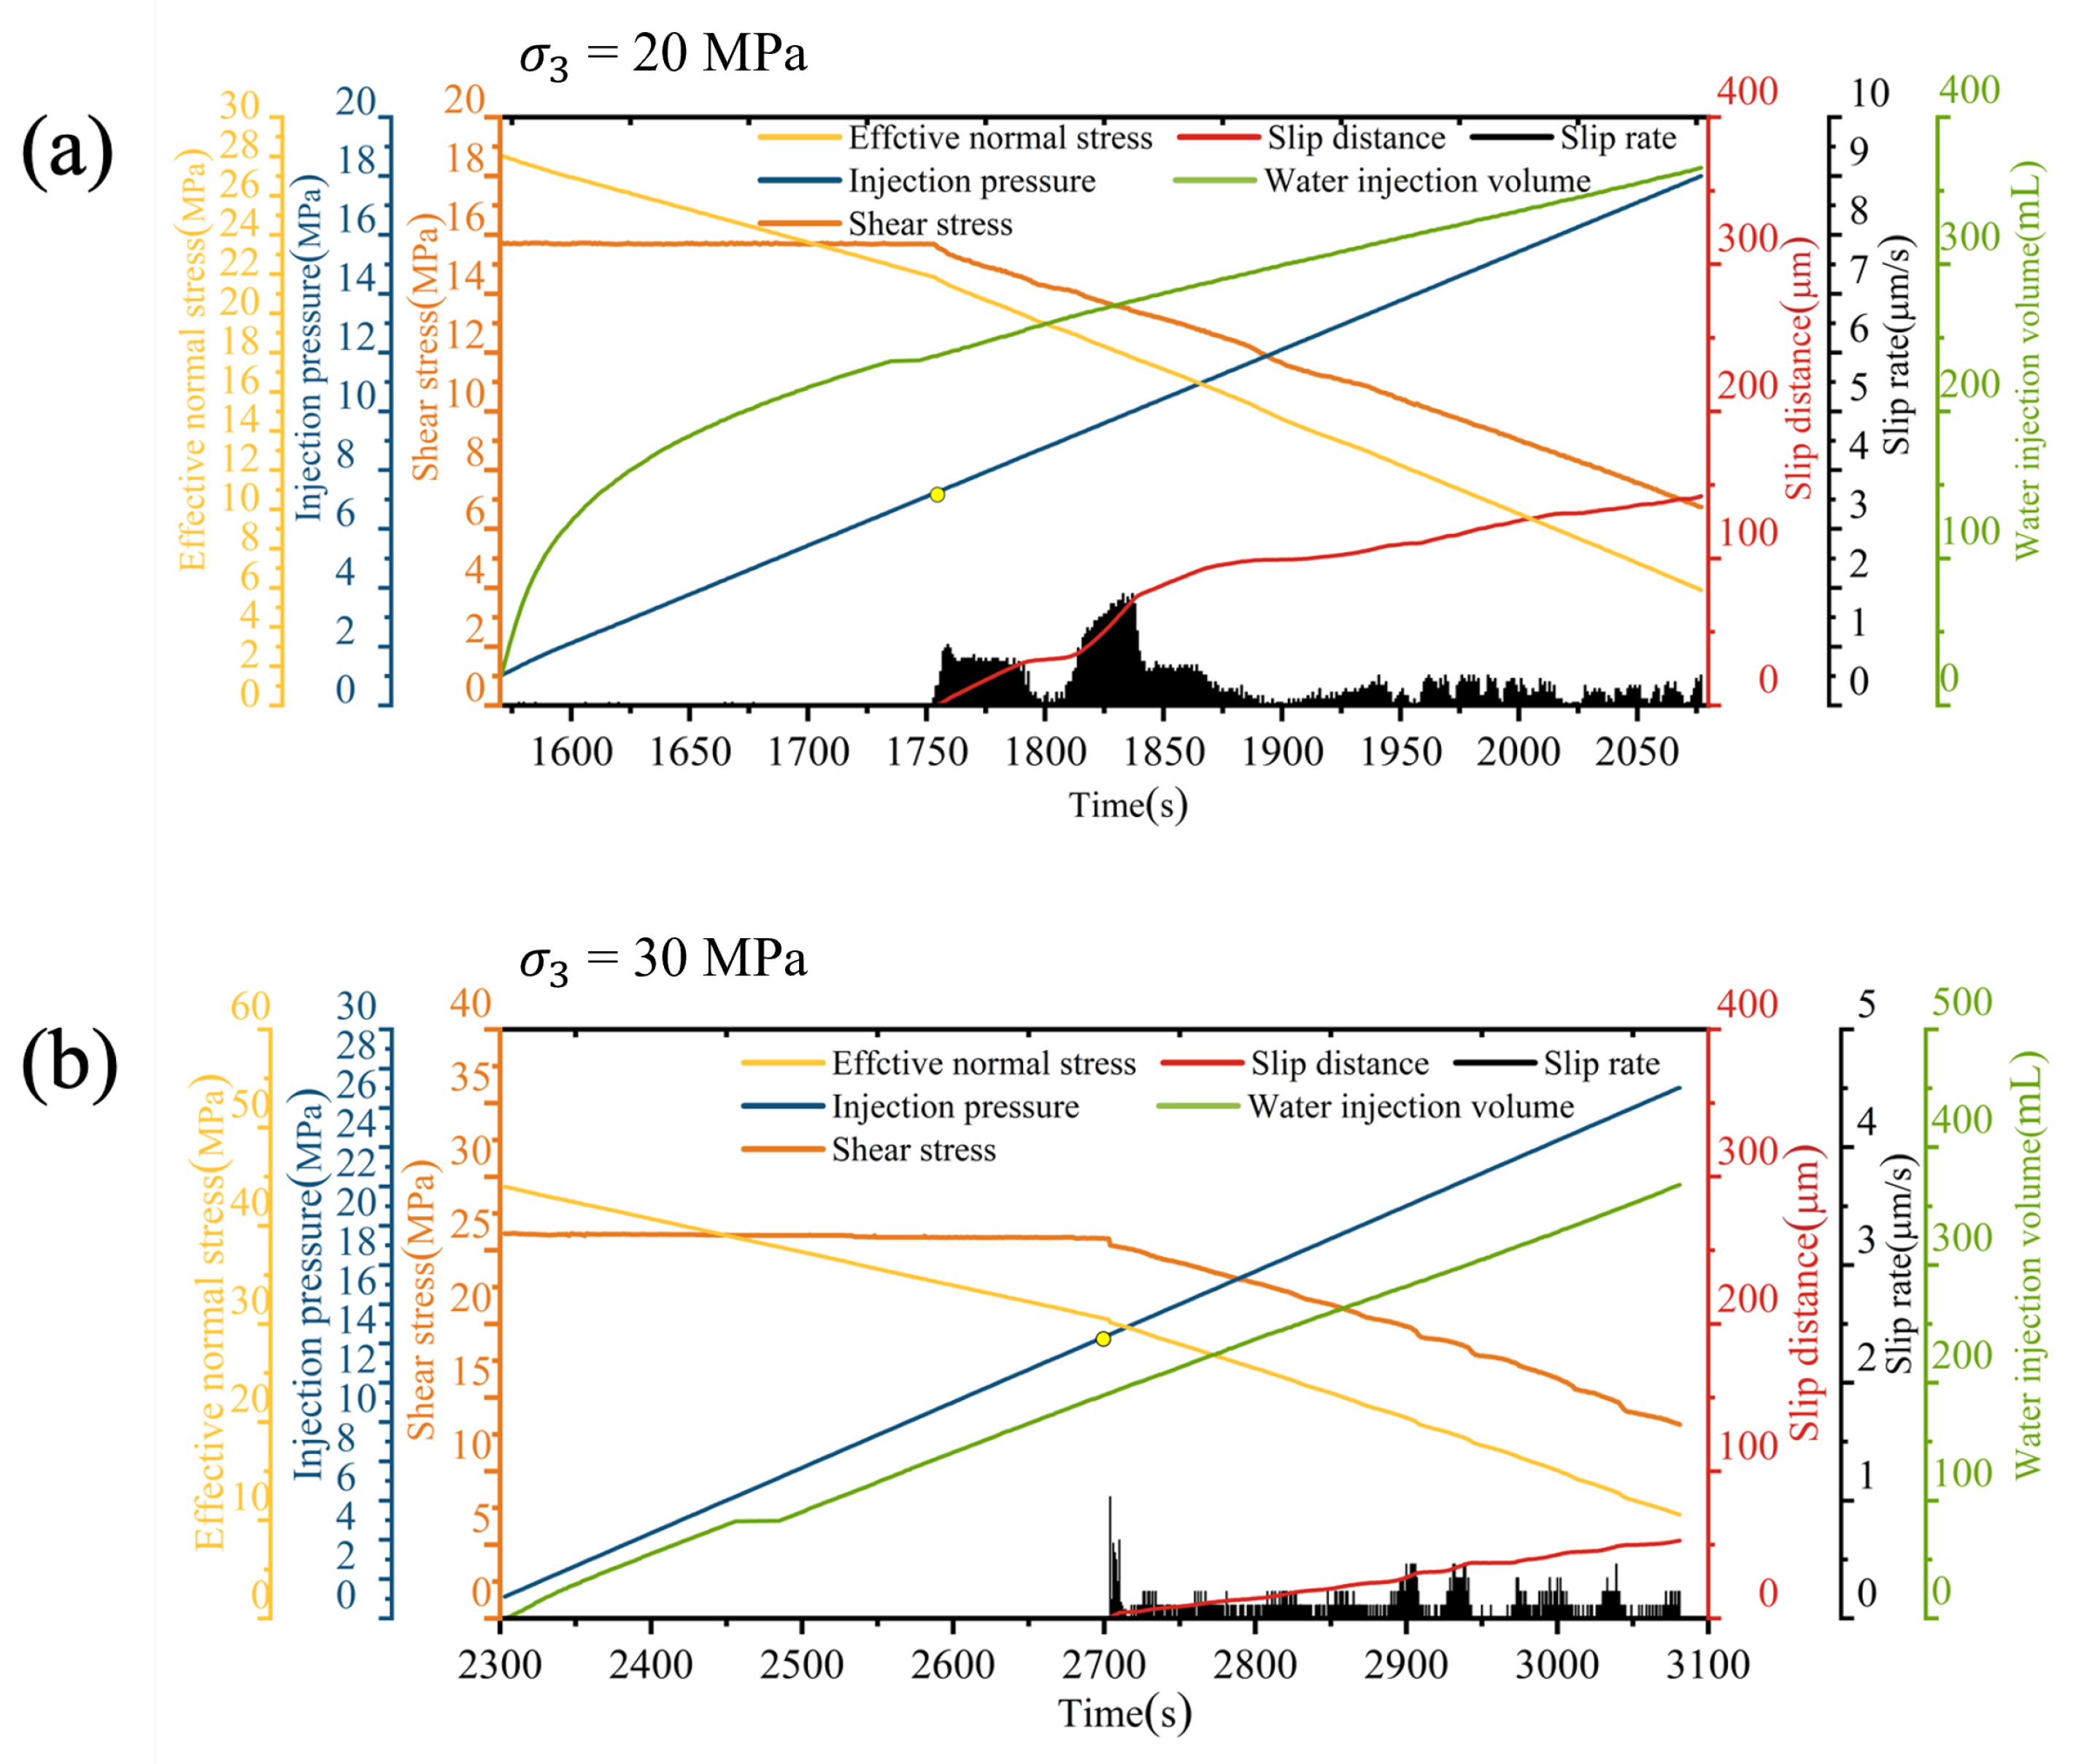
3.2. Cases of Different Confining Pressures

The evolution of the shear stress τ , effective normal stress σ n , injection pressure p, slip distance d s , slip rate v s , and water injection volume under different confining pressures is shown in Figure 5. The yellow circle in Figure 4b shows that the injection pressure required for the initiation of slip was 1.70 MPa at a confining pressure of σ 3 = 10 MPa. In Figure 5a,b, the injection pressures required for fault slip initiation were 7.30 and 14.48 MPa, which correspond to σ 3 = 20 and 30 MPa, respectively, indicating that a greater injection pressure was needed to reactivate a fault when the confining pressure was higher.
The peak slip rate under different confining pressures varied greatly. The peak slip rate at a confining pressure of 10 MPa was 30.95 μ m/s, which was 16.2 times that at 20 MPa (1.91 μ m/s) and 30 times that at 30 MPa (1.03 μ m/s). For a confining pressure of 10 MPa, as shown in Figure 4b, fault reactivation started at a dynamic slip rate of 30.95 μ m/s and was accompanied by an obvious 0.44 MPa shear stress drop and a nonlinear decrease in the effective normal stress. After that, the slip distance curve almost went up linearly, with the slip rate fluctuating at approximately 2 μ m/s. There was no sudden drop in shear stress during the whole process. There was no fault-locking phase ( Δ d s = 0) after the initiation of slip, which indicated that the sliding process was stable. As shown in Figure 5a, under the confining pressure of 20 MPa, two rapid accumulations of slip distance occurred during slip at 1752 and 1809 s, respectively. Two fault-locking events (slip distance curve stopped going up) occurred at 1800 and 1950 s, indicating that stick-slip events occurred during water injection. As shown in Figure 5b, at a confining pressure of 30 MPa, five nonlinear shear stress drops were identified at 2703, 2903, 2941, 3007, and 3041 s, which corresponded to the rapid increase in slip distance. After 2900 s, the slip distance curve increased in a stepwise manner, which also indicated that the fault changed back and forth between locking and reactivation during the slip process.

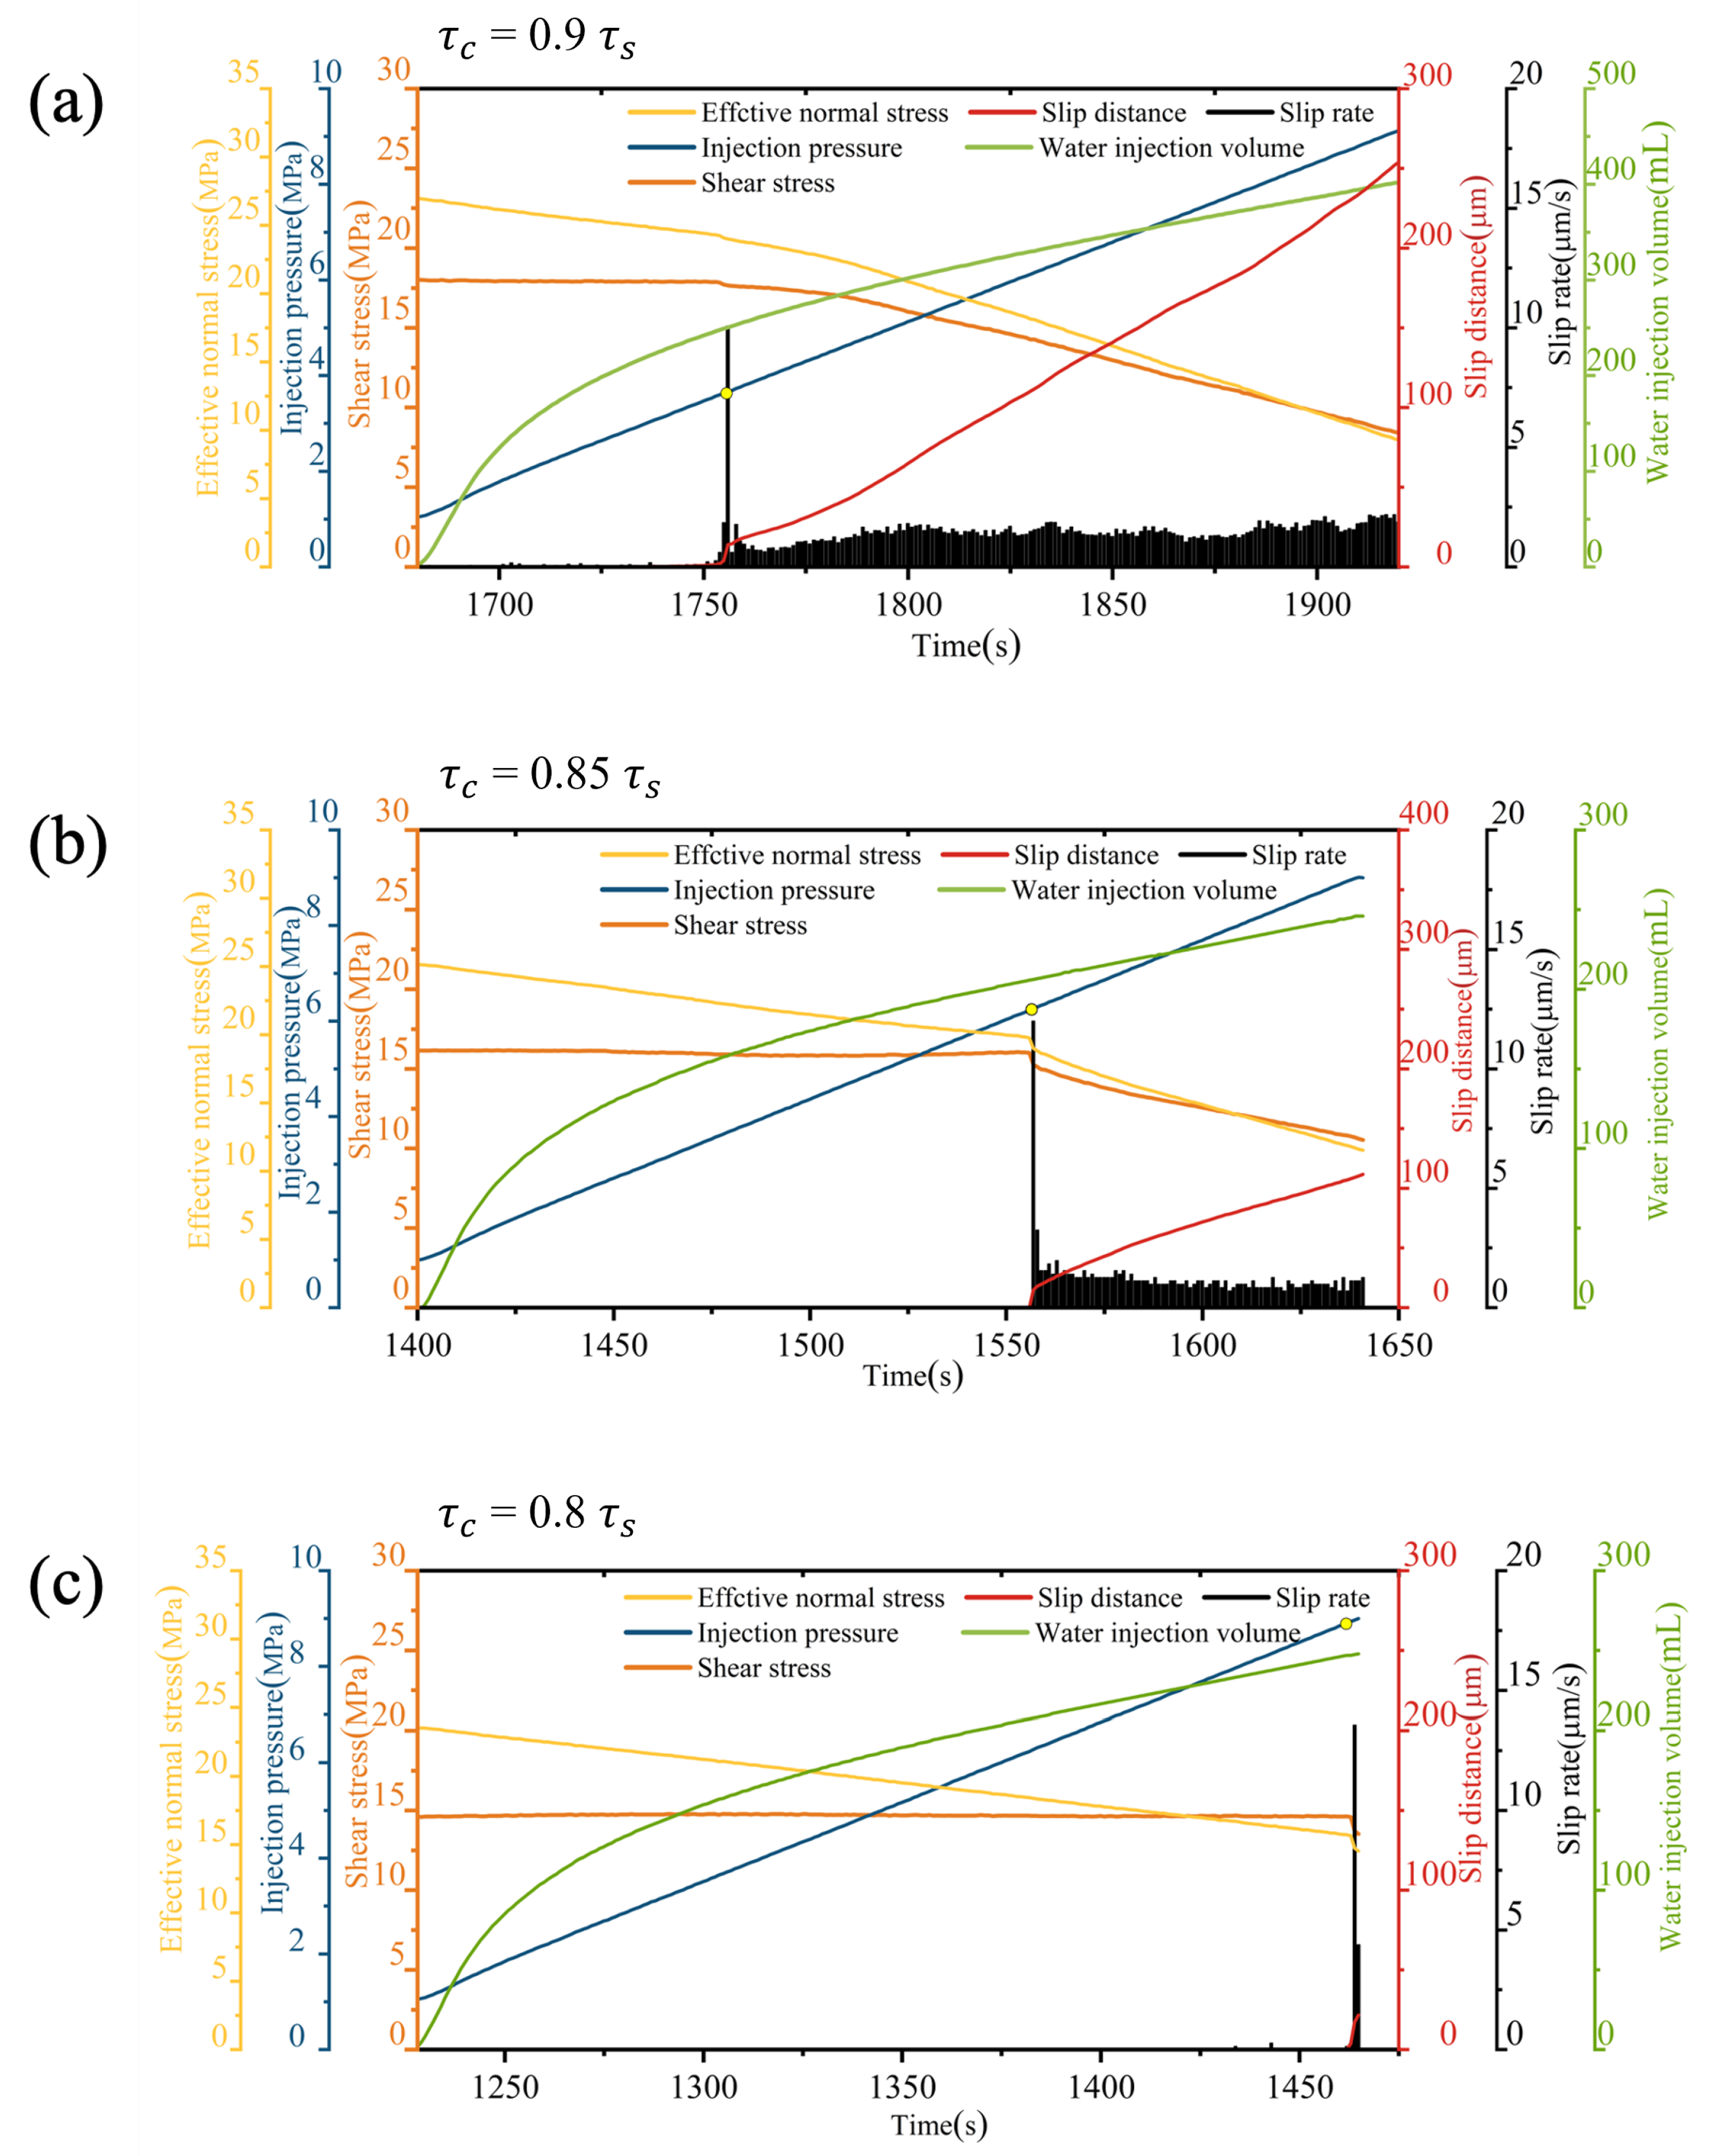
3.3. Cases of Different Initial Stress State

The evolution of the shear stress τ , effective normal stress σ n , injection pressure p, slip distance d s , slip rate v s , and water injection volume under different initial stress states is shown in Figure 6. Shear stress was started at 90% (Figure 6a), 85% (Figure 6b), and 80% (Figure 6c) of their shear strength. As the initial stress state decreased, the injection pressure needed for reactivation initiation increased, from 3.63 MPa at 90%, to 6.26 MPa at 85%, to 8.97 MPa at 80% (yellow circles in Figure 6). The closer the initial stress state was to the shear strength, the easier it was to slip.
The peak slip rate reached 10.08 μ m/s, 12.68 μ m/s, and 14.70 μ m/s, respectively, which meant that different initial stress states had little effect on the peak slip rate (Table 2). Figure 6 shows that the sliding process in the three cases was similar. After fault slip initiation, the shear stress dropped sharply, and the effective normal stress decreased non-linearly under all three situations along with a high slip rate (>10 μ m/s). Then, the slip rate dropped rapidly. Finally, faults slipped at a stable slip rate (approximately 1.5 μ m/s) without locking. The difference between the three initial stress states was the duration of the fault-locked phase in the early stage. Nonetheless, the total distance of shear slip varied greatly. It reached 253 μ m at 90% and 109 µm at 85%, while it reached only 21.53 μ m at 80%. This had to do with the higher water injection pressure required for slip and the shorter slip time in the low initial stress state.

4. Discussion

4.1. Effects of Pressurization Rate on Fault Slip Initiation

Under conditions of different factors and different levels, the injection pressure at the onset of slip was noticeably different, and it was higher than what the fault reactivation criterion predicted. To analyze the potential causes, the overpressure ratio (px) was computed in this research:
p x = p σ n τ μ
where px is the ratio of the injection pressure p (MPa) at the initiation of slip to the theoretical fluid pressure when slip occurs, and σ n (MPa) and τ (MPa) are the normal stress and shear stress on the fault, respectively. The friction coefficient μ = 0.64 was fitted with the shear strength obtained by the displacement-driven shear test under different confining pressures (Figure 7a).
Taking the pressurization rate as an example, since there are three sets of repeating groups at each level, the overpressure ratio of each group is calculated by Formula (7) (Table 3). Excluding data with relative deviations exceeding ±5%, the average overpressure ratio under various levels was calculated, as shown in Figure 7b. The closer the value of the overpressure ratio is to 1, the closer the measured value is to the theoretical prediction. As the pressurization rate increased, the results demonstrated that the measured injection pressure deviated more from the expected fluid pressure, which caused the fluid overpressure ratio to gradually increase from 1.19 to 3.7 (Figure 7b). Furthermore, the overpressure ratio exhibited a similar trend with respect to the impact of the confining pressure. The overpressure ratio rises from 1.78 to 3.24 when the confining pressure increases from 10 MPa to 30 MPa. The overpressure ratio rises from 2.19 to 2.75, while the initial stress state rises from 80% to 90%. However, the values for faults with different initial stress states were 2.22, 2.54, and 2.57, which showed little difference.
The experimental results showed that the injection pressure required for fault reactivation at a high pressurization rate was greater than that at a low pressurization rate and greater than that predicted by theory, possibly showing that the fluid pressure distribution on the fault was not uniform. Ji [37] reproduced the distribution of fluid pressure on the fault through numerical simulation. The results show that the closer it was to the borehole, the greater the fluid pressure, as shown in Figure 8. In addition, a high injection rate increased the degree of non-uniformity of the fluid pressure distribution, as the pressurized area at a high injection rate was significantly smaller than at a low injection rate before slip initiation. Therefore, under a high injection rate, the pressurized area expands continuously before slip starts, but the pressurized area is still much smaller than the fracture area. Because only a small part of the fault is in the pressurized area, higher local pressure is needed to propagate the slip front. As a result, when the pressurization was high, fault slip initiation required a higher injection pressure. However, when the injection rate was low, the pressurized area extended to almost the entire fault when the fault slip started.

4.2. Slip Modes in Fluid Injection

To further study the slip characteristics of faults, changes in the slip rate with time after fault slip initiation were compared and analyzed, as shown in Figure 9. Through the shear tests on cracks, Cappa [38] used quasi-static slip to represent fault slip at low speeds(less than 10 μ m/s) and dynamic slip to represent fault slip at high speeds (more than 10 μ m/s). In this article, the same terminology is used to further analyze slip mode.
As shown in Figure 9a, at a low pressurization rate (0.5 MPa/min), the slip rate remained at about 1.5 µm/s after slip initiation, indicating that the whole process was a quasi-static slip. At a low pressurization rate, the stress relaxation and the applied shear stress were balanced, resulting in sustained and stable fault creep. At 2 MPa/min, 8 MPa/min, and 32 MPa/min, a dynamic slip stage with a slip rate greater than 10 µm/s appeared after slip initiation, indicating that the friction coefficient of the fault changed from static friction to dynamic friction during the process of injection-driven shear slip. The difference among them was the subsequent slip behavior. The slip rate rapidly decreased to about 2.4 μ m/s after dynamic slip at 2 MPa/min for quasi-static slip, while dynamic slip occurred again after quasi-static slip at 8 MPa/min, and the slip rate was larger than the first dynamic slip, showing the characteristics of stick-slip. Additionally, the peak slip rate increased with the increase in the pressurization rate. For a confining pressure of 10 MPa, the slip mode changed from dynamic slip to quasi-static slip as the slip rate changed. However, the whole process was characterized by quasi-static slip at higher confining pressures (20 MPa and 30 MPa), and the slip rate was no higher than 5 μ m/s, as shown in Figure 9b. Faults with different initial stress states had no significant effect on the slip mode after the onset of slip and had the same transition from dynamic slip with a peak slip rate higher than 10 μ m/s to quasi-static slip with a slip rate lower than 4 μ m/s, as shown in Figure 9c. The slip rate measured above is in the same range as the shear slip rate ( 10 7 10 5 m/s) observed by Guglielmi during the occurrence of microearthquakes in field tests [38]. Due to the limitations of laboratory experiments, the process of fault reactivation induced by water injection in real geological engineering environments cannot be fully reflected, and there is a certain size effect, which is also the direction of further exploration.

5. Conclusions

To understand the onset of fault reactivation and slip characteristics during shear stimulation, we conducted injection-driven triaxial shear tests on granite samples containing a single saw-cut fault. Mechanical deformation (stress and deformation) and fluid flow parameters were measured to investigate the coupled hydromechanical responses.
The results show that both the pressurization rate and confining pressure affected the onset of fault reactivation. At a relatively low pressurization rate (0.5 MPa/min), the injection pressure required for fault reactivation was in good agreement with theoretical estimation. With the elevation in pressurization rate, the injection pressure for fault reactivation increased. An increase in the confining pressure also increased the injection pressure for fault reactivation. Our results found both quasi-static slip and dynamic slip occurred on the fault during water injection. Dynamic slip tended to occur at high pressurization rate (>0.5 MPa/min) and was followed by quasi-static slip. It has been observed that the temporal evolution of shear stress drop correlated well with the changes in slip velocity, as a high slip rate corresponded to a sharp shear stress drop. In addition, the peak slip rate of dynamic slip increased with an increasing pressurization rate. The faults showed significant stick-slip characteristics under high confining pressure, as fault locking and reactivation occurred repeatedly. Faults with different initial stress states had little influence on the slip mode after the initiation of slip.

Author Contributions

W.L.: formal analysis; conducting experiments; visualization; writing—original draft; H.S.: project administration; writing—review and editing; technical support. All authors have read and agreed to the published version of the manuscript.

Funding

This study was supported by the National Natural Science Foundation of China (Grant No. 51874054) and the National Key Research and Development Program of China (Grant No. 2023YFC3009001).

Institutional Review Board Statement

Not applicable.

Informed Consent Statement

Not applicable.

Data Availability Statement

The data that support the findings of this study are available from the corresponding author upon reasonable request.

Acknowledgments

We gratefully acknowledge the State Key Laboratory of Coal Mine Disaster Dynamics and Control for providing the necessary equipment for this study. We extend our gratitude to the editors and anonymous reviewers for their valuable suggestions and comments.

Conflicts of Interest

The authors declare no conflicts of interest.

References

  1. Khan, Y.; Liu, F. Consumption of energy from conventional sources a challenge to the green environment: Evaluating the role of energy imports, and energy intensity in Australia. Environ. Sci. Pollut. Res. 2022, 30, 22712–22727. [Google Scholar] [CrossRef] [PubMed]
  2. Zuo, Y.; Kong, Y.; Jiang, S.; Shao, H.; Zhu, H.; Yang, M. Progress in exploration, development and utilization of geothermal energy. Front. Earth Sci. 2022, 10, 911376. [Google Scholar] [CrossRef]
  3. Balat, M.; Balat, H.; Faiz, U. Utilization of Geothermal Energy for Sustainable Global Development. Energy Sources Part B Econ. Plan. Policy 2009, 4, 295–309. [Google Scholar] [CrossRef]
  4. Hamm, S.G.; Anderson, A.; Blankenship, D. Geothermal Energy R & D: An Overview of the U.S. Department of Energy’s Geothermal Technologies Office. J. Energy Resour. Technol. 2021, 143, 100801. [Google Scholar] [CrossRef]
  5. Baria, R.; Baumgärtner, J.; Rummel, F.; Pine, R.J.; Sato, Y. HDR/HWR reservoirs: Concepts, understanding and creation. Geothermics 1999, 28, 533–552. [Google Scholar] [CrossRef]
  6. Tester, J.W.; Anderson, B.J.; Batchelor, A.S. Impact of enhanced geothermal systems on US energy supply in the twenty-first century. Philos. Trans. R. Soc. A Math. Phys. Eng. Sci. 2007, 365, 1057–1094. [Google Scholar] [CrossRef] [PubMed]
  7. Feng, C.; Gao, G.; Zhang, S. Fault slip potential induced by fluid injection in the Matouying enhanced geothermal system (EGS) field, Tangshan seismic region, North China. Nat. Hazards Earth Syst. Sci. 2022, 22, 2257–2287. [Google Scholar] [CrossRef]
  8. McGarr, A. Maximum magnitude earthquakes induced by fluid injection. J. Geophys. Res. Solid Earth 2014, 119, 1008–1019. [Google Scholar] [CrossRef]
  9. Langenbruch, C.; Zoback, M. How will induced seismicity in Oklahoma respond to decreased saltwater injection rates? Sci. Adv. 2016, 2, e1601542. [Google Scholar] [CrossRef] [PubMed]
  10. Mignan, A.; Landtwing, D.; Kästli, P. Induced seismicity risk analysis of the 2006 Basel, Switzerland, Enhanced Geothermal System project: Influence of uncertainties on risk mitigation. Geothermics 2015, 53, 133–146. [Google Scholar] [CrossRef]
  11. Kim, K.H.; Ree, J.H.; Kim, Y.; Kim, S.; Kang, S.Y.; Seo, W. Assessing whether the 2017 Mw 5.4 Pohang earthquake in South Korea was an induced event. Science 2018, 360, 1007–1009. [Google Scholar] [CrossRef] [PubMed]
  12. Sibson, R.H. A note on fault reactivation. J. Struct. Geol. 1985, 7, 751–754. [Google Scholar] [CrossRef]
  13. Dou, Z.; Gao, T.; Zhao, Z.; Li, J.; Yang, Q.; Shang, D. The role of water lubrication in critical state fault slip. Eng. Geol. 2020, 271, 105606. [Google Scholar] [CrossRef]
  14. Shang, D.; Zhao, Z.; Dou, Z.; Yang, Q. Shear behaviors of granite fractures immersed in chemical solutions. Eng. Geol. 2020, 279, 105869. [Google Scholar] [CrossRef]
  15. Ellsworth, W.L. Injection-Induced Earthquakes. Science 2013, 341, 1225942. [Google Scholar] [CrossRef]
  16. Rubinstein, J.L.; Ellsworth, W.L.; Dougherty, S.L. Erratum to The 2013–2016 Induced Earthquakes in Harper and Sumner Counties, Southern Kansas. Bull. Seismol. Soc. Am. 2018, 108, 3699–3700. [Google Scholar] [CrossRef]
  17. Meng, L.; McGarr, A.; Zhou, L.; Zang, Y. An Investigation of Seismicity Induced by Hydraulic Fracturing in the Sichuan Basin of China Based on Data from a Temporary Seismic Network. Bull. Seismol. Soc. Am. 2019, 109, 348–357. [Google Scholar] [CrossRef]
  18. Segall, P.; Fitzgerald, S.D. A note on induced stress changes in hydrocarbon and geothermal reservoirs. Tectonophysics 1998, 289, 117–128. [Google Scholar] [CrossRef]
  19. Barbour, A.J.; Norbeck, J.H.; Rubinstein, J.L. The effects of varying injection rates in Osage County, Oklahoma, on the 2016 M w 5.8 Pawnee earthquake. Seismol. Res. Lett. 2017, 88, 1040–1053. [Google Scholar] [CrossRef]
  20. Frohlich, C. Two-year survey comparing earthquake activity and injection-well locations in the Barnett Shale, Texas. Proc. Natl. Acad. Sci. USA 2012, 109, 13934–13938. [Google Scholar] [CrossRef] [PubMed]
  21. Keranen, K.M.; Weingarten, M. Induced Seismicity. Annu. Rev. Earth Planet. Sci. 2018, 46, 149–174. [Google Scholar] [CrossRef]
  22. Keranen, K.M.; Weingarten, M.; Abers, G.A.; Bekins, B.A.; Ge, S. Sharp increase in central Oklahoma seismicity since 2008 induced by massive wastewater injection. Science 2014, 345, 448–451. [Google Scholar] [CrossRef] [PubMed]
  23. Yeo, I.W.; Brown, M.R.M.; Ge, S.; Lee, K.K. Causal mechanism of injection-induced earthquakes through the Mw 5.5 Pohang earthquake case study. Nat. Commun. 2020, 11, 2614. [Google Scholar] [CrossRef] [PubMed]
  24. Goebel, T.H.W.; Rosson, Z.; Brodsky, E.E.; Walter, J.I. Aftershock deficiency of induced earthquake sequences during rapid mitigation efforts in Oklahoma. Earth Planet. Sci. Lett. 2019, 522, 135–143. [Google Scholar] [CrossRef]
  25. Rajesh, R.; Gupta, H.K. Characterization of injection-induced seismicity at north central Oklahoma, USA. J. Seismol. 2021, 25, 327–337. [Google Scholar] [CrossRef]
  26. Cueto-Felgueroso, L.; Santillán, D.; Mosquera, J.C. Stick-slip dynamics of flow-induced seismicity on rate and state faults. Geophys. Res. Lett. 2017, 44, 4098–4106. [Google Scholar] [CrossRef]
  27. Andrés, S.; Santillán, D.; Mosquera, J.C.; Cueto-Felgueroso, L. Delayed Weakening and Reactivation of Rate-and-State Faults Driven by Pressure Changes Due to Fluid Injection. J. Geophys. Res. Solid Earth 2019, 124, 11917–11937. [Google Scholar] [CrossRef]
  28. Zhu, W.; Allison, K.L.; Dunham, E.M.; Yang, Y. Fault valving and pore pressure evolution in simulations of earthquake sequences and aseismic slip. Nat. Commun. 2020, 11, 4833. [Google Scholar] [CrossRef] [PubMed]
  29. Dong, L.; Luo, Q. Investigations and new insights on earthquake mechanics from fault slip experiments. Earth-Sci. Rev. 2022, 228, 104019. [Google Scholar] [CrossRef]
  30. Passelègue, F.X.; Brantut, N.; Mitchell, T.M. Fault Reactivation by Fluid Injection: Controls From Stress State and Injection Rate. Geophys. Res. Lett. 2018, 45, 12-837. [Google Scholar] [CrossRef]
  31. Ye, Z.; Ghassemi, A. Heterogeneous fracture slip and aseismic-seismic transition in a triaxial injection test. Geophys. Res. Lett. 2020, 47, e2020GL087739. [Google Scholar] [CrossRef]
  32. Rutter, E.; Hackston, A. On the effective stress law for rock-on-rock frictional sliding, and fault slip triggered by means of fluid injection. Philos. Trans. R. Soc. A Math. Phys. Eng. Sci. 2017, 375, 20160001. [Google Scholar] [CrossRef] [PubMed]
  33. Noël, C.; Passelègue, F.X.; Giorgetti, C.; Violay, M. Fault Reactivation During Fluid Pressure Oscillations: Transition From Stable to Unstable Slip. J. Geophys. Res. Solid Earth 2019, 124, 10940–10953. [Google Scholar] [CrossRef]
  34. Nemoto, K.; Moriya, H.; Niitsuma, H.; Tsuchiya, N. Mechanical and hydraulic coupling of injection-induced slip along pre-existing fractures. Geothermics 2008, 37, 157–172. [Google Scholar] [CrossRef]
  35. French, M.E.; Zhu, W.; Banker, J. Fault slip controlled by stress path and fluid pressurization rate. Geophys. Res. Lett. 2016, 43, 4330–4339. [Google Scholar] [CrossRef]
  36. Brace, W.F.; Byerlee, J.D. Stick-Slip as a Mechanism for Earthquakes. Science 1966, 153, 990–992. [Google Scholar] [CrossRef] [PubMed]
  37. Ji, Y.; Wanniarachchi, W.A.M.; Wu, W. Effect of fluid pressure heterogeneity on injection-induced fracture activation. Comput. Geotech. 2020, 123, 103589. [Google Scholar] [CrossRef]
  38. Cappa, F.; Guglielmi, Y.; Nussbaum, C.; Birkholzer, J. On the Relationship Between Fault Permeability Increases, Induced Stress Perturbation, and the Growth of Aseismic Slip During Fluid Injection. Geophys. Res. Lett. 2018, 45, 11-012. [Google Scholar] [CrossRef]
Figure 1. (a) A sketch of the granite sample size design. (b) A well-prepared granite sample.
Applsci 14 03322 g001
Figure 2. (a) The GCTS equipment and sample assembly. (b) A sketch describing the stress and deformation of the fault under triaxial shear test.
Applsci 14 03322 g002
Figure 3. Diagram of the whole load path including the following: displacement-driven shear test (Stage 1), unloading (Stage 2), and injection-driven shear test (Stage 3), performed at pressurization rates of 0.5 MPa/min, σ 3 = 10 MPa, and an inclination angle ψ = 30°.
Applsci 14 03322 g003
Figure 4. Time evolution of the shear stress τ , effective normal stress σ n , injection pressure p, slip distance d s , slip rate v s , and water injection volume in the injection-driven shear test at pressurization rates of (a) 0.5 MPa/min; (b) 2 MPa/min; (c) 8 MPa/min; and (d) 32 MPa/min. Yellow circles mark the injection pressure at fault slip onset.
Applsci 14 03322 g004
Figure 5. Time evolution of the shear stress τ , effective normal stress σ n , injection pressure p, slip distance d s , slip rate v s , and water injection volume at different confining pressures in the injection-driven shear test (a) at σ 3 = 20 MPa and (b) at σ 3 = 30 MPa. Yellow circles mark the injection pressure at fault slip initiation.
Applsci 14 03322 g005
Figure 6. Time evolution of the shear stress τ , effective normal stress σ n , injection pressure p, slip distance d s , slip rate v s , and water injection volume at different initial stress states in the injection-driven shear test (a) at τ c = 0.9 τ s ; (b) at τ c = 0.85 τ s ; and (c) at τ c = 0.8 τ s . Yellow circles mark the injection pressure at fault slip initiation.
Applsci 14 03322 g006
Figure 7. (a) The frictional coefficient obtained by fitting shear the strength. (b) The overpressure ratio for different factors and levels.
Applsci 14 03322 g007
Figure 8. The distribution of fluid pressure during injection.
Applsci 14 03322 g008
Figure 9. Time evolution of the slip rate during water injection at (a) different pressurization rates, (b) different confining pressures, and (c) different initial stress states.
Applsci 14 03322 g009
Table 1. Average measurements of physical and mechanical properties of granite.
Density (g/cm3)Young’s Modulus (GPa)Poisson’s RatioUCS (MPa)
2.8092.850.26152.84
UCS represents the uniaxial compressive strength.
Table 2. Summary of experimental conditions and partial results.
Test No.Pressurization Rate (MPa/min)Confining Pressure σ 3 (MPa)Inclination Angle (°)Shear Strength τ s (MPa)Critical Shear Stress τ c (MPa)Slip Distance d s ( μ m)Peak Slip Rate v s ( μ m/s)
Z10.510609.260.9 τ s 226.890.84
Z2210609.570.9 τ s 198.1430.95
Z3810609.590.9 τ s 227.959.89
Z43210609.350.9 τ s 213.864.6
W22206017.590.9 τ s 1421.91
W32306028.990.9 τ s 52.881.03
J12104519.870.9 τ s 25310.08
J22104519.010.85 τ s 10912.68
J32104518.230.80 τ s 21.5314.70
Table 3. The overpressure ratios of three repeated groups under different pressurization rates.
Overpressure Ratio px
Sample No.0.5 MPa/min2 MPa/min8 MPa/min32 MPa/min
Test no.11.181.852.683.77
Test no.21.141.692.473.71
Test no.31.291.822.523.63
Average1.191.782.563.7
Disclaimer/Publisher’s Note: The statements, opinions and data contained in all publications are solely those of the individual author(s) and contributor(s) and not of MDPI and/or the editor(s). MDPI and/or the editor(s) disclaim responsibility for any injury to people or property resulting from any ideas, methods, instructions or products referred to in the content.

