1. Introduction
Industry 4.0 has a significant impact on production systems. On the other hand, safety at work at construction sites plays an essential role in this context of the new industrial dimension. New technological tools such as the Internet of Things (IoT), cloud computing, big data, and virtual reality, among others, generate a new labor ecosystem for analysis of the products of work methods.
In the construction sector, the presence of heavy machinery and workers in concrete processes and the fact that non-stabilized labor appears implies an environment full of constant changes. Therefore, from the point of view of occupational safety and risk prevention, challenges are faced that perhaps do not exist in other sectors of the industry.
The rate of construction accidents is one of the most pressing issues at the European and international levels [
1,
2] Spain has one of the highest accident rates in the European Union, although in the construction sector in the last ten years a considerable decrease has been detected [
3].
An important factor is the costs associated with these accidents, such as the human factor (Work Experience, Physical Health, Educational Background, Professional Competence and Emotional Intelligence) [
4], which is not measurable, and others of an economic nature, such as casualties due to accidents and the medical treatments associated with them [
5].
For this reason, it is considered essential to introduce new methodologies or technologies that help to continue decreasing the number of accidents [
6].
One of the ways that can be effective in achieving this reduction is through the application of new digital technologies that, in many cases, are managing to improve and perfect many of the activities and tasks carried out with other manual procedures. For example, sensing and display technology through the digital twin (DT) has offered the potential to improve construction health and safety in the workplace [
7]. However, its applicability in the area of occupational health and safety is still in the development phase. In this context, the existence of two areas of the digital branch that constitute progress in occupational health has been detected. On the one hand, virtual reality [
8,
9] and Building Information Modeling (BIM) [
2,
8,
10,
11].
In the construction sector, BIM methodology is a digital representation of the physical and functional characteristics of a facility [
12].
In this context, a new stage appears, “Smart Construction”, in which various applications arise around 3D modelling that establish two large areas on which health and safety studies can focus at work: BIM, digital capture, and recording technologies.
On the one hand, BIM occupies the largest scientific study at the moment, followed by the database and virtual reality. Not far away is the study of capture and recording technologies such as the LiDAR system [
13]. With regard to this latest technology, reverse engineering (RE) is a technology that is essentially used to create three-dimensional models by scanning objects or structures. Registration through Massive Data Capture Systems (MDCS) guarantees a short-term analysis of the morphology of construction products and elements.
However, most scientific studies that use reverse engineering methodology focus on issues related to built heritage as an example of the evaluation of the seismic behavior of buildings [
14]. BIM 3D geometric model for energy efficiency and retrofitting building façades [
15]. For the building of the 3D geometric model or the creation of building information models applied to heritage [
16], this information benefits architects and engineers for evaluation management.
Reverse engineering is also focused on resolving issues related to civil engineering, such as quality inspection that would make up the detection of cracks in bridges, loss of mass that determines dynamic loads caused by traffic and winds, detection of corrosion, the presence of water, and, in general, structural evaluation [
17].
As has been seen, there is one prospect for the use of new technologies for data collection related to safety and health in construction work. Therefore, at this point, it has been detected that most investigations focus their work on identifying risks in the design. That is why in this investigation, evaluation and analysis are carried out through reverse engineering evaluation. That is, it is about establishing and identifying risks in situ by capturing data records during the construction process, making several records in successive stages of the process. This implies the novelty of acquiring parameters related to the overlap of activities, work interferences, and spatiality of the collections. So, evaluate the semantic information model of the BIM construction, in which the deformations between the ideal model and what was executed can be determined.
1.1. Literature Reviews
Safety at work is one of the main concerns in the construction sector. Statistics on illnesses and deaths in workplaces in this industry continue to be a problem for institutions and governments in some parts of the world. An estimated 36% of all fatalities in the US workplace occur in the construction industry [
12].
One of the factors that contributes to the large number of work accidents is poor organization and programming during the execution of building and civil engineering works.
The appearance of the new Information and Communication Technologies (ICT) represents an advance in this area in terms of its applicability in the different phases of construction.
The new paradigm of building information modeling (BIM) offers great potential to explore, allowing its use to improve occupational safety so that agents in the construction sector can more accurately assess dangerous conditions in workplaces [
18].
Building information modeling has, among other things, the potential to address poor safety performance in the project life cycle. BIM is currently widely implemented in the construction sector, and, specifically in terms of safety, numerous articles have been published [
19].
In Spain, the implementation of this methodology still has a long way to go, but in other countries, good integration has been achieved. The uses of BIM platforms regarding safety at work are very varied, from helping to improve the capacity and information of the workers to carrying out identification of occupational risks and analysis of different tasks and even the investigation of accidents during the different phases of the process [
20].
Advances in data collection technologies have been significant, such as Structure-from-Motion (SfM) and Unmanned Aerial Vehicles (UAV) and the use of LiDAR (Light Detection and Ranging) terrestrial technologies in environments such as infrastructure and works. It is evident that, given their precision and the amount of data that can be obtained, these technologies can contribute to advanced risk analysis in the safety and quality of construction, providing a non-intrusive mechanism and sometimes easy-to-use equipment that can provide a lot of valuable and reliable information.
On the other hand, in relation to these technologies, some research has been focused on establishing hypotheses that develop monitoring or tracking to reproduce activity workflows, such as security monitoring through photogrammetry [
21], prediction to detect risks in the workplace based on laser scanning [
22], or the automated identification of objects in 3D space to prevent injuries and deaths in the workplace using cascade mask R-CNN from the point cloud [
23].
Within the framework of the above considerations, it should be noted that BIM occupies an important space, among other reasons, because construction information modeling applications may not only contain aspects that have to do with design and construction planning but rather occupy an essential place in the space of process simulation.
Several authors have made proposals on how to bring security through the design phase of BIM. Safety Through Design: A BIM-Based Framework is an article that deals with it, in which a methodology was developed through which, through the 3D design of both the building and the corresponding safety elements, it was possible to implement StD (Safety Through Design) from the design phase of the building [
24]. Other articles, such as “Building Information Modeling (BIM) for Safety Risk Identification in Construction Projects,” have proposed different types of methodologies. In this case, the model proposed indicates the existing risks related to the placement, handling, or absence of protective equipment in a construction project [
25].
In another line of work, Cortés-Pérez et al. [
2] propose a methodology in accordance with the Spanish health and safety regulations for the integration in the design phase of projects executed with BIM.
Although much of the research on occupational health and safety is focused on methodologies related to the design phase [
26], other works focus the study on an approach to the use of 4D-BIM, that is, on planning and communication [
26,
27,
28].
The development of digital tools contributes to a great extent in all areas of knowledge, but in particular, they can help improve safety in construction, so the proposal of a Prevention approach based through Design (PtD) [
29] could translate into minimizing the risks and improving safety.
An important space within the BIM methodology is the study of ontology. Semantics is the key to the identification of standard security industry hazards, thus aiding in the identification of risks.
In relation to the entire framework developed, the evolution of the new digital tools to apply reverse engineering and, from here, develop quality control evaluations is observed, and some knowledge gaps in terms of health and safety research in construction with respect to digital communication are closed, with the purpose of improving the processes of the construction industry.
1.2. Objectives
The objective of this article is not to present the framework of a BIM-based “rules check” method for the design phase supported by the security measures established in the legal security requirements, as occurs in other studies carried out [
24], but to establish a framework of knowledge and analysis regarding the quality of construction in the structure phase and determine the levels of health and safety risks through the application of reverse engineering processes. This implies the novelty of acquiring factors or parameters related to the overlap of activities, work interferences, and spatiality of the collections. It is therefore an unprecedented investigation that materializes from five phases of scanning in the process of constructing the structures of a building. For this, a methodology will be carried out through a comparison algorithm in this first phase of evaluation, and later, based on the analysis, the risk levels will be established.
2. Methodology
The research began with the study of the regulations for the implementation of Occupational Risk Prevention and the regulatory framework that the European Union has used. To apply the new reverse engineering technologies, the processing of the point cloud captured from the asset is established, evaluating the quality of the scan in
Section 2.2 and
Section 2.3. Within this same evaluation section, the study of Pillar and Wall 1 is carried out. In
Section 2.4, the study of Dynamic Spatial Interference (DSI) is developed to determine the avoidable risks in the determined spatial framework. These risks are identified in
Section 2.5. In
Section 2.6, an experiment is developed through the influence of sampling patterns, generating a 3D digital elevation model, identifying the storage area, and identifying the static elements of the study area. This pattern is modeled and statistically graphed, obtaining results in
Section 2.7. From this, an approach is developed aimed at modeling in BIM the part of the basement chosen to evaluate the model. Finally,
Section 3 discusses the results.
2.1. Choice of Case Study
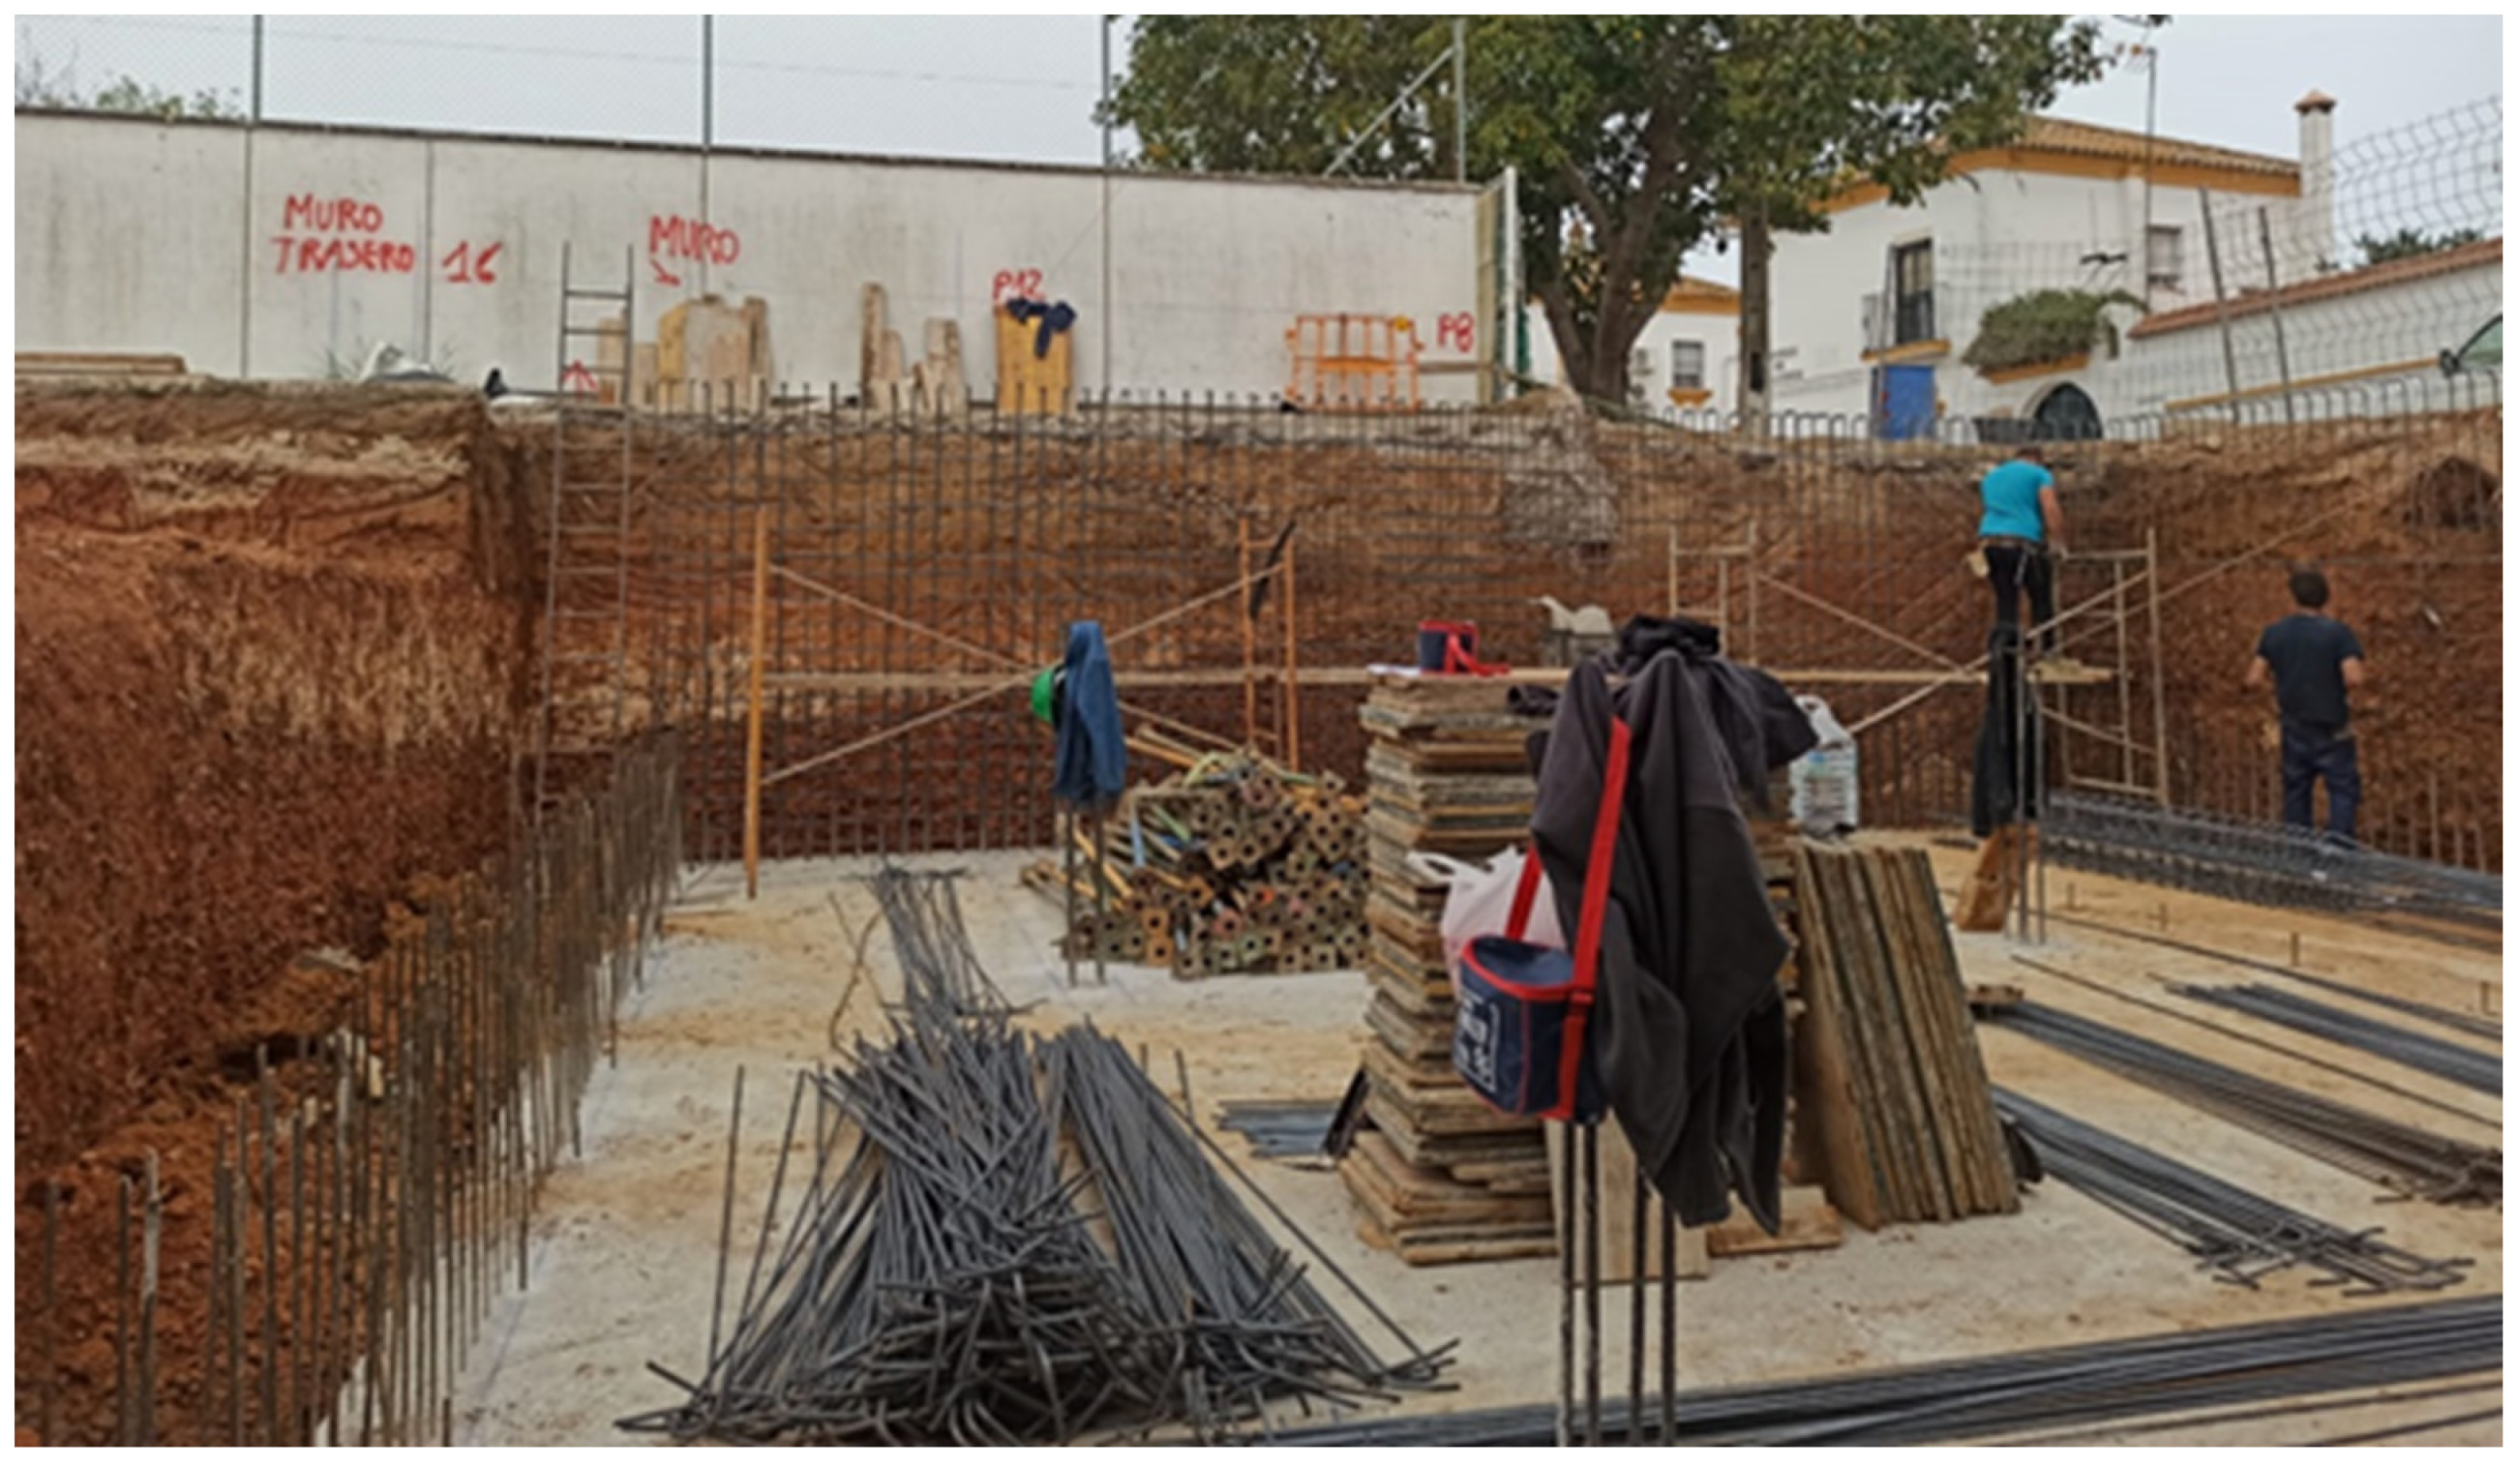
To carry out this research work, it was decided to request permission from the technical management of the construction under study to make five records of the construction process from the foundation to the finished structural unit.
The chosen construction is a single-family home between party walls located in the Bellavista neighborhood, a town south of Seville, Spain (
Figure 1).
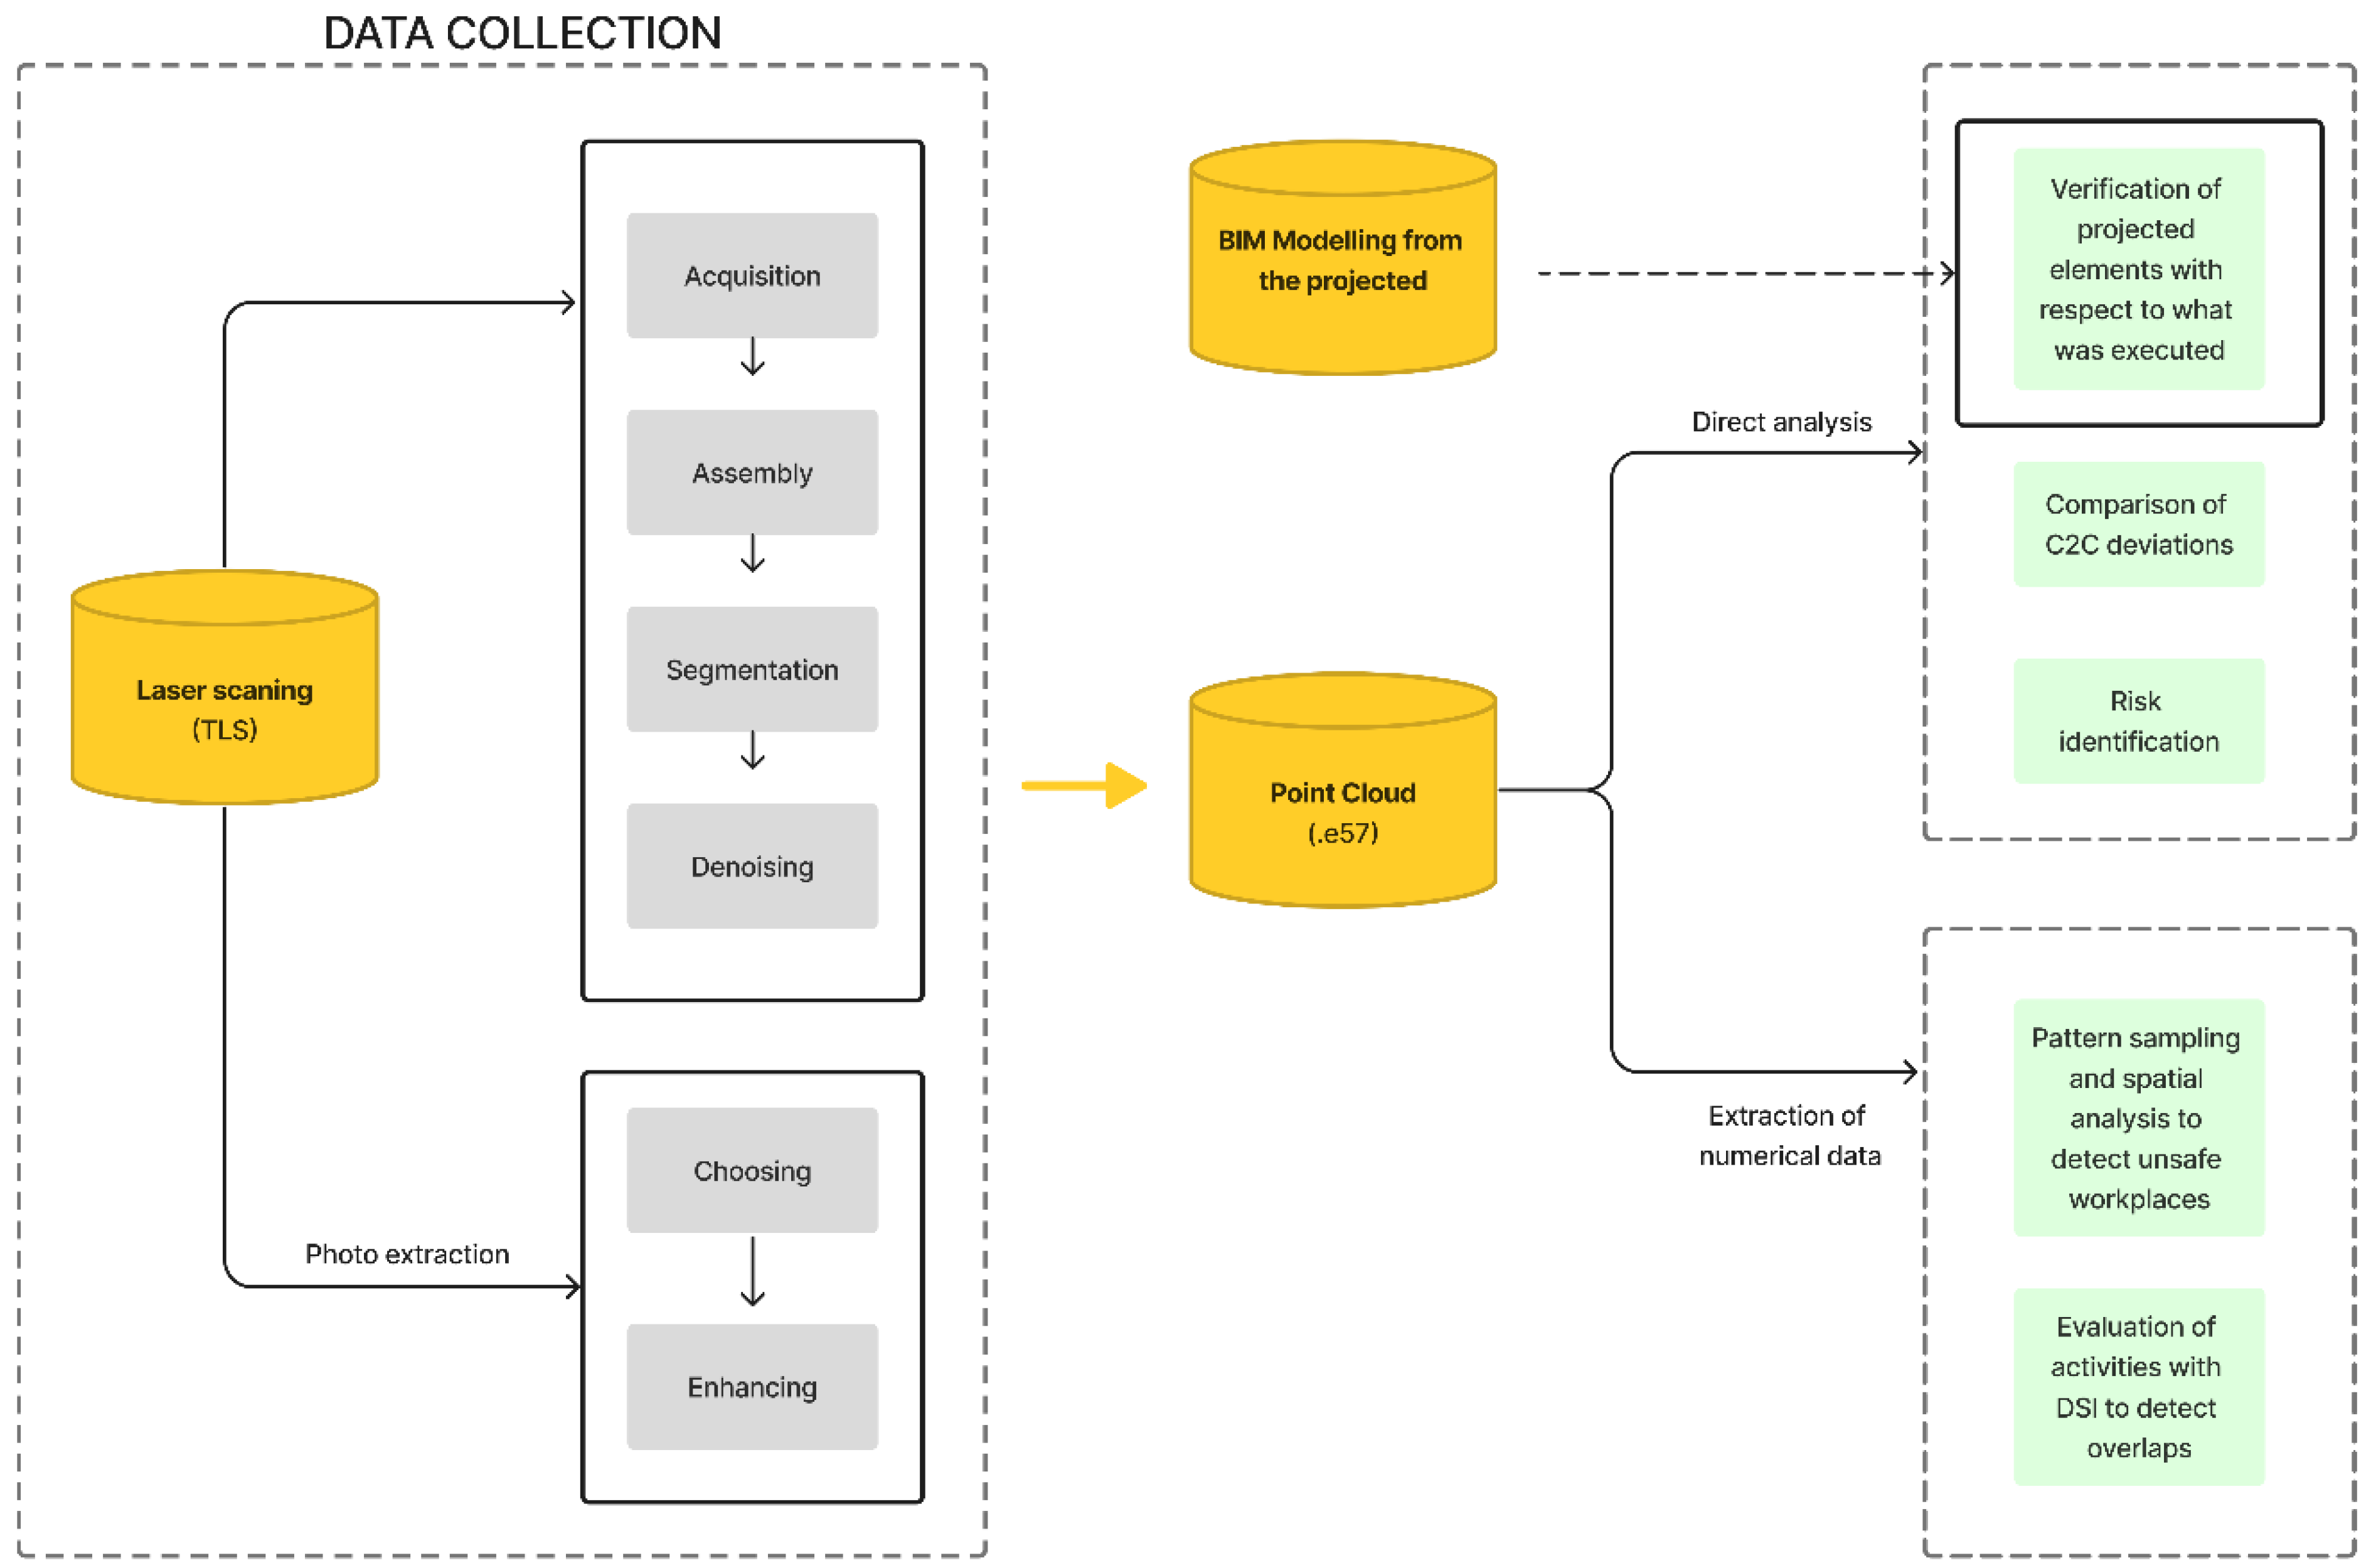
The registration of the point cloud is carried out by means of massive data acquisition techniques (MDCS). The importance of acquiring replicas through terrestrial laser scanning (TLS) compared to traditional methods is well known. The connection between security and operators lies in the construction space, and the new terrestrial laser scanner technologies are responsible for making measurements with millimeter precision. So Tao Chang [
30] defined three categories of spaces in which topology space represents the built environment essential for security. Therefore, in this research, the main components of the approach are described in the flowchart of
Figure 2.
New TLS data acquisition technologies, which determine precision and speed, are combined with measurement equipment such as the total station with the aim of georeferencing the point cloud. A georeferenced point cloud is embedded in a fixed coordinate system on Earth [
31] such as WGS84 (World Geodetic System, 1984), in which each point has three coordinates, Pi = (xi, yi, zi). The point cloud provides other valuable information having to do with point attributes, such as vectors and color characteristics. In addition, the point cloud used in reverse engineering allows direct measurement and insertion of this file into 3D modeling platforms, such as building information modeling (BIM) platforms. The point cloud insertion process in BIM will follow the steps established by Moyano et al. [
32], where, depending on the type of software and the collection of the data set, the insertion is either direct or performed through other links.
2.2. Point Cloud Processing
The terrestrial laser scanner is used to obtain the data from the cloud of points that are stored in a data structure that contains a vertical angle Ɵ, a horizontal angle ϕ, and the distance R between the scanner and the object [
33].
For registration, a BLK360 Personal Laser Scanning (PLS) weighing 1 kg was used, which makes it very useful for managing non-complex architectures [
34].
The BLK360 Terrestrial Laser scanner (Leica Geosystems, Switzerland) uses waveform scanning (WFD) technology, with a maximum speed of 360,000 points/s. The description, precision, and characteristics of said equipment can be seen in the work carried out by Moyano et al. [
34] in relation to works that are related to the field of architectural heritage. Regarding processing, the BLK360 operates through the Cyclone FIELD 360 software (in its updated version as of the shipping date) using a tablet as an operator in field work.
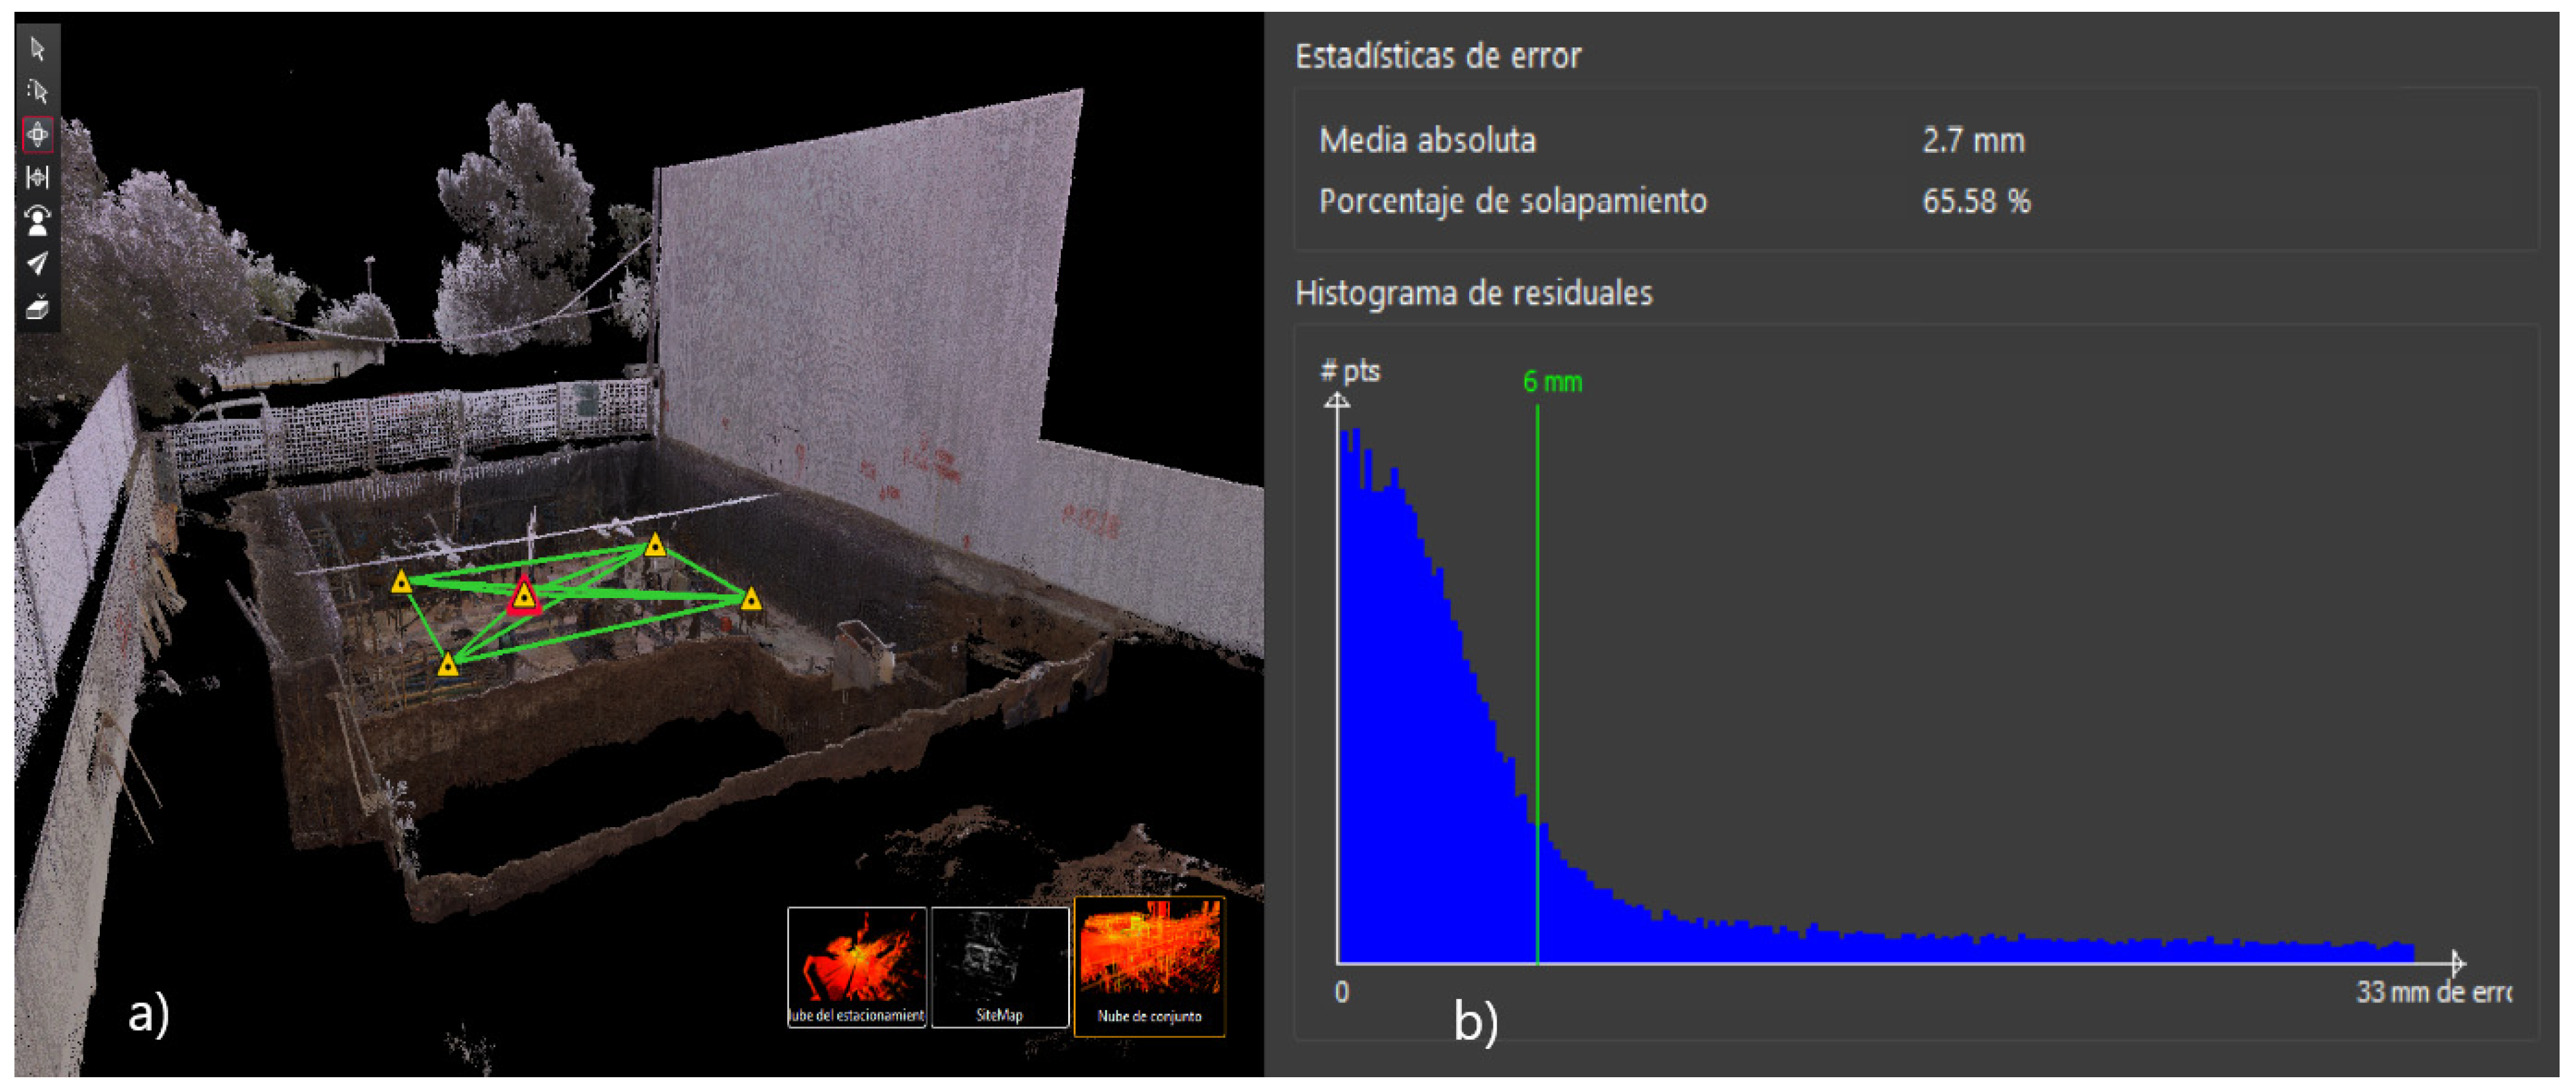
For data processing, the Cyclone REGISTER 360 software was used through the process structure, as shown in
Figure 3a: “Create new project”, “Import files”, “Smart Align Option”, “Visual alignment” and “Accuracy result obtained” according to this configuration shown in
Figure 3b. To determine the analysis of the point density of the laser scanner, a segmented sample of the set of two phases was taken with a section of 0.265 by 0.248 m, making two subsets of points with 65,720 mm
2. In Phase 1, 18,799 points are obtained, so the density is 0.28 points/mm
2. In Phase 2, in the same way, a total of 19,150 points are obtained, so the density is 0.29 points/mm
2. If we compare this scanner with other structured light scanner densities [
35], we will observe that its point density varies. The average distance between points of the Phase 1 record has also been determined, taking twenty samples at random and nearest points, obtaining a result of 0.00318 m.
2.3. Evaluation of the Quality in the Construction between Point Clouds
The information extraction process at the time of the material execution of the work is carried out by collecting data from the cloud of points.
The moment of execution of the work or phase chosen includes the placement of the wall and pillar reinforcements, as well as the placement of the formwork of both construction units.
In order to study the different geometric properties of the concreting process, a quantitative comparison is made between the reinforcements of the walls and columns placed and their respective formwork, that is, the distance between (A) reinforcement and (E) formwork. For this, you take the results of the two sets of TLSiA + TLSiE point clouds from segmentation as part of the TLSiG global point cloud.
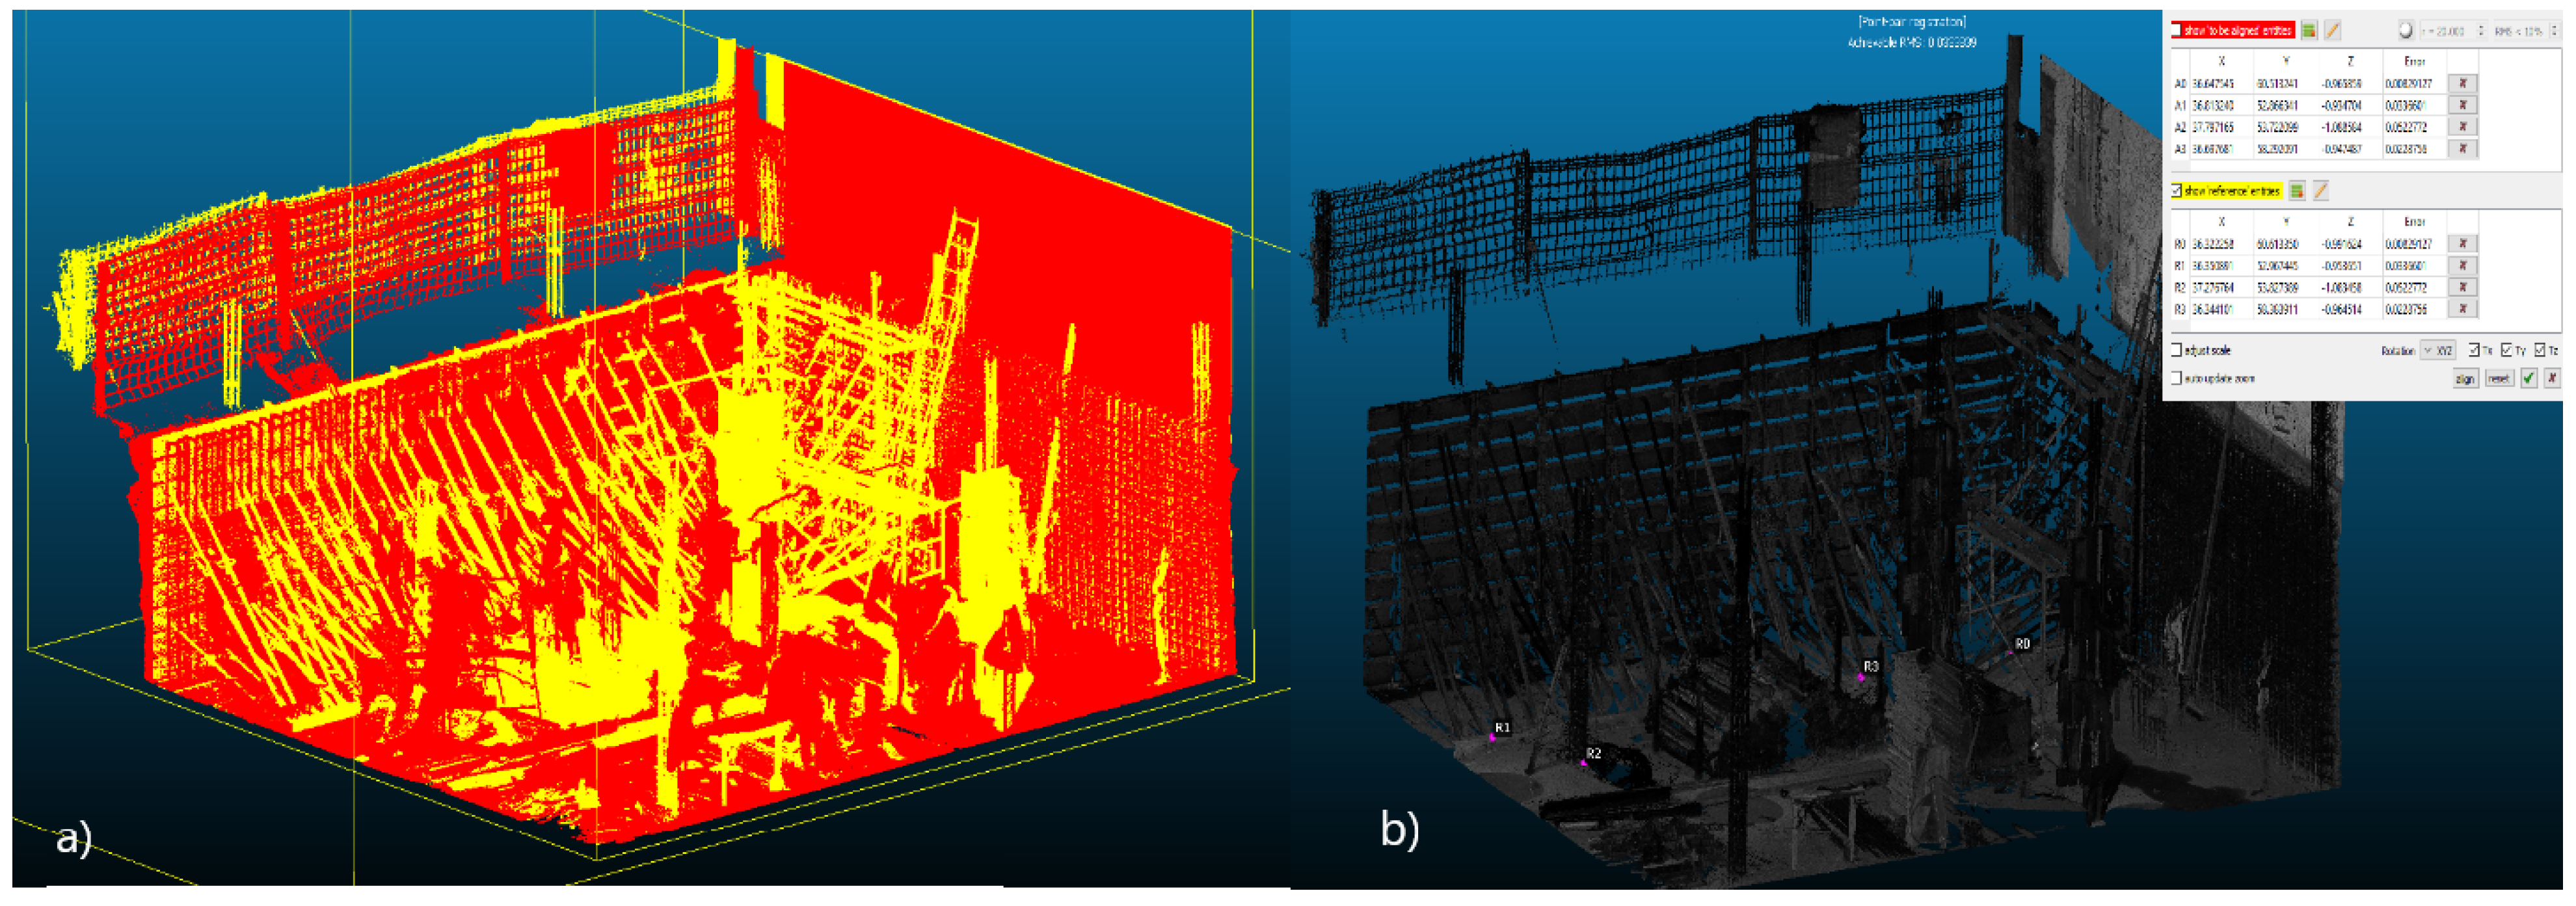
For the alignment of Phase 1 and Phase 2, an automatic alignment process was carried out. The result of the automatic alignment is that the average RMS error of the raw alignment was 0.1787 m with a scale factor of 1.0. In
Figure 4a, you can see the alignment of the reference point cloud in yellow and the alignment in red. This process allows us to detect that the sequences of both clouds are not perfectly aligned, although for a first approximation, it could be adequate.
In the second phase of alignment of the models, four pairs of points have been taken (R0-A0, R1-A1, R2-A2, R3-A3). These points were strategically located on the surface of the lot. The average RMS error of the raw alignment was 0.0067 m. The points that were taken and shown in
Figure 4b were made on the basis of fixed points that allow for the connection of individual scans. These chosen support points were fixed reinforcements that are placed on the concrete slab and that will later serve to support the formwork. These points have the advantage that they are non-moving points and guarantee the alignment of the two point clouds in different phases.
According to the terms exposed by Jafari [
36], a rigid transformation is produced between n
pi Ꞓ
P and
qi Ꞓ
Q where
pi Ꞓ
P is a point in the 3D reference point cloud and
qi Ꞓ
Q is a point in the destination point cloud.
Using the nearest neighbor search and Euclidean distance calculation [
37], the algorithm estimates the closest point between
pi y
qi as correspondence points. To calculate the rotation
R and the translation
t between the two indicated points according to Equation (1).
The system works by finding pairs of adjacent points in TLS
iA and TLS
iE and then calculating the transformation parameters between the two subsets of points [
38,
39]. In the processing for the acquisition of subsets of points, segmentation has been carried out manually, as it is common for noise and atypical values to appear that can alter the sample of the final results [
34]. That is why the point clouds that we have used in this part of the work have been segmented by matching the singularity of the sample to work more easily due to the large number of points in the TLS
iG global set.
2.3.1. Analysis of Pillar 1 Cloud-to-Cloud Algorithm
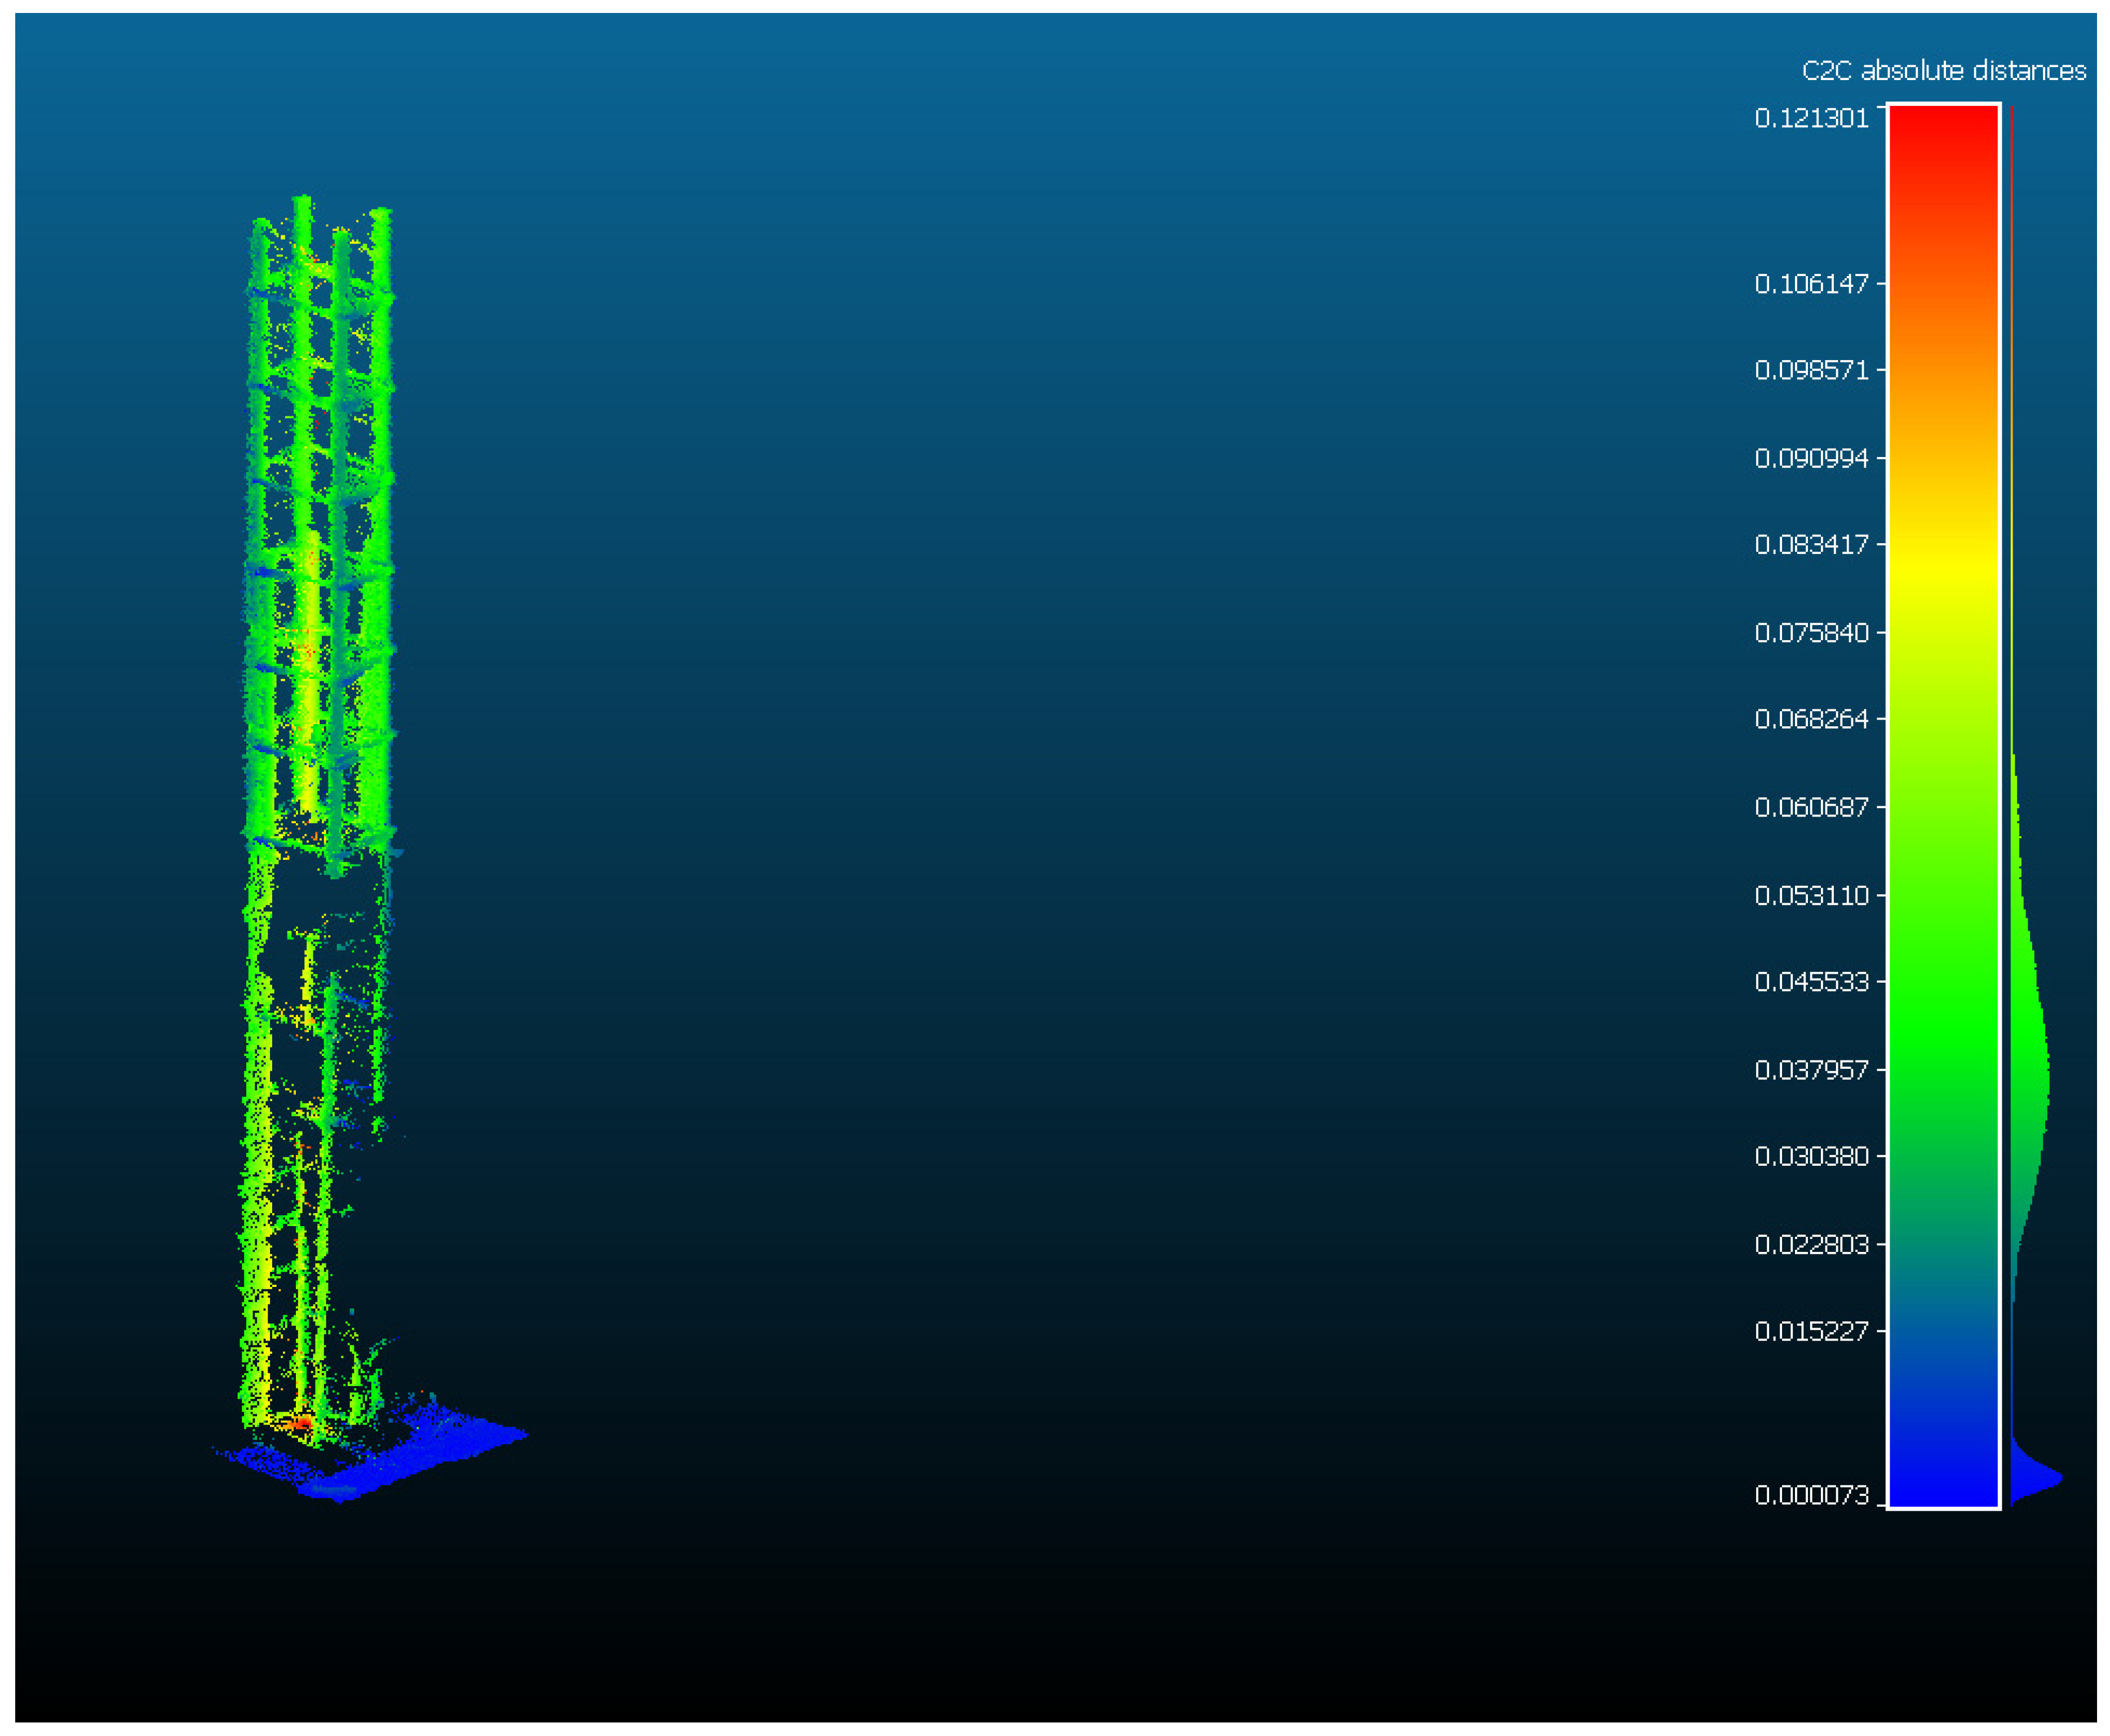
This analysis focuses on determining the distance between the reinforcement of exempt pillar no. 1, from the scan in phase 2, and the faces of this pillar once the entire phase of structures is finished, which would be phase 5, and where there was a passage of two months and two months and ten days.
Once the desired segmented areas were obtained, the points that could cause noise and give atypical results were cleaned. All of this has been developed in the CloudCompare version 2.13.1 software itself [
40], which provides us with tools and instruments for these analysis activities and comparisons, as can be seen in
Figure 5.
As can be seen in
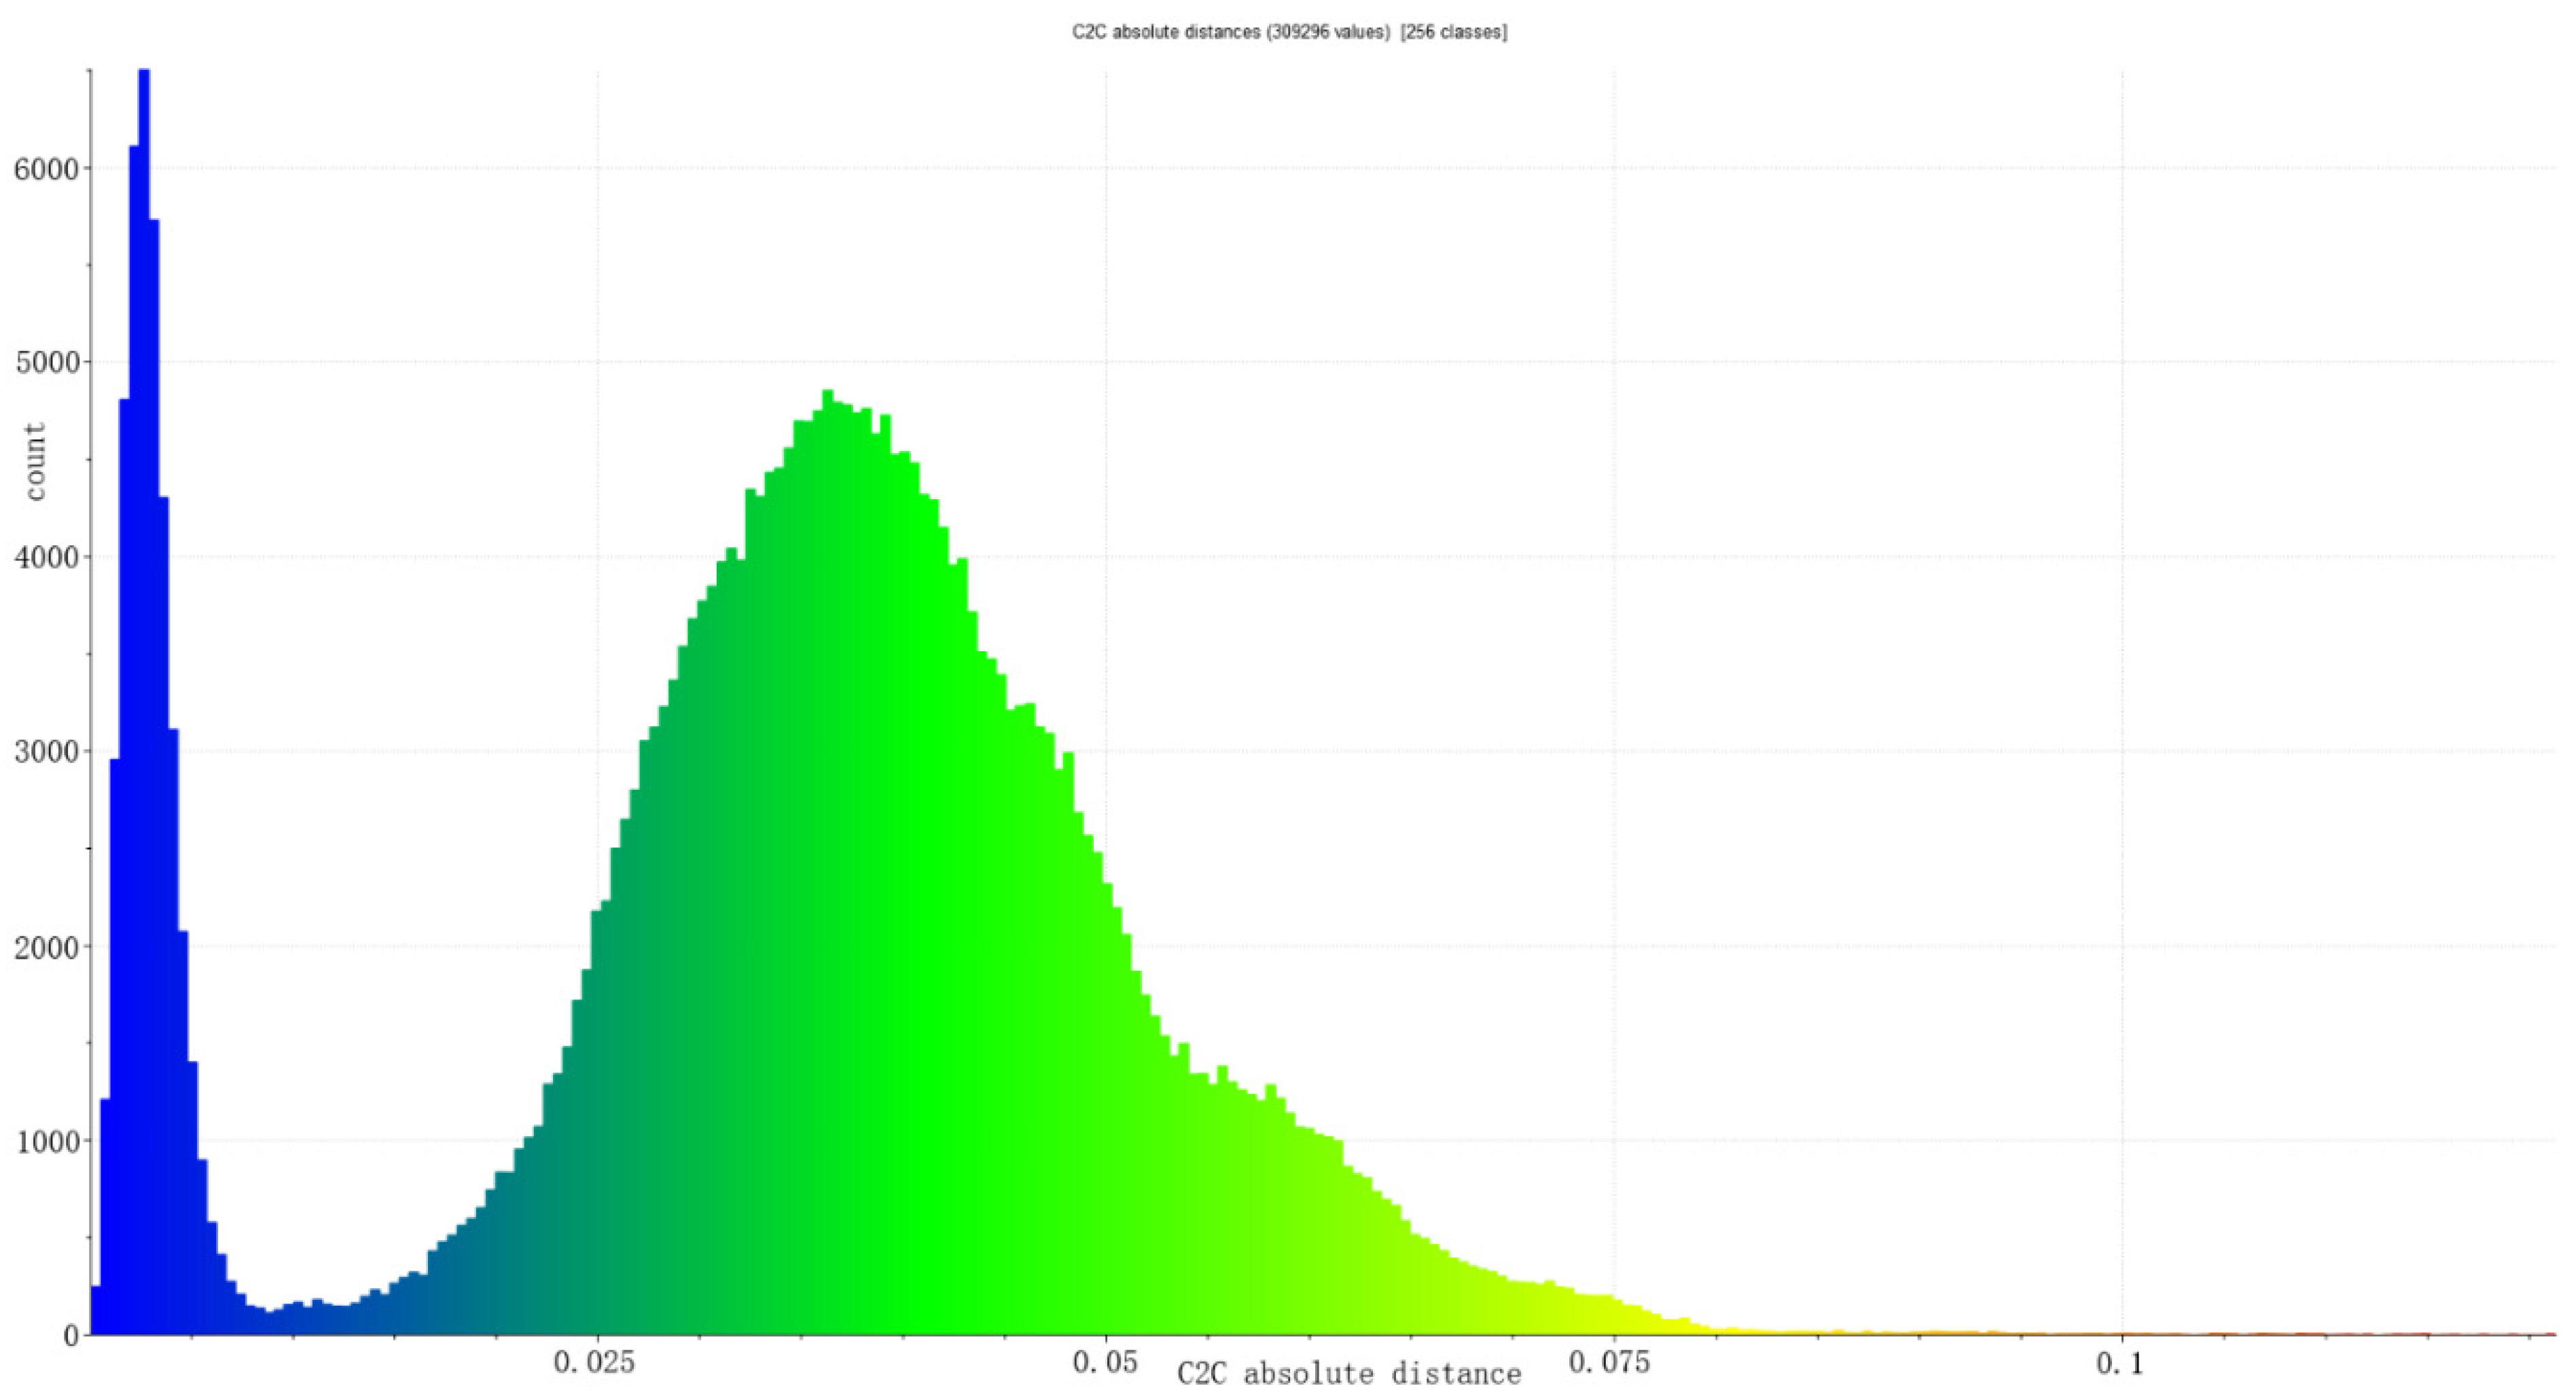
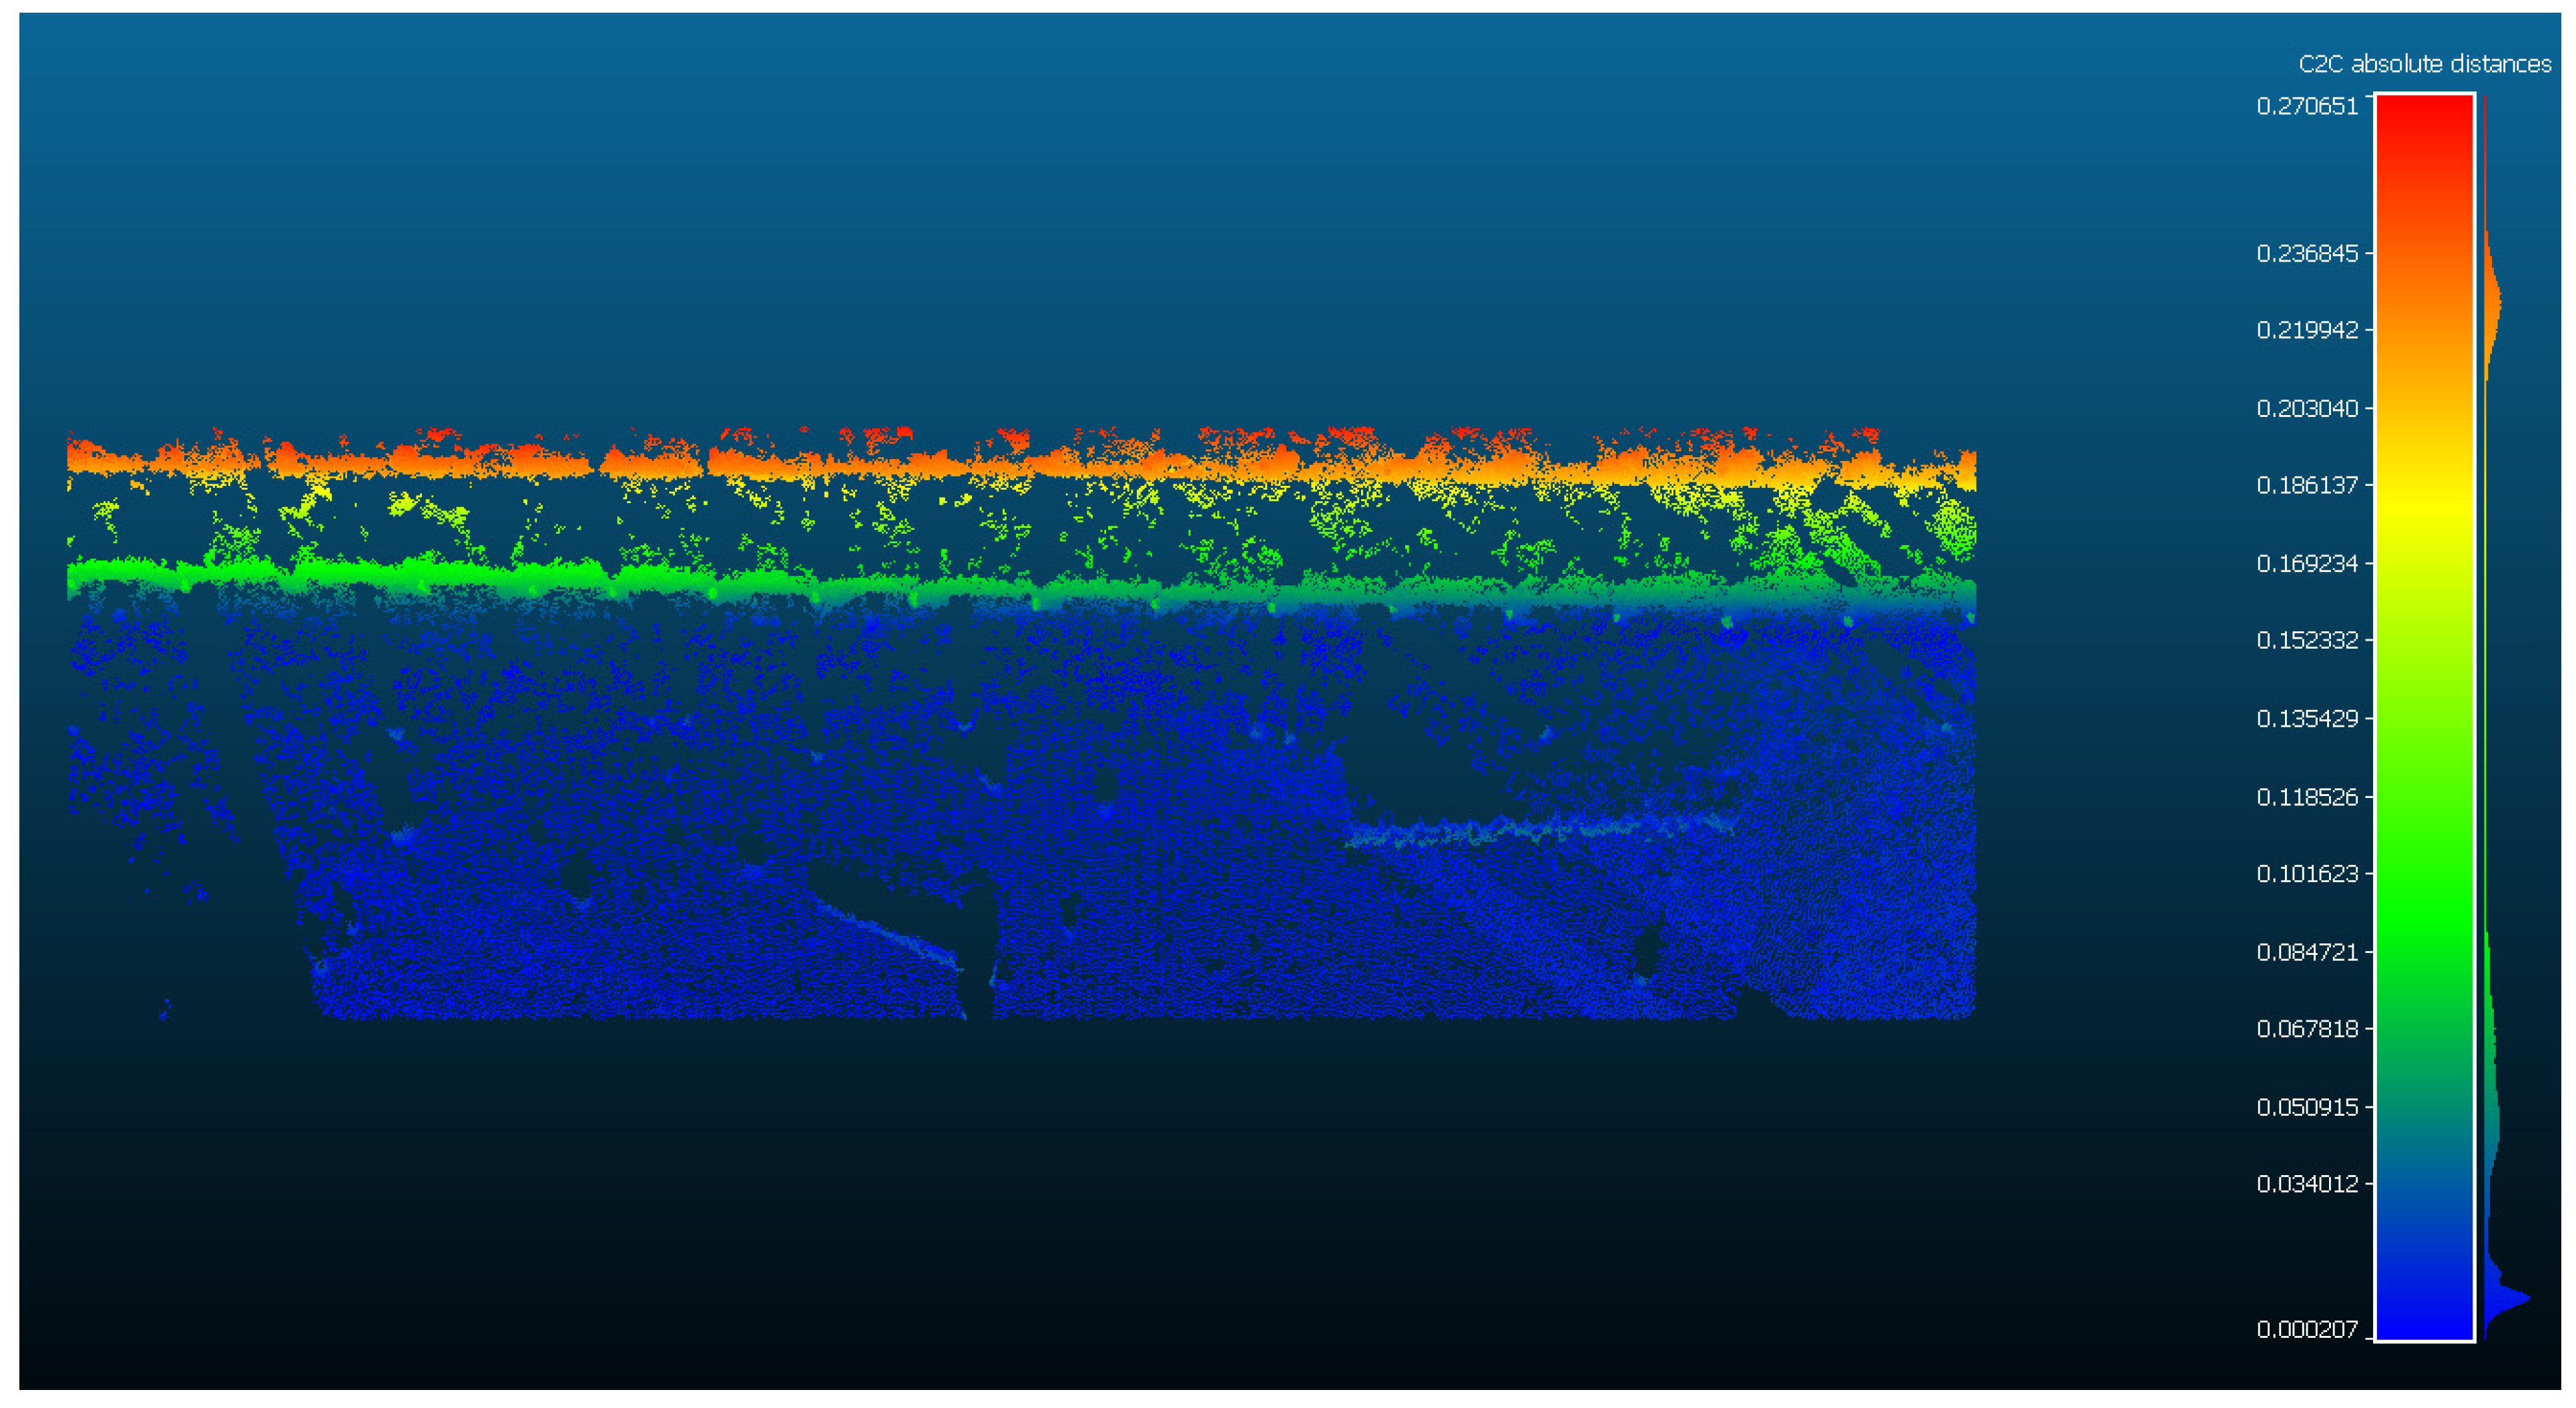
Table 1, we have a maximum distance of 11 cm. This distance may be due to some scattered point that contains the set of sampling points, so it is not representative of the set. The minimum distance refers to the coincidence of points in space. However, attention is paid to the average and the normal deviation, values more in line with what we are looking for can be observed, with the average distance being about 3 cm and the sigma of 1.7 cm, as it appears in the histogram of
Figure 6.
Focusing your attention on this other, more detailed graph, you can see a large number of points that are at values very close to 0, which are all those that are represented in blue. Most of these points correspond to the area of the ground on which the studied pillar rises, which has been taken as a reference to align the different phases studied. The subset of points in a total of 309.296, or 12% is equivalent to values not greater than 0.0053, that is, practically 0.
Removing most of the points with values close to 0, we can see that we have a graph that follows a normal distribution, where from approximately 18% to 85% we find most of the points included in a distance no greater than 5 cm. It is also observed that the value to which the greatest number of points are associated is 0.036, for which there are a total of 4750 associated points, eliminating, of course, those very close to 0, which, as we have commented, does not reflect reality.
2.3.2. Wall Analysis I Cloud-to-Cloud Algorithm
To determine the degree of inclination of the reinforcements before concreting, a segmentation of the TLS
iG part has been carried out. Some results from TLS
iA and TLS
iE were included that will indicate the inclination and separation between the reinforcements and the face of the formwork. These are taken as a reference to carry out this analysis, since both phases (one and two) were aligned in it. Therefore, the TLS
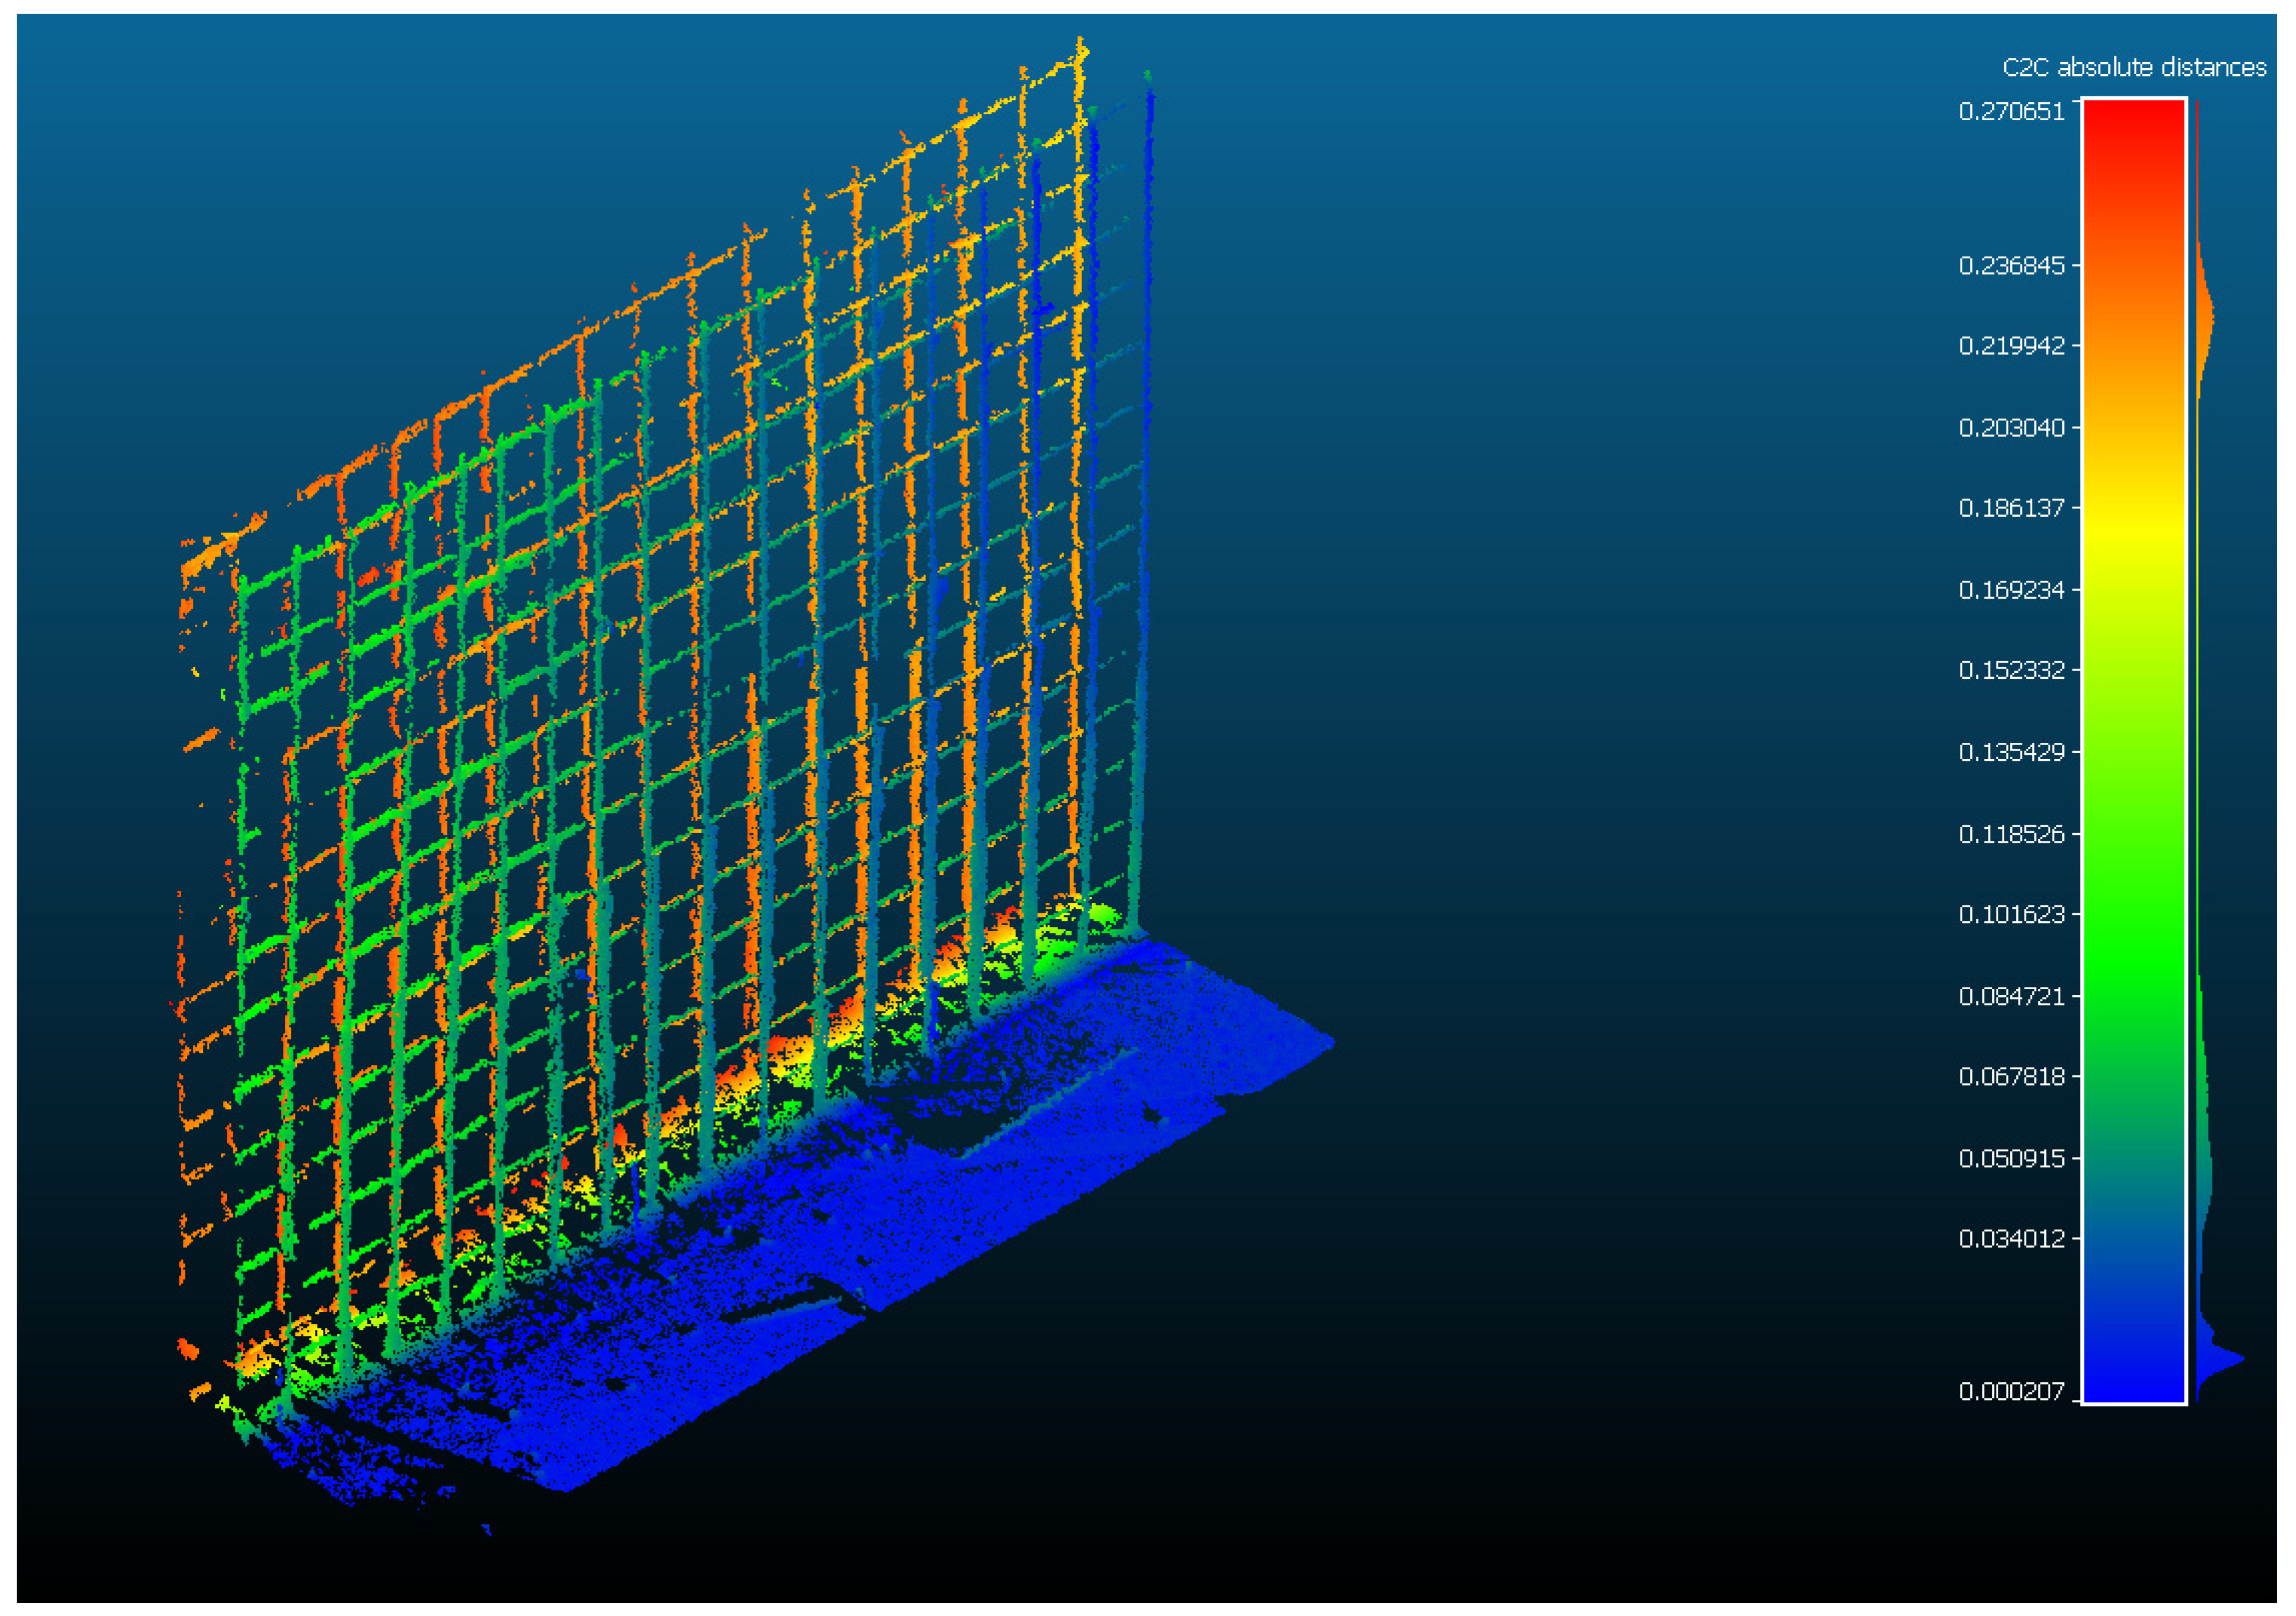
iG point cloud is sectioned through another area of interest, in this case the one on the left side wall (
Figure 7).
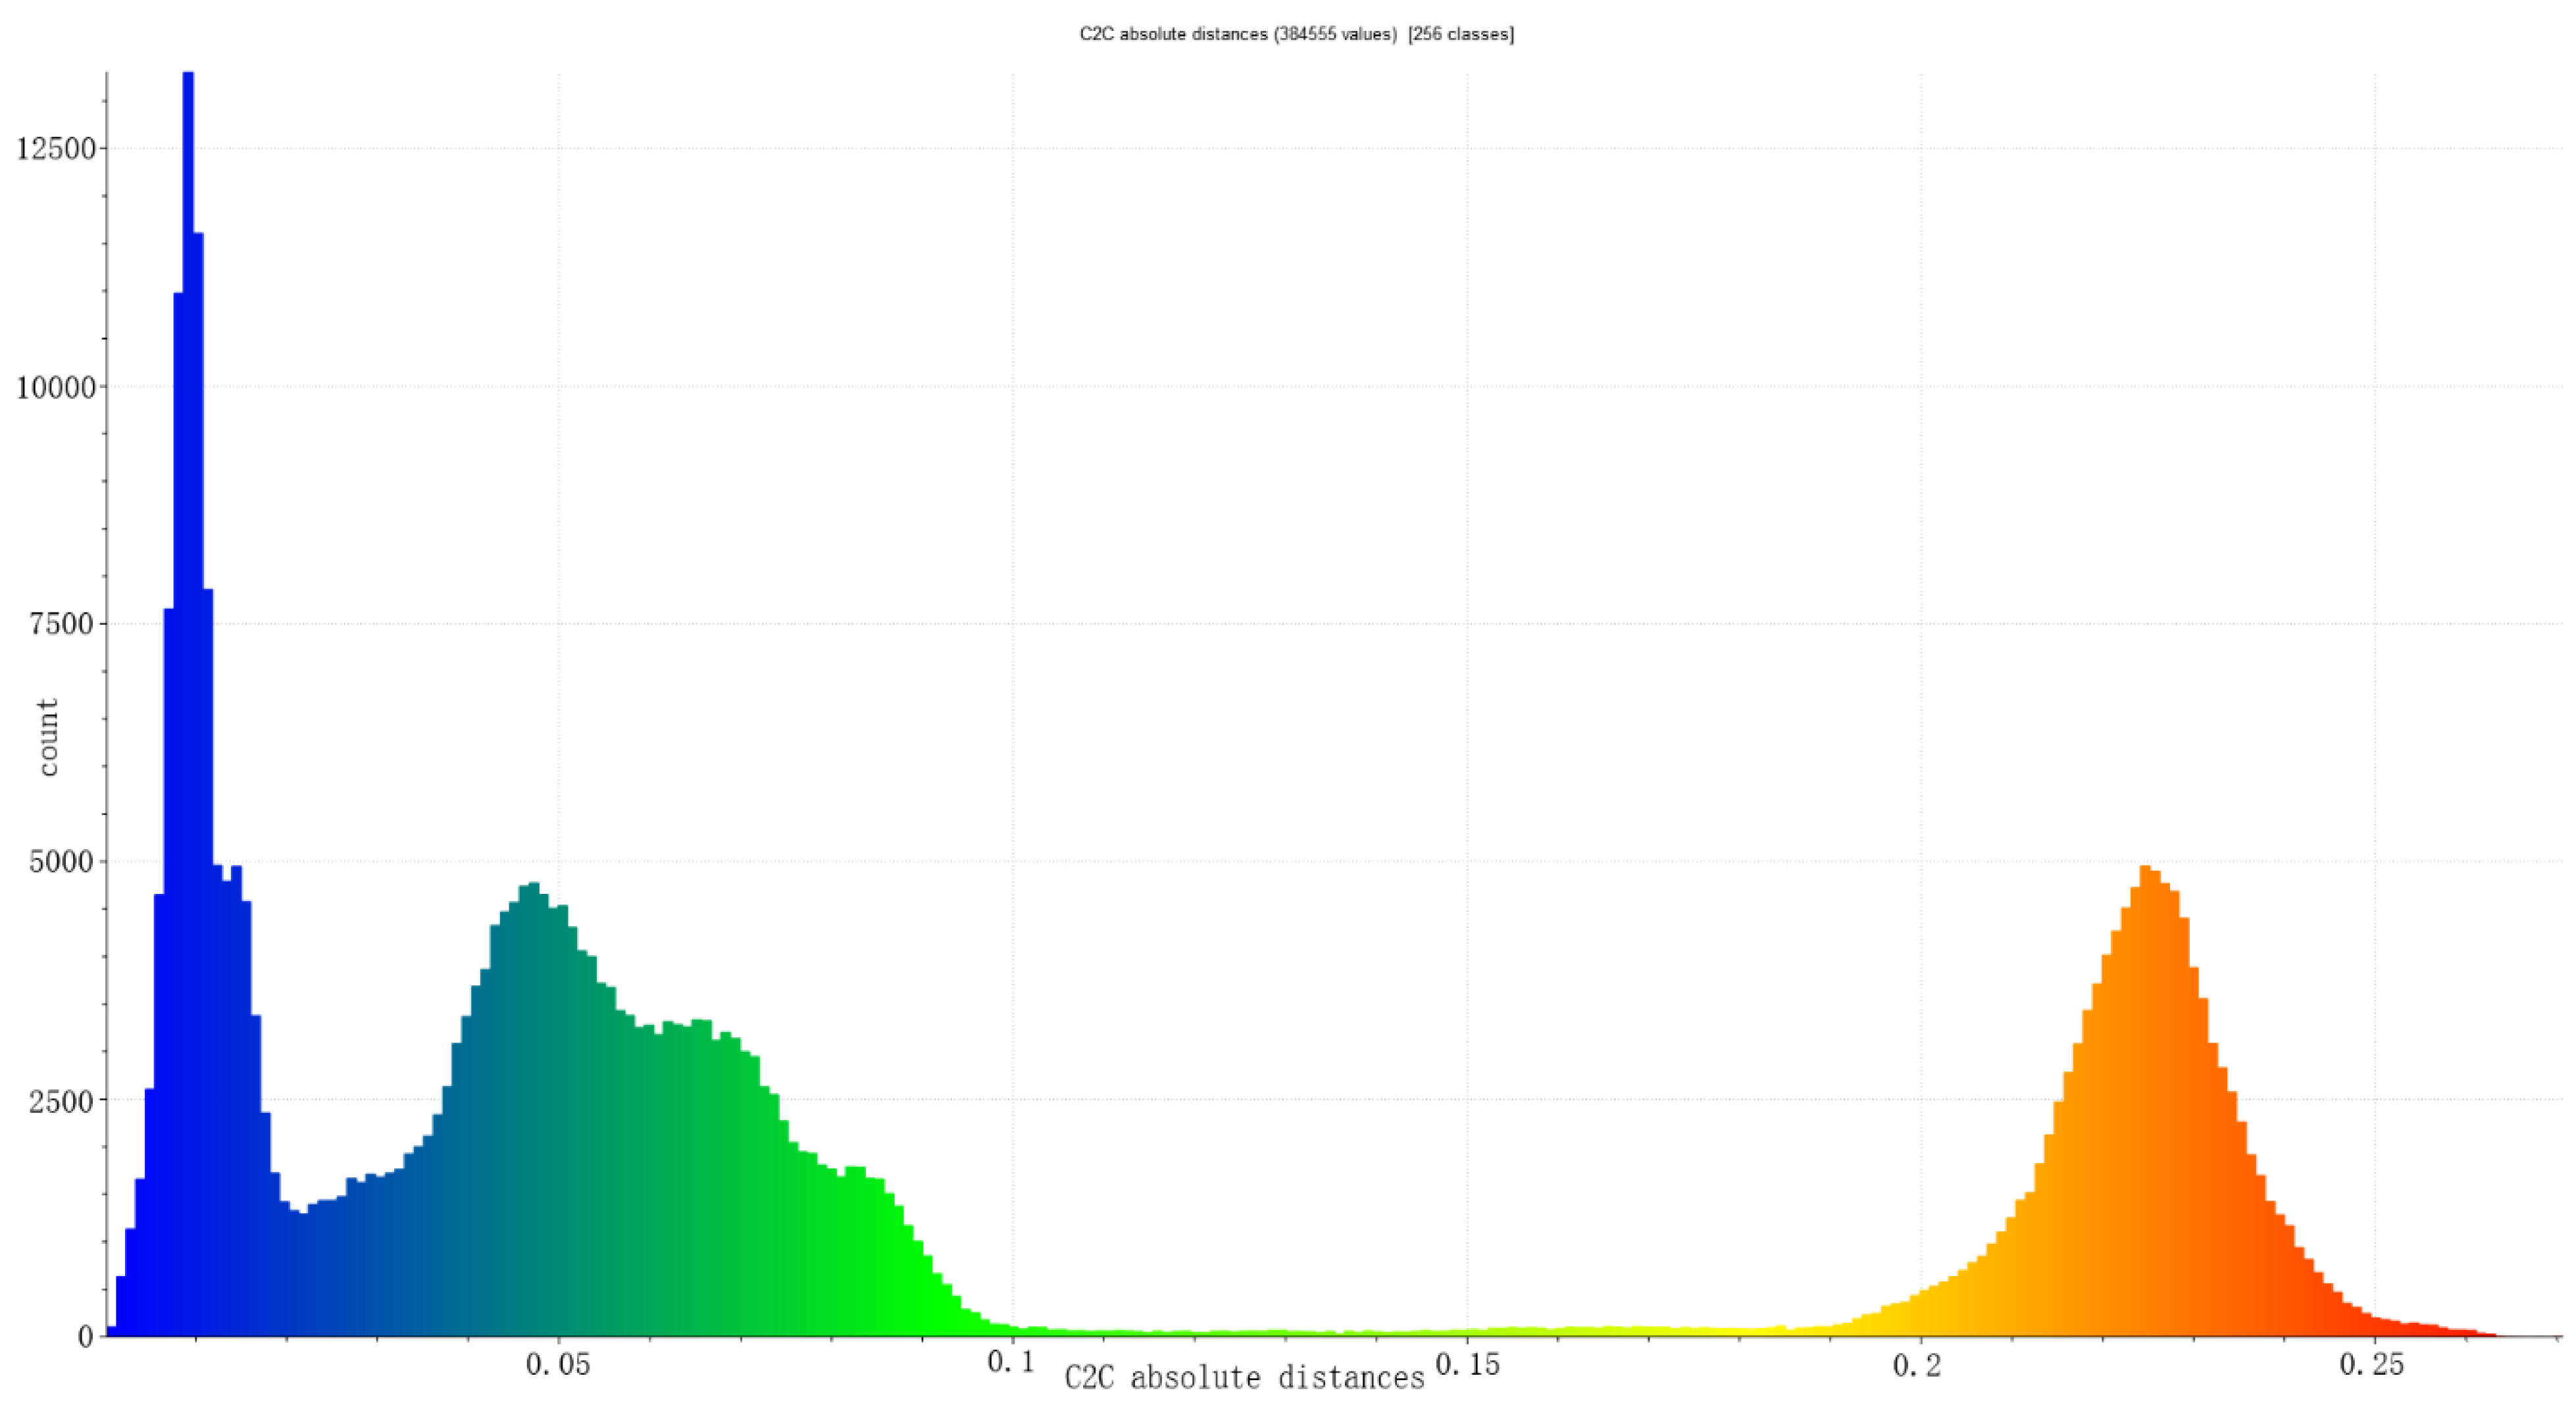
Table 2 establishes the distances of the set; in this case, the results are certainly nonsense and different from those of the pillar. This occurs because we compare the internal and external faces of the reinforcement with the internal faces of the wall. Therefore, the value of the average distance of 0.092 m is not representative.
In the same way, it occurs with the maximum distance at which a value of 0.2748 m is observed, which represents the distance between some point on the internal face of the wall and another on the external face of the reinforcement. These data correspond to a normal distribution of the reinforcement spacing, so it is quite close to the 30 cm measured by the wall.
When interpreting the analysis of the histogram in
Figure 8, it must be appreciated that there are a large number of points with values practically equal to 0, most of them representing the soil, which in this case consisted of a larger surface than in the previous analysis.
Of all the total points, 23% correspond both to the ground and to an area of interior reinforcement in which there is a significant deviation from the reinforcement plane, and the values are also very close to 0, as shown in
Figure 9.
The rest of the data obtained are equivalent to the two parts of the reinforcement, the inner face and the outer face. The distances are variable, as can be seen in the inner reinforcement, which has values close to 0.05 m, while the outer face represents values between 0.2 and 0.25 m.
Figure 9 shows the deviation in the plan of the different reinforcements of the wall. In green is the first line of reinforcements, and in orange is the second line of reinforcements that is closest to the terrain.
2.4. Spatial Analysis of Construction Safety Risk
Identifying the risks and dangers of construction during the execution of the work requires that the security agents be proactive in determining the dangers that the workers are potentially subjected to.
In the traditional way, the levels of risk in construction have been evaluated with surveys and accessory devices that have not taken into account the study of space in three dimensions.
Thus, during the construction phase, exposure to risks must be assessed at the level of activities and the physical context in which they are carried out [
41]. Therefore, the geospatial context is important to determine, on the one hand, the identification of risks and, on the other, using detection and comparison algorithms to establish space units that can help in risk analysis.
In terms of the methodological study of this spatial analysis, mention should be made of the method of “construction hazard assessment with spatial and temporal exposure” (CHASTE) [
42], a doctoral thesis developed at the Israel Institute of Technology. Subsequently, this methodology was applied by Sacks et al. [
41] to address construction safety planning tasks.
Other perspectives related to spatial studies focus on the spatial association of abnormal gait patterns of workers to track the location of slip, trip, and fall (STF) hazards [
43].
There is also work related to the monitoring and synchronization of sensors that work through probabilistic inference [
44].
However, the Identification analysis of the Spatial-temporal Condition (SCI), with activities focused on 4D BIM modelling, is of great interest in the detection of overlapping schedules and overlapping spaces [
45]. Thus, the methodology used for the identification of risks based on the overlap of delimited zones in the area of the work space has been the one used in this study, and for this, the basement construction can be observed in
Figure 10.
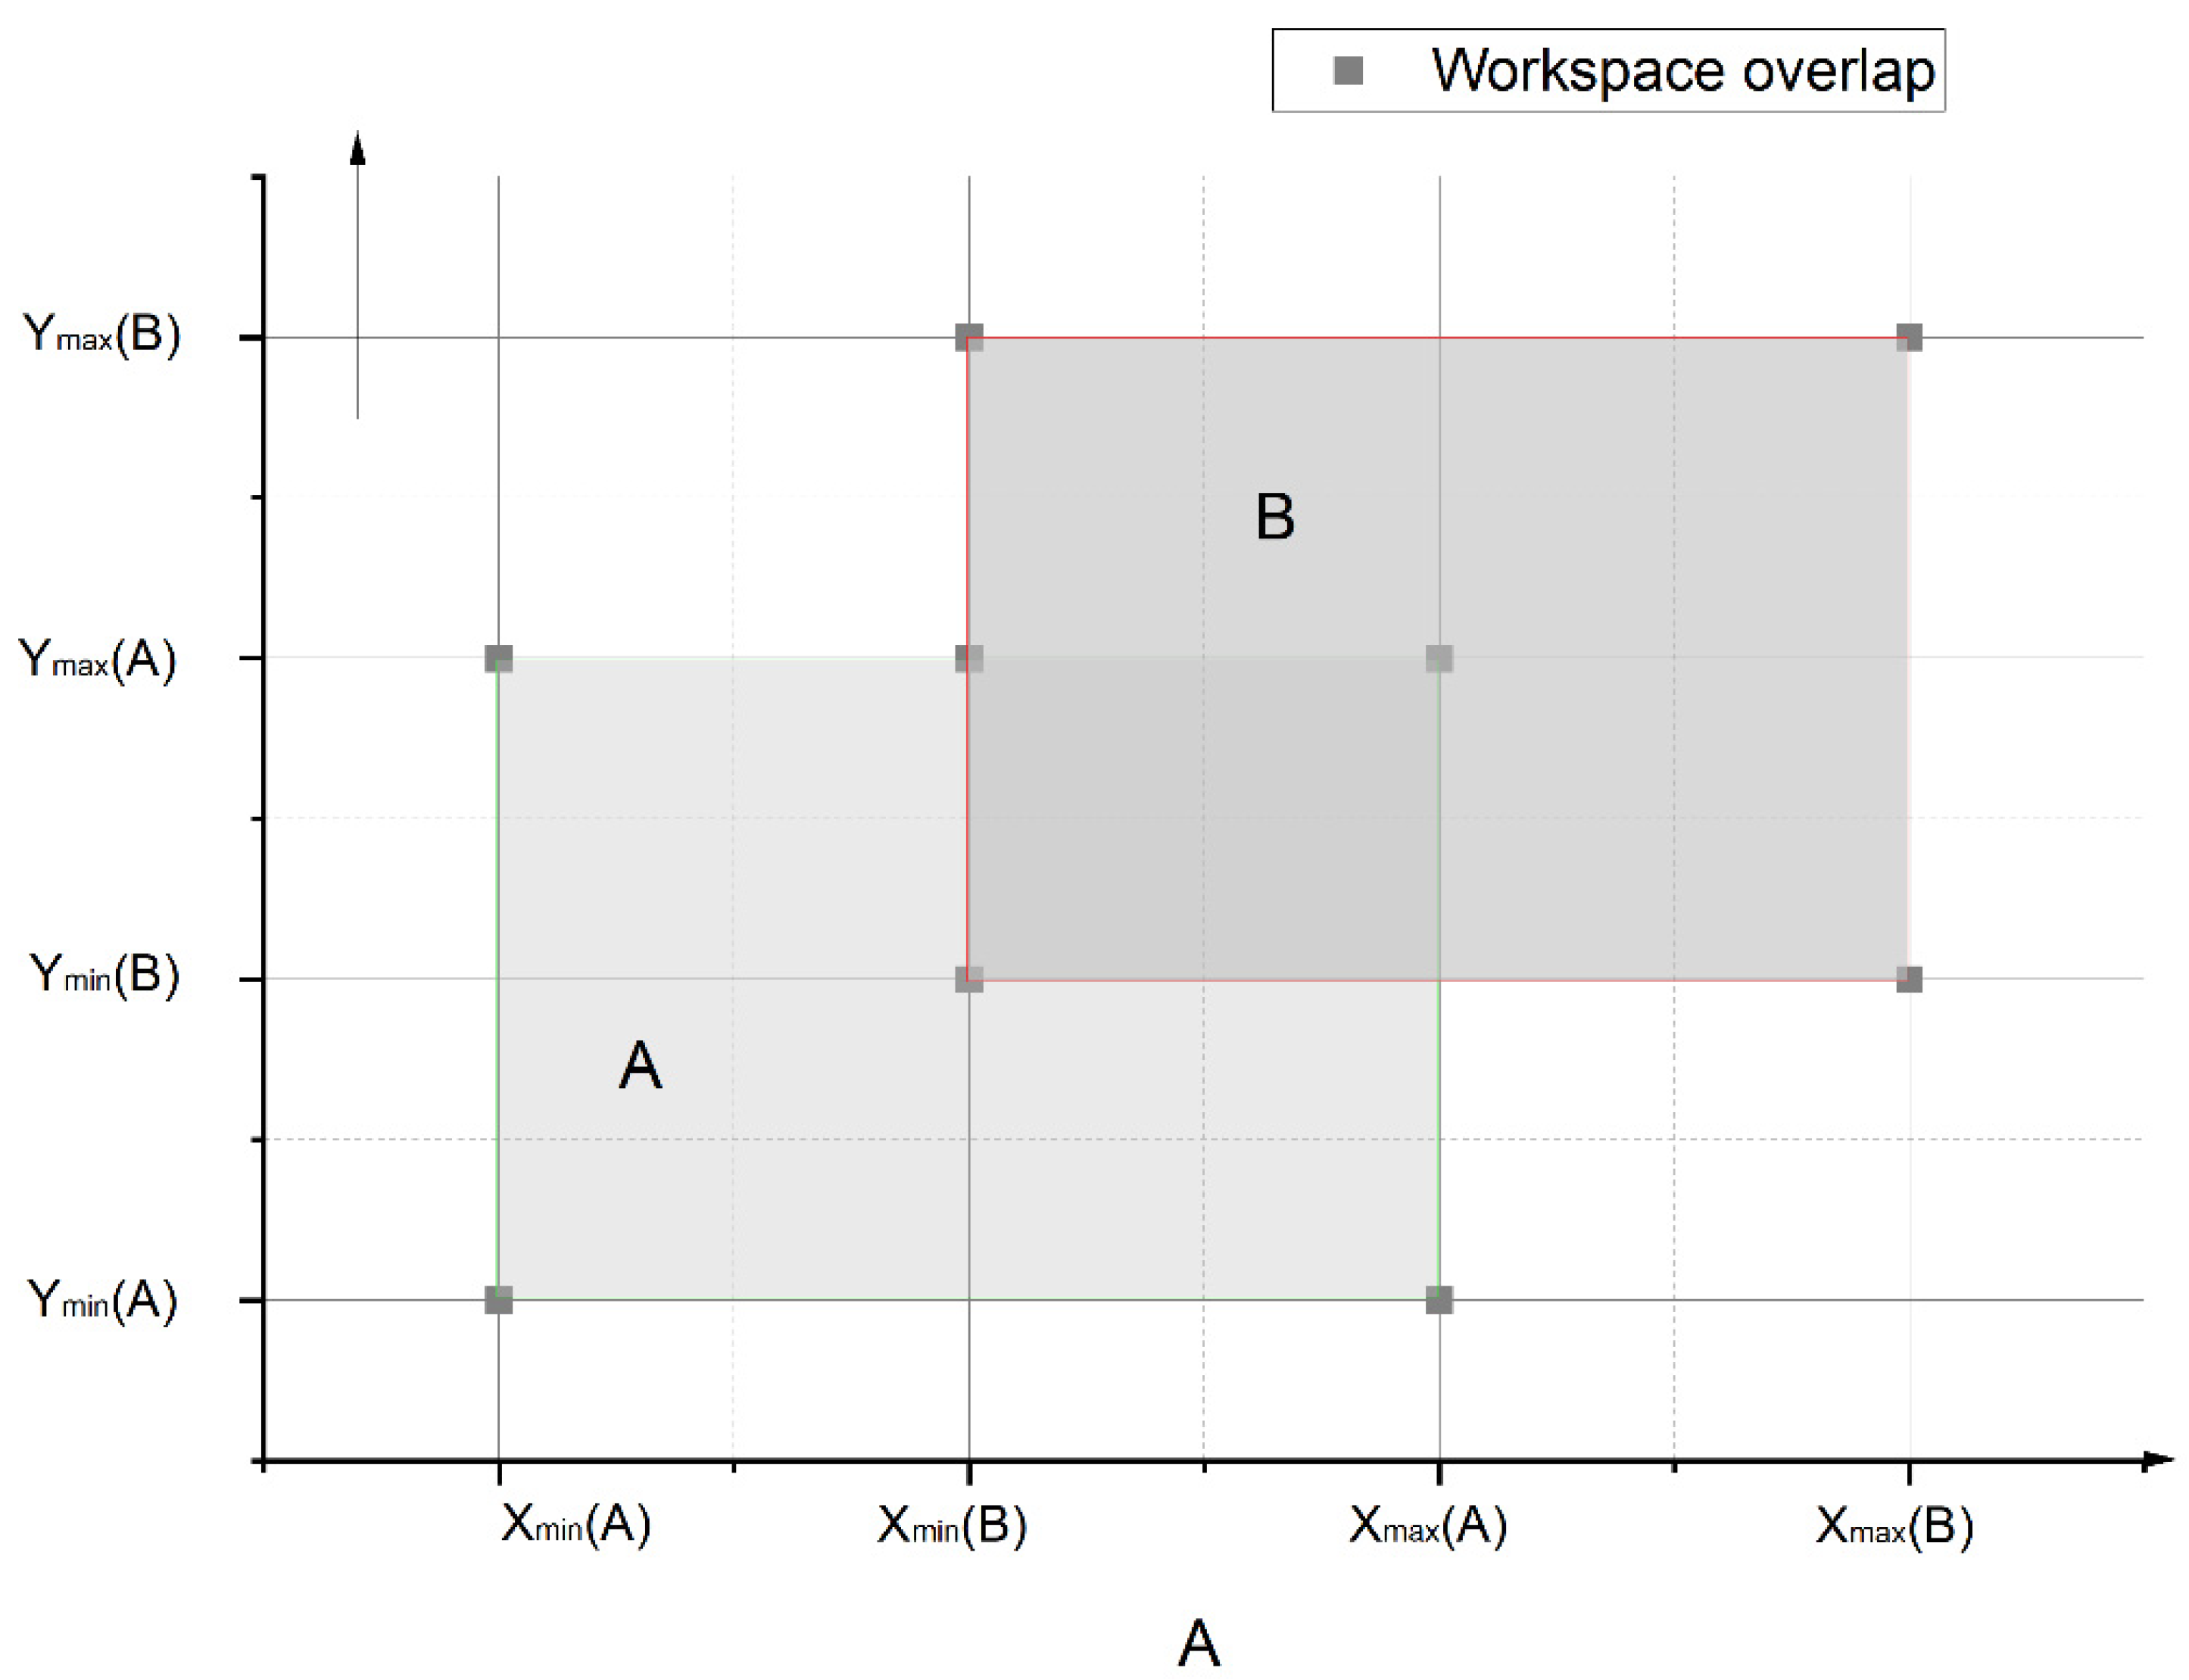
Within the framework of studying a space defined by the abscissa coordinates (x) and by the ordinate coordinate (y) and an origin point (0, 0), the workspace A is described as (X
Amin, X
Amx_ _, Y
Amin, Y
Amx_ _, Z
Amin, Z
Amx_ _,). In the same way, the workspace B is described as (X
Bmin, X
Bmx_ _, Y
Bmin, Y
Bmx_ _, Z
Bmin, Z
Bmx_ _,). The condition that there is a real overlap is given by Equation (2). In the same way, when there is an analysis in a 3D workspace, the intersection of the workspaces must satisfy that Z
Amin is less than or equal to Z
Bmx_, and Z
Amx_ is greater than or equal to Z
Bmin. When the operator detects at the same time that there is no overlap, this condition does not occur.
Another spatiotemporal analysis to define the Dynamic Spatial Interference (DSI) is defined under Equations (3)–(6) [
46].
where:
is the individual space-time utilization factor of the activity;
is an incremental component that includes the effect of interfering spatial entities;
is the utilization factor of ¡ which is an element f a set of interfering workspaces;
Sia is the overlapping volume between A and i,
SA is the spatial volume of A;
tiA is the time Interval over which A and i overlap;
tA is the activity duration of A.
Dynamic Spatial Interference (
DIS) gives the extent to which a work operator can accommodate interference due to other activity workspaces. This equation, was express by Rahal and Khoury [
47].
2.5. Risk Identification
The risks related to safety in construction works have been evaluated according to the method of the Technical Note on Prevention NTP-330 already used in [
48,
49,
50]. With this methodology, it is possible to quantify the magnitude of existing risks and prioritize corrections.
Table 3 shows the link between risk factors and their causes.
This methodology makes it possible to determine the probability that certain risks materialize in damages and the magnitude of the damages. NR = NP × NC, which means that it is possible to establish a magnitude scale of the different risks [
51].
Table 4 establishes the level of probability and the level of consequence, and
Table 5 shows the level of intervention according to the NTP-330 method.
Among the tasks identified in the construction of the concreting of walls in the basement phase, we can establish: (i) placement of vertical reinforcements, (ii) tying of reinforcements, (iii) placement of horizontal reinforcement, (iv) tying of horizontal reinforcements, and (v) tying of upper areas from the work platform. Each of these tasks implies a list of sets of risks to which preventive measures will be assigned.
Table 6 shows both the list of detected risks and their corresponding evaluation according to NTP-330. It is observed that there are several risks for which, due to the probability of their occurrence and the seriousness of the possible consequences, urgent correction is essential.
2.6. Sampling Patterns
Within the analyzed study, the basement area of the experimental house is taken as the first construction unit, that is, the first phase of the structure, followed by the activities of placing reinforcements on the walls and placing the formwork. Data on the location of stockpiles of materials, as well as the location of the workers, can give the keys to the interference of the activities carried out, so geometric data on position and volume define other interconnection spaces. In this case, a sampling pattern model is applied that is inserted into a 2D occupancy grid and another 3D occupancy grid in order to visualize the different levels of activity and define the risks. Three-dimensional occupancy grid modelling was already used by Teizer et al. [
52] to process 3D range values in real time.
The 3D model of the set of points extracted by LiDAR systems can help to generate an action plan for the operations that are carried out in that analyzed space and to be able to observe the position occupied by the stockpiles and identify both static and dynamic elements.
If a partial analysis of the obtained point cloud is carried out, a 3D digital elevation model of the objects that circumscribe the basement space is generated, detecting existing obstacles, areas occupied by the formwork, as well as parts of scaffolding, and the areas swept by the crane that, in some cases, have been studied in [
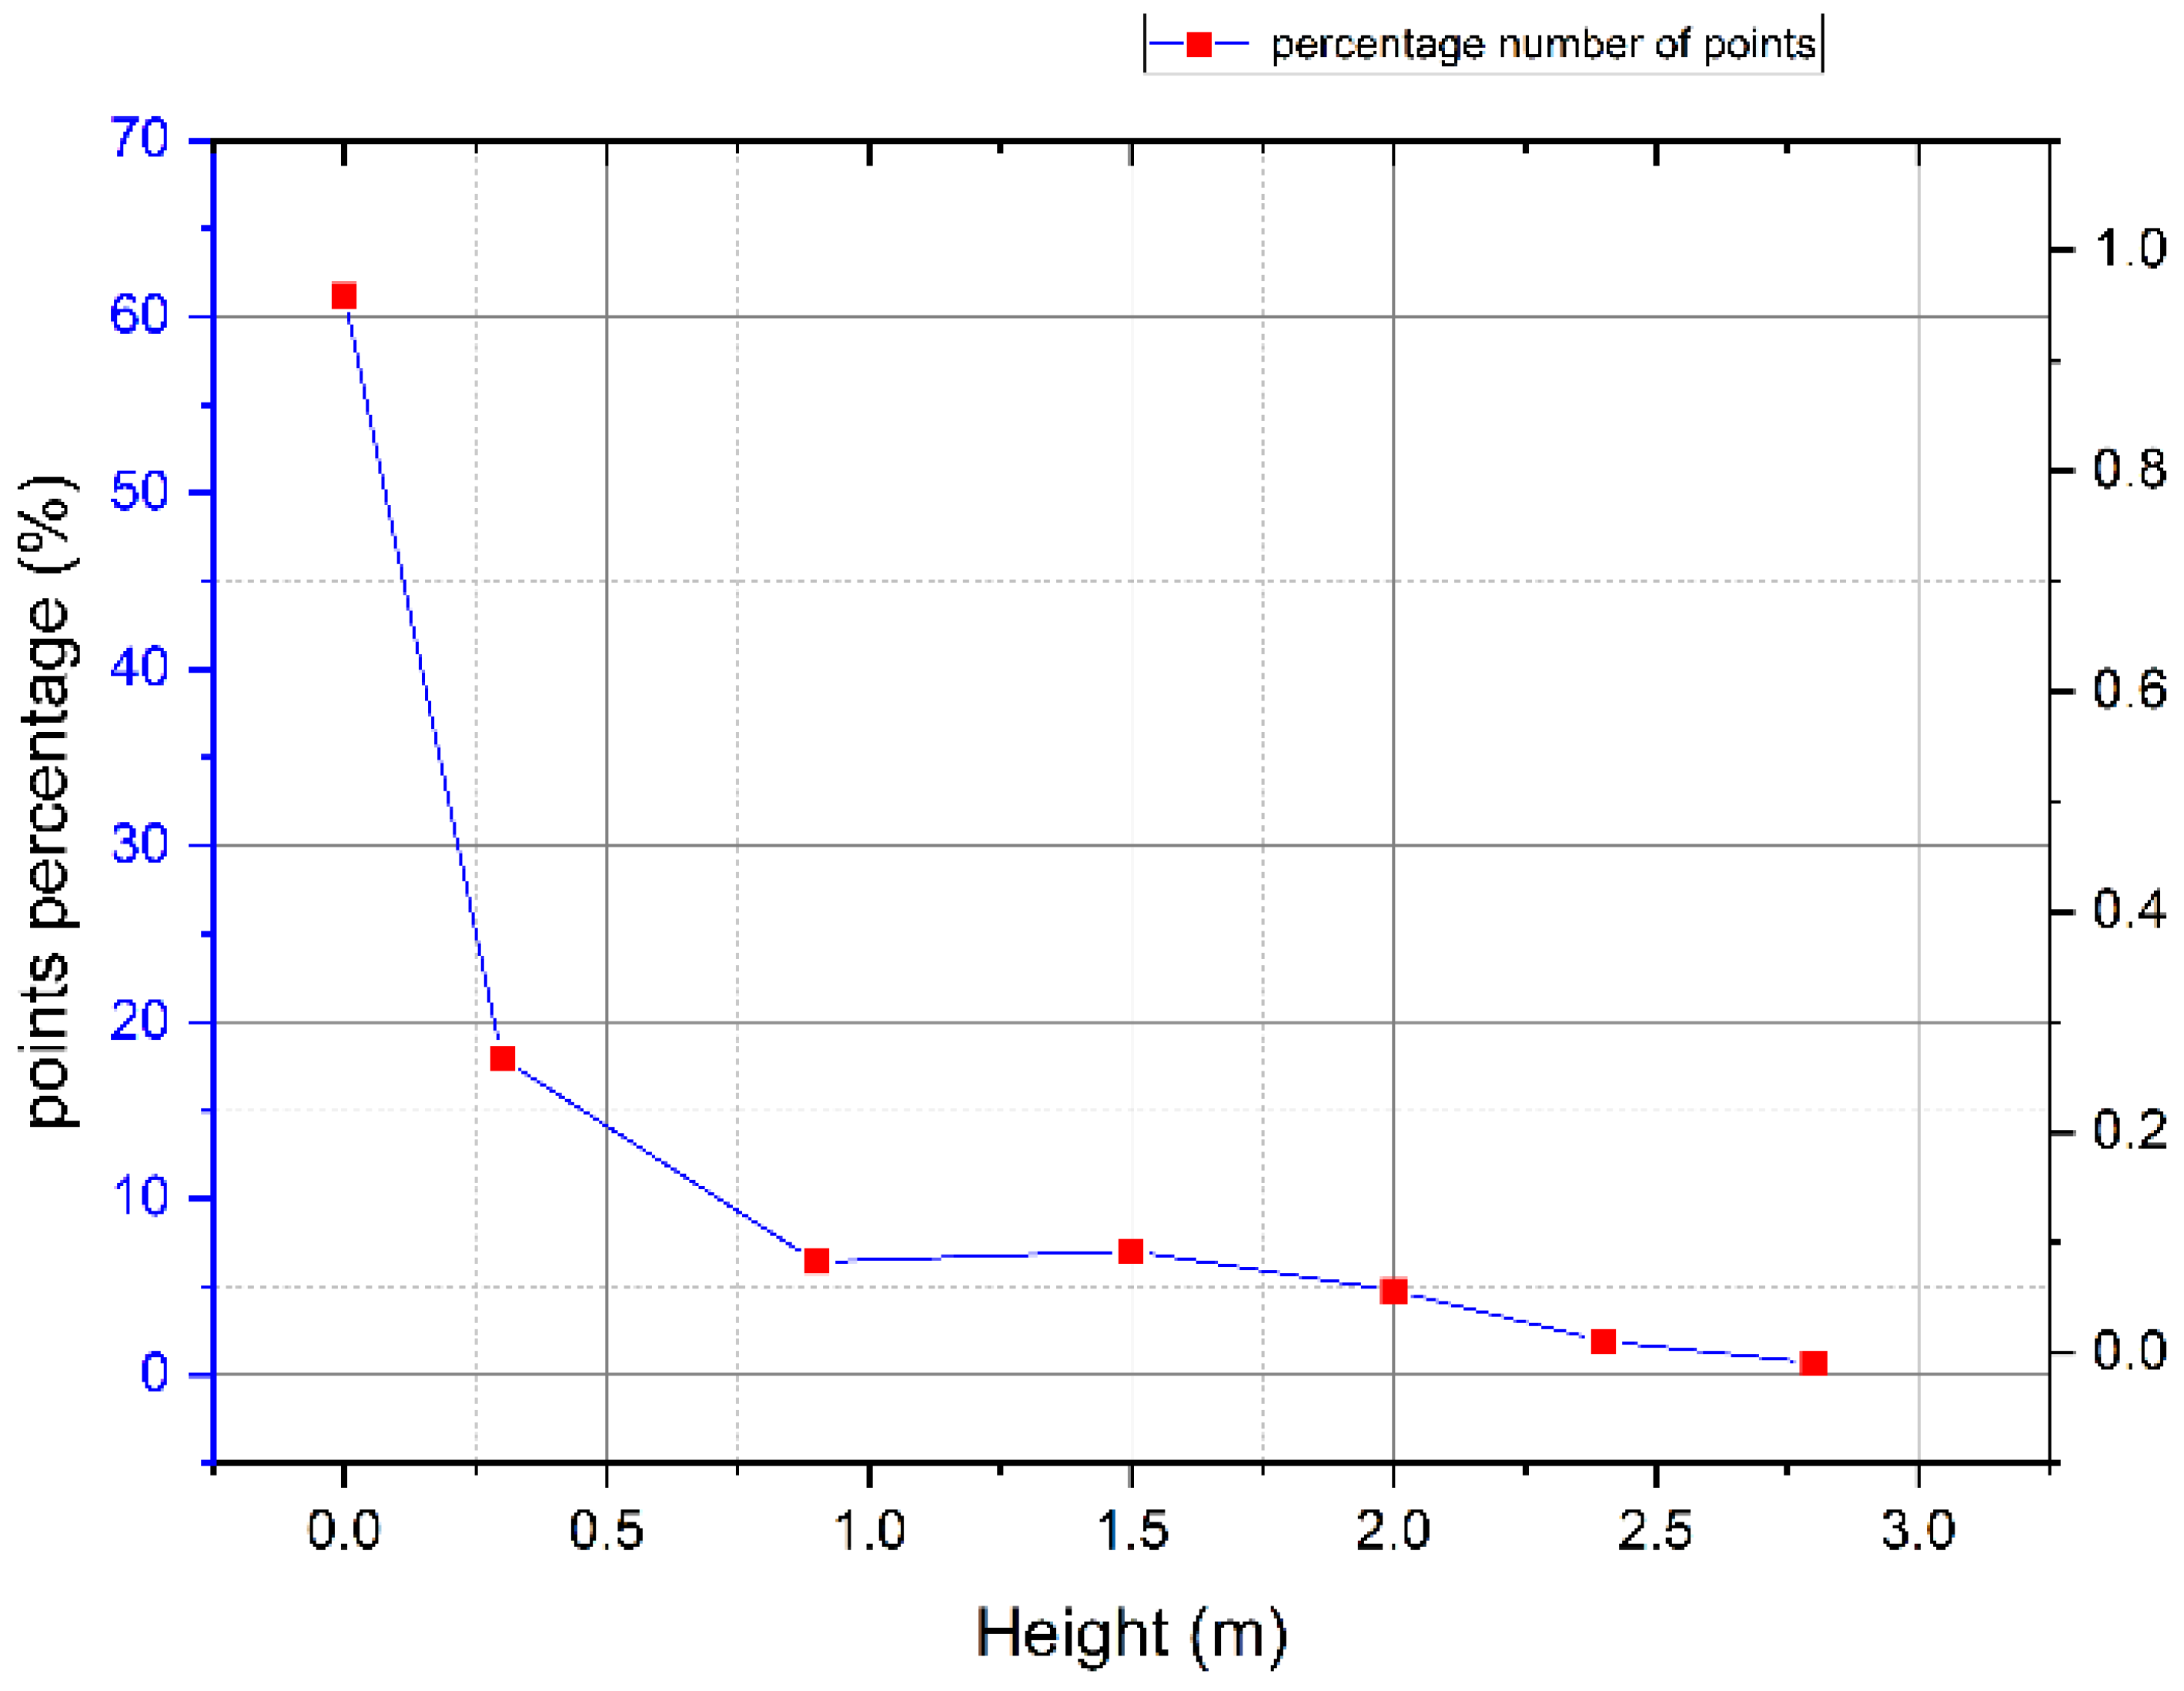
53]. The elevation map of the volume of the stockpiles in
Figure 11 can be naturally inferred from the process of overlapping activities, being able to observe the number of elements in a 3D space based on the x-,y plane of the ground level of the concrete slab.
To determine the percentage of spaces that are free of obstacles, the iterative closest point (ICP) algorithm is used through CloudCompare software, which compares a theoretical auxiliary plane (x, y) so that the result of the process is a value scale for each of the points of the indicated cloud as Euclidean distance [
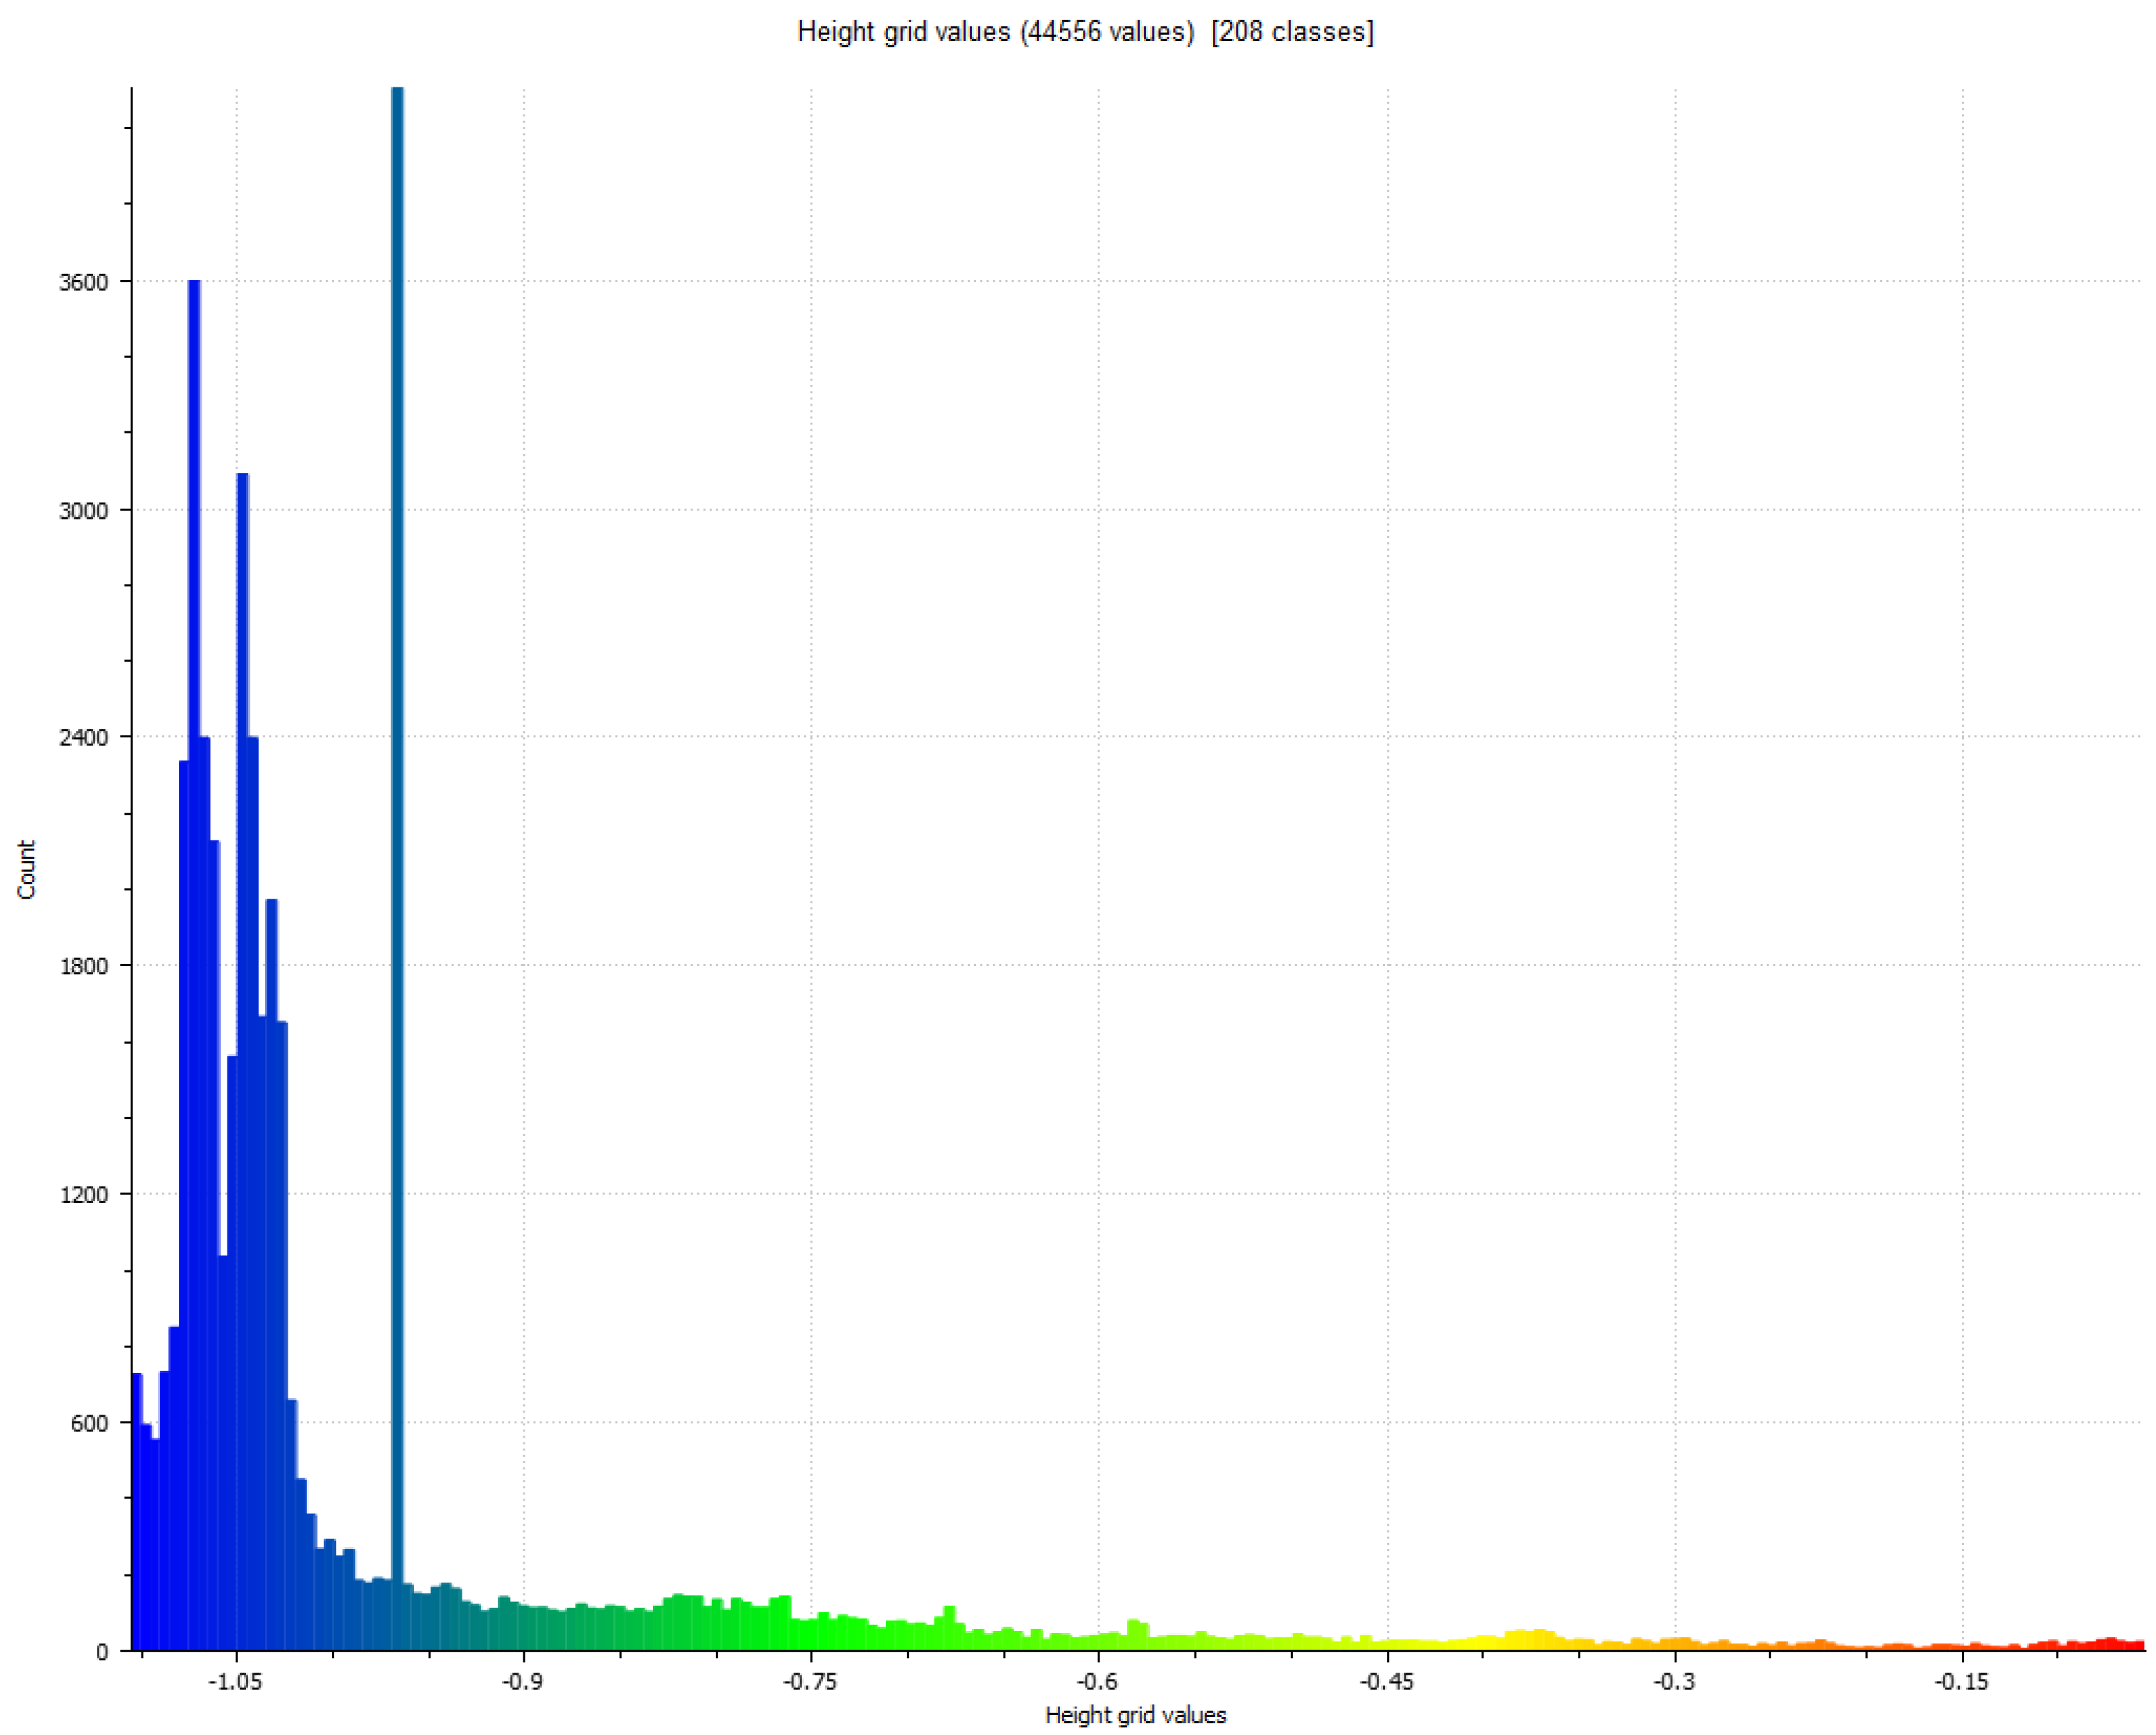
54]. To determine the percentage with full accuracy, the histogram of coincident points was obtained, obtaining 63% of the points in the plane at elevation +0.00. See
Figure 12 for histogram of the elevation map.
Through 3D spatial study, it is possible to determine how a workspace works and what activities are carried out in the different phases of the process. In the scan, four different phases were taken, and a work area was divided into two heights on the floor, that is, two vertical levels of work.
Subsequently, two types of elements were identified: IDEs static elements, which are the instruments, machinery and stockpiles detected in the elevation map and later the IDEs static elements that are the instruments, machinery and stockpiles detected in the elevation map, and the IDEd dynamic elements, which are the activities that can be developed within the action plan.
A new scenario of the methodological design includes identifying overlaps of IDEs according to Equation (2), where the handling of materials or stockpiles of the work can be involved.
The manual activity analysis protocol was developed by [
44] in four units: work, material, displacement, and inactivity. The first is considered a dynamic IDE
d element where a displacement occurs. The next three can be established as static IDE
s, where materials can occupy a space, but at the same time, overlaps can occur that are important to identify. For this, the areas of stockpiles and materials are identified in the set of TLS
iG points, and later, a segmentation of the set of clouds of points is carried out in phase 2.
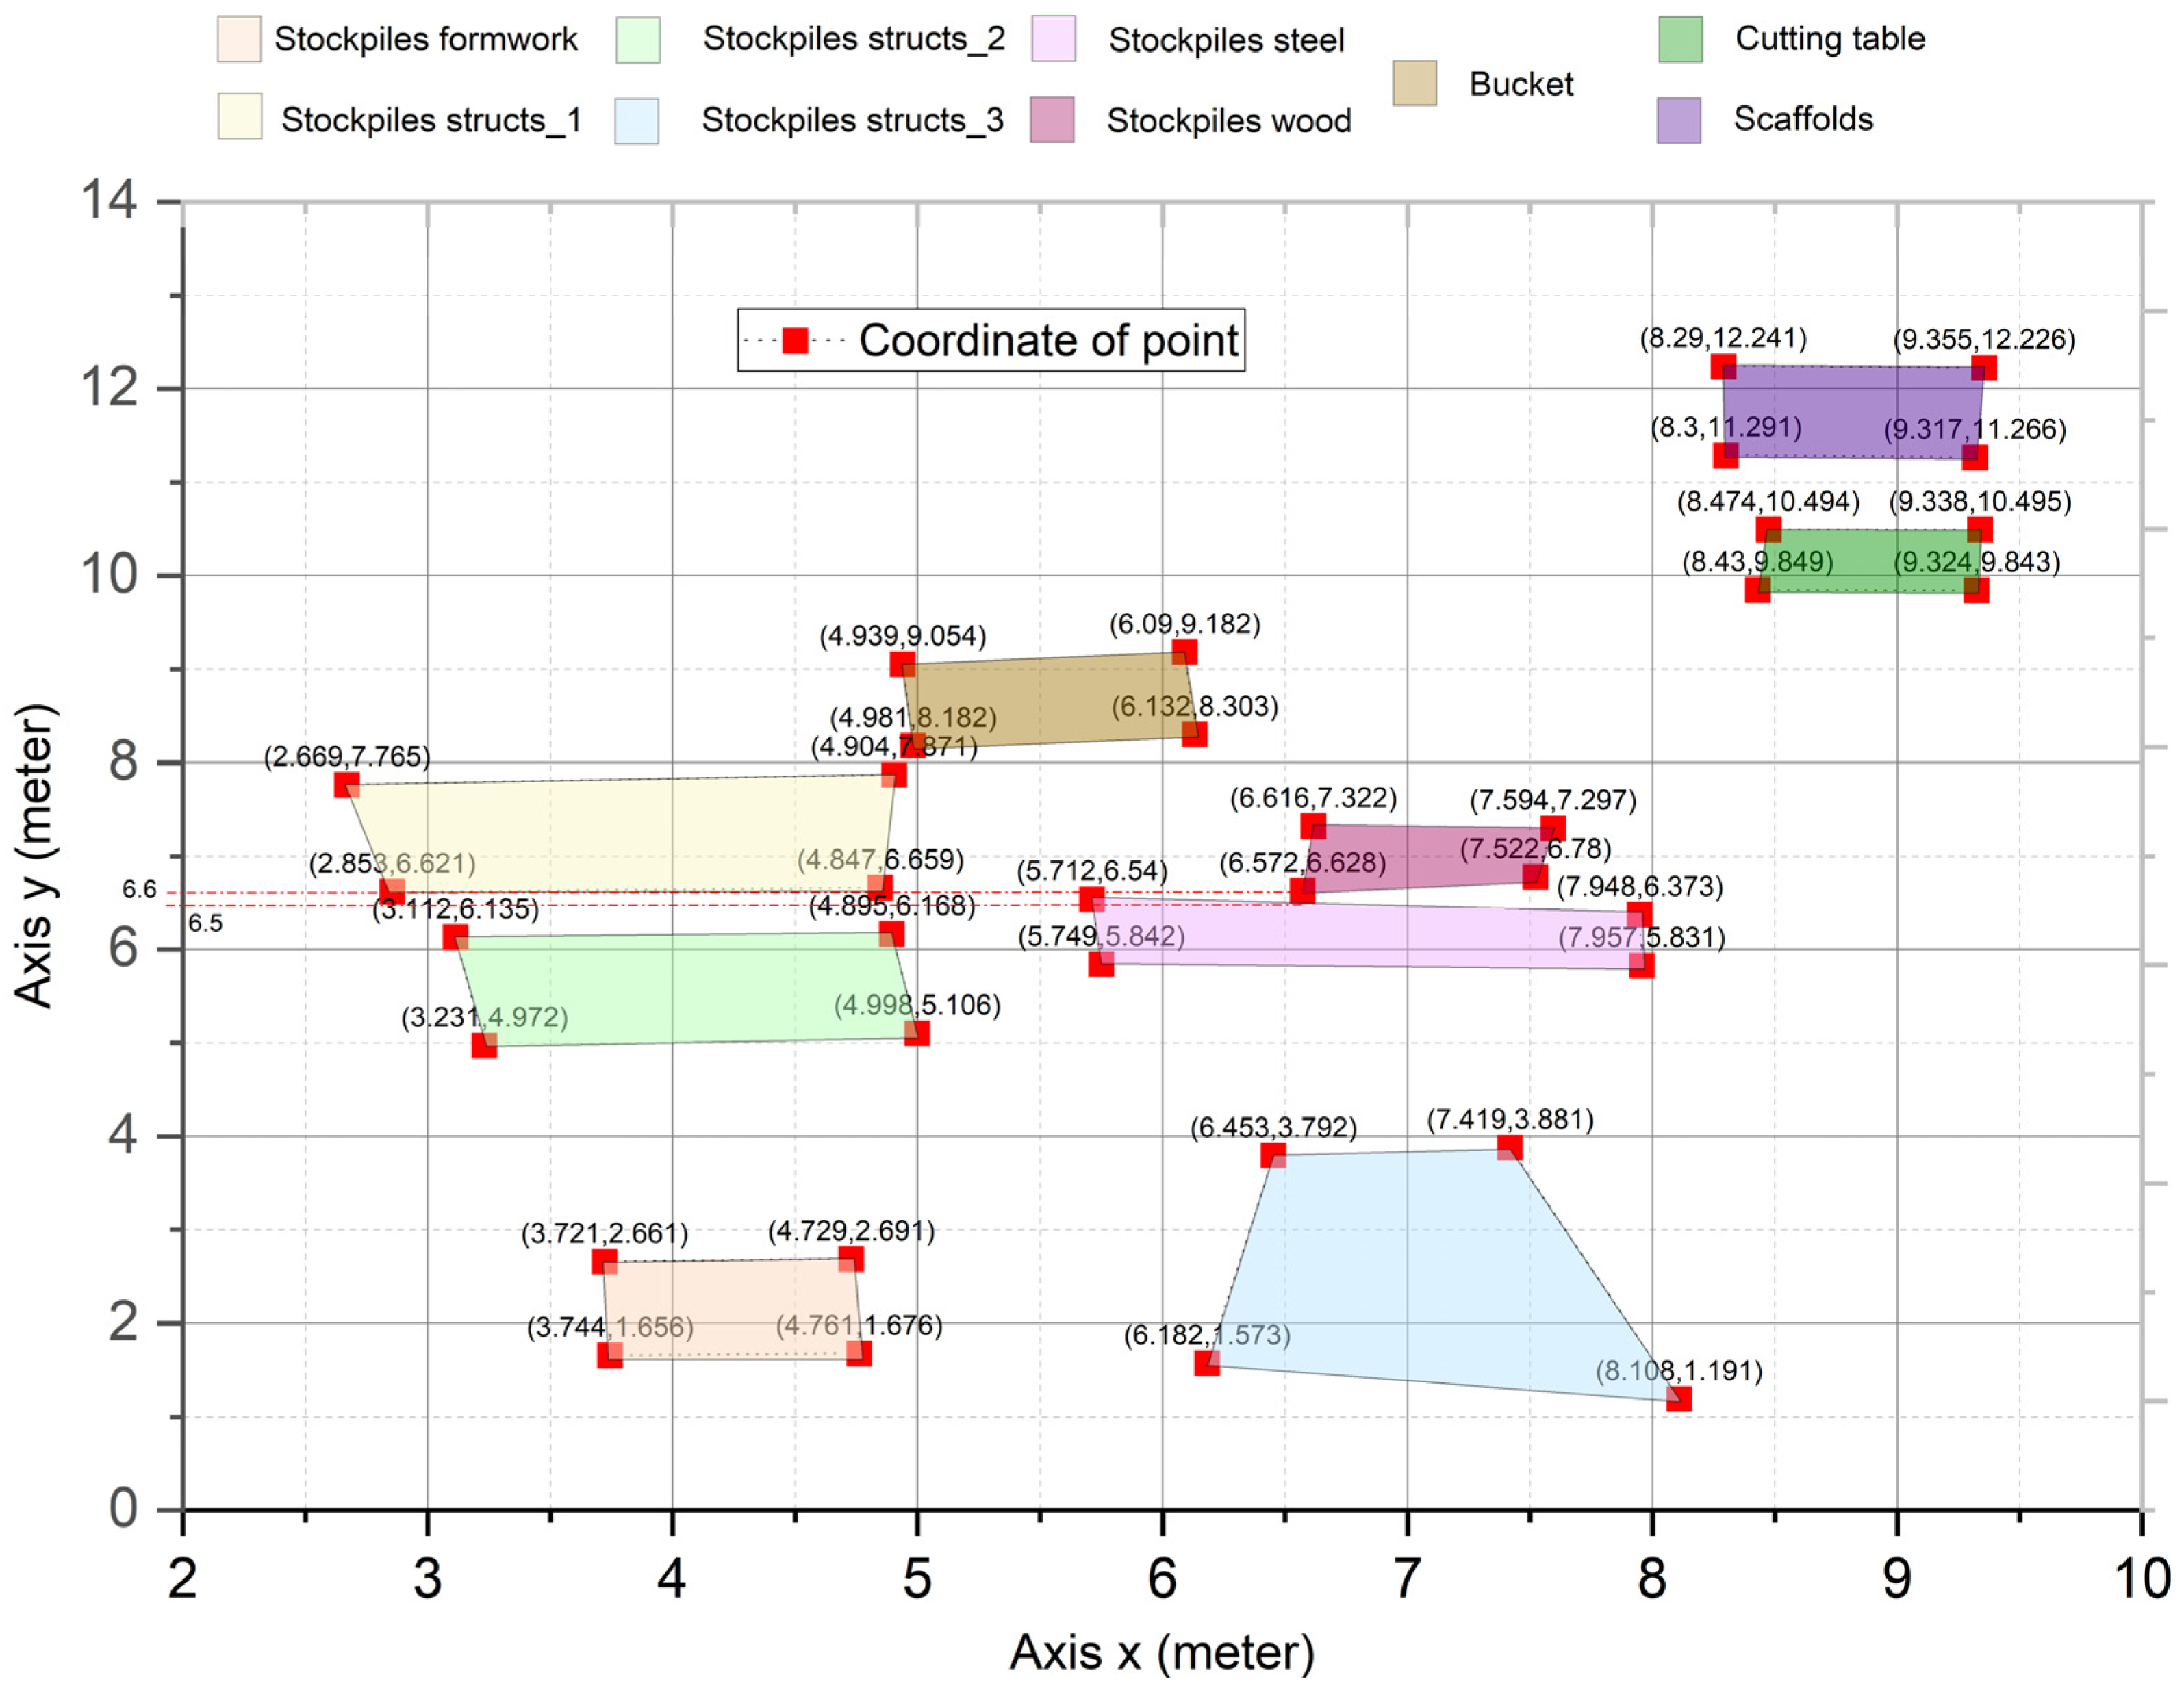
The structure was plotted, taking into account the coordinates in a plane (x, y), as shown in
Figure 13.
Nine parts were identified that correspond to the stockpiles of the formwork, the stockpiles of props, steel material, wooden boards, the cutting table, and the scaffolding body.
The sampling pattern determines a new scenario of analysis in which the distribution of the collections can cause interruptions in the work. This way of representing the spaces graphically accurately determines whether they are free of obstacles.
2.7. Overview of Workspace Modelling
At present, the methods of planning workspaces are carried out by means of CAD structures in 2D analysis elements.
Image vision has been developed later, although this work delves into aspects of 4D CAD visualization by allowing and quantitatively analyzing the sequences and activities that can be carried out in the registration phases through a TLS.
Using reverse engineering makes it possible to determine aspects that may be overlooked by other interpretations other than this method.
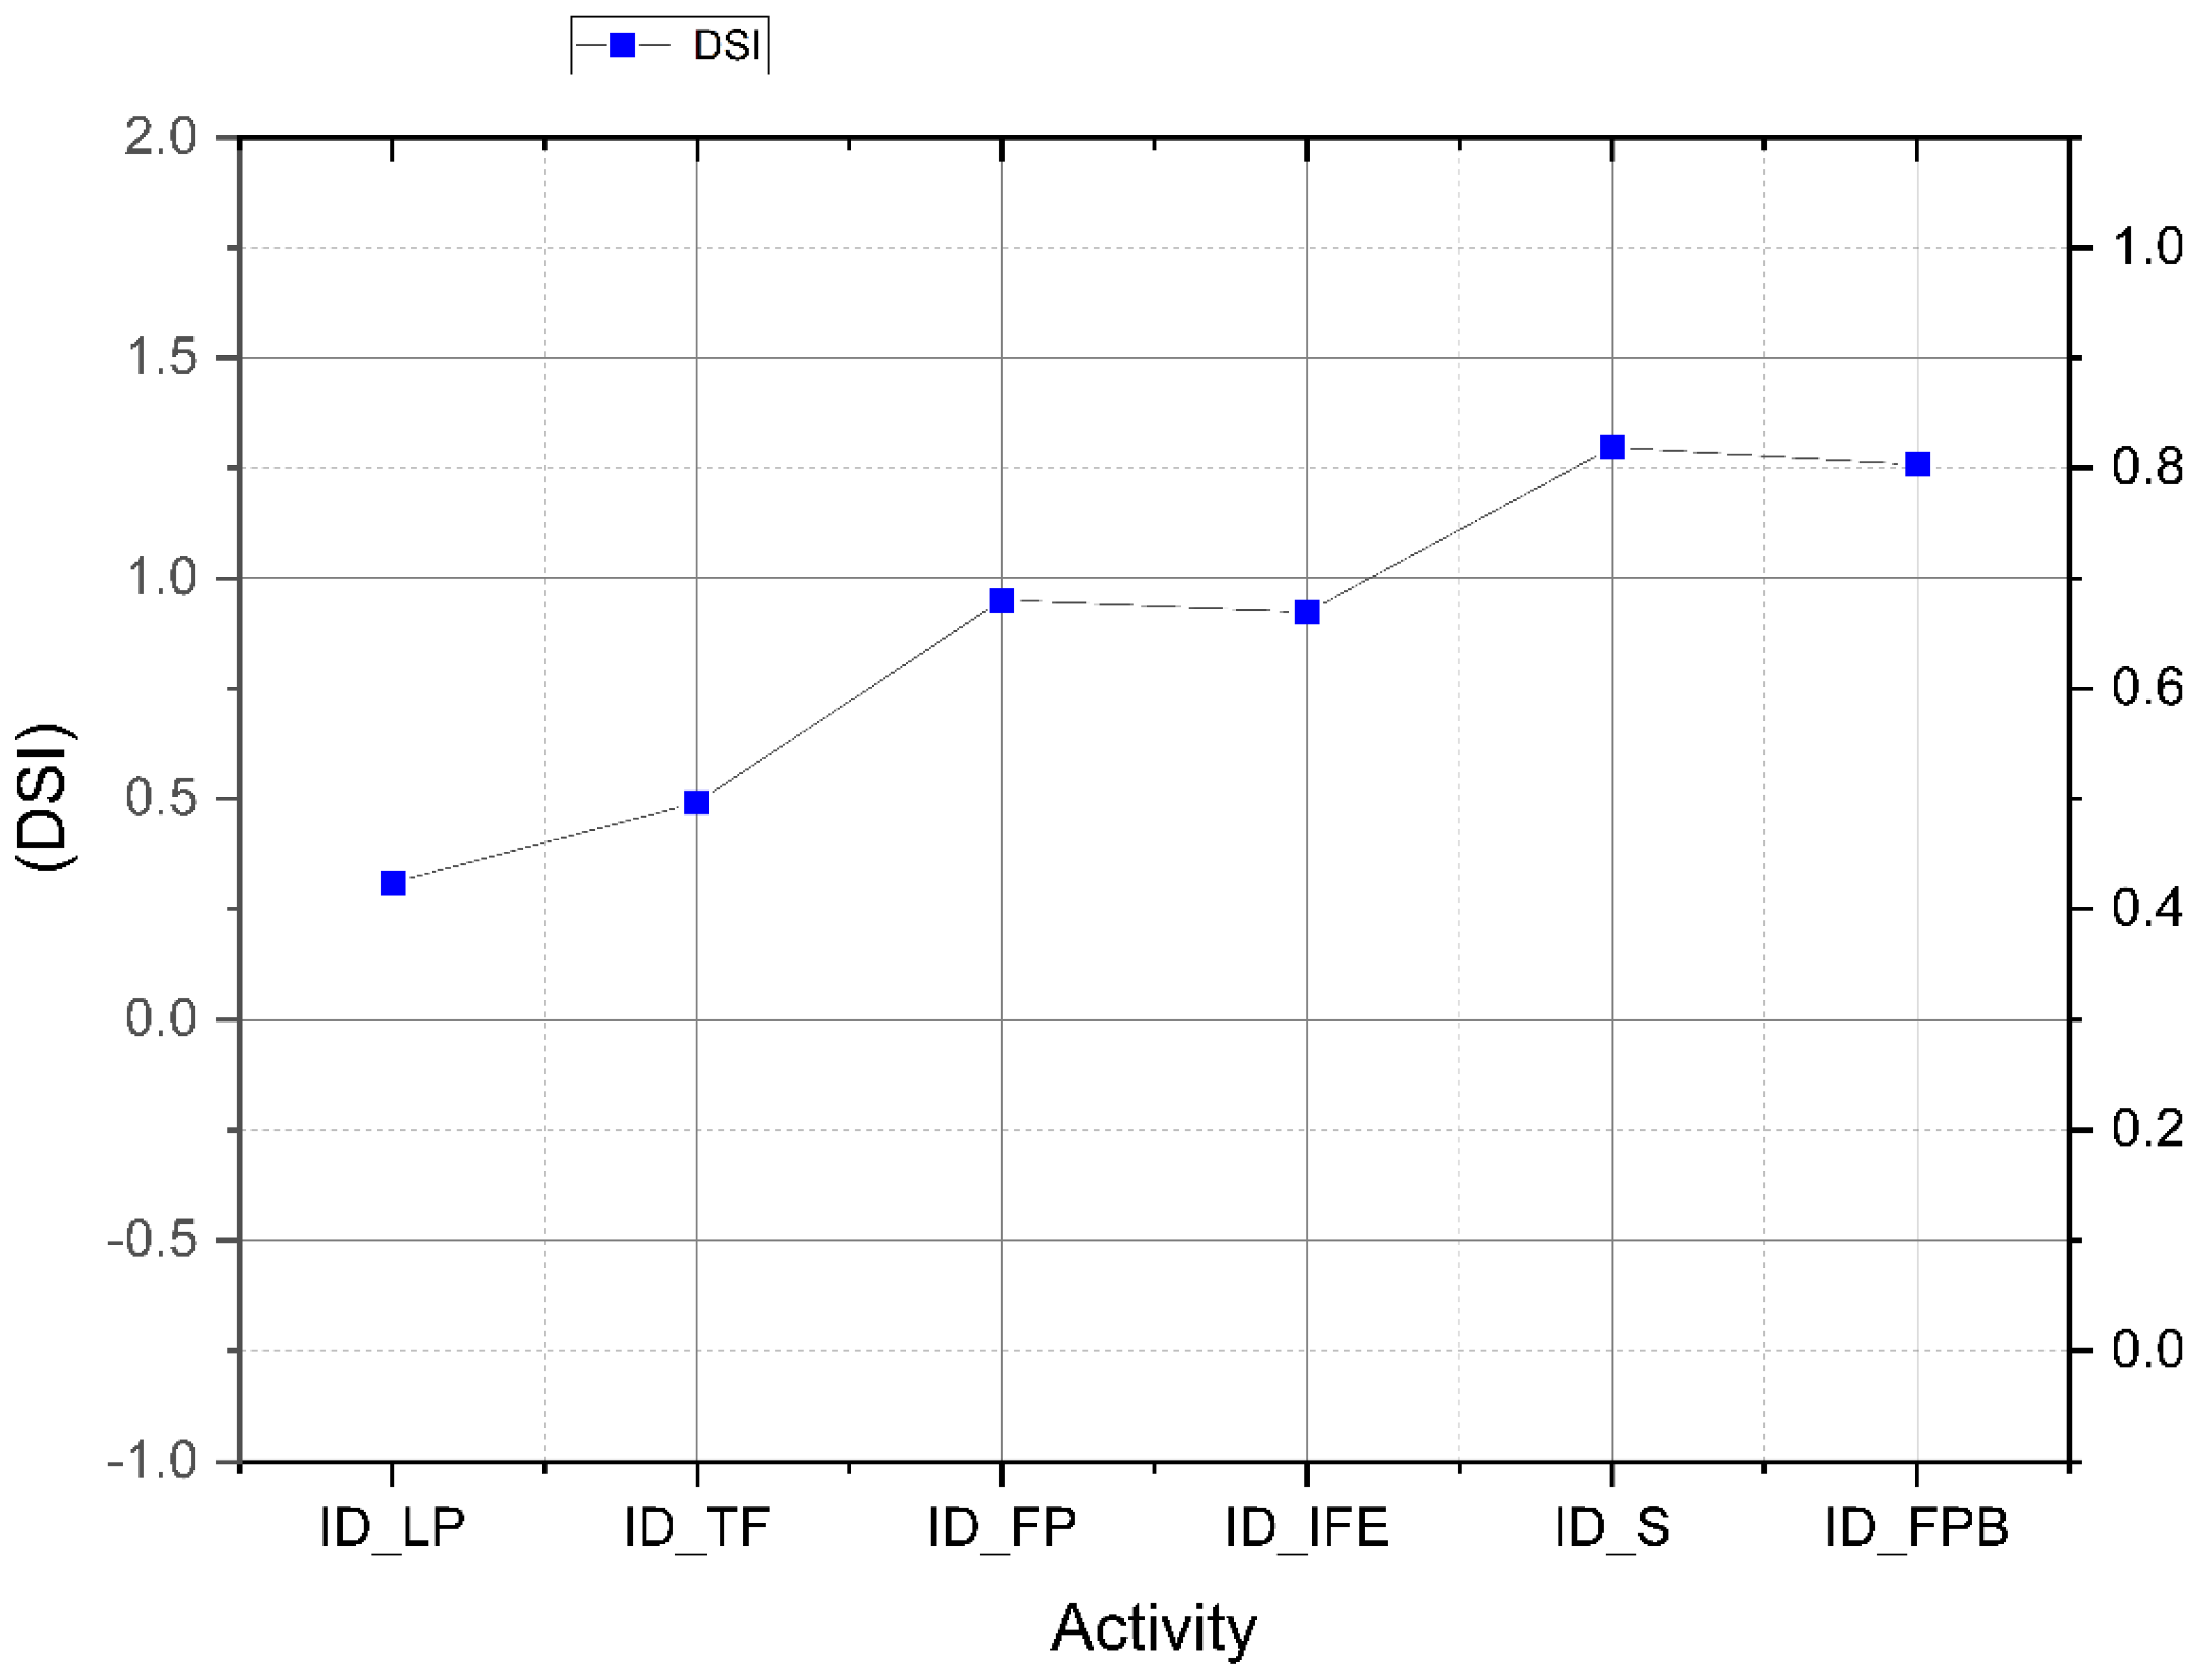
According to the methodological structure exposed in previous sections, with Dynamic Spatial Interference (DSI), the extent to which a work operator can accommodate interferences due to other activity workspaces is obtained. For this, six interactions are characterized in phase 4 that have been cataloged as formwork cleaning (ID_LP); transfer of formwork (ID_TF); formwork positioning (ID_FP); installation of fixed elements (ID_IFE); Shoring (ID_S) shoring and plumb formwork (ID_FPB).
Table 7 shows the results of the parameters of Equations (2)–(4).
Table 7 shows the results of the parameters used in the proposed study.
The DSI values obtained in
Table 7 range between 0 and 1, which means that the congestion levels can vary from nonexistence to a critical value overlap. Therefore, the value 1 comprises the maximum congestion value (
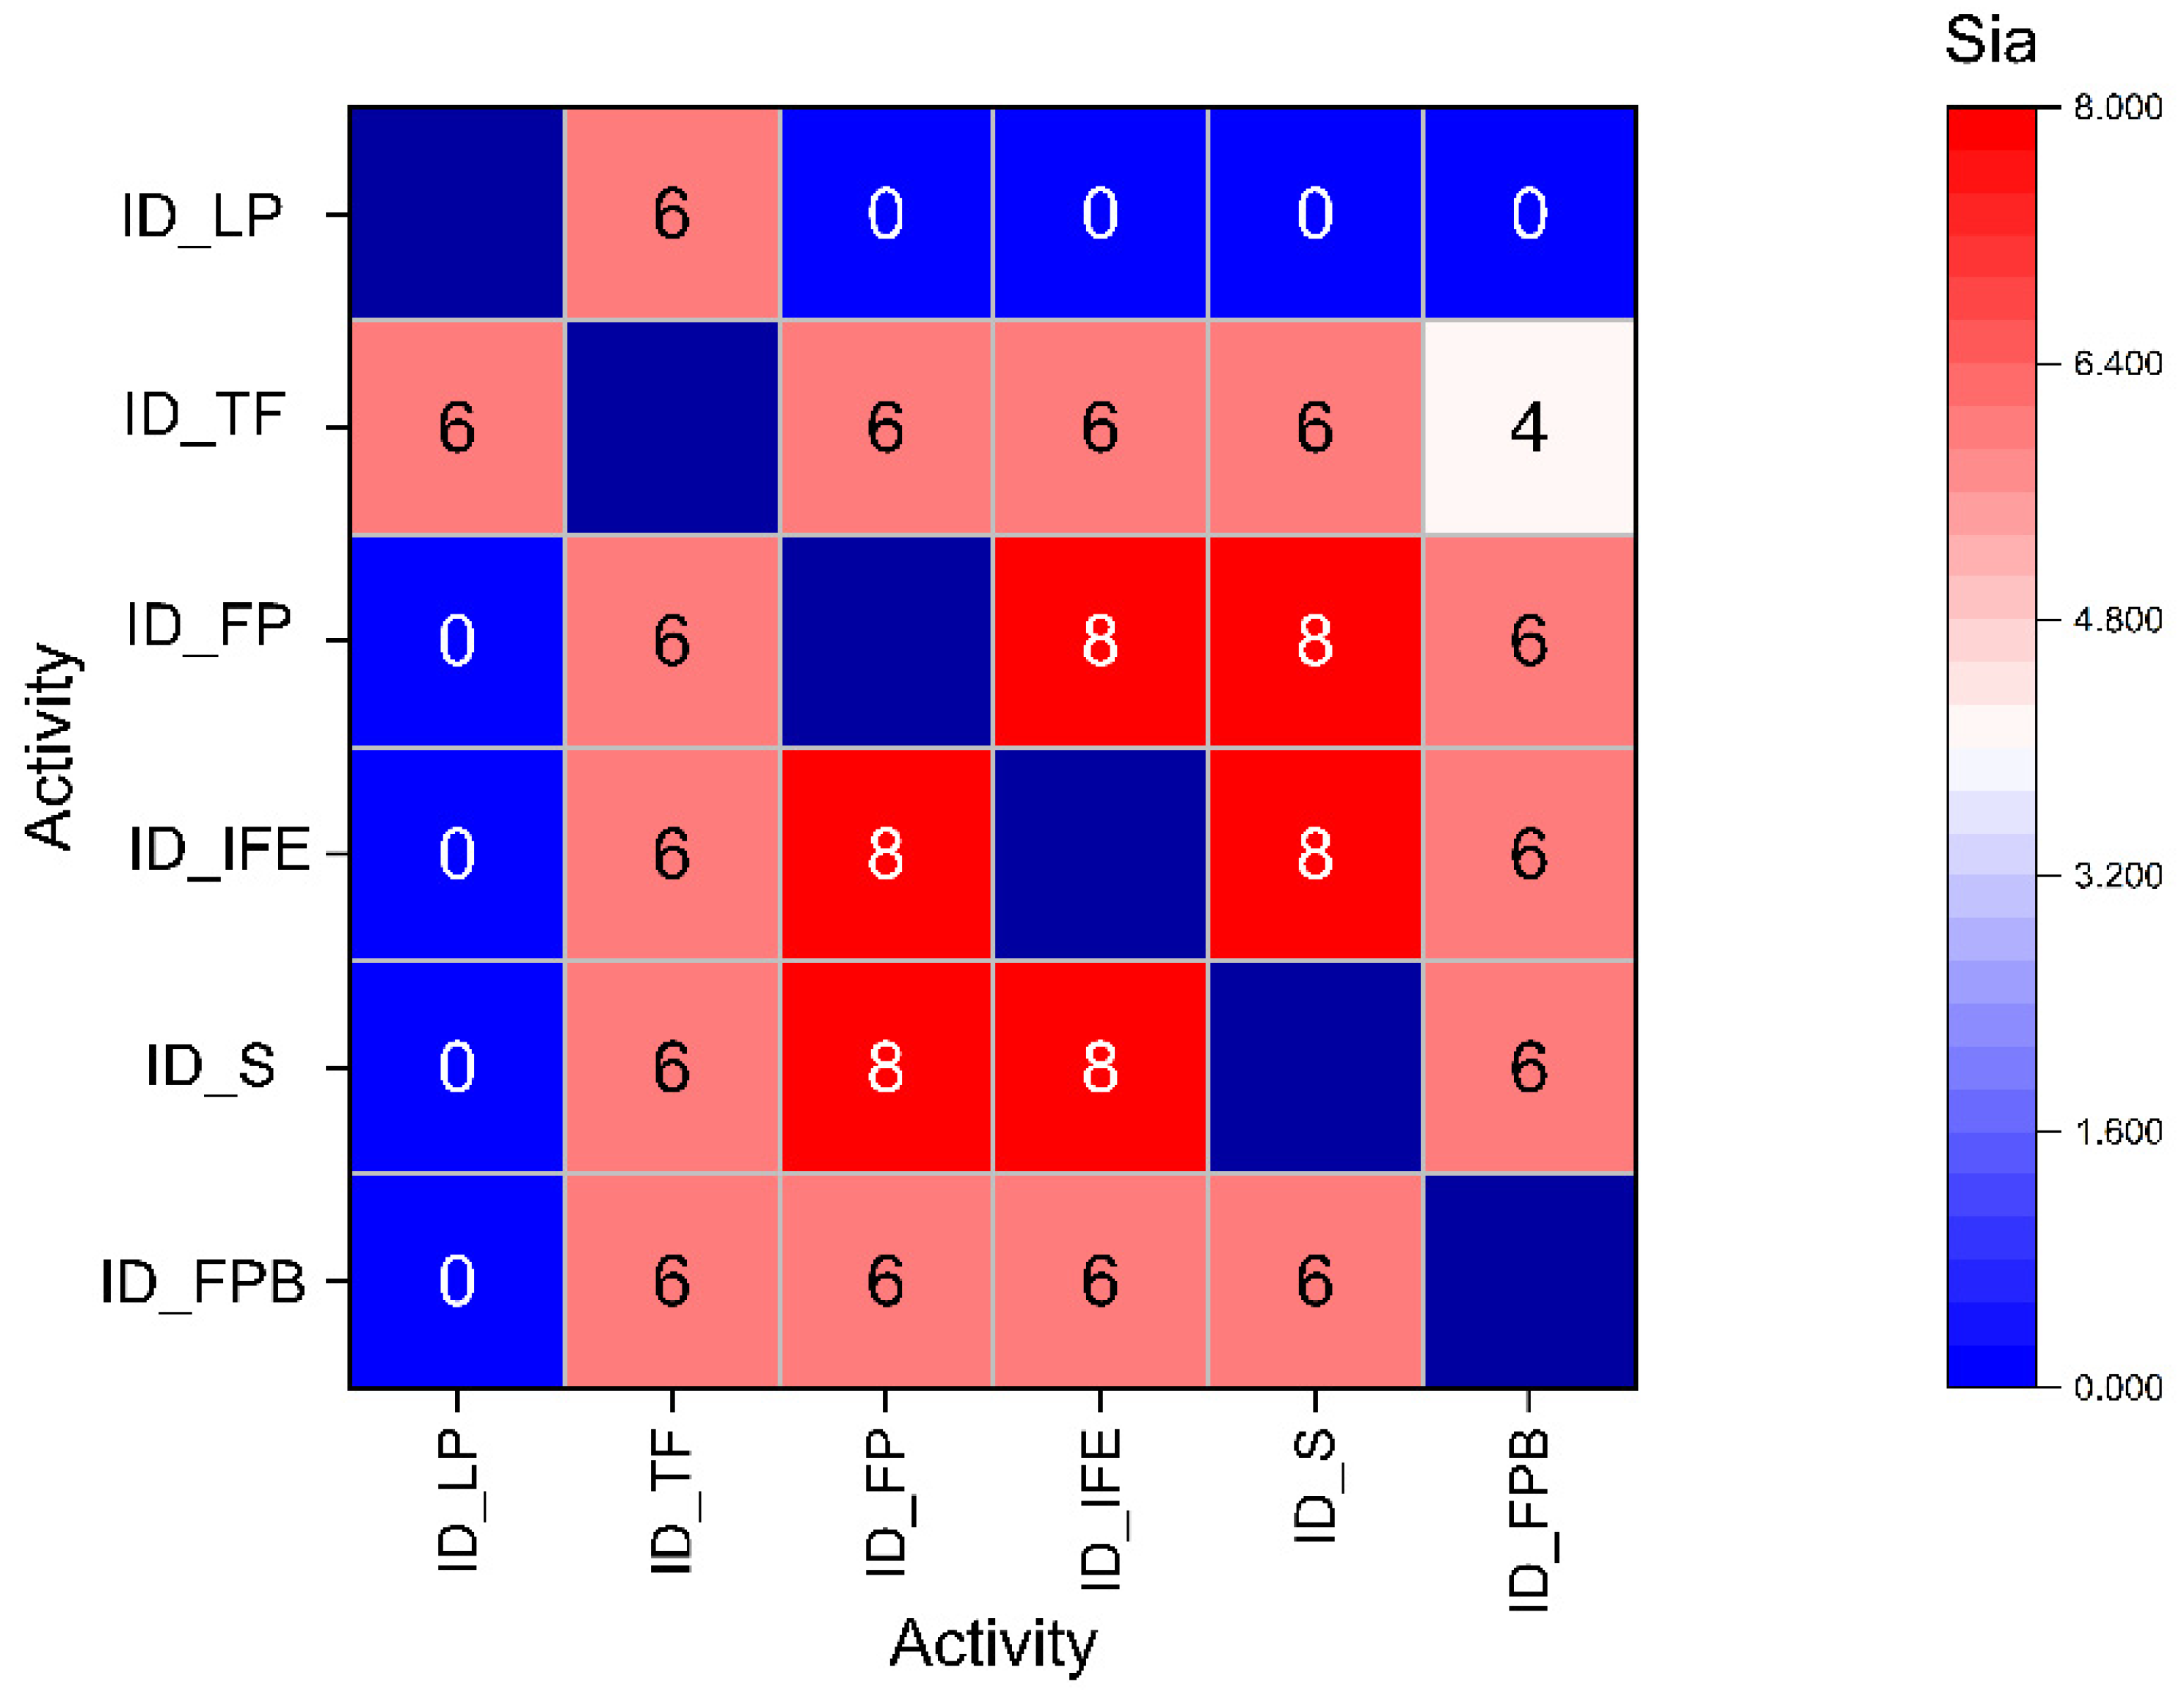
Figure 14). Analysis of the graph estimates that the critical value is set to Shoring (ID_S) and the minimum value to formwork cleaning (ID_LP). In addition, to know the interpretation of the values of the Sia or the tia, a correlation matrix between the activities is exposed, where the range is established from 0 to the value 24 as relationship values between space and time, as can be determined in
Figure 15.
2.8. Wall Sector Model BIM
The development of virtual models that link safety and hygiene in construction work is gaining considerable results. From the beginning, 4D models were used to generate three-dimensional geometric models with construction schedule data [
55] that allow predicting issues about organization. With the appearance of BIM 4D, safety verification systems based on accident codes have become more extensive. And in this line of action, construction safety risk assessments have been specializing in different stages, for example, in the design of construction projects [
56] or the focus of this work, where post-construction analysis through reverse engineering prevails. The generation of BIM models and their analysis using the point cloud is a common practice to find the deformations that have taken place during construction. It allows us to detect the magnitude and type of errors committed on site and the movements caused by the formwork systems during the execution of the works.
For this analysis, the entire structure is modeled by selecting Grafisoft’s BIM ArchiCAD version 25 software, which, together with Revit, is the most widely used tool in the design process of a construction information model in new buildings and historic buildings.
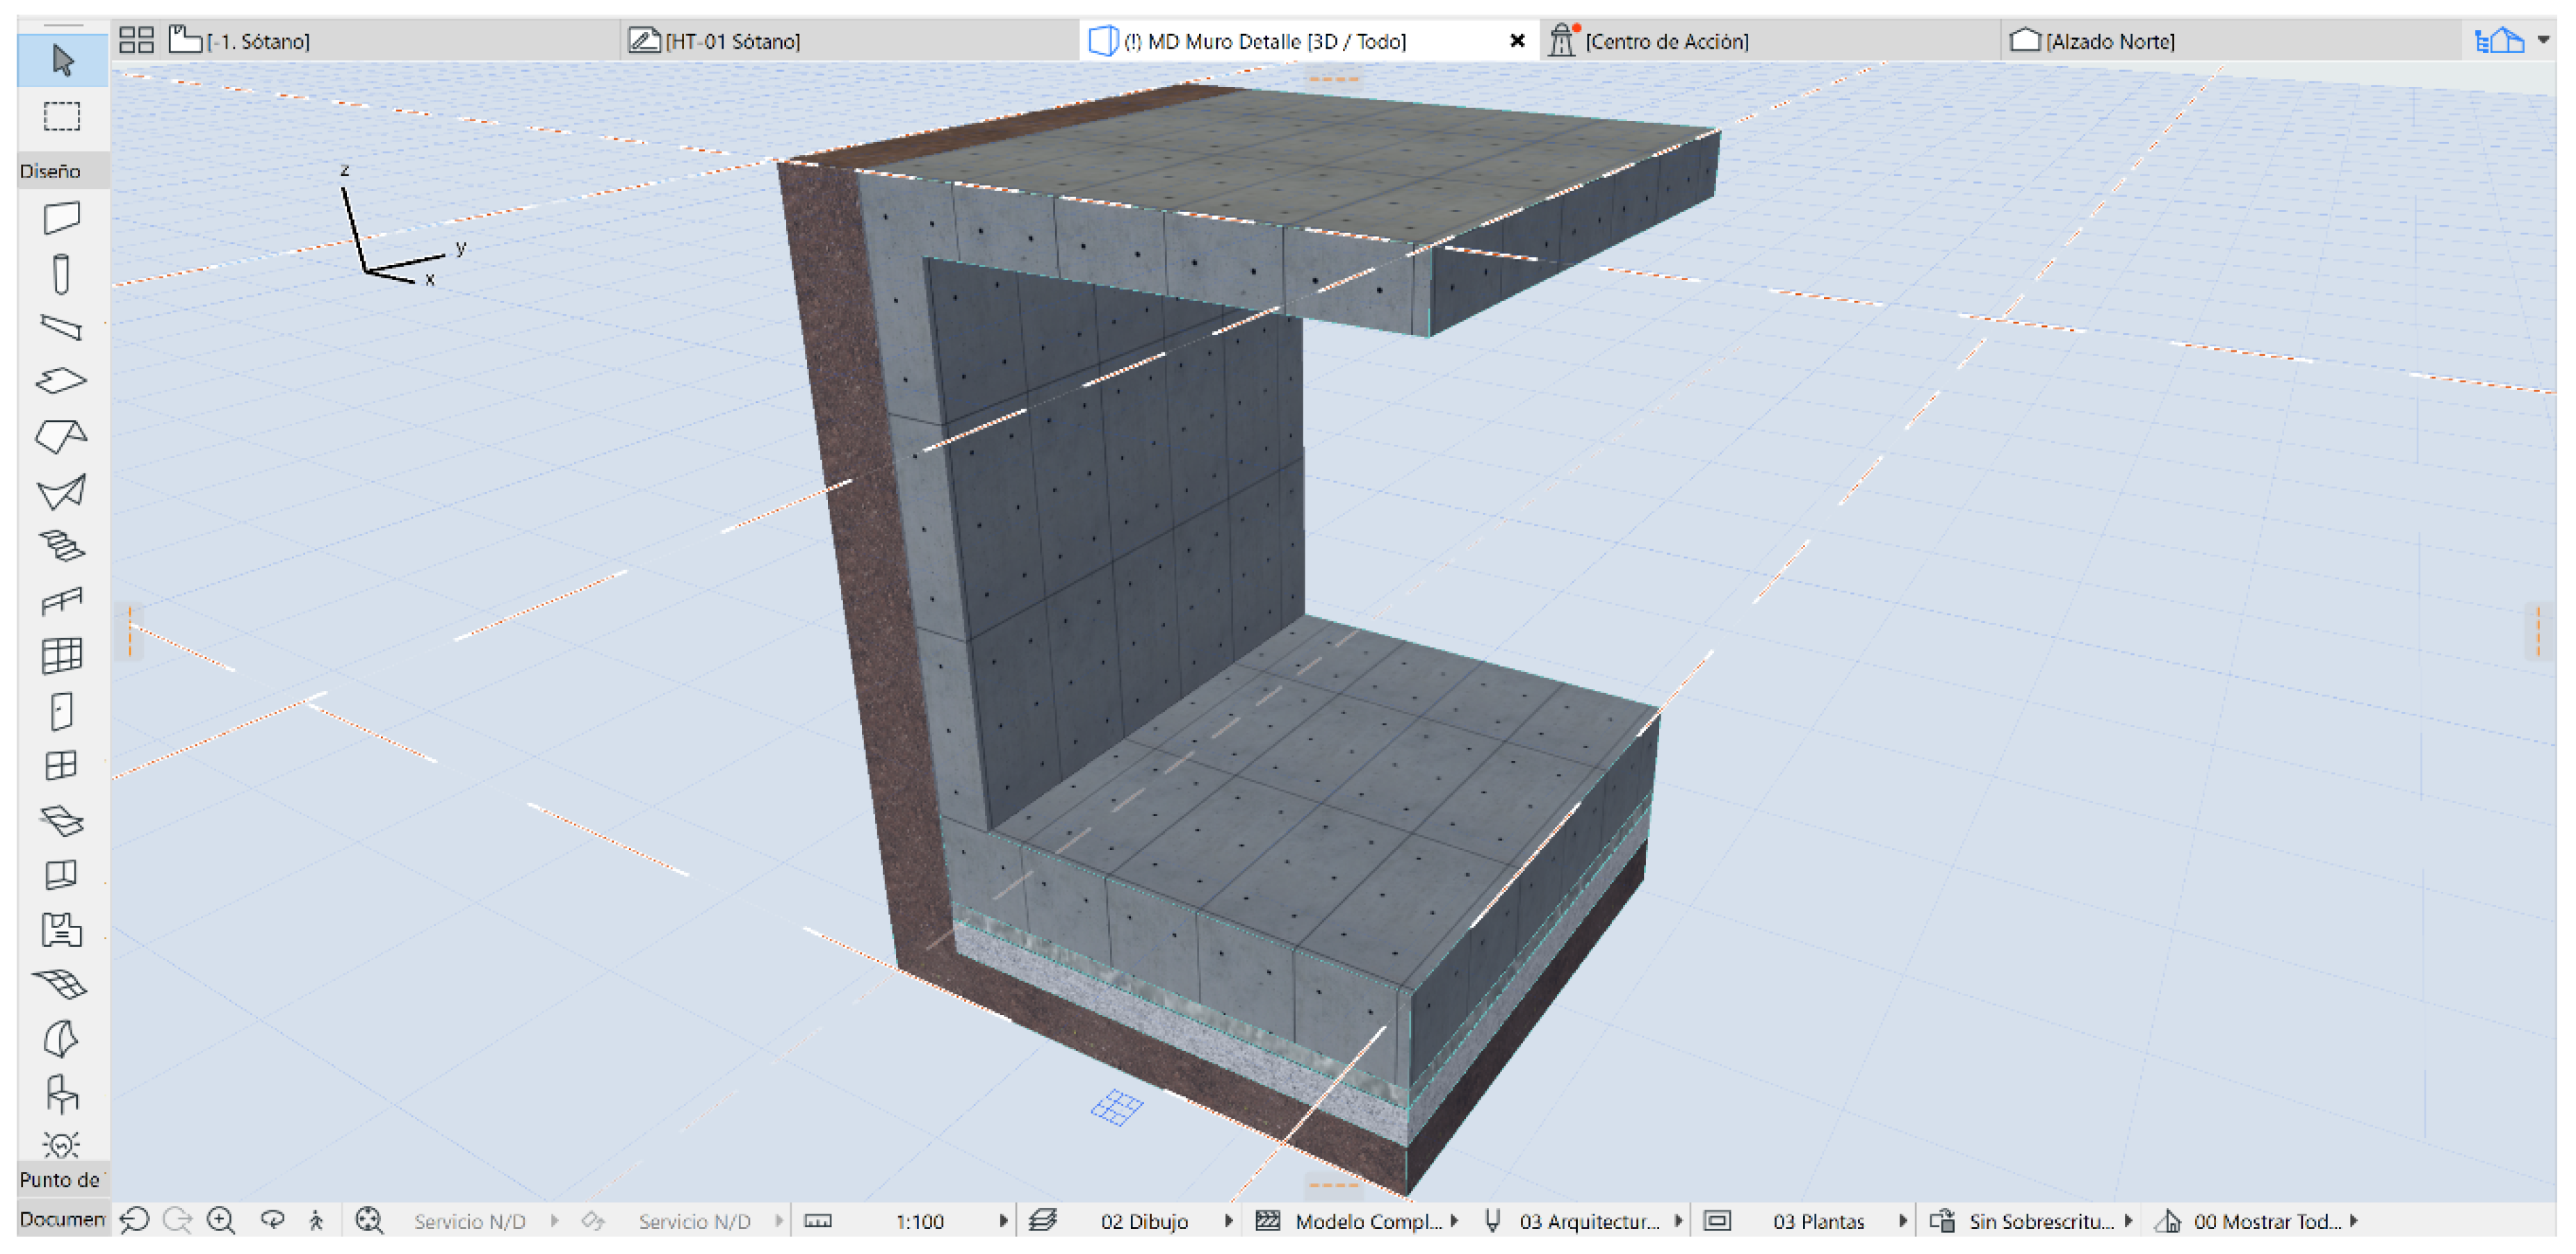
Starting from the complete structure, a partial basement wall is made in
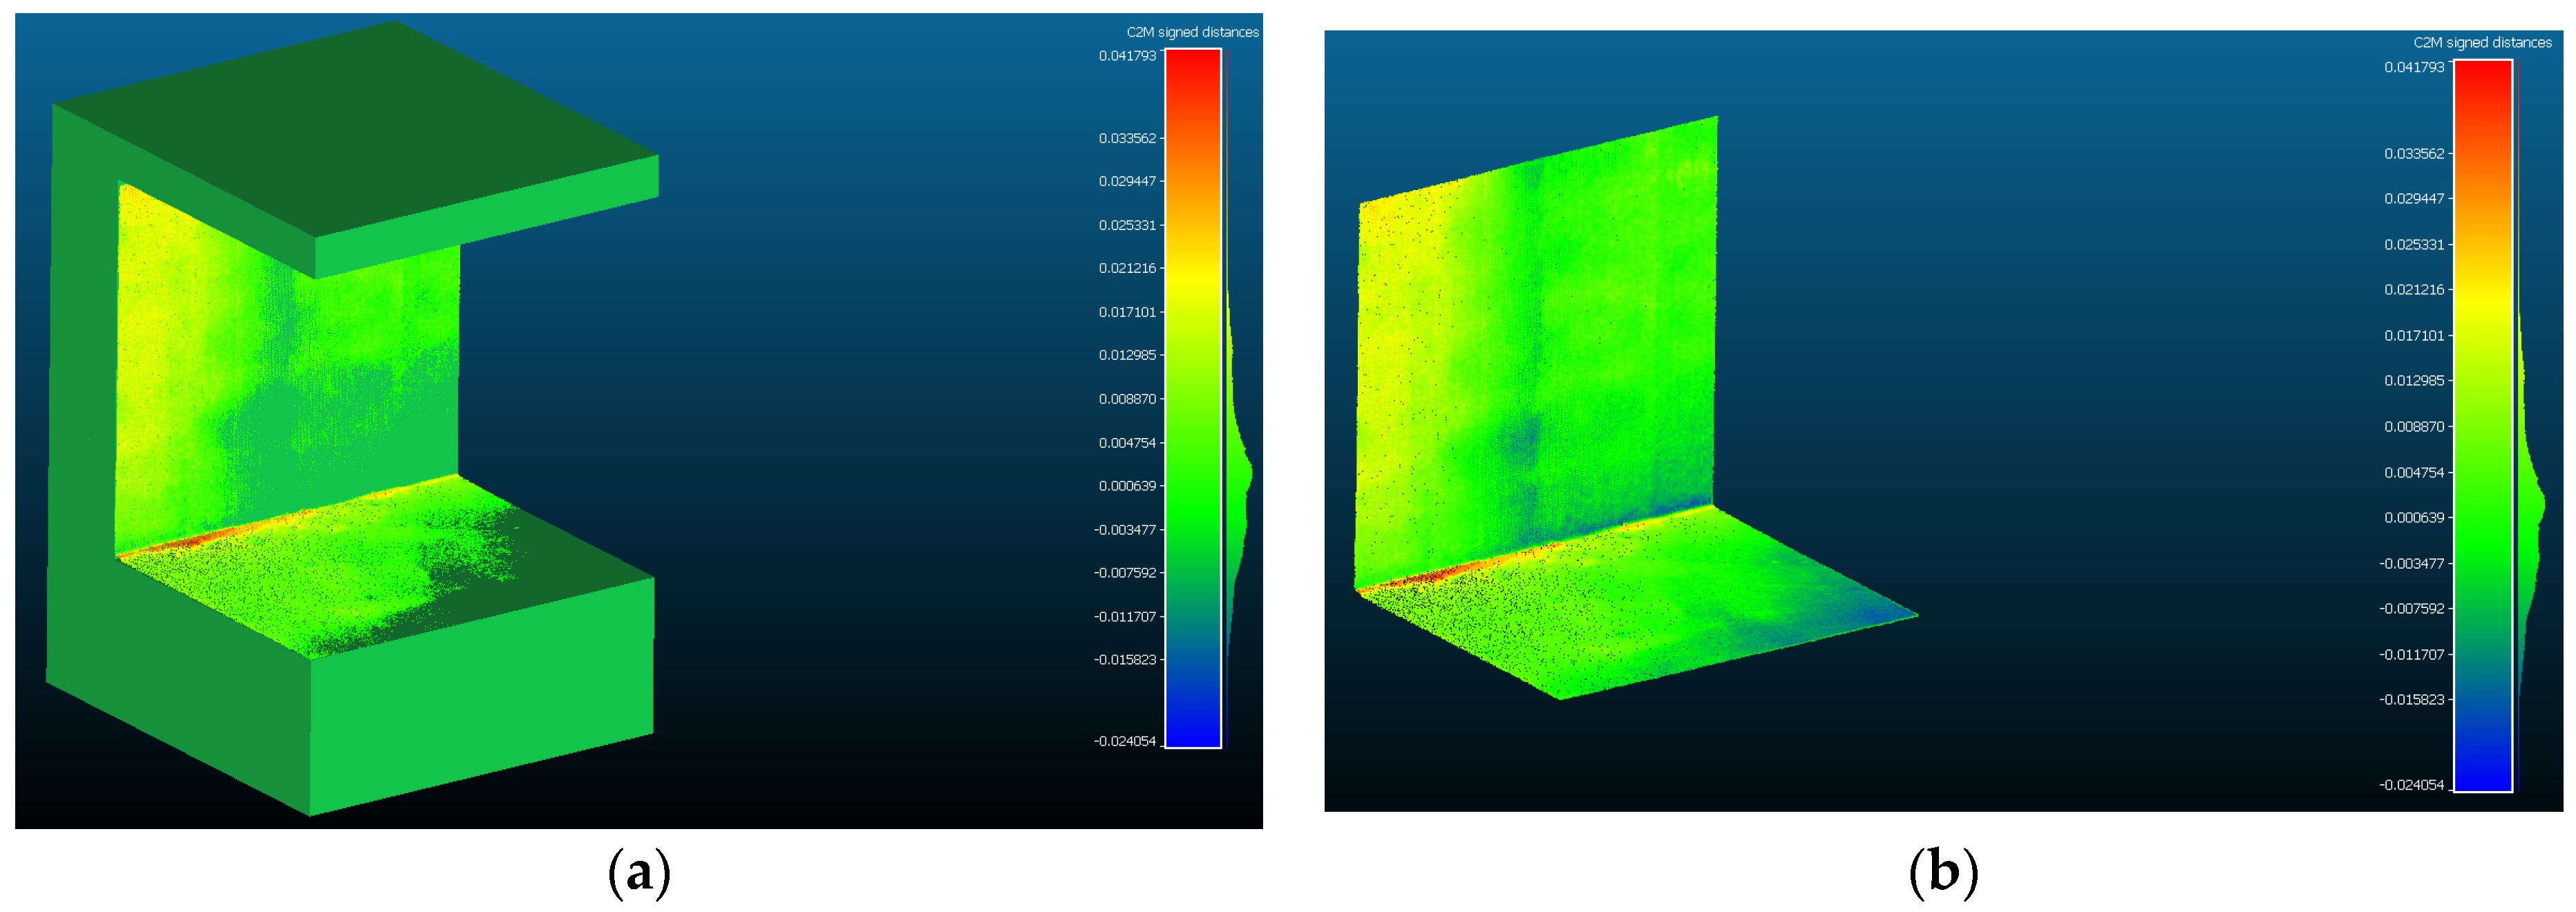
Figure 16, which represents each of the parts, from the natural terrain to each of the layers that make up the structural unit. This slab and wall sector is exported in .STL format for further evaluation with the data set obtained from the records. The BIM model is compared with the set of points obtained by manual segmentation of the same environment in its final state. That is, once the concreting is finished, the laser scanner register takes measurements of the exterior surfaces of the walls. Both the complete model and the face model are represented in
Figure 17.
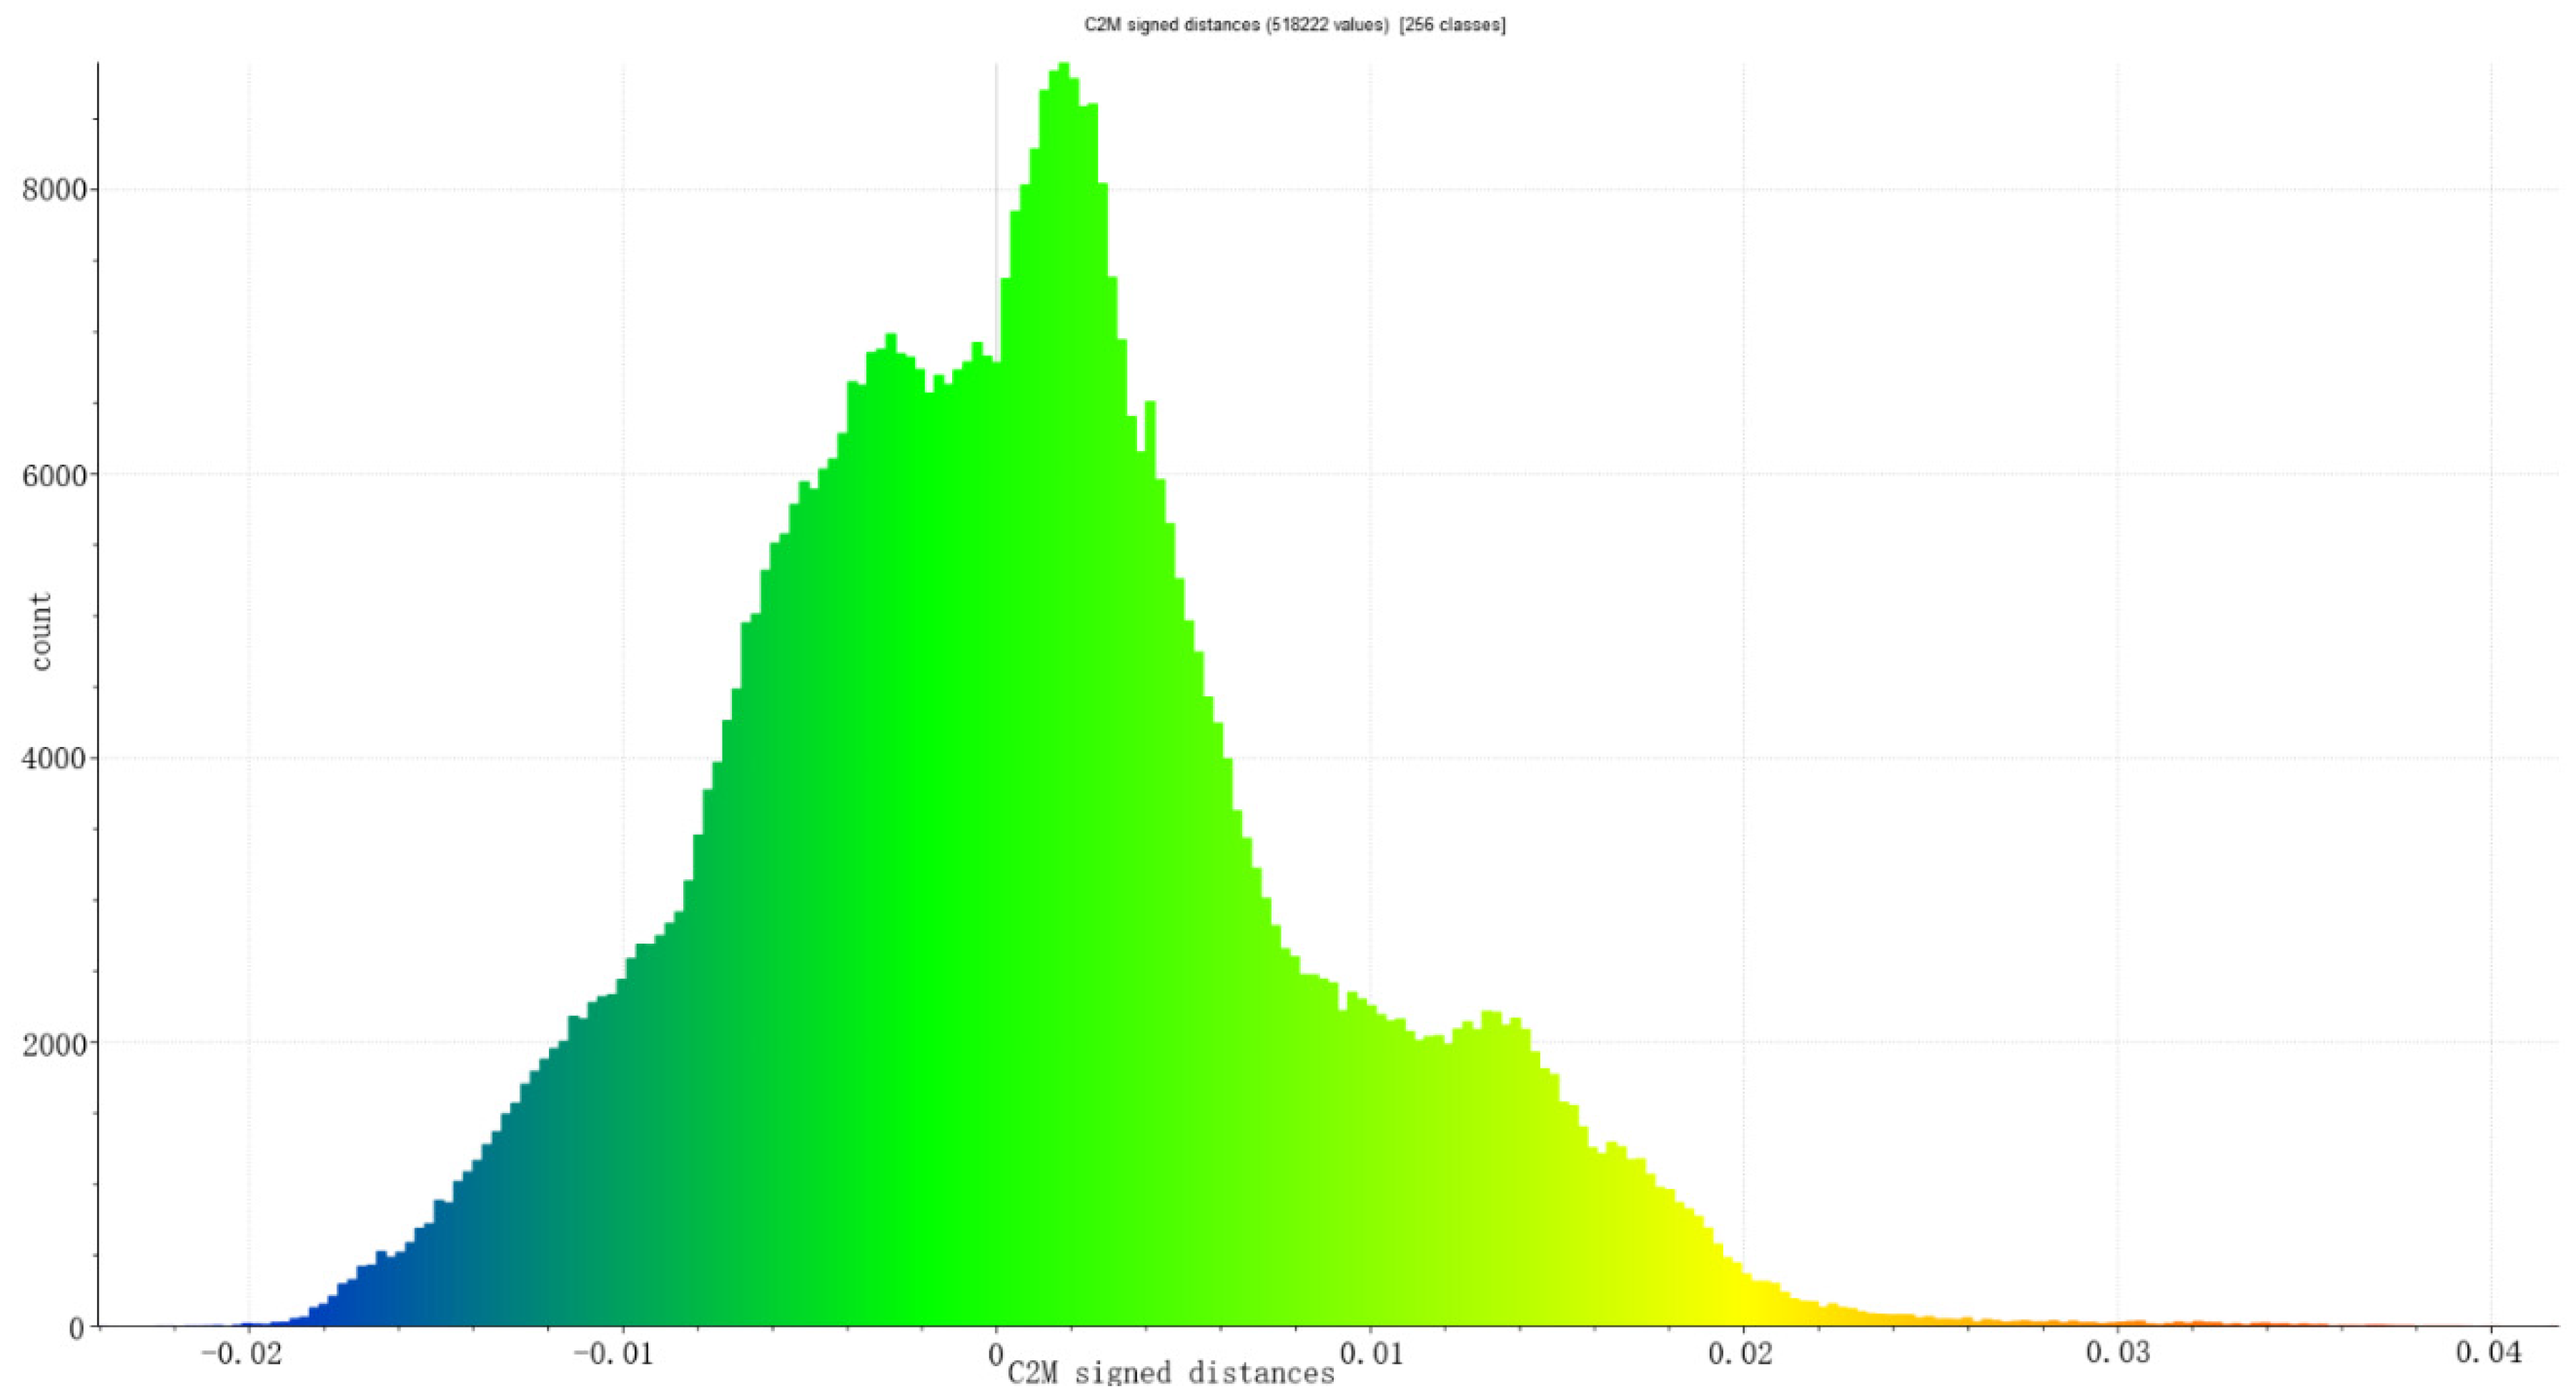
The results can be observed through the histogram (
Figure 17).
The deflection maps determine color patterns in the directions of the surfaces normal to the evaluation plane, in this case, the (x, y) plane and the (y, x) plane. The colors designated in red represent the highest range of deformations obtained from that evaluation, and, as can be seen in the histogram, there are a large number of coincident points in green (
Figure 18) that are close to the zero value.
3. Discussion of the Results
Most of the studies for the evaluation of the security risk in construction works analyzing 3D dimensions, the shape that the spaces occupy, and the location of the objects are focused on surveillance camera systems [
57,
58] The advantage of these systems is that they can remotely recognize the work methods that are being used in real time on construction sites.
On the other hand, the use of terrestrial laser scanning techniques or photogrammetry via drones is very limited, perhaps because of the specialization of the operators in the recording of information and its subsequent processing.
However, there is no doubt that, through the analysis methodologies developed in this work, very interesting data can be inferred about the use and management of security systems. Thus, the TLS record allows analyzing the physical environment at a given moment and in 3D, with which there is a clear difference with respect to surveillance cameras since the study context is an environment of axes (x, y, z), thus being able to reproduce and measure the physical characteristics at each moment and place that we determine with millimeter precision.
In addition, the data obtained from spatial analysis are very suitable to be inserted into a building digital information model (BIM), taking into account that BIM platforms manage processes that have to do with time, cost, resources, and building maintenance.
Thus, in an initial part of this work, the distance between the cloud of points of the column reinforcements and the faces of the rectangular prism that makes up the reinforced concrete solid (pillar 1) is evaluated using the CloudCompare ICP algorithm.
This analysis conforms the dispersion in centimeters between the face of the reinforcement and the faces of the solid and supposes knowing the deviation that the reinforcement presents before its concreting and quantifying the construction errors regarding the separation of reinforcements and also the degree of inclination of these respects the verticality of the element. This inclination could carry the risk of armor displacement in areas of operation.
However, most of the sets of points that have a blue color in
Figure 5 are due to the coincidence of the plane of elevation +0.00 and therefore are points that would not be representative of the sample.
In
Figure 6, it can be determined that there is a parabola of point increments in green, a total of 4750 associated points, and that it has a maximum of 0.036 m, which corresponds to the fact that most of the reinforcements are 3.6 cm away. Average spacing of reinforcements. This fact eliminates the risk of reinforcements with great torsion that could endanger the close coverage of workers.
With respect to the wall, these results differ somewhat from those established for the pillar. The first consequence is the fact that two parabolas appear in the graph with a greater number of points when we compare the reinforcement with the face of the formwork. This analysis can determine whether there was any deformation during the concrete pouring process, as well as the degree of risk or displacement. From the observations of the histogram in
Figure 8, it can be determined that the two maximum points of the graph correspond to the position of the extrados and intrados reinforcements with respect to the face of the wall taken as the comparison surface.
Within the analysis of the sampling patterns, a 3D model is generated that can be inserted into the BIM. The 3D or 4D simulation, in comparison with the conventional management techniques, allow global execution strategies [
53] and allows one to determine the different levels of risks in heights and observe the overlaps of the stockpiles and their interferences.
Therefore, a digital elevation map can be a movement control tool that allows security operators to determine the scenario of “Static Elements” and the free space to occupy in the lines of operations or spaces free of obstacles.
From this digital elevation map, a graph can be illustrated with the percentages of the number of points per height (
Figure 11), where the range of height of the operation plan and the activities planned and recorded in phase 1 will be represented on the x-axis. 62% of the plane (x, y) is free of obstacles, and this proportion decreases from 0.25 m to 18% of the total space occupied. From 70 cm in height, the map determines percentages much lower than 5%. This translates into an analysis of the histogram (
Figure 12), where the majority of the points are below −1.00 m, representing spaces free of obstacles, hence the importance of showing the histogram as a basis for analyzing the results.
In addition to all the procedures analyzed, according to Equation (2), a graph of the overlaps of static elements has been determined (
Figure 19).
Stage marks the coordinates in a Π (x, y) plane, the exact position of static elements, and the degree of overlap. With them, it is possible to insert the cloud of points in a BIM modelling environment, build stockpiling scenarios from the graph, and detect collisions between certain spaces, advancing planning and organization aspects.
Closest point interference occurs on the stage between Stockpiles Steel and Stockpiles Wood.
The study of stockpiles in BIM could determine, with real elements, whether the BIM software itself has the properties of establishing object collisions.
From the digital elevation model, a rasterization of the point cloud is performed in phase 4 through the CloudCompare software. The first phase of point cloud rasterization is to establish a grid of square cells in the (x, y) plane. There are several raster algorithms, some based on pixels and others based on points. Shirowzhan et al. [
59], based on the citation of [
60], state that pixel-based LiDAR classification methods are less accurate than point-based methods. Points that are established in a 3D model from pixels lose the original information inherent in the points. Among the algorithms that directly apply the LiDAR point cloud are C2C and M3C2 in the author’s comparison study.
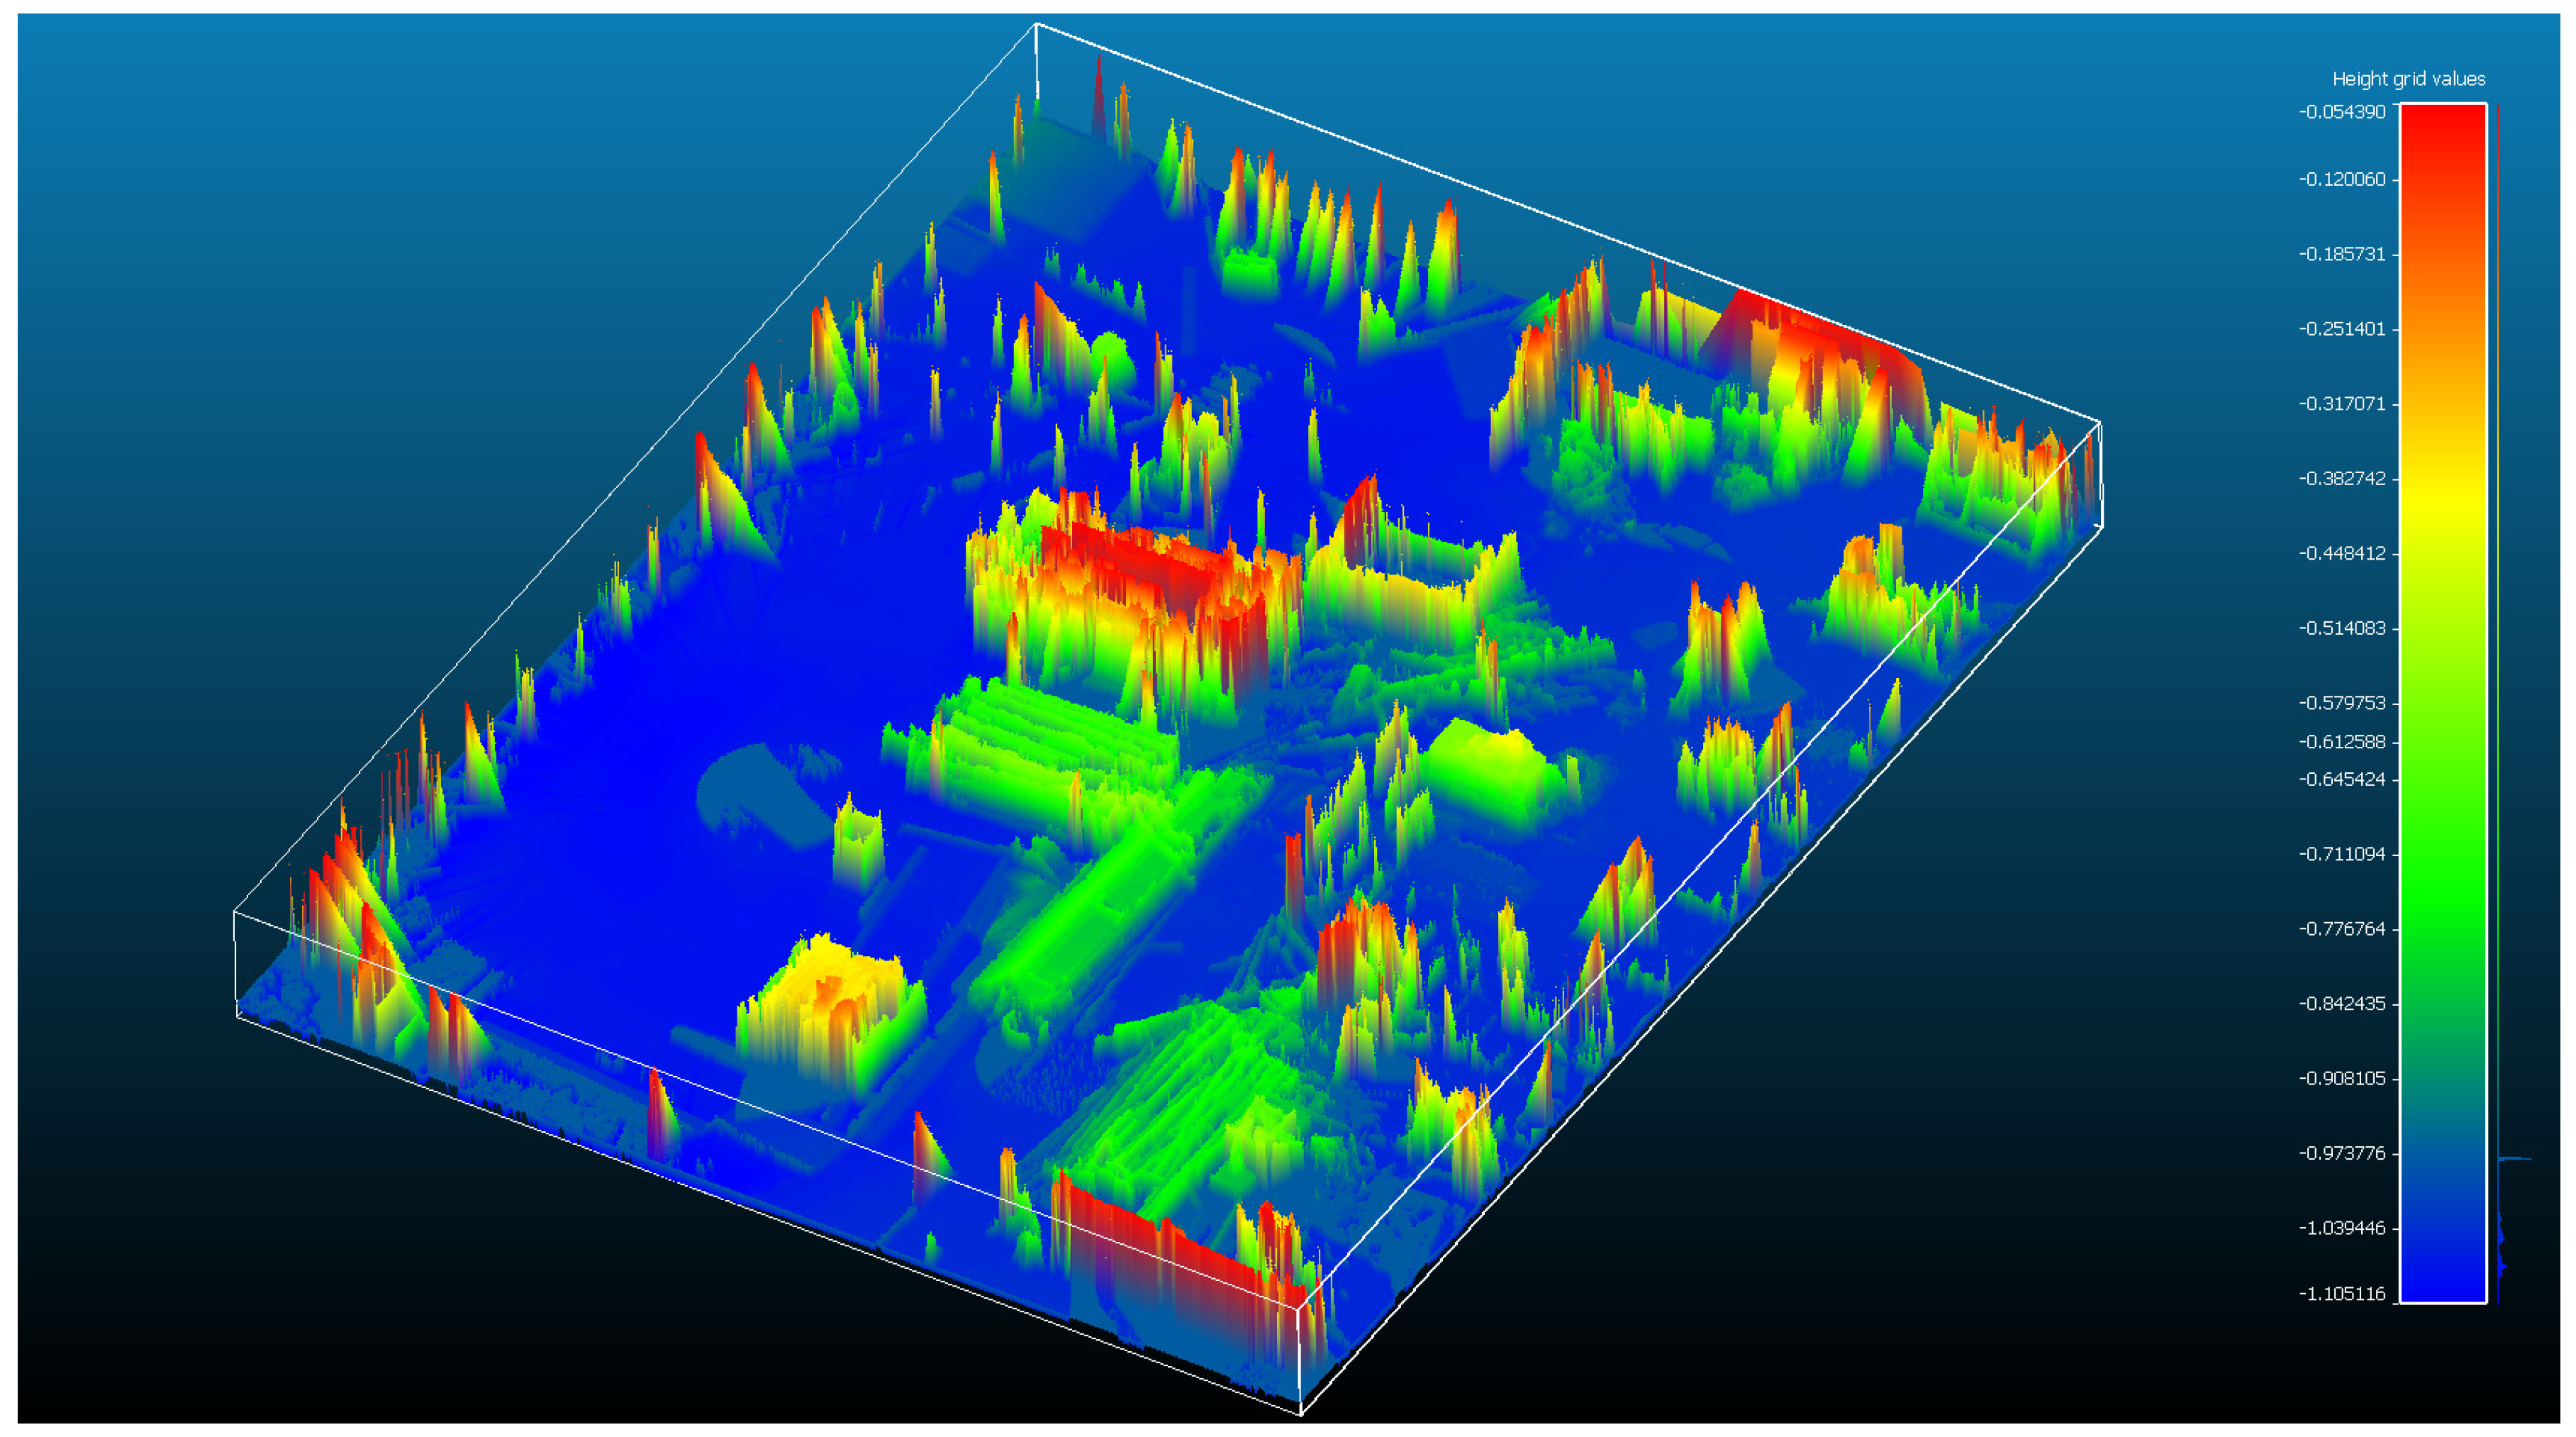
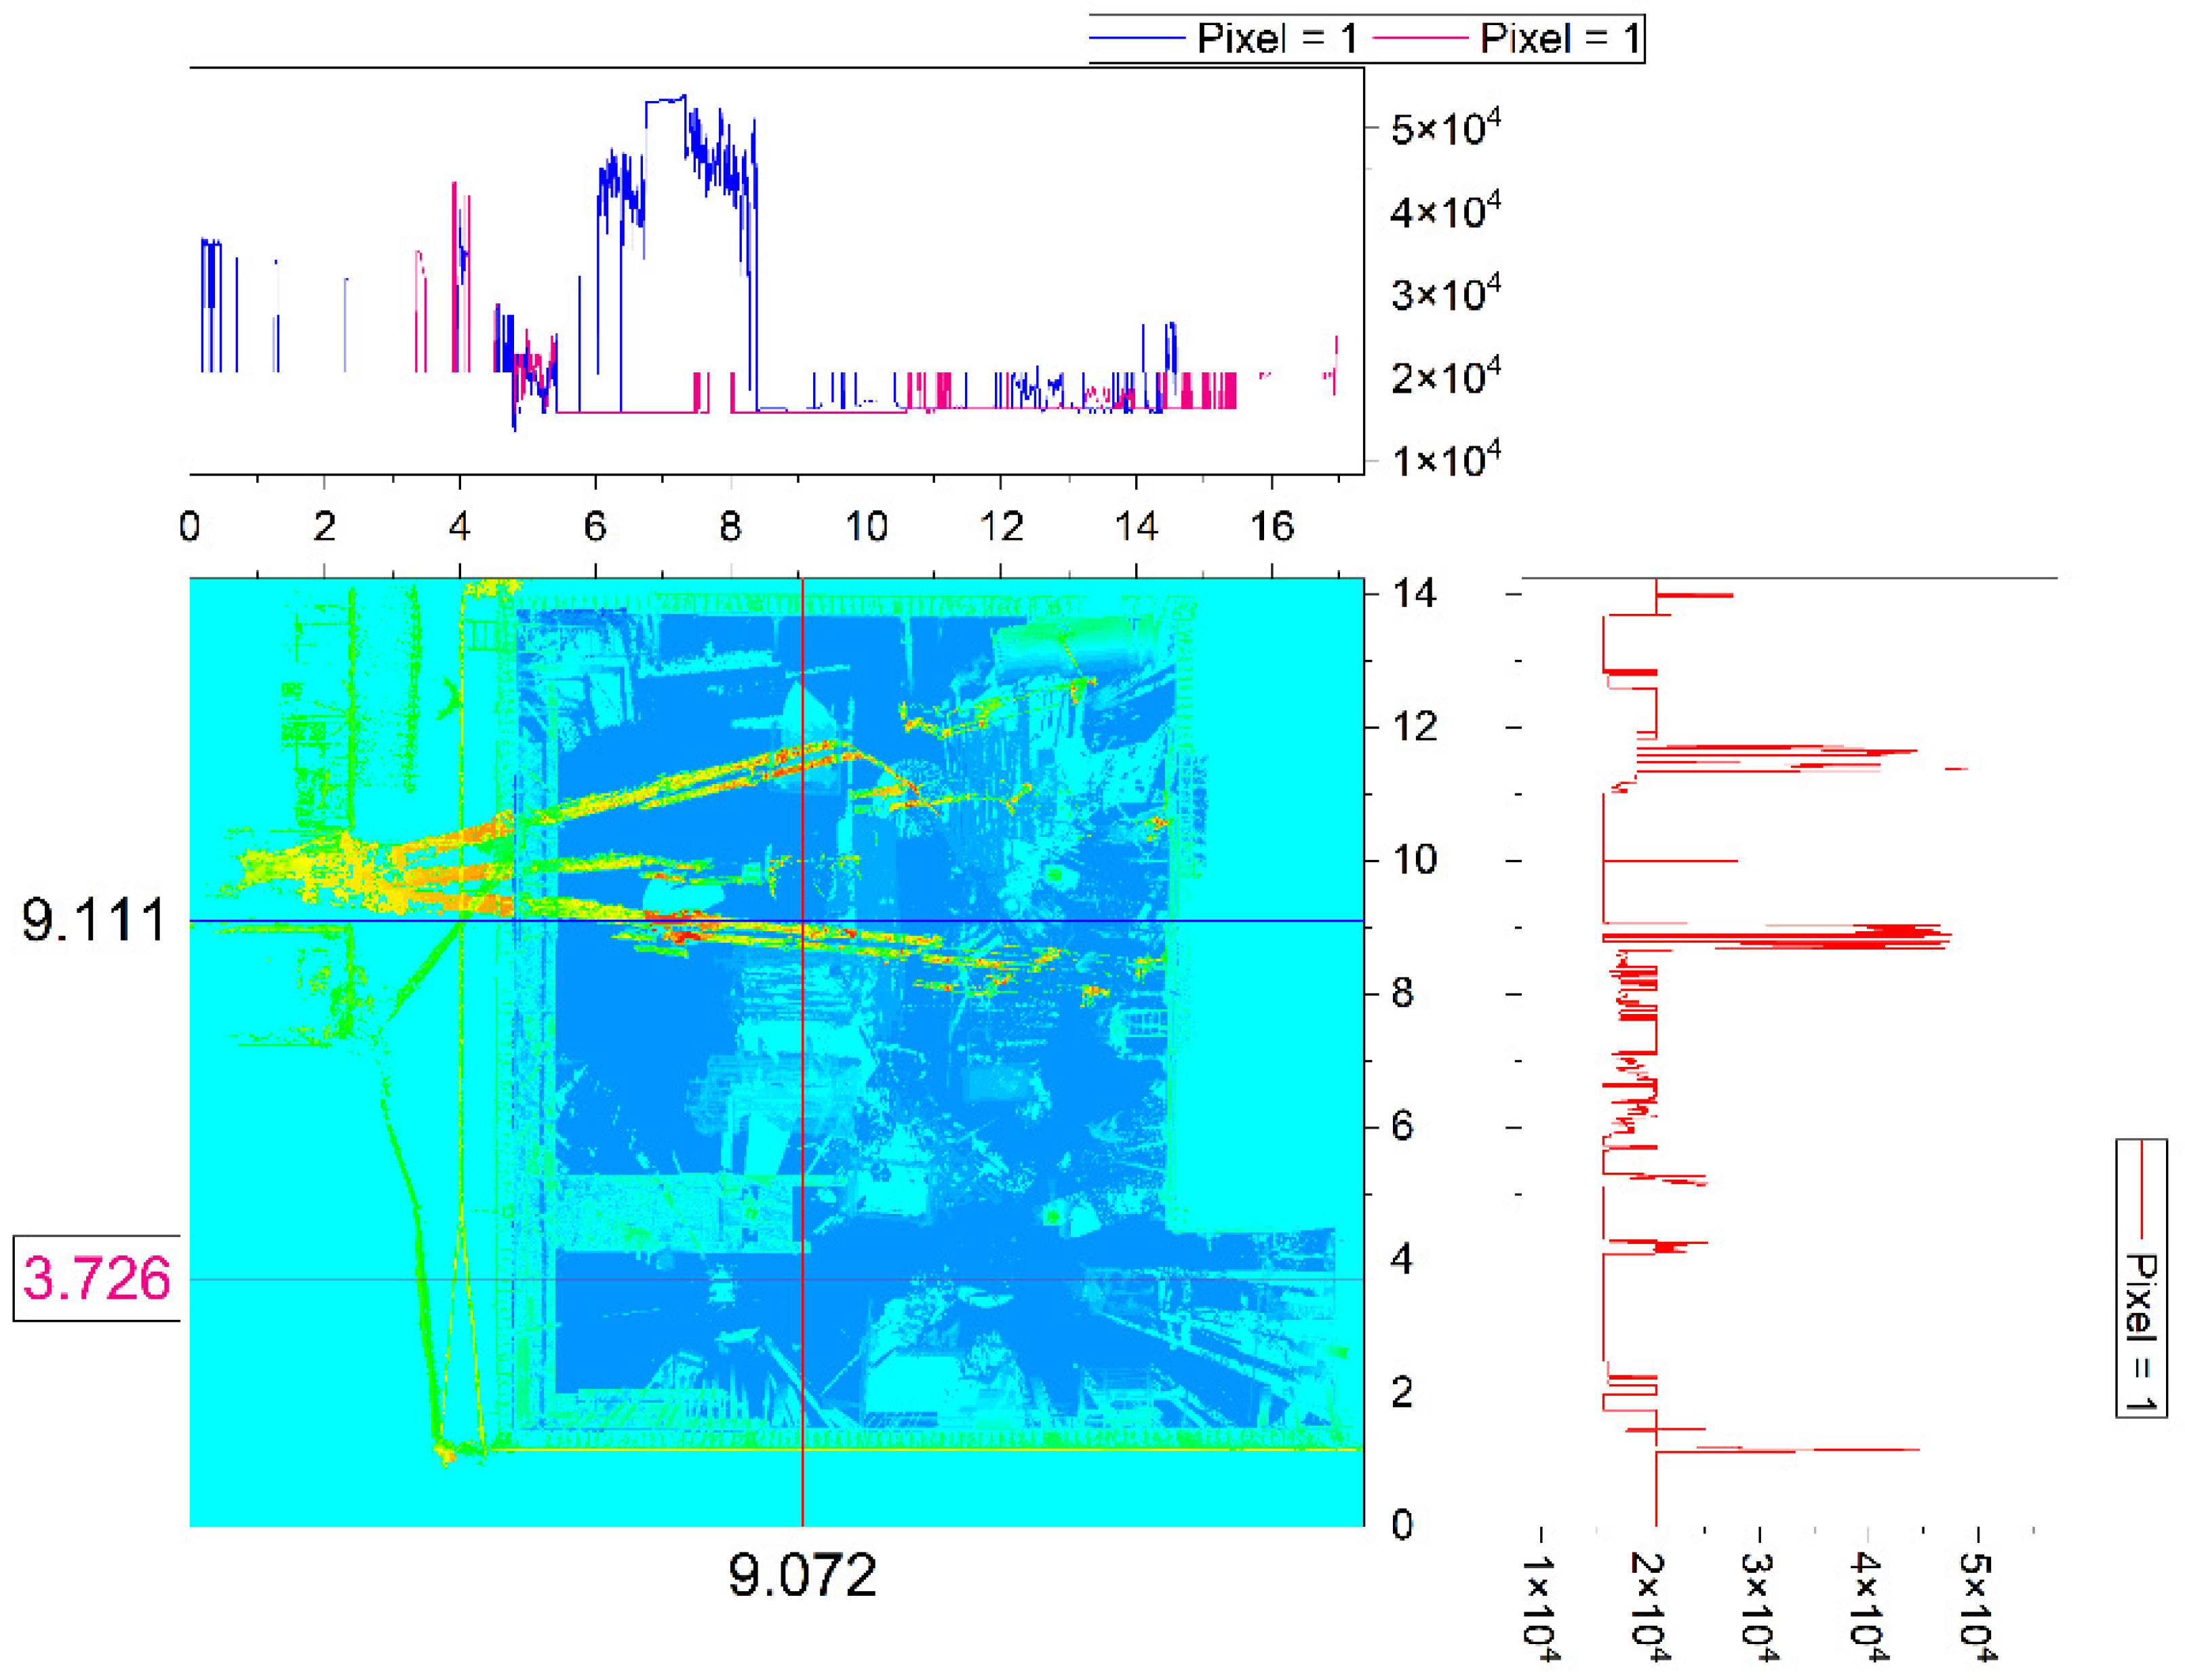
From the rasterization, a profile contour graph is obtained in
Figure 20, where it is possible to determine different profiles that generate the degree of security risk intervention in phase 4.
The elevation value of each of the DEM profiles defines the location of the static and dynamic elements of the model. This value of the morphometric parameter of the building and the scene to be represented characterizes the morphometry of the activities. In the raster image, it can be determined that the warm colors indicate height values of the work activities, and the cold colors point to range levels of basement plans.
Phase 4 is evaluated through the installation of the wall formwork, and for this, a mobile crane is used.
The digital model of elevation represents each of the movements of the crane, which allows the planning of activities related to the crane. In this analysis process, the profile of the contour graph, in blue, determines the height of the crane and its movements.
The analysis database in the proposed framework contains detailed information on the scenarios of activities that can generate risks in construction.
Accurate 3D models from LiDAR systems enable profile-associated simulation. This information can be integrated into BIM platforms through schematics and metadata units for a record while modeling the different construction phases is carried out.
Regarding the evaluation of the model with the cloud of points in the sector of slab and wall, the deviation maps here have the function of determining the errors between the “ideal” model generated through BIM platforms and the registration of the surfaces. finished. The maximum deviation is 0.041 m in the plane of the slab developed at (x, y) at its intersection with the vertical wall; this may be due to the flatness of the concrete slab floor. At the other end of the range of the color palette, the blue color represents the end of the vertical wall formwork at the intersection with the slab, which represents deviations of 0.024 m, probably due to displacement of the formwork system. Therefore, with respect to security measures, it would be possible to think that the lower areas and ends of the formwork system plates are subjected to tensions that can displace the origin of the systems by up to three centimeters, according to
Figure 17. Reverse engineering Through the deviation maps, field work photographs can be used, in addition to the execution plans, as a method of quality control analysis [
61] and to detect possible errors that serve to prevent safety risks in the construction of buildings.
4. Conclusions
Both the development of digital tools and the improvement of techniques that generate massive data sets contribute to the study of knowledge, the improvement of safety in construction, and the evaluation of the quality of construction elements. On the one hand, this can translate into minimizing risks in construction and improving the safety situation in the industry. The potential of 3D model reconstruction techniques, together with comparison algorithms that determine millimeter precision, establishes a mechanism for inspection and evaluation with nondestructive techniques. The evaluation process is complex in this field of research, but as on-site improvement processes are implemented in the works, all these studies represent an analysis mechanism of great scientific and professional interest, as they generate significant potential for the control of quality and safety in construction works. It should be noted that by identifying changes, mechanical deformations and stresses associated with production mechanisms can be quantified [
62].
This research opens a new framework for construction risk analysis based on both BIM modelling and massive data acquisition techniques. Answers the following challenges: (i) Quality analysis in the material execution of the activity and construction of formwork systems and their safety, (ii) From the study of the DEM, define the location of the static and dynamic elements of the model. This value of the morphometric parameter of the building and the scene to be represented characterizes the morphometrics of the work execution activities and (iii) The last contribution of this work is to evaluate the semantic information model of the BIM construction, in which the deformations between the ideal model and what was actually executed can be determined. This process could be part of the safety planning and execution feedback in the construction process.
It is concluded that the use of reverse engineering and BIM applied in the sense described in this study offers the intervening agents and especially the construction company a virtual-digital environment that undoubtedly improves the precision and possibilities of risk detection with respect to traditional methods. Furthermore, it is a clear novelty to use said digital models of the different moments of construction as precise databases for analysis for the purposes of prevention in future similar scenarios.
Within the limitations of the work, an important aspect is the use of personal laser scanning equipment, whose prices are increasingly competitive but are still not accessible for small construction companies. Furthermore, these procedures require operators with specialized training in geomatics. The algorithm used may also have difficulty distinguishing and accurately tracking cloud movements, especially in dynamic atmospheric environments. In this circumstance, the process becomes complicated since point cloud filtering algorithms must be used to eliminate residual values.
Therefore, it is an evident contribution to the industry that, even having at present the limitations related to the cost of the equipment, the installation time, and the assembly of the results, in the very near future they will undoubtedly be resolved.
In the future, it is intended to expand the research with more complex buildings, both in size and use. For example, the development in the construction of commercial buildings, where the planning and logistics parameters are more complex than the construction of residential homes. The geographical environment can also establish very different analysis parameters where the impact of time is key for the execution of the works.


