1. Introduction
In recent decades, the significant increase in energy needs, together with a growing awareness of the urgency of limiting emissions of greenhouse gases and pollutants, has promoted considerable interest in the development of technologies aimed at energy saving and the adoption of renewable energy sources. To this aim, a key role is played by energy storage capabilities, and, among the different technologies available, thermal energy storage (TES) stands out for its versatility and economic feasibility. In the framework of this technology, particular attention has been paid to systems based on latent heat storage (LHS), where the accumulation and release of heat happen within a limited temperature range, being mainly associated with the phase change in a particular material. The materials adopted in these systems are generally referred to as phase change materials (PCMs) and the main interest in their use is represented by the ability to store a higher energy content taking advantage of the latent heat of the PCMs, instead of using sensible heat, which is limited by the available temperature variation.
The widespread use of phase change materials also depends on the development of effective containment methods [
1]. The nature of the substances used as phase change materials requires the adoption of containment materials characterized by specific requirements such as [
2] mechanical resistance, flexibility, corrosion resistance, structural and thermal stability and easy management. The containment must act as a barrier between the PCM and the surrounding environment, preventing material leakage, ingress or escape of water, oxygen penetration and consequent oxidation; it should be able to adapt to the volume variations during the phase transitions; it should allow the generation of a sufficient surface area for heat exchange; and, of course, it should not introduce significant heat transfer resistance [
3]. Radouane [
4] describes the most relevant encapsulation methods and technologies. Among those methods, macroencapsulation is beneficial from different points of view such as easy processing, good heat transfer, high safety, and possibility of large-scale application [
5,
6].
In macroencapsulation, significant quantities of material are enclosed in discrete units (capsules), from a few grams to a kilogram, with a particle size above 1000 μm [
7,
8] of different geometry: spheres, cylindrical tubes, annuluses, rectangular plates, and pouches [
9]. Studies have been performed to analyze the influence of the geometry of the encapsulation on the speed of the discharge process [
10,
11,
12,
13,
14]: in the discharge phase, cold water enters the heat exchange tank and flows over the encapsulated phase change material, which is cooled and solidified: the duration of solidification represents the time in which latent heat is released into the water.
Wei et al. [
10] carried out both numerical and experimental investigations of a storage system in which an encapsulated paraffin wax was used as the PCM. The effects of the capsule geometry on the discharge speed were analyzed using a one-dimensional conductive model. Specifically, four different geometries were studied: sphere, cylinder, plate and tube. The diameters of the studied capsules ranged from 2 to 5 mm and given their small size, it was possible to neglect internal natural convection. The results obtained showed that spherical capsules have the best performance among the four types of capsules studied, while tubular capsules with a low degree of vacuum are not ideal for rapid releases of energy stored in the PCM. Heat release performance progressively decreased in the order spheres, cylinders, plates and tubes.
Barba and Spiga [
11] studied the behavior of encapsulated hydrated salts, used as latent energy storage media in a hot water storage tank. The salt was a mixture of hydrated ammonium and magnesium nitrates with a low melting temperature (52.5 °C). The PCM cooling process was analytically analyzed under three different geometrical configurations: plate, cylinder, and sphere. The PCM was encapsulated in polyethylene containers and the dimensions for the plate thickness and for the diameters of the sphere and cylinder were equal to 2 cm. The model evaluated the speed of advancement of the solidification front: the shortest time for complete solidification was achieved with spherical capsules with high Jacob numbers and high thermal conductivity.
In the above-mentioned studies, it was demonstrated that spherical capsules allow the best performance during the discharge process, and, as a matter of fact, this geometry finds major application in packed-bed TES configurations [
9] and numerous works have been presented in the scientific literature about the melting and/or solidification of phase change materials inside a spherical container [
13,
15,
16,
17,
18,
19,
20,
21,
22,
23,
24]. Moore and Bayazitoglu [
15] were the first to report experimental and numerical studies related to “unconstrained” melting in a sphere (i.e., the solid portion falls and passes through the molten portion due to its higher density). It has been found that convective currents deriving from the fall of the solid mass cannot be neglected within the molten mass.
Nazzi Ehms et al. [
13] investigated by numerical simulations the solidification process of erythritol in spheres with different diameters (from 10 to 40 mm) and different wall temperatures (from 10 to 40 K below the phase change temperature of the considered material). The initial fill volume of the studied capsules was 98.5% and the remaining volume was assumed to contain air.
The charging and discharging processes, which consist of the melting and solidification of the PCM, represent a major concern for several LHS systems, because heat transmission depends on PCMs’ thermal conductivity, which, in some applications and for most of the conventional materials, is lower than needed [
25]. This is also true in macroencapsulation, in particular during energy release: the liquid solidifies in the correspondence of the exchange surface, thus creating a motionless layer of solid material with low thermal conductivity.
Several studies were conducted focusing on the development of analytical models describing packed-bed systems with sphere-encapsulated PCMs and their optimization [
5,
26,
27,
28,
29,
30]. Amin et al. [
21] developed a CFD model of a heat transfer fluid flowing past a single sphere containing PCM (neglecting buoyancy forces within the PCM). After experimental validation at various temperatures, this study established an empirical correlation that can be used to determine the effective thermal conductivity within a sphere during melting. This parameter can be applied for the representation of the average natural convection over the melting process and to refine its representation in different numerical models.
In further studies, Aziz et al. [
22,
23] studied the phase change time of PCM encapsulated in a sphere with pins and copper plating adopted to increase the performance of the heat transfer. The numerical model, validated against physical tests, demonstrated the improvement in heat transfer inside the PCM sphere, confirming the validity of this design option.
Dai et al. [
24] numerically explored the solidification process of a phase change material in a sphere, where high thermal conductivity was obtained by the addition of expanded graphite. The simulations also took into account the volume change in paraffin during phase change and the distribution of cavities formed due to the manufacturing process. The authors concluded that the volume change in paraffin has a great impact on the heat transfer process during the later stages of solidification, and that the addition of a certain quantity of expanded graphite in the capsule can effectively improve heat transfer characteristics.
In the present study, an experimental and computational analysis of a sphere containing a phase change material located in a buffer water tank during both charge (melting) and discharge (solidification) phases was carried out. A CFD model has been validated against experimental measurements and then applied to determine the influence of the theoretical insertion of a high-thermal-conductivity material inside the PCM and of the envelope material, on the heat transfer efficiency and time.
2. Materials and Methods
The objective of the experimental tests was to analyze the melting (TES charging), and the solidification (TES discharging) of a phase change material contained inside a spherical capsule and immersed in a water bath at a controlled temperature.
Melting was studied setting the spherical capsule at an initial temperature (Ti) lower than the melting temperature (Tm) of the PCM. At a given time, the surface of the capsule is brought to a constant temperature T0 > Tm. by immersing it in the water bath. Heat passes through the container wall by conduction, leading to the gradual melting of the material.
Conversely, solidification tests are carried out considering spherical capsules at a temperature Ti higher than the melting temperature (Tm), and at a time t = 0, the surface of the capsule is brought to a constant temperature T0 such that T0 < Tm and the phase change material gradually begins to solidify.
2.1. Material Used
The A46 paraffin wax (melting temperature of 46 °C) was selected as the phase change material because of its safety, reliability and cost characteristics. The main physical properties of the material, provided by the manufacturer, are shown in
Table 1.
The measurement of the thermal conductivity of the PCM was carried out with a “Transient Plane Source” instrument, model “C-Therm TCi Thermal Conductivity Analyzer” by C-THERM Technologies (Federicton, NC, Canada), described in [
31]. The results obtained during these experimental tests also showed that the paraffin actually does not have a single melting point, rather solid–liquid transition occurs over approximately 6 °C (43–49 °C).
Furthermore, given the relevance of the convective motions in the case studied, the viscosity in the liquid state was also measured using a rotational viscometer by HAAKE (Vreden, Germany), model RV12: a value of 22.7 mPa s was obtained.
2.2. Experimental Set Up
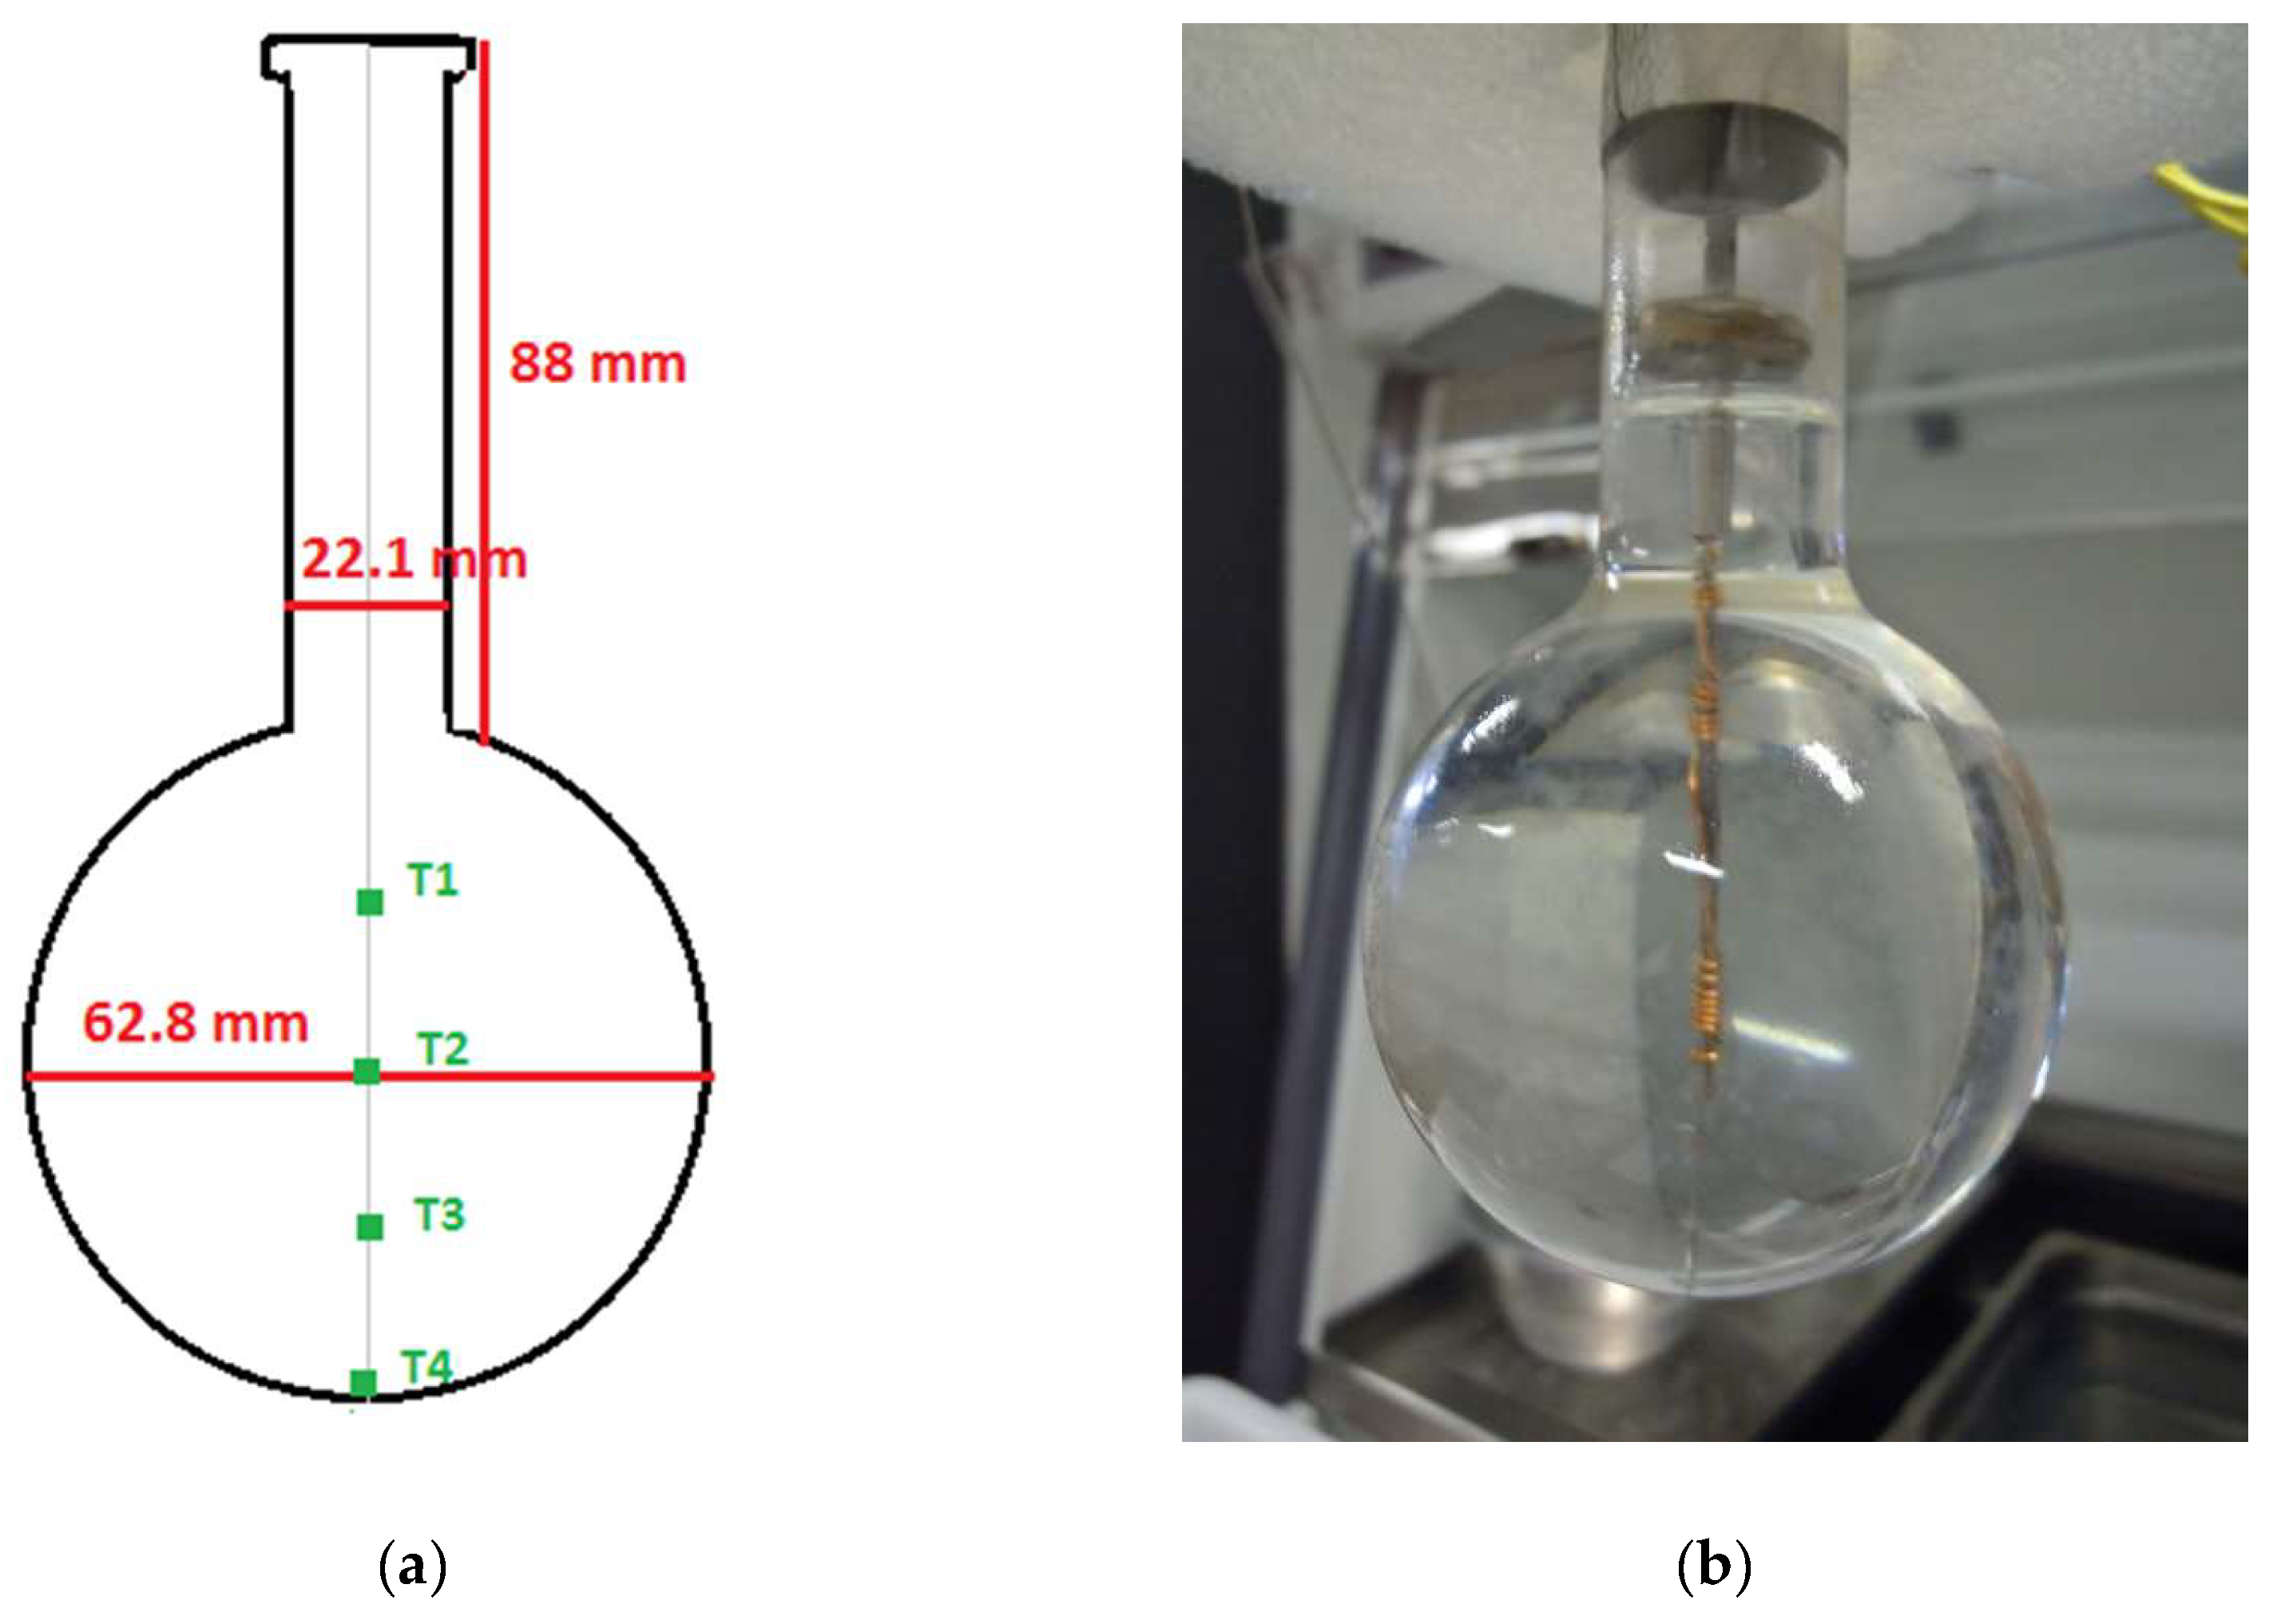
A Pyrex glass “round-bottom” flask was used as a spherical containment capsule. The flask had an external diameter of 62.8 mm and a wall thickness of 1.5 mm. Four thermocouples were arranged inside the flask, spaced 1.5 cm apart from each other, and starting from the bottom of the container, as shown in
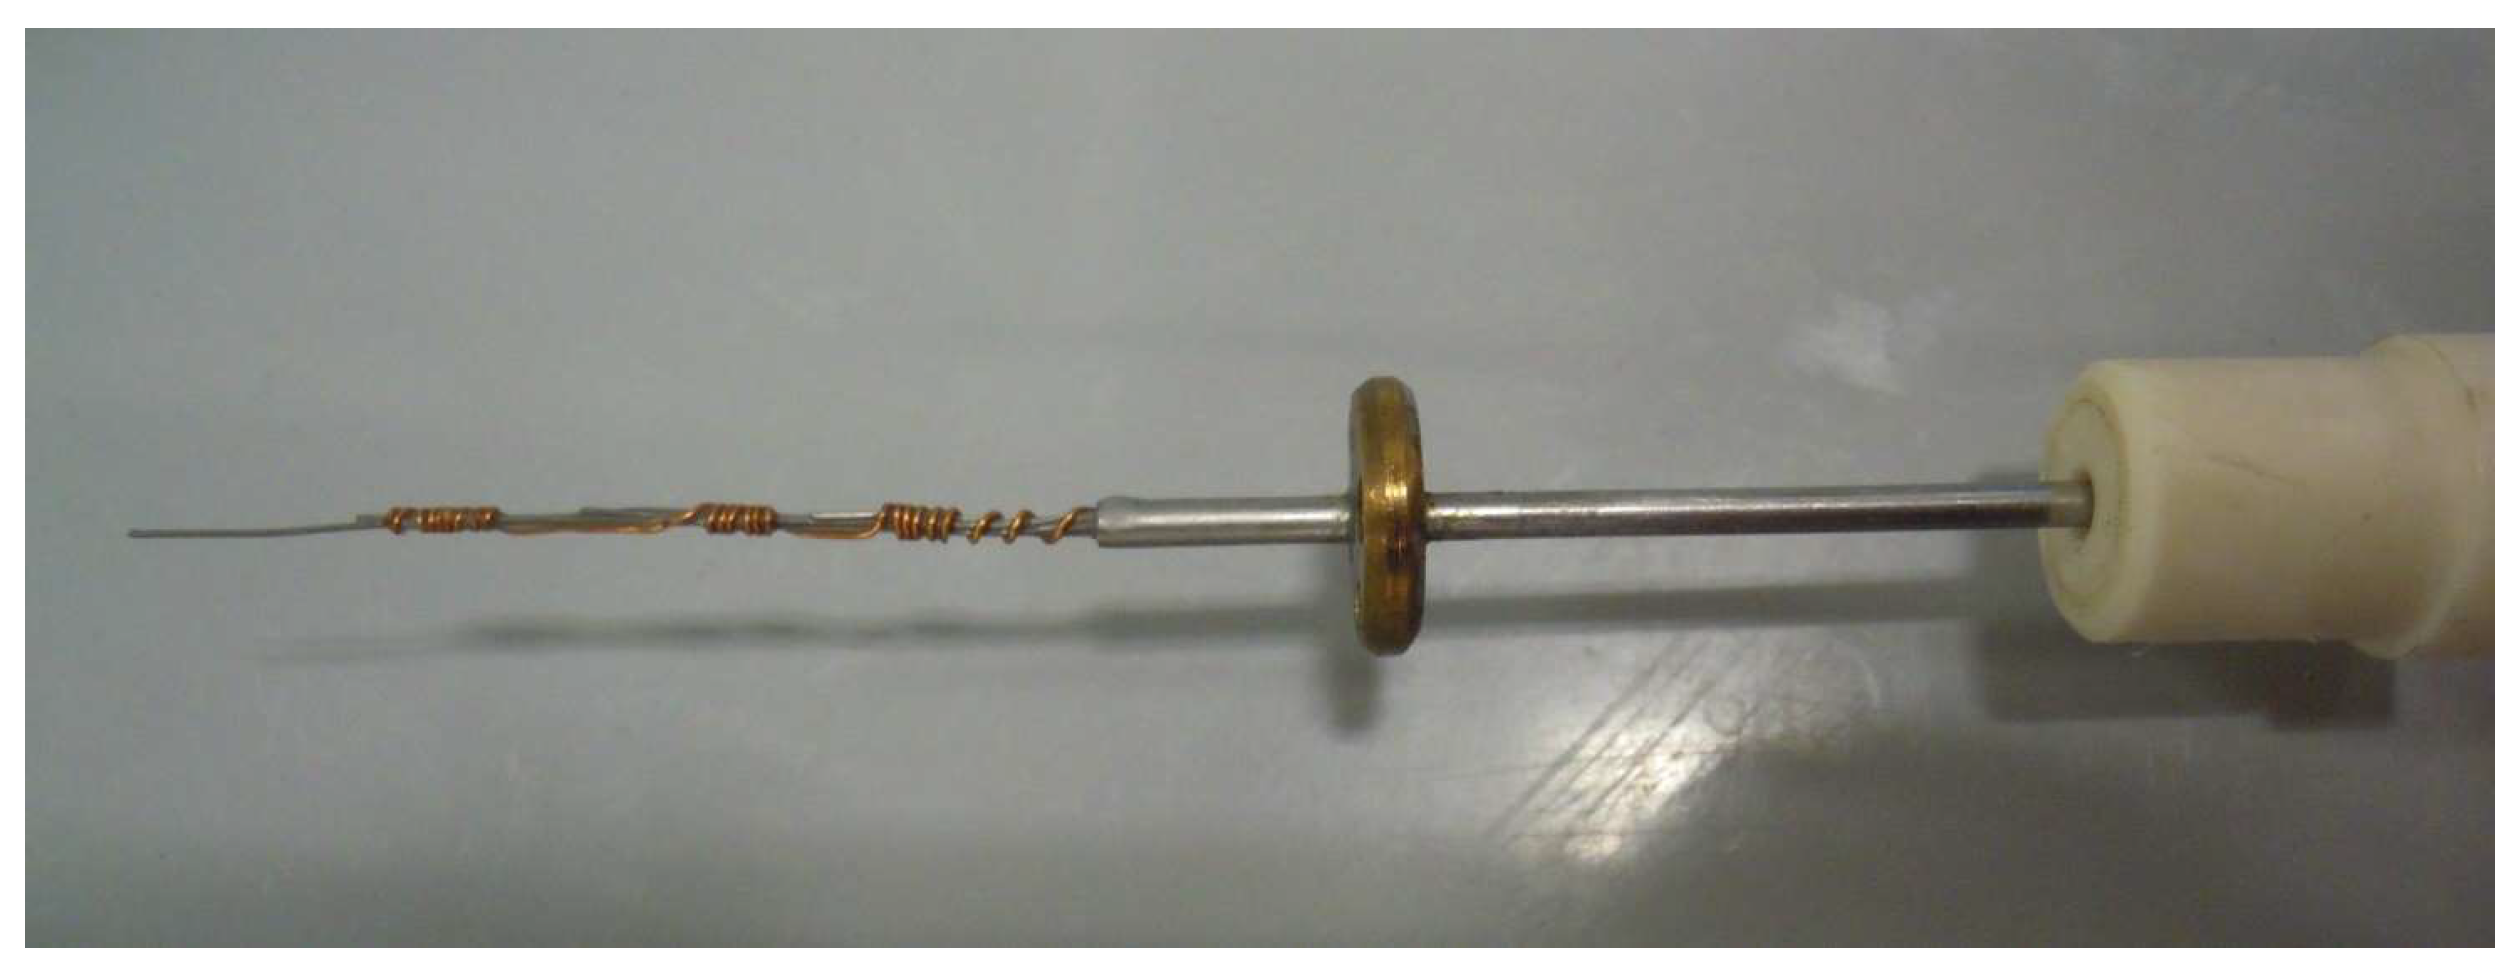
Figure 1. The thermocouples were held in position using a solid support (a metal tube) welded to a washer (arranged along the neck of the flask) which prevented the thermocouples from moving when the paraffin melted (see
Figure 2). A fifth thermocouple is used to monitor and record the temperature of the water in which the balloon was immersed.
The spherical capsule was initially filled with melted paraffin, the thermocouples were then inserted (see
Figure 1) and the PCM was finally allowed to solidify at room temperature.
The melting tests were conducted by immersing the spherical capsule, initially at room temperature, in a thermostatic water bath whose initial temperature was set at different values, higher than the melting temperature of the paraffin, up to a maximum of 71 °C, namely: 56 °C, 61 °C, 66 °C and 71 °C. The thermostatic tank was provided with an internal agitation system so that the wall temperature of the sphere could be considered constant during the tests.
The solidification tests were carried out by immersing the sphere with the melted paraffin at different initial temperatures, namely 56 °C, 61 °C, 66 °C and 71 °C, in the water bath at room temperature (approximately 22.5 °C).
Data acquisition was carried out using a National Instruments (Austin, TX, USA) Compact DAQ system with a thermocouple module (24bit ADC, 16 channels), controlled by a program developed in Labview® 2018, software by National Instruments (Austin, TX, USA) to obtain real-time readings of the temperature values and recording of transients.
3. Computational Method
A two-dimensional model of the sphere containing phase change material was set up using ANSYS FLUENT, version 16.0, by ANSYS (Canonsburg, PA, USA). A VOF model was used for simulating the solidification and melting.
The following simplifying assumptions were made for the model development:
Both the liquid phase and the solid phase are isotropic and homogeneous, so that constant properties can be assumed;
Phase change material melting is considered axisymmetric;
The two phases at the solid–liquid interface are in thermal equilibrium;
The wall temperature of the sphere is considered constant;
The Boussinesq approximation is adopted to simulate the convective motions inside the sphere: this consists in assuming constant density in all terms of the equations that govern natural convection, with the exception of the buoyancy term:
where ρ
0 is the PCM density, T
0 is the operating temperature and β is the thermal expansion coefficient. This approximation is accurate for small changes in density; in particular, the Boussinesq approximation is valid when β(T–T
0) ≪ 1.
With reference to the latter point, assuming a value of 0.001 K
−1 for the coefficient of thermal expansion of the A46 paraffin [
32], and since the maximum temperature difference reached during the tests was 49 K, the Boussinesq approximation was appropriate for the model.
Based on the previous assumptions, the model equations in spherical coordinates are [
33,
34]:
Polar direction momentum:
Radial direction momentum:
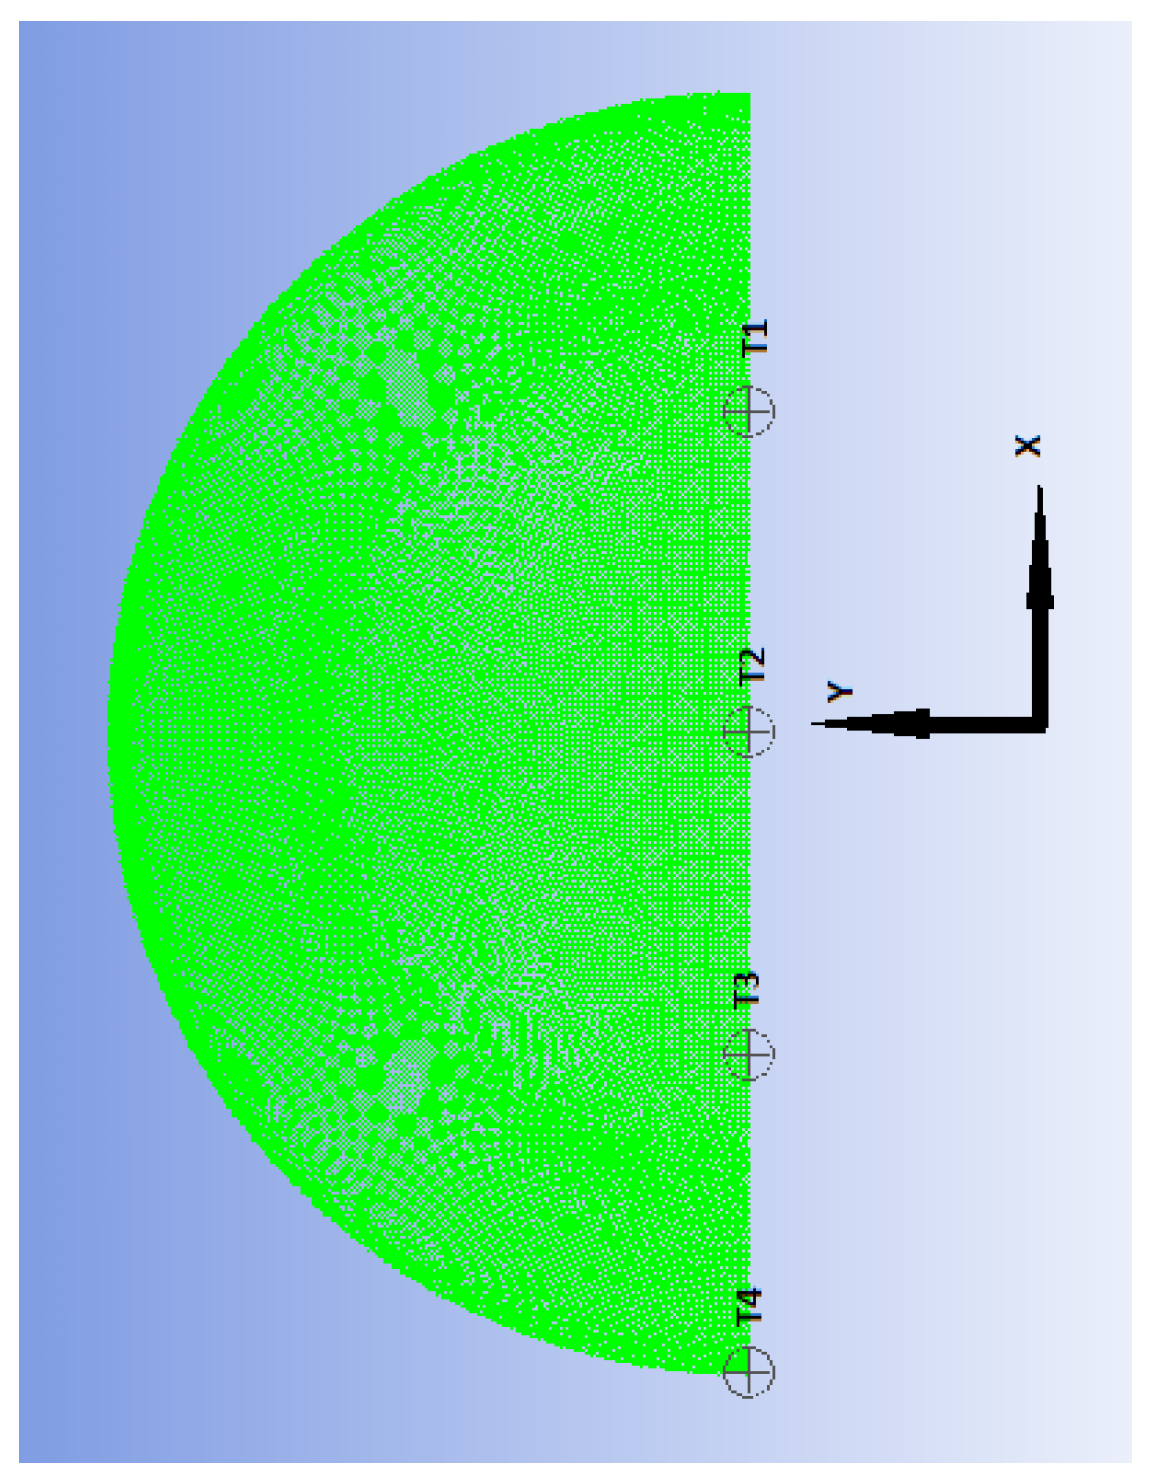
After a mesh independency check, a hybrid unstructured mesh with 35,320 elements and 34,997 nodes was used: the grid had a greater resolution for the cells near the wall where the maximum heat flow occurs. A gravitational acceleration of 9.81 m/s
2 is set in the negative direction of the x-axis: therefore, the denser mass tends to precipitate in this direction. Four points were monitored in the simulation (
Figure 3), which correspond to the position of the 4 thermocouples arranged inside the rounded-bottom flask (
Figure 1).
4. Result and Discussion
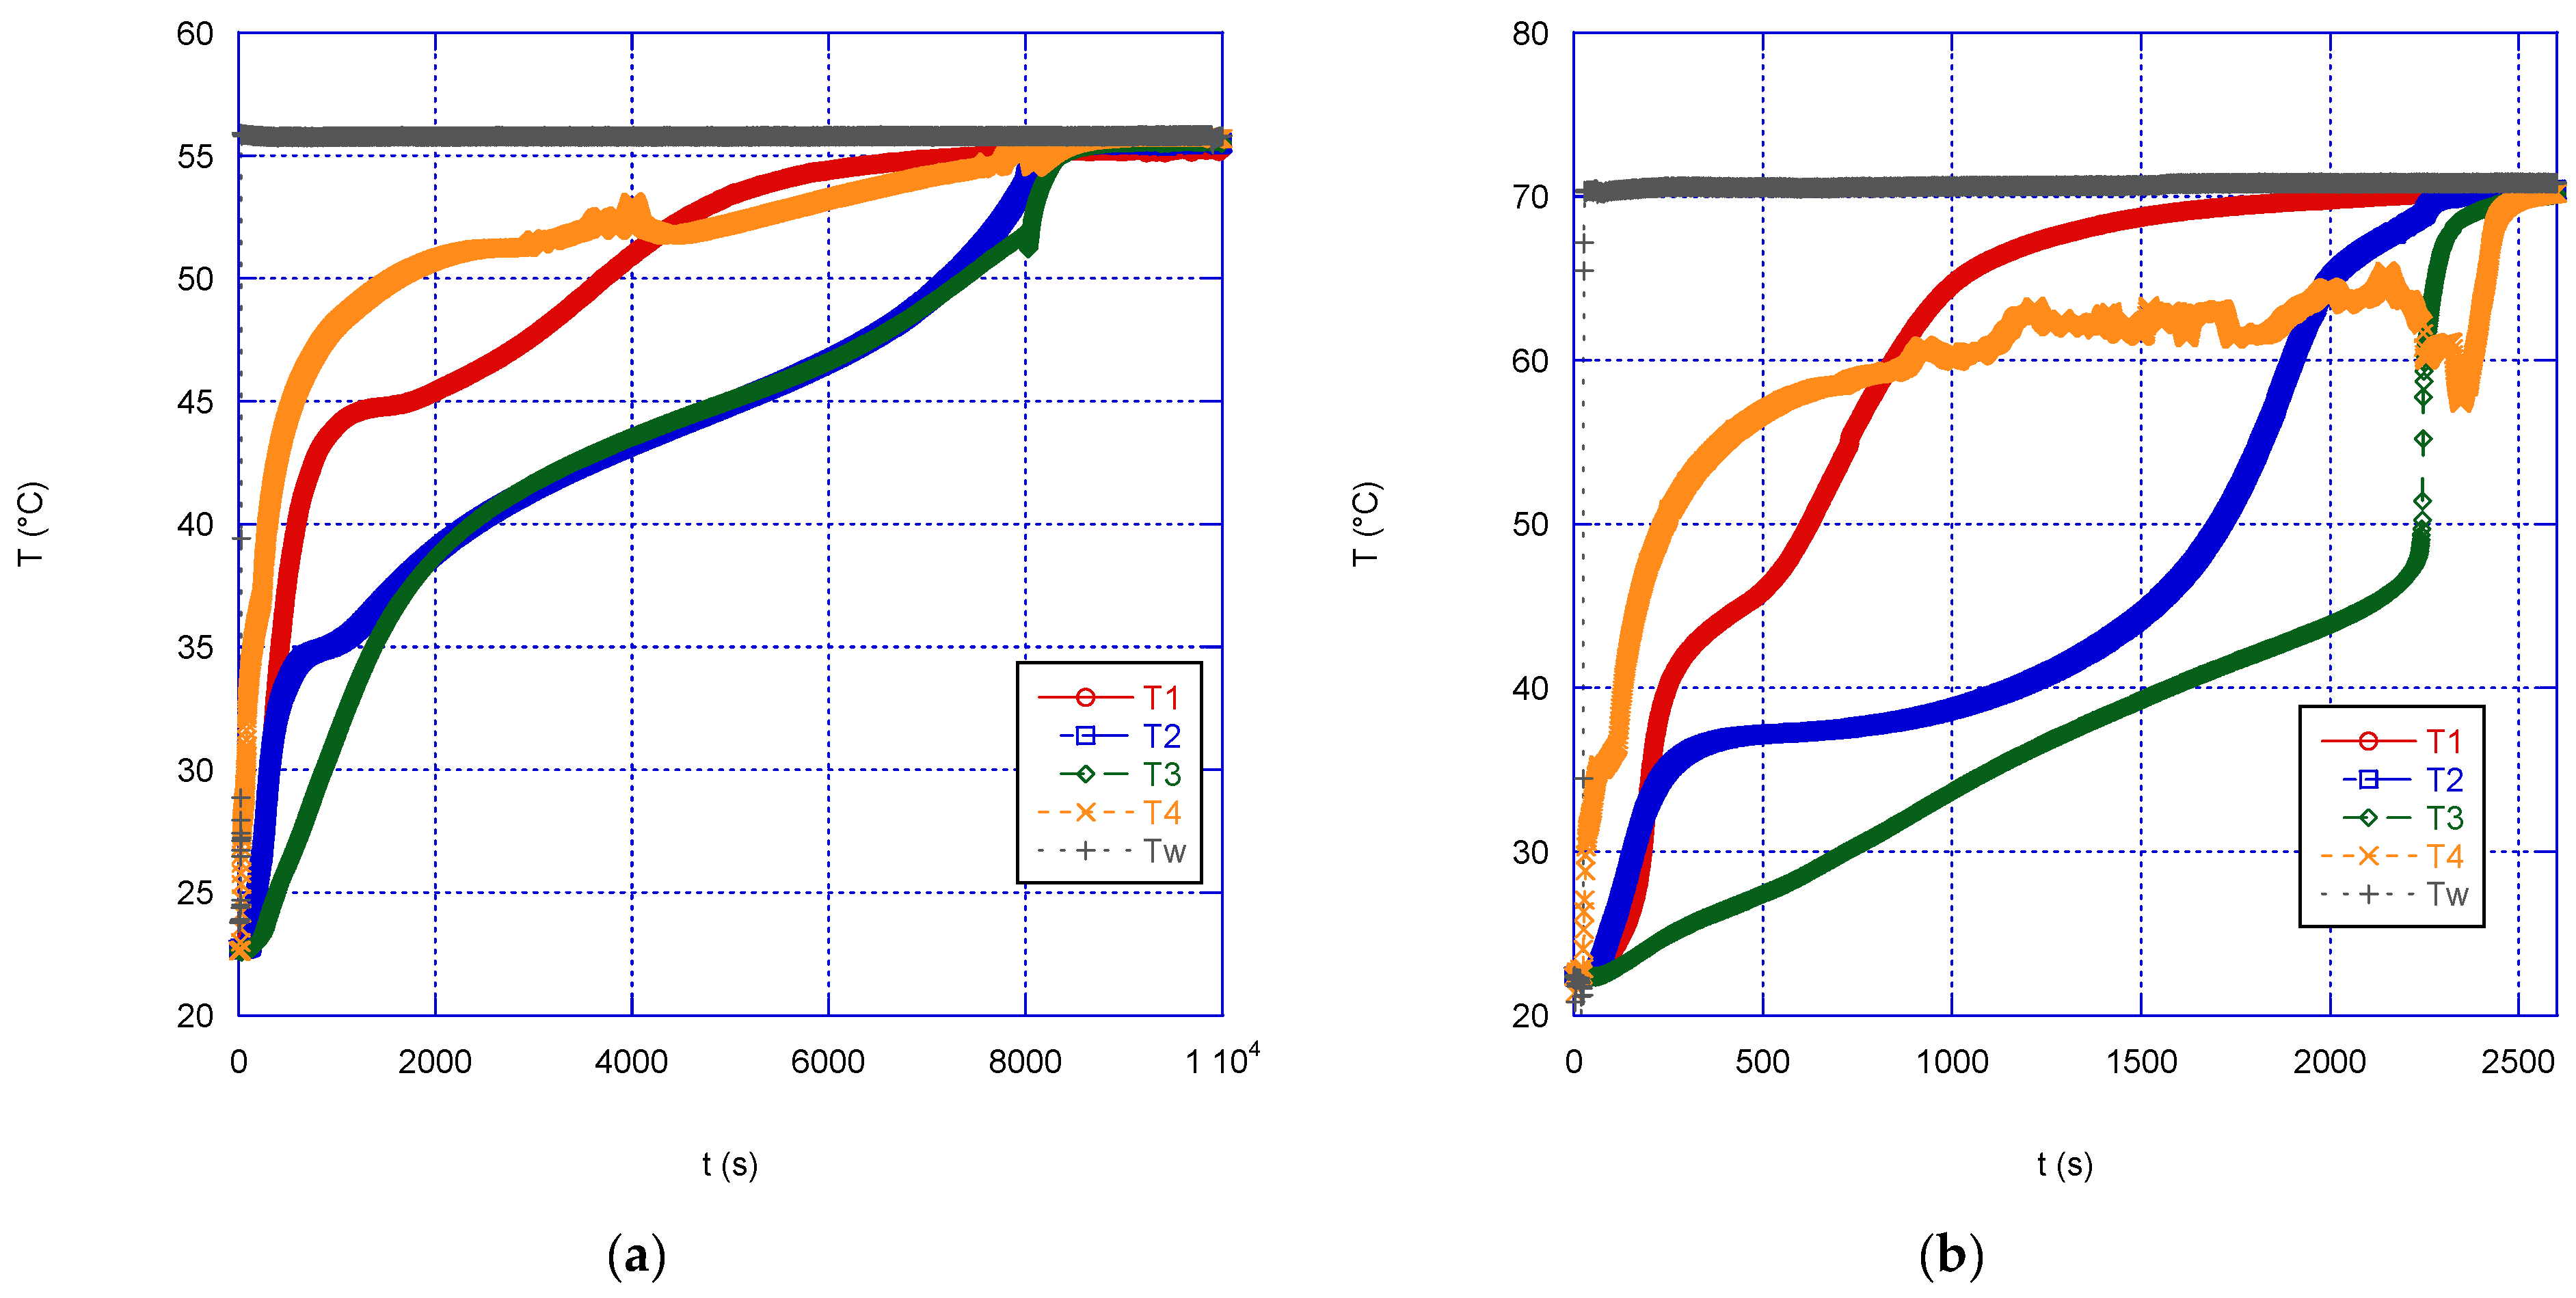
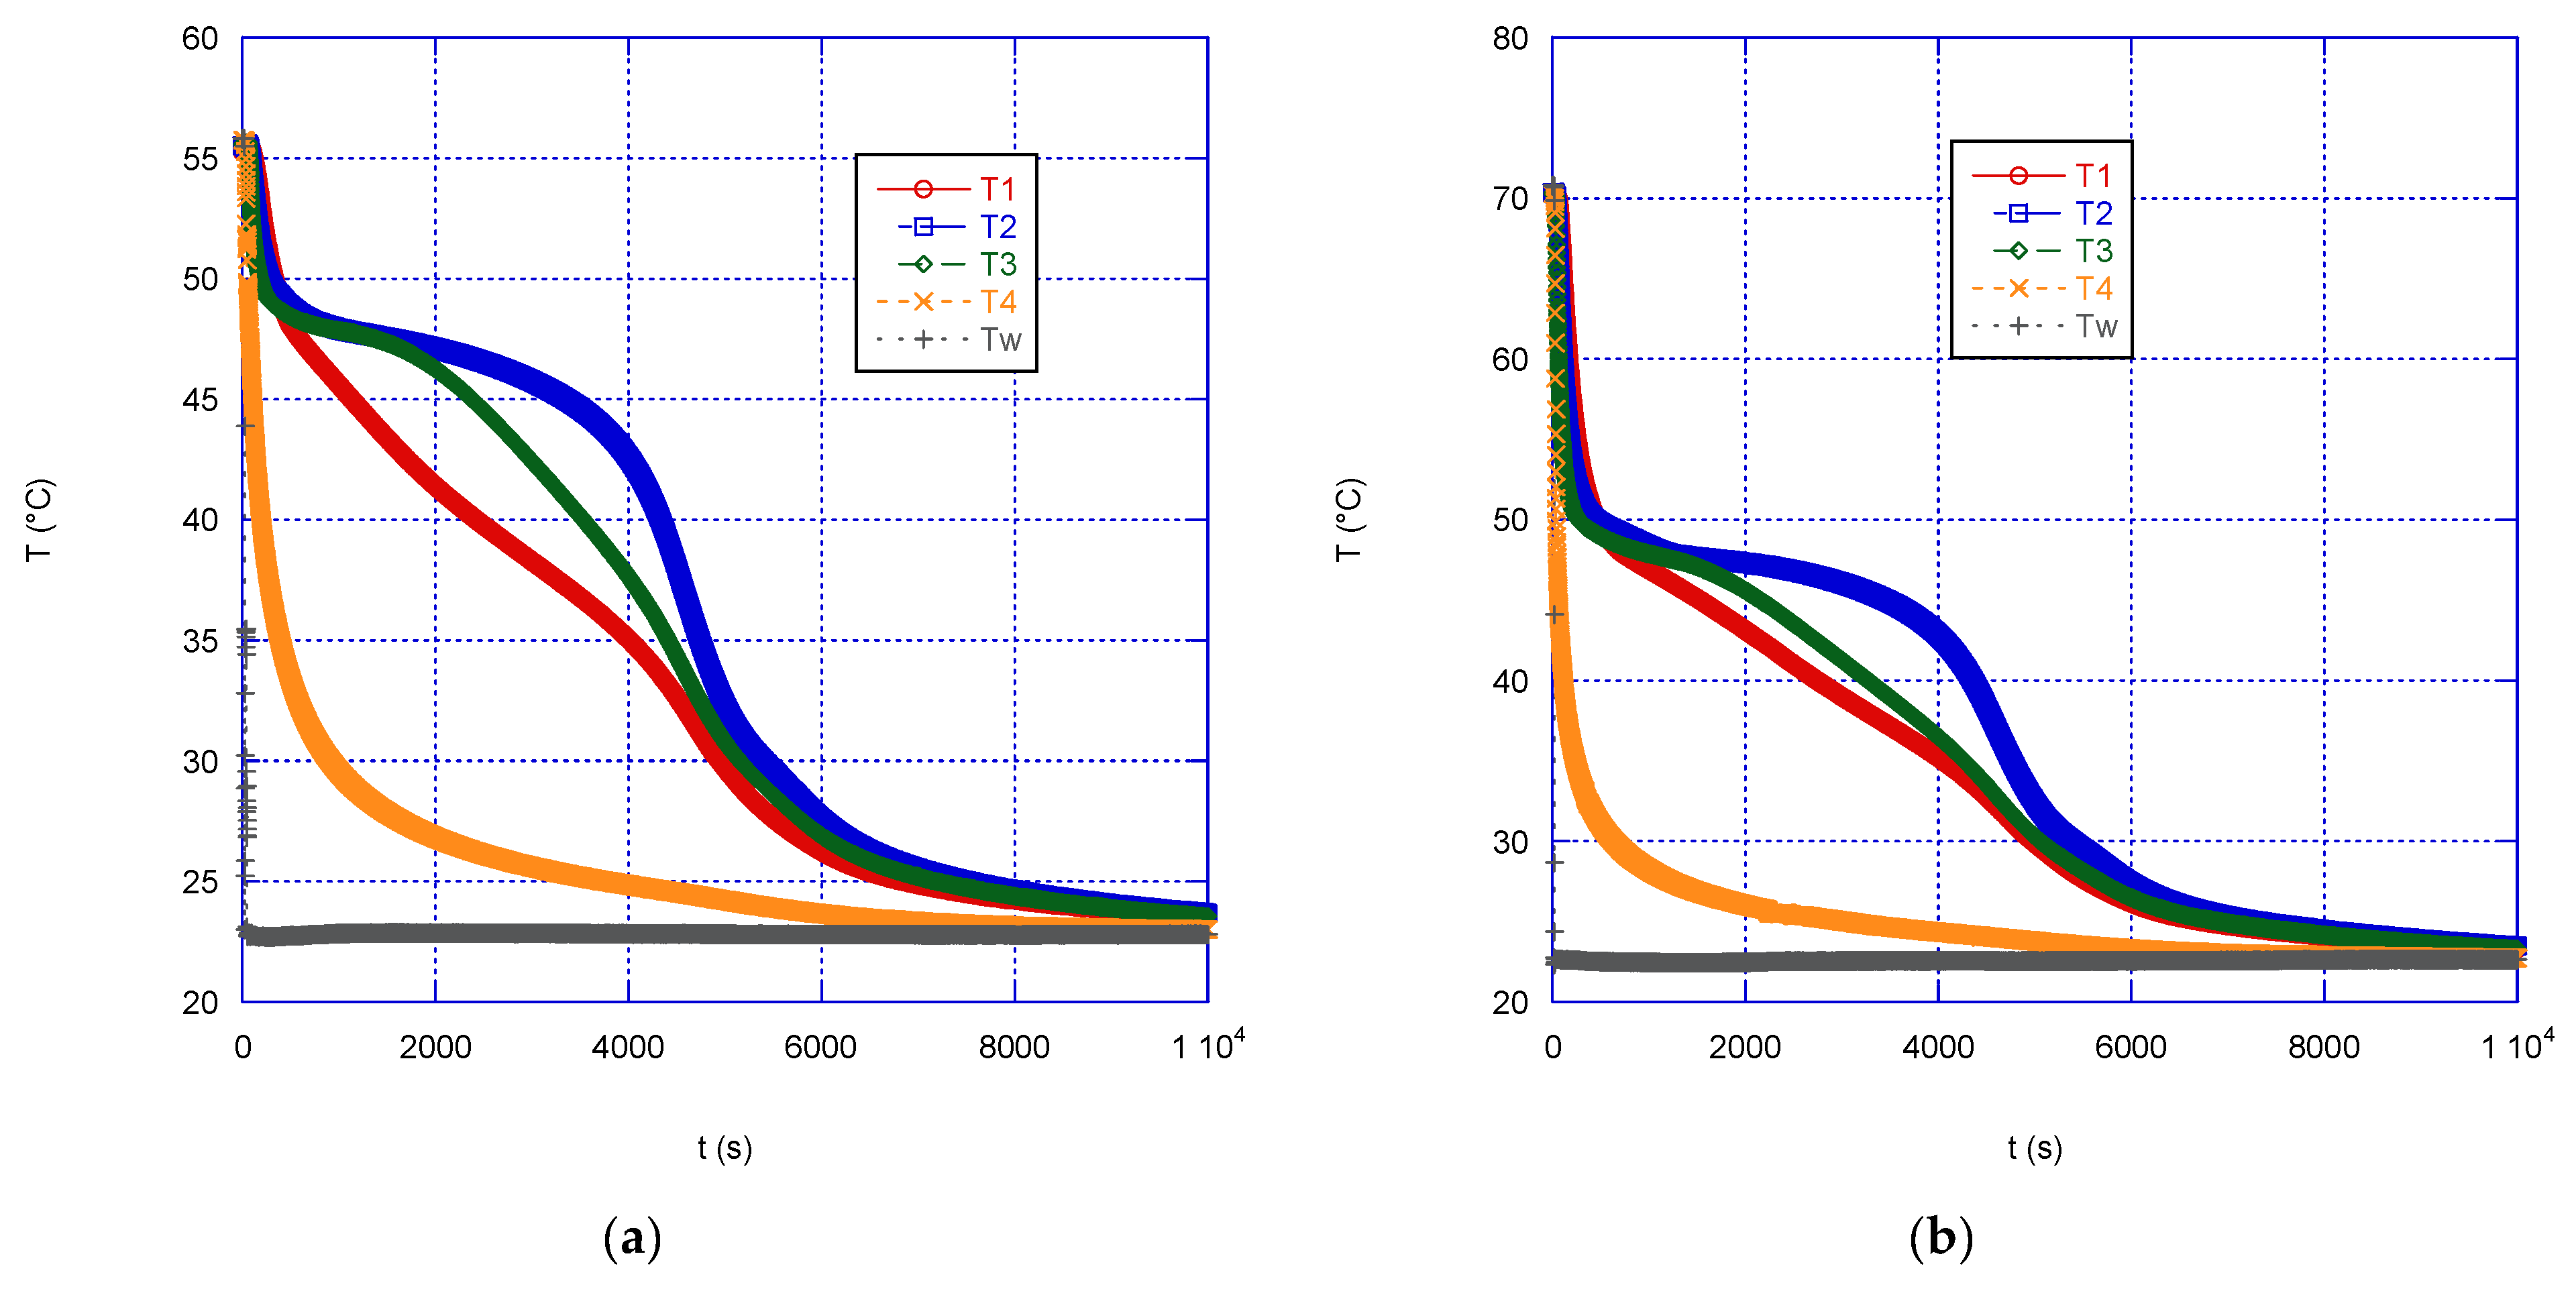
The graphs below show the experimental results obtained during the melting (
Figure 4) and solidification (
Figure 5) of the PCM in the spherical capsule. Each graph shows the temperatures of the four thermocouples inside the flask and of the thermocouple used to monitor the water bath temperature (T
w). According to the findings that a specific single melting temperature was not found for the PCM, there is no plateau in the temperature profile, but a more or less continuous trend (either increasing or decreasing) is observed. As might be expected, the curves corresponding to the inner thermocouples (T2 and T3) always show a delayed response with respect to those closer to the external surface in contact with the tank water.
During melting, as the temperature of the bath increases, the time required to reach thermal equilibrium is significantly reduced. Thermal equilibrium occurs when the temperature of the whole paraffin sphere equals the wall temperature (that is the temperature of the water in the thermostatic bath) and therefore the PCM is no longer able to absorb energy. By increasing the wall temperature from 56 to 71 °C, the time to complete the charge (i.e., to reach thermal equilibrium) decreases by approximately 70% (more than 1.5 h). In addition to the observation about the inner temperature profiles mentioned above, in the case of the melting phase, as far as the extreme temperatures are concerned, it can be seen that, after some time, the temperature at T1 becomes higher than at T4, probably due to the convective motions inside the increasing liquid mass within the sphere.
During solidification (
Figure 5), the measured temperatures initially drops almost simultaneously inside the paraffin mass, until a temperature of approximately 49 °C is reached, which is the temperature at which the transition to the solid state of the material begins. Subsequently, the temperature in the correspondence of the heat exchange surface decreases more quickly, due to the formation of a solid layer close to the wall, which slows down heat exchange with the external volume, due to its low thermal conductivity. The formation of this “insulating” layer, which thus becomes the controlling step of the heat exchange process, is probably the cause of another interesting result occurring during the discharge phase: regardless of the initial temperature, the time necessary to reach thermal equilibrium is almost the same, in the present case approximately 2.8 h. It can, therefore, be deduced that the discharge speed of a TES does not depend on the initial temperature of the liquid PCM.
4.1. Model Validation
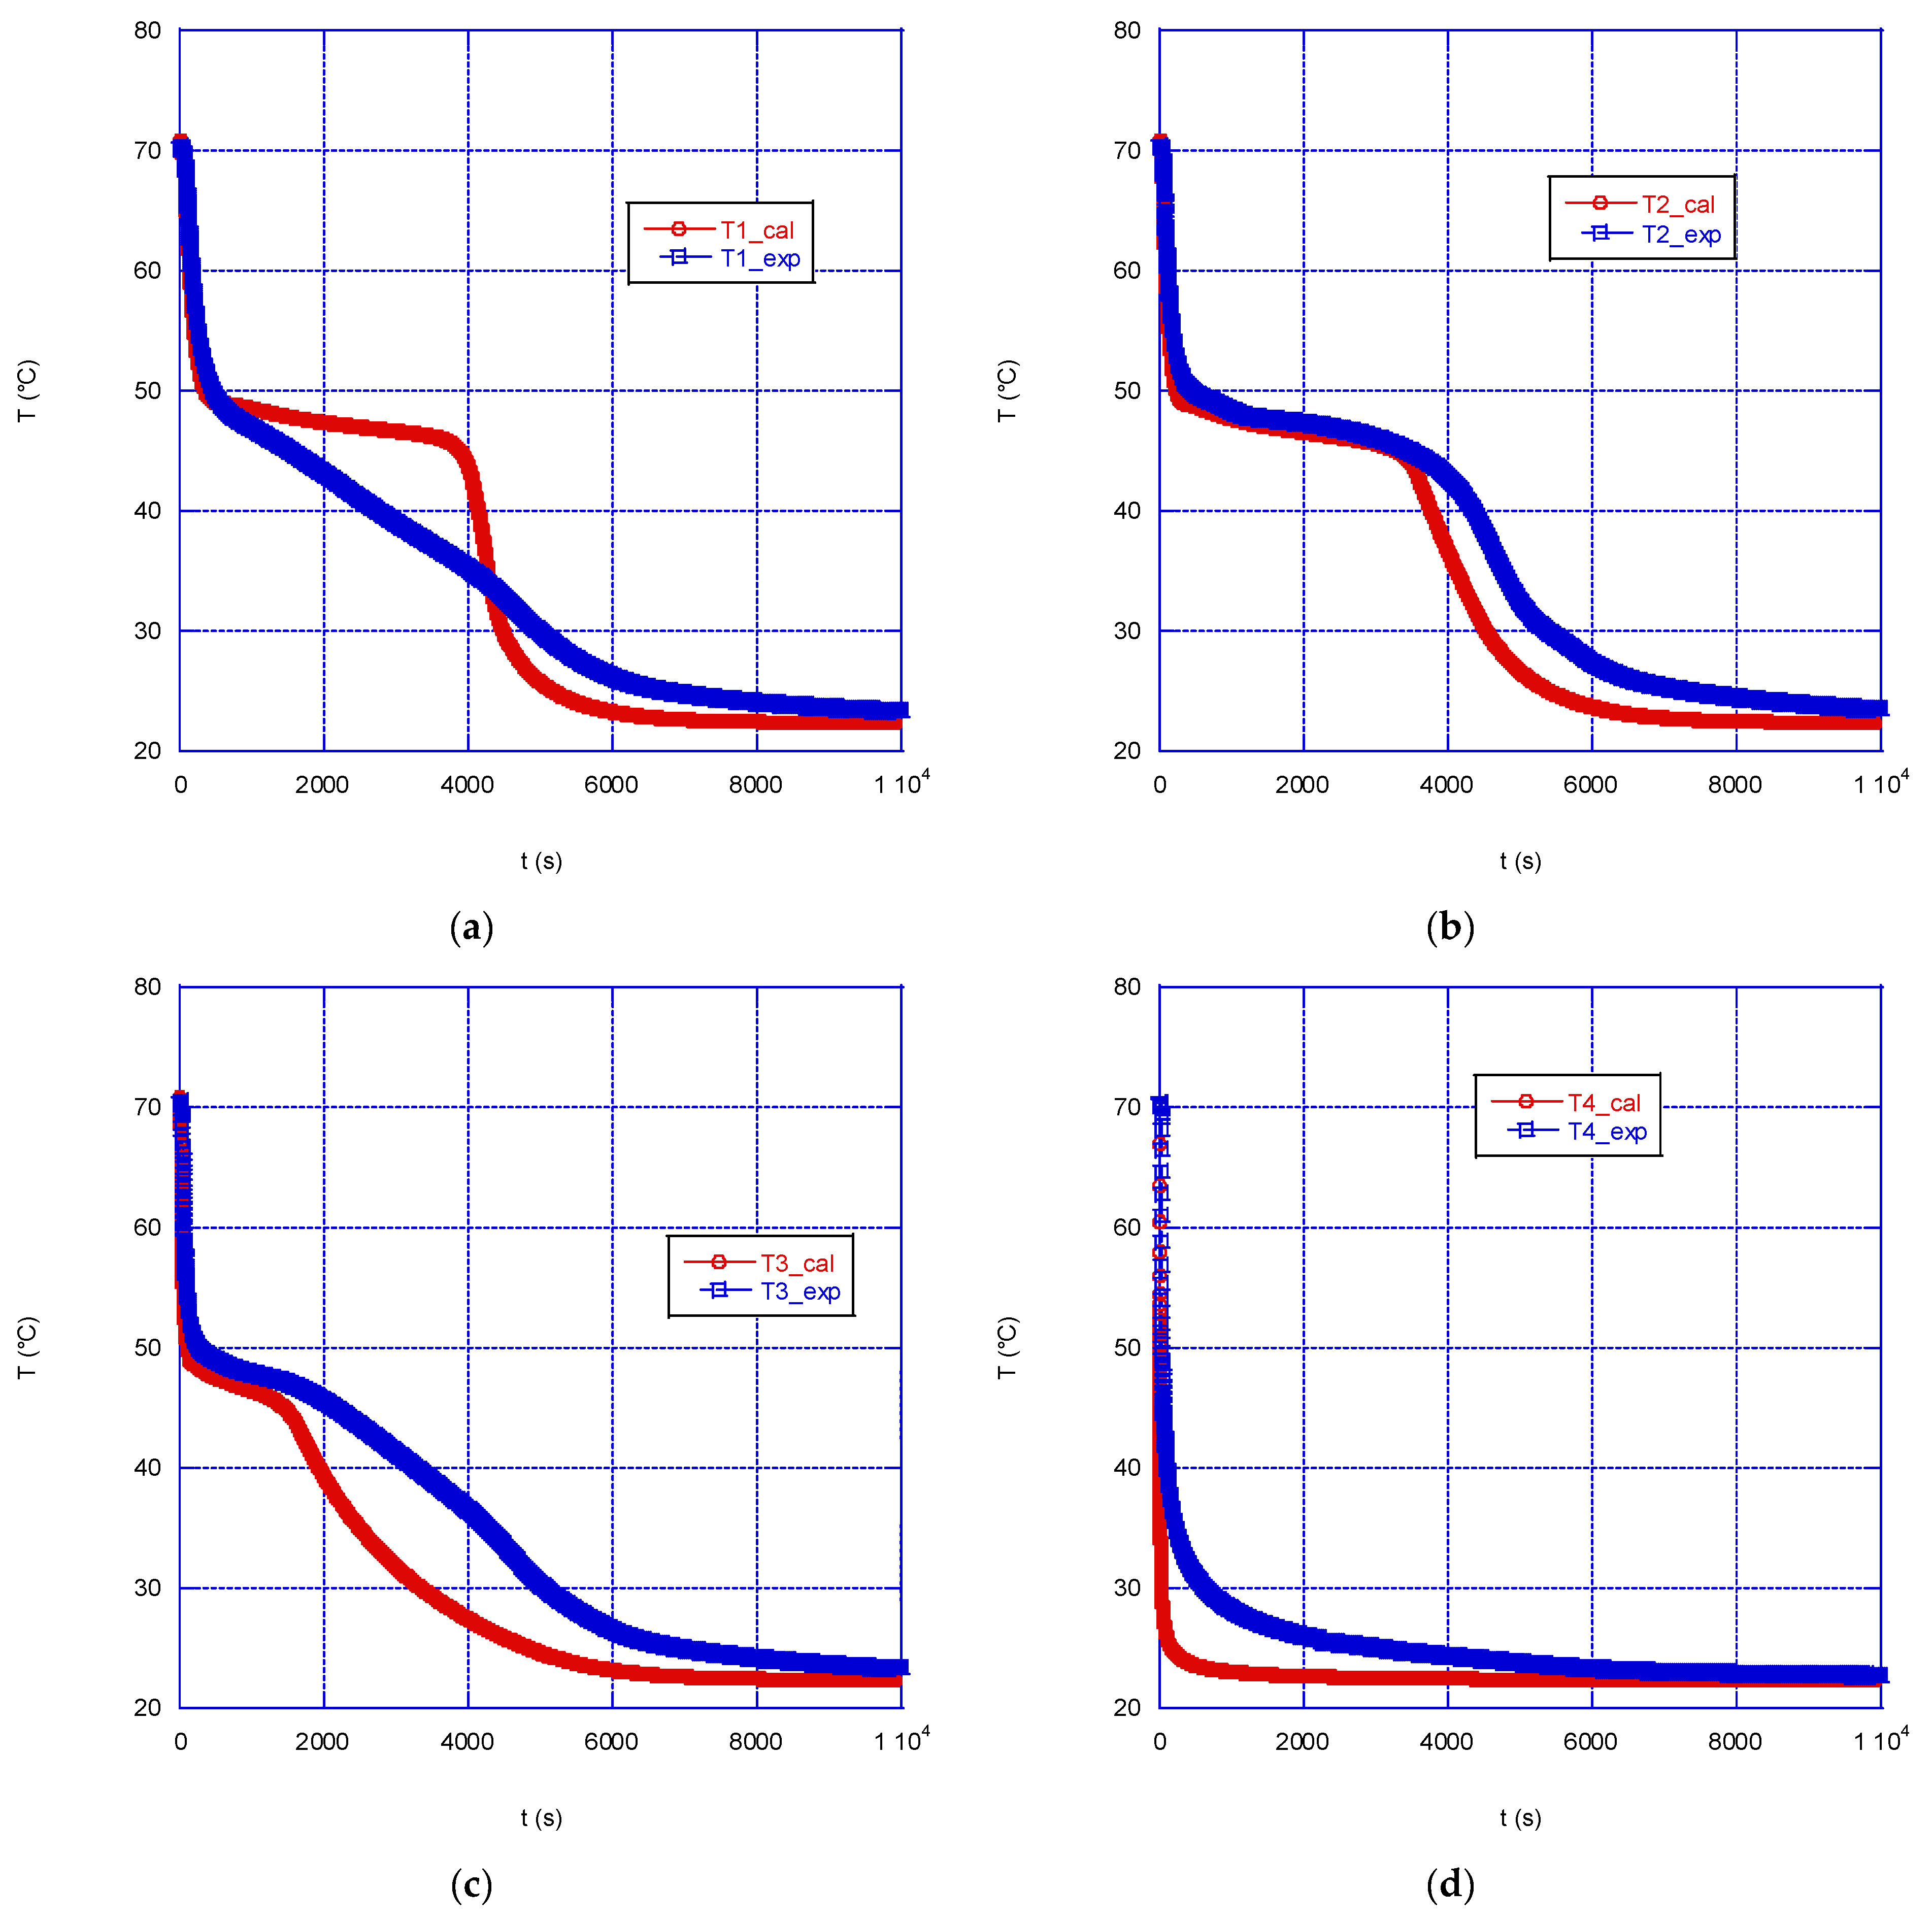
Figure 6 and
Figure 7 introduce the data for the validation of model in the solidification case, while
Figure 8 and
Figure 9 shows the data for the melting case.
Figure 6 shows the comparison between the simulated and the experimental temperatures in the correspondence of the four thermocouples, in the case of solidification with a wall temperature equal of 22.5 °C and an initial paraffin temperature of 71 °C. The agreement between the values is rather good, with the model accurately predicting the temperature trend until the solidification start temperature is reached; for values lower than 49 °C a faster cooling is calculated with respect to the experimental trend. This will reflect in a calculated shorter time to reach equilibrium: the time predicted by the model is approximately 2.3 h, while experimentally a time of 2.8 h was measured. In any case, overall, the model is capable of reproducing rather well the experimental data during solidification at the four thermocouples, with the exception of thermocouple T1, where a greater discrepancy between the experimental and simulated temperature trends is observed: the simulation predicts a prolonged flattening of the curve in the correspondence of the melting temperature of the PCM. Probably, this discrepancy is partly also due to the presence of the flask neck which modifies the symmetry of the system; however, given the position of the thermocouples, its effect is expected to be small, compared to the whole system.
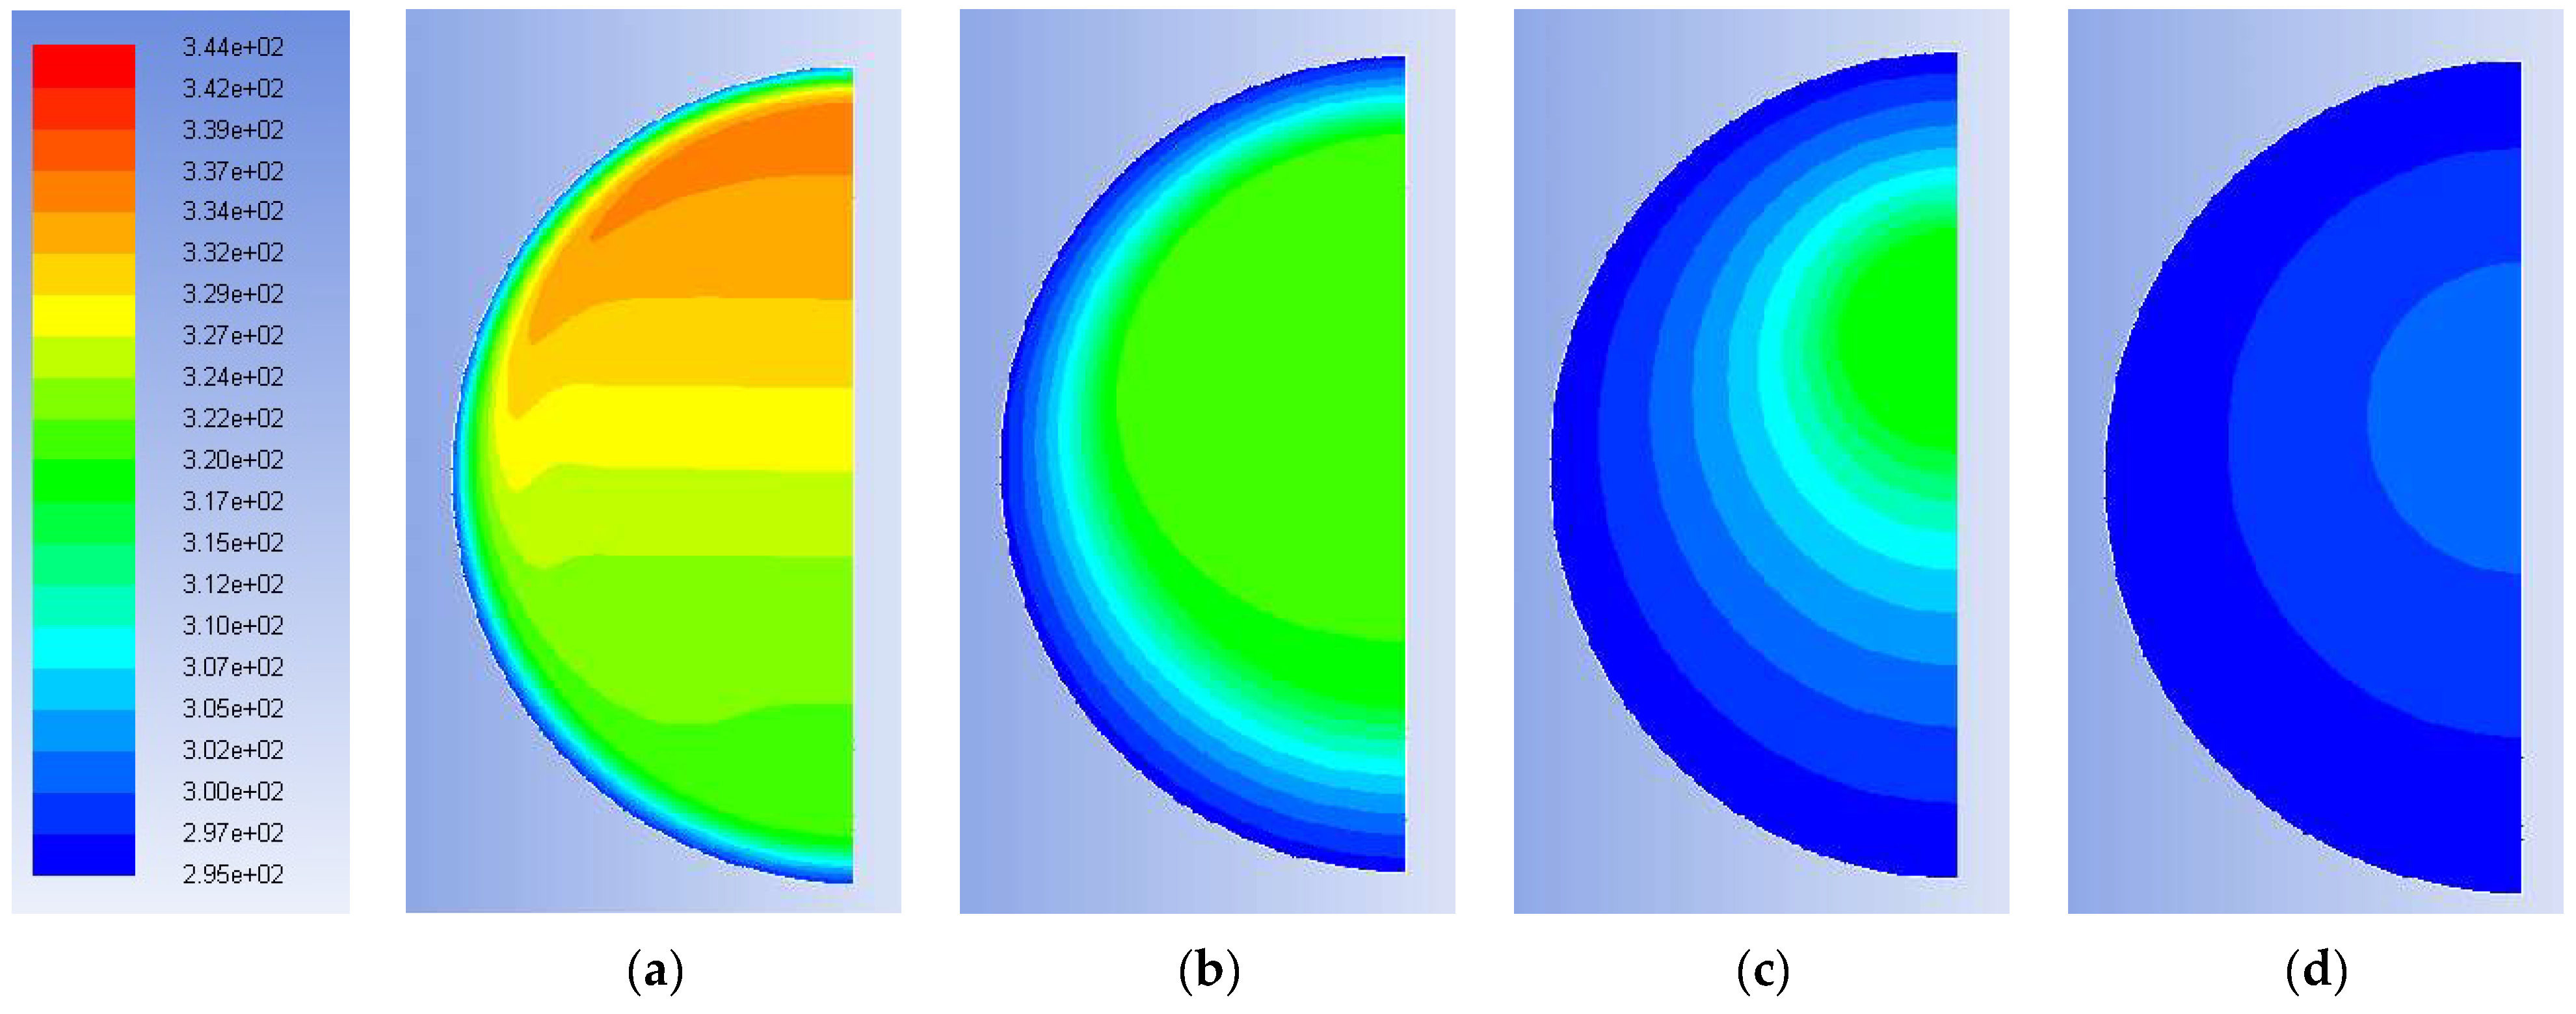
Figure 7 shows the distribution of temperatures inside the sphere at four instants, i.e., after: 150 s, 1200 s, 3600 s and 6000 s. Through the snapshots of the simulation, it is possible to gain an idea of the distribution of temperatures and masses of solid and liquid PCM in the spherical capsule during the solidification process: due to the external cooling, the solidification starts on the outer surface, with the formation of a solid shell, which then acts as a nucleus that gradually increases its thickness inward. From the color maps it is possible to see that the hotter liquid mass tends to remain in the inner and upper part of the sphere: the movements of the mass are, in any case, much slower and more regular than those occurring during melting (see for comparison
Figure 7b and
Figure 9d both at 1200 s).
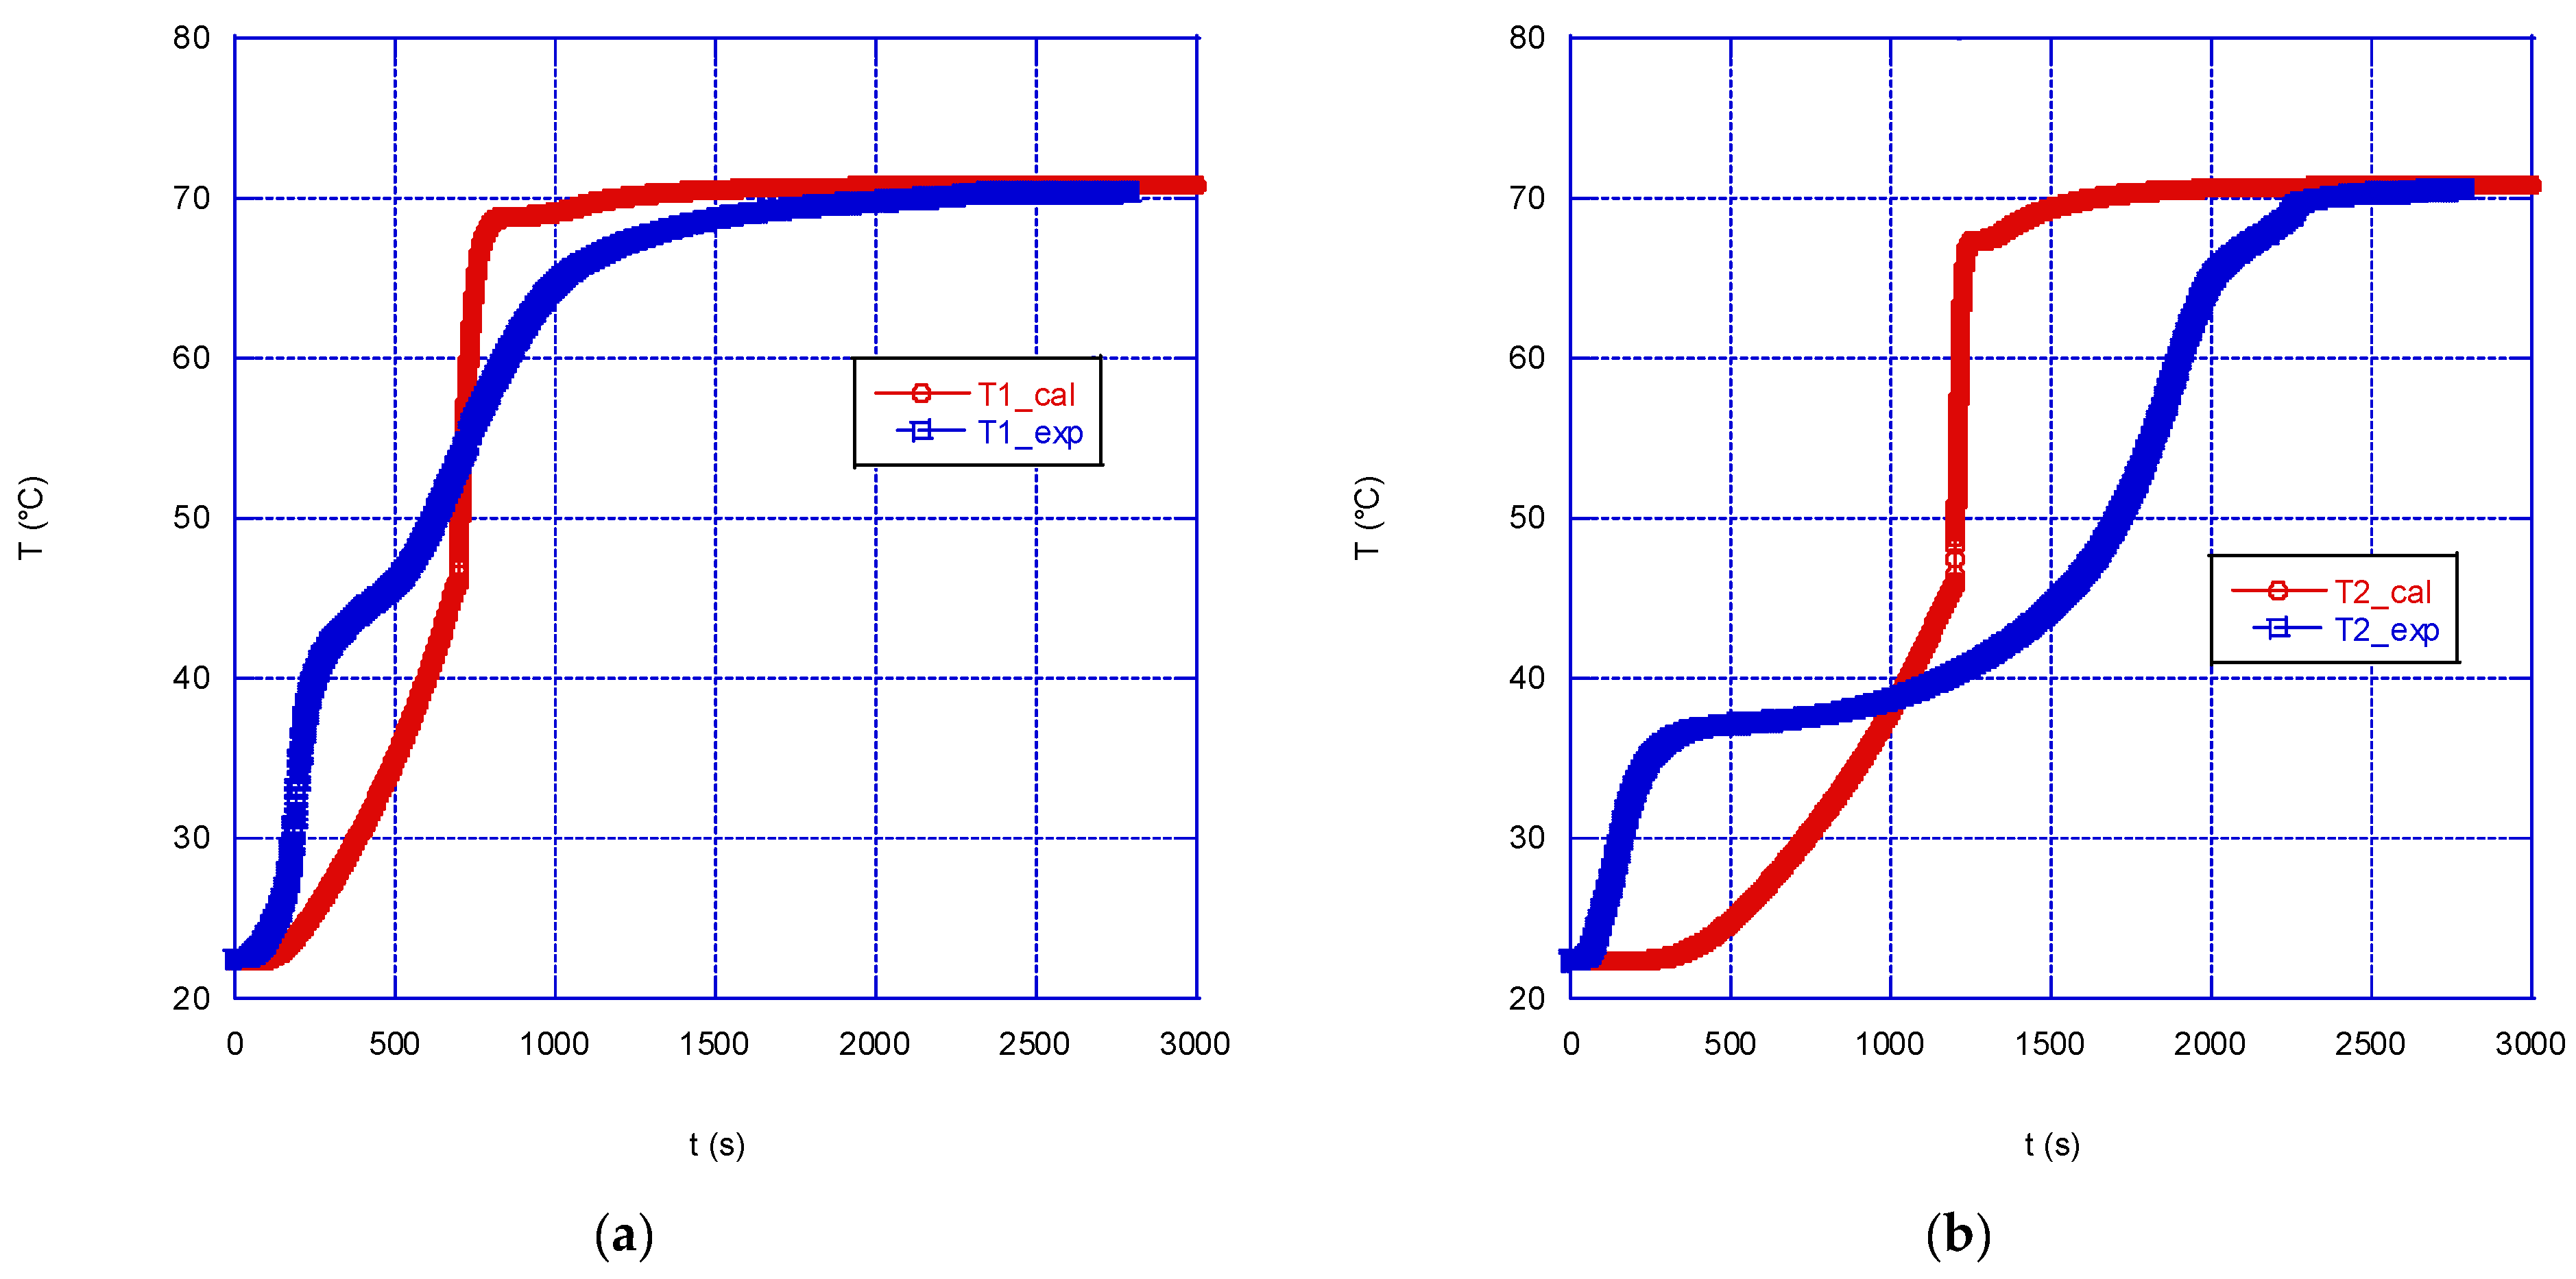
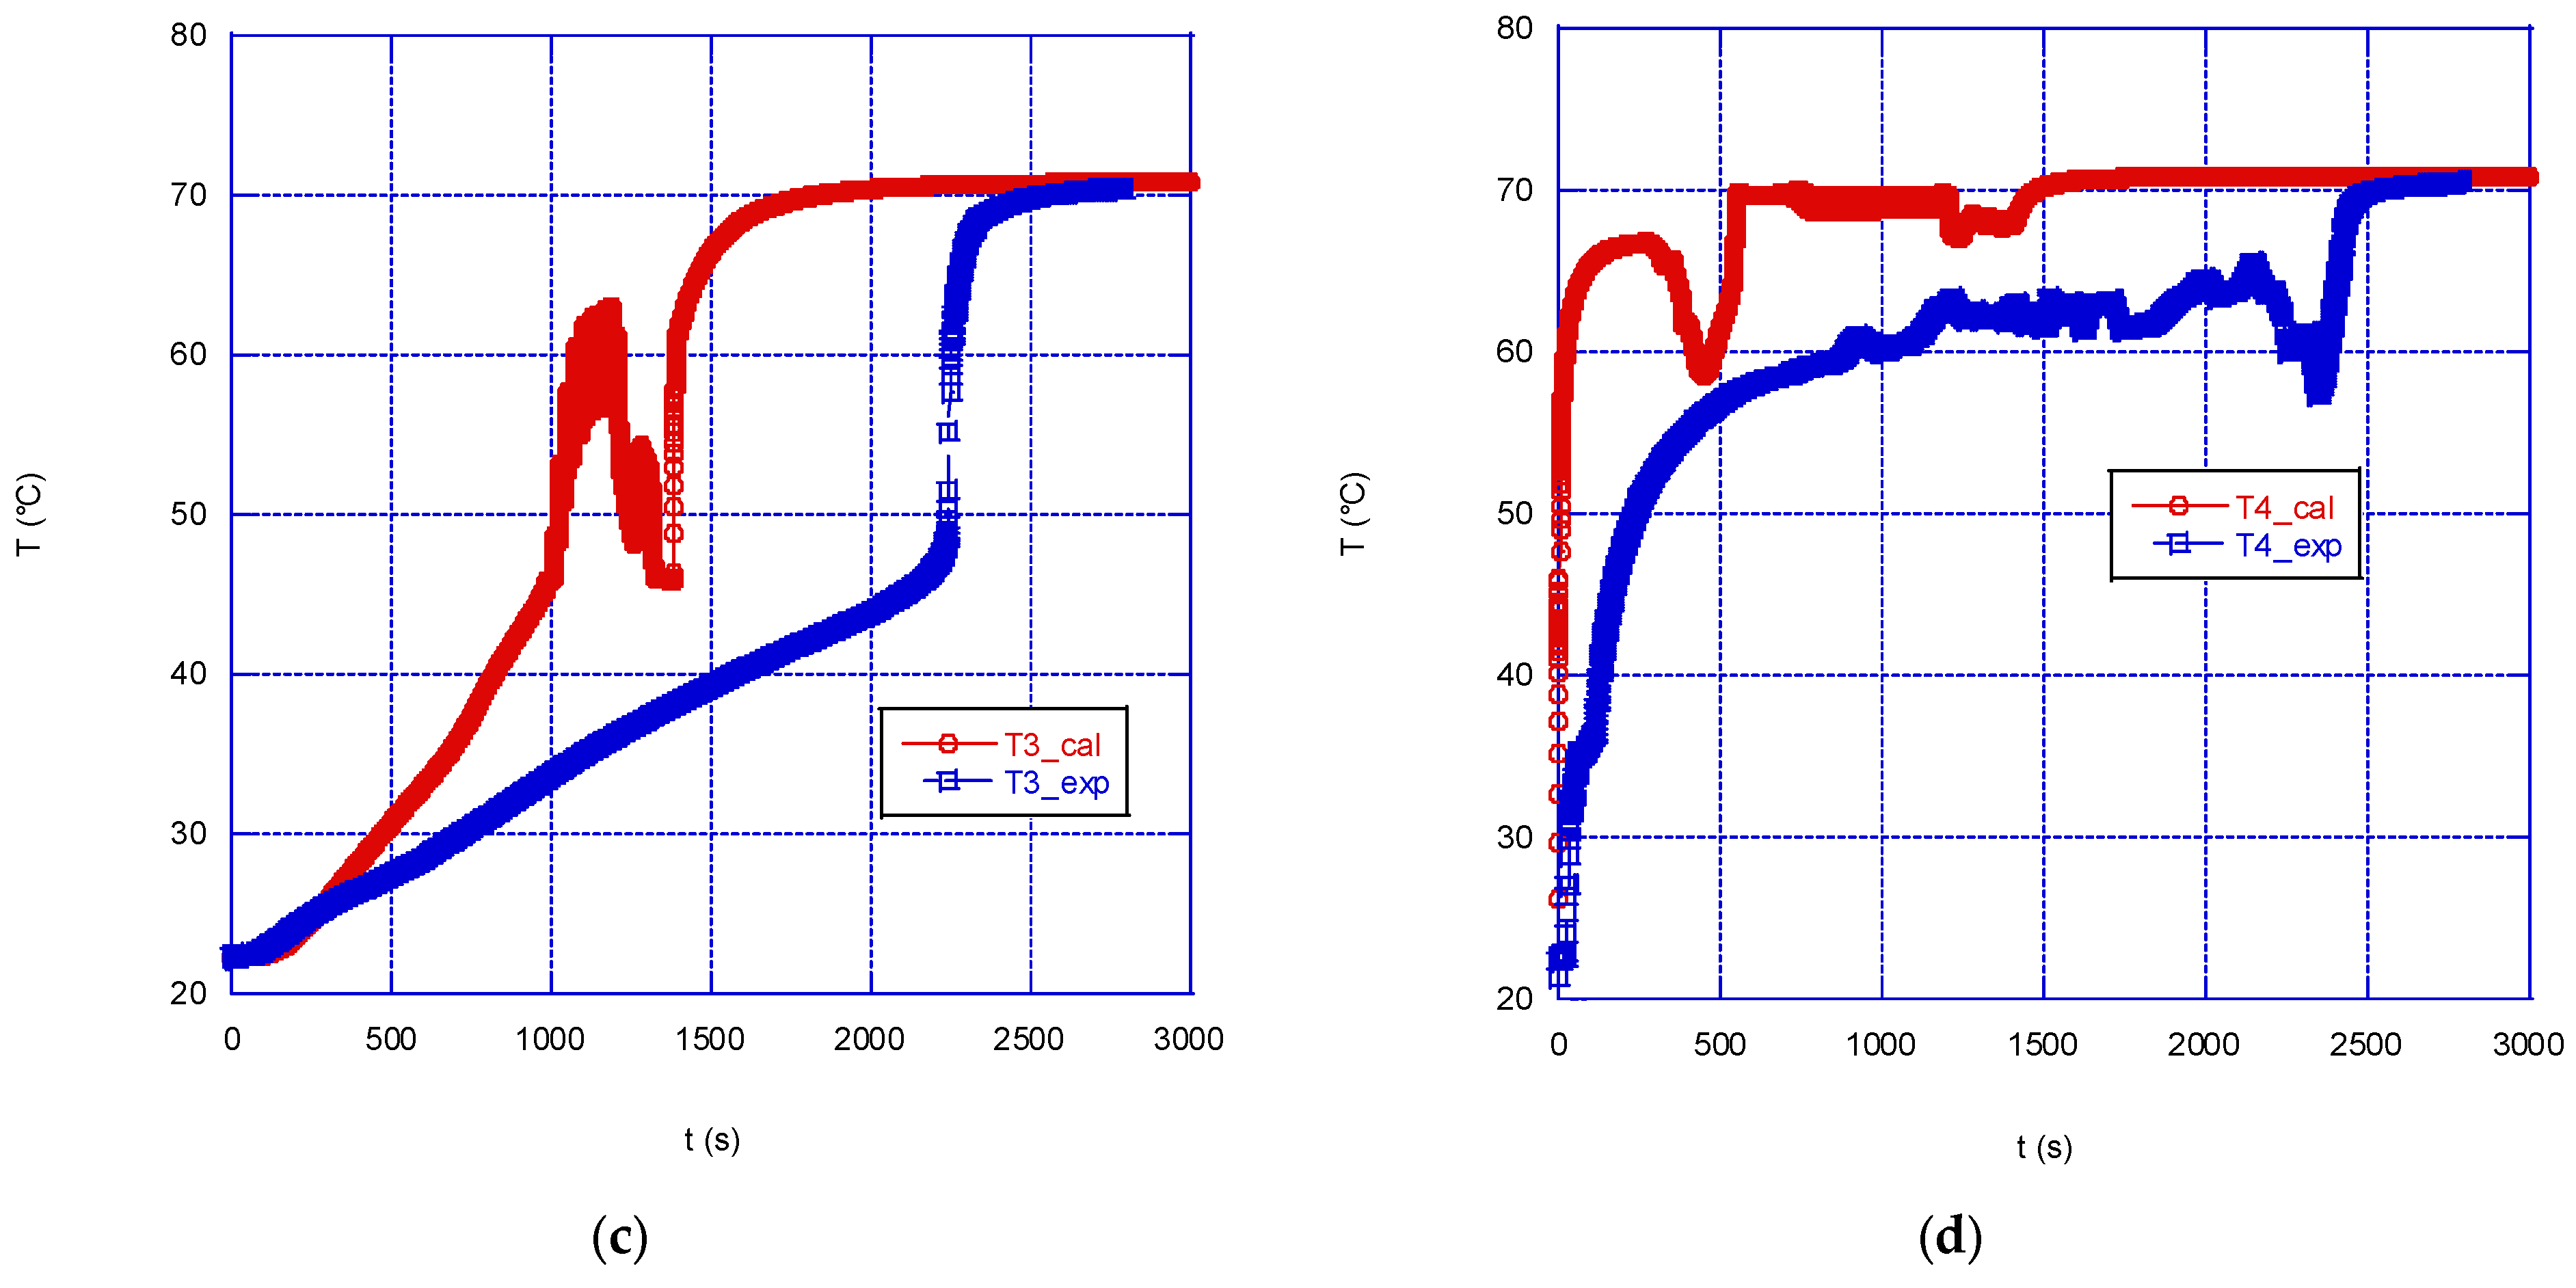
Figure 8 shows the comparison between experimental and simulated data during the charge phase (melting of the PCM) for a wall temperature of 71 °C, while
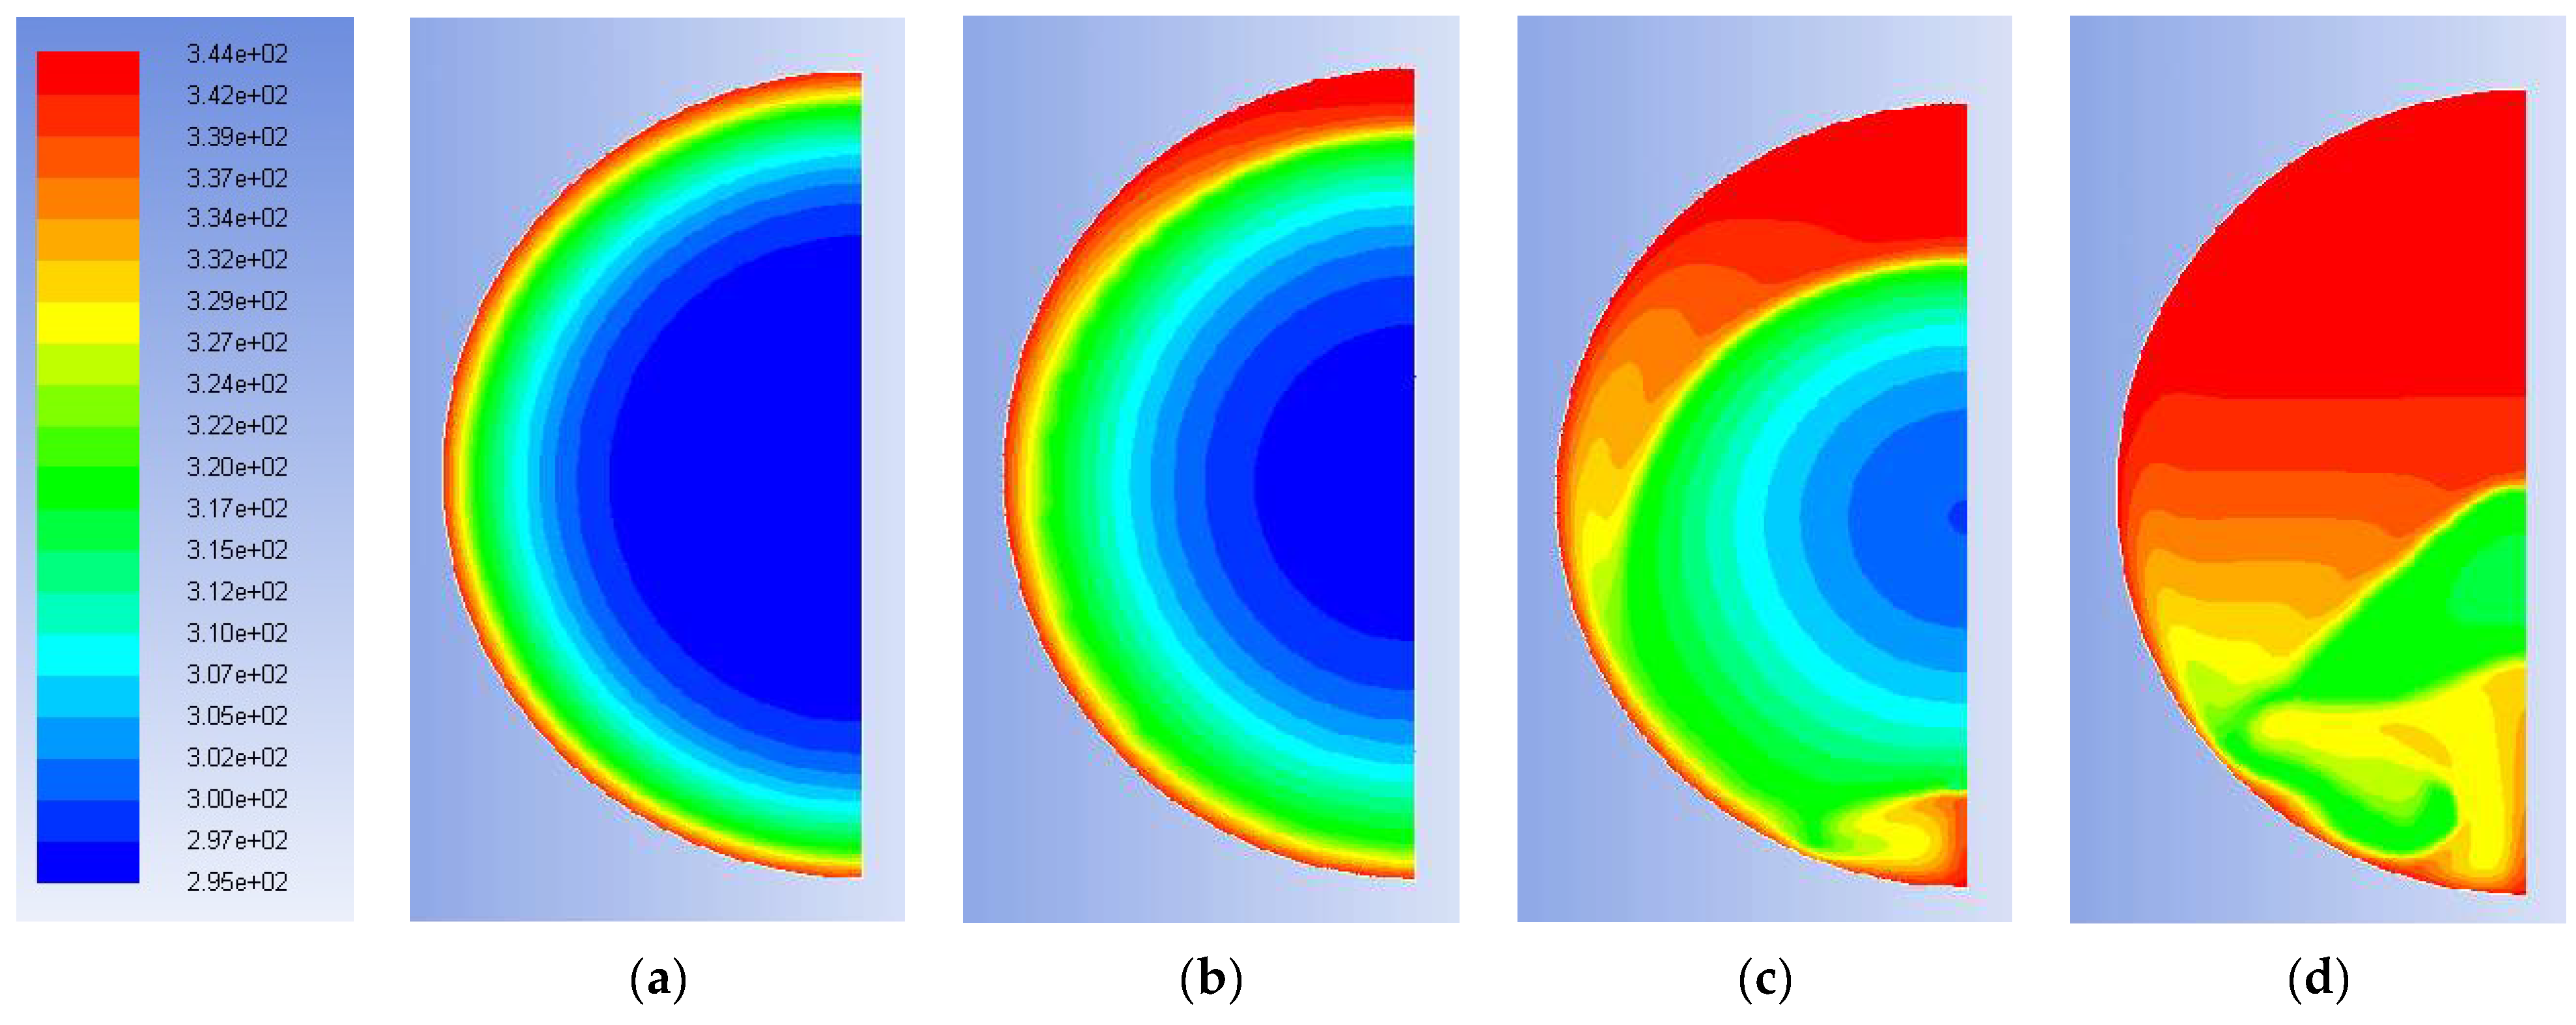
Figure 9 shows the calculated temperature distribution inside the sphere at four instants, namely 150 s, 300 s, 600 s and 1200 s from the start. The time sequence reported in
Figure 9, clearly represents the free movement of the heavier block of solid paraffin towards the bottom of the control volume and the upwards movement of the liquid paraffin, which cause a markedly uneven distribution of the temperature inside the sphere: after 300 s, the distribution of the solid and liquid volumes in the sphere appears already strongly influenced by the effect of gravity.
If we look at the temperature comparison reported in
Figure 8, some significant differences can be noticed. The temperature at thermocouple T1 is predicted by the model rather well (
Figure 8a), while in the correspondence of thermocouple T2, the model predicts a much slower heating of the solid mass, compared to the experimental trend, up to 40 °C, followed by a steep increase up to 71 °C, after approximately 1200s since the beginning; experimentally, however, the equilibrium temperature is reached after 2200 s (
Figure 8b). Similar, or even larger, discrepancies are observed in the correspondence of T3 and T4, with the model predicting a much faster temperature rise, compared to the experimental one (
Figure 8c,d), followed by some waving trend. Besides those significant differences, overall, the model predicts a faster melting of the PCM mass in the sphere: thermal equilibrium is predicted after approximately 1700 s, instead of 2500 s, as measured experimentally.
Modeling the melting of a phase change material in a sphere is a rather complex problem, hence the difficulty in obtaining quantitatively reliable results. Tan et al. [
34] developed a model to simulate the melting process of a PCM into a sphere with an internal diameter of 101 mm. The results were compared against experimental data and the model always predicted a higher melting speed. Similarly, Sattari et al. [
35] carried out a CFD analysis of the constrained melting of n-octadecane paraffin wax in a spherical container at different operating conditions and various container diameters and validated the results of the simulations with experimental data. The results showed the existence of thermally stable layers on the top half of the sphere due to the increasing influence of natural convection; at the same time, the waviness behavior of the PCM in the bottom part of the container was observed. As far as the melting rate is concerned, this study highlighted the major influence of the surface temperature rather than other operational and geometrical parameters. These results agree with those reported in the present study.
Overall, in both the mentioned studies there was a general qualitative agreement with the experimental data, but quantitatively, discrepancies of the same order of magnitude as those obtained in this study, were observed.
In addition to the above remarks regarding the difficulties in modelling the PCM melting, another issue which might partly explain the differences between experimental and calculated values reported in the present case might be associated with the experimental rig adopted. In fact, as seen in
Figure 2, the thermocouples are fixed to a small axial shaft, which also acts as a constraint for the solid phase during melting, which therefore remains anchored to it and is not free to fall towards the bottom: consequently, the inner volume of the sphere is expected to remain colder than it would be if the solid would be replaced by the hotter liquid. Of course, the model is not affected by this effect.
4.2. Influence of Solid Foam Insertion on the Response Rate of the System
As already highlighted in the discussion above, despite the theoretical possibility of storing much larger amounts of energy than with conventional heat transfer systems, PCM are often characterized by relatively low thermal conductivity, which hinders a fast energy transfer between the PCM and the tank liquid. This markedly increases the process time, making the method unsuited for applications where the heat exchange time plays a significant role. Given the difficulty in finding melting materials with the required properties (from the thermal, safety, economic, etc., point of views), a possible solution is to include some high-thermal-conductivity materials in the capsule containing the basic PCM.
Solid foams can be used to increase the conductivity of the phase change material encapsulated in the sphere. Asker et al. [
36] examined the solidification of PCM integrated with metal foam in a spherical capsule by applying a one-dimensional model, and they concluded that such materials could represent a reasonable approach for enhancing the heat transfer in TES systems. However, convective heat exchange inside the sphere was not taken into account even for PCM without embedded foam.
In the present study, the influence of the inclusion of a higher-thermal-conductivity material in the sphere containing the PCM, was also assessed.
For its evaluation, in addition the base case of the pure A46 paraffin, with k = 0.22 W/mK, two additional systems have been simulated, characterized by:
- -
k = 1 W/mK, corresponding to A46 paraffin immersed in a composite SiC porous foam matrix (k = 200 W/mK), already presented elsewhere [
37,
38];
- -
k = 10 W/mK, arbitrarily set to investigate the effect of
k, and representative of average values reported in the literature for the effective thermal conductivity of paraffin wax in metal foams [
39].
In both cases, the composite structure was simulated as a pseudo-homogeneous material [
38,
39] but, due to the presence of the solid foam which prevents the movement of the PCM mass, the convective motions were discarded during simulation.
The graphs below show a comparison between the temperature profiles obtained simulating the sphere containing pure A46 paraffin (with the convective motions allowed in the simulation) and those obtained for the two composite configurations.
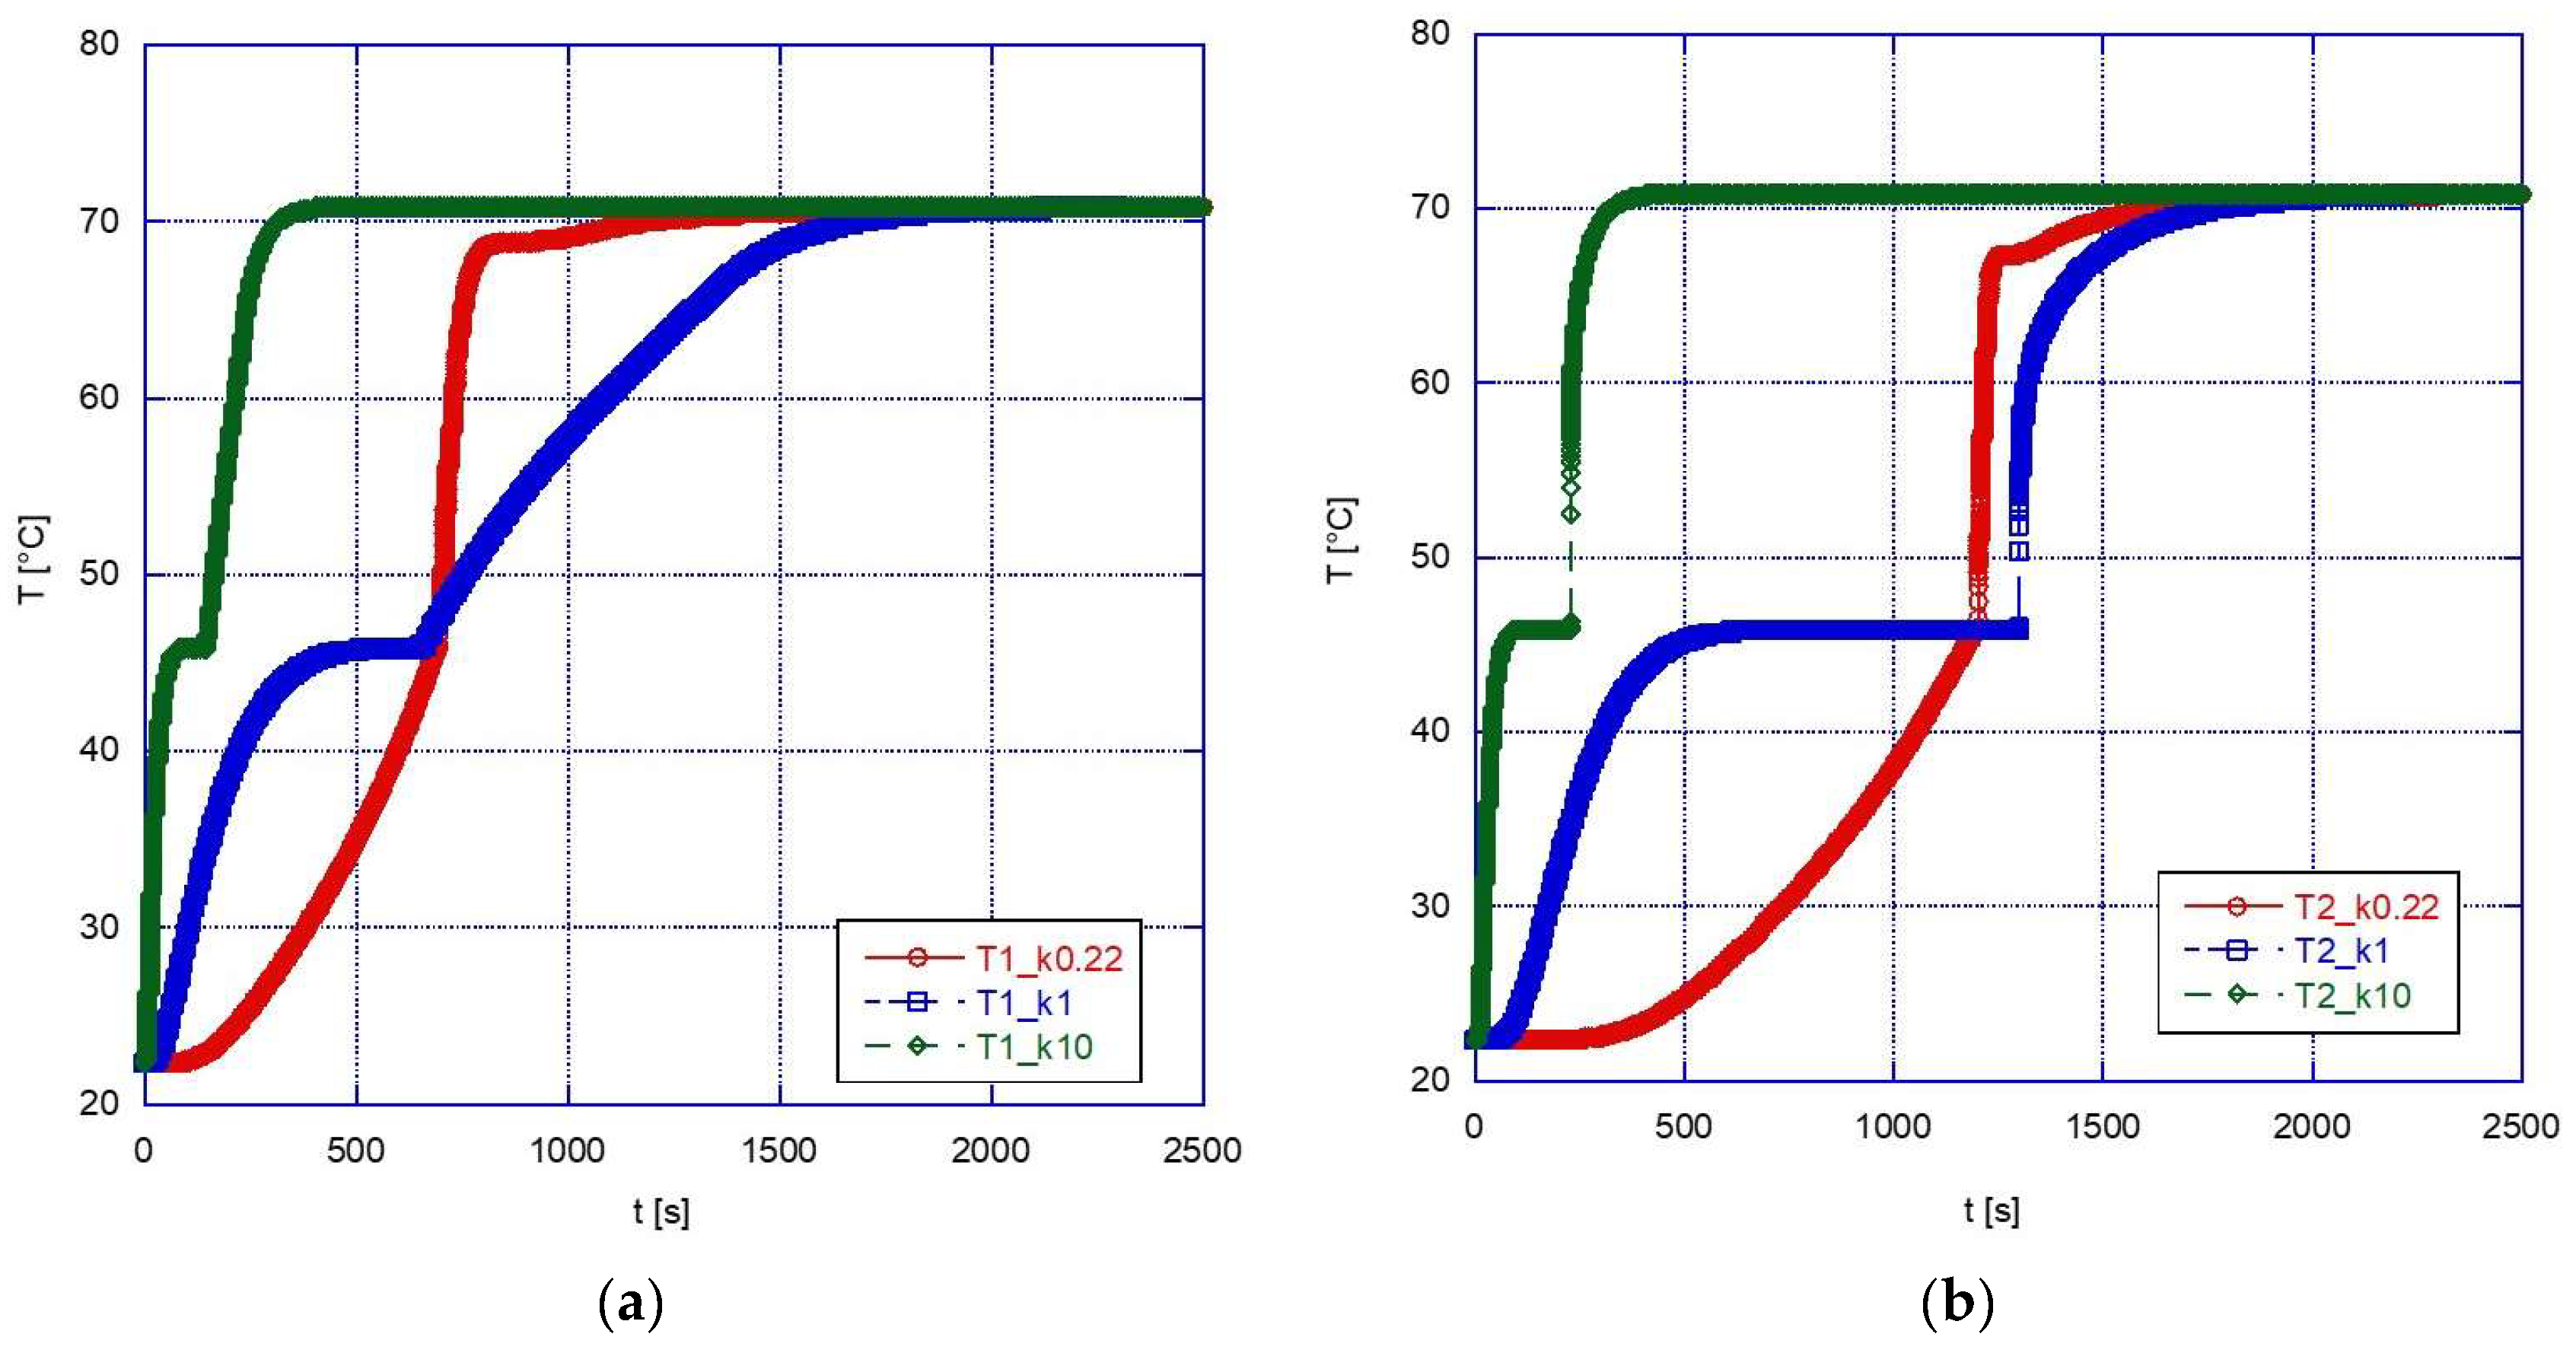
During the melting phase (
Figure 10), a marked beneficial effect can be observed after a change in thermal conductivity from 1 W/mK to 10 W/mK. This might be expected, and it is especially true for the inner thermocouples (see for example
Figure 10b). Overall, this increased efficiency reduces the time to reach thermal equilibrium from approximately 1700 s down to approximately 400 s. However, if we compare the results for k = 1 W/mK and k = 0.22 W/mK (pure A46), it is found that the difference is not significant and, in the upper part of the sphere, the efficiency is even higher in the case of the pure PCM rather than with the composite structure. This effect is likely due to the influence of the convective motions which have been already discussed above, and it has an important practical importance: in fact, since introducing a solid foam inside a spherical capsule is not a trivial procedure and would also increase the overall cost of the system, its adoption should be carefully considered and adopted only in those cases where it is expected to actually provide significant advantages.
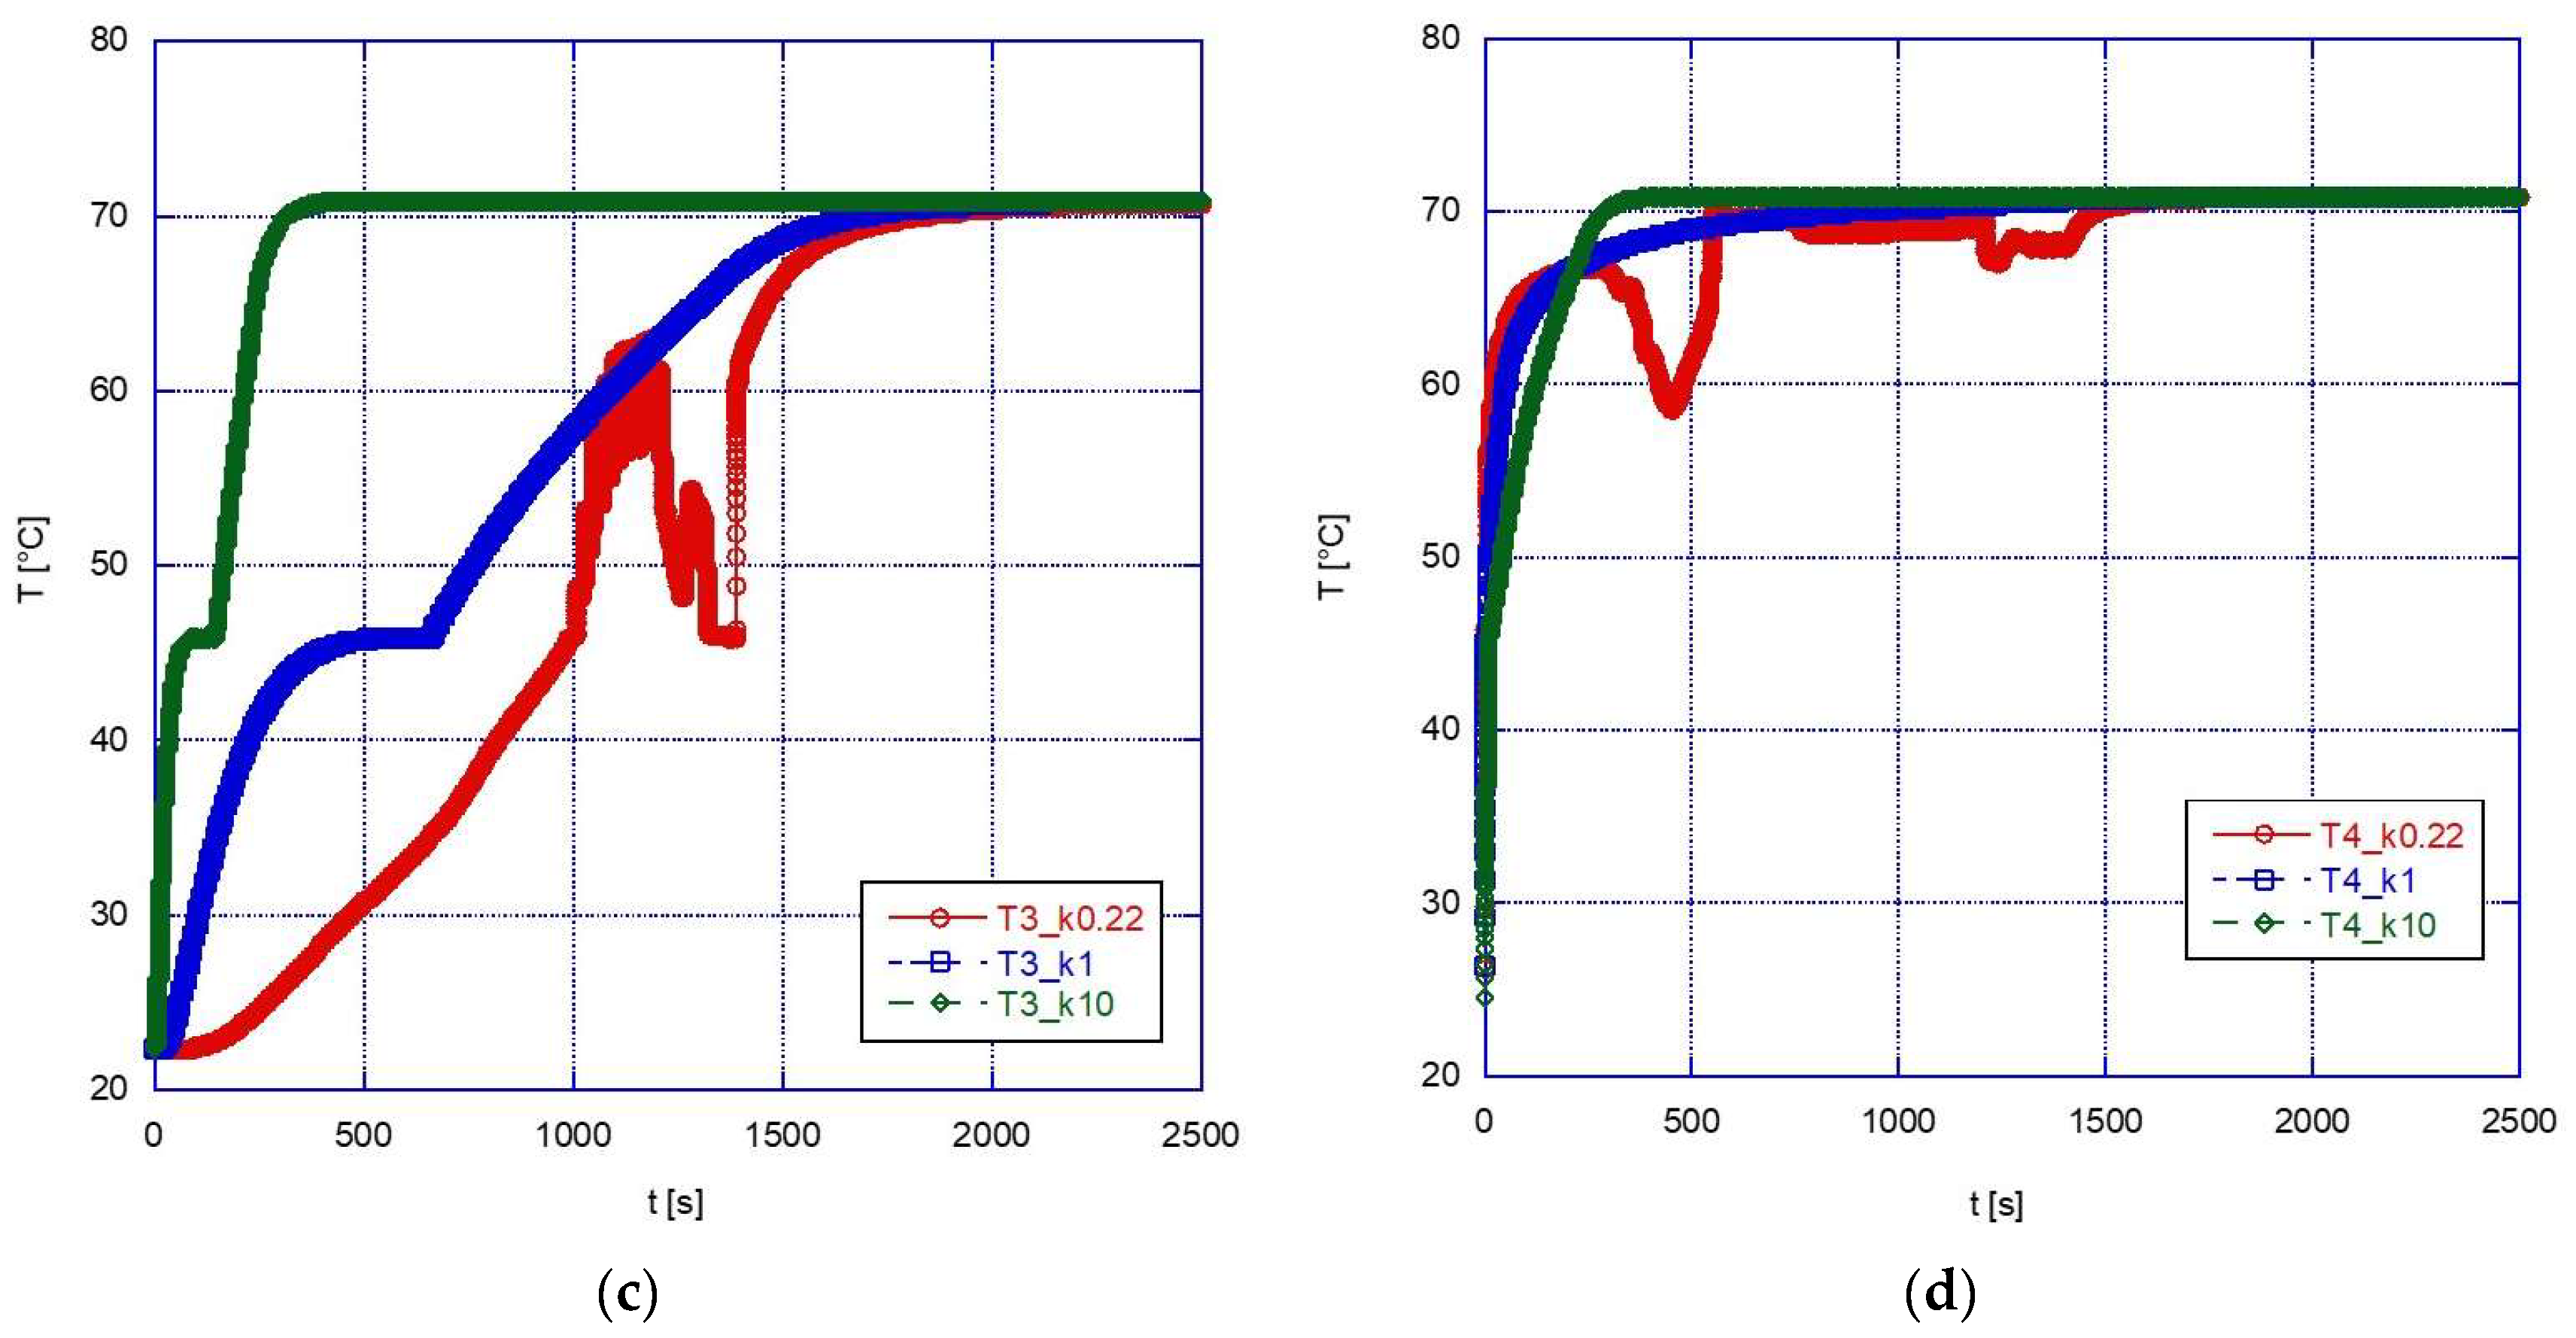
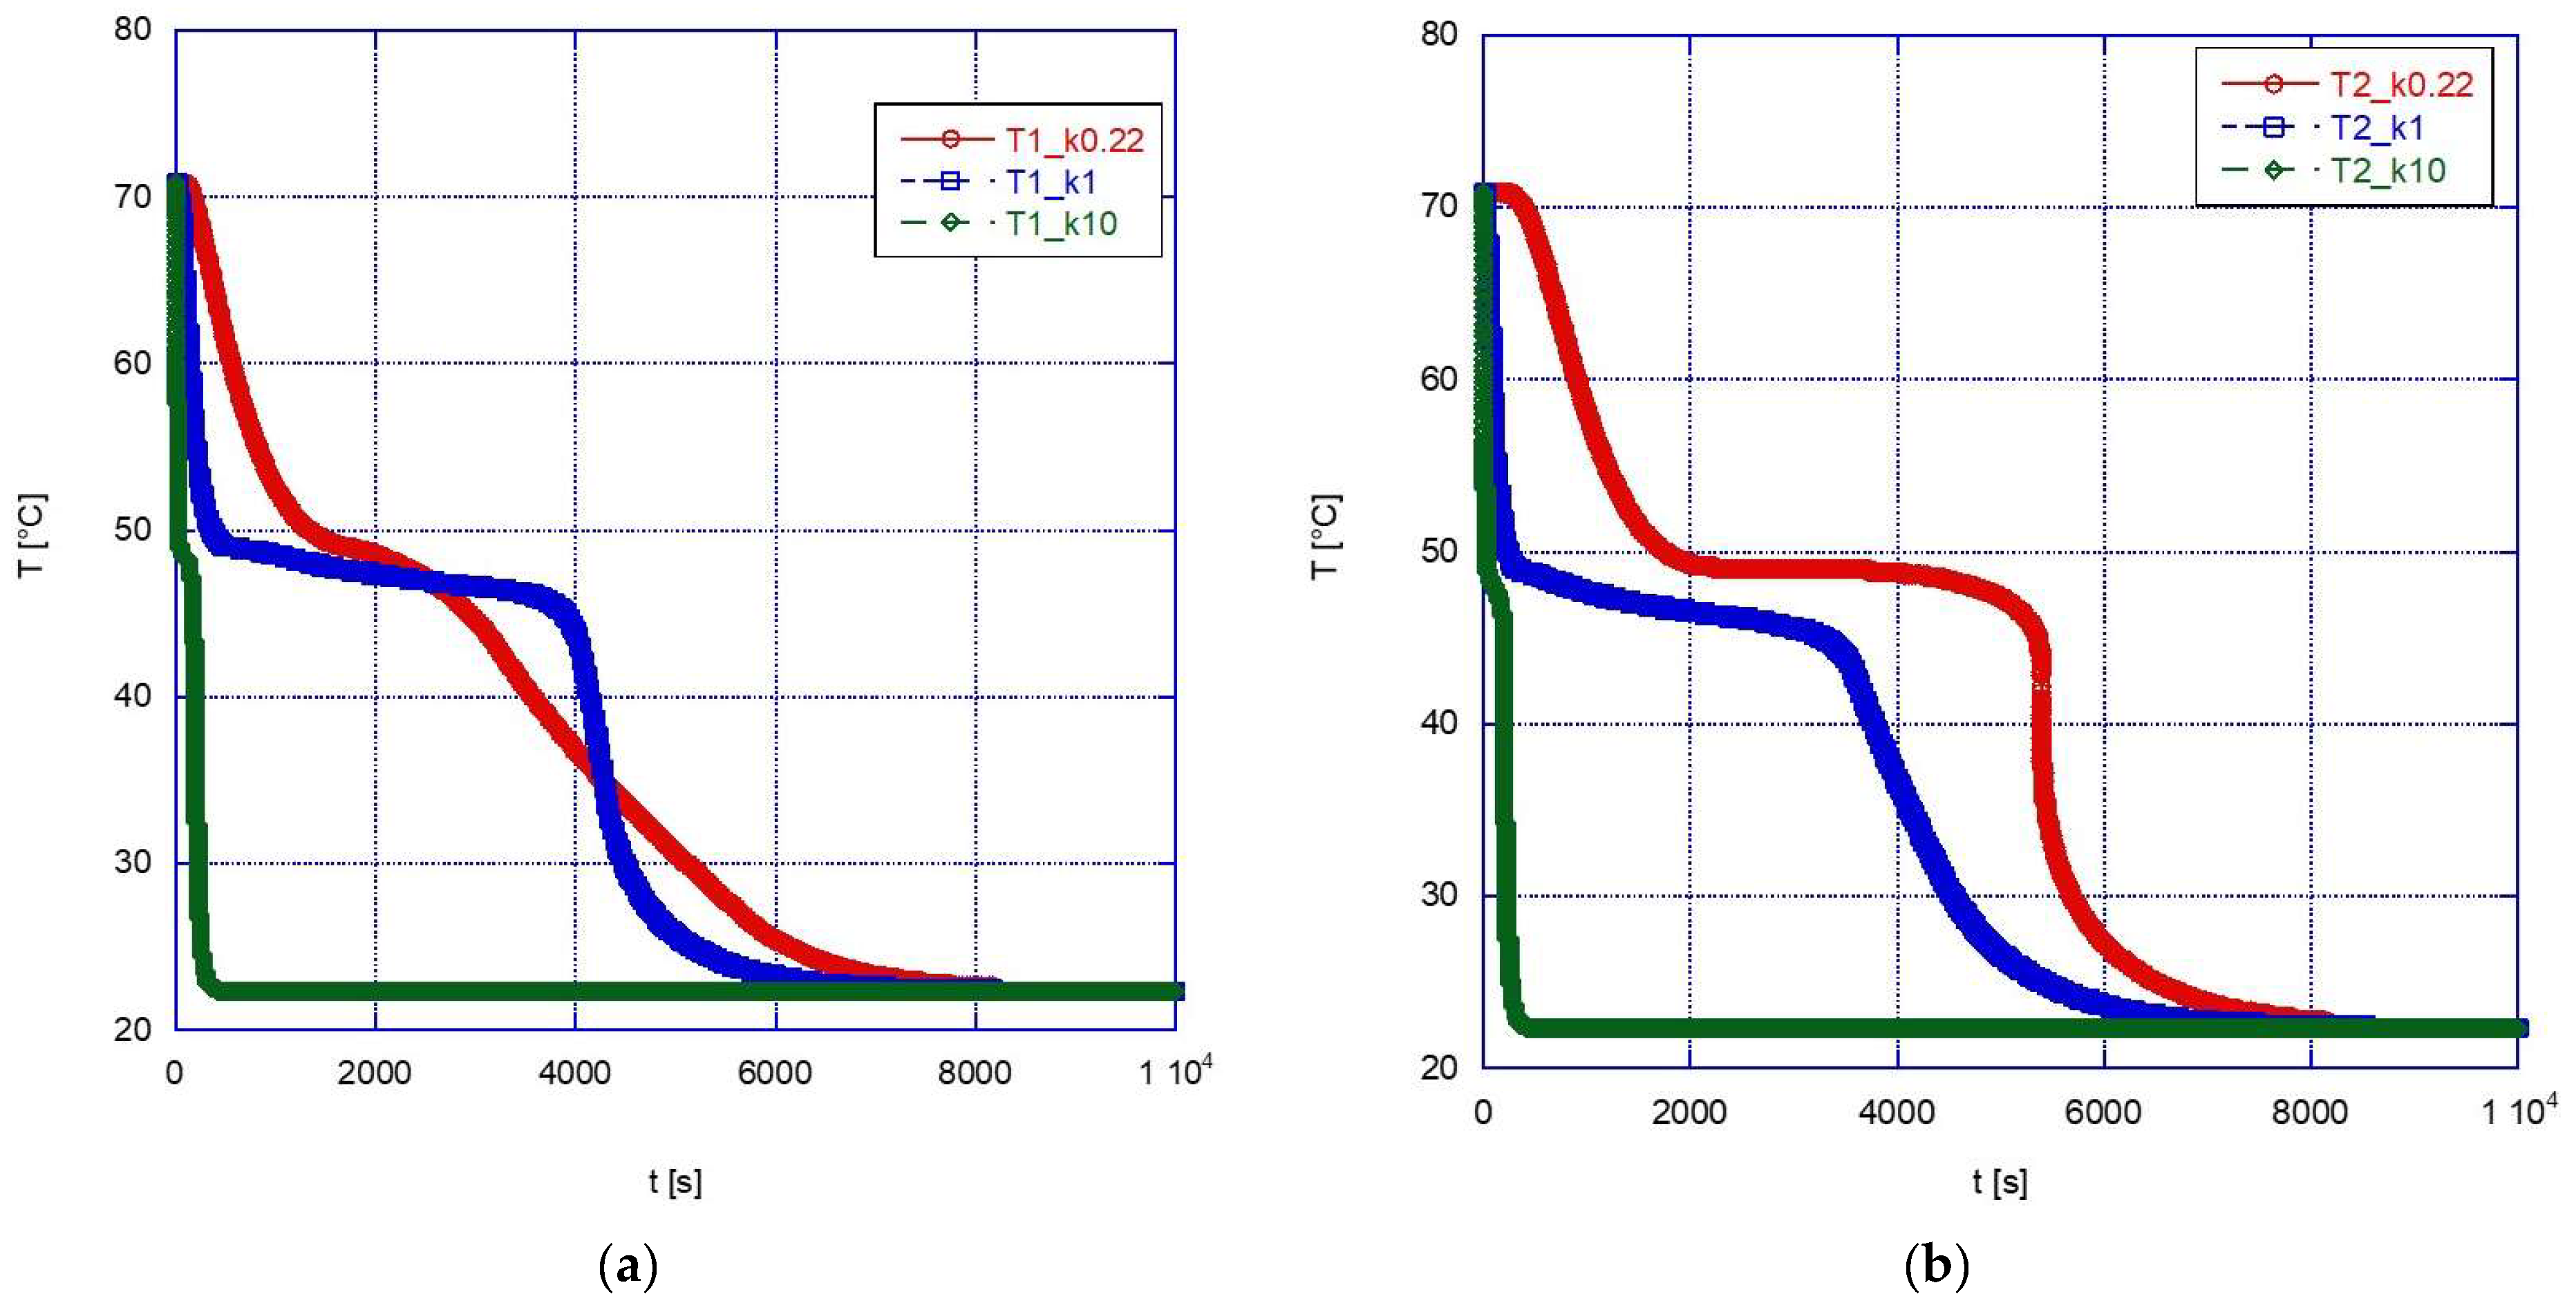
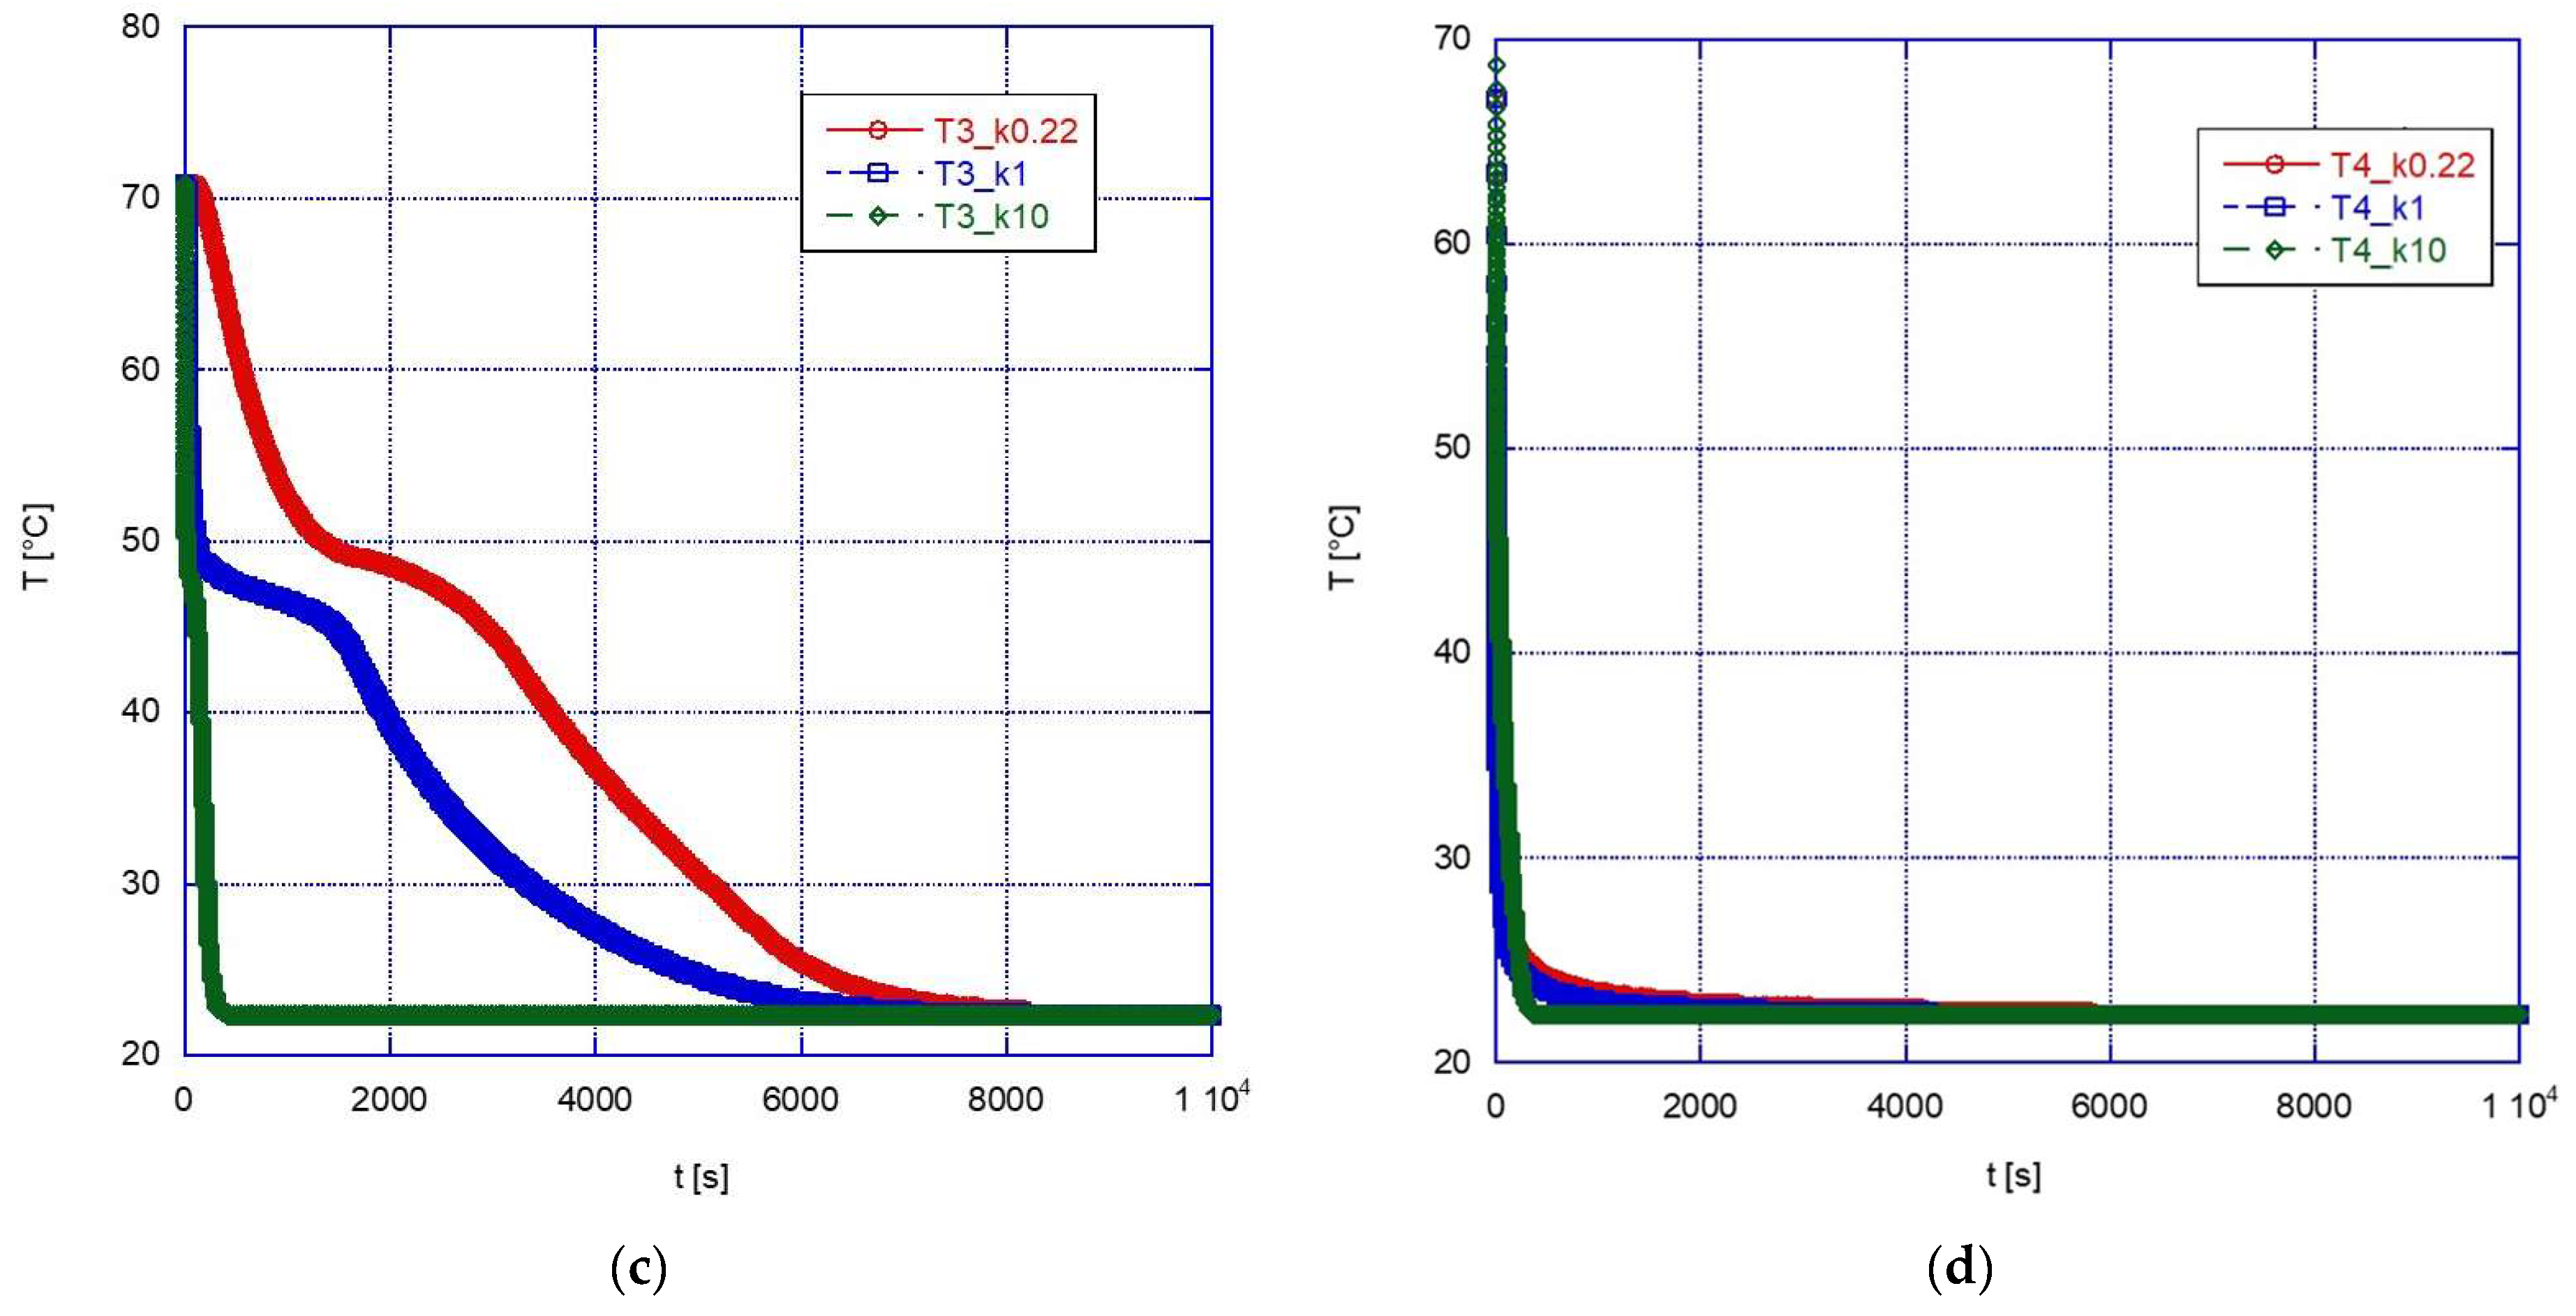
In the solidification phase (
Figure 11), the advantage of using a high-thermal-conductivity material is apparent, with the final thermal equilibrium reached in a very short time (approximately 400 s) for k = 10 W/mK, i.e., less than approximately 1/20 the time required with pure PCM. However, in this case the advantage is apparent also for lower values of thermal conductivity (again, especially for the inner volume of the sphere), with the solidification temperature reached earlier than with pure PCM in any location inside the sphere, thanks to the higher conductivity of the external solid phase, and with a faster subcooling after solidification.
4.3. Influence of the Wall Material on the Response Rate of the System during the Discharge Phase
Given the influence of the solid layer, which forms during the discharge phase as highlighted above, the effect of the material used for the encapsulation of the sphere was also investigated.
Two materials with significantly different thermal properties were selected:
The physical properties of the two materials are shown in
Table 2.
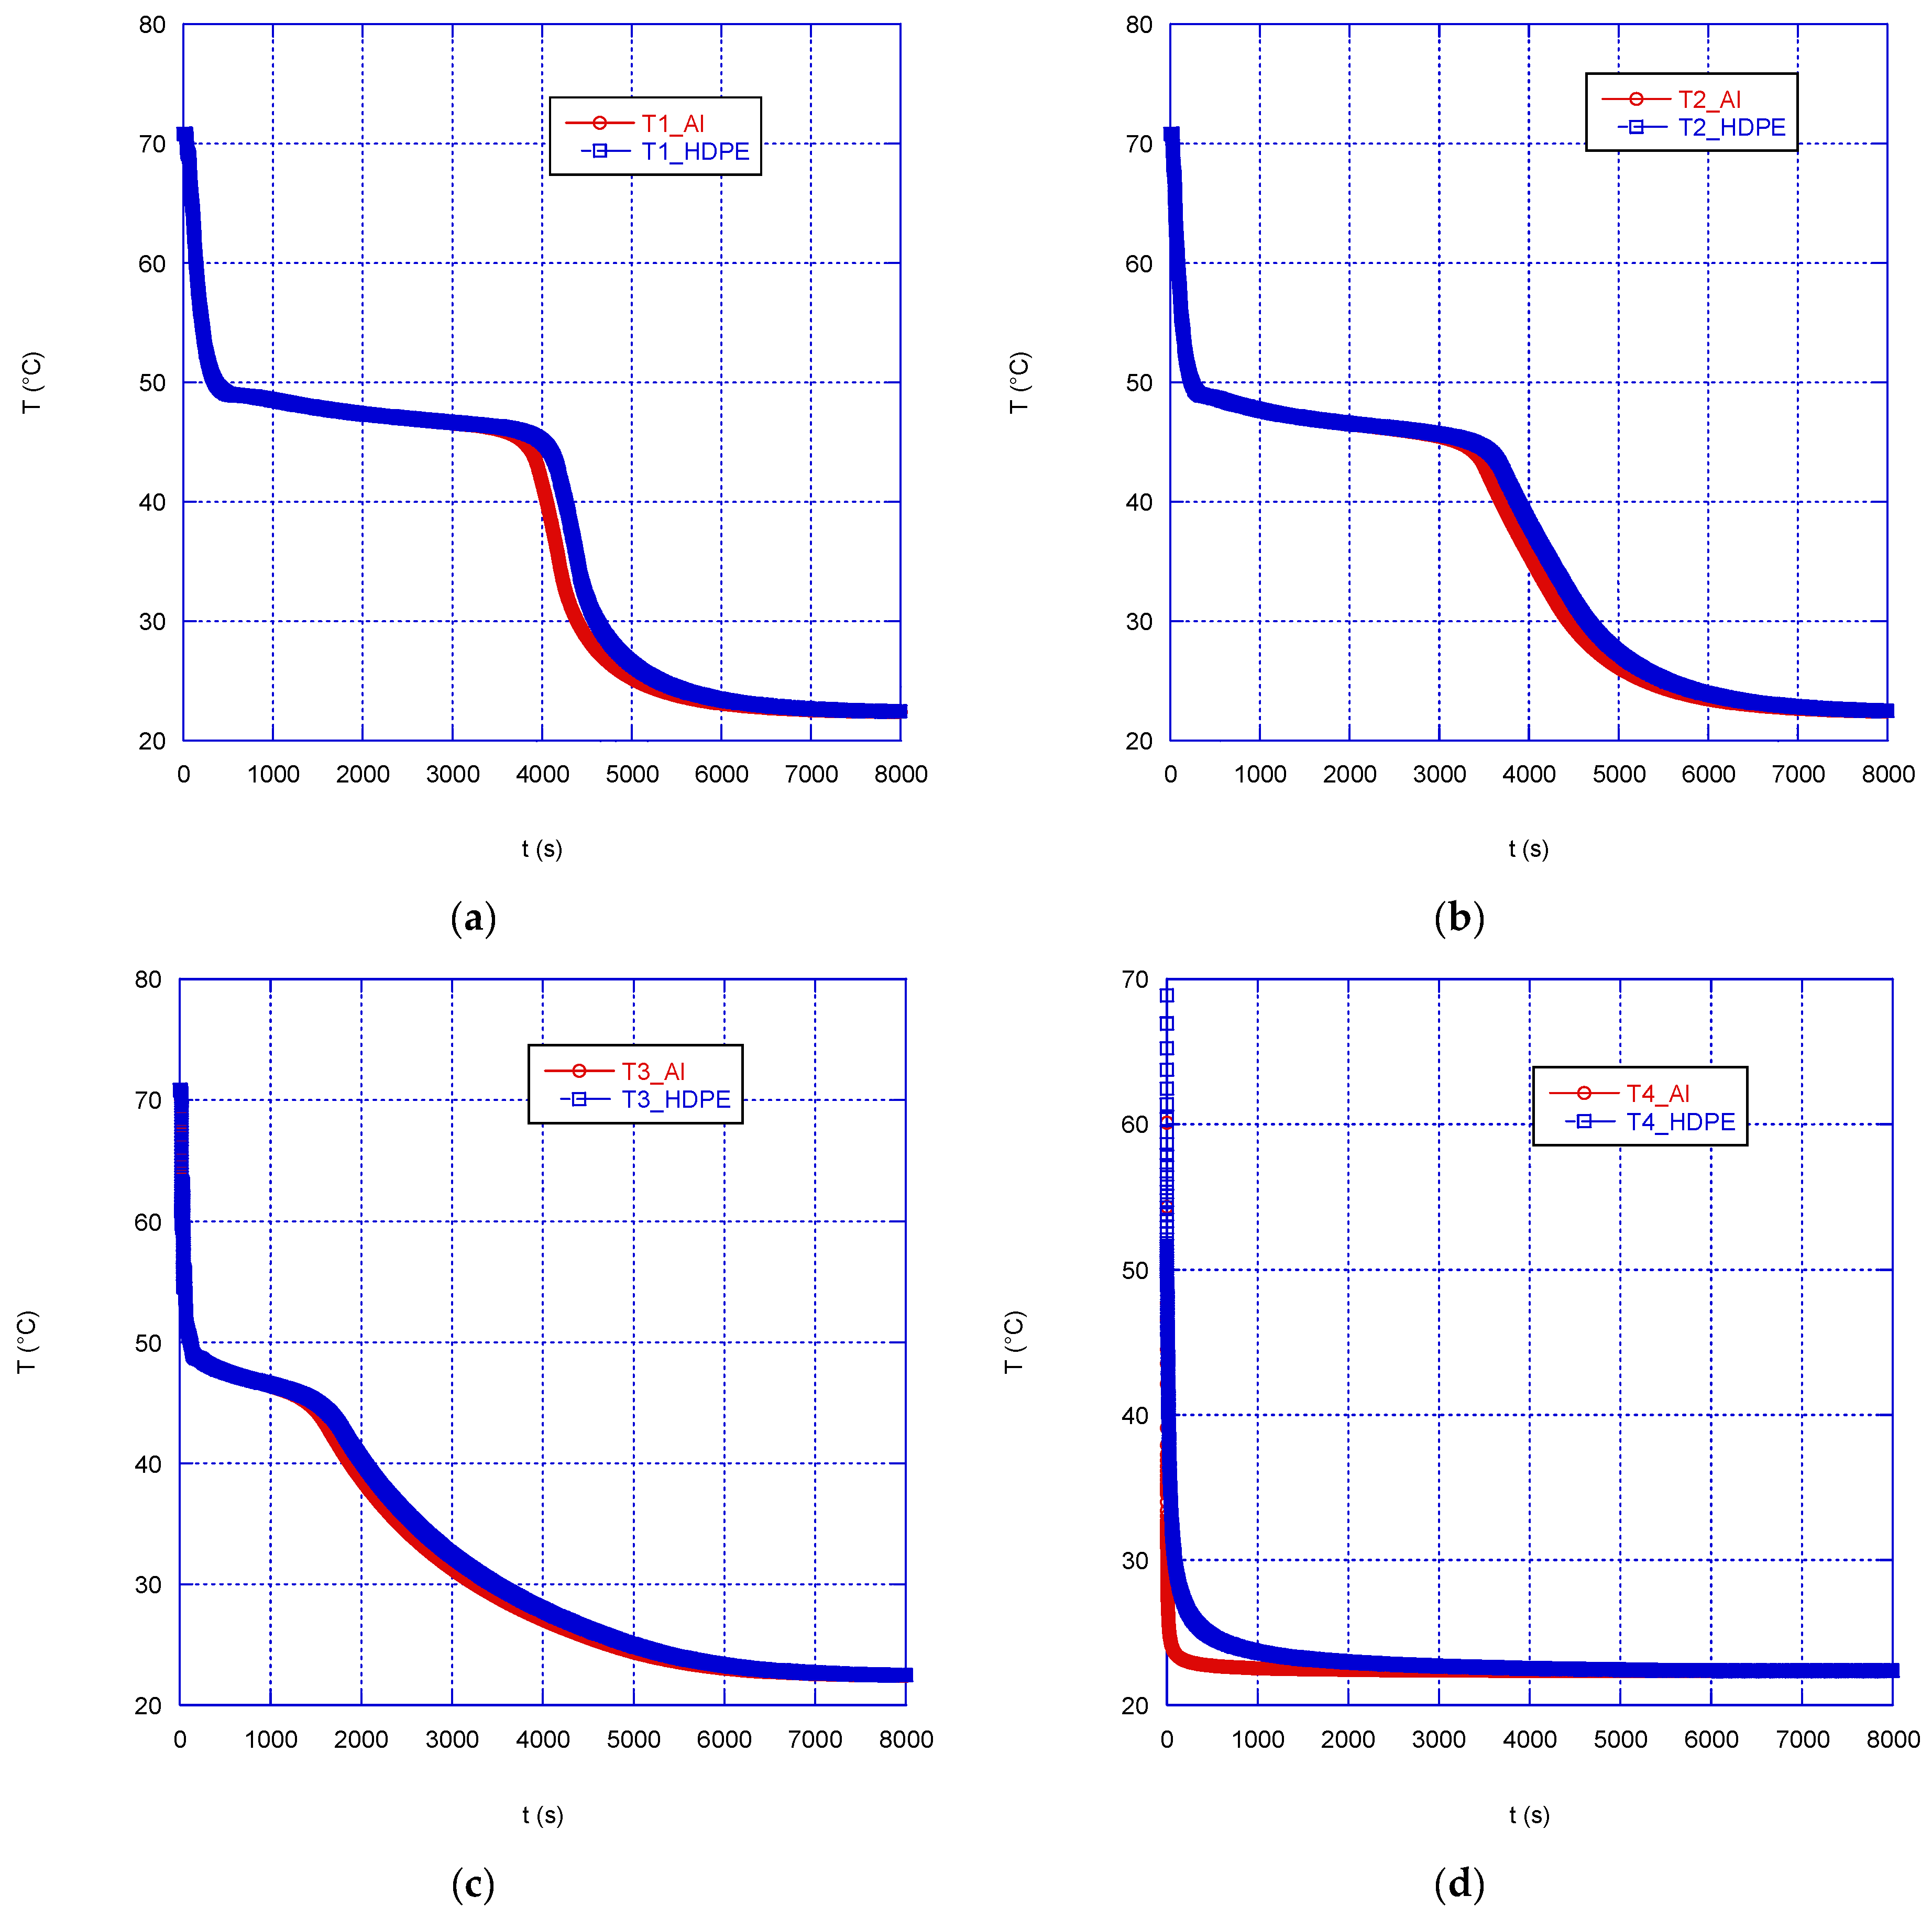
Figure 12 compares the temperature trends in the correspondence of the four monitored points inside the sphere. As might be expected, the temperature of the PCM within the aluminum capsule (wall thickness of 1.5 mm) decreases more rapidly than in the case of HDPE encapsulation, only at the wall proximity (
Figure 12d). Instead, the effect of the external material is negligible at inner locations and the system overall response time is almost independent of the wall material. This happens because of the comparable (in the case of HDPE) or much lower (for aluminum) thermal conductivity of the PCM compared to that of the containment material, so that, as soon as the solidification starts and a layer of solid PCM with increasing thickness forms, the thermal resistance of the wall material to heat conduction plays a secondary role on the overall heat transfer efficiency of the system.
5. Conclusions
In this work, the effectiveness of various configurations of a thermal energy storage (TES) system using a phase change material (PCM) placed inside a spherical capsule has been investigated.
Experimental tests were performed to analyze the melting (TES charging) and solidification (TES discharging) of the PCM: it has been verified that by increasing the wall temperature by 15 °C (from 56 to 71 °C), the time to complete the charge (i.e., to reach thermal equilibrium) decreased by approximately 70%, while the temperature trend was independent of the initial temperature during solidification.
The benefits of introducing a solid foam inside the PCM, to increase its thermal conductivity and thus to reduce the system’s response time, was then investigated by numerical simulations.
If the whole operation cycle is considered, i.e., both charging and discharging phases of the TES, and despite the difficulties encountered in reproducing the temperature trend of the PCM during melting, the following conclusions can be summarized:
The use of a SiC solid foam increases the conductivity of the material encapsulated in the sphere but hinders heat exchange due to convective motions;
For small increases in thermal conductivity, relatively small reductions in the operation times are obtained (only 10 min during melting compared to the case of pure paraffin);
Considering the practical difficulties to set up such systems and their costs, this solution does not bring substantial benefits, unless a significant increase in the thermal conductivity of the material is obtained (more than 50 fold that of the pure PCM).
Finally, it was found that the use of highly conductive wall materials does not appreciably increase the system efficiency, due to the much larger influence of the insulating layer of the solid PCM.


