Article

Analysis of Soil–Water Characteristic Curve and Microstructure of Undisturbed Loess

1
Faculty of Urban Construction, Beijing University of Technology, Beijing 100124, China
2
College of Geosciences and Engineering, North China University of Water Resources and Electric Power, Zhengzhou 450046, China
3
PowerChina Kunming Engineering Corporation Limited, Kunming 650051, China
*
Author to whom correspondence should be addressed.
Appl. Sci. 2024, 14(8), 3329; https://doi.org/10.3390/app14083329
Submission received: 17 March 2024 / Revised: 10 April 2024 / Accepted: 12 April 2024 / Published: 15 April 2024

Abstract

:
Long-term irrigation promotes the infiltration of water in the thick, stratified loess layer, significantly raising the groundwater table and triggering a series of landslides in loess platform areas. The soil–water characteristic curve (SWCC) of loess buried at different depths affects the unsaturated infiltration process and is intricately connected to the soil’s microstructure. The SWCCs, scanning electron microscope (SEMs), and pore size distributions (PSDs) for five sets of undisturbed loess samples at depths ranging from 3.4 to 51.9 m are shown in this paper. The results indicate that the fitting parameter air entry value (AEV) of the SWCC rises from 13.67 kPa to 40.19 kPa as the depth increases from 3.4 to 51.9 m. And the saturated volumetric water content drops by 10.9%, with a notable SWCC shape difference between the transition and residual zones observed. Additionally, the total porosity of undisturbed loess falls by 12% when the depth increases from 3.4 to 51.9 m, while the macropores and mesopores reduce by 3.6% and 12.1%, respectively. These findings highlight the control of the pore structure on the SWCC and emphasize the correspondence between the SWCC and PSD. The conclusions also illustrate that the compaction effect changes the microstructure characteristics of loess, thereby affecting the soil’s water retention behavior.

1. Introduction

Loess is mainly distributed in arid and semi-arid areas and is a structurally special sediment forming since the Quaternary, with multiple pores, a loose composition, and weak cementation [1,2,3,4]. Loess soils typically exist in an unsaturated state and are highly sensitive to water, resulting in common geologic hazards and geotechnical engineering problems in loess areas, such as landslides, collapses, and ground subsidence often attributed to water-related factors [5]. Because of the deep burial of groundwater in loess areas, surface water must traverse the thick unsaturated loess layer to recharge the groundwater [6,7,8,9,10,11]. Influenced by the sedimentation process and sedimentation age, the density, particle gradation, and pore ratio of undisturbed loess samples at different depths are different, resulting in changes in the microstructures of undisturbed loess samples. The microstructure between the soil particles essentially controls the macroscopic physical and mechanical behaviors of the soil and influences engineering problems related to the hydraulic characteristics [12]. Investigating the unsaturated hydraulic properties of loess, especially at different burial depths, contributes to exploring the water propagation process in thick, stratified loess layer and finding technical solutions for disaster prevention and mitigation.
The SWCC is expressed as the water content (alternatively degree of saturation) versus matric suction and is a quantitative representation of the balanced state between soil moisture and soil energy [13,14,15,16]. The partition of SWCCs is valuable for understanding the behavior and characteristics of soil under different water conditions. According to Vanapalli et al. [17] the SWCC of a soil’s desaturation process is typically divided into three stages, which are delineated by three zones on the drying path of an SWCC: the boundary effect zone, transition zone, and residual zone. These stages are characterized by specific points on the SWCC, namely the air entry value (AEV) and the residual suction: (1) Boundary effect zone: In this zone, the volumetric water content of the sample remains relatively constant with increasing matric suction, indicating that the soil is essentially saturated; (2) Transition zone: Positioned between the AEV and residual suction, the transition zone is dominated by capillary action. Here, as suction increases, the free water in the macroporous space diminishes significantly, and gas gradually replaces the water. The slope of the curve in this zone reflects the soil’s water-retention capacity; (3) Residual zone: This zone is characterized by a relatively low volumetric water content that decreases slowly with increasing matric suction. Water distribution in the sample becomes discontinuous, with adsorption effects influencing water retention in soil.
Many researchers have utilized an SWCC to predict various parameters of unsaturated soil’s behavior, including permeability coefficients, hydraulic conductivity, soil water storage, strength, and more. [18,19,20,21,22,23,24,25,26]. Additionally, an SWCC is instrumental in describing the waterforce–chemical coupling process in unsaturated soil [27]. These prediction parameters are based on the inherent connection between an SWCC and microstructure, especially the PSD. An SWCC is influenced by various factors, such as the soil type [28], soil structure [29,30], stress history and stress state [18], density [31,32], and more. Among these factors, the density, stress history, and stress state alter the SWCC by affecting the soil’s structure [33]. Differences in the soil structure can cause significant variations in the SWCC of natural loess, and even small structural changes can lead to different SWCCs [34,35,36,37,38]. The undisturbed loess samples at different depths have different natural structures, so it is imperative to investigate the relationship between the soil microstructure and hydrological properties. Thus, developing technologies to study soil pore structures and mechanical properties is essential [39,40,41]. In soil structure research, SEM and MIP are commonly employed to analyze the soil pore size, particle geometry characteristics, and pore and particle morphology distributions [39,40]. SEM allows for the visual observation of two-dimensional (2D) images, facilitating the examination of the cross-sectional distribution of pores and particles [41]. Meanwhile, MIP is utilized to study the relationship between PSDs of unsaturated soil and SWCCs, as well as permeability [42,43,44,45]. Despite the growing interest in unsaturated soils over recent decades, limited data on undisturbed soils have been published [46,47]. It is worth acknowledging the existence of various studies focused on the SWCC of loess; however, most of these studies have prioritized compacted specimens, as obtaining undisturbed specimens is both labor intensive and costly. Consequently, further research on the soil structures and SWCCs of undisturbed loess buried at different depths remain a subject requiring exploration and understanding.
This research presents experimental studies on the relationship between the SWCC of the undisturbed loess buried at different depths with the microstructure characteristics. Five sets of undisturbed loess samples at depths ranging from 3.4 to 51.9 m were acquired from the Chinese Loess Plateau. The basic physical properties of the loess samples, such as their dry density, particle size distribution curve, etc., were obtained through indoor testing. On this basis, the SWCCs of undisturbed loess buried at different depths were measured using the HYPROP system. Subsequently, with regard to the microscopic structure of the loess samples, the pore distribution characteristics of the samples were measured using the MIP test. The characteristics of pore morphology and particle contact for loess samples at different depths were obtained using SEM. Finally, the macroscopic SWCC test results and the microstructure characteristics of loess samples at different depths were linked, and the inherent relationship between the pore distribution characteristics and the SWCC of undisturbed loess was explored. The findings of the study can improve our understanding of how the hydraulic characteristics of undisturbed loess change as the burial depth increases. This can aid in predicting and explaining how water moves within thick, stratified loess layers.

2. Materials and Methods
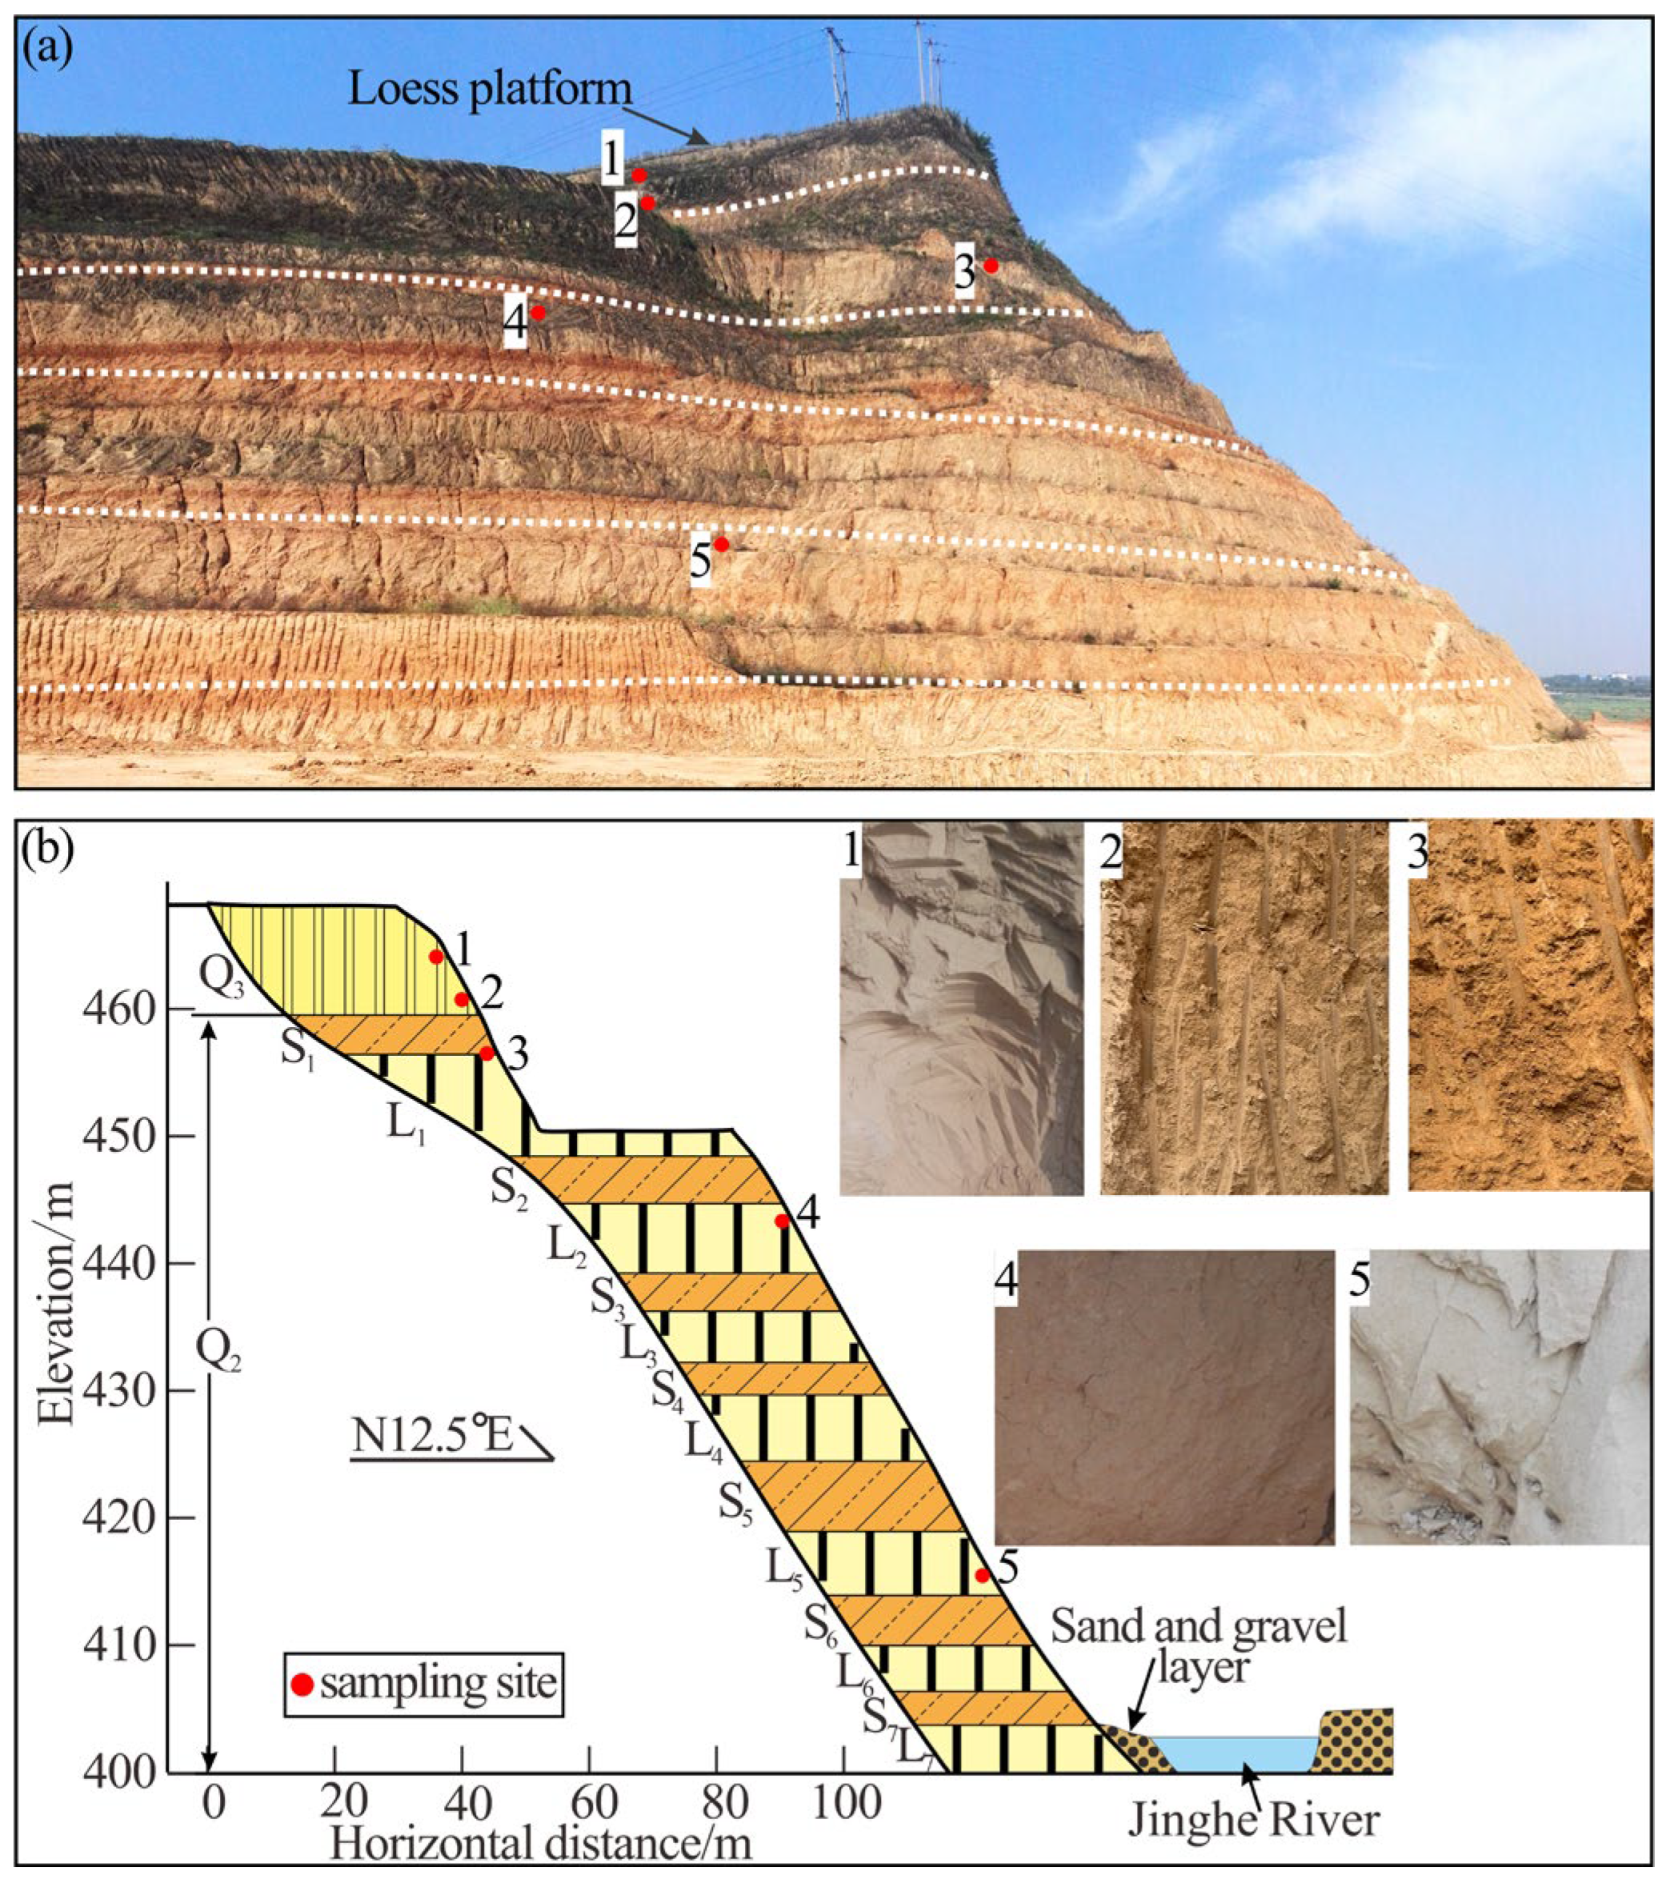
2.1. Materials

The study site was the Jingyang South Loess Plateau, situated in Jingyang County, Shaanxi Province, China. The plateau’s top elevation stands at 468 m, with a height variance ranging from 62 to 90 m and a slope gradient of 50° to 80°. The base of the slope transitions into a river terrace with flat terrain, overlaid with distributed landslide deposits. The sampling location is situated within the loess plateau in Shutangwang Village, Gaozhuang Town (108°49′18″ E, 34°29′33″ N), on the right bank of Jingyang County, approximately 5 km south of the city. As shown in Figure 1a, the sampling profile exhibits a well-defined loess–paleosol layer, characterized by continuous and intact loess layers interspersed with discernible paleosol layers. The soil layer characteristics are distinctly discernible and facilitate easy differentiation. The stratigraphic profile illustrated in Figure 1b displays exposed loess strata comprising Q3 to L7 loess from Q3 to Q2, classified as the Late Pleistocene Malan loess, appearing light yellow with a consistent soil texture. S1 represents a brownish-red paleosol, characterized by calcareous nodules in the upper section and dense, hardened soil in the lower section. Below S1 lies the Middle Pleistocene Lishi loess and the paleosol series, with the Lishi loess exhibiting a grayish-yellow hue and uniform soil texture. The sampling points, indicated by red dots in Figure 1, are located in Shutangwang Village. In order to maximize the retention of the natural structure of the soil samples, we first removed the 0.5 m thick soil from the slope surface, and we employed a 250 cm3 (50 mm high, 80 mm inner diameter) ring knife to extract undisturbed loess samples. Additionally, we collected loose soil in the vicinity of the sampling point to measure the basic physical properties of the loess in the laboratory.
The physical properties of these samples were assessed in the laboratory and are summarized in Table 1. A laser particle size analysis was conducted on soil particles passing through a 2 mm sieve using the Mastersizer 2000. Figure 2 illustrates the cumulative particle size distribution curve and particle size density curve of the loess samples. The particle size density curves of loess soils at different depths exhibit bimodal distributions, with the first peak ranging from 28.28 to 39.91 µm and the second peak from 316.98 to 893.37 µm. The percentages of particle size at the first and second peaks range from 3.66 to 4.58 and 0.96 to 3.61%, respectively. Bimodal particle size distribution soils typically feature two levels of structure: the soil microstructure (the elementary particle associations within the soil aggregates) and macrostructure (the arrangement of the soil aggregates) [46]. Based on the particle size distribution curve, the percentages of various particle sizes of loess at different depths, as well as the control particle size (d60), median particle size (d30), and effective particle diameter (d10) of each sample, were determined. Additionally, the coefficient of curvature (Cc), calculated as (d30·d30)/(d10·d60), and the coefficient of uniformity (Cu), calculated as d60/d10, were derived. Table 1 demonstrates that the loess exhibits good gradation at various depths.

2.2. SWCC Measurement

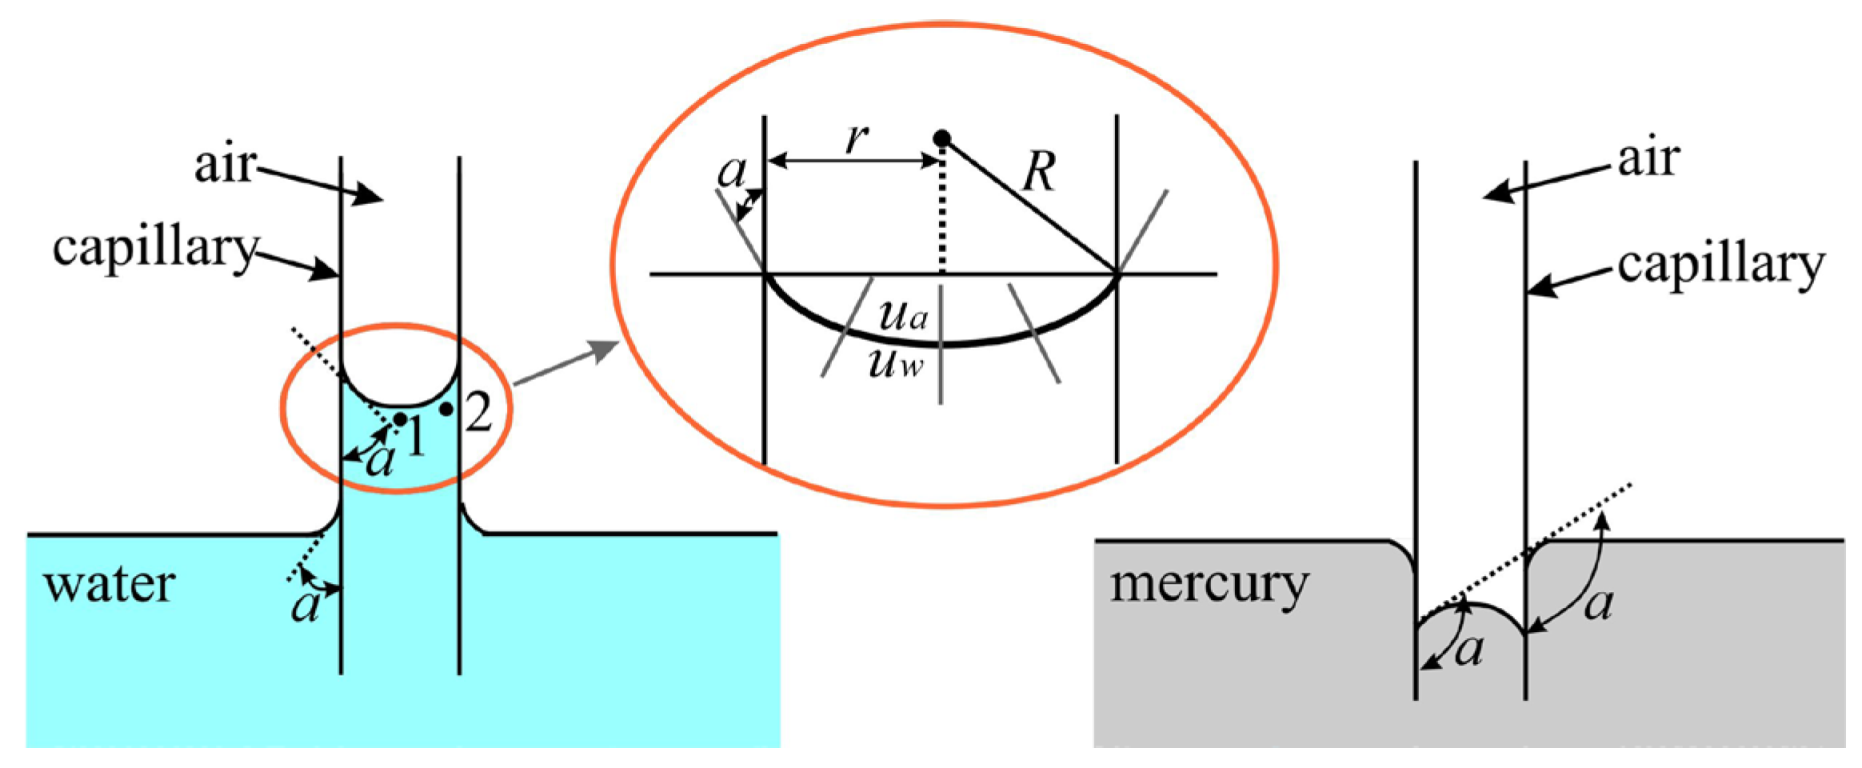
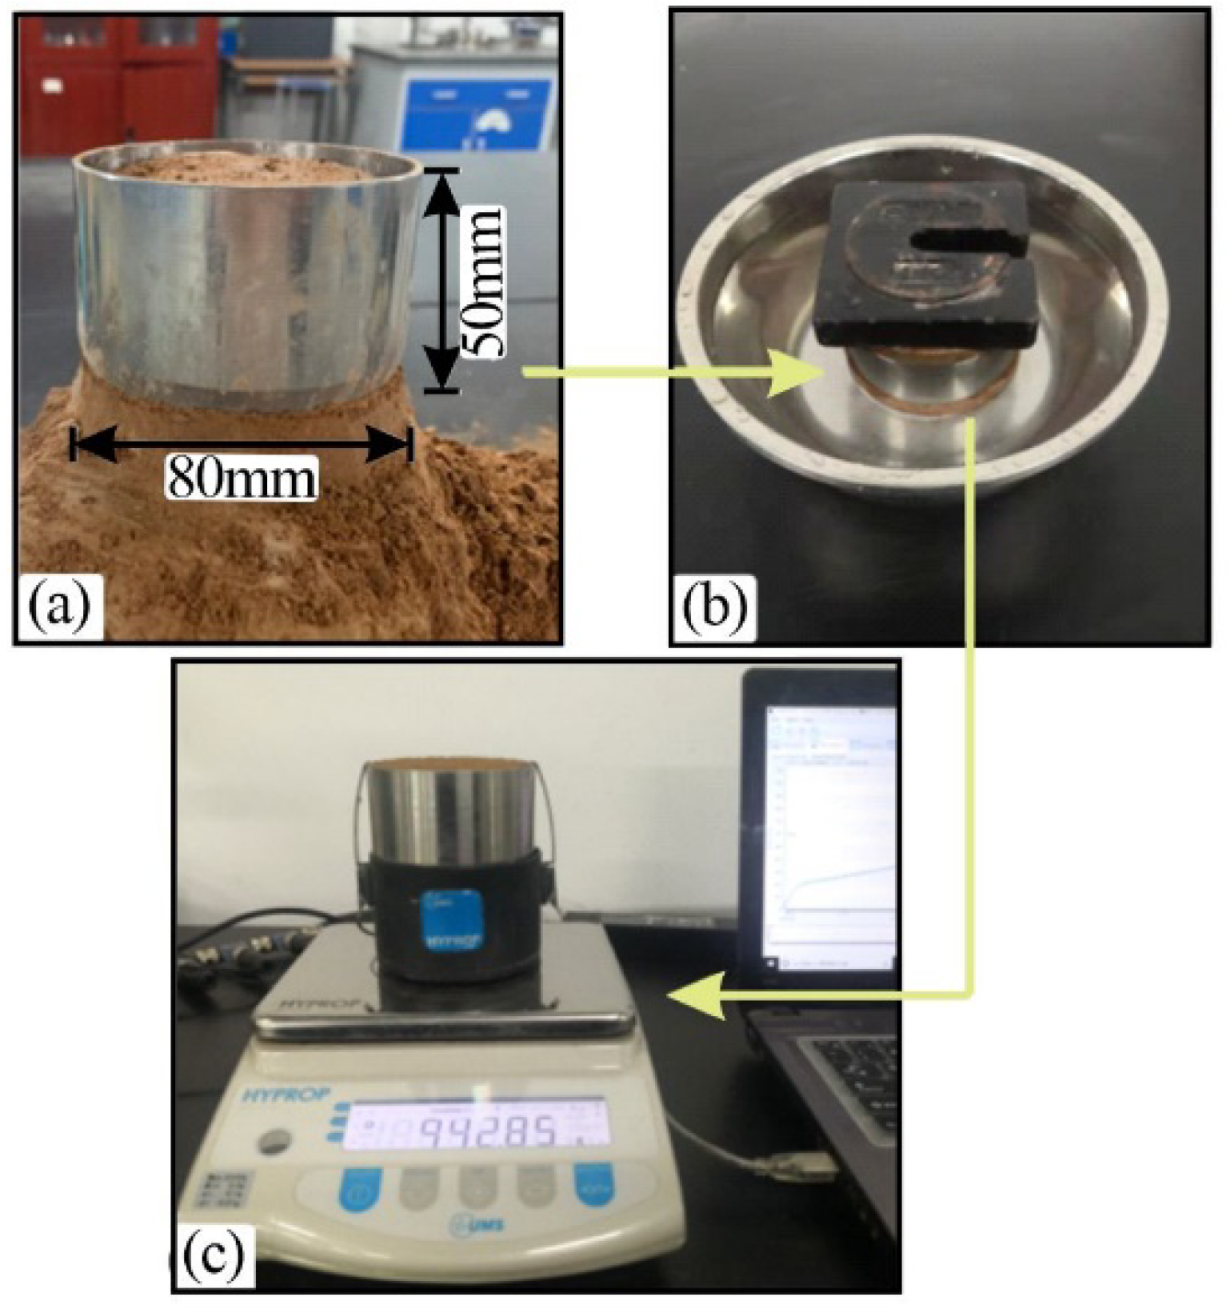
2.2.1. Test Apparatus

The measurements of the SWCCs for the undisturbed loess samples were conducted using the HYPROP system developed by the METER Group. The HYPROP system mainly consists of the soil sample, sensor unit, and a high-precision electronic balance. The soil sample intended for testing may be in either a remolded or undisturbed condition. The sensor unit consists of two tension shafts positioned at depths of 12.5 mm and 37.5 mm, respectively. The matric suction can be measured within a scale of 0–100 kPa with an accuracy of ±0.05 hPa. The high-precision electronic balance with a weighing range of 0–2200 g and weight accuracy of 0.01 g is designed to monitor sample mass changes during the evaporation process. The matric suction of soil at a depth of 25 mm is equal to the mean of the recorded matric suction levels at elevations of 12.5 mm and 37.5 mm, which in accordance with the linear hypothesis posited by Schindler (1980) [48]. Meanwhile, the volumetric water content of soil at the midpoint (i.e., at a depth of 25 mm) can be ascertained by considering the evaporation mass of the saturated sample at that specific moment, which is in accordance with the principle of saturated evaporation proposed by Peters and Durner (2008) [49]. Using the difference method, the corresponding matric suction and volumetric water content were obtained at different time points and depths. Utilizing the HYPROP system for SWCC determination offers several advantages, including simple operation, short test cycles, modular expansion capability, simultaneous measurement of up to 20 samples, and non-perturbed measurement of the sample, allowing natural evaporation to establish the sample’s SWCC.

2.2.2. Experimental Process

The SWCCs of the five sets of undisturbed loess samples at different depths were measured using the HYPROP device along the drying path. The test procedure is illustrated in Figure 3.
The specific steps involved in measuring the SWCC using the HYPROP system are as follows: Initially, the procedure involved preparing and saturating the undisturbed loess samples. The ring knife was pressed into the soil block to make the loess sample while ensuring the potential gaps between the side wall of the ring knife and the sample was filled with Vaseline. A layer of filter paper and permeable stone was placed at the top and bottom of the ring knife sample, and the assembled sample was immersed in degassed water to naturally saturate. The ring knife sample was weighed at regular intervals until the weight no longer changed, indicating that the sample was fully saturated. The subsequent procedure involved saturating the tension shafts and the sensor unit, with the ceramic cup of the tension shafts being filled with degassed water. The third stage involved the compilation of the saturated soil specimen within the HYPROP system. An auger was used to drill holes in the soil sample for the tension shafts while ensuring the tension shafts’ proper alignment with the sample holes and fixing the soil sample in place with clips. Subsequently, we proceeded by positioning the tension unit and sample onto the balance for automated weighing and initiated the test. The final step to measure the SWCC with HYPROP was to monitor the evaporation process of the undisturbed loess sample. The variation in the value of matric suction with the volumetric water content was monitored using HYPROP-VIEW software https://metergroup.com/products/hyprop-2/ (accessed on 11 April 2024). Once the tension value began to decrease, signifying the end of the test, the sample was extracted from the sensor unit, and the weight of the dry soil sample was ascertained using a drying method. In general, these procedures guarantee the precise determination of the SWCC through the utilization of the HYPROP system, thereby offering reliable information on soil moisture attributes and hydraulic behaviors.

2.3. PSD Measurement

The PSD of undisturbed loess samples was determined using Mercury Intrusion Porosimetry (MIP), a commonly employed method for measuring the pore structure and pore volume of materials [50,51,52,53,54]. The instrument used for MIP testing in this study was an Auto Pore V 9600 mercury intrusion meter, which has a low-pressure measurement range of 0.34 to 1.38 kPa, permitting detailed data to be collected over a large pore size range. The maximum pressure is 455.14 MPa, and the measurable pore diameters are 0.003–1100 µm. During the test, the laboratory temperature is maintained at 20 °C, and good ventilation conditions are maintained. The procedural steps were as follows: (1) the undisturbed loess sample, previously measured for SWCC, was cut into 10 × 10 × 10 mm cubes, freeze dried, and their weights were recorded; (2) a selected expansion meter was placed into the dried sample, sealed, weighed, and the weight of the expansion meter assembly was input; (3) the expansion meter was installed at the low-pressure station for analysis, removed after completion, and the components were reweighed; and finally, (4) we proceeded to the high-pressure station for further analysis, saving the data and cleaning the components after completion.

2.4. SEM Tests

SEM is a micro-morphological observation method that is somewhat between optical microscopy and transmission electron microscopy. It allows for direct micro-imaging of sample material properties and is an essential instrument for studying the soil microstructure. SEM was employed to obtain planar microscopic images of the undisturbed samples. The operational steps were as follows: (1) the sample was cut into a cylinder with a diameter of 10 mm and a height of 10 mm and freeze dried; (2) a gold coating was applied to the dried undisturbed sample; (3) the gold-coated sample was placed under a SEM for observation and photography, enabling the examination of the microstructure of the undisturbed loess sample at different resolutions.

3. Results and Discussion

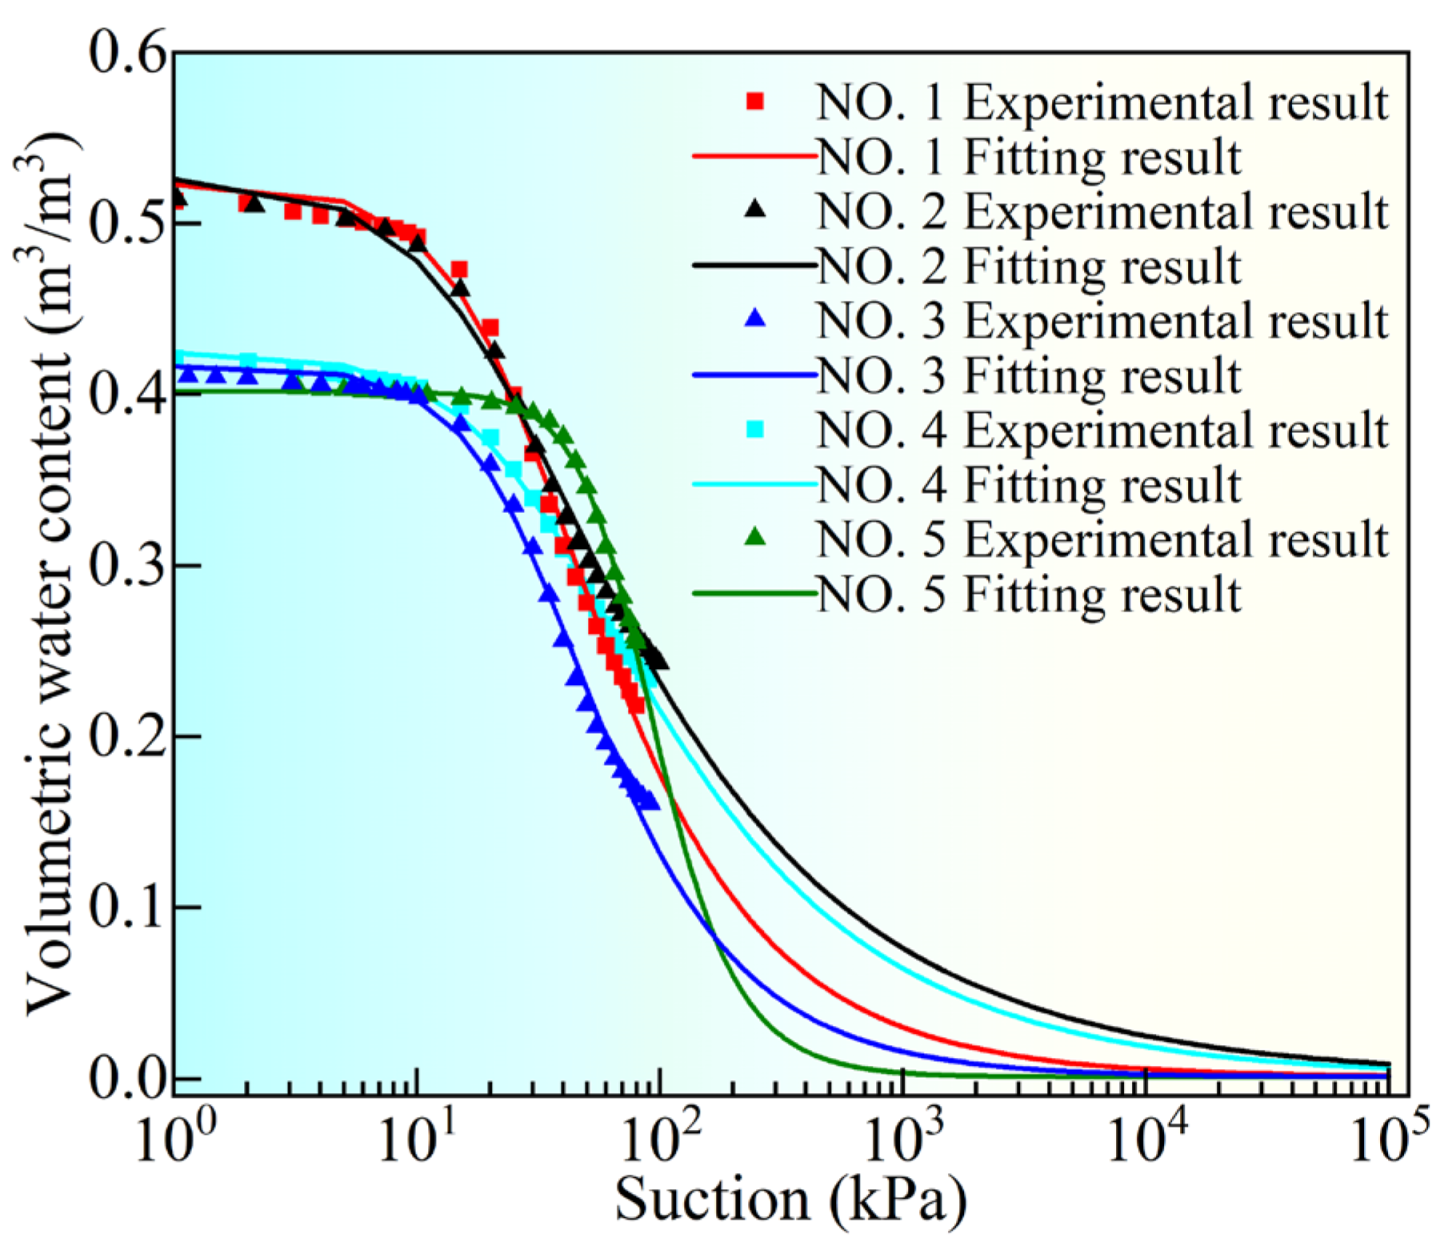
3.1. SWCCs of Undisturbed Loess Samples

The SWCCs of undisturbed loess samples at various depths are presented in terms of the volumetric water content (Figure 4). To provide a quantitative representation of the SWCCs, the experimental data points were fitted using mathematical models. The commonly utilized models in this study include the Van Genuchten (VG) model [55], Fredlund and Xing model [56], and Brooks and Corey model [57]. The VG model has been demonstrated to effectively describe and predict the continuous water tension relationship of undisturbed Jingyang loess under full matric suction values [58]. Fredlund et al. [56] proposed that when the matric suction of the soil equals 106 kPa, the water content of the soil is 0. Thus, we employed the VG model with our experimental data, assuming a residual water content of 0.001 for fitting purposes, to illustrate the relationship between the matric suction and volumetric water content across the range of 0 to 9×10⁵ kPa. The VG model fitting equation is as follows:
θ ( ψ ) = ( θ s θ r ) [ 1 + ( a | ψ | ) n ] 1 n 1 + θ r
where θ s is the saturated volumetric water content; θ r is the residual volumetric water content; α and n are the VG model fitting parameters; and ψ (kPa) is the matric suction of the sample.

3.1.1. SWCCs of the Undisturbed Loess Samples Buried in the Same Layer

Samples NO. 1 and NO. 2 represent undisturbed loess samples buried at different depths within the same layer. The comparison of their SWCCs, as depicted in Figure 4, highlights the significant influence of the burial depth on the slope of the transition zone. This slope is indicative of the soil’s water retention capacity, with a smaller slope indicating better water retention.
Table 1 reveals that deeper soil burial results in a higher dry density. However, it is noteworthy that the slope of sample NO. 1 is larger than that of sample NO. 2, suggesting that the slope of the SWCC transition zone is not solely determined by the dry density. Factors such as the soil’s plasticity index and fine particle content play a crucial role in shaping the SWCC morphology [59,60]. The plasticity indices of samples NO. 1 and NO. 2 are 13.24% and 15.30%, respectively (Table 1). It is observed that the slope of the SWCC decreases with an increase in the plasticity index [59]. Additionally, the fines contents are 73.22% and 88.50%, respectively. A higher fines content enhances the soil’s water retention ability and reduces the slope of the SWCC transition zone. Despite the slight difference in the dry density between NO. 1 and NO. 2 and their similar pore ratios, the saturated volumetric water contents of the SWCC samples remain essentially the same.

3.1.2. SWCCs of Undisturbed Loess Samples Buried in Different Layers

Samples NO. 2 to NO. 5 represent undisturbed loess samples buried at gradually increasing depths in different layers. The analysis of the SWCCs (Figure 4) reveals that the burial depth significantly influences the AEV, saturated volumetric water content, and slope of the transition zone. A deeper burial results in a higher dry density and a smaller cumulative pore ratio, limiting the water accommodation space and consequently reducing the saturated volumetric water content. The AEV, indicative of the matric suction when gas invades the maximum pore during drying, increases with deeper burial due to larger pore diameters facilitating gas entry. Interestingly, the slope of the transition zone does not exhibit consistent trends with the depth. This discrepancy is attributed to variations in the particle size composition and plasticity index of the loess at different depths [51,59]. Thus, the slope of the transition zone is influenced not only by the burial depth (dry density) but also by the soil’s particle size composition and plasticity index.
The VG model parameters for the five sets of undisturbed loess samples at different depths are presented in Table 2. The VG model effectively captures the measured SWCC, with the deviation parameter R2 exceeding 0.99 for all samples, indicating a strong fit. Figure 5a,b illustrate the variations in parameters α and n, respectively, in regard to the dry density. Parameter α decreases with an increasing dry density, while parameter n initially decreases and then increases with the dry density. The trend observed for parameter α aligns with the findings of Shen et al. (2021) [61], who established a quadratic relationship between parameter α and the dry density.

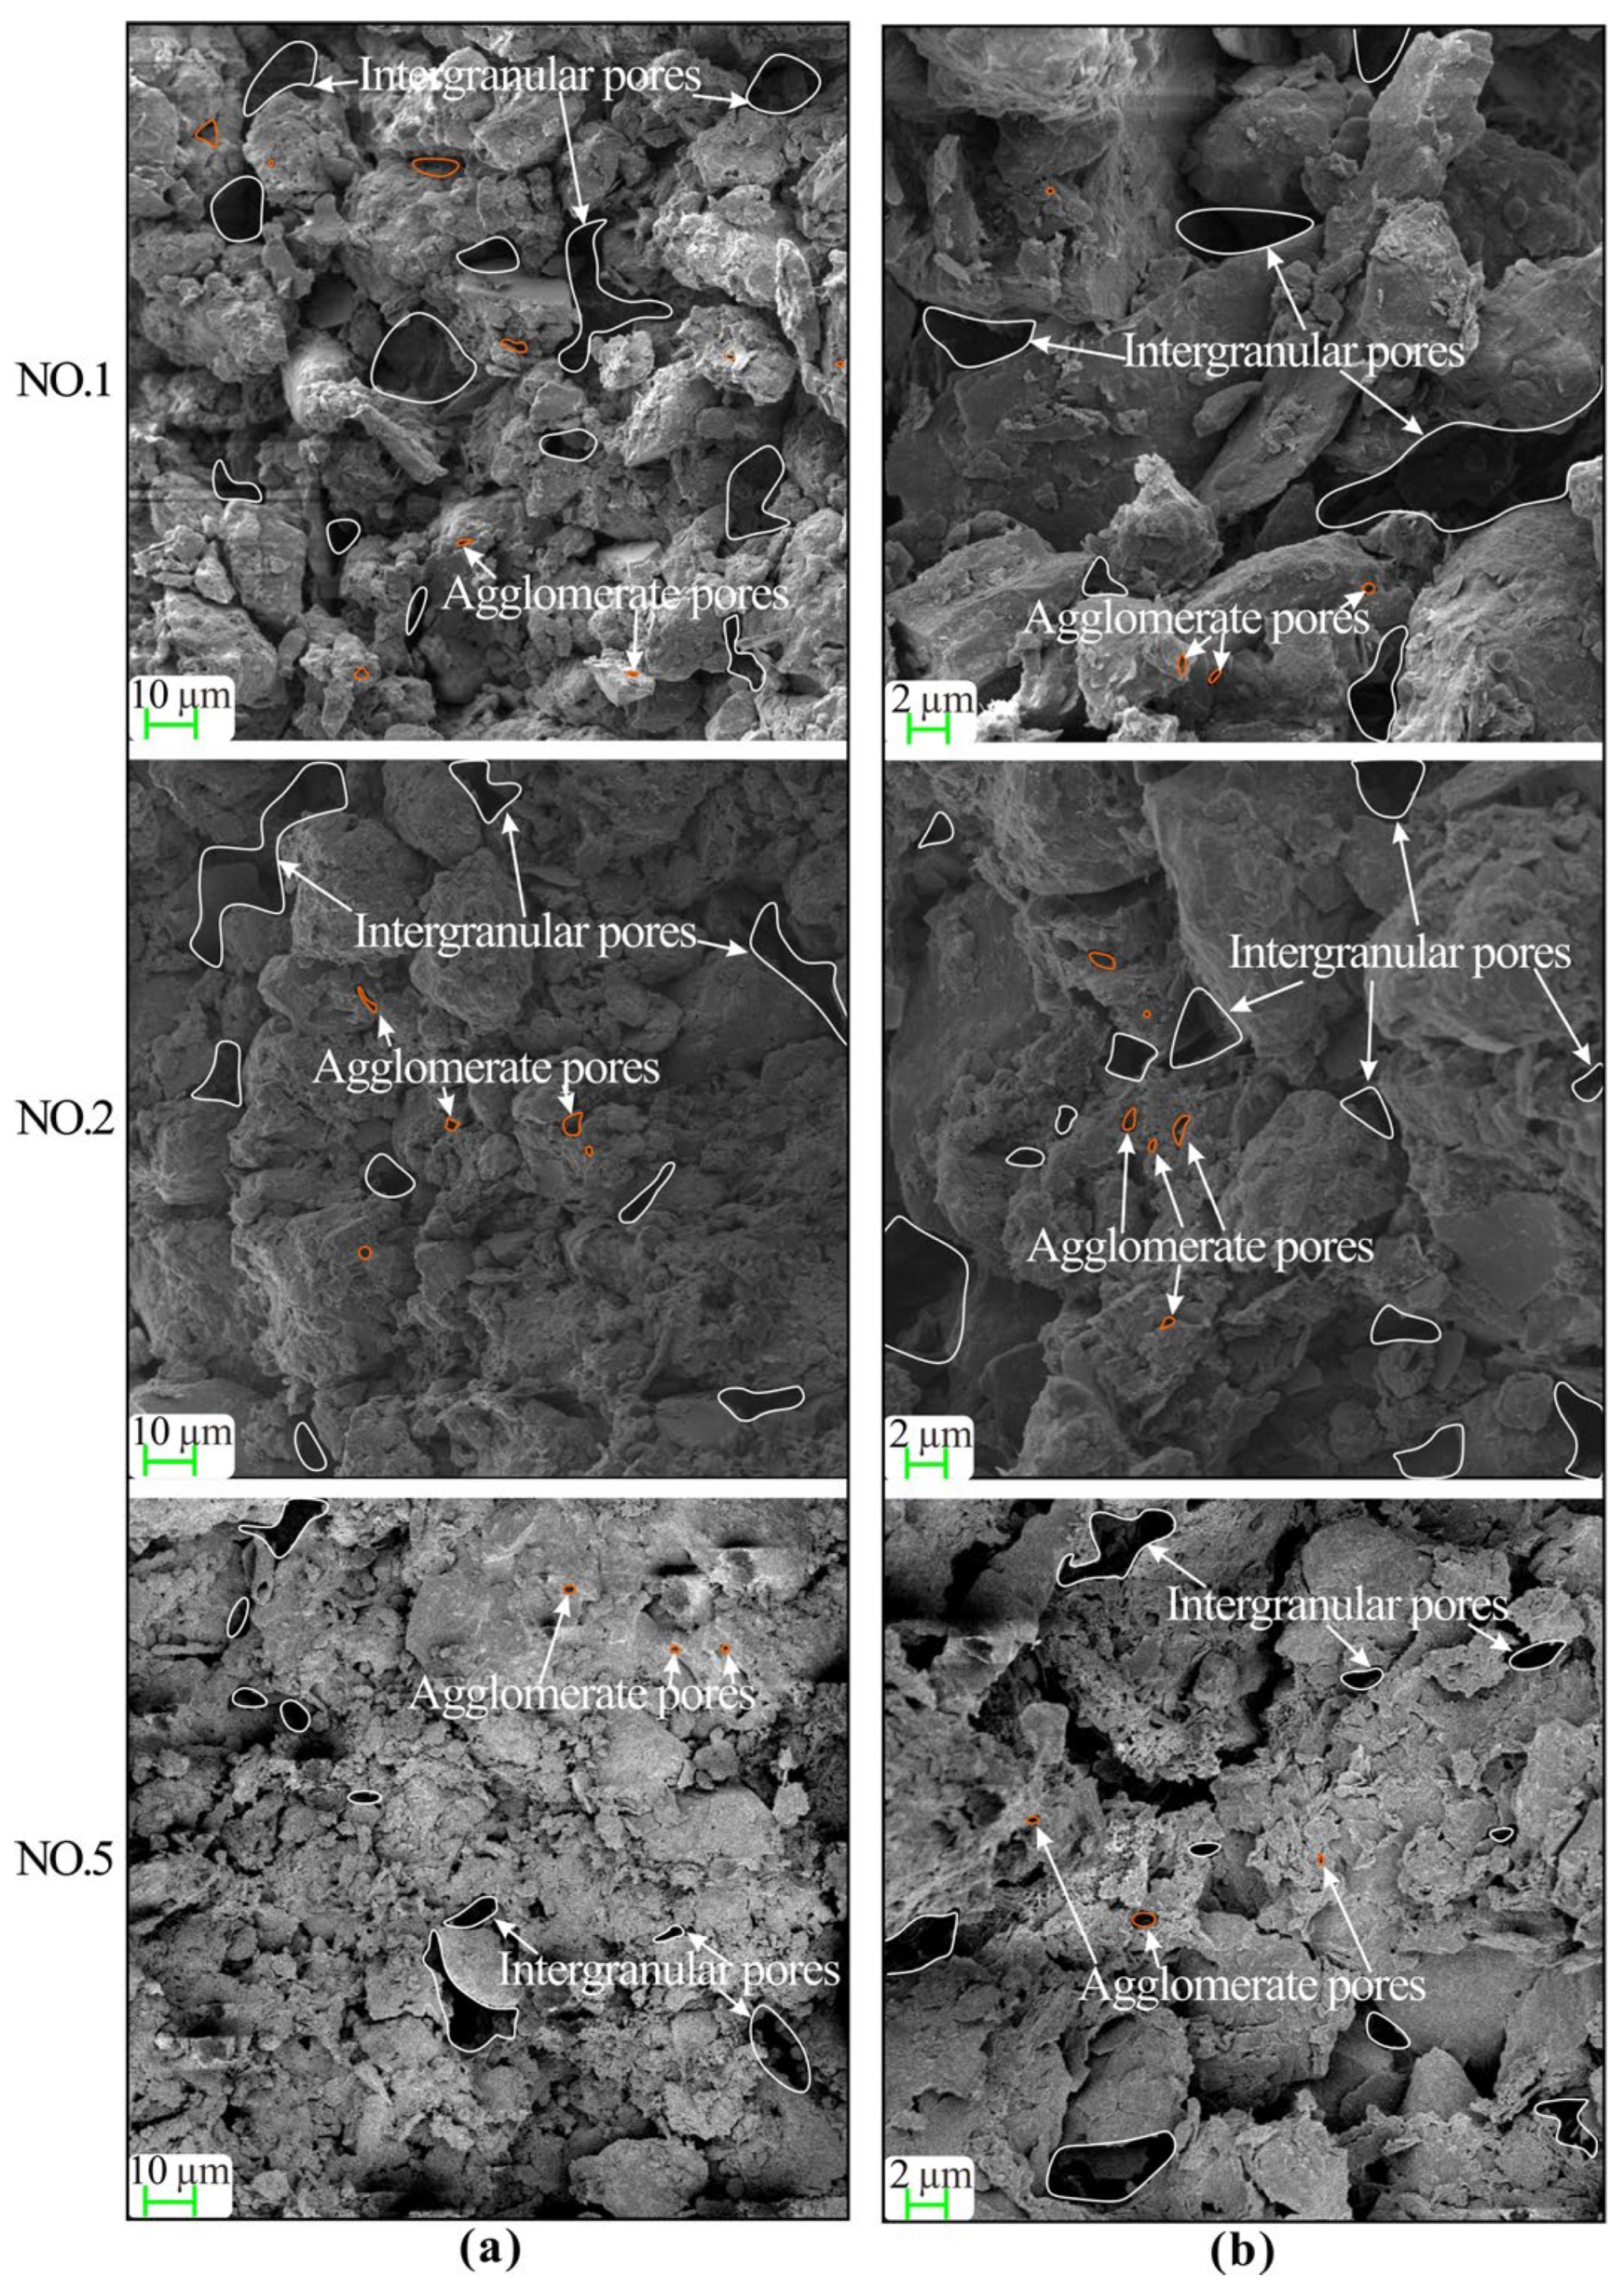
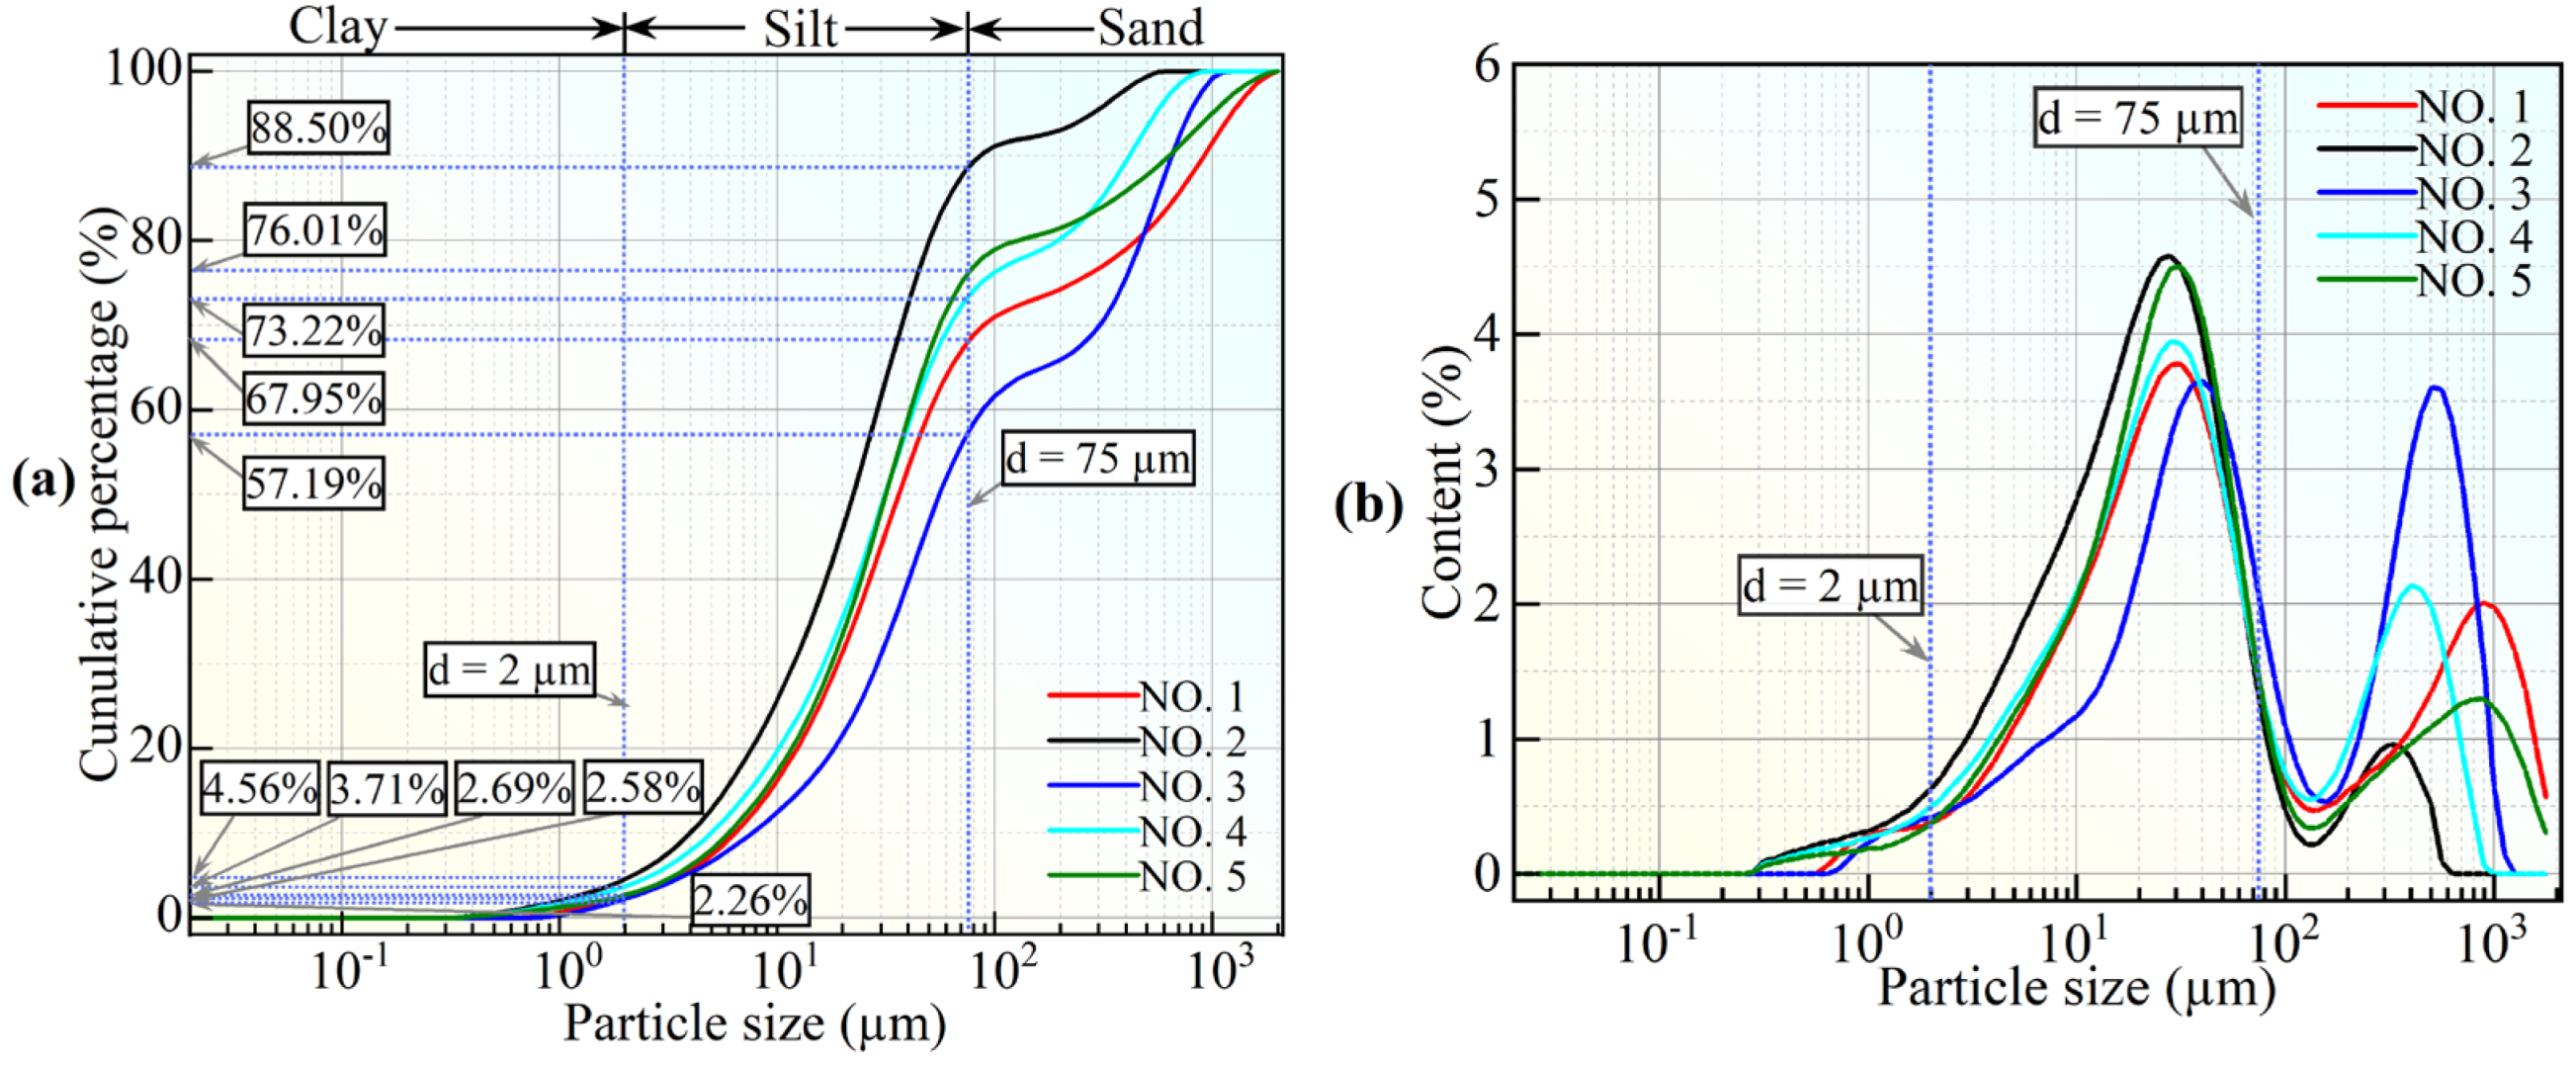
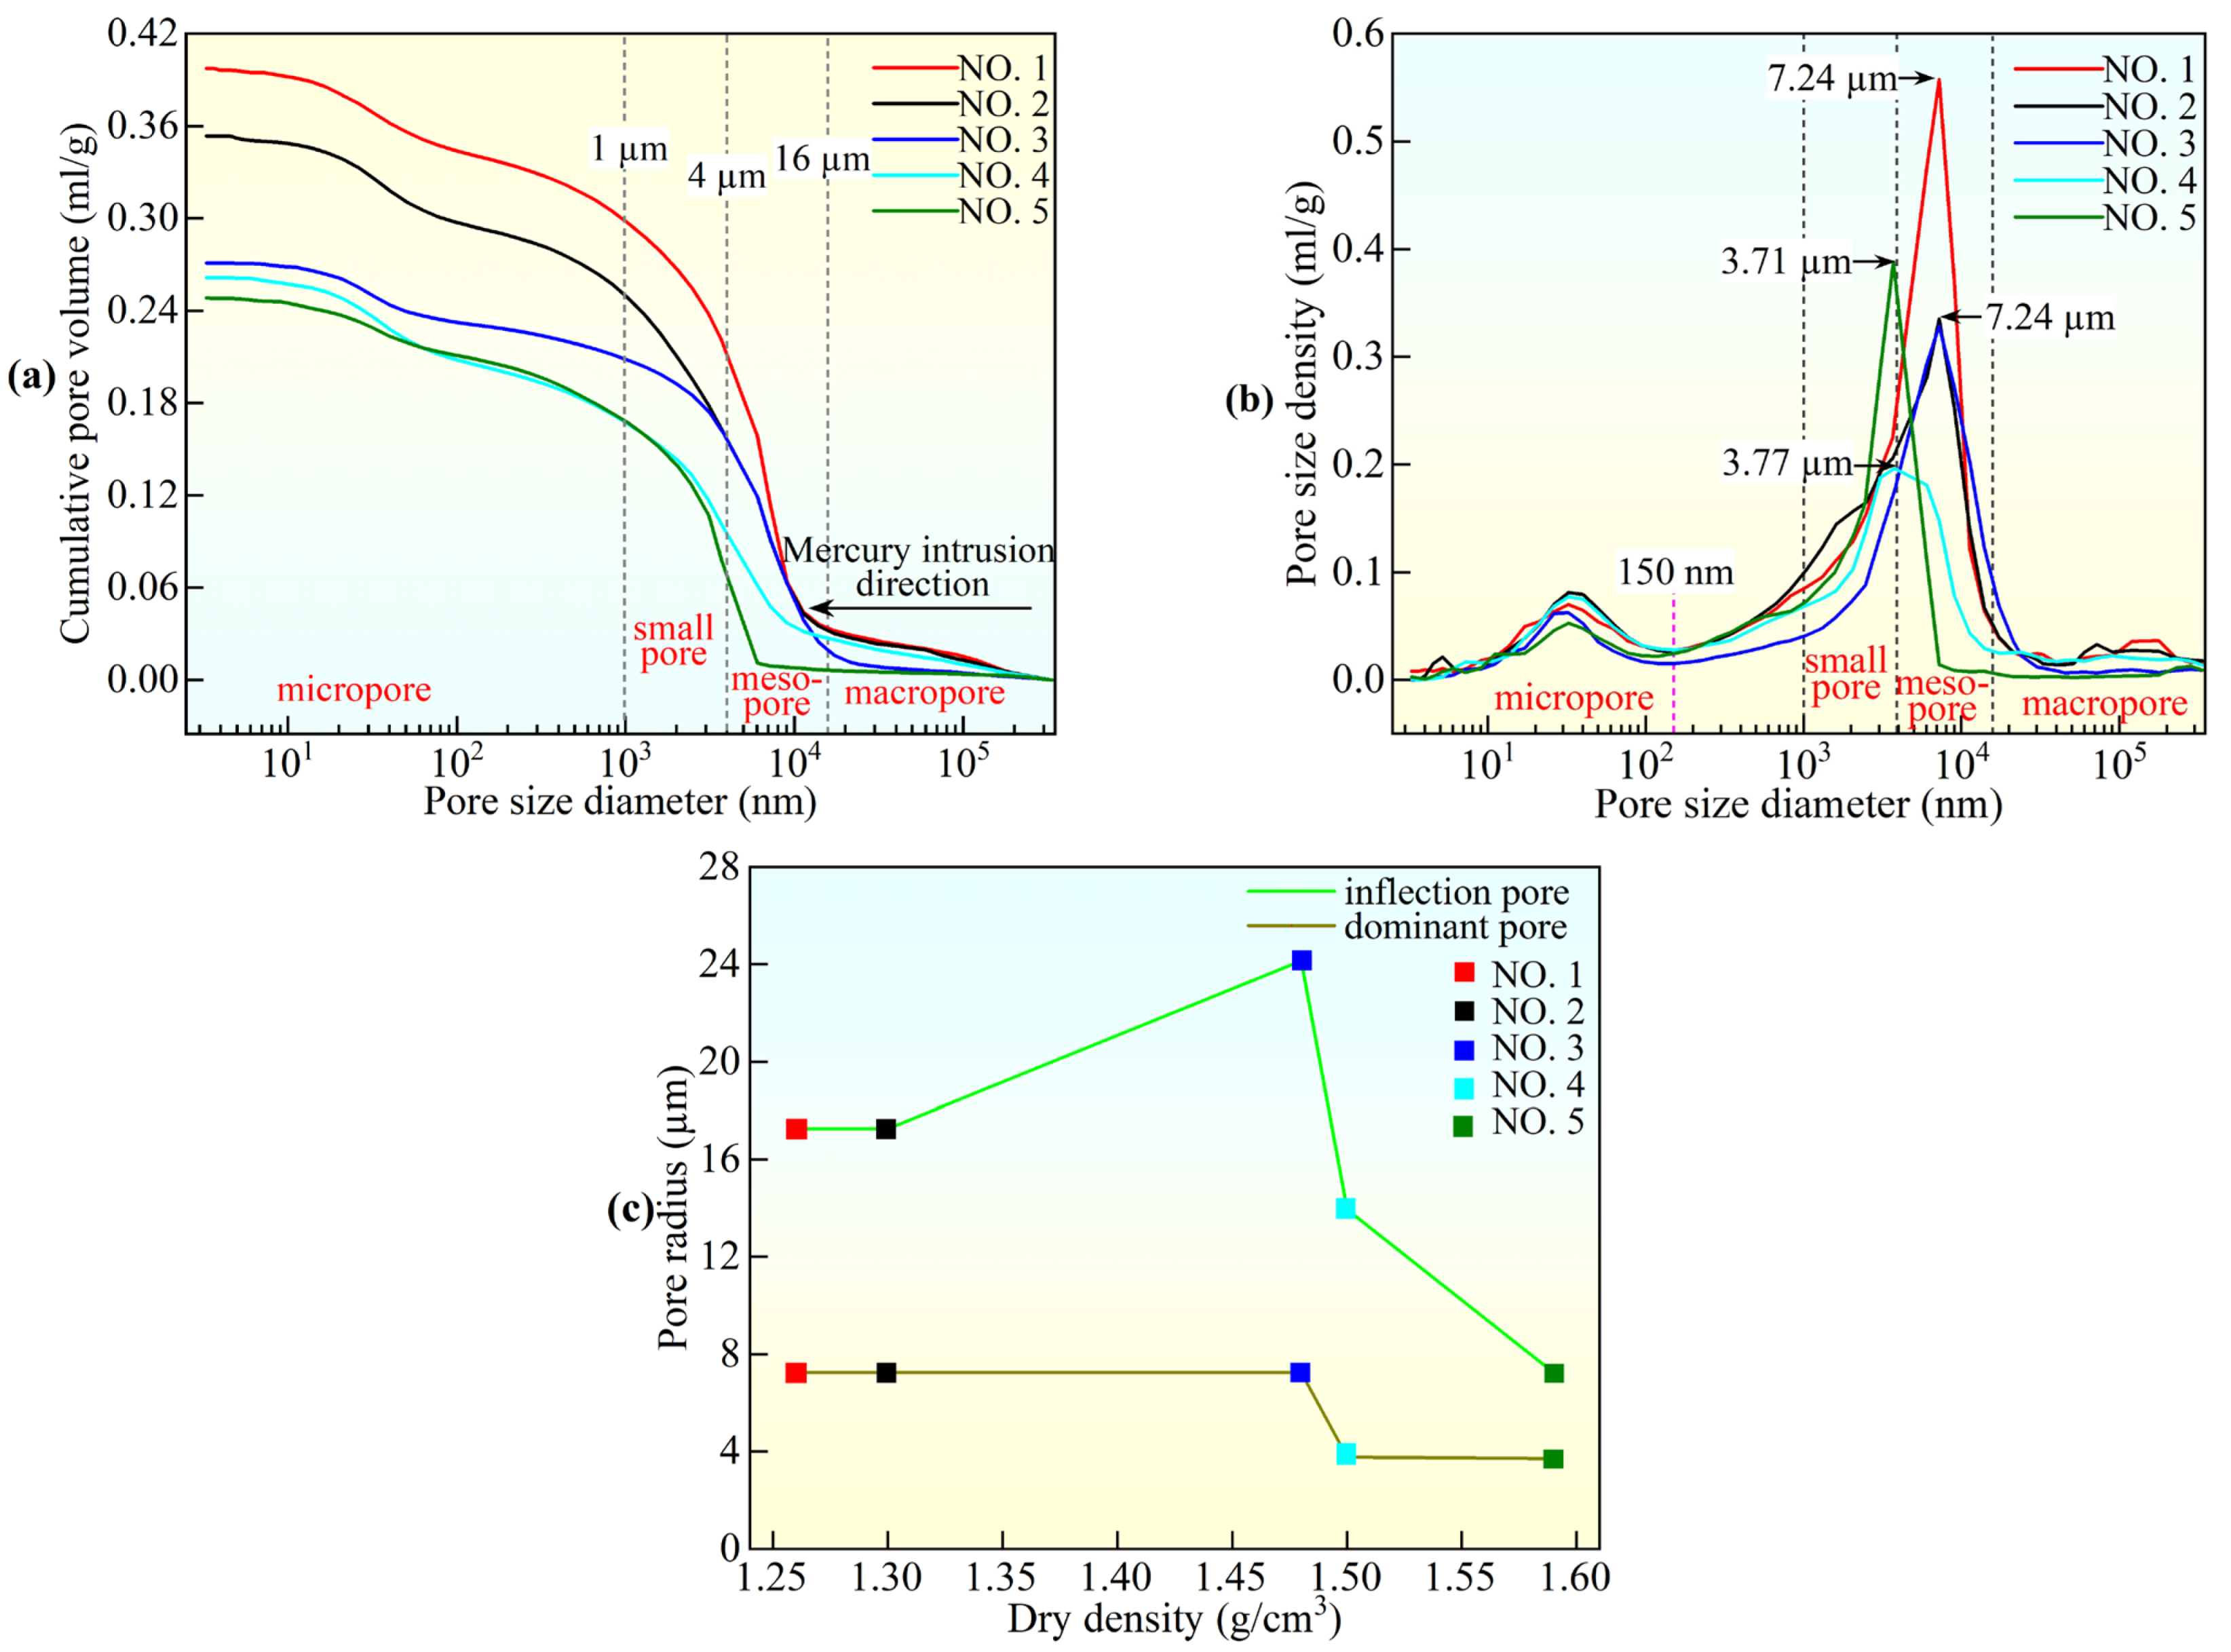
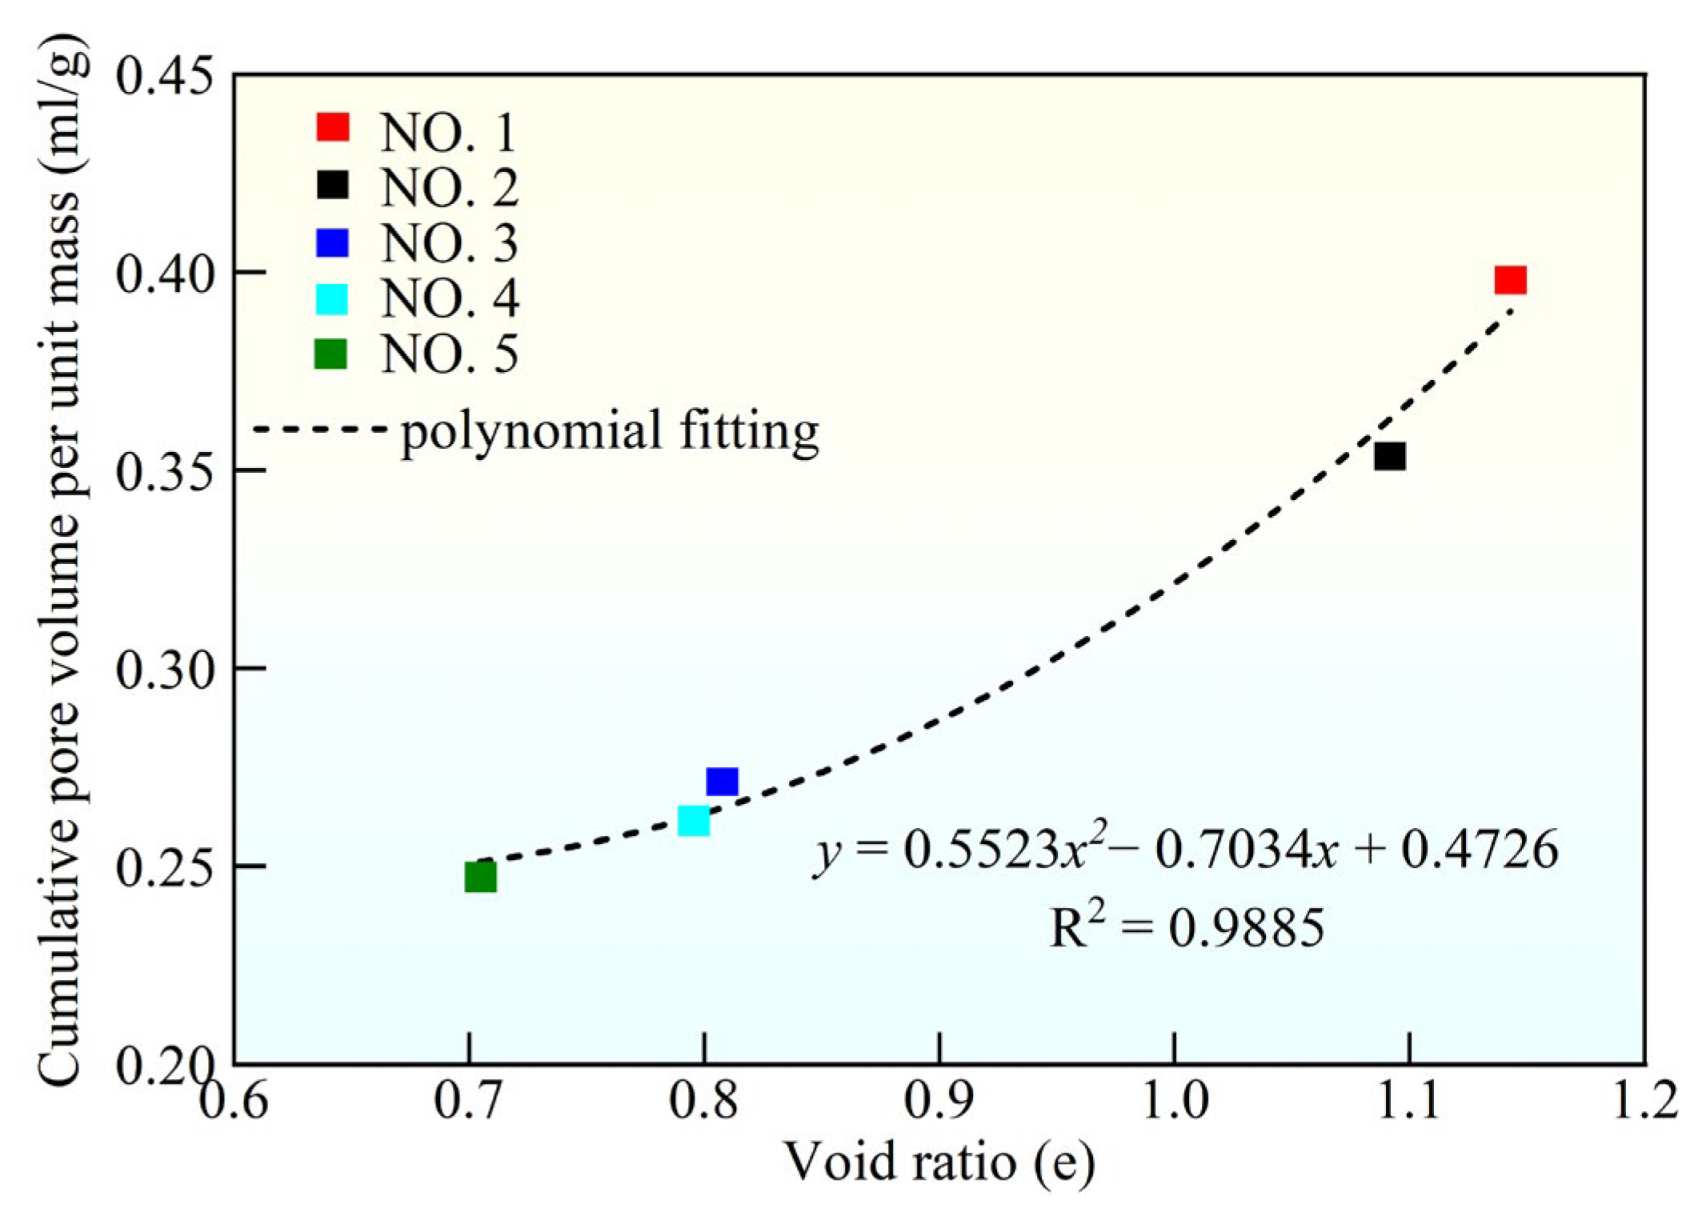
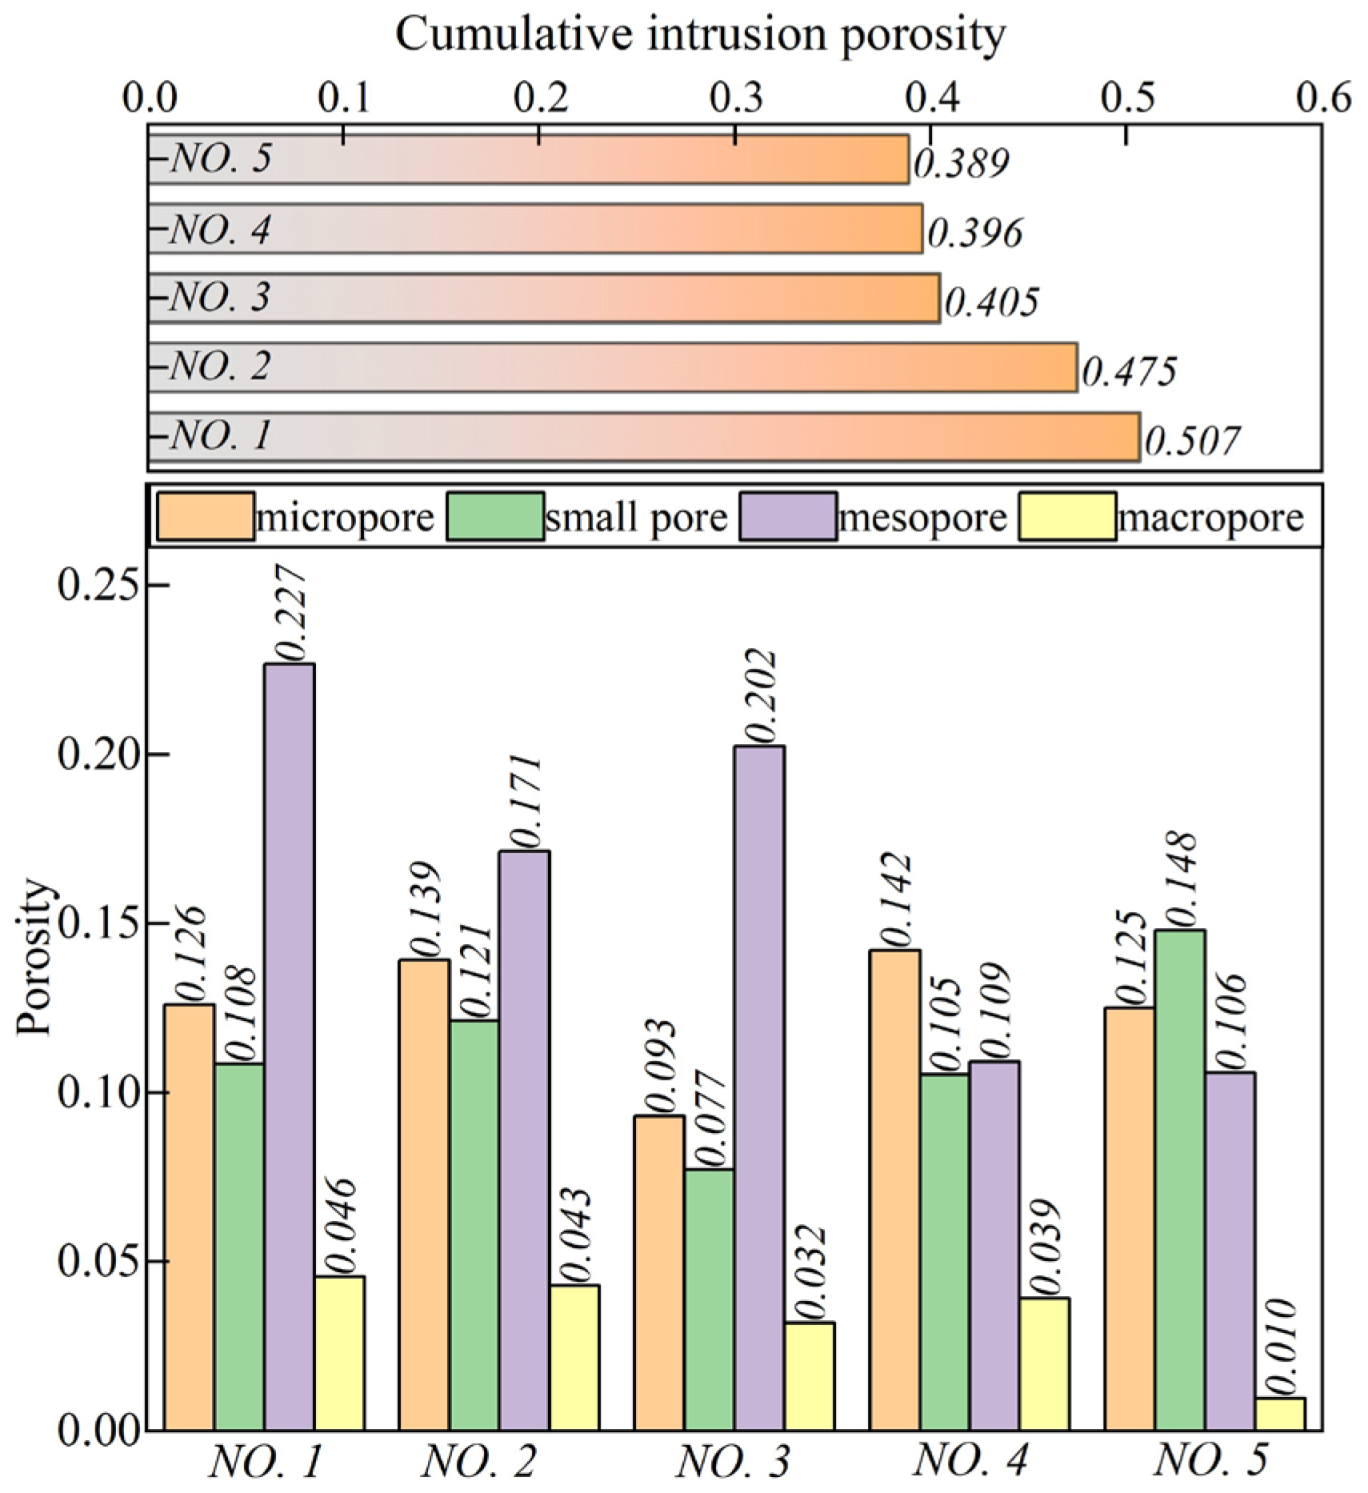
3.2. Pore Structure and PSD Characteristics

In this study, we examined undisturbed loess samples NO. 1 and NO. 2 from the same layer, as well as NO. 5 from a deeper layer (Figure 1). The SEM images obtained at magnifications of 500× and 1000× for these samples are shown in Figure 6. The images reveal particles of varying sizes loosely arranged, predominantly comprising angular debris particles with some sheet-like aggregates. Granular particle agglomerates are also evident, indicating the presence of aggregates. Particle contacts are mainly indirect or surface to surface, with fewer edge-face contacts and minimal point contacts. Pores of different sizes and shapes are observed between the soil particles. The comparison of the SEM images between NO. 1 and NO. 2 reveals that NO. 1 predominantly contains inter-aggregate or shelf pores between coarse particles, indicating better connectivity. This corresponds to a larger dominant pore diameter and higher pore distribution density in the PSD curve. NO. 2 exhibits a similar microstructure to NO. 1 but with smaller inter-aggregate pores.
Figure 7a and b illustrate the representation of the pore size distribution curve using the cumulative pore size volume and pore size density distribution curves, respectively.
Figure 7b illustrates that the PSDs of the five sets of undisturbed loess samples at various depths exhibit bimodal characteristics, indicating the presence of two families of pores within the samples. This bimodal distribution arises from the elementary units constituting the structure of undisturbed loess samples, primarily clay aggregates and clay–silt aggregates formed under electrostatic attraction and capillary attractions, as well as van der Waals forces. These aggregates, which form the skeleton structure of undisturbed loess, contribute to its double-layer pore structure, comprising the microstructure and macrostructure [62,63,64]. Pores within aggregates are classified as intra-aggregate pores, while those between aggregates are termed inter-aggregate pores, which have a bounding pore size of approximately 150 nm (Figure 7b).
To facilitate the analysis of PSD changes due to burial depth variations, this study classifies undisturbed loess pores into four categories based on their radius, following the criteria proposed by Lei (1988) [65]: micropores (d ≤ 1000 nm), small pores (1000 nm < d ≤ 4000 nm), mesopores (4000 nm < d ≤ 16,000 nm), and macropores (d > 16,000 nm) (Figure 7a,b). The comparison of cumulative pore volume curves (Figure 7a) reveals a steep increase followed by a gradual increase in the mercury intrusion curves for undisturbed loess samples at different depths, with a subsequent significant decrease in the cumulative mercury intrusion amount and pore range as the burial depth increases.
As depicted in Figure 7c, inflection points for NO. 1 and NO. 2 are at 17.3 μm, while those for NO. 3, NO. 4, and NO. 5 are 24.1 μm, 13.9 μm, and 7.2 μm, respectively. Generally, the pore size at the inflection point decreases with an increasing burial depth. Notably, the dominant pore diameter corresponding to the larger peaks of NO. 1, NO. 2, and NO. 3 is 7.24 μm, categorized as a mesopore, while NO. 4 and NO. 5 exhibit dominant pore diameters within the range of small pores, at 3.77 μm and 3.71 μm, respectively.
For samples NO. 1 and NO. 2 from the same layer but different depths, the inflection pore sizes are 17.26 μm and 7.24 μm, respectively, consistent with the dominant pore sizes. However, NO. 4 and NO. 5 display inflection pore sizes of 13.94 μm and 7.24 μm, with dominant pore sizes of 3.77 μm and 3.71 μm, respectively. Interestingly, NO. 3 exhibits an inflection pore size of 24.14 μm, aligning with NO. 1 and NO. 2, indicating consistency in the dominant pore sizes, except for NO. 3, which experiences a different depositional and pedogenic environment at the junction of loess and paleosol.
Figure 8 demonstrates that the cumulative pore volume increases with the porosity, showing a quadratic growth relationship between the cumulative pore volume and void ratio. Figure 9 provides a comparison of the porosity of micro-, small, meso-, and macro-pores in undisturbed loess samples at different depths, revealing a gradual decrease in total porosity with an increasing burial depth, measured using MIP. Specifically, the meso- and macropore contents of four undisturbed loess samples, excluding NO. 3, decreased with an increasing burial depth. Notably, although NO. 5 was buried deeper, its small pore content exceeded that of the other four undisturbed samples, indicating a higher burial depth impact on meso- and macropores compared to micro- and small pores.
The porosity (n) represents the ratio of the total pore volume to the total volume of the soil sample, while the effective porosity (ne) indicates the ratio of effective pore volume (total volume minus closed pore volume) to the total sample volume. The porosity corresponding to the cumulative intrusion rate of MIP represents the effective porosity (ne). Additionally, Figure 9 summarizes the cumulative intrusion porosity (effective porosity, ne), while Table 3 provides an overview of the pore parameters for the five undisturbed loess samples to analyze the pore measurement characteristics using MIP. It is observed that the ne measured using MIP is lower than the n obtained through laboratory tests (Table 3), which is attributed to insolated and constricted pores, in addition to pores with a diameter outside the range of 3 nm to 360 µm, which cannot be intruded by mercury [53,54,62].
The effective porosities (ne) measured using MIP for the five sets of undisturbed loess samples ranged from 41.33 to 53.33%, all of which were smaller than the actual porosities. To express the extent of mercury intrusion into soil pores, the effective rate of mercury intrusion (φ) is calculated as the ratio of the effective porosity (ne) to the porosity (n) obtained using MIP. It was observed that the effective rate of mercury intrusion for the five undisturbed loess samples exceeded 89%. Specifically, the effective rate of mercury intrusion for NO. 1 and NO. 5 exceeded 94%, while for NO. 2 and NO. 3, it was around 91%, and for NO. 4, it was less than 90%. Compared with the literature, the effective porosity of undisturbed loess at a natural moisture content was higher than that of compacted loess samples at the same dry density [64].

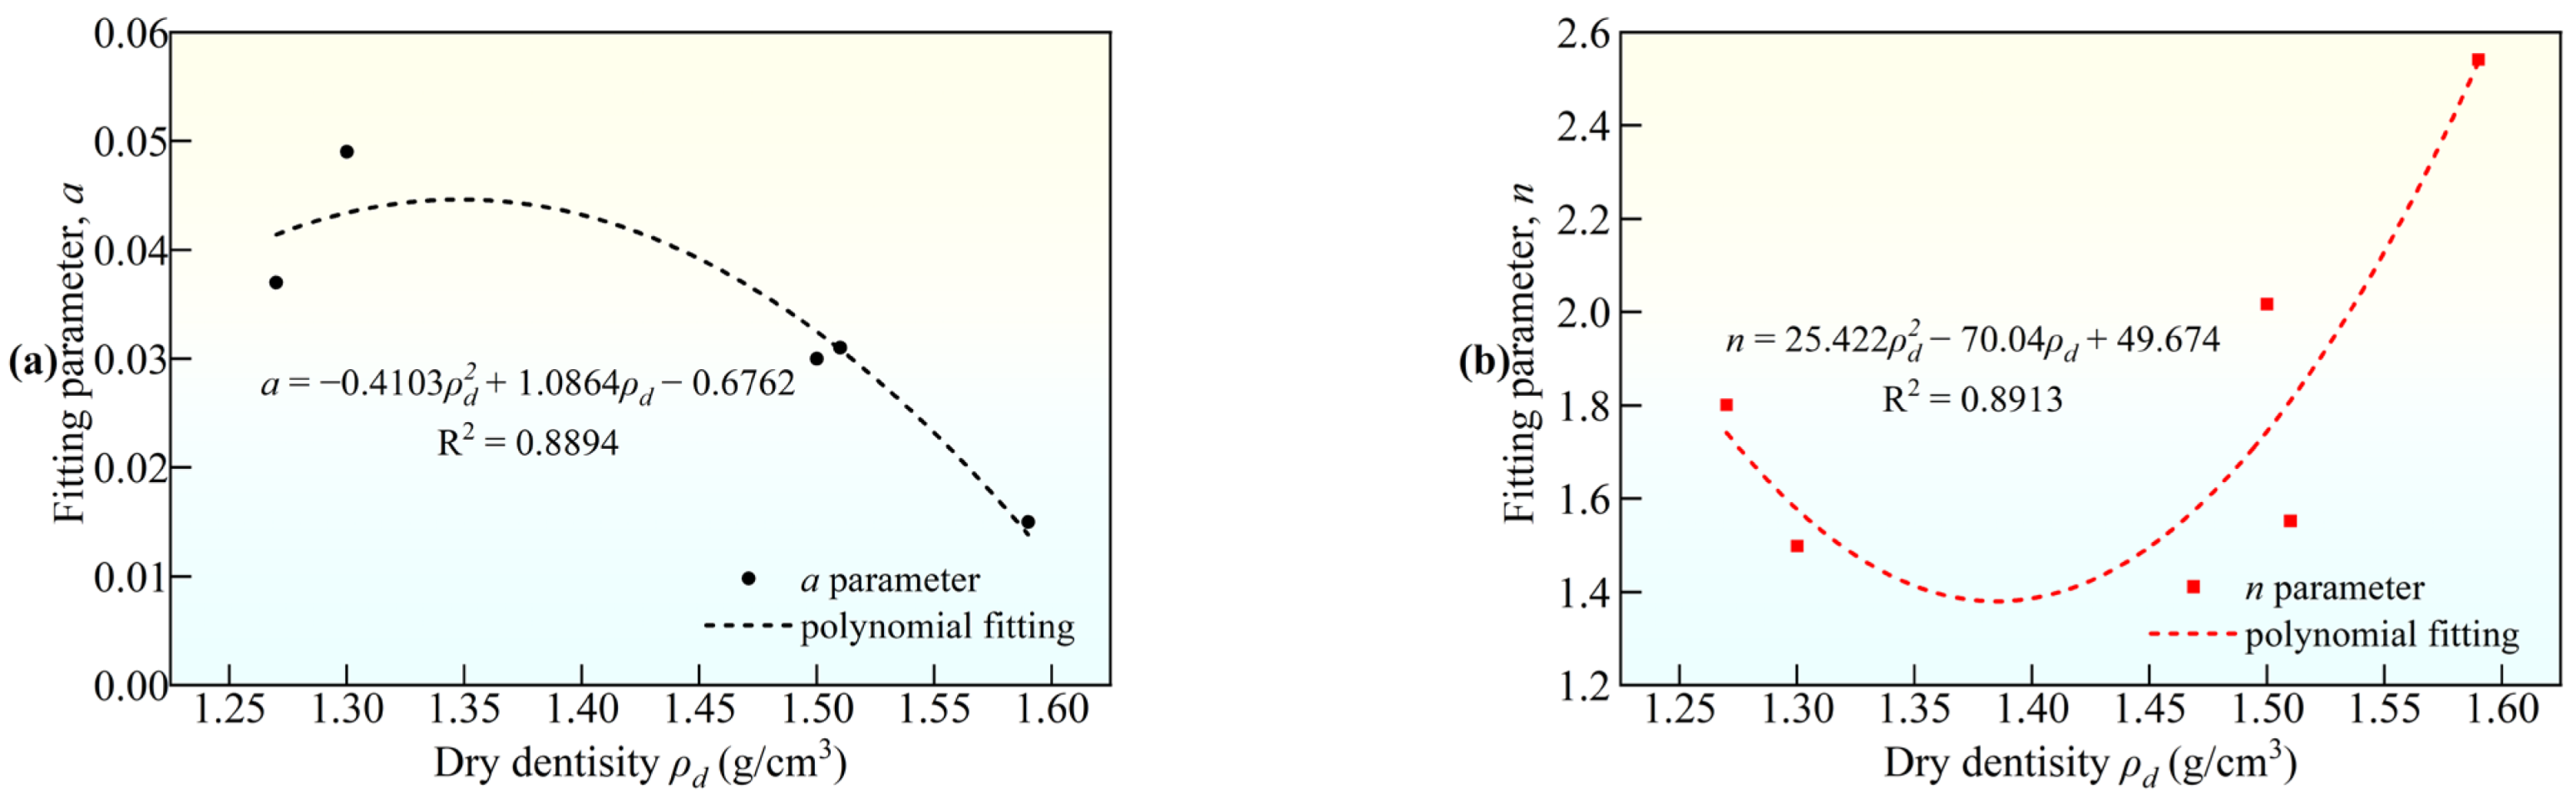
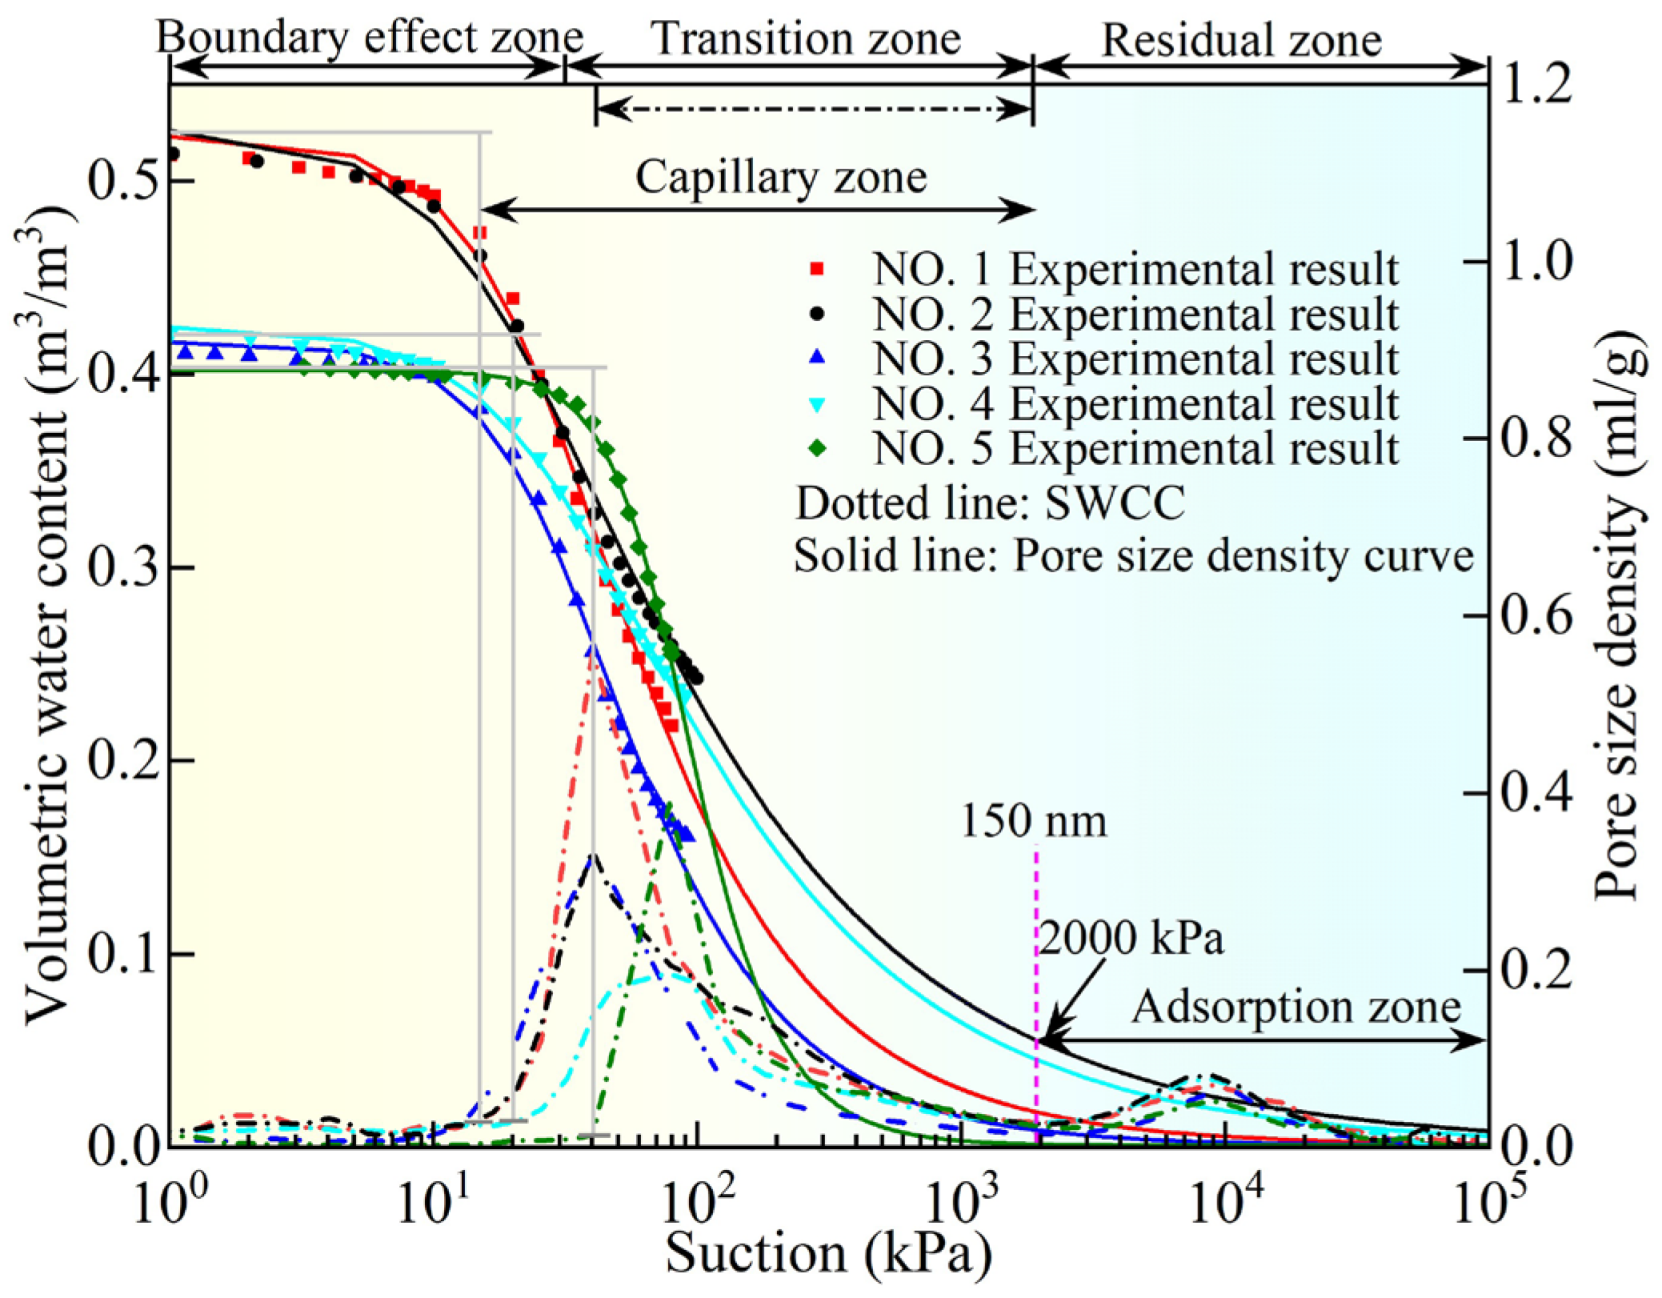
3.3. Response of SWCCs to Pore Structure

In unsaturated soil, a pressure difference exists at the air–water interface, often conceptualized using an equal diameter capillary model, as depicted in Figure 10. Capillary midpoints 1 and 2, situated at the radius of curvature R, have identical water pressures. The pressure differential at the interface can be expressed as:
u a u w = 2 T s R = 2 T s cos a R
where ua is the pore–air pressure (kPa); uw is the pore–water pressure (kPa); uauw is the matric suction (kPa); Ts is the surface tension of the liquid phase; and asw is the wettability contact angle. The curvature radius R is determined using the constraint radius r and the liquid–solid contact angle a; a is an intrinsic property, with a wetting contact angle asw for soil–water that is often taken as 0°–90°, while asm for soil–mercury is a repulsive contact angle, often taken as 130°–140°. Assuming that the matric suction in soil is generated by capillary action, and the pore radius is equal to the capillary radius, the matric suction can be calculated by the pore radius.
The relationship between the PSD and SWCC can be elucidated by converting the pore radius to matric suction using Equation (2). This conversion allows for an analysis in the same coordinate system, facilitating comparison. In Figure 11, there is a notable alignment between the PSD and SWCC for the five undisturbed loess samples. The inflection point of the PSD corresponds to the air entry value (AEV) of the SWCC, while the first dominant peak section of the pore density corresponds to the steep decline segment in the SWCC. Conversely, the low valley section of the pore density aligns with the gentle section of the SWCC. This correspondence reflects the dynamic process of water occupying the pores during desaturation. As the matric suction increases, water gradually discharges from the pores, with larger pores losing water more rapidly. Upon reaching the AEV, capillary action dominates in small pores and mesopores, leading to a rapid decrease in the volumetric water content. Capillary action in this zone is inversely proportional to the capillary radius: smaller pores exhibit a stronger capillary action, slower water loss rates, and higher water holding capacities. Consequently, the soil enters the unsaturated residual zone, where the pore water mainly exists as bound water due to strong bonding with soil particles. Here, the volumetric water content is minimally affected by matric suction. This analysis underscores the intricate relationship between the pore structure, capillary action, and water retention properties in unsaturated soils. It demonstrates how changes in matric suction impact water movement and storage within soil pores, highlighting the importance of understanding the soil’s pore structure for predicting the water behavior in various environmental conditions.
Figure 11 illustrates that the total area of the pore size distribution (PSD) curve and the X-axis governing the upper boundary of the soil–water characteristic curve (SWCC). A larger area indicates a higher saturated volumetric water content. Notably, the saturated volumetric water content decreases with an increasing burial depth for the five undisturbed loess samples. Moreover, the dominant pore range dictates the range of the transition zone in the SWCC. A larger pore size range results in a broader transition zone and a longer desaturation path. This relationship is evident in the order of NO. 1 > NO. 2 > NO. 3 > NO. 4 > NO. 5, where the transition zone range decreases with an increasing burial depth. Therefore, variations in the pore size distribution influence the shape and extent of the transition zone in the SWCC, ultimately affecting the water retention properties of the soil.
Specifically, the dominance of specific pore sizes plays a crucial role in determining how water behaves within the soil structure. Pores that fall within the range of the dominant pore sizes exert a strong influence on the movement and retention of water due to capillary action. Soils with a greater proportion of dominant pores typically demonstrate higher levels of volumetric water content. This characteristic is clearly illustrated when comparing samples NO. 1 and NO. 2, which display elevated saturated volumetric water contents in comparison to the other samples.
The distribution and morphology of dominant pores within undisturbed loess samples significantly impact their water retention characteristics. Specifically, water molecules residing within these dominant pores are strongly influenced by capillary action. Consequently, a higher proportion of dominant pores tends to correspond to a higher volumetric water content. For instance, samples NO. 1 and NO. 2 exhibit a greater saturated volumetric water content compared to the other samples, indicative of their higher concentration of dominant pores. Moreover, the strength of the capillary action can vary significantly among different dominant pores. In soils with bimodal dominant pores, the variation in capillary action results in five distinct transition zones with different slopes, as observed in Figure 11. This indicates the complex interplay between the pore size distribution and water retention behavior.
The water molecules within the range of dominant pores are significantly affected by the capillary action, and the more dominant pores present, the higher the volumetric water content. For example, the saturated volumetric water contents of NO. 1 and NO. 2 are higher than those of the other three sets of samples. The strength of the capillary action produced by different dominant pores varies greatly, and the soil with bimodal dominant pores exhibits five transition zone with different slopes (Figure 11). Due to the different distribution of dominant pores and morphology in the micropore range of the five sets undisturbed loess samples at different depths, their SWCC morphologies in the residual zone are different. The dominant pore content in the NO. 2 aggregate is the highest, so its residual volumetric water content is greater than those of the other four sets of samples.
Combined with the SEM images of the undisturbed loess shown in Figure 7, the results reveal that while the variation in pore size within the aggregates remains relatively small with an increasing burial depth, the connectivity of pores decreases notably. Samples NO. 1, NO. 2, and NO. 3 predominantly feature small pores as dominant pores, while NO. 4 and NO. 5 exhibit dominance in mesopores. This discrepancy in the dominant pore distribution leads to significant differences in the capillary action within the soil matrix.

4. Conclusions

In this study, we conducted an investigation into the SWCCs and microstructures of undisturbed samples buried at varying depths (samples NO. 1 to NO. 5 at depths of 3.4 m, 8.5 m, 13.2 m, 25 m, and 51.9 m). The SWCC data were obtained using the HYPROP device, while a microstructural analysis was carried out using SEM and MIP. Our findings provide valuable insights into the influence of the burial depth on the SWCC and pore size distribution characteristics. The following conclusions can be drawn:
  • The soils buried at different depths exhibited similar grain compositions, with all loess samples showing bimodal particle size density distribution curves. This bimodal distribution indicates the presence of two hierarchical structures within the soil’s microstructure and macrostructure. A deeper burial resulted in a higher dry density, and the saturated volumetric water content of the undisturbed loess decreased by 10.9%, and the AEV increased from 13.67 to 40.19 kPa. Additionally, the suction range of the transition zone decreased, exhibiting different slopes.
  • As the burial depth of the loess increased from 3.4 to 51.9 m, the SEM and MIP tests indicated a decrease in connectivity pores with an increasing depth, resulting in a decrease in ne from 50.69 to 38.88%: a total reduction of 11.81%. The PSD curves of all loess samples exhibit bimodal characteristics, corresponding to intra-aggregate pores within aggregates and inter-aggregate pores between aggregates, with a boundary at 150 nm. The intra-aggregate pores show little variation, while there are significant differences in the inter-aggregate pores. The content of macropores (d > 16,000 nm) decreased by 3.6%, the content of mesopores (4000 nm < d ≤ 16,000 nm) decreased by 12.1%, while the contents of small pores (1000 nm < d ≤ 4000 nm) and micropores (d ≤ 1000 nm) showed minor changes.
  • It is crucial to emphasize that the SWCCs of undisturbed loess at various depths were predominantly controlled by the pore size distribution. Specifically, the total porosity controls the saturated volumetric water content of the SWCC. The number of dominant pores or the peak point of the PSD curve governed the SWCC desaturation mode. The inflection pore of the PSD curve along the mercury intrusion direction corresponded to the AEV of the SWCC. The range of dominant pores determined the transition zone of the SWCC, while the size of the dominant pores determined the slope of the transition zone curve. Furthermore, the micropores distribution determined the morphology of the residual zone of the SWCC. These findings underscore the pivotal role of the pore structure in governing the soil’s water retention behavior.
  • Combining the macroscopic SWCC test results and microstructure characteristics of undisturbed loess samples buried at different depths, it can be concluded that the soil’s water retention behavior is strongly affected by the soil’s compaction effect. The larger the burial depth of the soil, the higher the dry density, which leads to a decrease in the total porosity of the soil, resulting in a decrease in the number of macropores and mesopores in the soil structure. This affects the morphological characteristics and model fitting parameters of the soil’s SWCC, resulting in differences in the water holding capacity of the soil. Therefore, when analyzing the propagation process of water in thick loess layers, it is necessary to fully consider the influence of the soil burial depth.

Author Contributions

Conceptualization, F.D.; Data curation, Y.T. and Z.Z.; Formal analysis, Y.T. and Z.Z.; Funding acquisition, F.D.; Methodology, F.D.; Project administration, F.D.; Writing—original draft, Y.T.; Writing—review and editing, Y.T., F.D., Z.Z., J.Z. and W.C. All authors have read and agreed to the published version of the manuscript.

Funding

This work was supported by the Huaneng Group Technology Project (No. HNKJ22-H107), the Yunnan Province Major Science and Technology Special Plan (No. 202202AF080004), and the Second Tibetan Plateau Scientific Expedition and Research (STEP) Program (No. 2019QZKK0905).

Data Availability Statement

The raw data supporting the conclusions of this article will be made available by the author Ye Tan on request.

Conflicts of Interest

Author Wei Cheng was employed by the company PowerChina Kunming Engineering Corporation Limited. The remaining authors declare that they have no known competing financial interests or personal relationships that could have appeared to influence the work reported in this paper.

References

  1. Dijkstra, T.A.; Wasowski, J.; Winter, M.G.; Meng, X.M. Introduction to geohazards of Central China. Q. J. Eng. Geol. Hydrogeol. 2014, 47, 195–199. [Google Scholar] [CrossRef]
  2. Nan, J.J.; Peng, J.B.; Zhu, F.J.; Ma, P.H.; Liu, R.; Leng, Y.Q.; Meng, Z.J. Shear behavior and microstructural variation in loess from the Yan’an area, China. Eng. Geol. 2021, 280, 105964. [Google Scholar] [CrossRef]
  3. Gao, L.; Shao, M. The interpolation accuracy for seven soil properties at various sampling scales on the Loess Plateau, China. J. Soils Sediments 2012, 12, 128–142. [Google Scholar] [CrossRef]
  4. Yao, X.; Fu, B.; Lü, Y.; Chang, R.; Wang, S.; Wang, Y.; Su, C.H. The multi-scale spatial variance of soil moisture in the semi-arid Loess Plateau of China. J. Soils Sediments 2012, 12, 694–703. [Google Scholar] [CrossRef]
  5. Peng, J.B.; Tong, X.; Wang, S.K.; Ma, P.H. Three-dimensional geological structures and sliding factors and modes of loess landslides. Environ. Earth Sci. 2018, 77, 675. [Google Scholar] [CrossRef]
  6. Huang, T.M.; Ma, B.; Pang, Z.; Li, Z.; Li, Z.; Long, Y. How does precipitation recharge groundwater in loess aquifers? Evidence from multiple environmental tracers. J. Hydrol. 2020, 583, 124532. [Google Scholar] [CrossRef]
  7. Hou, X.; Li, T.; Vanapalli, S.K.; Xi, Y. Water percolation in a thick unsaturated loess layer considering the ground-atmosphere interaction. Hydrol. Process. 2019, 33, 794–802. [Google Scholar] [CrossRef]
  8. Wang, C.X.; Li, T.L.; Li, P.; Wang, Y.; Li, H.; Xi, Y. Verification on the mode of moisture transfer in the vadose zone of thick loess. Hydrol. Process. 2022, 36, e14656. [Google Scholar] [CrossRef]
  9. Li, P.; Li, T.L.; Vanapalli, S.K. Influence of environmental factors on the wetting front depth: A case study in the Loess Plateau. Eng. Geol. 2016, 214, 1–10. [Google Scholar] [CrossRef]
  10. Zhang, C.L.; Li, T.L.; Li, P. Rainfall infiltration in Chinese loess by in situ observation. J. Hydrol. Eng. 2014, 19, 06014002. [Google Scholar] [CrossRef]
  11. Hou, X.; Qi, S.; Liu, F. Soil Water Retention and Pore Characteristics of Intact Loess Buried at Different Depths. Sustainability 2023, 15, 14890. [Google Scholar] [CrossRef]
  12. Li, X.A.; Li, L.C.; Song, Y.X.; Hong, B.; Wang, L.; Sun, J.Q. Characterization of the mechanisms underlying loess collapsibility for land-creation project in Shaanxi Province, China-a study from a micro perspective. Eng. Geol. 2019, 249, 77–88. [Google Scholar] [CrossRef]
  13. Fredlund, D.G.; Xing, A.; Fredlund, M.D.; Barbour, S.L. The relationship of the unsaturated soil shear strength to the soil-water characteristic curve. Can. Geotech. J. 1996, 33, 440–448. Available online: https://cdnsciencepub.com/doi/10.1139/t96-065 (accessed on 11 April 2024). [CrossRef]
  14. Chaney, R.C.; Demars, K.R.; Öberg, A.L.; Sällfors, G. Determination of Shear Strength Parameters of Unsaturated Silts and Sands Based on the Water Retention Curve. Geotech. Test. J. 1997, 20, 40–48. [Google Scholar] [CrossRef]
  15. Huang, S.Y.; Barbour, S.L.; Fredlund, D.G. Development and verification of a coefficient of permeability function for a deformable unsaturated soil. Can. Geotech. J. 1998, 35, 411–425. [Google Scholar] [CrossRef]
  16. Lim, P.C.; Barbour, S.L.; Fredlund, D.G. The influence of degree of saturation on the coefficient of aqueous diffusion. Can. Geotech. J. 1998, 35, 811–827. [Google Scholar] [CrossRef]
  17. Vanapalli, S.K.; Fredlund, D.G.; Pufahl, D.E.; Clifton, A.W. Model for the prediction of shear strength with respect to soil suction. Can. Geotech. J. 1996, 33, 379–392. [Google Scholar] [CrossRef]
  18. Vanapalli, S.K.; Fredlund, D.G.; Pufahl, D.E. The influence of soil structure and stress history on the soil-water characteristics of a compacted till. Géotechnique 1999, 51, 573–576. [Google Scholar] [CrossRef]
  19. Fredlund, D.G. Unsaturated soil mechanics in engineering practice. J. Geotech. Geoenviron. 2006, 132, 286–321. [Google Scholar] [CrossRef]
  20. Lu, N.; Likos, W.J. Suction stress characteristic curve for unsaturated soil. J. Geotech. Geoenviron. 2006, 132, 131–142. [Google Scholar] [CrossRef]
  21. Wen, B.P.; Yan, Y.J. Influence of structure on shear characteristics of the unsaturated loess in Lanzhou, China. Eng. Geol. 2014, 168, 46–58. [Google Scholar] [CrossRef]
  22. Ng, C.W.; Sadeghi, H.; Jafarzadeh, F. Compression and shear strength characteristics of compacted loess at high suctions. Can. Geotech. J. 2017, 54, 690–699. [Google Scholar] [CrossRef]
  23. Tu, H.Y.; Vanapalli, S.K. Prediction of the variation of swelling pressure and one-dimensional heave of expansive soils with respect to suction using the soil-water retention curve as a tool. Can. Geotech. J. 2016, 53, 1213–1234. [Google Scholar] [CrossRef]
  24. Gao, Q.F.; Zeng, L.; Shi, Z.N. Effects of desiccation cracks and vegetation on the shallow stability of a red clay cut slope under rainfall infiltration. Comput. Geotech. 2021, 140, 104436. [Google Scholar] [CrossRef]
  25. Gao, Y.; Li, Z.; Sun, D.A.; Yu, H.H. A simple method for predicting the hydraulic properties of unsaturated soils with different void ratios. Soil Tillage Res. 2021, 209, 104913. [Google Scholar] [CrossRef]
  26. Liu, Y.; Tian, G.; Wang, S.; Satyanaga, A.; Zhai, Q. Parametric Analysis of Rainfall-Induced Loess Soil Slope Due to the Rainwater Infiltration. Urban Sci. 2022, 6, 54. [Google Scholar] [CrossRef]
  27. Lu, N.; Likos, W.J. Unsaturated Soil Mechanics; John Wiley: Hoboken, NJ, USA, 2004. [Google Scholar]
  28. Yang, H.; Rahardjo, H.; Leong, E.C.; Fredlund, D.G. Factors affecting drying and wetting soil-water characteristic curves of sandy soils. Can. Geotech. J. 2004, 41, 908–920. [Google Scholar] [CrossRef]
  29. Simms, P.H.; Yanful, E.K. Predicting soil-water characteristic curves of compacted plastic soils from measured pore-size distributions. Géotechnique 2002, 52, 69–278. [Google Scholar] [CrossRef]
  30. Wang, Y.; Li, T.L.; Zhao, C.X.; Hou, X.K.; Li, P.; Zhang, Y. A study on the effect of pore and particle distributions on the soil water characteristic curve of compacted loess soil. Environ. Earth Sci. 2021, 80, 764. [Google Scholar] [CrossRef]
  31. Gao, Y.; Sun, D.A. Soil-water retention behavior of compacted soil with different densities over a wide suction range and its prediction. Comput. Geotech. 2017, 91, 17–26. [Google Scholar] [CrossRef]
  32. Hu, R.; Chen, Y.F.; Liu, H.H.; Zhou, C.B. A water retention curve and unsaturated hydraulic conductivity model for deformable soils: Consideration of the change in pore-size distribution. Geotechnique 2013, 63, 1389–1405. [Google Scholar] [CrossRef]
  33. Beckett, C.T.S.; Augarde, C.E. Prediction of soil water retention properties using pore-size distribution and porosity. Can. Geotech. J. 2013, 50, 435–450. [Google Scholar] [CrossRef]
  34. Jabro, J.D.; Stevens, W.B. Pore Size Distribution Derived from Soil–Water Retention Characteristic Curve as Affected by Tillage Intensity. Water 2022, 14, 3517. [Google Scholar] [CrossRef]
  35. Ng, C.W.W.; Sadeghi, H.; Hossen, S.B.; Chiu, C.F.; Alonso, E.E.; Baghbanrezvan, S. Water retention and volumetric characteristics of intact and re-compacted loess. Can. Geotech. J. 2016, 53, 1258–1269. [Google Scholar] [CrossRef]
  36. Li, P.; Li, T.L.; Vanapalli, S.K. Prediction of soil-water characteristic curve for Malan loess in Loess Plateau of China. J. Cent. South Univ. 2018, 25, 432–447. [Google Scholar] [CrossRef]
  37. Mu, Q.Y.; Dong, H.; Liao, H.J.; Dang, Y.J.; Zhou, C. Water-retention curves of loess under wettingdrying cycles. Geotech. Lett. 2020, 10, 135–140. [Google Scholar] [CrossRef]
  38. Chen, X.; Ma, M.; Zhou, S.; Hu, M.; Ma, J.; Wei, S. Determining the Bimodal Soil-Water Characteristic Curve of Fine-Grained Subgrade Soil Derived from the Compaction Condition by Incorporating Pore Size Distribution. Processes 2023, 11, 3394. [Google Scholar] [CrossRef]
  39. Jiang, M.J.; Li, T.; Hu, H.J.; Thornton, C. DEM analyses of one-dimensional compression and collapse behaviour of unsaturated structural loess. Comput. Geotech. 2014, 60, 47–60. [Google Scholar] [CrossRef]
  40. Li, P.; Xie, W.L.; Pak, R.Y.S.; Vanapalli, S.K. Microstructural evolution of loess soils from the Loess Plateau of China. Catena 2019, 173, 276–288. [Google Scholar] [CrossRef]
  41. Hou, X. Prediction of the Soil–Water Retention Curve of Loess Using the Pore Data from the Mercury Intrusion Technique. Water 2023, 15, 3273. [Google Scholar] [CrossRef]
  42. Li, X.A.; Li, N.C. Quantification of the pore structures of Malan loess and the effects on loess permeability and environmental significance, Shaanxi Province, China: An experimental study. Environ. Earth Sci. 2017, 76, 523. [Google Scholar] [CrossRef]
  43. Sasanian, S.; Newson, T.A. Use of mercury intrusion porosimetry for microstructural investigation of reconstituted clays at high water contents. Eng. Geol. 2013, 158, 15–22. [Google Scholar] [CrossRef]
  44. Wang, J.D.; Li, P.; Ma, Y.; Vanapalli, S.K. Evolution of pore-size distribution of intact loess and remolded loess due to consolidation. J. Soils Sediments 2018, 19, 1226–1238. [Google Scholar] [CrossRef]
  45. Wang, H.M.; Ni, W.K.; Yuan, K.Z.; Nie, Y.P.; Li, L. Study on SWCC and PSD evolution of compacted loess before and after drying-wetting cycles. Bull. Eng. Geol. Environ. 2023, 82, 180. [Google Scholar] [CrossRef]
  46. Muñoz-Castelblanco, J.A.; Pereira, J.M.; Delage, P.; Cui, Y.J. The water retention properties of natural unsaturated loess from northern France. Géotechnique 2012, 62, 95. [Google Scholar] [CrossRef]
  47. Satyanaga, A.; Rahardjo, H.; Leong, E.; Wang, J.Y. Water characteristic curve of soil with bimodal grain-size distribution. Comput. Geotech. 2013, 48, 51–61. [Google Scholar] [CrossRef]
  48. Schindler, U.; Müller, L. Simplifying the evaporation method for quantifying soil hydraulic properties. J. Plant Nutr. Soil Sc. 2006, 169, 623–629. [Google Scholar] [CrossRef]
  49. Peters, A.; Durner, W. Simplified evaporation method for determining soil hydraulic properties. J. Hydrol. 2008, 356, 147–162. [Google Scholar] [CrossRef]
  50. Juang, C.H.; Holtz, R.D. Fabric, Pore Size Distribution, and Permeability of Sandy Soils. J. Geotech. Eng. 1986, 112, 855–868. [Google Scholar] [CrossRef]
  51. Romero, E.; Gens, A.; Lloret, A. Water permeability, water retention and microstructure of unsaturated compacted Boom clay. Eng. Geol. 1999, 54, 117–127. [Google Scholar] [CrossRef]
  52. Jiang, M.J.; Zhang, F.G.; Hu, H.J.; Cui, Y.J.; Peng, J.B. Structural characterization of natural loess and remolded loess under triaxial tests. Eng. Geol. 2014, 181, 249–260. [Google Scholar] [CrossRef]
  53. Li, P.; Shao, S.J.; Vanapalli, S.K. Characterizing and modeling the pore-size distribution evolution of a compacted loess during consolidation and shearing. J. Soils Sediments 2020, 20, 2855–2867. [Google Scholar] [CrossRef]
  54. Xiao, T.; Li, P.; Shao, S.J. Fractal dimension and its variation of intact and compacted loess. Powder Technol. 2022, 395, 476–490. [Google Scholar] [CrossRef]
  55. Van Genuchten, M.T. A closed-form equation for predicting the hydraulic conductivity of unsaturated soils. Soil Sci. Soc. Am. J. 1980, 44, 892–898. [Google Scholar] [CrossRef]
  56. Fredlund, D.G.; Xing, A. Erratum: Equations for the soil-water characteristic curve. Can. Geotech. J. 1994, 31, 521–532. [Google Scholar] [CrossRef]
  57. Brooks, R.H.; Corey, A.T. Hydraulic Properties of Porous Media and Their Relation to Drainage Design. Trans. ASAE 1964, 7, 26–28. [Google Scholar] [CrossRef]
  58. Sillers, W.S.; Fredlund, D.G.; Zakerzadeh, N. Mathematical attributes of some soil-water characteristic curve models. Geotech. Geol. Eng. 2001, 19, 243–283. [Google Scholar] [CrossRef]
  59. Marinho, F.A.M. Nature of Soil-Water Characteristic Curve for Plastic Soils. J. Geotech. Geoenviron. 2005, 131, 654–661. [Google Scholar] [CrossRef]
  60. Kadir, K.; Askin, O.Z.; Tuncer, B.E.; Ertan, B.; Sedat, S.; Kurban, O.; Mustafa, O. Evaluation of Soil-Water Characteristic Curve and Pore-Size Distribution of Fine-Grained Soils. Water 2022, 14, 3445. [Google Scholar] [CrossRef]
  61. Shen, J.H.; Hu, M.J.; Wang, X.; Zhang, C.Y.; Xu, D.S. SWCC of calcareous silty sand under different fines contents and dry densities. Front. Environ. Sci. 2021, 9, 682907. [Google Scholar] [CrossRef]
  62. Wang, J.D.; Li, P.; Ma, Y.; Vanapalli, S.K.; Wang, X.G. Change in pore-size distribution of collapsible loess due to loading and inundating. Acta Geotech. 2019, 15, 1081–1094. [Google Scholar] [CrossRef]
  63. Li, P.; Vanapalli, S.; Li, T.L. Review of collapse triggering mechanism of collapsible soils due to wetting. J. Rock Mech. Geotech. 2016, 8, 256–274. [Google Scholar] [CrossRef]
  64. Xiao, T.; Li, P.; Pan, Z.H.; Hou, Y.F.; Wang, J.D. Relationship between water retention capacity and pore-size distribution of compacted loess. J. Soils Sediments 2022, 22, 3151–3165. [Google Scholar] [CrossRef]
  65. Lei, X.Y. The types of loess pores in china and their relationship with collapsibility. Sci. China Ser. B 1988, 31, 1398–1411. [Google Scholar] [CrossRef]
Figure 1. The topographic feature stratigraphic profile of the study area, numbers 1 to 5 represent sampling points for undisturbed samples at various depths. (a) Full view of the study area; (b) stratigraphic profiles of sampling sites.
Applsci 14 03329 g001
Figure 2. Particle size distribution curve of the five sets of loess samples, measured using a Mastersizer 2000 (UK) laser particle size analyzer. (a) Cumulative particle size distribution curves of loess; (b) particle size density distribution.
Applsci 14 03329 g002
Figure 3. Procedures of HYPROP for measuring SWCC. (a) Preparation of undisturbed loess samples; (b) saturated undisturbed loess sample; (c) evaporation process monitoring.
Applsci 14 03329 g003
Figure 4. SWCCs of undisturbed loess samples from different depths.
Applsci 14 03329 g004
Figure 5. Variations in the fitting parameters a and n with respect to the dry density. (a) The relationship between ρd and parameter a; (b) the relationship between ρd and parameter n.
Applsci 14 03329 g005
Figure 6. SEM images of the microstructure of undisturbed loess under different magnifications. (a) 500×; (b) 2000×.
Applsci 14 03329 g006
Figure 7. PSDs of undisturbed loess from different depths. (a) Cumulative pore volume curves; (b) pore size distribution curves; (c) pore radius versus dry density.
Applsci 14 03329 g007
Figure 8. Relationship between cumulative pore volume and void ratio of loess samples.
Applsci 14 03329 g008
Figure 9. Porosities of micropores, small pores, mesopores, and macropores, and ne of the undisturbed loess samples from different depths.
Applsci 14 03329 g009
Figure 10. Schematic diagram of equilibrium in capillary.
Applsci 14 03329 g010
Figure 11. Relationship between the PSD and SWCC of undisturbed loess soil samples from different depths.
Applsci 14 03329 g011
Table 1. Physical properties of loess samples.
Sample NO. 1 NO. 2 NO. 3 NO. 4 NO. 5
Depth (m)3.48.513.22551.9
In situ water content (%)8.1018.0810.1710.0010.00
Dry density (g/cm3)1.271.301.501.511.59
Initial void ratio, e1.111.100.810.790.71
Specific gravity, Gs2.702.702.712.712.71
Liquid limit, wL (%)32.4832.9033.0030.0529.92
Plastic limit, wP (%)19.2417.6016.6016.9918.09
Plasticity index, IP (%)13.2415.3016.4013.0611.83
Clay (0–0.002 mm) (%)2.584.562.263.712.69
Silt (0.002–0.075 mm) (%)65.3783.9454.9369.5173.32
Sand (0.075–2 mm) (%)32.0511.5042.8126.7823.99
Effective particle diameter (µm)6.423.987.664.965.33
Median diameter (µm)19.0011.9128.8716.3417.80
Control particle size (µm)50.5028.8688.1242.3240.95
Coefficient of uniformity, Cu7.877.2411.508.537.68
Coefficient of curvature, Cc1.111.231.231.271.45
Table 2. SWCC fitting parameters of undisturbed loess samples.
Sample θ s θ r α n R2
NO. 10.5230.0010.0371.8010.994
NO. 20.5280.0010.0491.4980.993
NO. 30.4120.0010.0302.0170.997
NO. 40.4250.0010.0311.5520.996
NO. 50.4040.0010.0152.5410.996
Table 3. The dry densities and porosities of the samples.
Sample Sample Burial Depth (m)Dry Density ρd (g/cm3)Porosityn (%)Effective Porosity ne (%)Mercury Intrusion Efficiency φ (%)
NO. 13.41.2753.3350.6995.04
NO. 28.51.3052.2147.5090.99
NO. 313.21.5044.6540.4790.64
NO. 4251.4844.2839.5989.41
NO. 551.91.5941.3338.8894.08
Disclaimer/Publisher’s Note: The statements, opinions and data contained in all publications are solely those of the individual author(s) and contributor(s) and not of MDPI and/or the editor(s). MDPI and/or the editor(s) disclaim responsibility for any injury to people or property resulting from any ideas, methods, instructions or products referred to in the content.

