Communication

Double-Mode Thermometer Based on Photoluminescence of YbGd2Al2Ga3O12: Cr3+ Operating in the Biological Windows

1
Graduate School of Human and Environmental Studies, Kyoto University, Kyoto 606-8501, Japan
2
Graduate School of Advanced Science and Technology, Japan Advanced Institute of Science and Technology, Nomi 923-1292, Japan
*
Author to whom correspondence should be addressed.
Appl. Sci. 2024, 14(8), 3357; https://doi.org/10.3390/app14083357
Submission received: 21 March 2024 / Revised: 11 April 2024 / Accepted: 12 April 2024 / Published: 16 April 2024
(This article belongs to the Special Issue Advances in Biological and Biomedical Optoelectronics)

Abstract

:
A Near-Infrared (NIR) ratiometric luminescence thermometer with the composition of Yb1Gd2Al1.98Cr0.02Ga3O12 was prepared and studied. When excited by 660 nm in the first biological transparent window (BTW), the sample shows a peak structure of around 1000 nm due to the 2F5/22F7/2 transitions of Yb3+ via the energy transfer process from Cr3+. Due to the Boltzmann distribution, the Yb3+ PL intensities in the shorter wavelength side (i.e., 1st BTW) and longer wavelength side (i.e., 2nd BTW) exhibit opposite temperature dependencies. The luminescence intensity ratio (LIR) of Yb3+ in shorter and longer wavelength ranges works as a luminescence thermometer with a relative sensitivity of 0.55% K−1 at 310 K. In addition, YbGd2Al1.98Cr0.02Ga3O12 can also be employed for temperature sensing based on the LIR of Cr3+ (2E → 4A2) at around 700 nm and Yb3+ (2F5/22F7/2) at around 1000 nm, achieving a remarkable relative sensitivity of 2.69% at 100 K. This study confirms that the YbGd2Al1.98Cr0.02Ga3O12 thermometer fulfills the requirements for biological temperature measurements.

Graphical Abstract

1. Introduction

Since the 1980s, phototherapy and hyperthermia treatment in cancer therapy have attracted considerable attention due to their unique therapeutic effects [1,2,3,4]. Compared to chemotherapy and radiotherapy, these techniques have minimal side effects, further contributing to maintaining a high level of research interest. These treatments crucially require continuous monitoring of temperature distribution to avoid damaging normal cells, as deviations in temperature cause irreversible harm during treatment. Therefore, phototherapy and hyperthermia treatment should be accompanied by a real-time temperature measurement technique. Inorganic luminescence thermometers have emerged as a solution, offering real-time, rapid response and high sensitivity remote temperature measurements. Luminescence thermometers within the biological transparent window (BTW) are particularly advantageous for temperature detection from deep tissue. The BTW can be separated into three wavelength regions, 650–950 nm (1st), 1000–1350 nm (2nd), and 1550–1870 nm (3rd), which are summarized based on the spontaneous fluorescence, absorption effects from biological tissues, and the inverse fourth power of the Rayleigh scattering effect concerning the wavelength [5,6].
In the past two decades, for the research of luminescence thermometers, a widely employed strategy is the combination of the ratiometric method and Boltzmann distribution, which relies on the luminescence intensity ratio from two thermally coupled energy levels of the luminescence center ion in inorganic host material. The population of these two energy levels is determined by the Boltzmann distribution [7,8,9,10]. The most widely used Boltzmann thermometer is based on the thermally coupled energy levels of Er3+: 4S3/2/2H11/2. One of the interesting applications of it has been its use in measuring the local temperature gradients during catalytic reactions [11]. Furthermore, other luminescence ions have been investigated from the luminescence wavelength and temperature rage viewpoint. Boltzmann thermometers based on Ho3+: 5F4/5F5 [12,13], and Eu3+: 5D0/5D1 [14] have been gradually developed for high-temperature detection because of the high energy difference between these pairs of thermally coupled levels, exceeding 1500 cm−1. However, these Boltzmann thermometers work within the visible range; when used for deep tissue temperature measurement, they are affected by Rayleigh scattering, spontaneous fluorescence from biological tissues, and absorption effects, leading to reduced temperature measurement accuracy.
NIR Boltzmann thermometers have become the hotspot for deep tissue temperature measurement in recent years. Nd3+ ion is often seen as an ideal NIR luminescence center for its excitation and emission within the BTW. However, the less-than-perfect energy differences (ΔE) between two pairs of thermally coupled energy levels of Nd3+ bring about a technical bottleneck for temperature measurement applications. Nd3+: 4F3/2/4F5/2 with a ΔE of up to 1000 cm−1 results in a deviation from the theoretical LIR value after the temperature drops below 300 K [15]. On the other hand, the relative sensitivity of temperature measurement based on the thermally coupled Stark sublevels of Nd3+: 4F3/2 is low due to a ΔE value as low as 100 cm−1 (not exceeding 0.7% K−1) [16,17,18]. Therefore, one approach to overcome this technical bottleneck is to find a NIR luminescence center with a moderately suitable ΔE value.
Yb3+-doped GAGG is more advantageous for luminescence temperature measurement applications. Yb3+ is a NIR luminescence center with a ΔE value of 300~680 cm−1 for the Stark energy level pairs of the 2F5/2 excited state [19,20]. This enables more accurate temperature measurements at lower temperatures than Nd3+. Among various hosts for Yb3+, Gd3Al2Ga3O12 (abbreviated as GAGG) allows the Yb3+ ions to have the highest optical conversion efficiency [21], and its thermal conductivity does not dramatically degrade compared to other pure garnets [22]. As a member of the garnet family, GAGG also has a broad transparency range, good thermomechanical properties, thermal stability, and chemical stability.
Transition metal Cr3+ has been repeatedly demonstrated to exhibit strong PL in various garnet hosts [23]. The Cr3+-Yb3+ pair also represents a dual-center system with energy transfer capabilities [24]. Compared to Yb3+ single-doped GAGG, the advantage of co-doping with Cr3+ is that visible light (e.g., at 660 nm, which is within the 1st BTW) can excite Cr3+ instead of directly exciting Yb3+ with infrared light. This approach enables the complete measurement of the Yb3+ PL spectrum.
A Yb3+ and Cr3+ co-doped Gd3Al2Ga3O12 (GAGG) NIR thermometer was developed in this work. The optical performance of the sample at 660 nm excitation is evaluated through temperature-dependent photoluminescence spectra and the fitting calculations. The shape of the Cr3+ PL spectra and the Cr3+ → Yb3+ energy transfer process are discussed with Racah parameter calculations and fitting of the luminescence lifetime, respectively. This work demonstrated that Yb3+ and Cr3+ co-doped GAGG thermometers have the potential for accurate temperature measurement in the field of biology.

2. Materials and Methods

The YbGd2Al1.98Cr0.02Ga3O12 transparent ceramic was synthesized using the solid-state reaction method. Gd2O3 (4N), Yb2O3 (4N), Al2O3 (4N), Cr2O3 (3N), and Ga2O3 (4N) were used as starting materials. The mixed precursors were ball-milled with ethanol, and the obtained slurry was dried at 95 °C for 18 h. After drying, the powder was calcined at 1000 °C for 8 h, and then compressed into a pellet using a hydraulic press. Finally, the pellet was sintered at a high temperature of 1600 °C for 8 h in a vacuum environment. The obtained transparent ceramics were double-surface polished using a copper plate and diamond slurry.
The phase compositions of the synthesized powders and consolidated ceramics were determined via X-ray diffraction (XRD) (Ultima IV, Rigaku, Tokyo, Japan). Download GAGG’s standard xrd pattern from the Inorganic Crystal Structure Database (ICSD 5.1.0) library for comparison. One set of PL spectra was measured under 660 nm LED (Newport, Irvine, CA, USA) excitation with a 695 nm shortcut filter. The other set of PL spectra was measured under 455 nm LD excitation with a 570 nm shortcut filter (Optocode Corporation, Tokyo, Japan). PL spectra were detected using a multichannel spectrometer (NIR-Quest, Ocean Optics, Orlando, FL, USA) with a connected optical fiber. The obtained PL spectra were calibrated against a spectrum of deuterium−tungsten halogen light sources (DH-2000, Ocean Optics). The temperature of the sample was controlled by a thermal stage (10033L, Linkam, Redhill, UK) in the temperature range of 100–400 K. The absorption spectrum was obtained separately using a UV3600 Shimadzu spectrophotometer (Kyoto, Japan). The excitation source for the fluorescence lifetime test is an N2 dye laser (KEC-200, USHO, Tokyo, Japan) with a coumarin dye (480 nm).

3. Results and Discussion

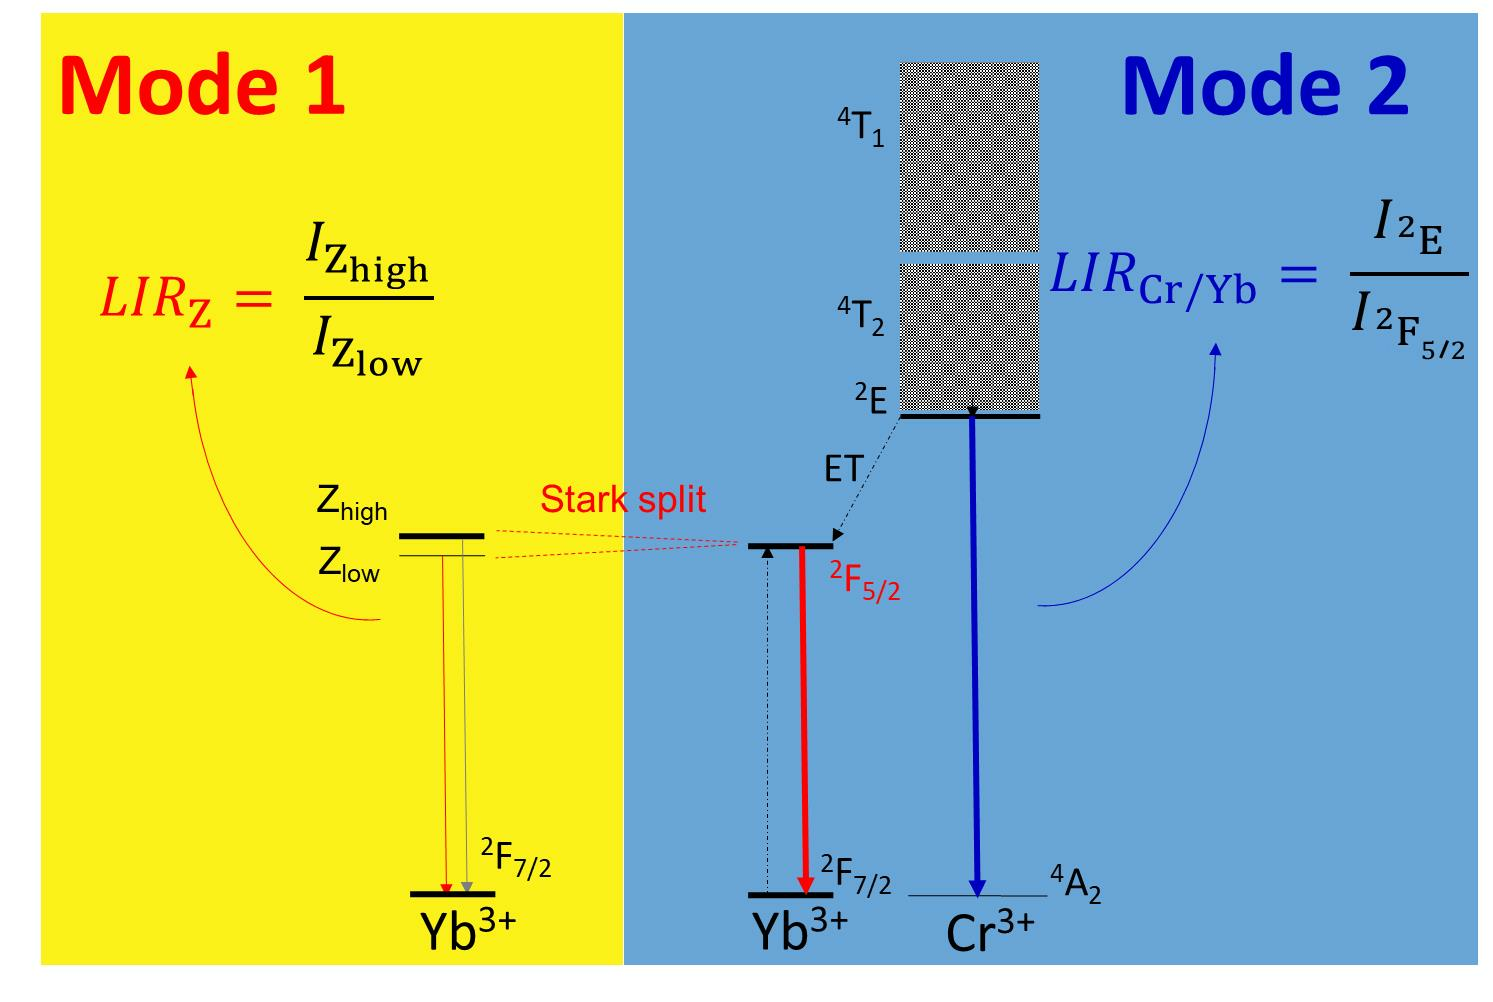
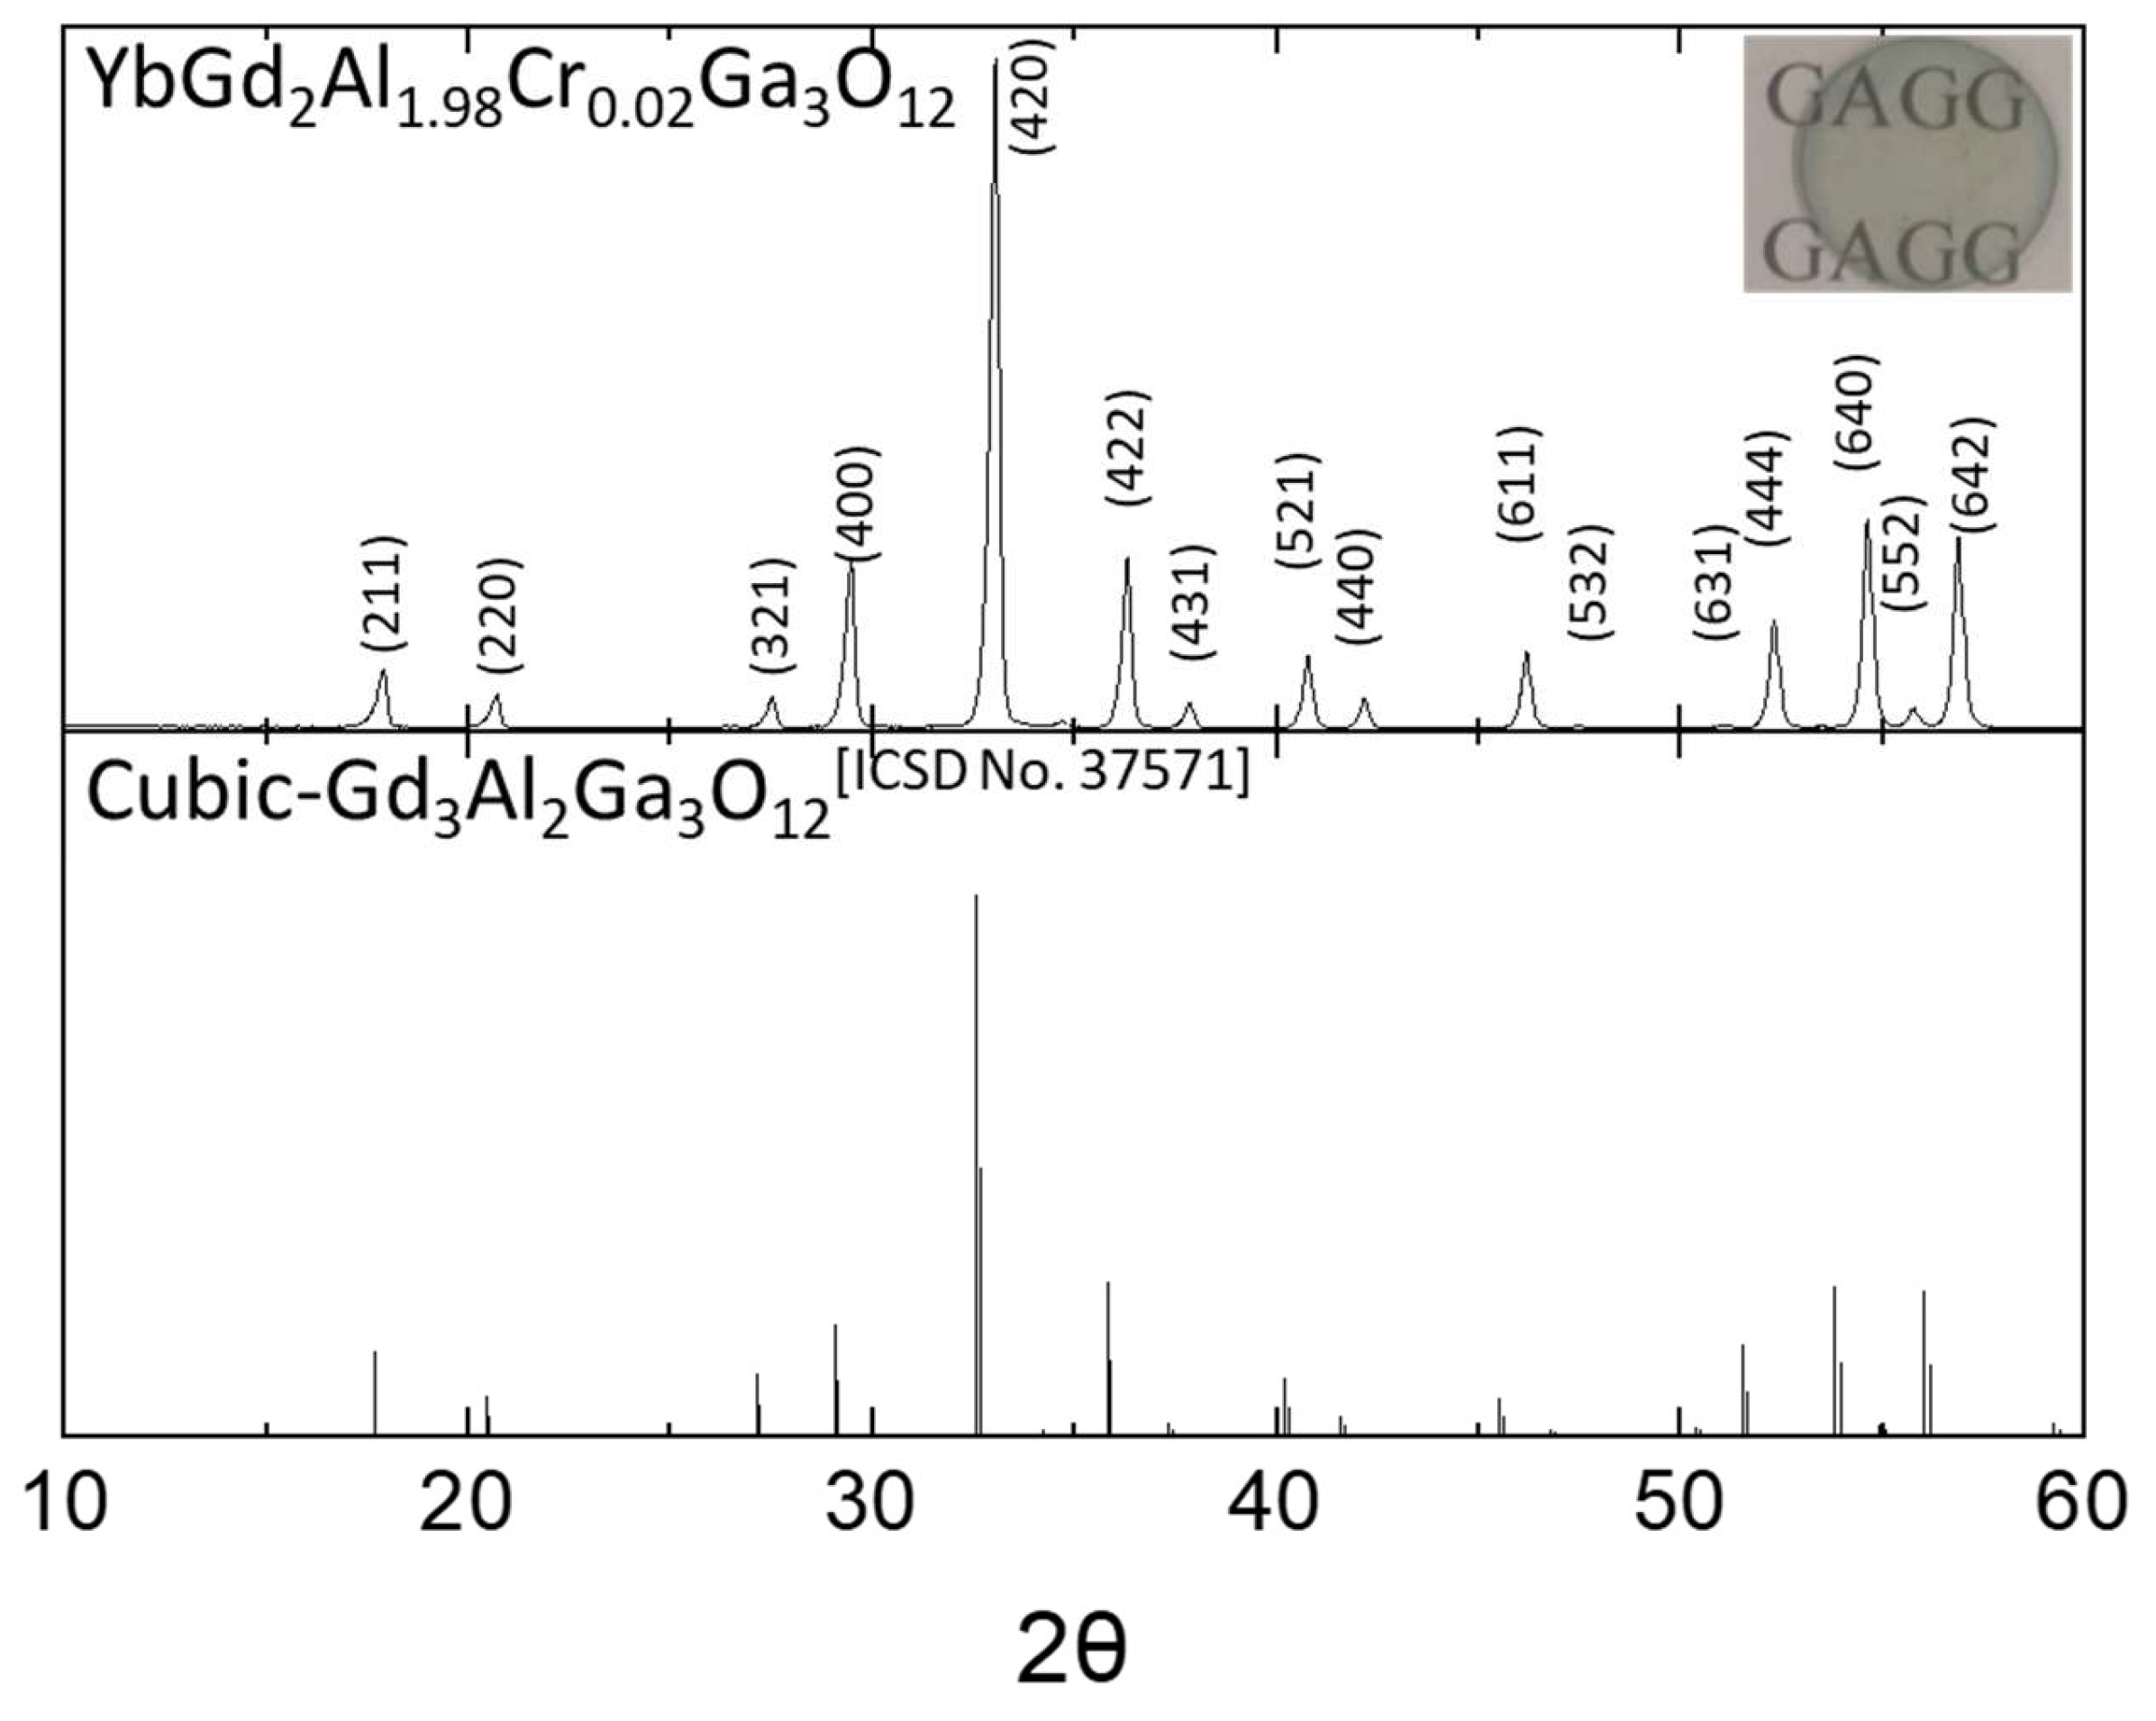
3.1. Crystal Structure

The X-ray diffraction pattern of the garnet sample YbGd2Al1.98Cr0.02Ga3O12 (YbGAGG: Cr3+) and standard cubic-Gd3Al2Ga3O12 garnet (GAGG, ICSD No. 37571) [25] are shown in Figure 1. Sample is identified as a single phase of the garnet structure, and the XRD peaks are shifted to a slightly higher degree due to one-third of the Gd3+ ions being substituted by smaller Yb3+ ions.
To clarify the structure of the Cr3+ doped YbGd2Al2Ga3O12 sample, the Rietveld refinement on the XRD pattern of the sample within the General Structure Analysis System (GSAS) was performed (as shown in Figure 2). The refined agreement factors are as follows: Rp = 14.32%, Rwp = 19.52%. The space group of GAGG is Ia-3d and lattice parameter a = 12.257 Å, with the unit cell volume V = 1841.64 Å [25]. The refined result shows that, for the Cr3+ doped YbGd2Al2Ga3O12 sample, a = 12.110 Å, V = 1776.06 Å, with an unchanged Ia-3d space group. The result indicated that the unit cell volume of the sample is smaller than the GAGG host because of the smaller ionic radius of Yb3+ than that of Gd3+.

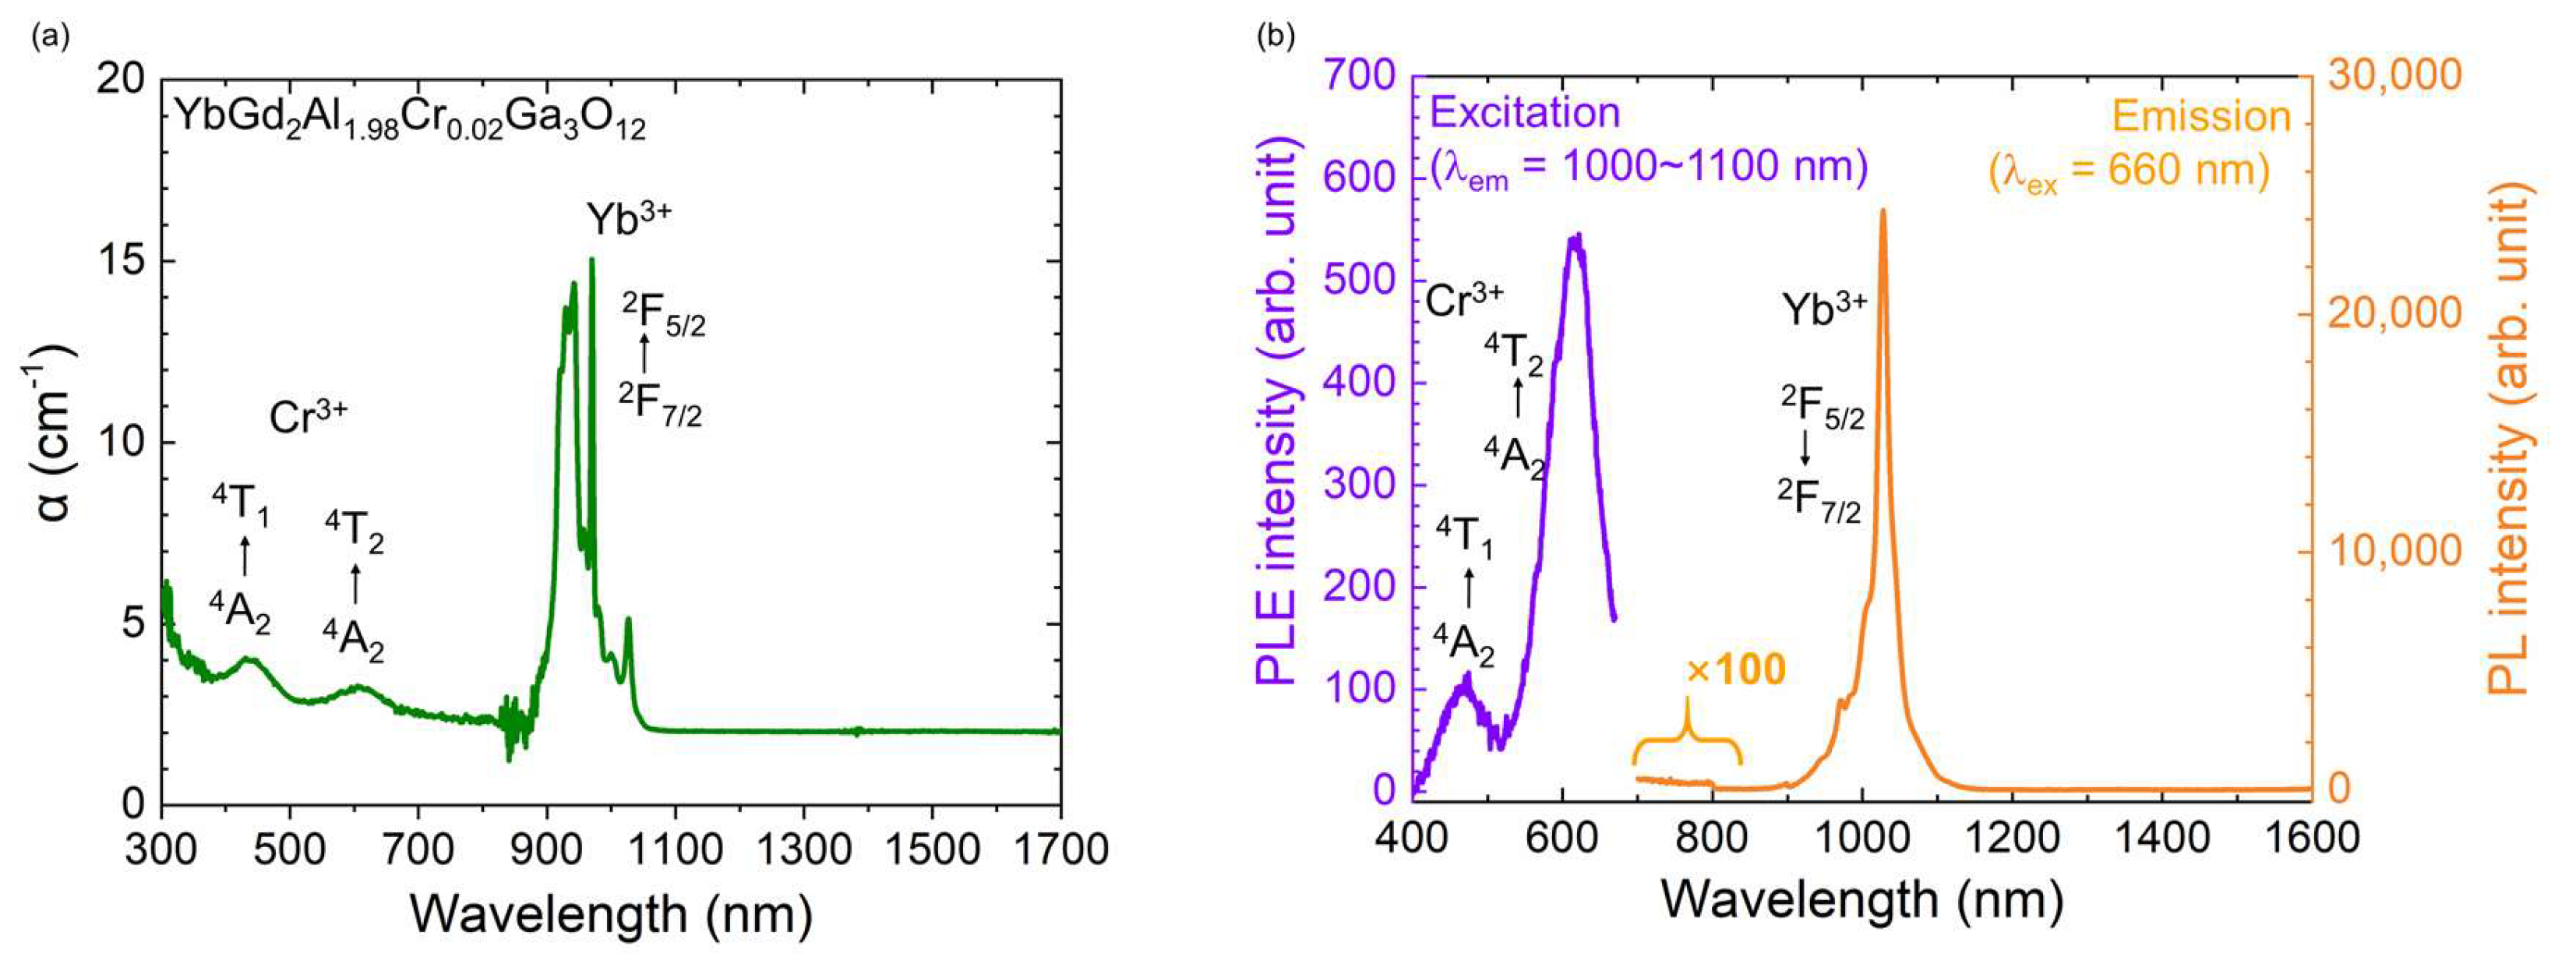
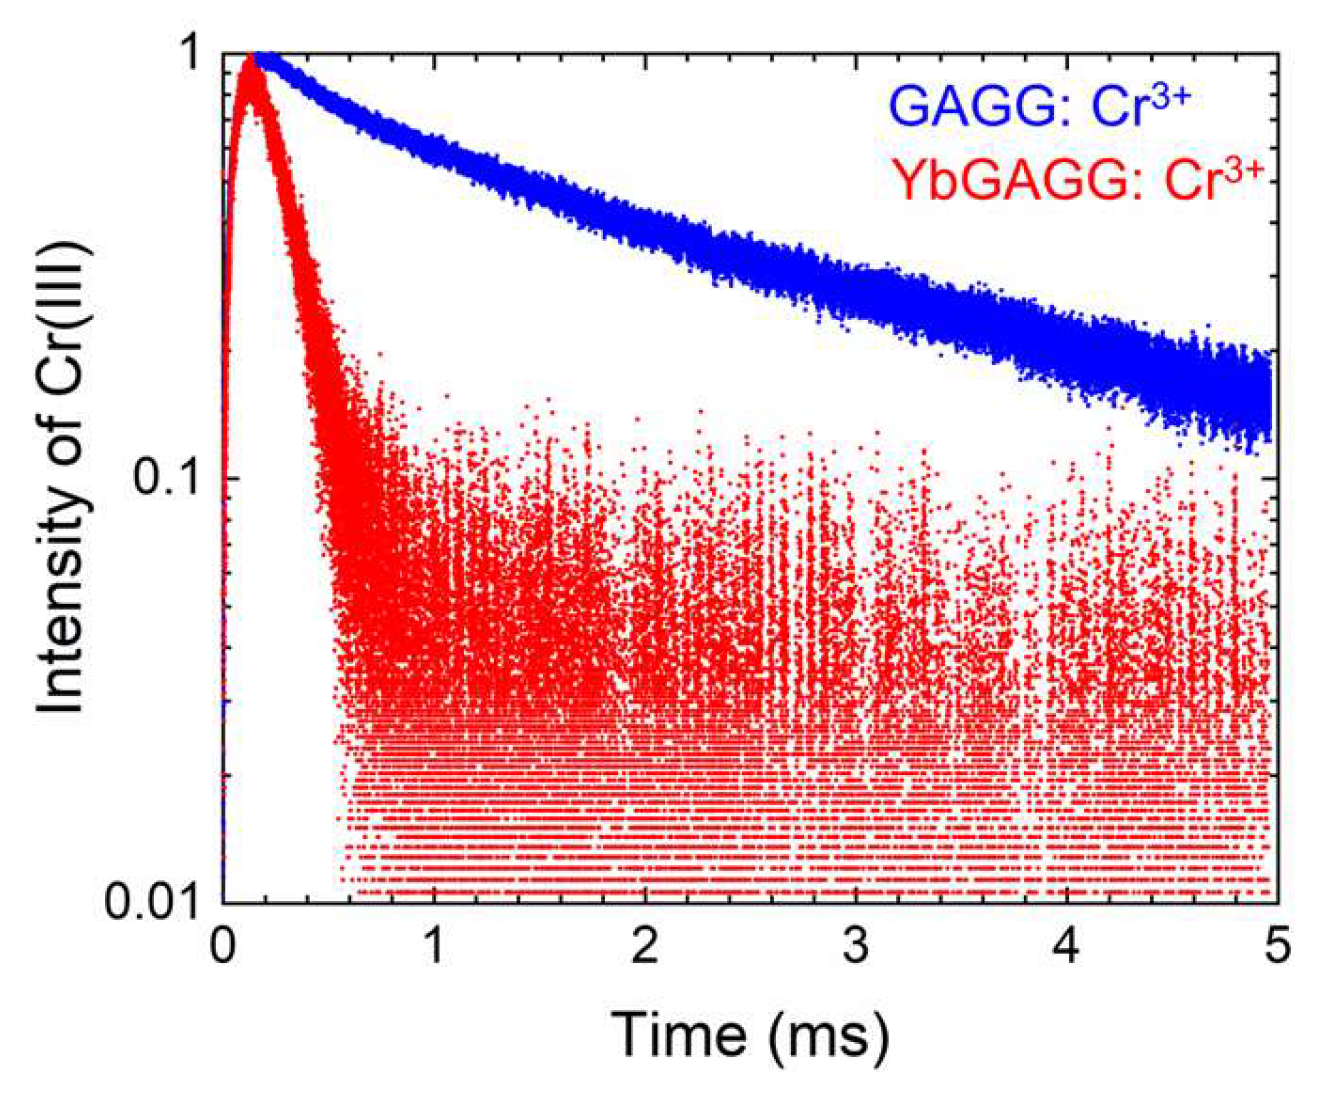
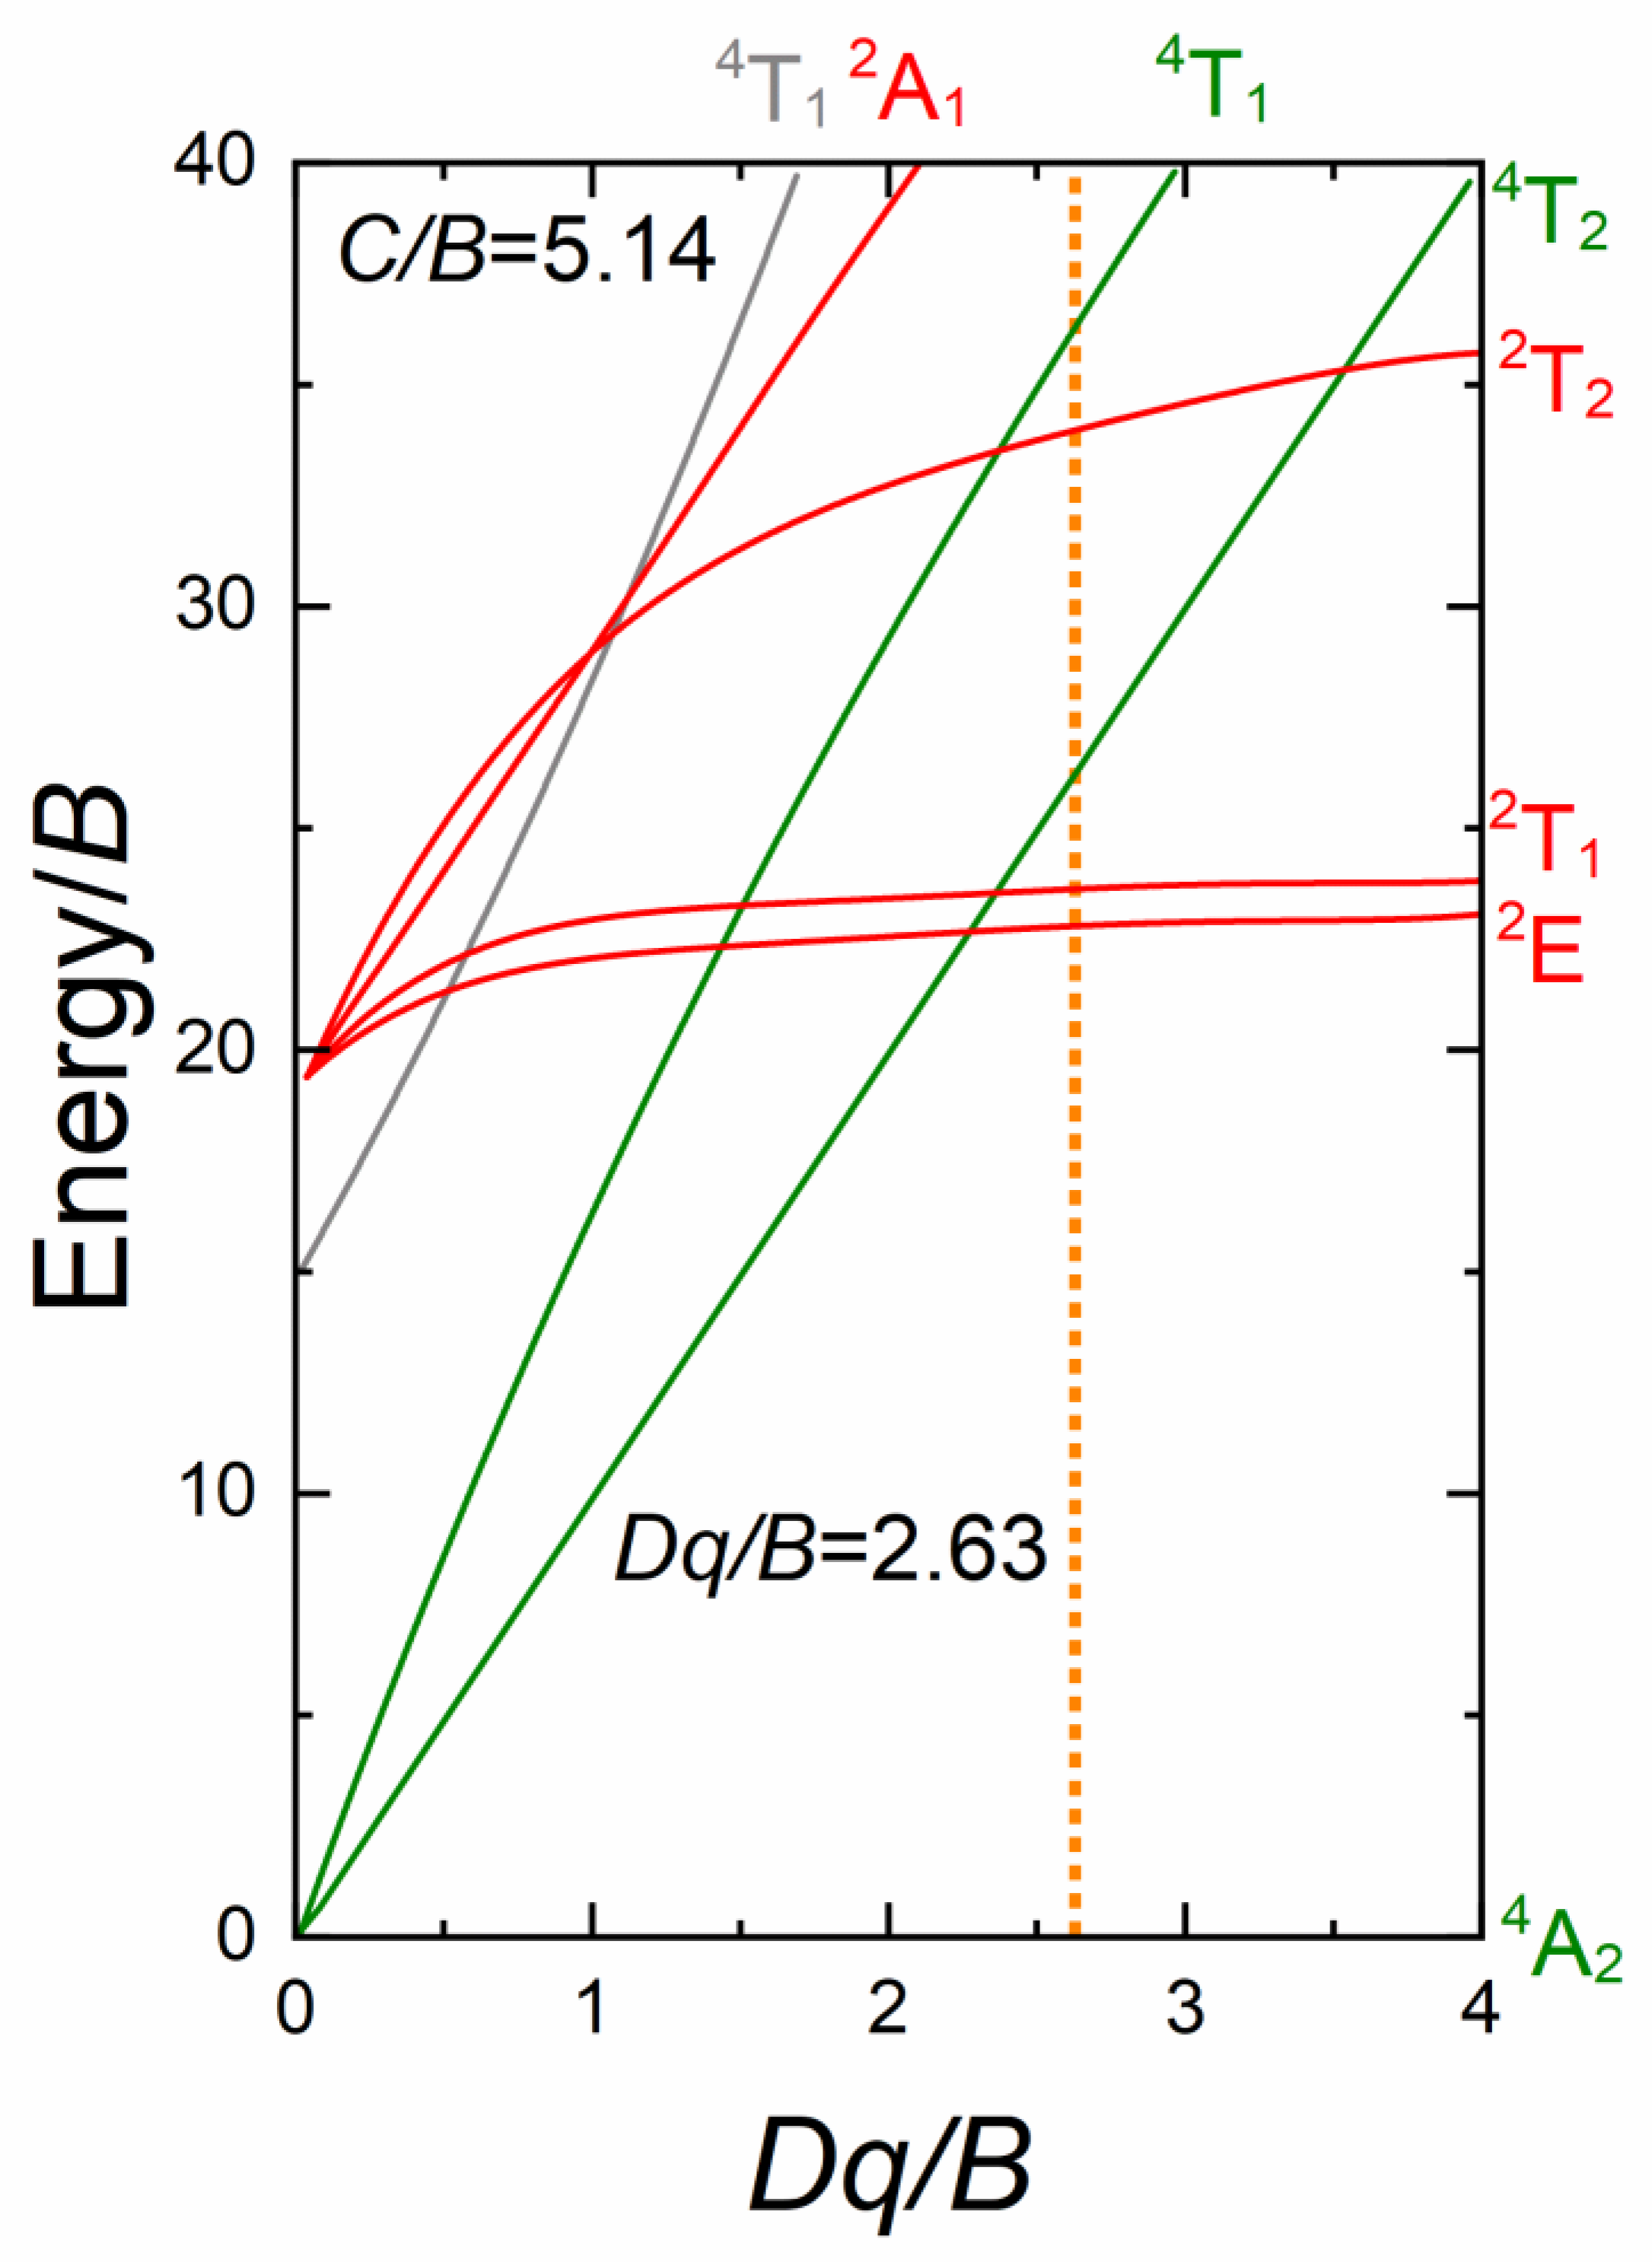
3.2. Luminescence Properties of YbGAGG: Cr3+

The absorbance coefficient spectrum of transparent ceramic YbGAGG: Cr3+ is shown in Figure 3a. The shape of the absorbance coefficient (α) spectrum in the 400–700 nm range aligns with the 4A2-4T1 and 4A2-4T2 absorption bands of Cr3+. On the contrary, at approximately 1000 nm, typical absorption peaks of Yb3+ are observed. Notably, the spectrum only shows absorption bands for Cr3+ and Yb3+, with no Cr4+ signal (at around 1350 nm). These results prove that the oxidation state of chromium in the YbGAGG host is trivalent.
The orange curve in Figure 3b represents the PL spectrum of the YbGAGG: Cr3+ sample under 660 nm excitation at room temperature. At approximately 1000 nm, the PL band of Yb3+: 2F5/22F7/2 was observed. The purple curve is the photoluminescence excitation (PLE) spectrum monitoring the PL of Yb3+. Two PLE bands within the 400–700 nm range were attributed to the transition from the 4A2 to two excited states of Cr3+: 4T1 and 4T2 [26], confirming the energy transfer process from Cr3+ to Yb3+. For the PL spectrum (orange curve) in Figure 3b, no PL signal was observed in the 700–800 nm range (where the Cr3+ PL signal is expected). This result is attributed to the excessive concentration of Yb3+, leading to an efficient energy transfer process from Cr3+ to Yb3+.
To further investigate the energy transfer process from Cr3+ to Yb3+, a luminescence lifetime measurement of Cr3+ was performed and shown in Figure 4. The PL decay of both YbGAGG: Cr3+ and GAGG: Cr3+ (preparation method is the same as for YbGAGG: Cr3+) in the range of 600–800 nm were measured under 480 nm excitation. The obtained decay plots were fitted using the following double exponential function:
I = A 1 × e x p ( t / τ 1 ) + A 2 × e x p ( t / τ 2 )
After fitting the decay curve with a function and obtaining the parameters, the lifetime is calculated using the following formula:
τ a v e = A 1 τ 1 2 + A 2 τ 2 2 A 1 τ 1 + A 2 τ 2
Using Formula (2), the lifetimes of the decay curves for YbGAGG:Cr3+ and GAGG:Cr3+ were calculated as τCrYb = 3.86 ms and τCr = 0.122 ms, respectively. Substituting these values into the following formula, the energy transfer efficiency was calculated to be η = 96.8%:
η = 1 τ CrYb / τ Cr

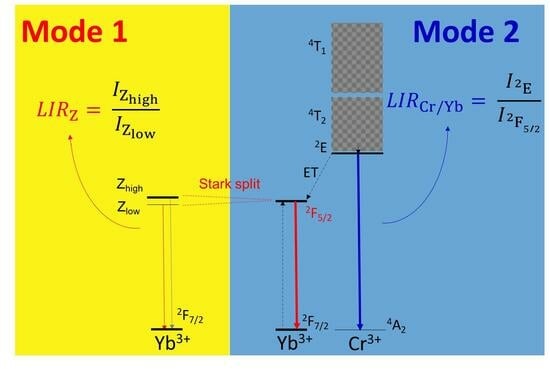
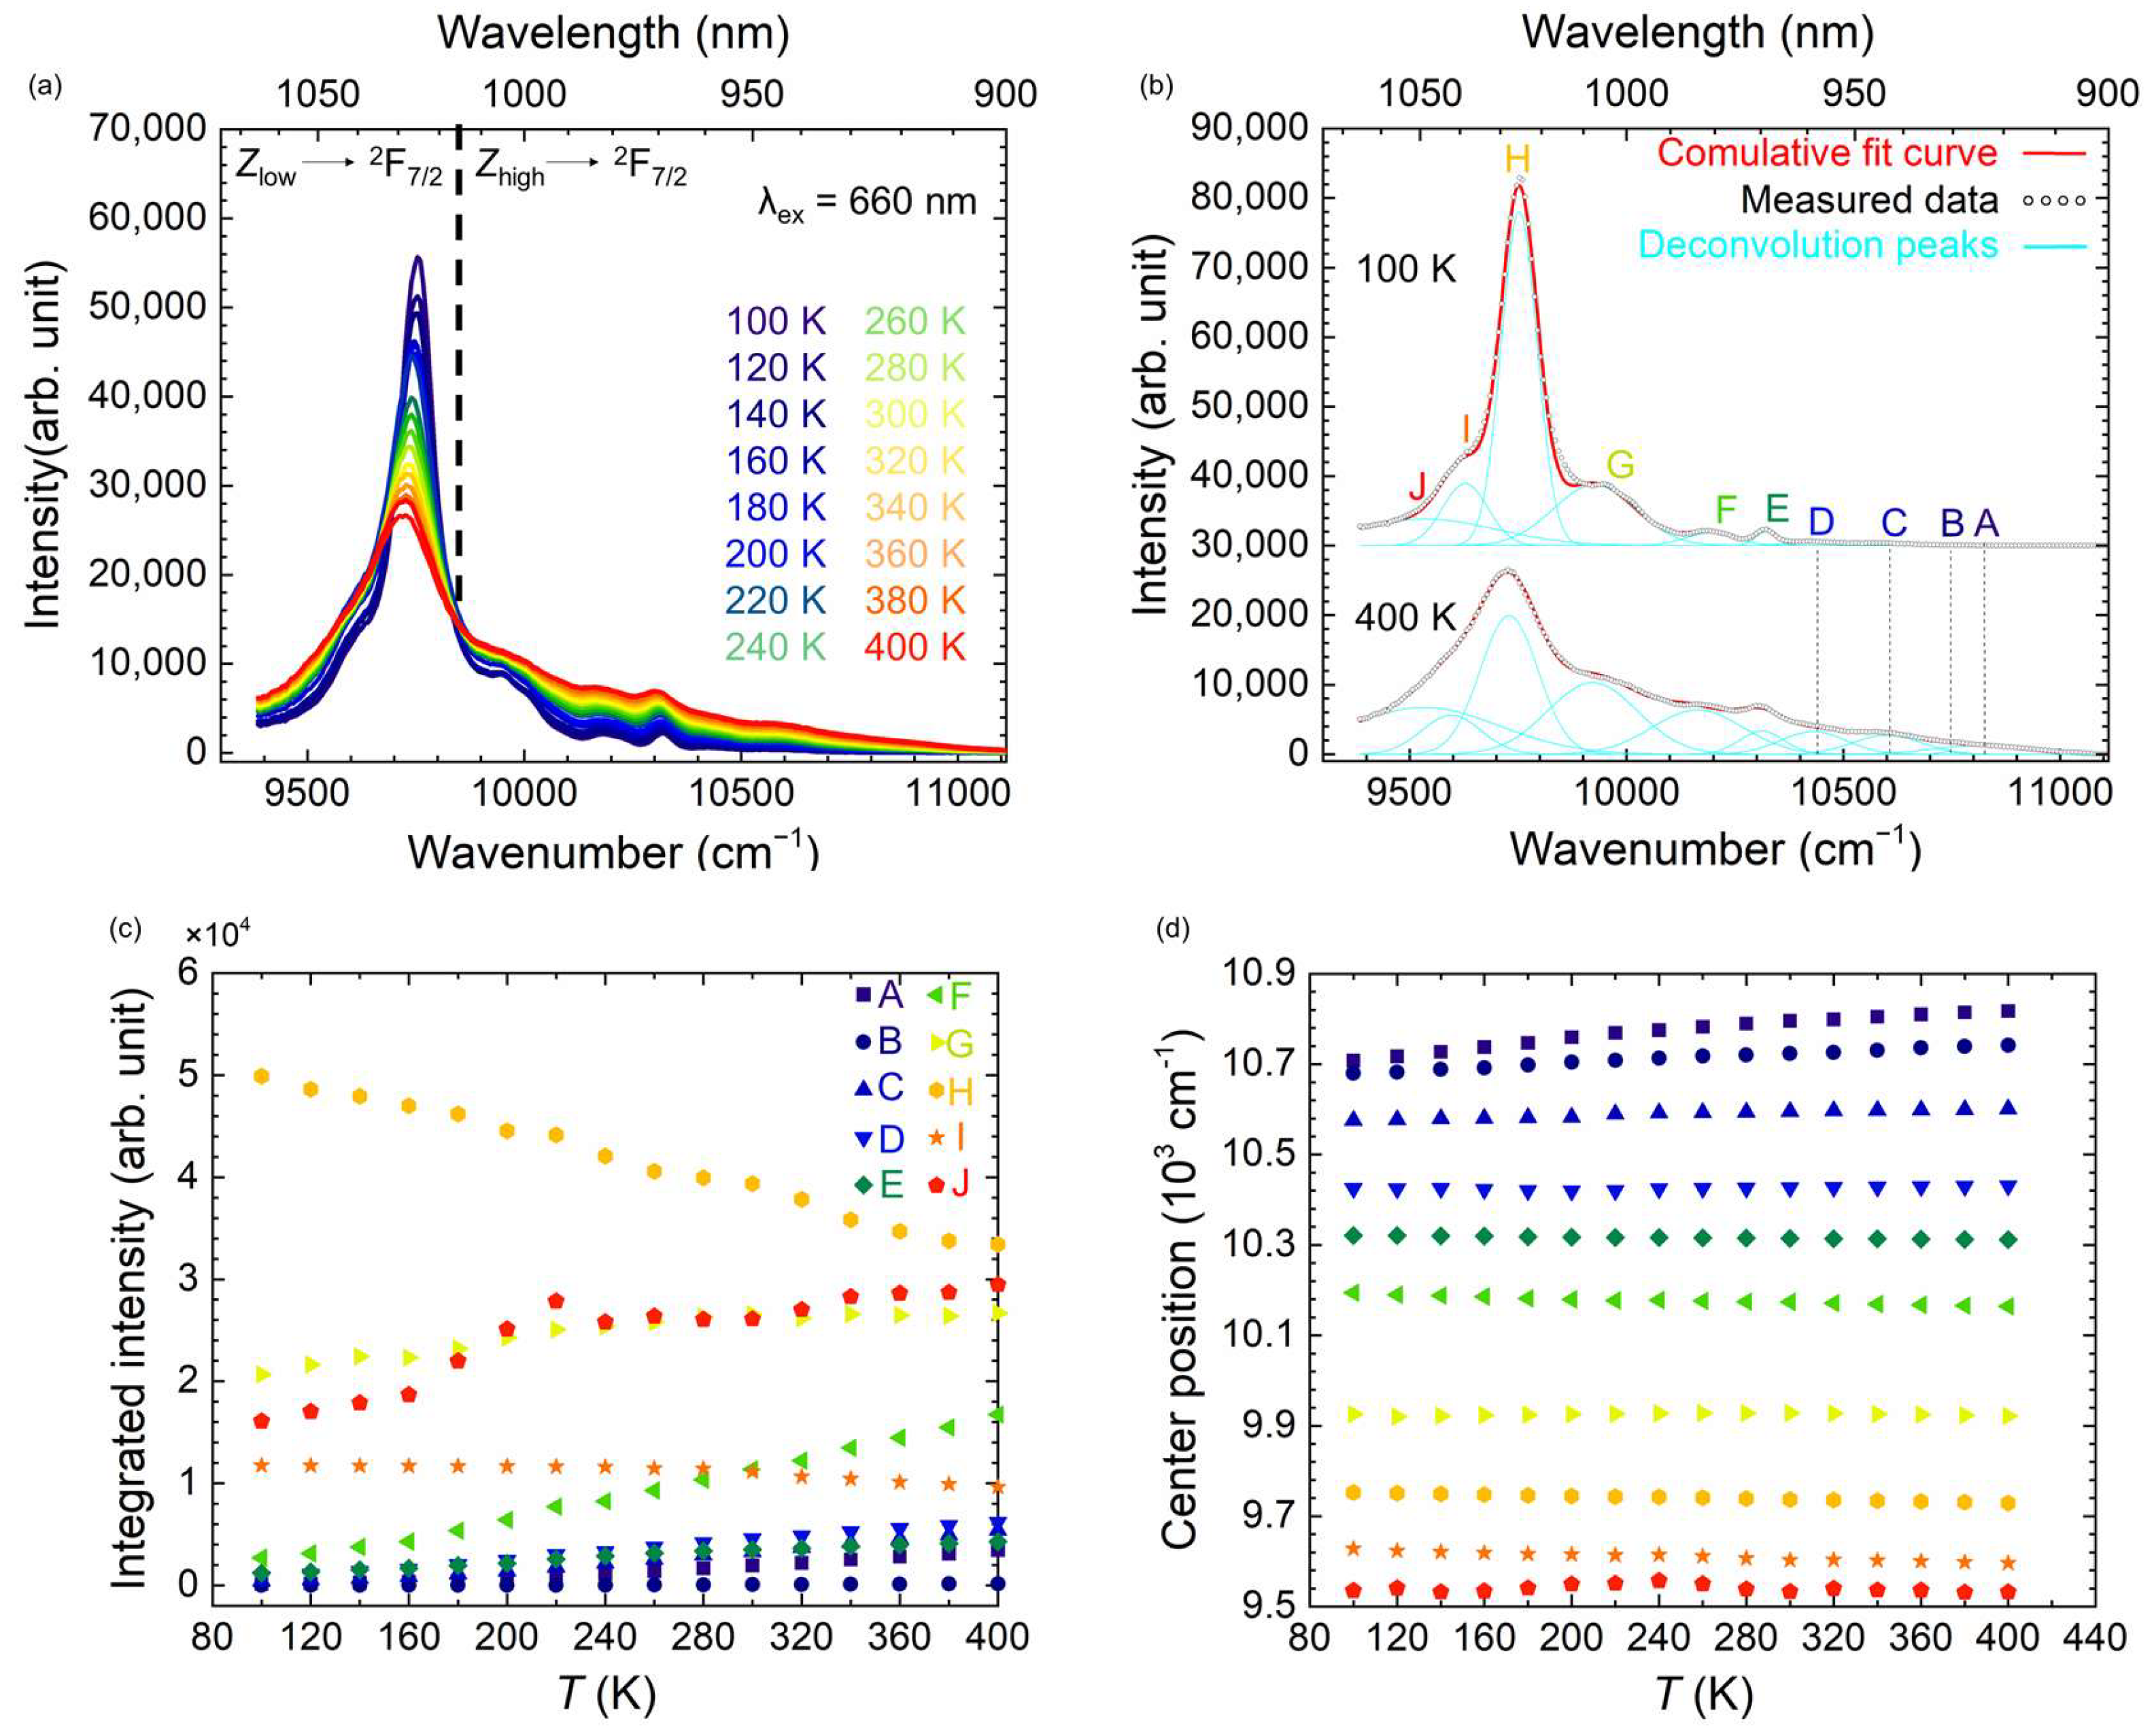
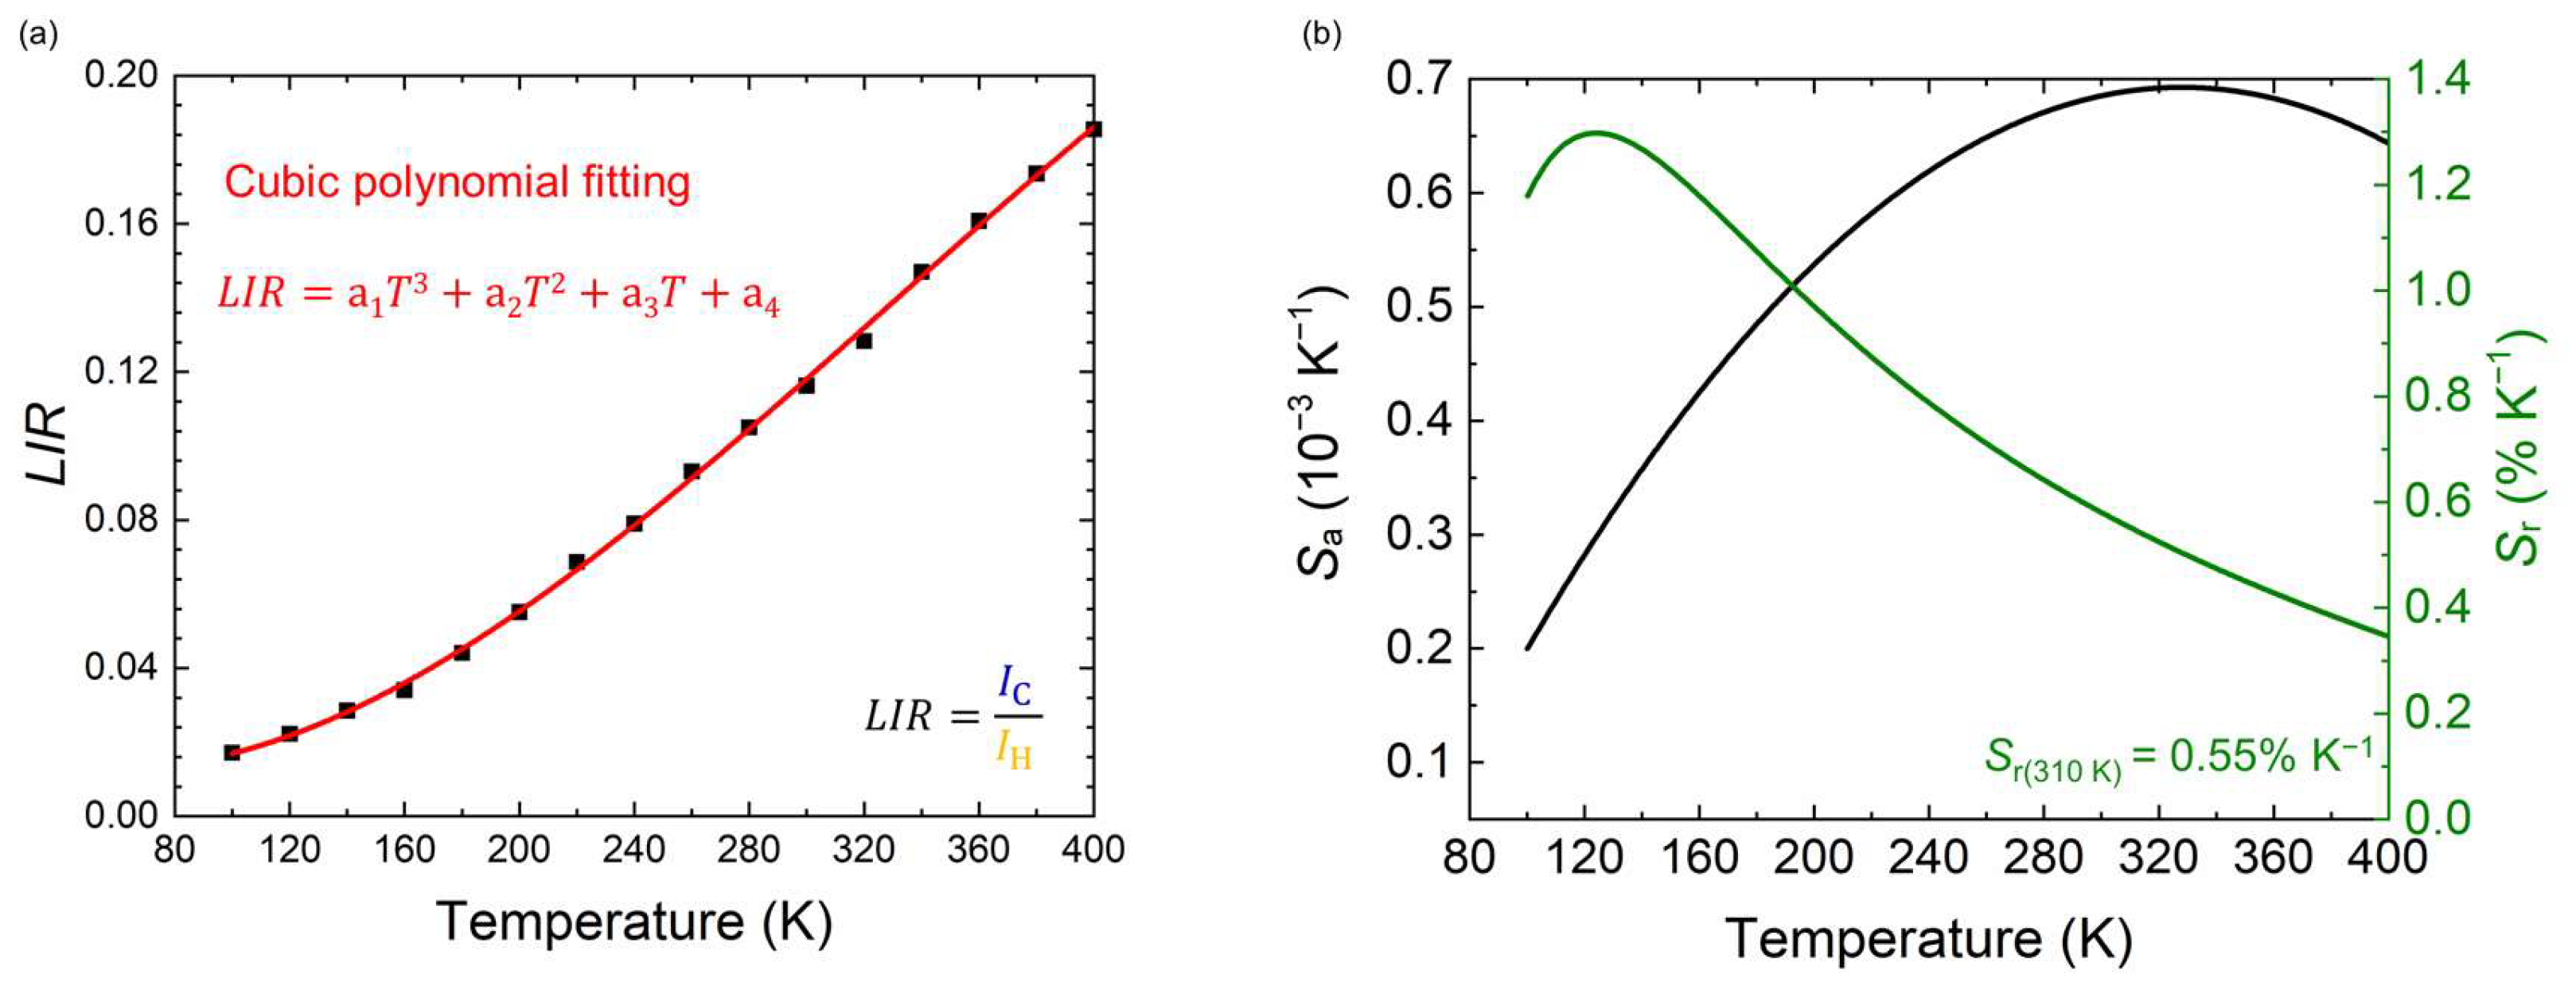
3.3. YbGAGG: Cr3+ Ratiometric Thermometer Based on the Emission of Yb3+ (Mode 1)

The temperature dependence of PL of YbGAGG: Cr3+ from 100 K to 400 K was measured and shown in Figure 5a. A notable observation is that the intensity of the central PL peak, located near 1026 nm (within the second BTW), decreases as the temperature increases. Furthermore, within the first BTW (650–950 nm), the PL spectra display an inverse temperature dependence compared with the central peak H in the more extended wavelength range. The reason for this phenomenon is the Stark splitting of the 2F5/2 level of Yb3+ in the garnet, resulting in the separation into the lowest Stark sublevel (denoted as Zlow) and several higher ones (denoted as Zhigh, typically containing two levels according to Kaminskii’s work [19]). Due to the Boltzmann distribution, the intensity of the PL from Zhigh exhibits a positive correlation with temperature (corresponding to the short wavelength range before 1000 nm in Figure 5a).
To obtain the temperature dependence of the intensity of each PL peak of YbGAGG: Cr3+, a deconvolution analysis was performed on the PL spectra across a temperature range of 100–400 K. Examples of this analysis process are shown in Figure 5b. Detailed information on the temperature dependence of the peak center position and peak intensity for peaks labeled A–J were derived from deconvolution and are shown in Figure 5c,d.
After obtaining the temperature dependence of the position and intensity of each peak, peaks C and H, located in the first BTW and second BTW, respectively, were selected due to their contrasting temperature dependencies. These peaks were then utilized to determine the temperature dependence of the LIR. The temperature dependence of LIR = IC/IH (Mode 1) was calculated and shown in Figure 6a. The cubic polynomial function was employed to fit the temperature dependence of the LIR. Subsequently, absolute sensitivity (Sa) and relative sensitivity (Sr) were calculated using Equations (1) and (2), respectively.
S a = d ( L I R ) d T
S r = 1 L I R × d ( L I R ) d T × 100 %
The calculated Sa and Sr curves are shown in Figure 6b. Notably, when the temperature reaches 122 K, Sr reaches its maximum value of 1.30% K−1. This value exceeds the Sr of the Nd3+-based luminescence thermometer, which also utilizes Stark sublevels for temperature measurements but has a lower Sr maximum value of 0.7% K−1 [17]. However, as the temperature increases above 122 K, Sr monotonically decreases, leaving a value of 0.55% K−1 for Sr at 310 K. This trend indicates that Mode 1 of the YbGAGG: Cr3+ thermometer has the potential for application in biological temperature measurements and also exhibits higher sensitivity in lower temperature ranges.

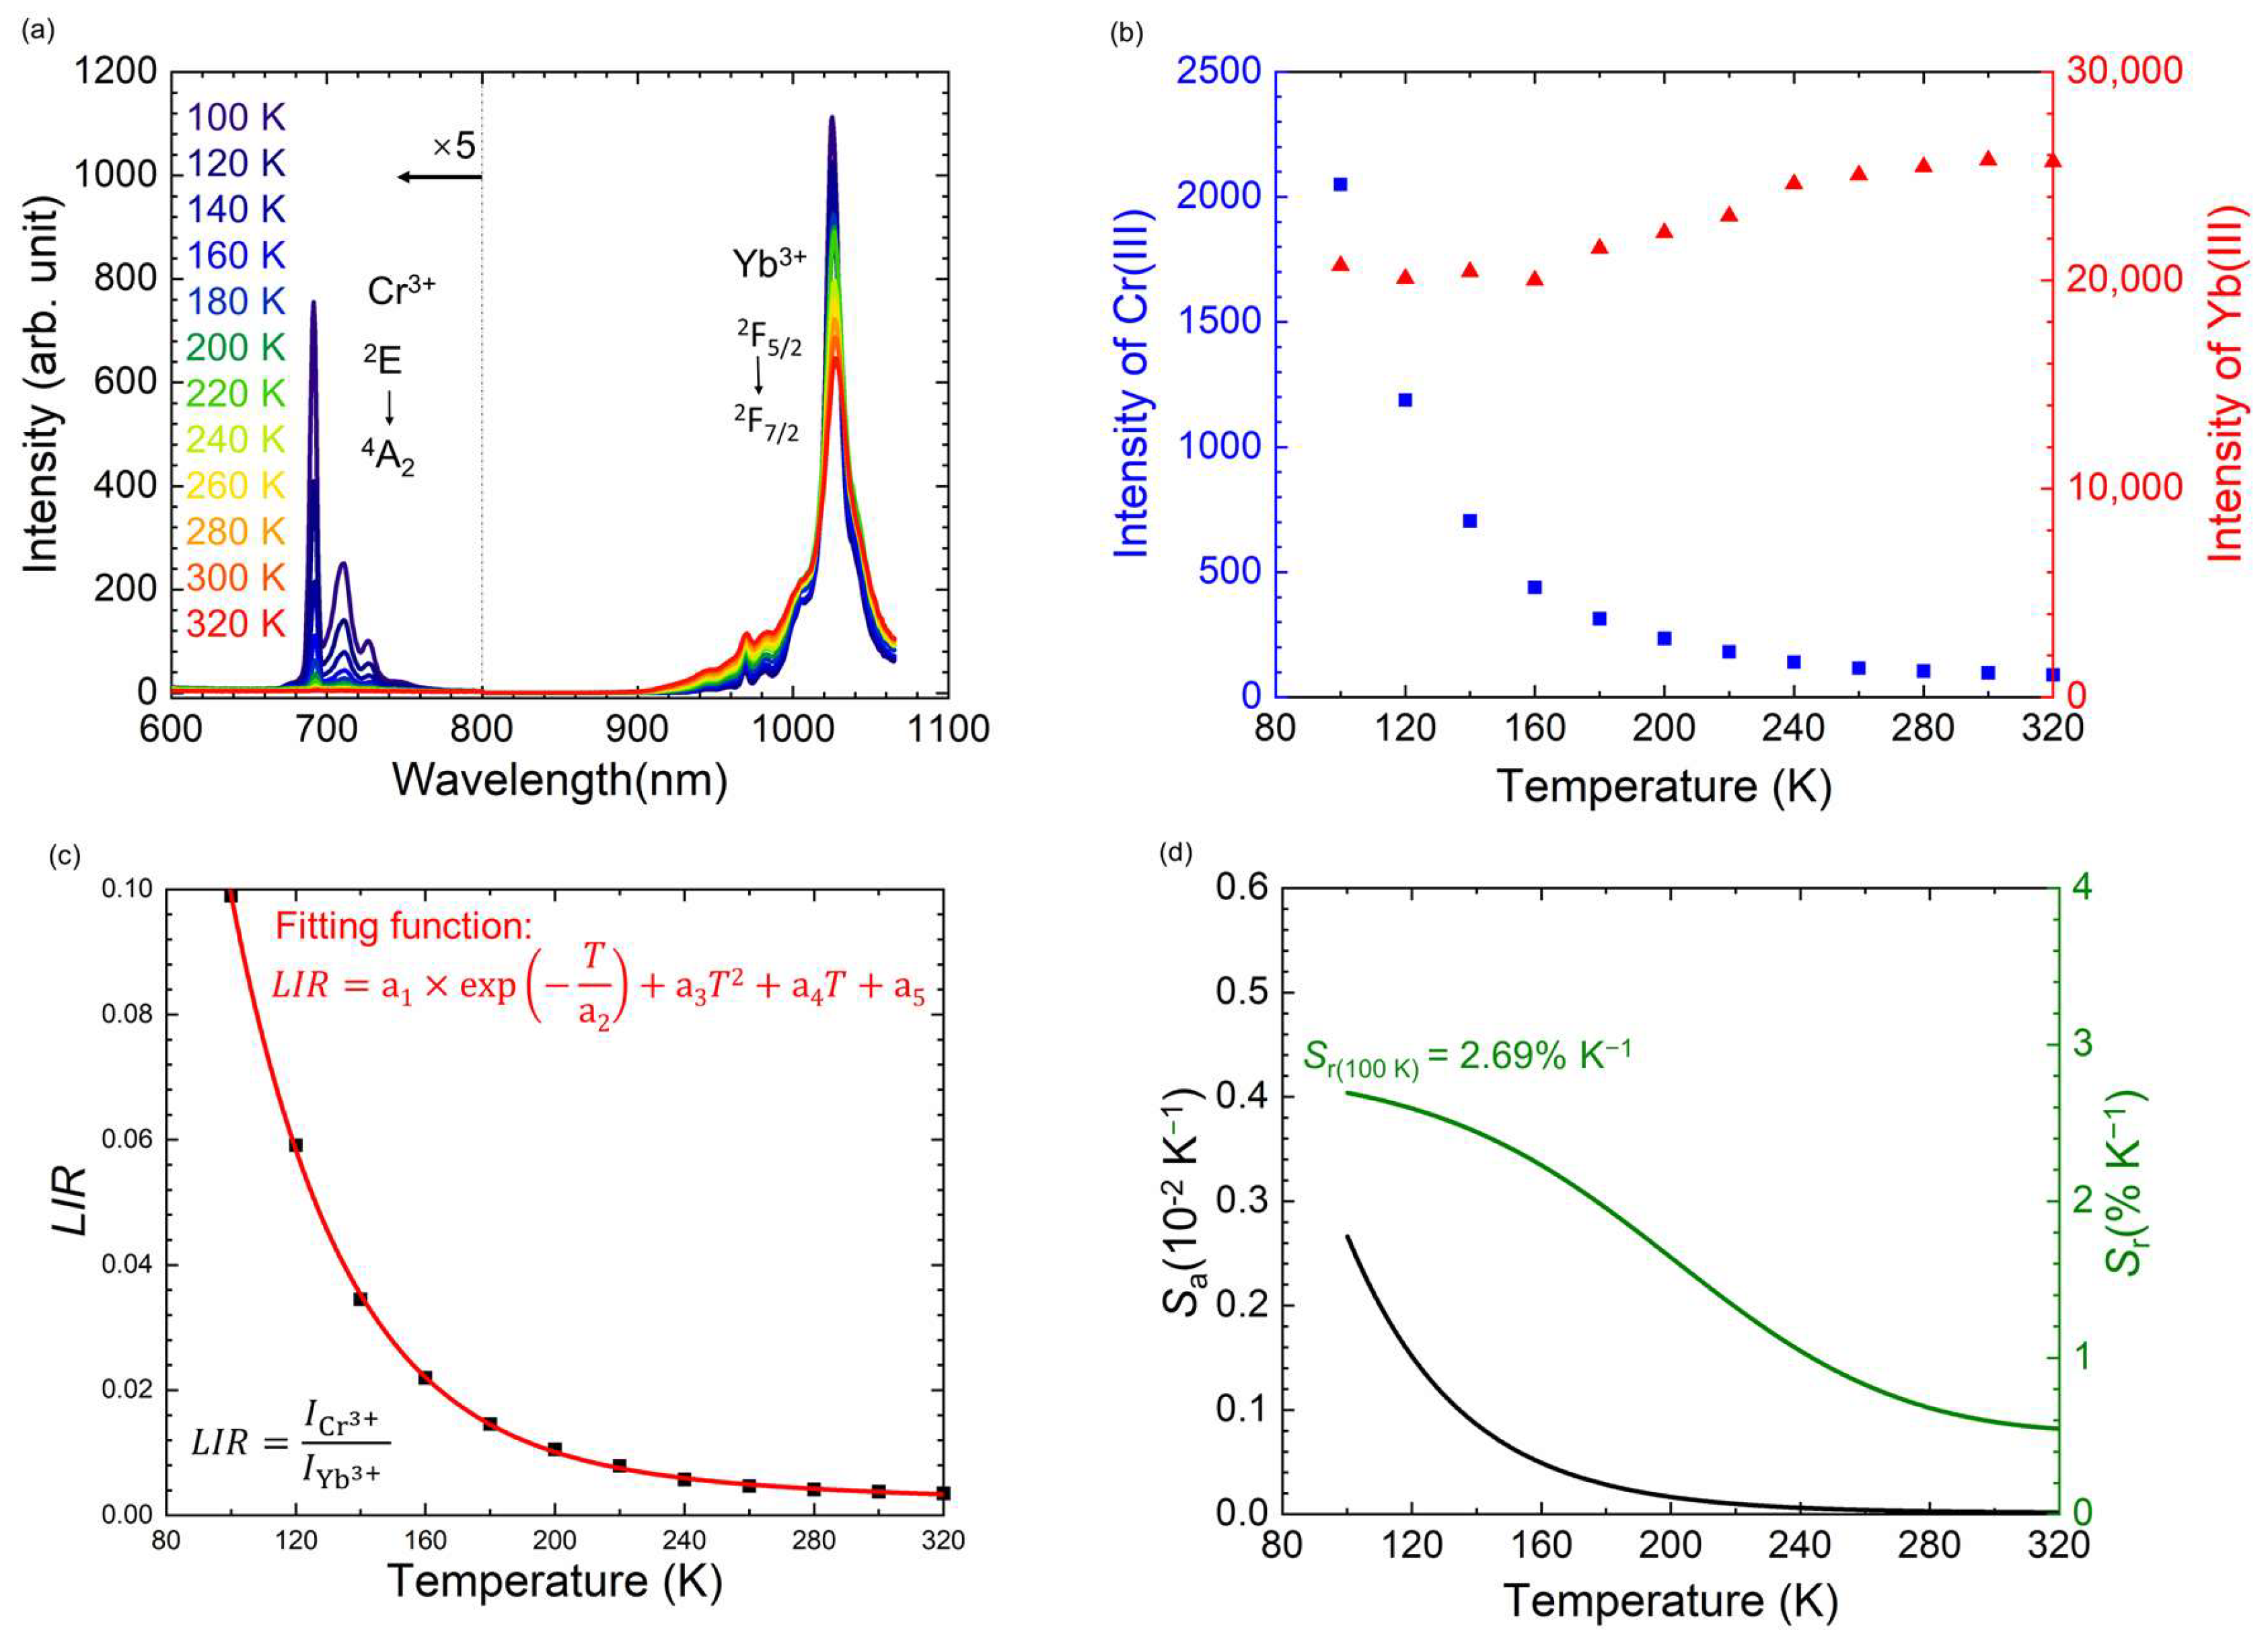
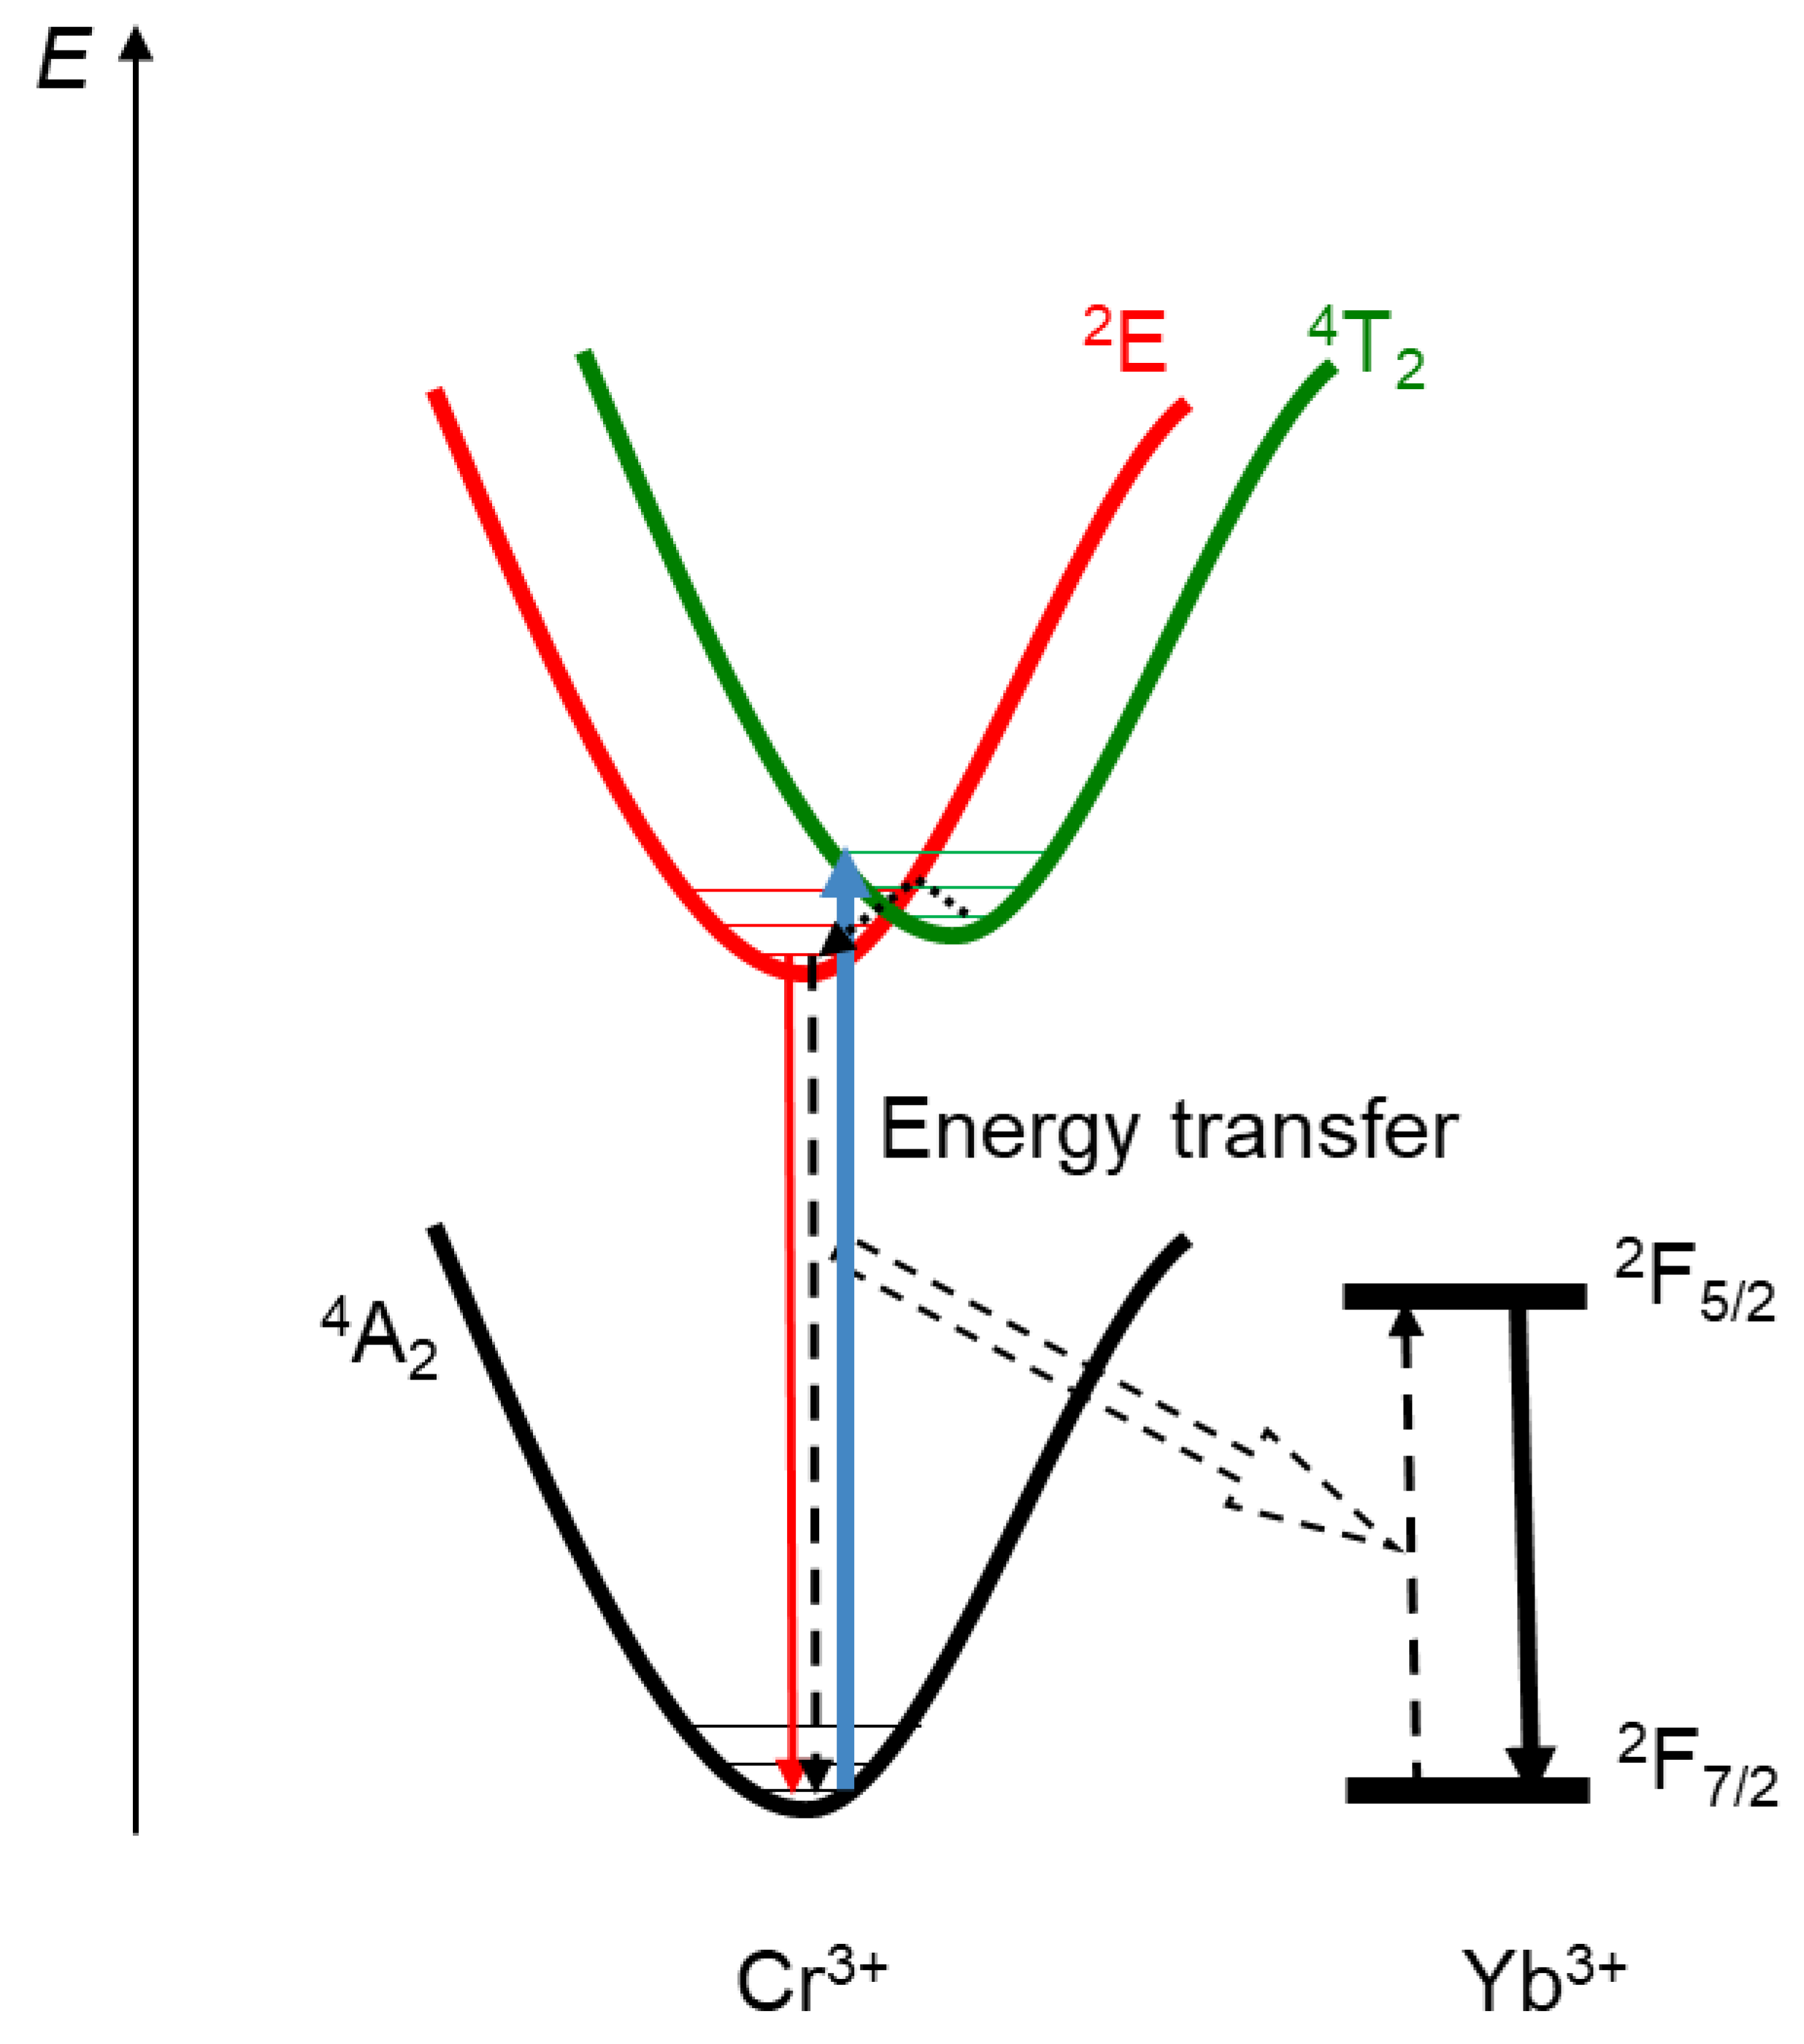
3.4. YbGAGG: Cr3+ Thermometer Based on the Photoluminescence Intensity Ratio of Cr3+/Yb3+ (Mode 2)

The temperature dependence of the PL spectrum of the YbGAGG: Cr3+ sample, excited at 455 nm, is shown in Figure 7a. The several PL peaks in the range of 650–800 nm originate the 2E-4A2 transition of Cr3+, and their intensity strongly decreases with increasing temperature. The integrated PL intensity of Yb3+ above 900 nm, as discussed in Section 3.3, increases with rising temperature (as illustrated by the red triangle plot in Figure 7b). The Boltzmann distribution and different transition probabilities between 2F7/2-2F5/2 with Stark levels can result in a negative thermal quenching. Additionally, the temperature dependence of energy transfer efficiency from Cr3+ to Yb3+ can play a part in this phenomenon (a demonstration of the energy transfer process can be found in the earlier discussion about Figure 3b). The opposite tendency between temperature-dependent PL intensities of Yb3+ and Cr3+ implies this hypothesis. For an efficient energy transfer, the luminescence spectrum of the donor and the absorption spectrum of the accepter should be overlapped. However, there is an energy mismatch between Cr3+: 2E → 4A2 luminescence and Yb3+: 2F7/2-2F5/2 absorption. This energy gap can be compensated efficiently at higher temperatures by two possibilities: Cr3+ PL broadening and phonon assist.
As the most common explanation for the temperature quenching of rare earth luminescence centers, the intensity of the weak multi-phonon relaxation effect for Yb3+ depends on the relationship between the phonon cut-off energy of the host material and the energy difference between the excited state and the ground state. Although the phonon cut-off energy of the GAGG host is as high as 808 cm−1 [27], the energy difference between Zlow and the ground state 2F5/2 of Yb3+ exceeds 9500 cm−1, depending on the intensity of the Stark split effect. In this case, the possibility of the multi-phonon relaxation process is negligible.
The shape of the PL signal of Cr3+ in Figure 7a is sharp peaks, which is believed to be a phenomenon that occurs when Cr3+ is in a strong crystal field. In GAGG, the octahedral sites are occupied by smaller Al3+ ions (0.535 Å) [28,29], resulting in a strong crystal field for the Cr3+ (0.615 Å) dopants. This results in the 2E energy level of Cr3+ becoming the lowest excited state, leading to the sharp peak shape of the PL spectrum.
To investigate the influence of the crystal field on the PL of Cr3+, Racah parameters were calculated to explore the effect of the crystal field strength on the d orbitals of Cr3+ and the shape of the PL spectrum. The formulas for calculating the crystal field strength (10Dq) and the Racah parameters (B and C) are as follows [30,31,32]:
E T 2 4 = 10 D q
D q B = 15 ( Δ E / D q 8 ) ( Δ E / D q ) 2 10 ( Δ E / D q )
E ( E 2 ) B = 3.05 C B + 7.90 1.80 B D q
where ΔE = E(4T1(4F)) − E(4T2). E(4T1(4F)), and E(4T2) are, respectively derived from the positions of the 4T1 and 4T2 bands of Cr3+ in Figure 3a, while the value of E(2E) is derived from the position of the R-line of Cr3+ PL spectrum in Figure 7a (691.53 nm). The final calculations result in Dq = 1658.9 cm−1, B = 631.53 cm−1, and C = 3244.1 cm−1. Based on the above parameters, we can derive the Tanabe−Sugano diagram (as shown in Figure 8). Under excitation by a 660 nm light source, Cr3+ will transition from the 4A2 ground state to the 4T2 state and then relax to the 2E state (as shown in Figure 9). The lowest excited state 2E and the ground state 4A2 are weakly coupled [33], so the emission from 2E to 4A2 does not experience strong thermal quenching due to the cross-over effect. The extremely low PL intensity of Cr3+ at room temperature is mainly due to the high phonon assistant energy transfer efficiency from Cr3+ to Yb3+ [34].
The luminescence intensity of Cr3+ decreases sharply with increasing temperature, as indicated by the blue square in Figure 7b. For Cr3+, as mentioned in Section 3.3, the Cr3+ luminescence is quenched at a higher Yb3+ concentration due to the efficient Cr3+ → Yb3+ energy transfer process. The opposite temperature dependence of Yb3+ and Cr3+ exhibits considerable thermometric sensitivity, especially at temperatures around 100 K.
The LIR plots shown in Figure 7c were directly obtained from the integrated intensities of Yb3+ and Cr3+ in the temperature range of 100–320 K in Figure 7b, based on the formula of L I R = I C r 3 + I Y b 3 + (Mode 2), where I C r 3 + and I Y b 3 + represent the integrated intensities of Cr3+ and Yb3+, respectively. A fitting function was employed to analyze these LIR plots further, as defined by Equation (3):
L I R = a 1 × e x p T a 2 + a 3 T 2 + a 4 T + a 5
The calculation of the temperature dependence of Sa and Sr of the YbGAGG: Cr3+ thermometer based on the luminescence intensity ratio L I R = I C r 3 + I Y b 3 + was also conducted using the method described in Section 3.4 and shown in Figure 7d. Notably, at 100 K, Sr reaches its maximum value of 2.69% K−1. This indicates a high level of sensitivity at lower temperatures for Mode 2.

4. Conclusions

The development and thorough analysis of the double-mode YbGAGG: Cr3+ thermometer highlights its significant potential in temperature measurement applications. Excitation and emission of Mode 1 of the YbGAGG: Cr3+ thermometer are within the two BTW range. By utilizing the opposite temperature dependence of the PL from different Stark sublevels of Yb3+, a Sr value of 0.55% K−1 was achieved at 310 K. These results highlight the potential of this thermometer for biomedical temperature measurement. Additionally, Mode 2 of the YbGAGG: Cr3+ thermometer exhibits high sensitivity at a low-temperature range, reaching a maximum Sr of 2.69% K−1 at 100 K. This is attributed to the slight possibility of the multi-phonon relaxation processes of Yb3+ and the intense energy transfer process from Cr3+ to Yb3+ induced by the high Yb3+ concentration. The unique temperature-dependent behaviors observed in the two modes of YbGAGG: Cr3+ offer valuable insights into the design and enhancement of luminescence thermometers, paving the way for more advanced and precise temperature measurement technologies.

Author Contributions

Writing—original draft, Q.Z.; Writing—review & editing, J.U.; Supervision, S.T. All authors have read and agreed to the published version of the manuscript.

Funding

This work was supported by the Izumi Science and Technology Foundation.

Institutional Review Board Statement

Not applicable.

Informed Consent Statement

Not applicable.

Data Availability Statement

The original data presented in the study are openly available in FigShare at https://doi.org/10.6084/m9.figshare.25611675.

Conflicts of Interest

The authors declare no conflict of interest.

References

  1. Bunzli, J.C.G. Lanthanide light for biology and medical diagnosis. J. Lumin. 2016, 170, 866–878. [Google Scholar] [CrossRef]
  2. Bunzli, J.C.G. Rising stars in science and technology: Luminescent lanthanide materials. Eur. J. Inorg. Chem. 2017, 2017, 5058–5063. [Google Scholar] [CrossRef]
  3. Zhou, J.; Leano, J.L.; Liu, Z.; Jin, D.; Wong, K.L.; Liu, R.S.; Bunzli, J.C.G. Impact of lanthanide nanomaterials on photonic devices and smart applications. Small 2018, 14, 1801854–1801882. [Google Scholar] [CrossRef] [PubMed]
  4. Hemmer, E.; Venkatachalam, N.; Hyodo, H.; Hattori, A.; Ebina, Y.; Kishimoto, H.; Soga, K. Upconverting and NIR emitting rare earth based nanostructures for NIR-bioimaging. Nanoscale 2013, 5, 11339–11361. [Google Scholar] [CrossRef] [PubMed]
  5. Labrador-Paez, L.; Pedroni, M.; Speghini, A.; Garcia-Sole, J.; Haro-Gonzalez, P.; Jaque, D. Reliability of rare-earth-doped infrared luminescent nanothermometers. Nanoscale 2018, 10, 22319. [Google Scholar] [CrossRef]
  6. Hemmer, E.; Benayas, A.; Légaré, F.; Vetrone, F. Exploiting the biological windows: Current perspectives on fluorescent bioprobes emitting above 1000 nm. Nanoscale Horiz. 2016, 1, 168–184. [Google Scholar] [CrossRef] [PubMed]
  7. Brites, C.D.S.; Lima, P.P.; Silva, N.J.O.; Mill, A.; Amaral, V.S.; Palacio, F.; Carlos, L.D. Thermometry at the nanoscale. Nanoscale 2012, 4, 4799–4829. [Google Scholar] [CrossRef] [PubMed]
  8. Jaque, D.; Vetrone, F. Luminescence nanothermometry. Nanoscale 2012, 4, 4301–4326. [Google Scholar] [CrossRef]
  9. Brites, C.D.S.; Balabhadra, S.; Carlos, L.D. Lanthanide-based thermometers: At the cutting-edge of luminescence thermometry. Adv. Opt. Mater. 2019, 7, 1801239–1801268. [Google Scholar] [CrossRef]
  10. Bednarkiewicz, A.; Marciniak, L.; Carlos, L.D.; Jaque, D. Standardizing luminescence nanothermometry for biomedical applications. Nanoscale 2020, 12, 14405–14421. [Google Scholar] [CrossRef] [PubMed]
  11. Geitenbeek, R.G.; Nieuwelink, A.E.; Jacobs, T.S.; Salzmann, B.B.V.; Goetze, J.; Meijerink, A.; Weckhuysen, B.M. In situ luminescence thermometry to locally measure temperature gradients during catalytic reactions. ACS Catal. 2018, 8, 2397. [Google Scholar] [CrossRef] [PubMed]
  12. Xu, W.; Gao, X.; Zheng, L.; Zhang, Z.; Cao, W. Short-wavelength upconversion emissions in Ho3+/Yb3+ codoped glass ceramic and the optical thermometry behavior. Opt. Express 2012, 20, 18127–18137. [Google Scholar] [CrossRef]
  13. Li, X.Y.; Yuan, S.; Hu, F.; Lu, S.; Chen, D.Q.; Yin, M. Near-Infrared to shortwavelength upconversion temperature sensing in transparent bulk glass ceramics containing hexagonal NaGdF4: Yb3+/Ho3+ nanocrystals. Opt. Mater. Express 2017, 7, 3023–3033. [Google Scholar] [CrossRef]
  14. Allison, S.W.; Gillies, G.T. Remote thermometry with thermographic phosphors: Instrumentation and applications. Rev. Sci. Instrum. 1997, 68, 2615. [Google Scholar] [CrossRef]
  15. Rocha, U.; Jacinto, C.; Kumar, K.U.; López, F.J.; Bravo, D.; Solé, J.G.; Jaque, D. Real-time deep-tissue thermal sensing with sub-degree resolution by thermally improved Nd3+: LaF3 multifunctional nanoparticles. J. Lumin. 2016, 175, 149–157. [Google Scholar] [CrossRef]
  16. Skripka, A.; Benayas, A.; Marin, R.; Canton, P.; Hemmer, E.; Vetrone, F. Double rare-earth nanothermometer in aqueous media: Opening the third optical transparency window to temperature sensing. Nanoscale 2017, 9, 3079–3085. [Google Scholar] [CrossRef] [PubMed]
  17. Back, M.; Xu, J.; Ueda, J.; Tanabe, S. Neodymium (III)-doped Y3Al2Ga3O12 garnet for multipurpose ratiometric thermometry: From cryogenic to high temperature sensing. J. Ceram. Soc. Jpn. 2023, 131, 57–61. [Google Scholar] [CrossRef]
  18. Skripka, A.; Morinvil, A.; Matulionyte, M.; Cheng, T.; Vetrone, F. Advancing neodymium single-band nanothermometry. Nanoscale 2019, 11, 11322–11330. [Google Scholar] [CrossRef] [PubMed]
  19. Kaminskii, A. Crystalline Lasers: Physical Processes and Operating Schemes; CRC Press: Boca Raton, FL, USA, 1996. [Google Scholar]
  20. Dramićanin, M. Luminescence Thermometry: Methods; Materials; Applications; Woodhead: Sawston, UK, 2018. [Google Scholar]
  21. Zhang, B.T.; He, J.L.; Jia, Z.T.; Li, Y.B.; Liu, S.D.; Wang, Z.W.; Wang, R.H.; Liu, X.M.; Tao, X.T. Spectroscopy and laser properties of Yb-doped Gd3AlxGa5-xO12 crystal. Appl. Phys. Express 2013, 6, 082702. [Google Scholar] [CrossRef]
  22. Novoselov, A.; Kagamitani, Y.; Kasamoto, T.; Guyot, Y.; Ohta, H.; Shibata, H.; Yoshikawa, A.; Boulon, G.; Fukuda, T. Crystal growth and characterization of Yb3+-doped Gd3Ga5O12. Mater. Res. Bull. 2007, 42, 27. [Google Scholar] [CrossRef]
  23. Xu, J.; Ueda, J.; Tanabe, S. Toward tunable and bright deep-red persistent luminescence of Cr3+ in garnets. J. Am. Ceram. Soc. 2017, 100, 4033–4044. [Google Scholar] [CrossRef]
  24. Fang, Z.; Li, Y.; Zhang, F.; Ma, Z.; Dong, G.; Qiu, J. Enhanced sunlight excited 1-μm emission in Cr3+–Yb3+ codoped transparent glass-ceramics containing Y3Al5O12 nanocrystals. J. Am. Ceram. Soc. 2015, 98, 1105–1110. [Google Scholar] [CrossRef]
  25. Solarz, P.; Głowacki, M.; Lisiecki, R.; Sobczyk, M.; Komar, J.; Macalik, B.; Ryba-Romanowski, W. Impact of temperature on excitation, emission and cross-relaxation processes of terbium ions in GGAG single crystal. J. Alloys Compd. 2019, 789, 409. [Google Scholar] [CrossRef]
  26. Mironova, N.; Brik, M.G.; Grube, J.; Krieke, G.; Kemere, M.; Antuzevics, A.; Gabrusenoks, E.; Skvortsova, V.; Elsts, E.; Sarakovskis, A.; et al. EPR, optical and thermometric studies of Cr3+ ions in the α-Al2O3 synthetic single crystal. Opt. Mater. 2022, 132, 112859–112865. [Google Scholar] [CrossRef]
  27. Niedźwiedzki, T.; Ryba-Romanowski, W.; Komar, J.; Głowacki, M.; Berkowski, M. Excited state relaxation dynamics and up-conversion phenomena in Gd3(Al, Ga)5O12 single crystals co-doped with erbium and ytterbium. J. Lumin 2016, 177, 219–227. [Google Scholar] [CrossRef]
  28. Nakatsuka, A.; Yoshiasa, A.; Yamanaka, T. Cation distribution and crystal chemistry of Y3Al5−xGaxO12 (0 ≤ x ≤ 5) garnet solid solutions. Acta Crystallogr. Sect. B Struct. Sci. 1999, 55, 266–272. [Google Scholar] [CrossRef] [PubMed]
  29. Laguta, V.; Zorenko, Y.; Gorbenko, V.; Iskaliyeva, A.; Zagorodniy, Y.; Sidletskiy, O.; Bilski, P.; Twardak, A.; Nikl, M.; Chem, J.P. Aluminum and gallium substitution in yttrium and lutetium aluminum–gallium garnets: Investigation by single-crystal NMR and TSL methods. J. Phys. Chem. C 2016, 120, 24400–24408. [Google Scholar] [CrossRef]
  30. Wei, G.; Li, P.; Li, R.; Wang, Y.; He, S.; Li, J.; Shi, Y.; Suo, H.; Wang, Z. How to Achieve Excellent Luminescence Properties of Cr Ion-Doped Near-Infrared Phosphors. Adv. Opt. Mater. 2023, 11, 2301794–2301814. [Google Scholar] [CrossRef]
  31. Brik, M.G.; Srivastava, A.M. Critical review—A review of the electronic structure and optical properties of ions with d3 electron configuration (V2+, Cr3+, Mn4+, Fe5+) and main related misconceptions. ECS J. Solid State Sci. Technol. 2017, 7, R3079. [Google Scholar] [CrossRef]
  32. Mironova-Ulmane, N.; Brik, M.G.; Grube, J.; Krieke, G.; Antuzevics, A.; Skvortsova, V.; Kemere, M.; Elsts, E.; Sarakovskis, A.; Piasecki, M.; et al. Spectroscopic studies of Cr3+ ions in natural single crystal of magnesium aluminate spinel MgAl2O4. Opt. Mater. 2021, 121, 111496. [Google Scholar] [CrossRef]
  33. Henderson, B.; Imbusch, G.F. Optical Spectroscopy of Inorganic Solids; Oxford University Press: New York, NY, USA, 2006. [Google Scholar]
  34. Xu, D.; Zhang, Q.; Wu, X.; Li, W.; Meng, J. Synthesis, luminescence properties and energy transfer of Ca2MgWO6: Cr3+, Yb3+ phosphors. Mater. Res. Bull. 2019, 110, 135–140. [Google Scholar] [CrossRef]
Figure 1. X-ray diffraction pattern of YbGAGG: Cr3+ and standard pattern of GAGG.
Applsci 14 03357 g001
Figure 2. Rietveld refinement of the XRD profiles of YbGAGG: Cr3+, small black circles and the red curve represent the experimental and the calculated values, respectively; vertical bars (green) indicate the position of Bragg peaks. The blue bottom trace depicts the corresponding residuals between the experimental and the calculated intensity values.
Applsci 14 03357 g002
Figure 3. (a) Absorption spectrum of YbGAGG: Cr3+ at room temperature; (b) photoluminescence spectrum under 660 nm excitation, and photoluminescence excitation spectrum of Yb3+ from YbGAGG: Cr3+ at room temperature.
Applsci 14 03357 g003
Figure 4. Luminescence decay curves of Cr3+ in YbGAGG and GAGG.
Applsci 14 03357 g004
Figure 5. (a) Temperature dependence of the PL spectrum; (b) deconvolution analysis of the photoluminescence spectra at 100 K and 400 K; temperature dependence of (c) integrated intensity and (d) peak position of A–H peaks.
Applsci 14 03357 g005
Figure 6. (a) Temperature dependence of the luminescence intensity ratio, fitted by a cubic polynomial function; (b) calculated temperature dependence of Sa and Sr for the YbGAGG: Cr3+ thermometer.
Applsci 14 03357 g006
Figure 7. (a) Temperature dependence of the photoluminescence spectra sample under 455 nm excitation; (b) corresponding integral intensity of Cr3+ and Yb3+ for YbGAGG: Cr3+; (c) temperature dependence of the luminescence intensity ratio; (d) calculated temperature dependence of Sa and Sr for the YbGAGG: Cr3+ thermometer based on the photoluminescence intensity ratio of Cr3+ to Yb3+.
Applsci 14 03357 g007
Figure 8. Tanabe-Sugano diagram for Cr3+, in YbGAGG, the orange dotted line represents the crystal field strength of Cr3+ in YbGAGG.
Applsci 14 03357 g008
Figure 9. Energy level diagram of YbGAGG: Cr3+ sample under 660 nm excitation, the blue solid arrow represent the transition process of Cr3+ excited from the ground state to the 4T2 state by the 660 nm excitation source, the red solid arrow represent the luminescence transition process of Cr3+ from the 2E state emission back to the ground state, black dashed arrows represent the Cr3+→Yb3+ energy transfer process, and the black solid arrow represent the luminescence transition process of Yb3+.
Applsci 14 03357 g009
Disclaimer/Publisher’s Note: The statements, opinions and data contained in all publications are solely those of the individual author(s) and contributor(s) and not of MDPI and/or the editor(s). MDPI and/or the editor(s) disclaim responsibility for any injury to people or property resulting from any ideas, methods, instructions or products referred to in the content.

